pulse-based fast battery iot charger using dynamic ... · energies 2016, 9, 209 2 of 20 based on...
TRANSCRIPT

energies
Article
Pulse-Based Fast Battery IoT Charger Using DynamicFrequency and Duty Control Techniques Based onMulti-Sensing of Polarization Curve
Meng Di Yin, Jeonghun Cho and Daejin Park *
School of Electronics Engineering, Kyungpook National University, Daegu 702-701, Korea;[email protected] (M.D.Y.); [email protected] (J.C.)* Correspondence: [email protected]; Tel.: +82-10-7529-1231
Academic Editor: K. T. ChauReceived: 18 January 2016; Accepted: 9 March 2016; Published: 17 March 2016
Abstract: The pulse-based charging method for battery cells has been recognized as a fast andefficient way to overcome the shortcoming of a slow charging time in distributed battery cells, whichis regarded as a connection of cells such as the Internet of Things (IoT). The pulse frequency forcontrolling the battery charge duration is dynamically controlled within a certain range in order toinject the maximum charge current into the battery cells. The optimal frequency is determined inorder to minimize battery impedance. The adaptation of the proposed pulse duty and frequencydecreases the concentration of the polarization by sensing the runtime characteristics of battery cellsso that it guarantees a certain level of safety in charging the distributed battery cells within theoperating temperature range of 5–45 C. The sensed terminal voltage and temperature of batterycells are dynamically monitored while the battery is charging so as to adjust the frequency and dutyof the proposed charging pulse method, thereby preventing battery degradation. The evaluationresults show that a newly designed charging algorithm for the implemented charger system is about18.6% faster than the conventional constant-current (CC) charging method with the temperaturerise within a reasonable range. The implemented charger system, which is based on the proposeddynamic frequency and duty control by considering the cell polarization, charges to about 80% ofits maximum capacity in less than 56 min and involves a 13 C maximum temperature rise withoutdamaging the battery.
Keywords: fast battery charger; battery management system (BMS); pulse width modulation;polarization; frequency and duty control
1. Introduction
Recently, demands for various applications based on large-scale battery cells, such as electricvehicle (EV) and remotely-installed industrial appliances, are beginning to grow [1]. Large capacitybattery-operated appliances have not been widely used due to the high price of purchasing the batterycells and the long charging times.
We consider collection of battery cells as Internet of cell-Things (IoCT), where the distributedcells share their status with each other. Actually, multiple battery pack is now implemented witha wire-connected package, but in the future, the supervisor (e.g., the gateway) and the viewer(e.g., the mobile phone) will enable seamless communication between battery cells installed aroundus. The proposed approaches introduce our initial effort to improve the charging-control methodof the multiple cell-things without supervisor configuration. It can be considered as a smartIoCT application.
Energies 2016, 9, 209; doi:10.3390/en9030209 www.mdpi.com/journal/energies

Energies 2016, 9, 209 2 of 20
Based on this concept, we proposed the fast battery-charging architecture for the distributedmultiple battery cells as IoCT, which is illustrated in Figure 1a. This large-scale battery pack iscomposed of 80 cells connected in series, and the battery management microcontrollers are mountedon each battery cell. Figure 1b describes the system-level evaluation environment of the proposedfast charging method. The four cells are integrated with the on-battery microcontroller (MCU)-basedcontroller and host-side charger algorithm.
(a) Sharing the status for battery management system (BMS) of large-scale battery cells
MCU 1 MCU 2
Charger
MCU n-1 MCU n
Battery Cell 1
+
Pulse
…..Sharing the cell status
Battery Cell 2
Battery Cell n-1
Battery Cell n
Sharing the cell status
…..
Supervisor
Host Machine
Smart Battery
BMS Host Algorithm
Charger
Bu
s
Power (Charge Injection)
BMS Client Algorithm
N Battery Cells
(b) Implementation of BMS system at host and client side
Figure 1. Large scale battery cells (internet of cell things) and battery management system (BMS).MCU: Microcontroller.
A MCU is a tiny embedded system including dedicated hardware to be executed by theon-chip programmed software algorithm. A fully passive hardware component-based chargersolution needs more complex implementation efforts to perform case-by-case management underthe unexpected various situations of battery packs; therefore, a software-configurable MCU-basedcharger is more preferable.
The battery charger has to control the reasonable current injection at a specifically biased voltagelevel by sensing and sharing the dynamically changed characteristics of the battery’s status, suchas voltage, injected current, load current, and operating temperature. The trade-off between thecharging speed and the reliability of the internal electrochemical reaction process has to be considered,which is a barrier to increasing the charging speed.
There are lots of studies on how to increase the speed of battery charging, such as variants ofthe constant current, constant voltage (CC-CV) charging method, polarization curve-based chargingmethod, and pulse-based charging method. The traditional CC-CV charging method has a limitationin terms of providing fast charging mode [2]. Actually, a battery charger with a fast charging method,which is available on the market, cannot fully charge to around 80% capacity in a relatively shortperiod of time of about 70 min [3].
The pulse-based charging method has been recognized as a fast and efficient way to overcomethe shortcoming of the slow charging time in distributed battery cells, which was also presentedin our previous work [4]. The pulse frequency for controlling the battery charge duration will bedynamically changed within a certain range in order to inject the maximum charge current into thebattery cells. This paper describes our efforts to design a fast battery-charging algorithm basedon optimal frequency and duty control, while still protecting battery cells from over-voltage orover-heating status, in order to provide a long life cycle for the battery pack. We implemented thetotal solution of the fast battery charger, including the charger algorithm in the host and the batterymanagement system-on-chip in the battery pack.
This paper is organized as follows. In Section 2, our research motivation and related workare discussed. Section 3 describes the details of the proposed fast battery-charging method.
Energies 2016, 9, 209 3 of 20
The implementation and experimental results are presented in Section 4. Finally, we conclude thepaper by summarizing our contributions in Section 5.
2. Background
The discussion of this paper mainly focuses on lithium rechargeable batteries because this kind ofbattery is mostly common used and they have some good features, such as high energy density, a longlife cycle,wide operating range in temperature, and the quality of being robust against short circuit.
A lot of research has been done on the battery charging method, but the performanceenhancement of battery charging is still needed. Several representative charge algorithms arediscussed in this section. These algorithms are analyzed in detail. Both the advantages anddisadvantages of each are also described.
2.1. Constant Current, Constant Voltage Charging Algorithm
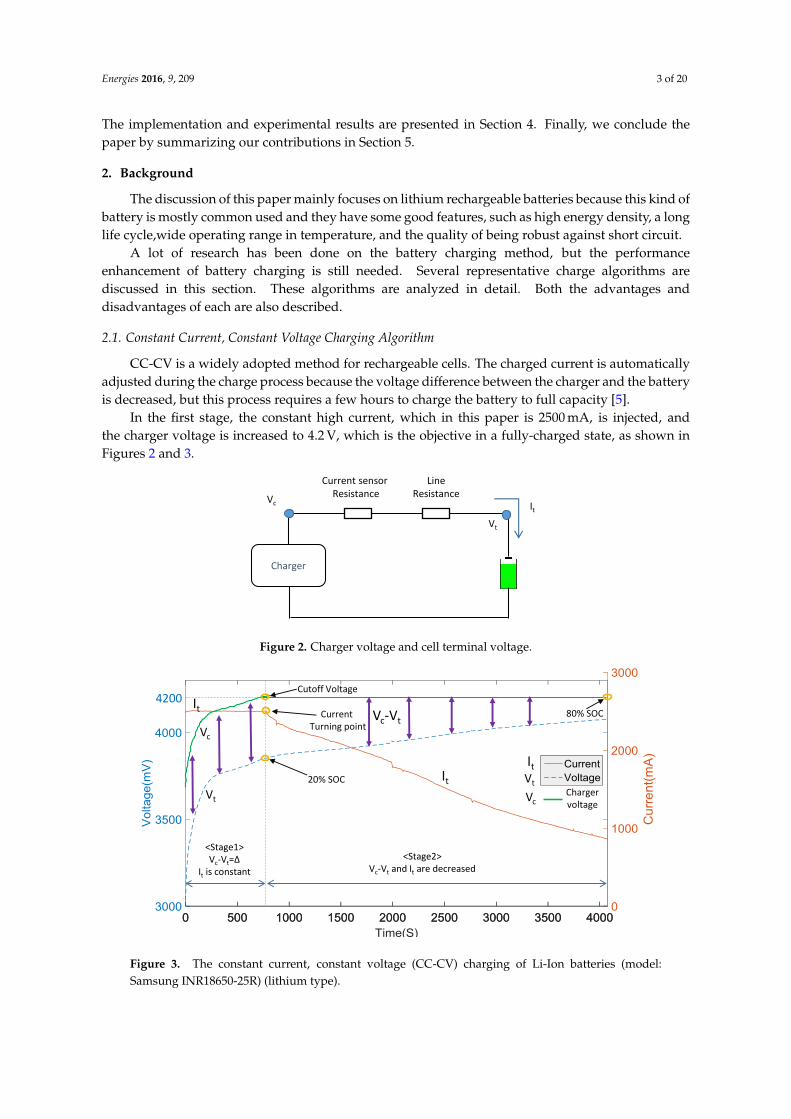
CC-CV is a widely adopted method for rechargeable cells. The charged current is automaticallyadjusted during the charge process because the voltage difference between the charger and the batteryis decreased, but this process requires a few hours to charge the battery to full capacity [5].
In the first stage, the constant high current, which in this paper is 2500 mA, is injected, andthe charger voltage is increased to 4.2 V, which is the objective in a fully-charged state, as shown inFigures 2 and 3.
Charger
Current sensorResistance
LineResistance
It
Vc
Vt
Figure 2. Charger voltage and cell terminal voltage.
Cutoff Voltage
80% SOC
20% SOC
4200Current
Turning point
It
Vt
VcCharger voltage
<Stage2>Vc-Vt and It are decreased
It
Vt
Vc
It
<Stage1>Vc-Vt=∆
It is constant
Vc-Vt
Figure 3. The constant current, constant voltage (CC-CV) charging of Li-Ion batteries (model:Samsung INR18650-25R) (lithium type).

Energies 2016, 9, 209 4 of 20
However, the battery terminal voltage is still 3.86 V due to the voltage drop in the current sensorand the line resistance. In the second stage, the charging current automatically drops and the constantvoltage of 4.2 V is still constantly biased until the state of charge (SOC) reaches 80%, at which pointthe terminal voltage is 4.08 V and the elapsed charge time is 4075 s.
As an example of controlling the charging process for multiple battery cells, electric vehicle(EV) manufacturers have adopted the constant-current charging method to reduce the charging time.The thermal response test is performed at the high charging rate of 3 C, and there is a high celltemperature increase of 18 C in free air [6].
2.2. Multi-State Current Charging Algorithm
Figure 4 illustrates the five stages of the constant current charging algorithm. In each stage,the constant current is injected to charge the battery until the terminal voltage reaches a specifiedlevel. The current magnitude decreases according to the transition between each stage. It is critical todetermine the proper charging current at every stage with the preset voltage limit.
Vlimit
Charging time
Current
Voltage
Stage 1 Stage 2 Stage 3 Stage 4 Stage 5
Vlimit
Vlimit
VlimitVlimit
Figure 4. The profile of five stages of current charging algorithm.
Many previous studies have been done on the optimal current determination. Some researchshowed that the multistage charging method, using complex calculation in a high performance MCU,is faster and more efficient than the traditional method [7].
2.3. Pulse-Based Charging Algorithm
To achieve a high charging speed for multiple battery cells, pulse-based battery chargingapproaches, such as variable frequency pulse charge system (VFPCS) and duty-varied voltagepulse-charge strategy (DVVPCS), have been introduced in previous literature, such as [8,9].
Figure 5a shows the biased charge period when the charge pulse is high and the followingrelaxation period when the charge pulse is off. An immediate rise and drop in the charging currentcan be observed between the beginning and ending of the charge injection, respectively.

Energies 2016, 9, 209 5 of 20
(b)(a)
Vt
Time
I t Instantaneous ResponseDelayed
Response
pu
lse
Battery
Charger pulse Vt
Polarization is stabilizedafter 1000 seconds
supplyIt
ON
Charging period
Relaxation period
OFF
Vocv
Figure 5. Relaxation after charging pulse. (a) battery charging current under 4.2 volts of chargingpulse; (b) text result of diffusion after pulse on INR18650-25R.
Figure 5b shows the diffusion relaxation after a period of the constant-current chargingmode. Terminal voltage declines abruptly after the charging period due to the polarization voltagedecreasing rapidly. The relaxation time will last a few hours before the status completely settlesdown. The terminal voltage settles down after 1000 s (at absolute time 1250 s) is elapsed from thepulse release. In this paper, we considered that the polarization voltage is small enough to be ignoredafter 1000 s [10].
Compared to the traditional CC-CV method, pulse charging has many advantages, includinghigh efficiency, high charging rate, and a long battery life cycle [11]. The charge speed of the VFPCSand the charge efficiency of the DVVPCS are good enough to be used in the recharging applicationsfor multiple cells, but neither considers both frequency and duty cycle factors simultaneously. Basedon the optimal frequency and duty control, our effort to design an efficient battery-charging algorithmfocuses on improving the charging speed and energy efficiency.
However, pulse-based charging needs the complex hardware configuration and algorithmicmanipulation sensing the current, voltage, and temperature in the charging runtime. In additionto the cost of design complexity, the unexpected variation of the charging current may lead toperformance loss due to the compensation of the current flow.
In this paper, we propose a newly designed charger to control the duty and frequency of thecharge pulse based on polarization curve characteristics according to the status of SOC. The newlydesigned pulse charger requires two input values: frequency and duty cycle. The searching methodsfor the optimal frequency and duty cycle are based on two approaches, which are described in thefollowing two sections.
3. Proposed Architecture
3.1. Basic Principle of Lithium Battery
The charge rate in a battery is an important parameter to assess the speed of charging, whichis allowed in terms of reliability. The charge rate C/10 means that the battery capacity is returnedin 10 h. The SOC refers to how much charge is available in a battery. SOC is proportional tothe remaining charge compared to the state of the fully charged battery. SOC is not measurable,and can be only estimated only by other measurable parameters, such as open circuit voltage(OCV), and OCV-SOC curve. We adopted the coulomb counting-based SOC estimation method withthe following:
SOC(t) = SOC(0)− 1Q
∫ t
0I(t)dt (1)

Energies 2016, 9, 209 6 of 20
Figure 6 shows an example of an OCV-SOC profile, which is measured for the INR18650-25Rlithium battery model.
Figure 6. The open circuit voltage-state of charge (OCV-SOC) profiles of the INR18650-25R battery.
3.4
3.5
3.6
3.7
3.8
3.9
4
4.1
4.2
4.3
0% 20% 40% 60% 80% 100%
Em(V)
T=5 T=20 T=40
Em(SOC,T)
C1(SOC,T)
R1(SOC,T)
R0(SOC,T)
Charger
Z1
Z0
(a)
Charging
(b)
SOC (%)
V
0
0.002
0.004
0.006
0.008
0.01
0.012
0.014
0% 20% 40% 60% 80% 100%
R0(mΩ)
T=5 T=20 T=40
SOC (%)
0
0.002
0.004
0.006
0.008
0.01
0.012
0% 20% 40% 60% 80% 100%
R1(mΩ)
T=5 T=20 T=40
SOC (%)0
10000
20000
30000
40000
50000
60000
0% 20% 40% 60% 80% 100%
C1(F)
T=5 T=20 T=40
SOC (%)
Figure 7. (a) Equivalent circuit model, and (b) lookup table (LUT) for statically sensed characteristicsof the lithium battery cell (X axis: SOC).
The equivalent circuit model [12] is a powerful approach to the numerical analysis ofbattery behavior, which describes the characteristics of the battery as capacitative and resistant.The high-fidelity model has also been also adopted as the basis of this work; it consists of an idealvoltage source (Em), an resistor-capacitor (RC) block (R1, C1), and an internal resistance (R0), as shownin Figure 7a. These fundamental parameters describing the status of the battery cells are dependenton the dynamically changed temperature and SOC of the cell [13].
A two-dimensional lookup table (LUT) for the parameters of the multiple battery cells isstatically built from the feature points that are collected in runtime using the parameter estimationtool in Simulink Design OptimizationTM. The generated LUT for the multiple battery cells, which isused in this study, is shown in Figure 7b.
After performing the parameter estimation procedure using independent experimental data, anadditional step is needed to verify whether the equivalent circuit model can meet all the dynamiccharacteristics of the cell.

Energies 2016, 9, 209 7 of 20
Polarization voltage is the dropout voltage on the RC block and it can be calculated by thefollowing equation:
Vp = Vo − OCVSOC − IR0 (2)
Vo is the battery terminal voltage. The OCV is a voltage value related to its SOC value at agiven time, as shown in Figure 6. A series of experimental results, which was introduced in ourprevious works [14], show that polarization voltage is relatively small when SOC is greater than 20%and less than 80%. In the earlier stage and the final stage (SOC < 20% or SOC > 80%), polarizationrapidly increases.
3.2. Acceptable Current Selection Based on Polarization
Based on the mechanism of polarization, the allowed current injection is restricted byconsidering the SOC of the battery, which is measured in Figure 8a. Therefore, the appropriatelyacceptable charging current has to be selected during the runtime of the charge process by increasingthe charging rate to reduce the time or by decreasing the charging rate to minimize the damage tothe battery.
(a)
Polarization voltage is relatively small, high current injection is allowed
(will be dynamically adjusted in runtime) Cu
rren
t(A
)
(b)
Boundary Curve ofCell Polarization
Average Ic
0SOC(%)
10 20 30 40 50 60 70 80
Small current inject (constant current)
High current injection (maximum allowed)
Adjusting the allowable injection current by considering the boundary of cell polarization
Figure 8. Acceptable current based on polarization voltage. (a) Polarization voltage according tocharging rate and SOC; (b) adjusting charging current based on polarization boundary (limit ) curve.
It is obvious that the polarization phenomenon is serious in the low and high SOC and relativelystable in the middle SOC, just like a bowl. First, charging the battery at C/3 using a constant currentfrom 0% to 20% SOC is shown in Figure 8b. Then 2 C is adopted until it meets the calculatedacceptable current curve, reducing the charging current every 5% of SOC and stopping chargingwhen SOC is 80%. This kind of method has already been proved as a quick charging method in theSOC from 20% to 80% [10]. This SOC region is the most commonly used and is very practical for EVsor plug-in hybrid electric vehicles (PHEV).
The calculated acceptable charging current in the specified range of SOC is shown in Table 1.In the experimental phase, this table will be used as the basis.
In this paper, we adjust the duty and frequency of the charge pulse simultaneously to select theacceptable injection current.

Energies 2016, 9, 209 8 of 20
Table 1. Calculated acceptable charging current for the INR18650-25R battery.
SOC range (%) Charging current (mA)
0–20 125020–40 400045–50 385850–55 353955–60 297960–65 265965–70 231970–75 195975–80 1500
3.3. Optimal Frequency Searching Mode
The capacitative characteristic of the battery cell causes different responses at different frequencypulses, which are activated when the battery is charging. Figure 7a shows that the battery impedanceis the summation of Z0 and Z1, as described in Equations (3) and (4):
Z1 =R1
1jwC1
R1 +1
jwC1
(3)
Z = Z0 + Z1 = R0 +R1
1jwC1
R1 +1
jwC1
(4)
This search mode finds the optimal frequency while minimizing the cell impedance, using thehighest charging current to reduce the energy consumption in the battery. Figure 9 shows thatimpedance Z1 is more dependent on the pulse charging frequency than SOC. We take 0.01 Hz, 0.1 Hz,1 Hz, and 100 Hz as examples, indicating that Z1 will regularly drop when the frequency rises.
State of charge
0.01Hz
0.1Hz
1Hz
100Hz
Z1(m
Ω)
Figure 9. The sensed impedance of Z1 varies with SOC and the pulse charging frequency at 20 C.
The AC impedance of the battery decreases as the frequency increases to 5000 Hz, which ismeasured by the Solartron 1280 analyzer (AMETEK, Oak Ridge, TN, USA). However, AC impedanceincreases exponentially in the range of 5000–100,000Hz [15].

Energies 2016, 9, 209 9 of 20
The charger proposed in this paper uses a 50% duty cycle and adjusts the frequency range from500 Hz to 5000 Hz by increasing the frequency by 500 Hz steps. Considering the complexity of the80 cells connected in a series, we adopt an optimal frequency search mode instead of using the fixedfrequency determined by experience.
The proposed algorithm for the optimal search mode is illustrated in Figure 10. First, the chargermust confirm that the SOC is under 0.8. If the proposed method is enabled when SOC is above 0.8,the fast charging process will be stopped to prevent over-heating or over-voltage in a short period.
Start
FN>5000
No
End
Yes
N+1
Charge with FNdelay 2s
IN calculation
Yes
IN<Ioptimal
No
Foptimal=FN
Figure 10. Proposed algorithm for controlling the optimal frequency and charging current.
The pulse frequency is initialized as 500 Hz, the duty cycle is kept at 50%, the optimal current(Ioptimal) is initialized as 0 A and the optimal frequency Foptimal is initialized as 500 Hz. The sweepfunction of the search frequency and the charging current is described in Equations (5) and (6):
FN = N ∗ 500Hz, (where, N : 1..10) (5)
IN = 0A(where, N : 1..10) (6)
After charging for five seconds by FN , the charging current calculation is immediately performedby averaging the current in the last five seconds, followed by updating the corresponding IN . If INis bigger than Ioptimal, the Ioptimal and the corresponding Foptimal will be updated with newer IN andFN , respectively. FN will increase by 500 Hz steps until the frequency reaches 5000 Hz or the SOCreaches 0.8.

Energies 2016, 9, 209 10 of 20
From the successful operation of this mode, we obtain the optimal frequency, at which the batteryimpedance is extremely minimized and the largest charging current is injected into the battery cell.In particular, the optimal frequency will be used as a basis in the following two modes.
3.4. Optimal Duty Cycle Search Mode
Figure 11 shows the charging current being pumped into the battery and then followed by avoltage relaxation period. An immediate rise and drop in the charging current amplitude can beobserved between the start and the stop of the charge injection, respectively. The instantaneousresponse corresponds to R0 in the equivalent cell model, and the delayed response correspondsto the R–C reaction. In particular, the results show that the voltage relaxation requires more thanten minutes to completely settle down.
Cu
rren
t(A
)
SOC
(%)
Optimal duty cycle for controlling acceptable charging current based on sensing polarization characteristics
Charging PulsetV
olt
age(
V)
Boundary Curve ofCell Polarization
Average Current
20
60
80
SOC
0t
Charging Pulse
Figure 11. Controlling the acceptable charging current using dynamic pulse duty cycle searchingmethod based on cell polarization.
Because the concentrated polarization of battery cells is high at the end of the charging period,the battery has to diffuse the reactant evenly in an electrochemical reaction. This duty cycle searchmode focuses on finding an appropriate length for the relaxation period, which may be a value thatis neither too short in diffusion nor too long in extending the charging time.
The duty and frequency of the charging pulse signal can be dynamically controlled usingthe cell temperature and SOC in runtime to determine the maximum rate of the current injection.The acceptable charging current based on polarization characteristics has to be determined [10].The charging current has to be under the boundary curve, taking polarization voltage as the limit,which is illustrated in Figure 11. If the charging current is always higher than the limit of theboundary curve, the battery will raise the terminal voltage, and even the temperature will rise tothe threshold.
As the SOC of the battery increases, the acceptable current based on the polarization curveis gradually decreased. By sensing the polarization curve to determine the maximum chargingcurrent, the proposed pulse duty cycle search method gradually reduces the average chargingcurrent. The sweep function of the searching duty cycle and the charging current is described inEquations (7) and (8):
T = Tc + Tr =1
Foptimal(7)

Energies 2016, 9, 209 11 of 20
I =Ic ∗ Tc
Tc + Tr(8)
Tc is the charging period, Tr is the relaxation period, Ic is the average charging current during thecharging period, and I is the equivalent charging rate in a cycle. In order to balance the influences ofthe polarization voltage and the charging time, the proposed charger adaptive controls the chargingpulse voltage, as shown in Figure 11. The equivalent charging rate in a cycle matches the boundarycurve exactly.
Start
DN>100
No
End
Yes
N+1
Charge with DN
delay 2s
IN calculation
Yes
IN<Ilimit
No
Foptimal=FN
IN-1>Ilimit
No
Yes
N-1
Figure 12. Proposed algorithm for the optimal duty search mode.
Figure 12 shows the algorithm of the optimal duty cycle (Doptimal) search mode. At thebeginning, the optimal frequency, which was obtained from the previous mode, is initialized, andthe 10% duty cycle (D1), as described in Equation (9), is selected as an initial value, which is used tocharge the battery for 5 s. Iave is the equivalent charging current in these 5 s, and Ilimit is the acceptablecurrent corresponding to the SOC.
Dn = n ∗ 0.1(where, n : 1..9) (9)
If Iave is below Ilimit, we can assume that the cell reactant, which is described in the equivalentcell model, can be diffused at the end of the charging period and that the battery is ready for the nextcharging pulse. In order to reduce the charging time, Dn increases by 10% steps until the duty cyclereaches 90% or the SOC reaches 0.8. If Iave is larger than Ilimit, the Doptimal will be updated to thenewer Dn.
The relaxation period during the charging process provides an opportunity to keep theconcentration of the charging current at a relatively low level, preventing the battery fromoverheating. The proposed search method enables the dynamic determination of Doptimal andeffective control at the right time for the processes of charge pumping, reaction, and diffusion.

Energies 2016, 9, 209 12 of 20
3.5. Optimal Frequency and Duty Cycle Charging Mode
In this mode, the optimal frequency and the duty cycle will be used simultaneously to chargethe battery in fast mode to diminish the cell polarization voltage. Real-time monitoring of whetherthe SOC is divisible by 2 or 5, then the optimal duty and frequency, should be repeatedly obtained byperforming the proposed searching mode again, respectively, which is shown in Figure 13. Becausethe battery state parameters are changed a lot, the instantaneous status of the multiple battery cells(e.g., battery voltage, temperature, and SOC) needs to be constantly monitored and shared acrossall cells.
YesSOC mod 2 == 0?
No
No
Frequency search
Duty cycle search
Optimal charge
SOC mod 5 == 0?
Yes
Start
Figure 13. Flow chart of the efficient frequency and duty cycle control method.
4. Implementation and Experimental Results
4.1. Evaluation Framework Setup
The evaluation framework is implemented using the MATLAB/Simulink environment to designthe proposed battery charger system, including the proposed search algorithm of the pulse frequencyand the duty cycle, which is shown in Figure 14. The physical model of the battery cells is developedusing the SimscapeTM package, which requires a solver reconfiguration.
The dotted box on the left in Figure 14 indicates variable declaration for the controlled frequencyand duty cycle value. The controlled voltage source block is selected from SimscapeTM to model pulsevoltage for the charge process of the battery pack. Duty cycle and frequency, as the two input signals,can be adjusted by changing the gain coefficient of the gain blocks.
The convective heat transfer block offers a way to exchange the convective heat effect betweenthe battery and the ambient environment. The second dotted box from the left shows that ambienttemperature is set at 20 C, which can be adjusted as an input variable.

Energies 2016, 9, 209 13 of 20
Figure 14. MATLAB/Simulink-based model to evaluate the feasibility of the proposedcharger system.
The third dashed line from the left shows the high-fidelity battery model provided bySimscapeTM. As a high-fidelity model design, we also consider SOC and the thermal effect on themodeled component. Each component of the equivalent circuit model will change with the SOCand temperature of the battery during the battery charging process. The amount of heat, which isgenerated on R0 and R1 as an output of the thermal model, is connected by convective heat transfer.
We designed a charge controller, described by a dashed line on the right. The charge controllerdecides whether to stop charging based on two input signals: the SOC and the temperature of thebattery. The Cur_Inte signal is an accumulated value provided by the integrator block at the upperright corner to calculate the average current within seconds, so as to obtain the optimal frequencyand duty cycle. The charge controller resets the integrator block with the charge_switch signal every5 s based on the design requirements.
Through observation and analysis of battery state parameters, such as charging current, terminalvoltage, SOC, and temperature, we achieved the most efficient frequency and duty cycle for a fastpulse-based charging method. The charging time and temperature rise are due to two importantparameters in the charging algorithm. The rise in temperature indicates heating in the internalresistance of the battery cells during the charge process.
The implemented state flow of the proposed charger system is shown in Figure 15. We proposedfive states, including the Start, Search, Search_1, Charge and Charge Complete states. The start state is adefault state that initializes all the parameters and checks the battery status. The charger has to verifythat the temperature and SOC of the battery are under the respective thresholds of 45 C and 0.8 byusing the function of status_check at the lower left corner. Throughout the charge process, the batterystatus is checked at regular intervals.
The optimal frequency is obtained in the Search state by calling the cur_check function. In theSearch_1 state, the duty cycle is adjusted to ensure that the charging current abides by the polarizationcurve. Through the LUT, we can check the polarization curve by calling the acc_cur_check function.We adopt the efficient pulse in the Charge state for two minutes, then cycle back to the Search stateonce again. Eventually, entering the Charge Complete state means that the charger process has ended.
The user-defined functions update_param_fre and update_param_duty in the MATLAB/Simulinkmodels are shown at the top left corner. In the function, get_param and set_param are used to get andchange the gain coefficient of the gain blocks shown in Figure 14 during the emulation.

Energies 2016, 9, 209 14 of 20
Initialize & StartInitialize
- variable, flagsCheck battery status
- temperature, SOC
Initialize- variable, flags
Check battery status- temperature, SOC
Search Frequency
Update frequencySense currentCheck battery status
Update frequencySense currentCheck battery status
Measure charge timeCheck battery statusMeasure charge timeCheck battery status
Search Duty
Update DutyCompare with LUTCheck battery status
Update DutyCompare with LUTCheck battery status
If(index>10) frequency=optimal_fre;
update_param_fre(frequency);
if(cell_status == 1)
Searching LUT
Charge If(index>9)duty=optimal_duty;update_param_duty(duty);
If(count>60)count=0;charge_fre=500,switch =0;
after(2,sec);count=count+1;cell_status=status_check(
cell_tem,cell_SOC)
Close charge pathClose charge path
Complete SOC >= 80%
Repeat optimal search in runtime
SOC >= 80%if SO
C < 80%
(a) (b)
Figure 15. The overall control flow of the proposed charger system. (a) Conceptual flow; (b) animplementation using Matlab stateflowTM .
The BMS IC is attached to the board to measure the temperature, current flow, and voltage levelof the target battery cells. The proposed fast-charge algorithm is simultaneously executed on thetarget BMS chip and the host-side software to provide optimized performance by integrating theon-cell extracted battery characteristics.
The Simulink state-flowTM implementation, which is described in Figure 15, is translated intothe MCU firmware to interact with the interface (I/F) MCU as a charger chip and the client-side BMSchip. The control flow of the supervisor in PC is implemented as a host-side charging algorithmto perform the interoperation with I/F MCU. The I/F MCU serves as a bridge charger between thehost-side supervisor and the client-side BMS, which is attached to the battery packs.

Energies 2016, 9, 209 15 of 20
In the following Charge state, the proposed system starts to charge the battery using the selectedoptimal pulse until the SOC is divisible by 2. These search and charge sequences, in runtime, willcycle until the completed state is achieved in terms of the battery capacity.
4.2. Charging Test for Lithium-Ion Battery
The LTC6802-2 battery monitoring IC can monitor the battery terminal voltage of not more than12 cells connected in a series. The capacity of the INR18650-25R lithium ion battery, which is usedin this work, is 2500 mAh. The maximum charge voltage and the minimum discharge voltage are4.2 V and 2.5 V, respectively. The standard charge current and the fast charge current are 1250 mAand 4000 mA, as provided by the manufacturer.
Considering the complexity and ease of development, this project adopted the Arduino UNOboard as an MCU, as shown in Figure 16. The microcontroller can communicate with the LTC6802-2monitoring chip via serial peripheral interface (SPI) interface. ACS712 is a hall effect-based linearcurrent sensor with 1.2 mΩ internal resistance and bidirectional current measurement ability. In thispaper, we used hall effect sensor to resolve the difficulties in implementing current-to-voltageconversion with small voltage drop. In addition, hall effect sensor separates the high current pathwith low-voltage operated MCU. When field effect transistor (FET) turns on, excessive load on the lineand circuit accidentally happens due to high short current. The separated ground is used to redirectthe high current from the battery, which is described as a blue-dotted line near the FET switch inFigure 16. It converts the sensing current into a 1.5 V to 3.5 V voltage as an output. The output voltageresponds directly to the current magnitude. The charging current should be monitored throughoutthe charging process to calculate the battery’s SOC.
Monitoring Board(LTC6802)
Arduino UNO(MCU)
Current Sensor
Regulated DC
Voltage and temperature information are transferred via SPI
ChargingCurrent
SPIMaster
SPISlave
Analog Signal(Current)
ACS712
PWM
Optical Coupler
R1
R2C1100nF
R3
R4
VPP
IRF540
PS2801C
MATLAB generated
code
Low-level driver code
Integrated code
470
1K
100
10
K
Current flow to separated ground for circuit protection
Figure 16. Schematic diagram for the charging test.
Using the state flow developed in the simulation process, we could obtain the correspondingC code, which is downloaded into MCU IC. All of the low-level drivers are developed using theArduino IDE (integrated development environment), such as the current sensor acquisition, thetemperature sensor acquisition, the SPI communication control, the pulse-width modulation (PWM)control, and the timer control code. We integrated the low-level driver code, the MATLAB-basedgenerated firmware into a single MCU.

Energies 2016, 9, 209 16 of 20
The pulse-width modulation, which is used for controlling the duty and frequency of the pulsecharging method, is generated at a cycle-accurate level by MCU. The experiment environment setupis captured in Figure 17a. Through the communication channel, the MCU board can monitor thebattery’s status from the host computer and collect the parameters, such as the charging current, thecell terminal voltage, the cell temperature, the pulse frequency, and the duty cycle, in order to performthe proposed pulse controlling algorithm.
Dc power supply
CurrentSensor
Communication Cable
MOSFETSwitch
BatteryCells
LTC6802-2Monitoring
Chip
Arduino UNO
Board
(a) (b)
Figure 17. Experiment environment for the charging test. (a) Experiment environment for thecharging text; (b) waveform captured by Oscilloscope.
As an example, the charge pulse of 500 Hz frequency and 50% duty cycle as an example isobtained from the output voltage signal of the current sensor (dark blue) and the corresponding PWMcontrol signal, which is described in Figure 16, is measured as red-colored signal by oscilloscope asshown in Figure 17b. The input of the optocoupler is controlled by the PWM output, which is a digitalpulse with the appropriate frequency (from 500 Hz to 5000 Hz) and duty width. One column means1 ms, and the pulse period is 2 ms. There are two channels in this figure. One horizontal line of thefirst channel (blue line) means 500 mV, and the second channel (red line) means 2 V. The first channel,on behalf of the magnitude of the charging current, can be used to infer that the charging current isapproximately 1.35 A (185 mV/A) because the current sensor output value is 2.5 V when the current iszero. The second channel on behalf of the PWM control signal has the same period and an amplitudeof 5 V.
Figure 18 shows the measurement result of the proposed pulse-based charging operation usingthe frequency searching mode and duty searching mode, respectively, during one cycle. Using theMATLAB/Simulink, the PC-side model-driven supervisor could indirectly probe the electrical signalfor the implemented hardware. The 1000 Hz frequency is obtained as the optimal charging frequencyafter changing the frequency from 500 Hz to 5000 Hz. Then, the following duty search mode triesto change the duty cycle from 10 to 25, from which the duty search algorithm determines that theoptimal duty is 20%.
From 0% SOC to 20% SOC, the battery is charged at C/2 (standard charge current) as thepolarization phenomenon is serious, as mentioned above. Then, the second stage tries to charge at4 A (fast charge current) until the level reaches the polarization curve. The charger continues charginguntil SOC is 80%, as shown in Figure 19.
Optimal frequency is obtained at the beginning and regained with every 5% SOC increase inthe charging process. The optimal duty cycle is continuously obtained with every 0.2% SOC increase.Figure 19 shows that the SOC and the temperature increase rapidly after 20% SOC and that the highesttemperature rise is 12 C, from 26 C to 38 C. Charging time from 0% to 80% SOC is 3318 s and from20% to 80% is 1896 s.

Energies 2016, 9, 209 17 of 20
Figure 18. Timed measurement result of the optimal pulse-based charging process during one cycleusing the proposed frequency and duty searching mode.
Searching duty and frequency of the charge pulse by considering the acceptable current based on SOC, temperature, Vp
Adjusting optimally acceptable current injection in runtime under boundary of cell polarization
Cu
rren
t(m
A)
Proposed IMethod IIMethod IIIMethod IV
(a)
(b)
(c)
Figure 19. Results of proposed charging algorithm. (a) duty and frequency search operation;(b) comparison of SOC and temperature rise; (c) dynamic adjustment result of voltage and currentby the proposed method compared to conventional approaches.
To maintain the duty cycle in a suitable range, the initial charging voltage is set to 13.6 V andadjusted four times when the SOC is 3%, 6%, 12%, and 20%, respectively, with a correspondingvoltage of 14 V, 15 V, 15.4 V, and 16.8 V. It is a remarkable fact that the value of the duty cycle is

Energies 2016, 9, 209 18 of 20
in a periodic oscillation state using the proposed searching algorithm. At the same time, both theterminal voltage and the current also have some shocks. In the optimal frequency searching mode,the abrupt change in current and voltage can be observed in Figure 19. The experimental results showthat the optimal pulse plays a critical role in the charging process.
Figure 20a shows our system-on-chip implementation and evaluation environment, includingthe host-side controller and the slave-side BMS. The host-side controller executes thecharge/discharge algorithm to control the slave-side BMS via the communication channel.The slave-side controller is implemented with an MCU-based algorithm executable chip to controlthe FET transistor, which is used to manage the current flow into the battery cells.
Host Charger Algorithm (PC)
I/F MCU
Multi Battery Cells
Smart Battery Management System (BMS)
Smart Battery Management System (BMS)
(a) (b)
Figure 20. Fabricated chip-based BMS Microcontroller and evaluation environment. (a) Evaluationenvironment of battery charge-algorithm and BMS; (b) fabricated BMS IC (stacked on multiplebatteries).
As shown in Figure 20b, the BMS IC is attached to the board to measure the temperature, thecurrent flow, and the voltage level of the target battery cells. The proposed fast-charge algorithmis simultaneously executed in the target BMS chip and host-side software to provide optimizedperformance by integrating the on-cell extracted battery characteristics.
4.3. Comparison of the Proposed Method and the Existing Method
In this section, a comparison experiment is conducted for the CC-CV, the fixed pulse (frequencyof 500 Hz, duty cycle of 50%), the polarization curve, and the proposed method. The CC-CVmethod adopts 2 C constant current charging lasting for 805 s, with a total charging time of 4075 s.This illustrates that increasing the current in the CC stage does not speed up the charging process.The fixed pulse method adopts 500 Hz, and a 50% duty fixed pulse, which has the longest chargingtime because the charging current is too high in the initial phase. As for the polarization curvemethod, it tries to charge the battery at C/2, which is the same as the proposed method, and thenfails to charge the battery at 4 A. Therefore, the selected C/3 charging current, with a total chargingtime of 4079 s, is shown in Table 2.
The experiment results show that the proposed charge method achieves the fast charging speedwithin operating temperature. This is especially suitable for the charge for EV or PHEV from 20%SOC to 80% SOC.
Table 2. Comparison of evaluation results.
No. Charge mode Temperature rise (C) 0%–80% Charge time (s) 20%–80% Charge time (s)
I Proposed 13 3318 1896II CC-CV(2C) 10 4075 3360III Fixed pulse 10 6150 5470IV Polarization method 12 4079 1909

Energies 2016, 9, 209 19 of 20
We assumed the cell equalization is performed after the pulse-based charging is triggered duringthe singles charging period so that all battery cells have the same terminal voltage and SOC. From theevaluation using the proposed charger for four battery cells, further works are needed so that the fastcharging is feasible for more large-scale batteries. The scalability issue using the proposed chargingapproach will be resolved after accurate cell equalization is performed by communicating and sharingthe cell characteristics between the group of cells.
The implemented charger circuit is composed of the discrete components, including commercialchips. Our initial approach focuses on evaluating the charging speed acceleration using the proposedmethod in terms of feasibility. Further works have to be performed to optimize the charger circuittopology. For example, the hall effect sensor has to be replaced with the small resistor and dedicatedanalog voltage-to-digital converter, and opto-coupler can be replaced with the switch IC on highvoltage protected circuit. The circuit using two grounds also has to be improved, still protecting thecircuit due to the over current.
5. Conclusions
In this study, the proposed system is based on two modes of searching: the optimal frequencysearching mode and the optimal duty cycle searching mode. By dynamic frequency control, theimpedance can be minimized while achieving the highest charging current. The duty cycle is wellcontrolled to keep the concentration of polarization at a relatively low level. This makes the chargingcurrent comply with the polarization curve in order to inject optimal charging currents into the batterycells, thereby ensuring the maximum charge speed without damaging the battery. The experimentalresults show that the proposed method can finish up to about 80% of its maximum capacity inapproximately 56 min with battery temperature increase of approximately 13 C.
Compared with traditional methods, the proposed method adopts relatively complex algorithmand pulse control circuit. This can cause difficulties in terms of implementing. In particular, quicklyswitching between the charging period and the relaxation period can cause a great change in thecharging current. Therefore, the impact of the charger on the power grid can not be ignored.
The implemented battery charger and BMS were evaluated for four cells of an INR18650-25Rbattery. The charging performance test for other types of lithium batteries will be performed in thefuture work. Furthermore, the impacts of the proposed charging algorithm in terms of reliability ofthe battery should be evaluated by measuring the remaining capacity of the battery after 1000 timescycle test.
Acknowledgments: This research was supported by the Basic Science Research Program through the NationalResearch Foundation of Korea (NRF) funded by the Ministry of Education (2014R1A6A3A04059410).
Author Contributions: Daejin Park designed the entire core architecture and wrote the paper including thecorresponding to the editor; Meng Di Yin performed the hardware/software implementation and experiments;Jeonghun Cho reviewed the feasibility of the proposed work.
Conflicts of Interest: The authors declare no conflict of interest. The founding sponsors had no role in the designof the study; in the collection, analyses, or interpretation of data; in the writing of the manuscript, and in thedecision to publish the results.
References
1. Situ, L. Electric Vehicle development: The past, present, future. In Proceedings of the 3rd InternationalConference on Power Electronics Systems and Applications, Hong Kong, 20–22 May 2009; pp. 1–3.
2. Li, J. Design of a Li-Ion battery charger with CC-CV-CT regualtion loop. In Proceedings of the 2011International Conference on Electric Information and Control Engineering, Wuhan, China, 15–17 April 2011;pp. 4088–4091.
3. Electric Vehicle Charging Infrastructure. Available online: http://www.mpoweruk.com/infrastructure.htm (accessed on 10 October 2015)

Energies 2016, 9, 209 20 of 20
4. Yin, M.D.; Youn, J.; Park, D.; Cho, J. Efficient Frequency and Duty Cycle Control Method for FastPulse-Charging of Distributed Battery Packs by Sharing Cell Status. In Proceedings of the InternationalWorkshop on Ubiquitous Wireless Sensor, Beijing, China, 10–14 August 2015; pp. 40–45.
5. Shen, W.; Vo, T.T.; Kapoor, A. Charging algorithms of lithium-ion batteries: An overview. In Proceedingsof the 2012 7th IEEE Conference on Industrial Electronics and Applications, Singapore, 18–20 July 2012;pp. 1567–1572.
6. Burke, A.; Miller, M. Fast Charging Tests (up to 6C) of Lithium Titanate Cells and Modules: Electrical and ThermalResponse; Institute of Transportation Studies: Davis, CA, USA, 2012; pp. 1–11.
7. Luo, Y.F.; Liu, Y.H.; Wang, S.C. Search for an optimal multistage charging pattern for lithium-ion batteriesusing the Taguchi approach. In Proceedings of the TENCON 2009—2009 IEEE Region 10 Conference,Singapore, 23–26 January 2009; pp. 1–5.
8. Chen, L.R. A Design of an Optimal Battery Pulse Charge System by Frequency-Varied Technique.IEEE Trans. Ind. Electron. 2007, 54, 398–405.
9. Chen, L.R. Design of Duty-Varied Voltage Pulse Charger for Improving Li-Ion Battery-Charging Response.IEEE Trans. Ind. Electron. 2009, 56, 480–487.
10. Jiang, J.; Liu, Q.; Zhang, C.; Zhang, W. Evaluation of Acceptable Charging Current of Power Li-Ion BatteriesBased on Polarization Characteristics. IEEE Trans. Ind. Electron. 2014, 61, 6844–6851.
11. Leong, C.; Gan, Y.; Gan, G.; Phuan, Z.; Yoong, M.; Cheah, B.; Chew, K. Ultra fast charging system on lithiumion battery. In Proceedings of the 2010 IEEE Conference on Sustainable Utilization and Development inEngineering and Technology, Petaling Jaya, Malaysia, 20–21 November 2010; pp. 37–39.
12. Huria, T.; Ceraolo, M.; Gazzarri, J.; Jackey, R. High fidelity electrical model with thermal dependencefor characterization and simulation of high power lithium battery cells. In Proceedings of the 2012 IEEEInternational Electric Vehicle Conference, Greenville, SC, USA, 4–8 March 2012; pp. 1–8.
13. Chang, W.Y. The State of Charge Estimating Methods for Battery: A Review. ISRN Appl. Math. 2013, 2013,doi:10.1155/2013/953792.
14. Yin, M.D.; Youn, J.; Park, D.; Cho, J. Dynamic Frequency and Duty Cycle Control Method for FastPulse-Charging of Lithium Battery Based on Polarization Curve. In Proceedings of the 9th InternationalConference on Frontier of Computer Science and Technology, Dalian, China, 26–28 August 2015; pp. 40–45.
15. Chen, H.C.; Chou, S.R.; Chen, H.C.; Wu, S.L.; Chen, L.R. Fast Estimation of State of Charge for Lithium-IonBattery. In Proceedings of the 2014 International Symposium on Computer, Consumer and Control (IS3C),Taichung, Taiwan, 10–12 June 2014; pp. 284–287.
c© 2016 by the authors; licensee MDPI, Basel, Switzerland. This article is an openaccess article distributed under the terms and conditions of the Creative Commons byAttribution (CC-BY) license (http://creativecommons.org/licenses/by/4.0/).