pulmonary function in stage i and ii pulmonary sarcoidosis
TRANSCRIPT
PULMONARY FUNCTION IN STAGE I A N D I1 PULMONARY SARCOIDOSIS*
Albert Miller, Ming Chuang, Alvin S . Teirstein, and Louis E. Siltzbach
The Pulmonary Laboratory and Pulmonary Division The Mount Sinai School of Medicine of
The City University of New York New York, New York 10029
As part of a continuing correlation of physiologic changes with clinical and radiographic staging in sarcoidosis, pulmonary function tests were performed on 25 previously unstudied patients with Stage I and 19 patients with Stage I1 disease a s defined by Siltzbach.’ Those with Stage I had mediastinal adenopathy with no or minor and localized parenchymal change, whereas those with Stage I1 sarcoidosis had mediastinal adenopathy with clear-cut streaky, nodular, or pneumonic infiltrates, but without evidence of fibrosis. The latter, showing hilar or diaphragmatic elevation, tracheal deviation, and/or cystic spaces in the lung, were the subject of previous reports.293
Unlike other investigators4 we found significant differences between the various stages of sarcoidosis compatible with the evolution of the pulmonary lesions.
Materials and Methods
All patients were studied in the Pulmonary Laboratory of the Mount Sinai School of Medicine within the past 2 yr. Concurrent roentgenograms were re- viewed by all 4 investigators. The diagnosis of sarcoidosis was established in all cases by demonstration of noncaseating epithelioid granulomas within the ap- propriate clinical setting and/or by positive Kveim test.
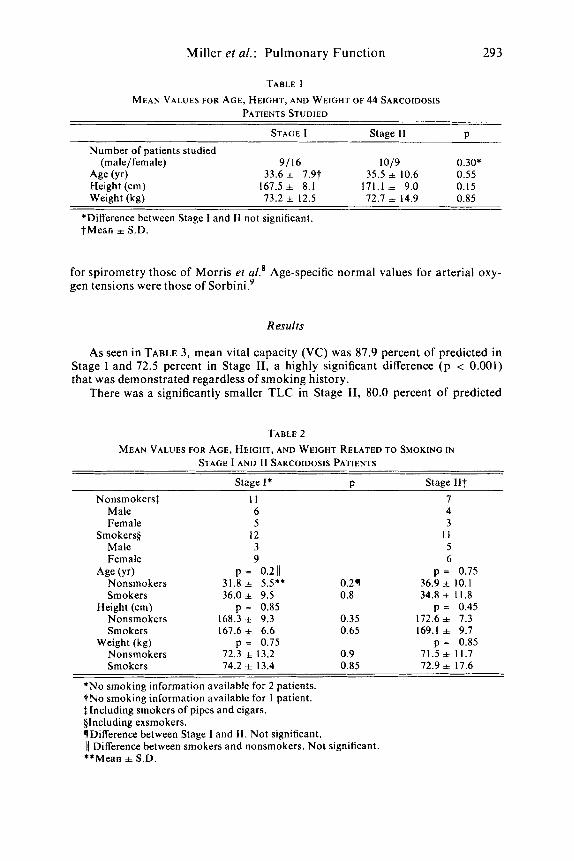
Mean age, height, and weight for the 44 patients are shown in TABLE 1. There are no significant differences between Stages I and 11, although there are more men in Stage 11. Mean ages are less than the 43.8 yr for the 16 patients with fibrosis secondary to pulmonary sarcoidosis previously described.’” There are no sig- nificant differences in age, height, or weight between smokers and nonsmokers in the same stage of disease or between patients with the same smoking history but of different stages (TABLE 2).
Spirometry, flow-volume curves, and single-breath N2 washout were per- formed by methods previously d e ~ c r i b e d . ~ Single-breath CO diffusing capacity (DL,,sB) was obtained by a modified Ogilvie method,5 total lung capacity (TLC) by multiple breath helium dilution or body plethysmography, and airway resis- tance (RAW) by body plethysmography. Predicted values for flow-volume rela- tionships were previously d i ~ c u s s e d . ~ For maximal voluntary ventilation (MVV) they were those of Baldwin et u I . , ~ for TLC and DL,,SB those of Bates et al.,’ and
*This work was supported by the Jack Martin Fund and Grant 5-RO 1 HL 13853-17 from the National Heart and Lung Institute.
29 2
Miller et al.: Pulmonary Function 29 3
TABLE I MEAN VALUES FOR AGE, HEIGHT, A N D WEIGHT OF 44 SARCOIDOSIS
PATIENTS STUDIED
STAGE I Stage I 1 P Number of patients studied
Age (Yr) 33.6 f 7.9t 35.5 + 10.6 0.55 Height (cm) 167.5 f 8.1 171.1 =t 9.0 0.15 Weight (kg) 13.2 * 12.5 12.1 + 14.9 0.85
(male/female) 9/16 1019 0.30*
*Difference between Stage I and I1 not significant. +Mean i S.D.
for spirometry those of Morris et al.' Age-specific normal values for arterial oxy- gen tensions were those of S ~ r b i n i . ~
Results
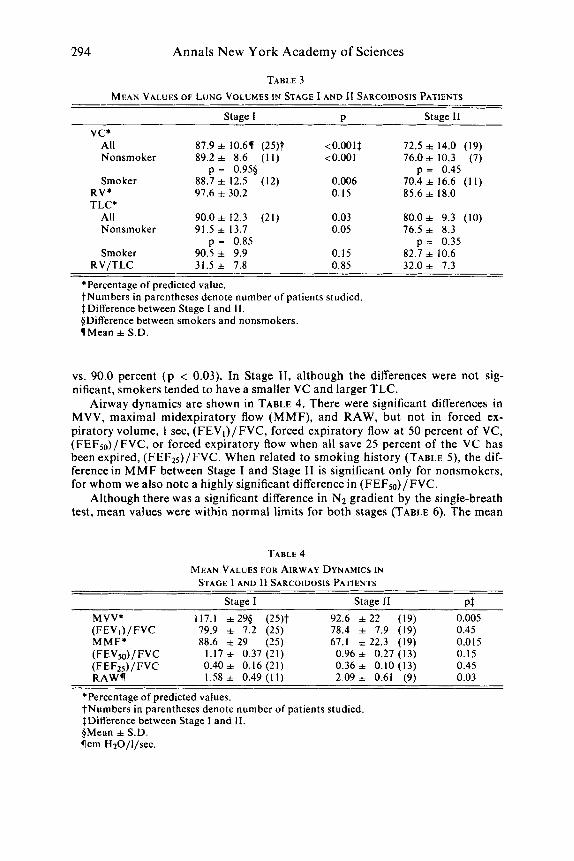
As seen in TABLE 3, mean vital capacity (VC) was 87.9 percent of predicted in Stage I and 72.5 percent in Stage 11, a highly significant difference ( p < 0.001) that was demonstrated regardless of smoking history.
There was a significantly smaller TLC in Stage 11, 80.0 percent of predicted
TABLE 2 MEAN VALUES FOR AGE, HEIGHT, AND WEIGHT RELATED TO SMOKING I N
STAGE I A N D I1 SARCOIDOSIS PATIENTS
Stage I* P Stage I I t Nonsmokers$ I 1 7
Male 6 4 Female 5 3
Smokers$ 12 I 1 Male 3 5 Female 9 6
Age (Yr) p = 0.2 I) p = 0.75 Nonsmokers 31.8 f 5.5** 0.21 36.9 f 10.1 Smokers 36.0 + 9.5 0.8 34.8 f 1 I .8
Nonsmokers 168.3 i= 9.3 0.35 172.6 f 7.3 Smokers 161.6+ 6.6 0.65 169.1 f 9.7
Nonsmokers 72.3 f 13.2 0.9 71.5 f 11.7 Smokers 14.2 f 13.4 0.85 72.9 f 11.6
Height (cm) p = 0.85 p = 0.45
Weight (kg) p = 0.15 p = 0.85
*No smoking information available for 2 patients. ?No smoking information available for 1 patient. $Including smokers of pipes and cigars. §Including exsmokers. qDifference between Stage I and 11. Not significant. )I Difference between smokers and nonsmokers. Not significant. **Mean =t S.D.
294 Annals N e w York Academy of Sciences
TABLE 3 MEAN VALUES OF LUNG VOLUMES IN STAGE I A N D 11 SARCOIDOSIS PATIENTS
v c * All Nonsmoker
Smoker RV* TLC*
All Nonsmoker
Smoker RV/TLC
Stage I
87.9 f 10.6( (25)f 89.2 + 8.6 ( I 1)
88.7 + 12.5 (12) 97.6 f 30.2
90.0 f 12.3 (21) 91.5 + 13.7
90.5 + 9.9 31.5 + 7.8
p = 0.955
p = 0.85
P
<0.001f <0.001
0.006 0.15
0.03 0.05
0.15 0.85
Stage I1
72.5 f 14.0 (19) 76.0+ 10.3 (7)
70.4 f 16.6 ( I I ) 85.6 f 18.0
p = 0.45
80.0 f 9.3 (10) 76.5 f 8.3
82.7 + 10.6 32.0 + 7.3
p = 0.35
*Percentage of predicted value. ?Numbers in parentheses denote number of patients studied. $Difference between Stage 1 and 11. @Difference between smokers and nonsmokers. (Mean f S.D.
vs. 90.0 percent (p < 0.03). In Stage 11, although the differences were not sig- nificant, smokers tended to have a smaller VC and larger TLC.
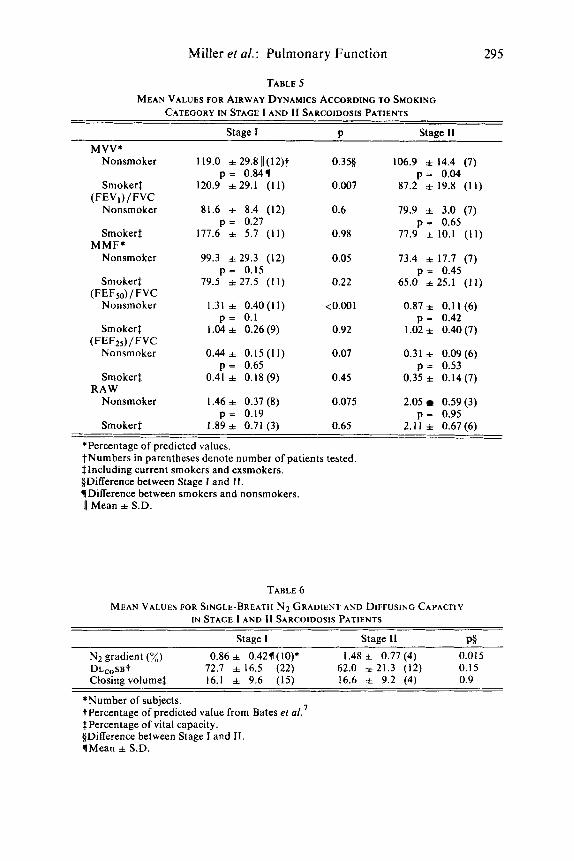
Airway dynamics are shown in TABLE 4. There were significant differences in MVV, maximal midexpiratory flow (MMF), and RAW, but not in forced ex- piratory volume, 1 sec, (FEVl)/FVC, forced expiratory flow a t 50 percent of VC, (FEFS0)/FVC, or forced expiratory flow when all save 25 percent of the VC has been expired, (FEF25)/ FVC. When related to smoking history (TABLE 5 ) , the dif- ference in M M F between Stage I and Stage I1 is significant only for nonsmokers, for whom we also note a highly significant difference in (FEF,)/FVC.
Although there was a significant difference in Nz gradient by the single-breath test, mean values were within normal limits for both stages (TABLE 6). The mean
TABLE 4
STAGE 1 AND I1 SARCOIDOSIS PATIENTS MEAN VALUES FOR AIRWAY DYNAMICS IN
Stage I Stage I1 PI MVV* 117.1 =t 295 (25)t 92.6 f 2 2 (19) 0.005 (FEVi)/FVC 79.9 + 7.2 (25) 78.4 + 7.9 (19) 0.45 MMF* 88.6 f 29 (25) 67.1 f 22.3 (19) 0.0 I5 (FEV50)/ FVC 1.17 f 0.37 (21) 0.96 f 0.27 (13) 0.15 (FEFzs)/FVC RAW(
0.40* 0.16 (21) 0.36 f 0.10 (13) 0.45 1.58=t 0 .49(l l ) 2.09 f 0.61 (9) 0.03
*Percentage of predicted values. ?Numbers in parentheses denote number of patients studied. $Difference between Stage I and 11. @Mean =t S.D. !lcm HzO/l/sec.
Miller et al.: Pulmonary Function 295
TABLE 5 MEAN VALUES FOR AIRWAY DYNAMICS ACCORDING TO SMOKING
CATEGORY IN STAGE I AND I1 SARCOIDOSIS PATIENTS
Stage I P MVV*
Nonsmoker 119.0 + 29.811(12)t 0.355
Smokerf 120.9 +29.1 (11) 0.007
Nonsmoker 81.6 + 8.4 (12) 0.6
Smoker! 177.6 + 5.7 (11) 0.98
Nonsmoker 99.3 i 2 9 . 3 (12) 0.05
p = 0.841
(FEV,) /FVC
p = 0.27
MMF*
p = 0.15 Smoker$ 79.5 i 27.5 (11) 0.22
Nonsmoker 1.31 f 0.40(11) <0.001 (FEF50) / FVC
p = 0.1 Smokerf 1.04 i 0.26 (9) 0.92
Nonsmoker 0.44* 0.15(11) 0.07
Smoker$ 0.41 i 0.18 (9) 0.45
Nonsmoker I .46 i 0.37 (8) 0.075
Smoker$ 1.89 i 0.7 1 (3) 0.65
(FEF25)/FVC
p = 0.65
RAW
p = 0.19
Stage I1
106.9 f 14.4 (7) p = 0.04
87.2 f 19.8 (11)
79.9 3.0 (7) p = 0.65
77.9 f 10.1 (11)
73.4 f 17.7 (7) p = 0.45
65.0 i 2 5 . 1 (11)
0.87 i 0.1 1 (6)
1.02 i 0.40 (7)
0.31 + 0.09 (6)
0.35 + 0.14 (7)
2.05 0.59 (3)
2.11 i 0.67 (6)
p = 0.42
p = 0.53
p = 0.95
*Percentage of predicted values. ?Numbers in parentheses denote number of patients tested. $Including current smokers and exsmokers. §Difference between Stage I and 11. YDifference between smokers and nonsmokers.
11 Mean * S.D.
TABLE 6 MEAN VALUES FOR SINGLE-BREATH N2 GRADIENT AND DIFFUSING CAPACITY
I N STAGE I A N D I1 SARCOIDOSIS PATIENTS
Staae I Stage I1 V6
N2 gradient (%) 0.86 f 0.426(10)* 1.48 f 0.77 (4) 0.015 DLcoSBT 72.7 i 16.5 (22) 62.0 f 21.3 (12) 0.15 Closing volume$ 16.1 + 9.6 (15) 16.6 + 9.2 (4) 0.9
*Number of subjects. t Percentage of predicted value from Bates ez al. $Percentage of vital capacity. §Difference between Stage I and 11. 1Mean + S.D.
296 Annals New York Academy of Sciences
TABLE 7 MEAN VALUES OF ARTERIAL BLOOD GASES IN
STAGE I AND I1 SARCOIDOSIS PATIENTS
Stage 1 P Stage I1
Pa,, mm Hg Rest
All 84.9 +7.@ (15)* 0.151 78.0 f 13.3 (12) Nonsmoker 85.7 f 7.5 (9) 0.61 82.8 f 14.0 (6)
Smoker 83.7 f 8.4 (6) 0.18 73.2 f 11.7 (6)
All 88.1 *7.8 (15) <0.001 71.1 f 14.4 (12) Nonsmoker 88.3 f 8.4 (9) 0.019 73.0 + 13.8 (6)
Smoker 87.8 f 7.6 (6) 0.035 69.2 + 16.0 (6)
Rest 37.5 f 3.7 (15) 0.45 38.9 f 5.6 (12) Exercise 35.3 f 6.0 (15) 0.95 36.4 f 5.8 (12)
Rest 7.412 f 0.030(15) 0.95 7.41 1 f 0.055 (12) Exercise 7.388 f 0.039 (15) 0.35 7.404 + 0.048 ( 12)
p = 0.64t p = 0.22
Exercise
p = 0.93 p = 0.66
mm Hg
PH
*Numbers in parentheses denote number of patients studied. ?Difference between smokers and nonsmokers. SDifference between Stage I and 11. §Mean f S.D.
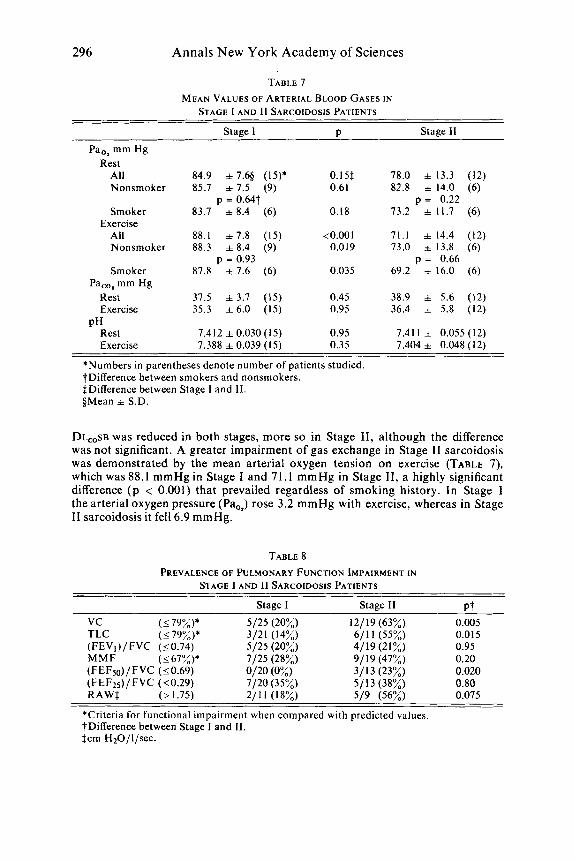
DL,,SB was reduced in both stages, more so in Stage 11, although the difference was not significant. A greater impairment of gas exchange in Stage I1 sarcoidosis was demonstrated by the mean arterial oxygen tension on exercise (TABLE 7), which was 88.1 mmHg in Stage I and 71.1 mmHg in Stage 11, a highly significant difference ( p < 0.001) that prevailed regardless of smoking history. In Stage I the arterial oxygen pressure (Pa,,) rose 3.2 mmHg with exercise, whereas in Stage I1 sarcoidosis it fell 6.9 mmHg.
TABLE 8 PREVALENCE OF PULMONARY FUNCTION IMPAIRMENT I N
STAGE I AND I1 SARCOIDOSIS PATIENTS
Stage 1 Stage 11 P t
vc (179%)* 5/25 (20%) 12/19(63%) TLC (_<79%)* 3/21 (14%) 611 1 (55%) (FEVl)/ FVC (50.74) 5/25 (20%) 4/19 (21%) MMF (<67%)* 7/25 (28%) 91 19 (47%) (FEFso) / FVC (50.69) 0120 (0%) 3/13 (23%) (FEF25) / FVC (50.29) 7/20 (35%) 5/13 (38%) RAWS (> 1.75) 2/11 (18%) 5/9 (56%)
*Criteria for functional impairment when compared with predicted values. ?Difference between Stage I and 11. Scrn H20/l/sec.
0.005 0.015 0.95 0.20 0.020 0.80 0.075
Miller et al.: Pulmonary Function 297
TABLE 9 PREVALENCE OF DIFFUSION IMPAIRMENT, HYPOXEMIA, A N D HYPOCAPNIA
IN STAGE 1 AND I1 SARCOIDOSIS PATIENTS
Stage I Stage I1 D% DL,,sB* (<75%) 12/22 (55%) 11/12 (92%) 0.03
Rest 8/ 15 (53%) 9/12 (75%) 0.25 Pao2t (mm Hg)
Exercise 4/ 15 (27%) 10/12 (83%) 0.005
Rest 4/ 15 (27%) 2/12 (17%) Exercise 5 / 15 (33%) 4/12 (33%)
PacO, (534 mm Hg) 0.60 -
*Diffusion impairment criteria from percentage predicted from Bates er 01.'
?Age-specific, from Sorbini et aL9 $Difference between Stage I and 11.
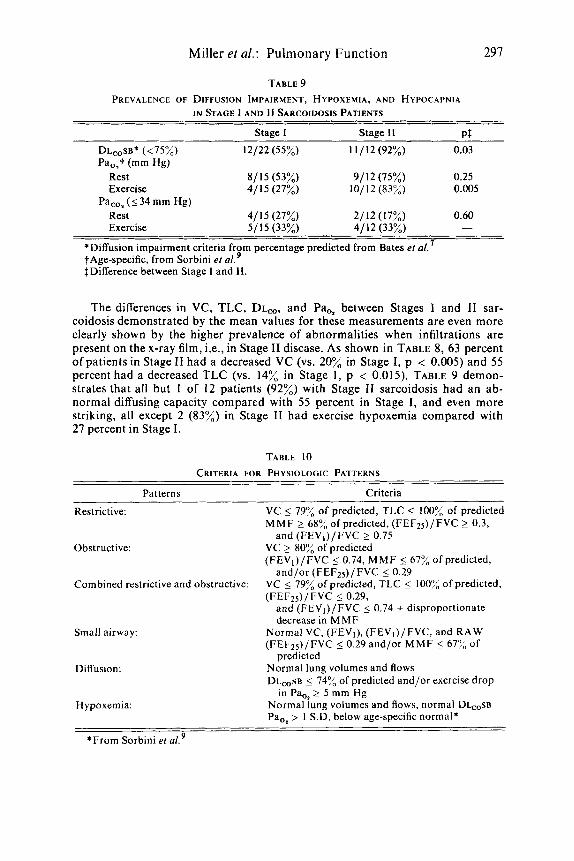
The differences in VC, TLC, DL,, and Pa,* between Stages I and I1 sar- coidosis demonstrated by the mean values for these measurements are even more clearly shown by the higher prevalence of abnormalities when infiltrations are present on the x-ray film, i.e., in Stage I1 disease. As shown in TABLE 8, 63 percent of patients in Stage I1 had a decreased VC (vs. 20% in Stage I, p < 0.005) and 55 percent had a decreased TLC (vs. 14% in Stage I , p < 0.015). TABLE 9 demon- strates that all but 1 of 12 patients (92%) with Stage I1 sarcoidosis had an ab- normal diffusing capacity compared with 55 percent in Stage I , and even more striking, all except 2 (83%) in Stage I1 had exercise hypoxemia compared with 27 percent in Stage I .
TABLE 10 CRITERIA FOR PHYSIOLOGIC PATTERNS
Patterns Criteria
Restrictive: VC 5 79% of predicted, TLC 5 100% of predicted MMF 2 68% of predicted, (FEF25)/FVC 2 0.3,
VC 2 80% of predicted (FEVI)/FVC 5 0.74, MMF 5 67% of predicted,
VC 5 79% of predicted, TLC 5 100% of predicted,
and (FEVi)/FVC 5 0.74 + disproportionate decrease in MMF
Normal VC, (FEV,), (FEVi)/FVC, and RAW (FEF*=,)/FVC 5 0.29 and/or MMF 5 677" of
Normal lung volumes and flows DL,,SB 5 74% of predicted and/or exercise drop
Normal lung volumes and flows, normal DL~,SB Pao2 > I S.D. below age-specific normal*
and (FEV,)/FVC 2 0.75 Obstructive:
and/or (FEFz,)/FVC 50.29 Combined restrictive and obstructive:
(FEF25)/FVC 50.29,
Small airway:
predicted Diffusion:
in Pa,, 2 5 mm Hg H ypoxemia:
*From Sorbini et d9
298 Annals New York Academy of Sciences
Discussion
Mean values for all pulmonary function tests were normal in Stage I sar- coidosis except for DL,,sB, which was slightly decreased (72.7% of predicted). Prevalence rates for impairment of conventional measurements of lung volumes and flows did not exceed 28 percent, whereas prevalence of abnormal diffusing capacity was 55 percent and abnormal resting Pa,, was 53 percent.
Mean values for VC, TLC, MMF, RAW, and oxygen tension on exercise were abnormal in Stage I1 and significantly different from Stage I. Significant dif- ferences in mean values were paralleled by differences in prevalence of impair- ment of these measurements and of DL,, as well. Prevalence rates of abnormal lung volumes and flows ranged from 43 to 63 percent.
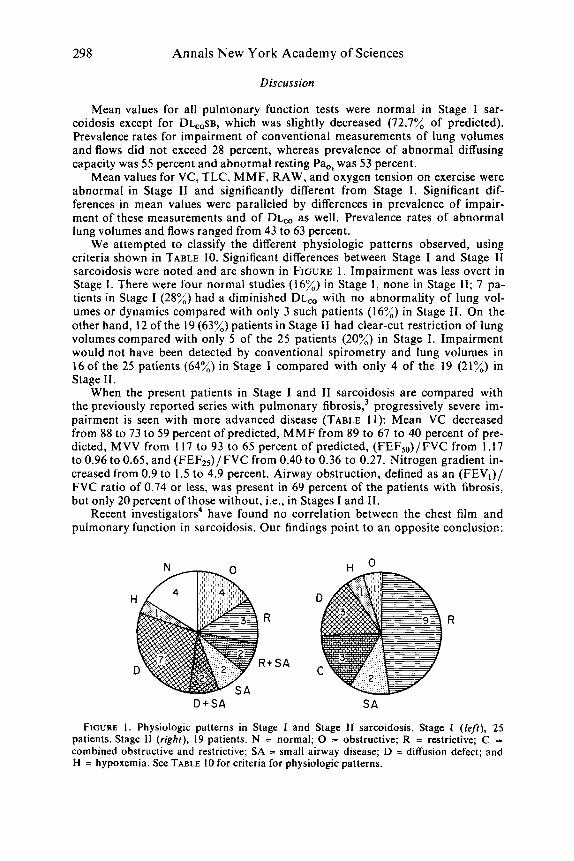
We attempted to classify the different physiologic patterns observed, using criteria shown in TABLE 10. Significant differences between Stage I and Stage I1 sarcoidosis were noted and are shown in FIGURE 1. Impairment was less overt in Stage I . There were four normal studies (16%) in Stage I, none in Stage 11; 7 pa- tients in Stage I (28%) had a diminished DL, with no abnormality of lung vol- umes or dynamics compared with only 3 such patients (16%) in Stage 11. On the other hand, 12 of the 19 (63%) patients in Stage I1 had clear-cut restriction of lung volumes compared with only 5 of the 25 patients (20%) in Stage I. Impairment would not have been detected by conventional spirometry and lung volumes in 160f the 25 patients (64%) in Stage I compared with only 4 of the 19 (21%) in Stage 11.
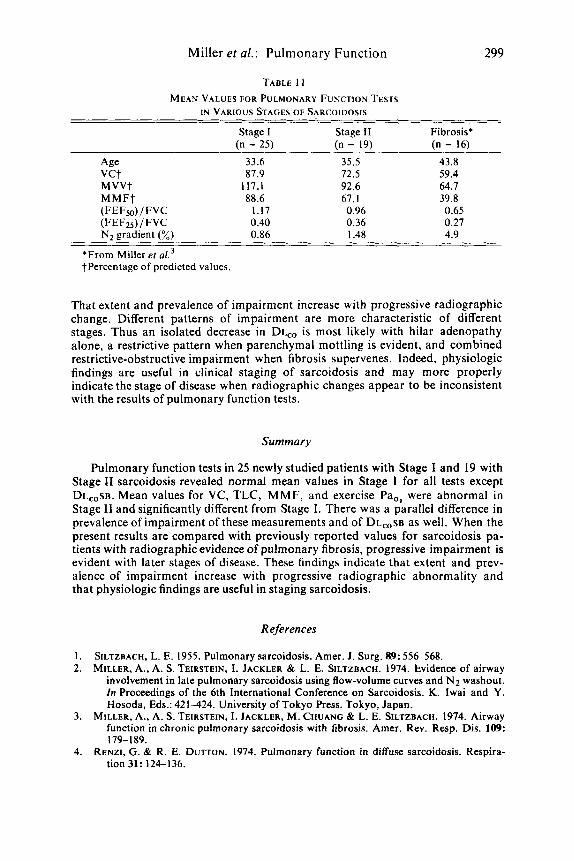
When the present patients in Stage I and I1 sarcoidosis are compared with the previously reported series with pulmonary f i b r ~ s i s , ~ progressively severe im- pairment is seen with more advanced disease (TABLE 11): Mean VC decreased from 88 to 73 to 59 percent of predicted, MMF from 89 to 67 to 40 percent of pre- dicted, MVV from 117 to 93 to 65 percent of predicted, (FEF,)/FVC from 1.17 to 0.96 to 0.65, and (FEF2,)/FVC from 0.40 to 0.36 to 0.27. Nitrogen gradient in- creased from 0.9 to 1.5 to 4.9 percent. Airway obstruction, defined as an (FEV,)/ FVC ratio of 0.74 or less, was present in 69 percent of the patients with fibrosis, but only 20 percent of those without, i.e., in Stages I and 11.
Recent investigators4 have found no correlation between the chest film and pulmonary function in sarcoidosis. Our findings point to an opposite conclusion:
R R
R + S A
D + S A S A
FIGURE I . Physiologic patterns in Stage I and Stage I1 sarcoidosis. Stage I ( le f t ) , 25 patients. Stage I1 (right), 19 patients. N = normal; 0 = obstructive; R = restrictive; C = combined obstructive and restrictive; SA = small airway disease; D = diffusion defect; and H = hypoxemia. See TABLE 10 for criteria for physiologic patterns.
Miller et al.: Pulmonary Function 299
TABLE 1 I
IN VARIOUS STAGES OF SARCOIDOSIS MEAN V A L U E S FOR PULMONARY FUNCTION TESTS
Stage I Stage I1 Fibrosis* (n = 25) (n = 19) (n = 16)
Age 33.6 35.5 43.8 vct 87.9 72.5 59.4 MVVt 117.1 92.6 64.7 M M F t 88.6 67. I 39.8 (FEFso)/ FVC 1.17 0.96 0.65 (FEF2s) / FVC 0.40 0.36 0.27 N2 gradient (%) 0.86 1.48 4.9
*From Miller er a/.’ tPercentage of predicted values.
That extent and prevalence of impairment increase with progressive radiographic change. Different patterns of impairment are more characteristic of different stages. Thus an isolated decrease in DL,, is most likely with hilar adenopathy alone, a restrictive pattern when parenchymal mottling is evident, and combined restrictive-obstructive impairment when fibrosis supervenes. Indeed, physiologic findings are useful in clinical staging of sarcoidosis and may more properly indicate the stage of disease when radiographic changes appear to be inconsistent with the results of pulmonary function tests.
Summary
Pulmonary function tests in 25 newly studied patients with Stage I and 19 with Stage I1 sarcoidosis revealed normal mean values in Stage I for all tests except DL,,sB. Mean values for VC, TLC, MMF, and exercise Pao2 were abnormal in Stage I1 and significantly different from Stage I. There was a parallel difference in prevalence of impairment of these measurements and of DL,,SB as well. When the present results are compared with previously reported values for sarcoidosis pa- tients with radiographic evidence of pulmonary fibrosis, progressive impairment is evident with later stages of disease. These findings indicate that extent and prev- alence of impairment increase with progressive radiographic abnormality and that physiologic findings are useful in staging sarcoidosis.
References
1. 2.
SILTZBACH, L. E. 1955. Pulmonary sarcoidosis. Amer. J. Surg. 89: 556-568. MILLER, A., A. S. TEIRSTEIN, I. JACKLER & L. E. SILTZBACH. 1974. Evidence of airway
involvement in late pulmonary sarcoidosis using flow-volume curves and N2 washout. In Proceedings of the 6th International Conference on Sarcoidosis. K. Iwai and Y. Hosoda, Eds.: 421-424. University of Tokyo Press. Tokyo, Japan.
MILLER, A., A. S. TEIRSTEIN, I . JACKLER, M. CHUANG & L. E. SILTZBACH. 1974. Airway function in chronic pulmonary sarcoidosis with fibrosis. Amer. Rev. Resp. Dis. 109:
RENZI, G. & R. E. DUTTON. 1974. Pulmonary function in diffuse sarcoidosis. Respira-
3.
179- 189. 4.
tion 31: 124-136.
300 A n n a l s N e w York Academy of Sciences
5. OGILVIE, C. M., R. E. FORSTER, W. S. BLAKEMORE & J. W. MORTON. 1957. A stan- dardized breath holding technique for the clinical measurement of the diffusing capacity of the lung for carbon monoxide. J. Clin. Invest. 36: 1-17.
BALDWIN, E. deF., A. COURNAND & D. W. RICHARDS, JR. 1948. Pulmonary insuffi- ciency. I. Physiologic classification, clinical methods of analysis, standard values in normal subjects. Medicine 27: 243-278.
BATES, D. V., P. T. MACKLEM & R. V. CHRISTIE. 1971. Respiratory Function in Dis- ease: 93-94. W. B. Saunders Company, Philadelphia, Pa.
MORRIS, J. F., A. KOSKI & L. C. JOHNSON. 1971. Spirometric standards for healthy non- smoking adults. Amer. Rev. Resp. Dis. 103: 57-67.
SORBINI, C . A., V. GRASSI, E. SOLINAS & G. MUIESAN. 1968. Arterial oxygen tension in relation to age in healthy subjects. Respiration 25: 3-13.
6.
7.
8.
9.
DISCUSSION
DR. E. A. GAENSLER: Two of the speakers this afternoon compared Stage I and Stage I1 sarcoidosis and then compared Stage I1 with patients with fibrosis. One has t o compare the same disease stage ’ h e n one looks a t pulmonary fibrosis. The patients that were shown by Dr. Miller and Dr. Turiaf obviously were pa- tients who had far advanced fibrosis. If one looks a t the whole spectrum of patients who had interstitial pneumonia, one can find some who had a relatively early cel- lular process that would not fit into the stage of very advanced impairment and obstructive disease.
DR. MILLER: I agree with the points that Dr. Gaensler raises. We began our observations with the fibrotic group and we were struck that both physiologically and clinically they were different from the general run of other patients with sar- coidosis. The former had evidence of airway obstruction, most likely related to fibrosis, and many of them manifested wheezing and even hemoptysis, symptoms we d o not ordinarily associate with sarcoidosis. Then we went back and looked a t patients who had no fibrosis, patients who had either hilar adenopathy or nonfibrotic parenchymal changes. We tried to exclude fibrosis, realizing that radiographic criteria are imperfect. We wanted to see whether we could tell the difference between those two groups physiologically and I think to some degree we did.
DR. R. C. YOUNG, JR.: Dr. Miller said that a decrease in FEVl /FVC reflects obstructive airway disease. Is this related to endobronchial lesions? Or is it the generalized effect of fibrosis on the bronchi?
DR. MILLER: You can perhaps incriminate either mechanism. We did see it only in patients with far advanced disease and overt fibrosis on x-ray.
DR. R. DEREMEE: A year ago we published data on 107 patients supporting Dr. Miller’s findings. Interestingly there was a correlation of the patients’ symp- tom of dyspnea with pulmonary function. Our findings showed that patients who had dyspnea almost always had obstructive disease and when these two came to- gether there was a state of irreversibility in spite of steroids. Yet, there are those who say you should reserve treatment for the end of the disease, when it would d o n o good. I think we ought to reappraise that thinking.