pull-out strengths of gfrp-concrete bond exposed to ... · pull-out strengths of gfrp-concrete bond...
TRANSCRIPT
Pull-out Strengths of GFRP-Concrete Bond Exposed to AppliedEnvironmental Conditions
Muhammad Ikramul Kabir1),*, Bijan Samali1), and Rijun Shrestha2)
(Received December 6, 2015, Accepted September 28, 2016)
Abstract: This paper presents results of an experimental investigation on the behaviour of bond between external glass fibre
reinforced polymer reinforcement and concrete exposed to three different environmental conditions, namely, temperature cycles,
wet–dry cycles and outdoor environment separately for extended durations. Single shear tests (pull-out test) were conducted to
investigate bond strengths (pull-out strengths) of control (unexposed) and exposed specimens. Effect of the exposure conditions on
the compressive strength of concrete were also investigated separately to understand the effect of changing concrete compressive
strength on the pull-out strength. Based on the comparison of experimental results of exposed specimens to control specimens in
terms of bond strengths, failure modes and strain profiles, the most significant degradation of pull-out strength was observed in
specimens exposed to outdoor environment, whereas temperature cycles did not cause any deterioration of strength.
Keywords: GFRP-concrete bond, wet lay-up, pull-out strength, failure mode, strain profile, temperature cycles, wet–dry cycles,
outdoor environment.
1. Introduction
Application of fibre reinforced polymer (FRP) compositesin rehabilitation of concrete structures has recently beenconsidered as a suitable technique due to advantageousproperties of FRP such as high strength to weight ratio, highcorrosion resistance and ease in application process. Exten-sive research has been conducted on FRP material for bothits short and long term performance. In addition, manystudies can be found in literature on the FRP-concrete bondsystem for short term loads due to the dependence of theperformance of FRP bonded RC structures on the effectivestress transfer between FRP and concrete. However,according to authors’ knowledge, research studies on thelong term effects of environmental conditions on FRP-con-crete bond are still limited.Among the available studies, some research focused on
the durability of concrete beams strengthened with FRP andinvestigated the changes in ultimate beam strength andstiffness after various environmental exposures, whereasother research conducted similar investigation on the bondstrength between FRP and concrete under aggressive
environment. Various environmental conditions such asfreeze–thaw cycles, wet–dry cycles, combined environ-mental cycles, boiling water and UV radiation, hydrothermalageing under constant temperature and humidity, and dryheat were applied by Chajes et al. (1995), Toutanji andGomez (1997), Myers et al. (2001), Li et al. (2002) andGrace (2004) to investigate the long term performance ofFRP strengthened concrete beams in terms of ultimatestrength and/or stiffness of beams. Chajes et al. (1995)reported wet–dry cycles as slightly more severe than freezethaw cycles (Calcium Chloride was solution was used inboth cases) and graphite reinforced beams as the most dur-able compared to aramid and E-glass reinforced beams(36 % drop in strength was observed for aramid and E-glassreinforced beams due to wet–dry cycles). Toutanji andGomez (1997) also observed reduction of strength of twotypes of FRP-strengthened beams due to wet–dry cycles ofsalt water. The performance of CFRP-strengthened beamswas better than GFRP-strengthened beams. Myers et al.(2001) investigated the combined effect of freeze–thawcycles, extreme temperature cycles, relative humidity cyclesand indirect ultra-violet radiation exposure under sustainedload (0, 25 and 40 % of the ultimate load) on three types ofFRP (Carbon, Glass and Aramid)-concrete bond by means offour point bending tests of pre-cracked reinforced concrete(RC) beams. They reported the degradation of flexuralstiffness due to environmental conditions, especially for40 % sustained loads. GFRP (Glass Fibre Reinforced)strengthened beams showed the highest stiffness degradation(about 85 %). This study mainly considered the comparisonof strain profiles and flexural stiffness at a reference loadlevel 60 % of the ultimate load. In a similar study, Li et al.
1)Institute for Infrastructure Engineering, Western
Sydney University, Kingswood, NSW 2747, Australia.
*Corresponding Author;
E-mail: [email protected]
2)Centre for Built Infrastructure Research, University
of Technology Sydney, Ultimo, NSW 2007, Australia.
Copyright � The Author(s) 2016. This article is published
with open access at Springerlink.com
International Journal of Concrete Structures and MaterialsDOI 10.1007/s40069-016-0173-4ISSN 1976-0485 / eISSN 2234-1315
(2002) strengthened pre-cracked RC beams with carbon fibrereinforced polymer (CFRP) and GFRP sheets and investi-gated the combined effect of boiling water and UV-light.Test results showed 57–76 % loss of strengthening effi-ciency and 43–48 % loss of stiffness due to exposure.Unlike other studies, this study observed that CFRP-strengthened beams did not show higher remaining increasein strength than GFRP-strengthened beams after the expo-sure duration although CFRP is well known for its moredurable performance than GFRP. The reason was attributedto the deterioration of epoxy resin, and fibres, therefore, onlyhad a secondary role. Grace (2004) investigated the effectsof six types of environmental conditions on CFRP-strengthened concrete beams and reported the highestdegradation due to constant 100 % humidity at about 38 �Cconstant temperature for the duration of 10,000 h. The pri-mary mode of failure of CFRP strengthened beams with orwithout exposure was debonding of CFRP. This type offailure mode observed requires quantification of bondstrength due to exposure conditions by means of appropriatetest set-up. Research conducted by Homam et al. (2001), Daiet al. (2010), Benzarti et al. (2011), Yun and Wu (2011) andImani et al. (2010) focused on the performance of FRP-concrete bond system under freeze–thaw cycles, temperaturecycles, alkali solutions, moisture ingression, hydrothermalageing with the help of various test set-ups such as pull-off,bend tests, single-lap-joint shear tests, etc. Peel and shearfracture tests were used by Tuakta and Buyukozturk (2011)to study the effect of moisture on FRP-concrete bond systemby tri-layer fracture mechanics. Benzarti et al. (2011)observed the sensitivity of single shear test (pull-out test) toenvironmental conditions and suggested the use of the set-upfor adhesive bonded joints. In addition, Imani et al. (2010)adopted this test method because debonding of externallybonded FRP mainly occurs due to Mode II (shear) fracture.Moreover, according to Teng et al. (2002), this set-up cansimulate an important failure mode (intermediate flexuralcrack-induced debonding) of reinforced concrete beamsstrengthened with FRP. Although this failure mode occursdue to both shear and normal stress, shear stress is thedominant one in this type of failure and, therefore, can besimulated by direct shear test. Hence, more research apply-ing the test set-up can be helpful to create a large database ofFRP-concrete bond behaviour under various environmentalconditions.Research studies by Litherland et al. (1981), Dejke and
Tepfers (2001) and Phani and Bose (1987) proposed longterm prediction models for FRP and FRP in concrete envi-ronment applying high temperature to accelerate degradationrate. Their studies mainly investigated the durability of FRPnot the bond between FRP and concrete. Arrhenius Principlewas adopted in their research for acceleration of chemicalreaction rate. However, According to Robert et al. (2010),the use of high temperature may amplify the reduction of theproperties, leading to conservative prediction of long-termproperties. This inherent conservativeness necessitates fur-ther research by separating the high temperature from aspecific degradation mechanism.
Very limited data of natural ageing of FRP-concrete bondis another aspect found in the available literature and shouldbe addressed accordingly. Nishizaki and Kato (2011)investigated the durability of CFRP-concrete bond exposedto outdoor environment of Tsukuba Japan (moderate cli-mate) for 14 years since 1992 by means of pull-off and peeltests. Slight reduction of pull-off strength was observed after14 years of exposure but the peel test showed much devia-tion of strength due to outdoor environment and change offailure modes. However, the results of peel tests were notconclusive because the unexposed specimens of this serieswere fabricated much later (in 2006) than 1992 and couldnot be made from exactly the same materials used in 1992.Al-Tamimi et al. (2014) investigated the effect of dryexposure to sun as well as the saline water coupled withexposure to sun on CFRP-concrete bond specimens for morethan 150 days. In both conditions, sustained loads of 15 and25 % were used. The outdoor environment was chosen assummer time environment (temperature stays within therange between 38 and 55 �C at least for 3 months) of UnitedArab Emirates (UAE). Single shear tests were used tomeasure the bond strength after the exposure duration. Thetest results showed that harsh environment increased thebond strengths and the reason was attributed to greaterpolymer cross-linking due to elevated temperature. Theinteresting findings of the available two studies clearlyreflect the need for further research on natural ageing ofFRP-concrete bond in different climatic regimes.The current research aims to investigate the effects of tem-
perature cycles, humidity cycles and outdoor environmentseparately on CFRP-concrete and GFRP-concrete bond usingsingle shear test (pull-out test) for up to 18 months. This paperonly presents the experimental results of GFRP bondedspecimens, whereas the same for CFRP-concrete bond can befound in the PhD thesis by Kabir (2014) and Kabir et al.(2016a). The results of compressive tests on concrete cylinderssubjected to the same environmental conditions are also dis-cussed to understand the effect of concrete compressivestrengths on the changing behaviour of GFRP-concrete bond.
2. Experimental Program
Single shear tests (referred to as pull-out test herein) wereused to determine the strength of GFRP-concrete bond spec-imens exposed to three different environmental conditions(temperature cycles, wet–dry cycles and outdoor environ-ment) for durations up to 18 months. In addition, concretecylinders were fabricated from the same concrete mix used forpull-out specimens and were exposed to the same environ-mental conditions in order to identify the compressive strengthof concrete on the day of each pull-out test.
2.1 Pull-out Test of GFRP-Concrete BondSpecimens2.1.1 Specimen GeometryGFRP pull-out specimens consisted of a concrete prism
with dimensions of 300 mm 9 200 mm 9 150 mm and
International Journal of Concrete Structures and Materials
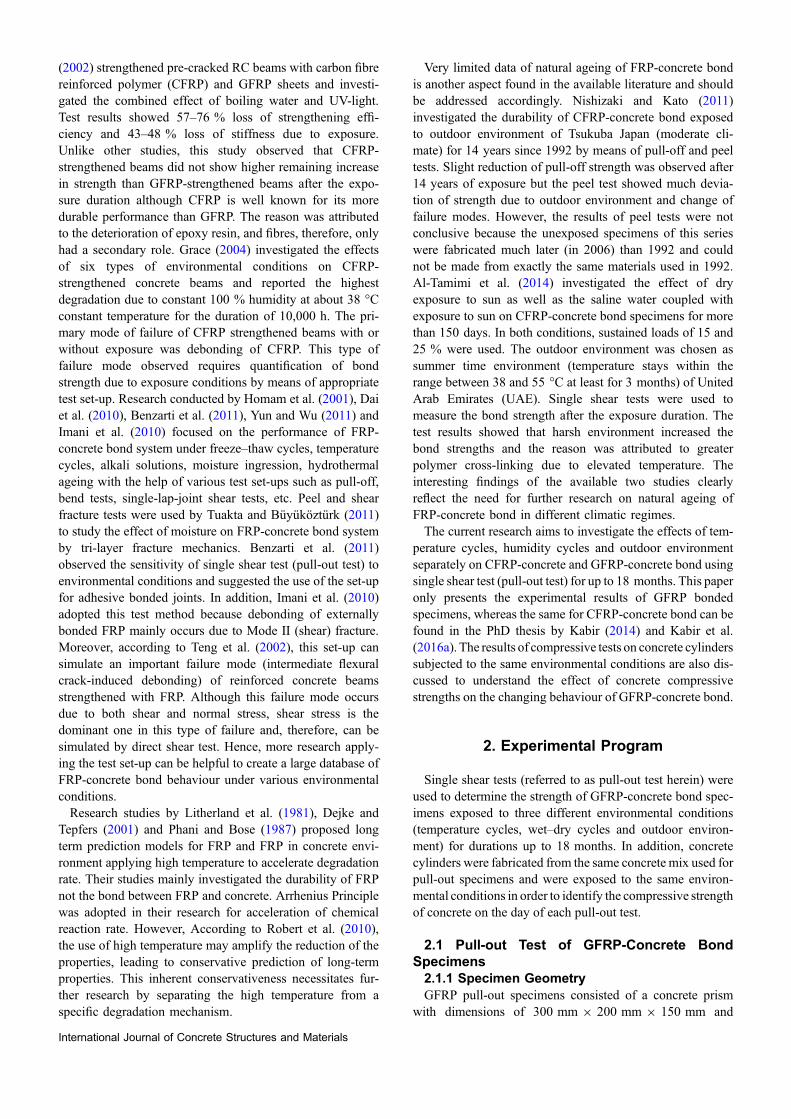
two layers of 40 mm wide FRP strip were bonded to the topof concrete prism. The total length of GFRP was 400 mm,including the bond length of 150 mm (Fig. 1). The bondlength of 150 mm was selected in a manner to satisfy theeffective bond length (84.5 mm) measured by the Eq. (1)recommended by Chen and Teng (2001). Effective bondlength can be defined as the active length for transferring ofmost of the interfacial stress from FRP sheets to concrete andbeyond this length failure load does not increase (Ouezdouet al. 2009; Kang et al. 2012). The bond length much longerthan the effective bond length was chosen considering thepossibility of increase in effective bond length due to envi-ronmental conditions and to keep the provision for thedevelopment of the full capacity of bond in that case.
Le ¼ffiffiffiffiffiffiffiffiffi
Ef tfffiffiffiffi
f 0c
p
s
ð1Þ
where Le = effective bond length, Ef = tensile modulus ofelasticity of FRP, tf = thickness of FRP and f
0
c = compres-sive strength of concrete.A gap of 50 mm was provided between the loaded edge of
adhesive bonded joint and concrete edge to prevent the edgeor boundary effect and to avoid wedge (triangular section)failure in concrete prism (Mazzotti et al. 2008, 2009). TheFRP strip was extended to 200 mm beyond the concreteprism to facilitate gripping by the jaws of the testing machine.
2.1.2 Fabrication of Pull-out Specimensand Materials PropertiesAfter concrete prisms were fabricated, moist curing was
conducted for 7 days by sprinkling water regularly andcovering them with plastic sheets. Then concrete specimenswere air cured under laboratory environment (22–23 �Ctemperature and 61–63 % relative humidity) for three moreweeks. After 28 days (moist and air curing), surface prepa-ration was conducted by exposing the aggregates by needle-gun. Two plies of GFRP strip were externally bonded to theconcrete prism with two part epoxy impregnation resin. Inaddition, concrete cylinders were cast to determine com-pressive properties of unexposed and exposed cylindersaccording to Australian Standards (AS 1012.9 1999; AS
1012.17 1997). Cylinders were also cured using the samecondition as used for the prisms. Moreover, GFRP couponswere prepared as per ASTM D3039/D3039M (2008) toinvestigate the tensile properties of GFRP only for unex-posed condition. The properties of concrete measured at28 days are shown in Table 1 whereas Table 2 provides theproperties of GFRP and epoxy resin.
2.1.3 Exposure Conditions2.1.3.1 Control Specimens Five specimens were
used as control specimens (GControl-1 to 5; where G refersto Glass and numbers from 1 to 5 refer to the specimennumber). After fabrication, control specimens were keptunder lab conditions (22–23 �C temperature and 61–63 %relative humidity) for curing of wet lay-up GFRP for 7 daysbefore they were tested under pull-out load.
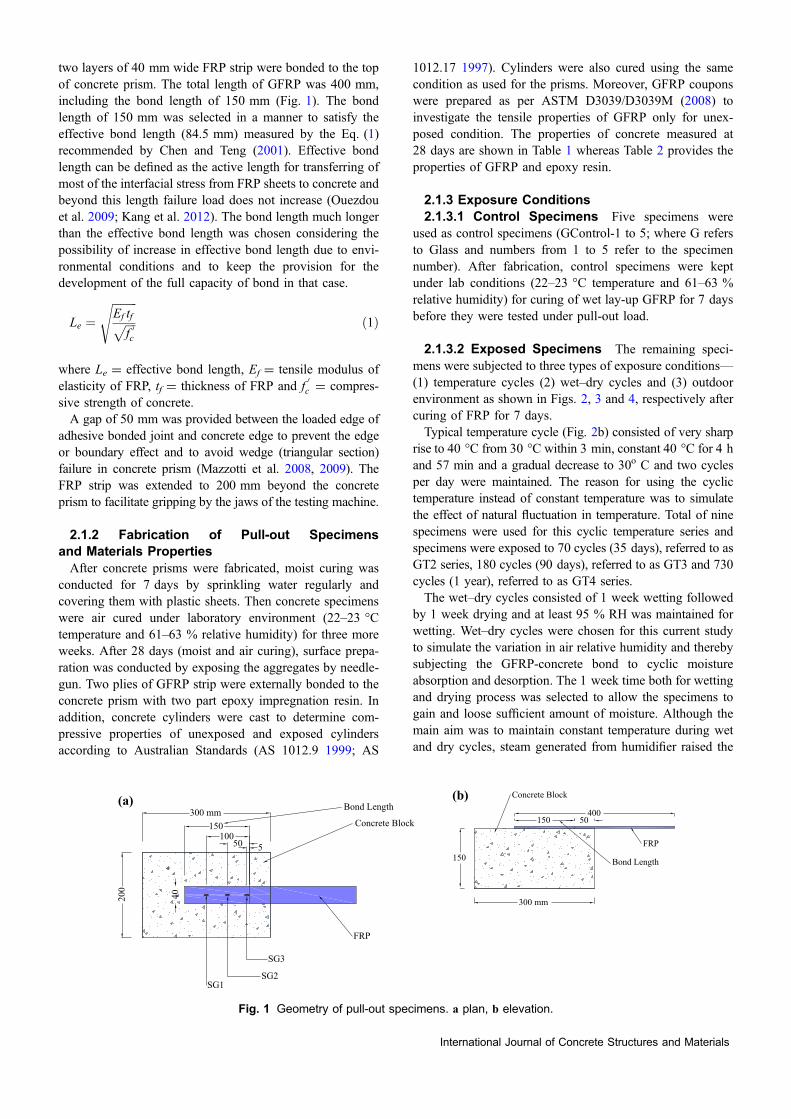
2.1.3.2 Exposed Specimens The remaining speci-mens were subjected to three types of exposure conditions—(1) temperature cycles (2) wet–dry cycles and (3) outdoorenvironment as shown in Figs. 2, 3 and 4, respectively aftercuring of FRP for 7 days.Typical temperature cycle (Fig. 2b) consisted of very sharp
rise to 40 �C from 30 �C within 3 min, constant 40 �C for 4 hand 57 min and a gradual decrease to 30o C and two cyclesper day were maintained. The reason for using the cyclictemperature instead of constant temperature was to simulatethe effect of natural fluctuation in temperature. Total of ninespecimens were used for this cyclic temperature series andspecimens were exposed to 70 cycles (35 days), referred to asGT2 series, 180 cycles (90 days), referred to as GT3 and 730cycles (1 year), referred to as GT4 series.The wet–dry cycles consisted of 1 week wetting followed
by 1 week drying and at least 95 % RH was maintained forwetting. Wet–dry cycles were chosen for this current studyto simulate the variation in air relative humidity and therebysubjecting the GFRP-concrete bond to cyclic moistureabsorption and desorption. The 1 week time both for wettingand drying process was selected to allow the specimens togain and loose sufficient amount of moisture. Although themain aim was to maintain constant temperature during wetand dry cycles, steam generated from humidifier raised the
(a) (b)
SG1
FRP
Concrete Block
SG2
SG3
Bond Length300 mm150
10050 5
200
40
Concrete Block
FRP
Bond Length
400
150
300 mm
150 50
Fig. 1 Geometry of pull-out specimens. a plan, b elevation.
International Journal of Concrete Structures and Materials
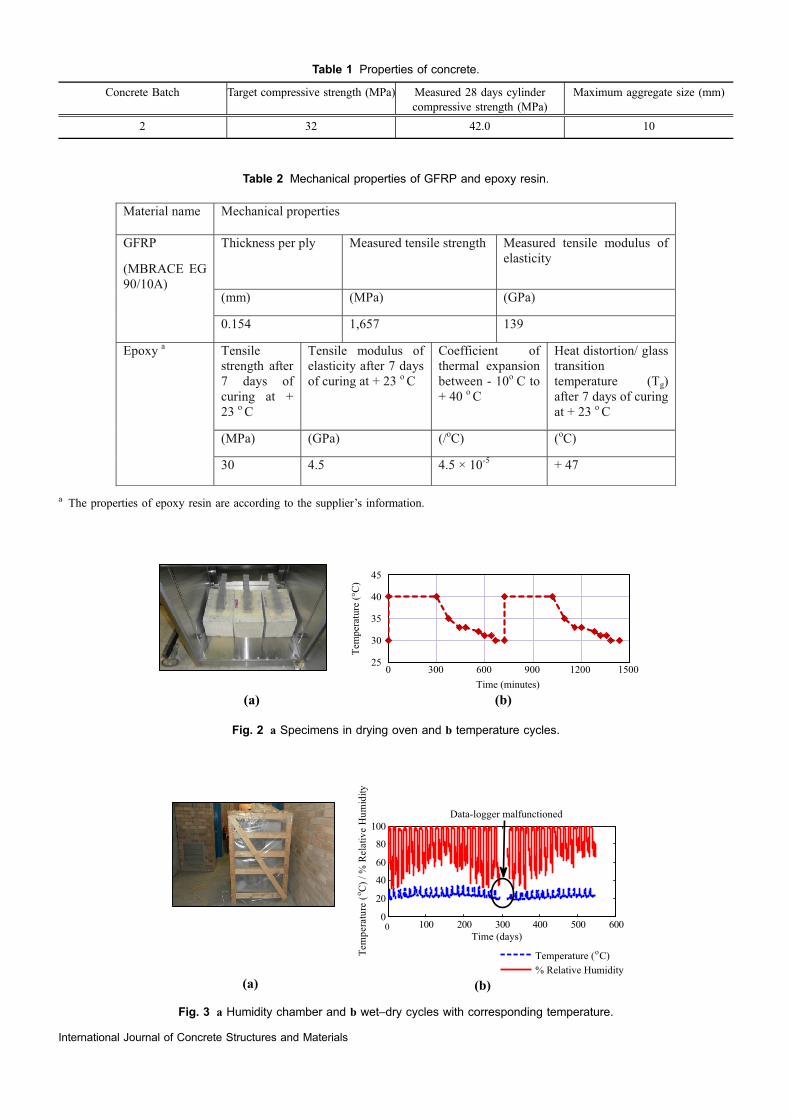
Table 1 Properties of concrete.
Concrete Batch Target compressive strength (MPa) Measured 28 days cylindercompressive strength (MPa)
Maximum aggregate size (mm)
2 32 42.0 10
Table 2 Mechanical properties of GFRP and epoxy resin.
Material name Mechanical properties
GFRP
(MBRACE EG 90/10A)
Thickness per ply Measured tensile strength Measured tensile modulus of elasticity
(mm) (MPa) (GPa)
0.154 1,657 139
Epoxy a Tensile strength after 7 days of curing at + 23 o C
Tensile modulus of elasticity after 7 days of curing at + 23 o C
Coefficient of thermal expansion between - 10o C to + 40 o C
Heat distortion/ glass transition temperature (Tg) after 7 days of curing at + 23 o C
(MPa) (GPa) (/oC) (oC)
30 4.5 4.5 × 10⁻⁵ + 47
a The properties of epoxy resin are according to the supplier’s information.
(a) (b)
25
30
35
40
45
0 300 600 900 1200 1500
Tem
pera
ture
(°C
)
Time (minutes)
Fig. 2 a Specimens in drying oven and b temperature cycles.
(a) (b)
0 100 200 300 400 500 6000
20
40
60
80
100
Time (days)
Tem
pera
ture
(o C
) / %
Rel
ativ
e H
umid
ity
Temperature (o C)% Relative Humidity
Data-logger malfunctioned
Fig. 3 a Humidity chamber and b wet–dry cycles with corresponding temperature.
International Journal of Concrete Structures and Materials
temperature to about 30–32 �C during wetting (the peak ofthe temperature plot in Fig. 3b). The temperature was almostconstant in the range of 20–23 �C during drying period. Therelative humidity during drying depended on the lab envi-ronment and showed scatters between 30 and 70 %.Humidity specimens were subjected to wet–dry cycles for1 month (GH1 series), 6 months (GH2 series), 12 months(GH3 series) and 18 months (GH4 series).A more detailed explanation of how the protocols of
temperature cycles and wet–dry cycles were selected can befound in the study by Kabir et al. (2016b).A number of specimens were directly exposed to outdoor
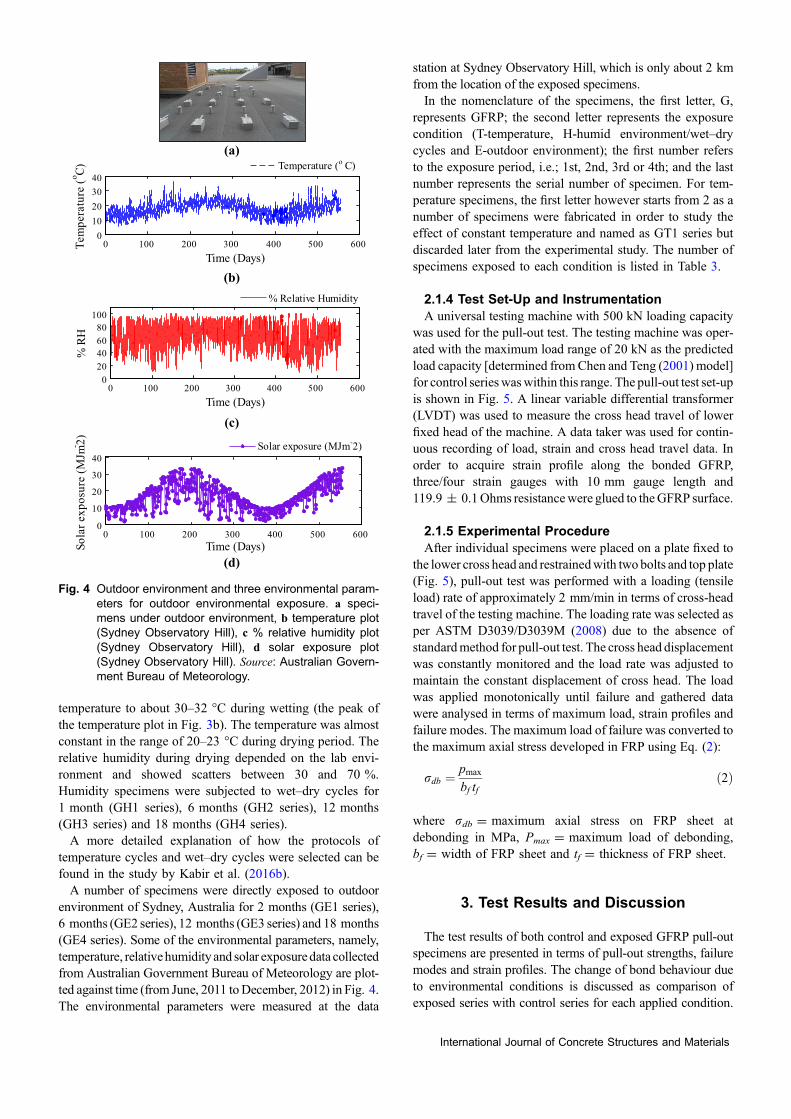
environment of Sydney, Australia for 2 months (GE1 series),6 months (GE2 series), 12 months (GE3 series) and 18 months(GE4 series). Some of the environmental parameters, namely,temperature, relativehumidity and solar exposuredata collectedfrom Australian Government Bureau of Meteorology are plot-ted against time (from June, 2011 toDecember, 2012) in Fig. 4.The environmental parameters were measured at the data
station at Sydney Observatory Hill, which is only about 2 kmfrom the location of the exposed specimens.In the nomenclature of the specimens, the first letter, G,
represents GFRP; the second letter represents the exposurecondition (T-temperature, H-humid environment/wet–drycycles and E-outdoor environment); the first number refersto the exposure period, i.e.; 1st, 2nd, 3rd or 4th; and the lastnumber represents the serial number of specimen. For tem-perature specimens, the first letter however starts from 2 as anumber of specimens were fabricated in order to study theeffect of constant temperature and named as GT1 series butdiscarded later from the experimental study. The number ofspecimens exposed to each condition is listed in Table 3.
2.1.4 Test Set-Up and InstrumentationA universal testing machine with 500 kN loading capacity
was used for the pull-out test. The testing machine was oper-ated with the maximum load range of 20 kN as the predictedload capacity [determined from Chen and Teng (2001) model]for control serieswaswithin this range. The pull-out test set-upis shown in Fig. 5. A linear variable differential transformer(LVDT) was used to measure the cross head travel of lowerfixed head of the machine. A data taker was used for contin-uous recording of load, strain and cross head travel data. Inorder to acquire strain profile along the bonded GFRP,three/four strain gauges with 10 mm gauge length and119.9 ± 0.1Ohms resistancewere glued to theGFRP surface.
2.1.5 Experimental ProcedureAfter individual specimens were placed on a plate fixed to
the lower cross head and restrainedwith twobolts and top plate(Fig. 5), pull-out test was performed with a loading (tensileload) rate of approximately 2 mm/min in terms of cross-headtravel of the testing machine. The loading rate was selected asper ASTM D3039/D3039M (2008) due to the absence ofstandardmethod for pull-out test. The cross head displacementwas constantly monitored and the load rate was adjusted tomaintain the constant displacement of cross head. The loadwas applied monotonically until failure and gathered datawere analysed in terms of maximum load, strain profiles andfailure modes. The maximum load of failure was converted tothe maximum axial stress developed in FRP using Eq. (2):
rdb ¼pmax
bf tfð2Þ
where rdb = maximum axial stress on FRP sheet atdebonding in MPa, Pmax = maximum load of debonding,bf = width of FRP sheet and tf = thickness of FRP sheet.
3. Test Results and Discussion
The test results of both control and exposed GFRP pull-outspecimens are presented in terms of pull-out strengths, failuremodes and strain profiles. The change of bond behaviour dueto environmental conditions is discussed as comparison ofexposed series with control series for each applied condition.
(a)
(b)
(c)
(d)
0 100 200 300 400 500 6000
10203040
Time (Days)
Tem
pera
ture
(o C)
0 100 200 300 400 500 6000
20406080
100
Time (Days)
% R
H
% Relative Humidity
0 100 200 300 400 500 6000
10
20
30
40
Time (Days)Sola
r exp
osur
e (M
Jm- 2) Solar exposure (MJm-2)
Temperature (o C)
Fig. 4 Outdoor environment and three environmental param-eters for outdoor environmental exposure. a speci-mens under outdoor environment, b temperature plot(Sydney Observatory Hill), c % relative humidity plot(Sydney Observatory Hill), d solar exposure plot(Sydney Observatory Hill). Source: Australian Govern-ment Bureau of Meteorology.
International Journal of Concrete Structures and Materials

3.1 Pull-out Strengths3.1.1 Control SeriesA total of five control-GFRP bonded prisms were tested
under direct shear tests and the maximum axial stress
developed in GFRP before debonding was considered aspull-out strength of each specimen. The average maximumstress developed in GFRP before debonding was 1027 MPawith a coefficient of variation (CoV) of 6 %.
Table 3 Number of pull-out specimens.
Exposure condition Number of specimens Name of specimens Exposure period
Control 5 GControl-1 to 5 –
Temperature cyclea 3 GT2-1 to 3 5 weeks
Wet–dry cycleb 5 GH1-1 to 5 1 month
Outdoor environment 5 GE1-1 to 5 2 months
Temperature cyclea 3 GT3-1 to 3 3 months
Wet–dry cycleb 5 GH2-1 to 5 6 months
Outdoor environment 5 GE2-1 to 5 6 months
Temperature cyclea 3 GT4-1 to 3 12 months
Wet–dry cycleb 5 GH3-1 to 5 12 months
Outdoor environment 5 GE3-1 to 5 12 months
Wet–dry cycleb 5 GH4-1 to 5 18 months
Outdoor environment 5 GE4-1 to 5 18 months
Total number of specimens 54
a 5 h at constant 40 �C followed by 7 h at gradual decrease to 30 �C.b 1 week at around 95 % RH followed by 1 week at normal lab condition.
(a) (b)
P
16 mm diameter bolt
Concrete prism
Top plate
Large bolt
Bottom plate
Pull-out forceFRP cantilever part
Bonded FRP
Lower cross-head
Top plate
Bolt
Bottom plateLVDT
Fig. 5 Pull-out test set-up: a schematic diagram and b photograph.
Table 4 GFRP pull-out strengths of cyclic temperature specimens.
Exposure duration (days) Mean pull-out strength (MPa) CoV of pull-out strength (%)
0 1027 6.0
35 1056 5.5
90 1065 1.9
365 1113 1.7
International Journal of Concrete Structures and Materials
3.1.2 Exposed SeriesAverage pull-out strengths of temperature cycles, wet–dry
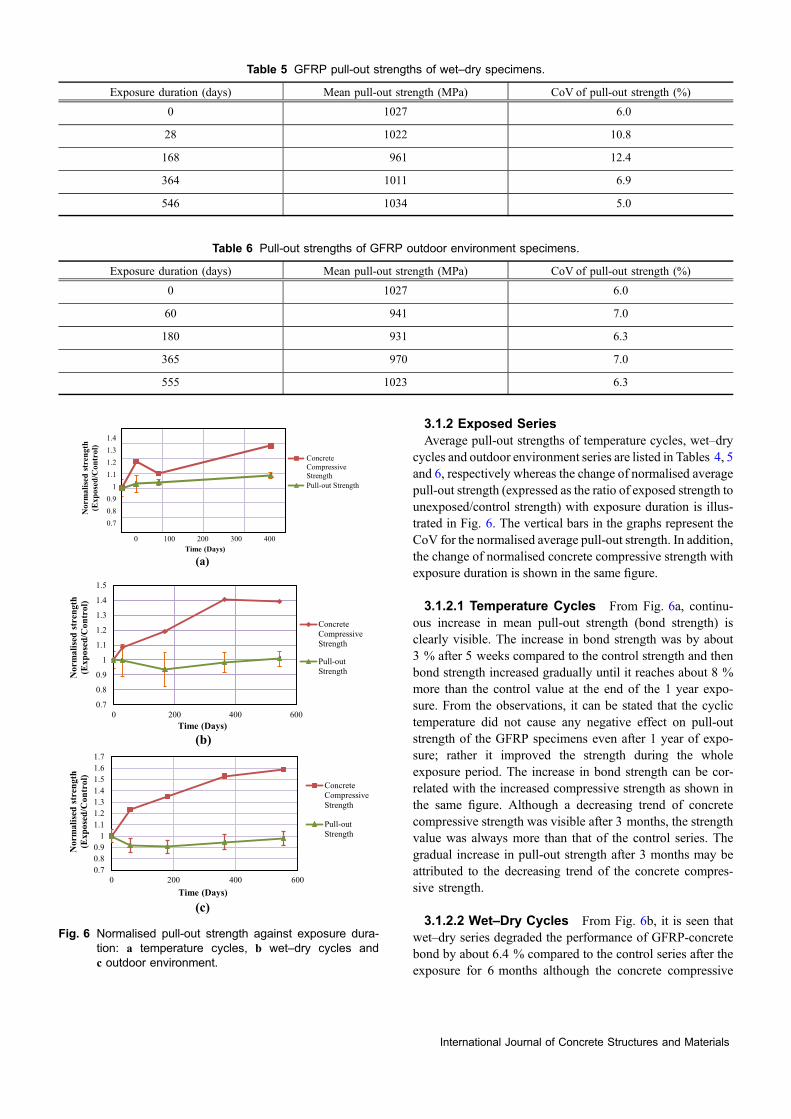
cycles and outdoor environment series are listed in Tables 4, 5and 6, respectively whereas the change of normalised averagepull-out strength (expressed as the ratio of exposed strength tounexposed/control strength) with exposure duration is illus-trated in Fig. 6. The vertical bars in the graphs represent theCoV for the normalised average pull-out strength. In addition,the change of normalised concrete compressive strength withexposure duration is shown in the same figure.
3.1.2.1 Temperature Cycles From Fig. 6a, continu-ous increase in mean pull-out strength (bond strength) isclearly visible. The increase in bond strength was by about3 % after 5 weeks compared to the control strength and thenbond strength increased gradually until it reaches about 8 %more than the control value at the end of the 1 year expo-sure. From the observations, it can be stated that the cyclictemperature did not cause any negative effect on pull-outstrength of the GFRP specimens even after 1 year of expo-sure; rather it improved the strength during the wholeexposure period. The increase in bond strength can be cor-related with the increased compressive strength as shown inthe same figure. Although a decreasing trend of concretecompressive strength was visible after 3 months, the strengthvalue was always more than that of the control series. Thegradual increase in pull-out strength after 3 months may beattributed to the decreasing trend of the concrete compres-sive strength.
3.1.2.2 Wet–Dry Cycles From Fig. 6b, it is seen thatwet–dry series degraded the performance of GFRP-concretebond by about 6.4 % compared to the control series after theexposure for 6 months although the concrete compressive
Table 5 GFRP pull-out strengths of wet–dry specimens.
Exposure duration (days) Mean pull-out strength (MPa) CoV of pull-out strength (%)
0 1027 6.0
28 1022 10.8
168 961 12.4
364 1011 6.9
546 1034 5.0
Table 6 Pull-out strengths of GFRP outdoor environment specimens.
Exposure duration (days) Mean pull-out strength (MPa) CoV of pull-out strength (%)
0 1027 6.0
60 941 7.0
180 931 6.3
365 970 7.0
555 1023 6.3
(a)
(b)
0.70.80.9
11.11.21.31.4
0 100 200 300 400
Nor
mal
ised
str
engt
h (E
xpos
ed/C
ontr
ol)
Time (Days)
ConcreteCompressiveStrengthPull-out Strength
0.7
0.8
0.9
1
1.1
1.2
1.3
1.4
1.5
0 200 400 600
Nor
mal
ised
str
engt
h (E
xpos
ed/C
ontr
ol)
Time (Days)
ConcreteCompressiveStrength
Pull-outStrength
(c)
0.70.80.9
11.11.21.31.41.51.61.7
0 200 400 600
Nor
mal
ised
str
engt
h (E
xpos
ed/C
ontr
ol)
Time (Days)
ConcreteCompressiveStrength
Pull-outStrength
Fig. 6 Normalised pull-out strength against exposure dura-tion: a temperature cycles, b wet–dry cycles andc outdoor environment.
International Journal of Concrete Structures and Materials
strength increased. Then, an increasing trend of pull-outstrength was observed with the strength value reaching thecontrol strength after 18 months. Therefore, the maximumdeterioration of GFRP-concrete pull-out strength observed inthis study was only 6.4 %. On the other hand, the concretecompressive strength was found to increase continuously upto 1 year and then became almost constant.
3.1.2.3 Outdoor Environment Outdoor environmentseries showed an initial reduction of the pull-out strength (to90.7 % after 6 months) followed by a recovery in the pull-outstrength reaching to98.2 %of the control value after 18 months(Fig. 6c). On the other hand, concrete compressive strengthincreased continuously with time during the whole exposureduration of 18 months. The reason for the degradation of pull-out strength despite the increase in concrete compressivestrength is discussed later through observed failure modes.
3.2 Failure ModesThe modes of failure of control series and exposed series,
namely, temperature cycles, wet–dry cycles and outdoorenvironment series are presented in this section.
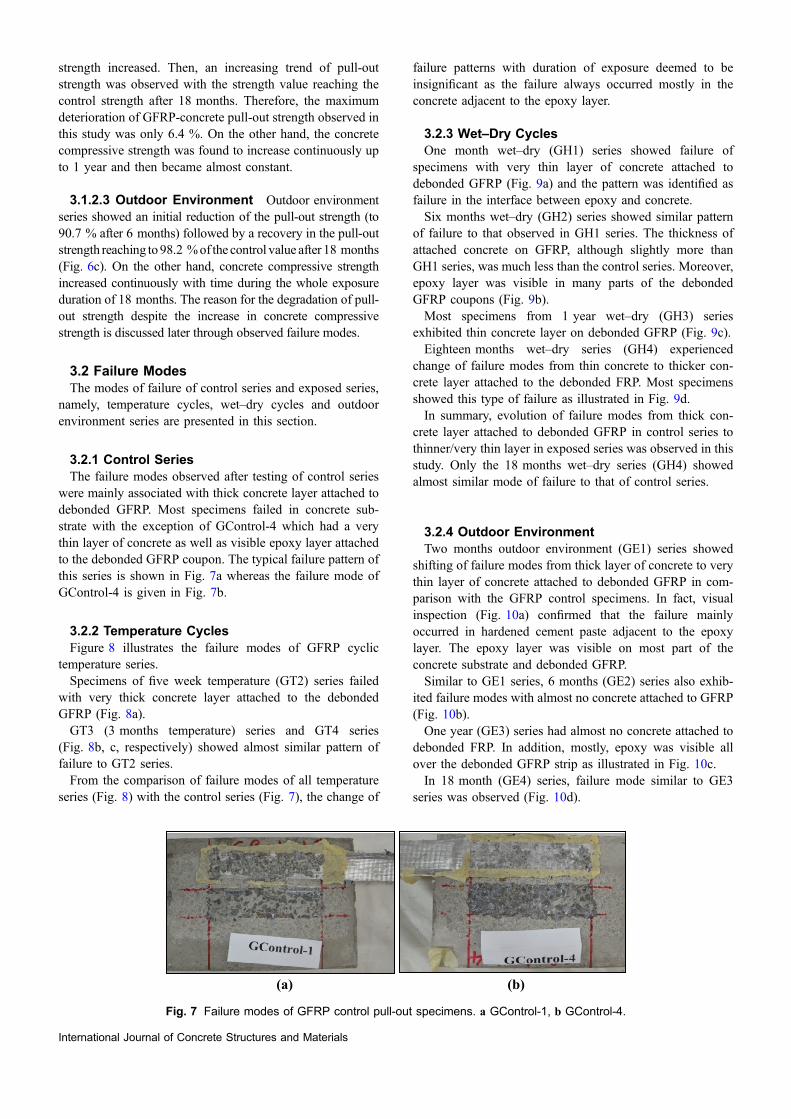
3.2.1 Control SeriesThe failure modes observed after testing of control series
were mainly associated with thick concrete layer attached todebonded GFRP. Most specimens failed in concrete sub-strate with the exception of GControl-4 which had a verythin layer of concrete as well as visible epoxy layer attachedto the debonded GFRP coupon. The typical failure pattern ofthis series is shown in Fig. 7a whereas the failure mode ofGControl-4 is given in Fig. 7b.
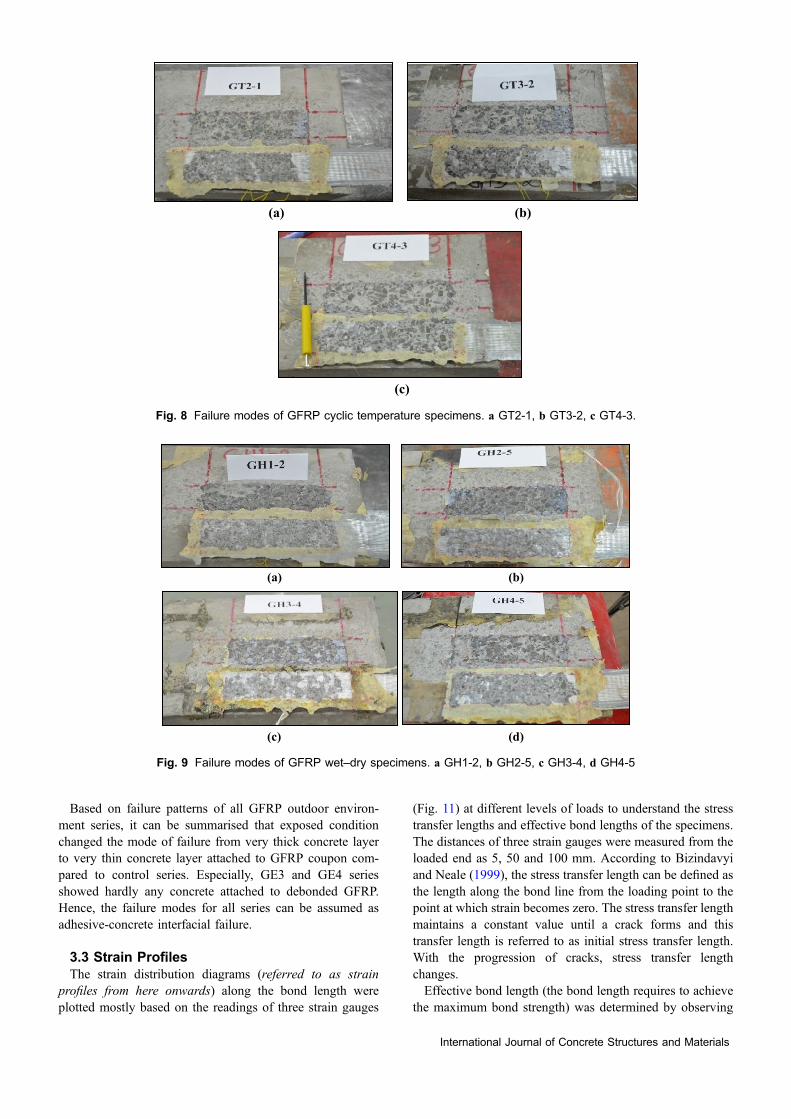
3.2.2 Temperature CyclesFigure 8 illustrates the failure modes of GFRP cyclic
temperature series.Specimens of five week temperature (GT2) series failed
with very thick concrete layer attached to the debondedGFRP (Fig. 8a).GT3 (3 months temperature) series and GT4 series
(Fig. 8b, c, respectively) showed almost similar pattern offailure to GT2 series.From the comparison of failure modes of all temperature
series (Fig. 8) with the control series (Fig. 7), the change of
failure patterns with duration of exposure deemed to beinsignificant as the failure always occurred mostly in theconcrete adjacent to the epoxy layer.
3.2.3 Wet–Dry CyclesOne month wet–dry (GH1) series showed failure of
specimens with very thin layer of concrete attached todebonded GFRP (Fig. 9a) and the pattern was identified asfailure in the interface between epoxy and concrete.Six months wet–dry (GH2) series showed similar pattern
of failure to that observed in GH1 series. The thickness ofattached concrete on GFRP, although slightly more thanGH1 series, was much less than the control series. Moreover,epoxy layer was visible in many parts of the debondedGFRP coupons (Fig. 9b).Most specimens from 1 year wet–dry (GH3) series
exhibited thin concrete layer on debonded GFRP (Fig. 9c).Eighteen months wet–dry series (GH4) experienced
change of failure modes from thin concrete to thicker con-crete layer attached to the debonded FRP. Most specimensshowed this type of failure as illustrated in Fig. 9d.In summary, evolution of failure modes from thick con-
crete layer attached to debonded GFRP in control series tothinner/very thin layer in exposed series was observed in thisstudy. Only the 18 months wet–dry series (GH4) showedalmost similar mode of failure to that of control series.
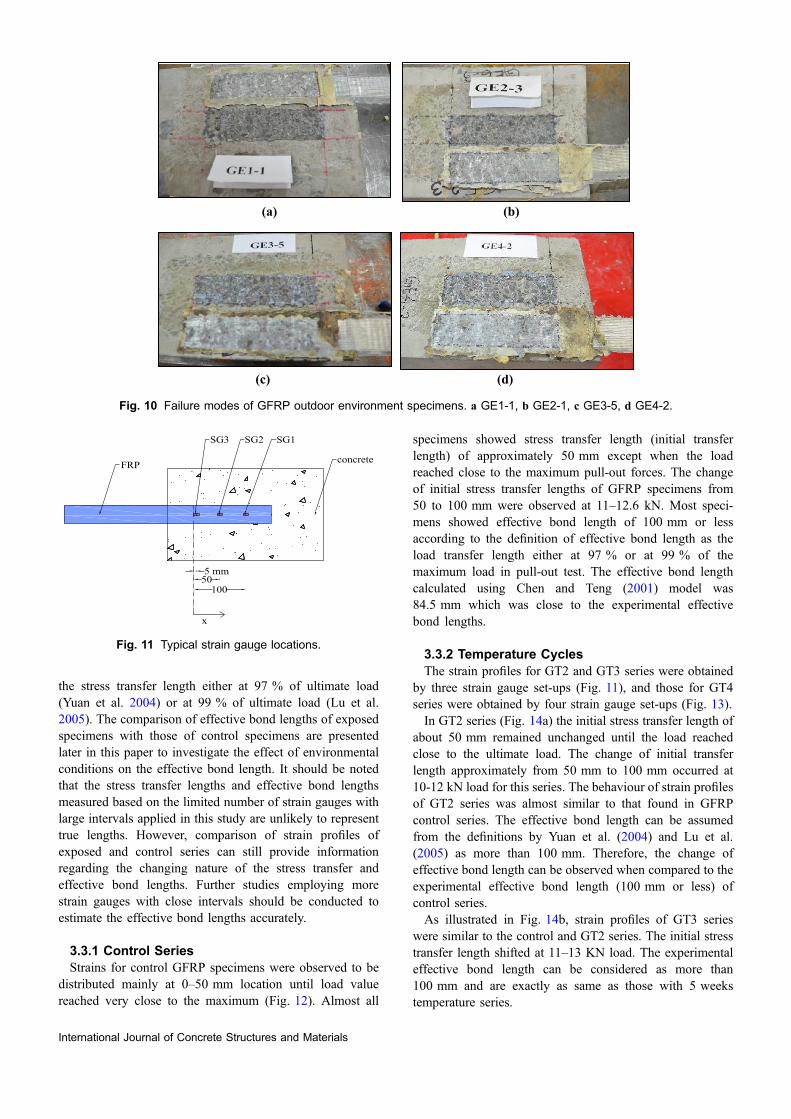
3.2.4 Outdoor EnvironmentTwo months outdoor environment (GE1) series showed
shifting of failure modes from thick layer of concrete to verythin layer of concrete attached to debonded GFRP in com-parison with the GFRP control specimens. In fact, visualinspection (Fig. 10a) confirmed that the failure mainlyoccurred in hardened cement paste adjacent to the epoxylayer. The epoxy layer was visible on most part of theconcrete substrate and debonded GFRP.Similar to GE1 series, 6 months (GE2) series also exhib-
ited failure modes with almost no concrete attached to GFRP(Fig. 10b).One year (GE3) series had almost no concrete attached to
debonded FRP. In addition, mostly, epoxy was visible allover the debonded GFRP strip as illustrated in Fig. 10c.In 18 month (GE4) series, failure mode similar to GE3
series was observed (Fig. 10d).
(a) (b)
Fig. 7 Failure modes of GFRP control pull-out specimens. a GControl-1, b GControl-4.
International Journal of Concrete Structures and Materials
Based on failure patterns of all GFRP outdoor environ-ment series, it can be summarised that exposed conditionchanged the mode of failure from very thick concrete layerto very thin concrete layer attached to GFRP coupon com-pared to control series. Especially, GE3 and GE4 seriesshowed hardly any concrete attached to debonded GFRP.Hence, the failure modes for all series can be assumed asadhesive-concrete interfacial failure.
3.3 Strain ProfilesThe strain distribution diagrams (referred to as strain
profiles from here onwards) along the bond length wereplotted mostly based on the readings of three strain gauges
(Fig. 11) at different levels of loads to understand the stresstransfer lengths and effective bond lengths of the specimens.The distances of three strain gauges were measured from theloaded end as 5, 50 and 100 mm. According to Bizindavyiand Neale (1999), the stress transfer length can be defined asthe length along the bond line from the loading point to thepoint at which strain becomes zero. The stress transfer lengthmaintains a constant value until a crack forms and thistransfer length is referred to as initial stress transfer length.With the progression of cracks, stress transfer lengthchanges.Effective bond length (the bond length requires to achieve
the maximum bond strength) was determined by observing
(a) (b)
(c)
Fig. 8 Failure modes of GFRP cyclic temperature specimens. a GT2-1, b GT3-2, c GT4-3.
(a) (b)
(c) (d)
Fig. 9 Failure modes of GFRP wet–dry specimens. a GH1-2, b GH2-5, c GH3-4, d GH4-5
International Journal of Concrete Structures and Materials
the stress transfer length either at 97 % of ultimate load(Yuan et al. 2004) or at 99 % of ultimate load (Lu et al.2005). The comparison of effective bond lengths of exposedspecimens with those of control specimens are presentedlater in this paper to investigate the effect of environmentalconditions on the effective bond length. It should be notedthat the stress transfer lengths and effective bond lengthsmeasured based on the limited number of strain gauges withlarge intervals applied in this study are unlikely to representtrue lengths. However, comparison of strain profiles ofexposed and control series can still provide informationregarding the changing nature of the stress transfer andeffective bond lengths. Further studies employing morestrain gauges with close intervals should be conducted toestimate the effective bond lengths accurately.
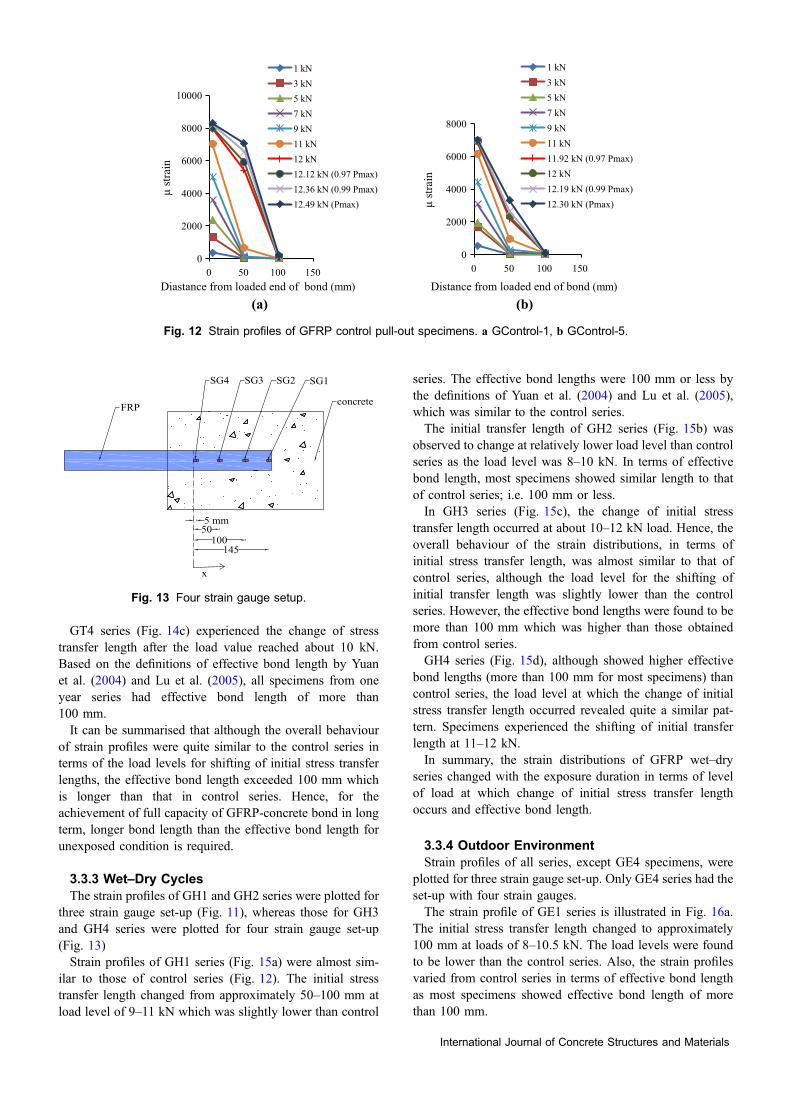
3.3.1 Control SeriesStrains for control GFRP specimens were observed to be
distributed mainly at 0–50 mm location until load valuereached very close to the maximum (Fig. 12). Almost all
specimens showed stress transfer length (initial transferlength) of approximately 50 mm except when the loadreached close to the maximum pull-out forces. The changeof initial stress transfer lengths of GFRP specimens from50 to 100 mm were observed at 11–12.6 kN. Most speci-mens showed effective bond length of 100 mm or lessaccording to the definition of effective bond length as theload transfer length either at 97 % or at 99 % of themaximum load in pull-out test. The effective bond lengthcalculated using Chen and Teng (2001) model was84.5 mm which was close to the experimental effectivebond lengths.
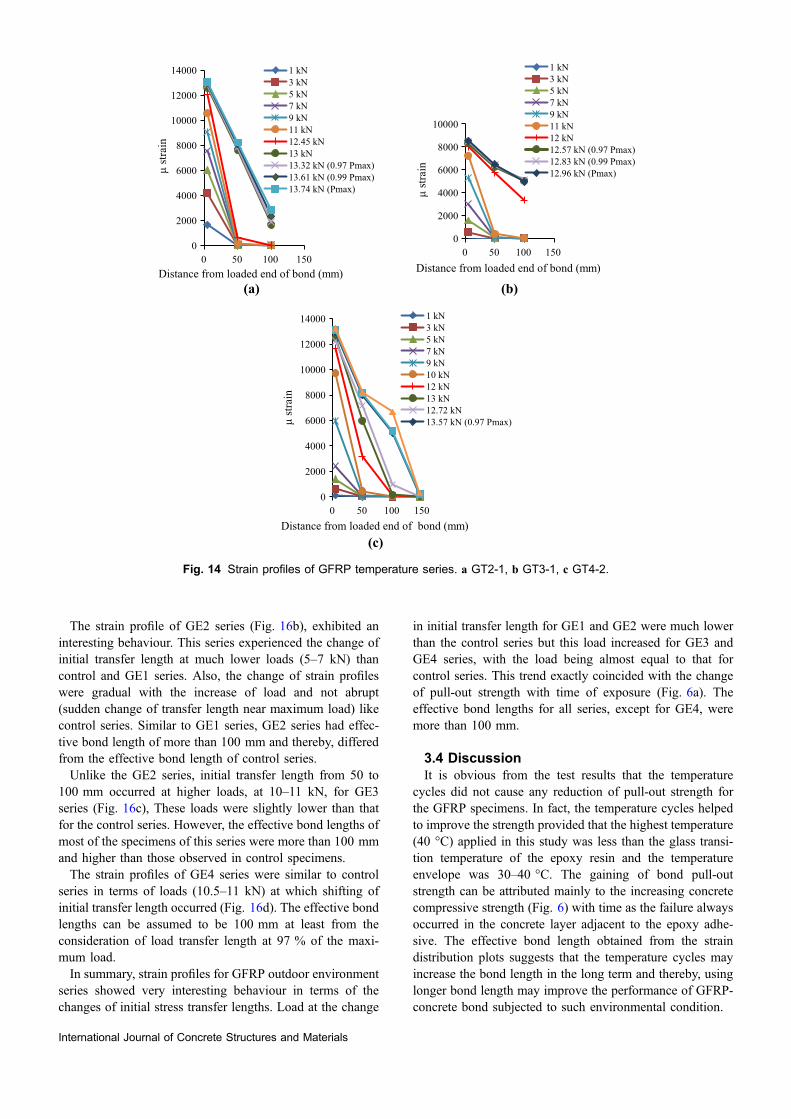
3.3.2 Temperature CyclesThe strain profiles for GT2 and GT3 series were obtained
by three strain gauge set-ups (Fig. 11), and those for GT4series were obtained by four strain gauge set-ups (Fig. 13).In GT2 series (Fig. 14a) the initial stress transfer length of
about 50 mm remained unchanged until the load reachedclose to the ultimate load. The change of initial transferlength approximately from 50 mm to 100 mm occurred at10-12 kN load for this series. The behaviour of strain profilesof GT2 series was almost similar to that found in GFRPcontrol series. The effective bond length can be assumedfrom the definitions by Yuan et al. (2004) and Lu et al.(2005) as more than 100 mm. Therefore, the change ofeffective bond length can be observed when compared to theexperimental effective bond length (100 mm or less) ofcontrol series.As illustrated in Fig. 14b, strain profiles of GT3 series
were similar to the control and GT2 series. The initial stresstransfer length shifted at 11–13 KN load. The experimentaleffective bond length can be considered as more than100 mm and are exactly as same as those with 5 weekstemperature series.
(a) (b)
(c) (d)
Fig. 10 Failure modes of GFRP outdoor environment specimens. a GE1-1, b GE2-1, c GE3-5, d GE4-2.
5 mm50
100
SG3 SG2 SG1
x
concreteFRP
Fig. 11 Typical strain gauge locations.
International Journal of Concrete Structures and Materials
GT4 series (Fig. 14c) experienced the change of stresstransfer length after the load value reached about 10 kN.Based on the definitions of effective bond length by Yuanet al. (2004) and Lu et al. (2005), all specimens from oneyear series had effective bond length of more than100 mm.It can be summarised that although the overall behaviour
of strain profiles were quite similar to the control series interms of the load levels for shifting of initial stress transferlengths, the effective bond length exceeded 100 mm whichis longer than that in control series. Hence, for theachievement of full capacity of GFRP-concrete bond in longterm, longer bond length than the effective bond length forunexposed condition is required.
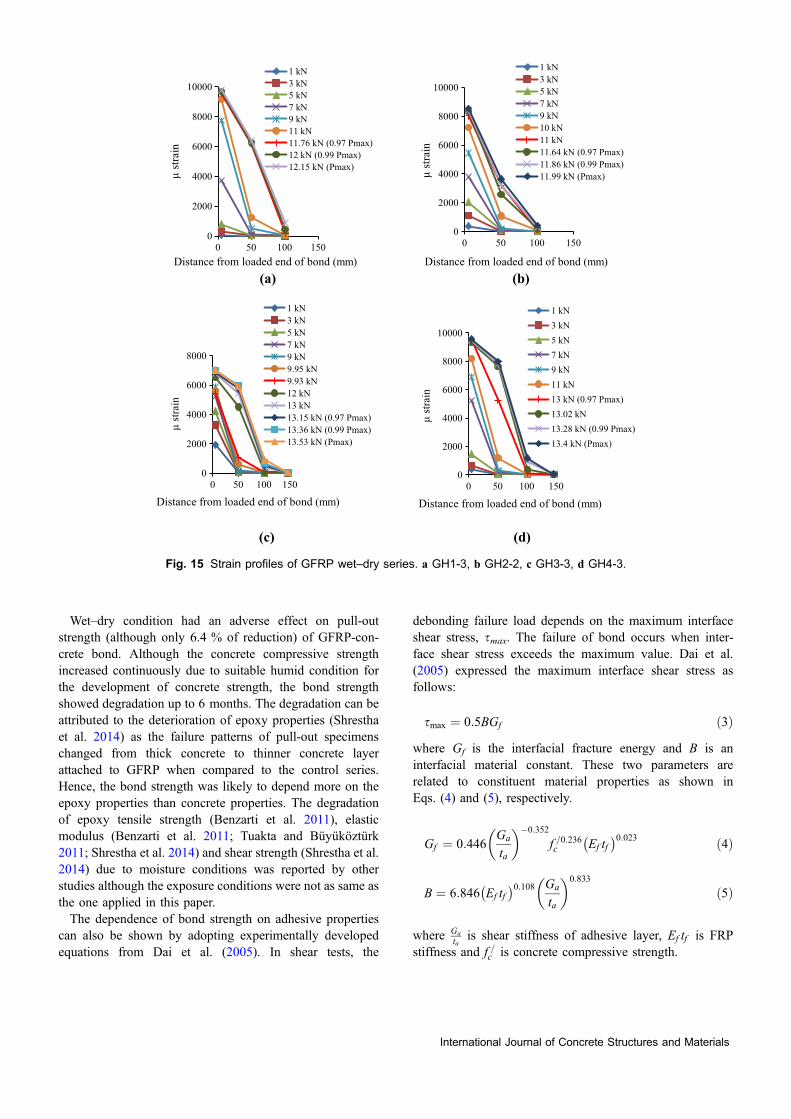
3.3.3 Wet–Dry CyclesThe strain profiles of GH1 and GH2 series were plotted for
three strain gauge set-up (Fig. 11), whereas those for GH3and GH4 series were plotted for four strain gauge set-up(Fig. 13)Strain profiles of GH1 series (Fig. 15a) were almost sim-
ilar to those of control series (Fig. 12). The initial stresstransfer length changed from approximately 50–100 mm atload level of 9–11 kN which was slightly lower than control
series. The effective bond lengths were 100 mm or less bythe definitions of Yuan et al. (2004) and Lu et al. (2005),which was similar to the control series.The initial transfer length of GH2 series (Fig. 15b) was
observed to change at relatively lower load level than controlseries as the load level was 8–10 kN. In terms of effectivebond length, most specimens showed similar length to thatof control series; i.e. 100 mm or less.In GH3 series (Fig. 15c), the change of initial stress
transfer length occurred at about 10–12 kN load. Hence, theoverall behaviour of the strain distributions, in terms ofinitial stress transfer length, was almost similar to that ofcontrol series, although the load level for the shifting ofinitial transfer length was slightly lower than the controlseries. However, the effective bond lengths were found to bemore than 100 mm which was higher than those obtainedfrom control series.GH4 series (Fig. 15d), although showed higher effective
bond lengths (more than 100 mm for most specimens) thancontrol series, the load level at which the change of initialstress transfer length occurred revealed quite a similar pat-tern. Specimens experienced the shifting of initial transferlength at 11–12 kN.In summary, the strain distributions of GFRP wet–dry
series changed with the exposure duration in terms of levelof load at which change of initial stress transfer lengthoccurs and effective bond length.
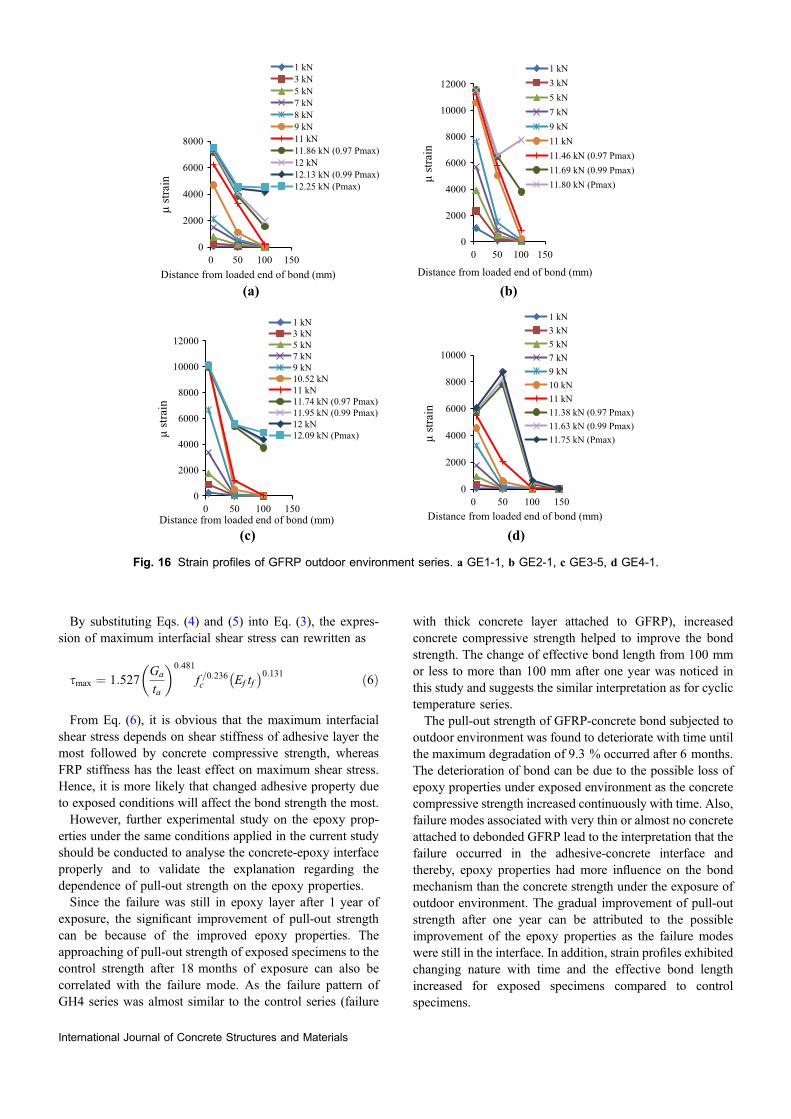
3.3.4 Outdoor EnvironmentStrain profiles of all series, except GE4 specimens, were
plotted for three strain gauge set-up. Only GE4 series had theset-up with four strain gauges.The strain profile of GE1 series is illustrated in Fig. 16a.
The initial stress transfer length changed to approximately100 mm at loads of 8–10.5 kN. The load levels were foundto be lower than the control series. Also, the strain profilesvaried from control series in terms of effective bond lengthas most specimens showed effective bond length of morethan 100 mm.
(a) (b)
0
2000
4000
6000
8000
10000
0 50 100 150
μst
rain
Diastance from loaded end of bond (mm)
1 kN3 kN5 kN7 kN9 kN11 kN12 kN12.12 kN (0.97 Pmax)12.36 kN (0.99 Pmax)12.49 kN (Pmax)
0
2000
4000
6000
8000
0 50 100 150
μst
rain
Distance from loaded end of bond (mm)
1 kN3 kN5 kN7 kN9 kN11 kN11.92 kN (0.97 Pmax)12 kN12.19 kN (0.99 Pmax)12.30 kN (Pmax)
Fig. 12 Strain profiles of GFRP control pull-out specimens. a GControl-1, b GControl-5.
5 mm50
100145
SG4 SG3 SG2 SG1
x
concreteFRP
Fig. 13 Four strain gauge setup.
International Journal of Concrete Structures and Materials
The strain profile of GE2 series (Fig. 16b), exhibited aninteresting behaviour. This series experienced the change ofinitial transfer length at much lower loads (5–7 kN) thancontrol and GE1 series. Also, the change of strain profileswere gradual with the increase of load and not abrupt(sudden change of transfer length near maximum load) likecontrol series. Similar to GE1 series, GE2 series had effec-tive bond length of more than 100 mm and thereby, differedfrom the effective bond length of control series.Unlike the GE2 series, initial transfer length from 50 to
100 mm occurred at higher loads, at 10–11 kN, for GE3series (Fig. 16c), These loads were slightly lower than thatfor the control series. However, the effective bond lengths ofmost of the specimens of this series were more than 100 mmand higher than those observed in control specimens.The strain profiles of GE4 series were similar to control
series in terms of loads (10.5–11 kN) at which shifting ofinitial transfer length occurred (Fig. 16d). The effective bondlengths can be assumed to be 100 mm at least from theconsideration of load transfer length at 97 % of the maxi-mum load.In summary, strain profiles for GFRP outdoor environment
series showed very interesting behaviour in terms of thechanges of initial stress transfer lengths. Load at the change
in initial transfer length for GE1 and GE2 were much lowerthan the control series but this load increased for GE3 andGE4 series, with the load being almost equal to that forcontrol series. This trend exactly coincided with the changeof pull-out strength with time of exposure (Fig. 6a). Theeffective bond lengths for all series, except for GE4, weremore than 100 mm.
3.4 DiscussionIt is obvious from the test results that the temperature
cycles did not cause any reduction of pull-out strength forthe GFRP specimens. In fact, the temperature cycles helpedto improve the strength provided that the highest temperature(40 �C) applied in this study was less than the glass transi-tion temperature of the epoxy resin and the temperatureenvelope was 30–40 �C. The gaining of bond pull-outstrength can be attributed mainly to the increasing concretecompressive strength (Fig. 6) with time as the failure alwaysoccurred in the concrete layer adjacent to the epoxy adhe-sive. The effective bond length obtained from the straindistribution plots suggests that the temperature cycles mayincrease the bond length in the long term and thereby, usinglonger bond length may improve the performance of GFRP-concrete bond subjected to such environmental condition.
(a) (b)
(c)
0
2000
4000
6000
8000
10000
12000
14000
0 50 100 150
μst
rain
Distance from loaded end of bond (mm)
1 kN3 kN5 kN7 kN9 kN11 kN12.45 kN13 kN13.32 kN (0.97 Pmax)13.61 kN (0.99 Pmax)13.74 kN (Pmax)
0
2000
4000
6000
8000
10000
0 50 100 150
μst
rain
Distance from loaded end of bond (mm)
1 kN3 kN5 kN7 kN9 kN11 kN12 kN12.57 kN (0.97 Pmax)12.83 kN (0.99 Pmax)12.96 kN (Pmax)
0
2000
4000
6000
8000
10000
12000
14000
0 50 100 150
μst
rain
Distance from loaded end of bond (mm)
1 kN3 kN5 kN7 kN9 kN10 kN12 kN13 kN12.72 kN13.57 kN (0.97 Pmax)
Fig. 14 Strain profiles of GFRP temperature series. a GT2-1, b GT3-1, c GT4-2.
International Journal of Concrete Structures and Materials
Wet–dry condition had an adverse effect on pull-outstrength (although only 6.4 % of reduction) of GFRP-con-crete bond. Although the concrete compressive strengthincreased continuously due to suitable humid condition forthe development of concrete strength, the bond strengthshowed degradation up to 6 months. The degradation can beattributed to the deterioration of epoxy properties (Shresthaet al. 2014) as the failure patterns of pull-out specimenschanged from thick concrete to thinner concrete layerattached to GFRP when compared to the control series.Hence, the bond strength was likely to depend more on theepoxy properties than concrete properties. The degradationof epoxy tensile strength (Benzarti et al. 2011), elasticmodulus (Benzarti et al. 2011; Tuakta and Buyukozturk2011; Shrestha et al. 2014) and shear strength (Shrestha et al.2014) due to moisture conditions was reported by otherstudies although the exposure conditions were not as same asthe one applied in this paper.The dependence of bond strength on adhesive properties
can also be shown by adopting experimentally developedequations from Dai et al. (2005). In shear tests, the
debonding failure load depends on the maximum interfaceshear stress, smax. The failure of bond occurs when inter-face shear stress exceeds the maximum value. Dai et al.(2005) expressed the maximum interface shear stress asfollows:
smax ¼ 0:5BGf ð3Þ
where Gf is the interfacial fracture energy and B is aninterfacial material constant. These two parameters arerelated to constituent material properties as shown inEqs. (4) and (5), respectively.
Gf ¼ 0:446Ga
ta
� ��0:352
f =0:236c Ef tf� �0:023 ð4Þ
B ¼ 6:846 Ef tf� �0:108 Ga
ta
� �0:833
ð5Þ
where Ga
tais shear stiffness of adhesive layer, Ef tf is FRP
stiffness and f =c is concrete compressive strength.
(a) (b)
(c) (d)
0
2000
4000
6000
8000
10000
0 50 100 150
μst
rain
Distance from loaded end of bond (mm)
1 kN3 kN5 kN7 kN9 kN11 kN11.76 kN (0.97 Pmax)12 kN (0.99 Pmax)12.15 kN (Pmax)
0
2000
4000
6000
8000
10000
0 50 100 150
μst
rain
Distance from loaded end of bond (mm)
1 kN3 kN5 kN7 kN9 kN10 kN11 kN11.64 kN (0.97 Pmax)11.86 kN (0.99 Pmax)11.99 kN (Pmax)
0
2000
4000
6000
8000
0 50 100 150
μst
rain
Distance from loaded end of bond (mm)
1 kN3 kN5 kN7 kN9 kN9.95 kN9.93 kN12 kN13 kN13.15 kN (0.97 Pmax)13.36 kN (0.99 Pmax)13.53 kN (Pmax)
0
2000
4000
6000
8000
10000
0 50 100 150
μst
rain
Distance from loaded end of bond (mm)
1 kN3 kN5 kN7 kN9 kN11 kN13 kN (0.97 Pmax)13.02 kN13.28 kN (0.99 Pmax)13.4 kN (Pmax)
Fig. 15 Strain profiles of GFRP wet–dry series. a GH1-3, b GH2-2, c GH3-3, d GH4-3.
International Journal of Concrete Structures and Materials
By substituting Eqs. (4) and (5) into Eq. (3), the expres-sion of maximum interfacial shear stress can rewritten as
smax ¼ 1:527Ga
ta
� �0:481
f =0:236c Ef tf� �0:131 ð6Þ
From Eq. (6), it is obvious that the maximum interfacialshear stress depends on shear stiffness of adhesive layer themost followed by concrete compressive strength, whereasFRP stiffness has the least effect on maximum shear stress.Hence, it is more likely that changed adhesive property dueto exposed conditions will affect the bond strength the most.However, further experimental study on the epoxy prop-
erties under the same conditions applied in the current studyshould be conducted to analyse the concrete-epoxy interfaceproperly and to validate the explanation regarding thedependence of pull-out strength on the epoxy properties.Since the failure was still in epoxy layer after 1 year of
exposure, the significant improvement of pull-out strengthcan be because of the improved epoxy properties. Theapproaching of pull-out strength of exposed specimens to thecontrol strength after 18 months of exposure can also becorrelated with the failure mode. As the failure pattern ofGH4 series was almost similar to the control series (failure
with thick concrete layer attached to GFRP), increasedconcrete compressive strength helped to improve the bondstrength. The change of effective bond length from 100 mmor less to more than 100 mm after one year was noticed inthis study and suggests the similar interpretation as for cyclictemperature series.The pull-out strength of GFRP-concrete bond subjected to
outdoor environment was found to deteriorate with time untilthe maximum degradation of 9.3 % occurred after 6 months.The deterioration of bond can be due to the possible loss ofepoxy properties under exposed environment as the concretecompressive strength increased continuously with time. Also,failure modes associated with very thin or almost no concreteattached to debonded GFRP lead to the interpretation that thefailure occurred in the adhesive-concrete interface andthereby, epoxy properties had more influence on the bondmechanism than the concrete strength under the exposure ofoutdoor environment. The gradual improvement of pull-outstrength after one year can be attributed to the possibleimprovement of the epoxy properties as the failure modeswere still in the interface. In addition, strain profiles exhibitedchanging nature with time and the effective bond lengthincreased for exposed specimens compared to controlspecimens.
(a) (b)
(c) (d)
0
2000
4000
6000
8000
0 50 100 150
μst
rain
Distance from loaded end of bond (mm)
1 kN3 kN5 kN7 kN8 kN9 kN11 kN11.86 kN (0.97 Pmax)12 kN12.13 kN (0.99 Pmax)12.25 kN (Pmax)
0
2000
4000
6000
8000
10000
12000
0 50 100 150
μst
rain
Distance from loaded end of bond (mm)
1 kN3 kN5 kN7 kN9 kN11 kN11.46 kN (0.97 Pmax)11.69 kN (0.99 Pmax)11.80 kN (Pmax)
0
2000
4000
6000
8000
10000
12000
0 50 100 150
μst
rain
Distance from loaded end of bond (mm)
1 kN3 kN5 kN7 kN9 kN10.52 kN11 kN11.74 kN (0.97 Pmax)11.95 kN (0.99 Pmax)12 kN12.09 kN (Pmax)
0
2000
4000
6000
8000
10000
0 50 100 150
μst
rain
Distance from loaded end of bond (mm)
1 kN3 kN5 kN7 kN9 kN10 kN11 kN11.38 kN (0.97 Pmax)11.63 kN (0.99 Pmax)11.75 kN (Pmax)
Fig. 16 Strain profiles of GFRP outdoor environment series. a GE1-1, b GE2-1, c GE3-5, d GE4-1.
International Journal of Concrete Structures and Materials
4. Conclusions
The research findings of this study are highlighted asfollows:
Temperature cyclesThe temperature cycles did not have any negative effecton the pull-out strength of GFRP-concrete bond. In fact,temperature cycles improved the pull-out strength by 8 %for GFRP-concrete bond. This improvement of pull-outstrength is attributed to the increased concrete compres-sive strength as the failure of bond occurred within theconcrete substrate with minimal reduction in concretethickness.Strain profiles did not show any changes with theexception of longer effective bond length observed insome exposed series.Wet–dry cyclesPerformance of GFRP-concrete bond under wet–drycycles was marginally poor (strength reduction by 6.4 %only). The degradation can be attributed to the epoxydegradation as the most series failed with almost noconcrete attached to the debonded GFRP.The trend of the loads at the change of initial stresstransfer length also changed with time and followedalmost a similar trend to the pull-out strength. Effectivebond lengths for most of exposed specimens were longerthan that of unexposed specimens for most exposuredurations.Outdoor environmentExposure to outdoor environment caused the most seriousdeterioration of pull-out strength (9.3 %). Deterioration ofbond strength due to outdoor environment can also beattributed to the degraded epoxy properties since unlikethe control specimens, very thin or almost no concretelayer was found to be attached to debonded FRP forexposed specimens.The change in strain profiles, in terms of the loads at theshifting of initial stress transfer length, and increase ineffective bond lengths were identified.
Based on the findings, it can be concluded that the outdoorenvironment caused the highest degradation of GFRP-con-crete pull-out strength, whereas degradation of pull-outstrength due to wet–dry cycles was slightly lower. The changeof failure modes for these two conditions suggests thedependence of pull-out strength more on epoxy properties.However, further research needs to be conducted on the effectof similar conditions on epoxy properties to validate this.Increased effective bond lengths for all three conditionsnecessitates the design of bond length longer than the effectivebond length of unexposed conditions for achieving the fullcapacity of bond strength in long term. Temperature cycles didnot have any negative effect on bond strength and failuremodes. However, further study with lowering the minimumtemperature will increase the difference between the maxi-mum and minimum temperature of the temperature envelopeand may lead to different findings.
Acknowledgments
The authors acknowledges the financial and technicalsupport provided by Centre for Built Infrastructure Research(CBIR) at University of Technology Sydney (UTS) forconducting the experimental studies.
Open Access
This article is distributed under the terms of the CreativeCommons Attribution 4.0 International License (http://creativecommons.org/licenses/by/4.0/), which permits unre-stricted use, distribution, and reproduction in any medium,provided you give appropriate credit to the originalauthor(s) and the source, provide a link to the CreativeCommons license, and indicate if changes were made.
References
Al-Tamimi, A. K., Hawileh, R. A., Abdalla, J. A., Rasheed, H.
A., & Al-Mahaidi, R. (2014). Durability of the bond
between CFRP plates and concrete exposed to harsh
environments. Journal of Materials in Civil Engineering,
27, 04014252.
AS 1012.17. (1997). Method of testing concrete—Determina-
tion of the static chord modulus of elasticity and Poisson’s
ratio of concrete specimens. Sydney, Australia: Standards
Australia.
AS 1012.9. (1999). Method of testing concrete—Determination
of the compressive strength of concrete specimens. Sydney,
Australia: Standards Australia.
ASTM D3039/D3039M. (2008). Standard test method for ten-
sile properties of polymer matrix composite materials.
Pennsylvania: American Society for Testing and Materials
(ASTM).
Benzarti, K., Chataigner, S., Quiertant, M., Marty, C., &
Aubagnac, C. (2011). Accelerated ageing behaviour of the
adhesive bond between concrete specimens and CFRP
overlays. Construction and Building Materials, 25,
523–538.
Bizindavyi, L., & Neale, K. (1999). Transfer lengths and bond
strengths for composites bonded to concrete. Journal of
Composites for Construction, 3, 153–160.
Chajes, M. J., Thomson, T. A., & Farschman, C. A. (1995).
Durability of concrete beams externally reinforced with
composite fabrics. Construction and Building Materials, 9,
141–148.
Chen, J., & Teng, J. (2001). Anchorage strength models for FRP
and steel plates bonded to concrete. Journal of Structural
Engineering, 127, 784–791.
Dai, J., Ueda, T., & Sato, Y. (2005). Development of the non-
linear bond stress–slip model of fiber reinforced plastics
International Journal of Concrete Structures and Materials

sheet–concrete interfaces with a simple method. Journal of
Composites for Construction, 9, 52–62.
Dai, J. G., Yokota, H., Iwanami, M., & Kato, E. (2010).
Experimental investigation of the influence of moisture on
the bond behavior of FRP to concrete interfaces. Journal of
Composites for Construction, 14, 834.
Dejke, V., & Tepfers, R. (2001). Durability and service life
prediction of GFRP for concrete reinforcement. In Pro-
ceedings of 5th international conference on fiber-reinforced
plastics for reinforced concrete structures (FRPRCS-5) (pp.
505–516).
Grace, N. F. (2004). Concrete repair with CFRP. Concrete
International, 26, 45–52.
Homam, S., Sheikh, S., & Mukherjee, P. (2001). Durability of
fibre reinforced polymers (FRP) wraps and external FRP–
concrete bond. In Proceedings of the 3rd international
conference on concrete under severe conditions, Vancou-
ver, BC, Canada, 18–20 June 2001, (pp. 1866–1873).
Imani, F. S., Chen, A., Davalos, J. F., & Ray, I. (2010). Tem-
perature and water-immersion effect on mode II fracture
behavior of CFRP-concrete interface. In CICE 2010—The
5th international conference on FRP composites in civil
engineering, Beijing, China (pp. 557–561).
Kabir, M. I. (2014). Short and long term performance of con-
crete structures repaired/strengthened with FRP. PhD thesis,
Civil Engineering, University of Technology, Sydney,
Australia.
Kabir, M. I., Samali, B., & Shrestha, R. (2016a). Fracture
properties of CFRP–concrete bond subjected to three
environmental conditions. Journal of Composites for
Construction. doi:10.1061/(ASCE)CC.1943-5614.0000665
.
Kabir, M. I., Shrestha, R., & Samali, B. (2016b). Effects of
applied environmental conditions on the pull-out strengths
of CFRP-concrete bond. Construction and Building Mate-
rials,. doi:10.1016/j.conbuildmat.2016.03.195.
Kang, T. H.-K., Howell, J., Kim, S., & Lee, D. J. (2012). A
state-of-the-art review on debonding failures of FRP lam-
inates externally adhered to concrete. International Journal
of Concrete Structures and Materials, 6, 123–134.
Li, G., Pang, S., Helms, J., Mukai, D., Ibekwe, S., & Alaywan,
W. (2002). Stiffness degradation of FRP strengthened RC
beams subjected to hygrothermal and aging attacks. Jour-
nal of Composite Materials, 36, 795.
Litherland, K. L., Oakley, D. R., & Proctor, B. A. (1981). The
use of accelerated ageing procedures to predict the long
term strength of GRC composites. Cement and Concrete
Research, 11, 455–466.
Lu, X. Z., Teng, J. G., Ye, L. P., & Jiang, J. J. (2005). Bond-slip
models for FRP sheets/plates bonded to concrete. Engi-
neering Structures, 27, 920–937.
Mazzotti, C., Savoia, M., & Ferracuti, B. (2008). An experi-
mental study on delamination of FRP plates bonded to
concrete. Construction and Building Materials, 22,
1409–1421.
Mazzotti, C., Savoia, M., & Ferracuti, B. (2009). A new single-
shear set-up for stable debonding of FRP–concrete joints.
Construction and Building Materials, 23, 1529–1537.
Myers, J., Murthy, S., & Micelli, F. (2001). Effect of combined
environmental cycles on the bond of FRP sheets to con-
crete. In Proceedings of the international conference on
composites in construction (CCC-2001) Porto, Portugal,
October 10–12, (pp. 55–59).
Nishizaki, I., & Kato, Y. (2011). Durability of the adhesive bond
between continuous fibre sheet reinforcements and concrete
in an outdoor environment. Construction and Building
Materials, 25, 515–522.
Ouezdou, M. B., Belarbi, A., & Bae, S.-W. (2009). Effective
bond length of FRP sheets externally bonded to concrete.
International Journal of Concrete Structures and Materi-
als, 3, 127–131.
Phani, K. K., & Bose, N. R. (1987). Temperature dependence of
hydrothermal ageing of CSM-laminate during water
immersion. Composites Science and Technology, 29,
79–87.
Robert, M., Wang, P., Cousin, P., & Benmokrane, B. (2010).
Temperature as an accelerating factor for long-term dura-
bility testing of FRPs: Should there be any limitations?
Journal of Composites for Construction, 14, 361.
Shrestha, J., Ueda, T., & Zhang, D. (2014). Durability of FRP
concrete bonds and its constituent properties under the
influence of moisture conditions. Journal of Materials in
Civil Engineering, 27, A4014009.
Teng, J. G., Chen, J. F., Smith, S. T., & Lam, L. (2002). FRP:
Strengthened RC structures. Hoboken, NJ: Wiley.
Toutanji, H. A., & Gomez, W. (1997). Durability characteristics
of concrete beams externally bonded with FRP composite
sheets. Cement & Concrete Composites, 19, 351–358.
Tuakta, C., & Buyukozturk, O. (2011). Deterioration of
FRP/concrete bond system under variable moisture condi-
tions quantified by fracture mechanics. Composites Part B
Engineering, 42, 145–154.
Yuan, H., Teng, J. G., Seracino, R., Wu, Z. S., & Yao, J. (2004).
Full-range behavior of FRP-to-concrete bonded joints.
Engineering Structures, 26, 553–565.
Yun, Y., & Wu, Y.-F. (2011). Durability of CFRP-concrete joints
under freeze–thaw cycling. Cold Regions Science and
Technology, 65, 401–412.
International Journal of Concrete Structures and Materials