published 18 may 2017 criminal justice statistics ... · where the youth court has determined that,...
TRANSCRIPT

1
Published 18th May 2017
Criminal Justice Statistics quarterly, England and
Wales, 2016 (final)
Main points
1.74 million individuals
dealt with by the CJS
The total number of individuals formally dealt with by the
criminal justice system is now at a record low level
(period 1970 to the year to 2016), at 1.74 million in the
latest year.
1.46 million defendants
were prosecuted
The number prosecuted at magistrates’ courts has
declined by 2% over the latest year. This was driven by a
fall in those prosecuted for indictable offences, while
numbers prosecuted for summary offences remained
broadly stable.
The conviction ratio was
85%
The overall conviction ratio increased slightly in the latest
year, by one percentage point. It has fluctuated between
82% and 84% between 2007 and 2015.
For indictable offences,
the custody rate was 30%
and ACSL was 19.4
months
The custody rate for indictable offences has been
increasing since 2010, from 24% to 30%. Average
custodial sentence length (ACSL) has increased for these
offences from 15.2 months to 19.4 months since 2007.
First time offenders were
more likely to be
convicted than they were
to be cautioned
Offenders dealt with for indictable offences with no
previous convictions and cautions are now more likely to
go to court and be convicted (53%) than they are to
receive a caution. 22% of first time offenders went to
court and were convicted 10 years ago.
This is the 2016 Criminal Justice Statistics calendar year annual bulletin; it is based on
finalised data which has been subject to additional quality assurance relative to the other,
provisional quarterlies and includes any cases for previous periods that have since become
available. In addition to enabling the examination of high level trends, this bulletin includes a
wider range of commentary on topics not covered in other quarterlies, and is accompanied
by various tools and experimental statistics enabling users to examine particular offences,
outcomes and offender profiles in greater detail (see list below for details). For technical
detail about sources, quality and terminology, please refer to the accompanying guide to
criminal justice statistics.
We are changing how our quarterly bulletins look, and would welcome any feedback to [email protected]
For other feedback related to the content of this publication, please let us know at [email protected]

2
Contents Main points ............................................................................................................... 1 Contents ................................................................................................................... 2 Introduction ................................................................................................................ 3 Contents of Criminal Justice Statistics (annual) publication ........................................ 4 Changes and revisions in this publication .................................................................. 5 1. Overview of the Criminal Justice System ............................................................ 6 2. Out of Court Disposals ...................................................................................... 9 3. Court Proceedings and Convictions ................................................................. 14 4. Remands ......................................................................................................... 19 5. Sentencing ...................................................................................................... 22 6. Motoring .......................................................................................................... 26 7. Offending Histories .......................................................................................... 28 Further information ................................................................................................... 30

3
Introduction
This report presents the key statistics on activity in the Criminal Justice System (CJS) for England and Wales. It provides information for the latest twelve months (January to December 2016, referred to as the ‘latest year’) with accompanying commentary, analysis and presentation of longer term trends.
The data provides users with information about proven offending and its outcomes in England and Wales. The contents of this bulletin will be of interest to government policy makers in the development of policy and their subsequent monitoring and evaluation. Others will be interested in the way different crimes are dealt with in the CJS. Where appropriate, comparisons are made with different sources covering activity in the CJS – in particular, numbers of crimes recorded by the police1, often the starting point for crimes dealt with by other CJS agencies.
In this publication, criminal offences are divided into four main offence groups:
Indictable proceedings cover the more serious offences such as violent and sexual offences and robbery. Initial proceedings are heard at magistrates’ courts but they then may be passed on to the Crown Court, either for sentencing, or for a full trial with a judge and jury. They are split into two categories:
Indictable only offences, which can only be tried on indictment in the Crown Court by a judge and jury2; and
Triable-either-way offences, which are triable either summarily in a magistrates’ court or on indictment in the Crown Court;
Summary proceedings cover typically less serious offences which are almost always handled entirely in magistrates’ courts when dealt with in court, with the majority being completed at the first hearing. They are split into two categories:
Summary non-motoring proceedings, such as TV license evasion and less serious criminal damage; and
Summary motoring proceedings, such as speeding and driving whilst disqualified.
The majority of information presented in this publication is reported on the principal offence and principal sentence. Where proceedings involve more than one offence, the principal offence is reported. The basis for the selection of the principal offence is as follows:
Where a defendant is found guilty of one offence and acquitted of another, the offence selected is the one for which they are found guilty;
Where a defendant is found guilty of two or more offences, the offence selected is the one for which the heaviest sentence is imposed;
1 Findings from the Crime Survey for England and Wales and police recorded crime data are published together in statistical bulletins by the Office for National Statistics.
2 All offences committed by a child or young person (someone aged 10-17 years old) can be dealt with by a youth court, subject to the following exceptions which mean that the offence must be dealt with by the Crown Court: homicide; grave crimes where the youth court has determined that, if convicted, a sentence beyond its powers should be available; firearms possession by 16-17 year olds; offences that would attract at least four years custody under the dangerousness provisions; and where it is necessary in the interests of justice to try a youth and adult together.

4
Where the same disposal is imposed for two or more offences, the offence selected is the one for which the statutory maximum penalty is the most severe.
The offence shown for each court proceeding is the one for which the court took its final decision and is not necessarily the same as the offence for which the defendant was initially prosecuted. Unless otherwise stated, the sentence shown is the most severe sentence or order given for the principal offence (i.e. the principal sentence) with secondary sentences given for the principal offence and sentences for non-principal offences not being counted in the tables. These statistics reflect all type of criminal offence dealt with by the courts, including those prosecuted by bodies other than the police (such as the TV license enforcement office).
Contents of Criminal Justice Statistics (annual) publication We are publishing the following products as part of this release:
This statistical bulletin, with commentary on trends in criminal justice statistics. This annual edition contains an additional chapter with commentary on motoring that is not included in the other three quarterlies.
A technical guide providing further information on how the data is collected and processed, as well as information on legislation relevant to sentencing trends and background on the functioning of the criminal justice system.
A set of overview tables, covering each section of this bulletin: an overview, out of court disposals, prosecutions, convictions, remand decisions, sentencing and motoring; as well as a diagram showing flows through the criminal justice system.
An interactive tool breaking down proceedings and outcomes by detailed offence group (CJS Outcomes by Offence).
A set of offending histories summary tables, alongside three data tools providing further information on first time entrants and offending histories.
Interactive data tools for: Cautions and Penalty Notices for Disorder; Prosecutions and Convictions; Magistrates’ Court Remand; Crown Court Remand; Sentencing; Motoring; Crown Court; and Magistrates’ Courts.
CSV files underpinning all these tools, together with an additional file (Courts by CJA) that shows prosecutions, convictions and sentencing information by criminal justice area. (This file is extremely large and cannot be fully opened in Excel.)
An experimental table showing prosecutions, convictions and sentencing information at the Home Office offence code level (i.e. by individual offence or the lowest-level grouping), for 2015 and 2016.
A classification guide outlining how offences are grouped in the ‘detailed offence group’ used in the majority of the tools.
A link to an interactive Sankey diagram (a type of flow diagram, in which the width of the arrows is shown proportionally to the number each represents) presenting flows through the criminal justice system.

5
Changes and revisions in this publication
In the 2015 Criminal Justice Statistics, an exercise was undertaken to reclassify a small proportion of offences in a manner more consistent with their legal basis. This classification has been further improved for this publication, meaning that there may be changes to the volumes or trend for a small number of specific offences (most notably, certain forms of criminal damage) relative to the 2015 Criminal Justice Statistics. (The intention is that we will continue to make any improvements to offence classifications as we become aware of them in future years, but we expect them to be of minimal impact.)
The £5,000 limit applied to the size of fines magistrates’ courts could apply in most cases was abolished in March 2015. In addition to the effect this can be expected to have upon average fines, more sophisticated quality assurance has been applied to high fines data for this bulletin, reflecting their increased prevalence and plausibility.
An interactive Sankey diagram has been produced for the first time, based on this publication. A link to this diagram can be found at:
moj-analytical-services.github.io/criminal_justice_statistics_sankey/
Community resolutions are being incorporated into out of court disposals totals for the first time in this annual publication, to reflect the availability of two complete years of data.
.

6
1. Overview of the Criminal Justice System
1.74 million individuals have been dealt with by the CJS
The total number of individuals formally dealt with by the criminal justice system is now at
a record low level (period 1970 to the year to 2016), at 1.74 million in the latest year.
Figure 1.1: Flows through the CJS, 2016
Flow through the Criminal Justice System, 2016back to contents
out of court disposals
103,355 35,863 (*)
1,176,117 (*) (*)
72,474 Not Guilty Plea(4) 9,644
Custody Fine Other Custody Fine Other
sentence disposal sentence disposal
39,507 6,598 1,660 3,886 6,853 551 150 503
Custody Fine Other
sation disposal
43,452 908,894 69,131
16.4 months
Probation starts(6)
67,524
Police recorded crime (1)
4,164,619
Crime outcomes
Cannabis/khat warnings Community resolutions Cautions Penalty Notices for Disorder Defendants proceeded against at magistrates' courts (2)
CPS discontinue the case
or case unable to proceed
CPS proceed with charge
Crown Prosecution Service receive papers
from the police for prosecution
Number committed for sentence at Crown Court(3)
34,252 111,485 1,456,177 2,201,537
Number tried at the Crown Court(3)
79,752
Number found guilty by magistrates Number found guilty at Crown Court
1,573,677 64,154 160,499
Compen-
20,200
Number sentenced by magistrates Number sentenced by the Crown Court
1,155,917 82,118
Guilty Plea
Suspended Community Compen- Suspended Community
sentence sation sentence sation
20,794 29 1,585 2
Suspended Community Compen-
sentence sentence
127,834
33,938 95,789 4,713
(1) Covers all indictable offences, including triable either w ay, plus a few
closely associated summary offences. Excludes fraud offences recorded by
Action Fraud/CIFAS/Financial Fraud Action UK.
Total sentenced to custody Total sentences to be served in the community
89,812 159,255
(5) Prison receptions of offenders sentenced to immediate custody.
(6) Offenders starting Community Order or Suspended Sentence Order supervision by the
Probation Service. Includes Suspended Sentence Orders w ithout requirements.
(2) Includes males, females, persons w here sex "Not Stated" and other offenders, i.e.
companies, public bodies, etc.
Average custodial sentence length
(3) Defendants tried or sentenced at the Crow n Court in a given year may have been committed
for trial or sentence by a magistrate in a previous year. Prison receptions(5)
(4) Figures for offenders pleading not guility include those cases recorded as
not applicable
no
tifi
able
off
ence
sD
efen
dan
ts: n
oti
fiab
le a
nd
no
n-n
otif
iabl
e principalo
ffen
ces
(* all
off
ence
s)

7
The total number of individuals (which includes people and companies) who have been dealt with formally by the CJS in England and Wales has been declining since 2006, with 1.74 million individuals dealt with in 20163.
In the latest year, the use of out of court disposals has continued to decrease, following a trend since 2007. There has been a 2% decrease in the number of defendants prosecuted at magistrates’ courts since 2015, this follows the longer term trend of decreases. The decrease in 2016 has been driven primarily by decreases in defendants prosecuted for indictable offences.
Figure 1.2: Individuals dealt with formally by the CJS3, 2006 to 2016 (Source: Table
Q1.1)
Comparisons with crime statistics4
The 2016 figures from the Crime Survey for England and Wales (CSEW) showed that there were an estimated 6.1 million incidents of crime against households and resident adults (aged 16 and over) in England and Wales excluding fraud and computer misuse offences. This is the lowest annual estimate since the survey began in 1981, but was not a statistically significant change compared with the 2015 CSEW figure of 6.4 million incidents. The CSEW covers a broad range of victim based crimes and includes crimes which do not come to the attention of the police. From October 2015, the survey has included questions on the experience of fraud and computer misuse amongst respondents and these have been published as experimental statistics. In the 2016 survey, there were around 5.4 million of these incidents reported (3.5 million fraud, 1.9 million computer misuse). In contrast to the CSEW, there was a 10% increase in police recorded crime excluding fraud (a 9% increase including fraud) compared with the previous year, with 4.2 million non-fraud offences recorded by the police in 2016. The renewed focus on the quality of crime
3 This is the first annual publication where we have two years of community resolutions data to incorporate into this trend. Adding this disposal causes the apparent increase in OOCDs in 2015, but the downward trend continued for each type of OOCD throughout the period – see chapter 2 for further details. 4 See Crime in England and Wales, year ending December 2016 https://www.ons.gov.uk/peoplepopulationandcommunity/crimeandjustice/bulletins/crimeinenglandandwales/yearendingdec2016

8
recording to improve compliance with national recording standards is thought to have been a key factor in increases in recorded crime over the last two years. This is thought to have particularly affected “violence against the person” offences, which have increased by 19% (largely driven by a 27% increase in violence without injury over the year). In contrast, the number of defendants prosecuted in the courts for violence against the person fell slightly in 2016. Care should be taken when making comparisons between crime data, counted on a crime basis, with courts data, counted on a defendant basis.
Once a crime is recorded by the police, an investigation takes place and the crime will be assigned one of a number of outcomes including charges, out of court disposals or explanations as to why no further action is taken for the offence, for example due to evidential difficulties, the offender having died, or no suspect being identified. Between 2015 and 2016, the number of recorded crimes which result in a charge has reduced across most crime types.
New offences included in court data This section highlights some offences that first became available in court data for 2016. It is a short summary showing new offences likely to be of particular interest only; the following web site has details of all legislation that has come into force throughout the entire reporting period: www.legislation.gov.uk There can be a delay between the commencement of new offences and seeing them in court data, primarily as a result of the time it takes for an offence to be investigated, the police to assign it an outcome, the prosecution and to result in a completed court case5. This delay is likely to lead to the recording of a higher proportion of cautions (relative to prosecutions) in the year of commencement, compared with future years, because the delay is shorter for cautions as they can be issued more quickly and will hence reach our data sooner. For this reason, only the numbers of offenders issued a caution and defendants prosecuted have been shown here. Offences that have commenced too late in the year to have any reasonable chance of being seen have not been considered. Controlling and coercive behaviour Section 76 of the Serious Crime Act 2015 created a new offence of controlling or coercive behaviour in a continuing relationship between intimate partners or family members. The offence is triable either way and has a maximum penalty of five years imprisonment.
In 2016 5 offenders were cautioned for this offence. There were 155 defendants prosecuted.
Psychoactive Substances Act 2016
Indictable offences under the Psychoactive Substances Act 2016 include the possession in a custodial institution, supply and production of psychoactive substances, i.e. substances intended for human consumption that are capable of producing a psychoactive effect. (This excludes legitimate substances, such as food, alcohol, tobacco, nicotine, caffeine and medical products, as well as controlled drugs, which continue to be regulated by the Misuse of Drugs Act 1971.)
No defendants were cautioned for these offences in 2016. There were 46 defendants prosecuted for indictable offences under this act.
5 It is useful to consider an example of a ‘new’ offence to illustrate the delay in court disposals – for example, the offence of stalking came into force in 2012 and in 2013, 53 individuals were convicted for the offence. This rose to 147 in 2014 as more cases flowed through the system and subsequently to 194 in 2015.
9
2. Out of Court Disposals
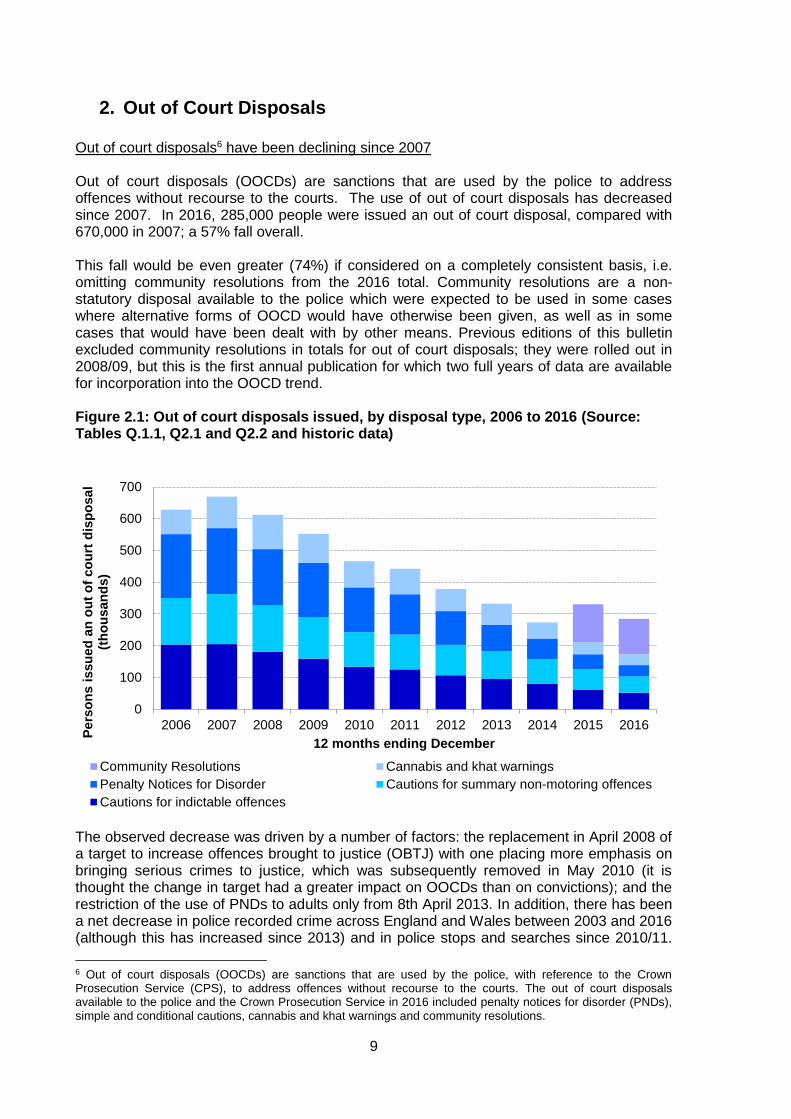
Out of court disposals6 have been declining since 2007 Out of court disposals (OOCDs) are sanctions that are used by the police to address offences without recourse to the courts. The use of out of court disposals has decreased since 2007. In 2016, 285,000 people were issued an out of court disposal, compared with 670,000 in 2007; a 57% fall overall. This fall would be even greater (74%) if considered on a completely consistent basis, i.e. omitting community resolutions from the 2016 total. Community resolutions are a non-statutory disposal available to the police which were expected to be used in some cases where alternative forms of OOCD would have otherwise been given, as well as in some cases that would have been dealt with by other means. Previous editions of this bulletin excluded community resolutions in totals for out of court disposals; they were rolled out in 2008/09, but this is the first annual publication for which two full years of data are available for incorporation into the OOCD trend. Figure 2.1: Out of court disposals issued, by disposal type, 2006 to 2016 (Source: Tables Q.1.1, Q2.1 and Q2.2 and historic data)
0
100
200
300
400
500
600
700
2006 2007 2008 2009 2010 2011 2012 2013 2014 2015 2016
Pers
on
s i
ssu
ed
an
ou
t o
f co
urt
dis
po
sal
(th
ou
san
ds)
12 months ending December
Community Resolutions Cannabis and khat warnings
Penalty Notices for Disorder Cautions for summary non-motoring offences
Cautions for indictable offences The observed decrease was driven by a number of factors: the replacement in April 2008 of a target to increase offences brought to justice (OBTJ) with one placing more emphasis on bringing serious crimes to justice, which was subsequently removed in May 2010 (it is thought the change in target had a greater impact on OOCDs than on convictions); and the restriction of the use of PNDs to adults only from 8th April 2013. In addition, there has been a net decrease in police recorded crime across England and Wales between 2003 and 2016 (although this has increased since 2013) and in police stops and searches since 2010/11.
6 Out of court disposals (OOCDs) are sanctions that are used by the police, with reference to the Crown Prosecution Service (CPS), to address offences without recourse to the courts. The out of court disposals available to the police and the Crown Prosecution Service in 2016 included penalty notices for disorder (PNDs), simple and conditional cautions, cannabis and khat warnings and community resolutions.

10
Statutory restrictions around the use of cautions have also been included in the Criminal Justice and Courts Act 2015 which came into force in April 2015. The proportion of people issued Penalty Notices for Disorder (PNDs) has fallen The use of PNDs has been decreasing year on year since their peak in 2007. In 2016, 35,900 were issued compared with 47,400 in 2015; a 24% decrease. Since 2007, the volume of PNDs issued fell by 83%.
In 2016, four higher tier offences comprised 90% of all PNDs issued; namely drunk and disorderly (39%), retail theft of goods under the value of £100 (22%), possession of cannabis (18%) and behaviour likely to cause harassment, alarm or distress (12%). The predominance of these offences has been broadly consistent over time since 2010, when the four offences comprised 88% of the total volume of PNDs issued. However, over this period the proportion of PNDs issued for drunk and disorderly and possession of cannabis has increased, while the proportion issued for causing harassment, alarm or distress has fallen. Figure 2.2: Penalty Notices for Disorder issued for higher and lower tier offences, 2006 - 2016 (Source: Table Q2.1)
0%
10%
20%
30%
40%
50%
60%
70%
80%
90%
100%
2006 2007 2008 2009 2010 2011 2012 2013 2014 2015 2016
Causing harassment, alarm or distress Drunk and disorderly
Theft (retail under £100) Possession of Cannabis
Other higher tier offences Lower tier offences
The proportion of people who paid their fines in full remained relatively stable in 2016, compared with 2015; falling one percentage point from 52% (24,500) to 51% (18,300). Those fined for late payment also remained stable, rising one percentage point in 2016 (33%) compared with 2015 (32%).

11
Police cautions issued have decreased and cautioning rates fallen In 2016, 103,400 offenders were given either a simple or conditional caution; an 18% decrease compared with 2015. The trend for cautions issued continues to fall from the peak in 2007, when 362,900 were issued (representing a 72% decline). Half (50%) of cautions issued in 2016 were for indictable offences. The offence groups where offenders were cautioned in the largest volumes were drug and theft offences; comprising 38% and 31% respectively of the total volume of offenders cautioned for indictable offences. Volumes of cautions decreased across all offence groups, except for possession of weapons, which increased by 1.5% in 2016 compared with 2015. The volume of cautions issued to offenders for indictable sexual offences fell by 10% in 2016 compared with 2015; continuing the downward trend with a 50% fall from 2007. In 2016, 2% of the total volume of offenders cautioned for indictable offences were cautioned for sexual offences. Figure 2.3: Proportion of offenders cautioned for indictable offences, by offence group, 2006 – 2016 (Source: Table Q2.2)
0%
10%
20%
30%
40%
50%
60%
70%
80%
90%
100%
2006 2007 2008 2009 2010 2011 2012 2013 2014 2015 2016
Violence against the person Sexual offences Robbery
Theft offences Criminal damage and arson Drug offences
Possession of weapons Public order offences Miscellaneous crimes
Fraud offences

12
The overall cautioning rate has fallen to 12.5% in 2016, compared with 14.5% during 2015. The equivalent cautioning rate for juveniles declined from 40.2% in 2015 to 37.3% in 2016; a fall of 3 percentage points. The cautioning rate for adults also decreased, to 11.3% in 2016; down from 13.2% in 2015. The indictable offence cautioning rate decreased in 2016, continuing the downward trend in each year since 2006. In 2016, the cautioning rate rose fell to 17.3% compared with 18.9% in the same period in 2015 and 40.2% at its peak in 2006. The cautioning rate decreased across all offence groups except robbery, where in 2016 it increased by less than one percentage point compared with 2015. The largest decrease in the cautioning rate was for criminal damage and arson offences, which declined by six percentage points in 2016 compared with the previous year. The trend for summary offence cautioning rates is of continued decline, and in the latest year it decreased to 9.8% compared with a peak of 24.3% in 2007. Figure 2.5: Cautioning rate for indictable and summary offences, 2006 – 2016 (Source: Table Q2.3)
0.0%
5.0%
10.0%
15.0%
20.0%
25.0%
30.0%
35.0%
40.0%
45.0%
2006 2007 2008 2009 2010 2011 2012 2013 2014 2015 2016
Cautioning rate: Indictable Cautioning rate: Summary
Cautioning rate: All offences

13
Cautions for rape offences are rare and less common recently than a decade ago There were 11 cautions administered for rape offences in 2016, compared with 18 cautions in 2015. Ten of these were administered to juveniles and the oldest offender given a caution was 20 years old7.
Of the 11 cautions administered in 2016:
four were for rape of a male aged under 13;
four were for rape of a female aged under 13;
two were for attempted rape of a female aged under 13; and
one was for rape of a female aged 16 or over.
The number of cautions given for rape offences has fallen over time. Between 2006 and 2010, an average of 30 cautions for rape offences were given each year. This compares with 17 per year between 2011 and 2016, with the 2016 number the lowest over the period. In contrast, the number of offenders prosecuted for rape has risen in recent years. There were around 3,700 offenders prosecuted for rape in 2016. While this was lower than the 2015 peak, there has been a general increase in offenders prosecuted for rape since 2008, when there were around 2,400 prosecutions. The use of cannabis and khat warnings continues to decline The trend for cannabis and khat warnings issued has been declining since 2008. In 2016, 34,300 cannabis and khat warnings were issued. This is a decrease of 10% (38,200 issued in 2015) compared with 2015, and a fall of 68% (108,300 issued) since the 2008 peak. Fewer community resolutions8 were issued in 2016 compared with 2015 In 2016, 111,500 community resolutions were administered by the police. This decreased by 7% since 2015, when 119,300 were issued.
7 Reasons for giving a caution for a rape offence are presented in the technical guide 8 Further information about community resolutions can be obtained from the Home Office publication at the link below: www.gov.uk/government/collections/crime-outcomes-in-england-and-wales-statistics

14
3. Court Proceedings and Convictions
1.46 million defendants were prosecuted in 2016
The number prosecuted at magistrates’ courts has declined by 2% over the latest year.
This was driven by a fall in indictable offences, while numbers prosecuted for summary
offences remained broadly stable.
The conviction ratio was 85%
The overall conviction ratio increased slightly in the latest year, by one percentage point.
It has fluctuated between 82% and 84% between 2007 and 2015.
Defendants will start proceedings at magistrates’ courts, regardless of the seriousness of the offence charged against them9. Less serious offences (summary offences) will be entirely dealt with by magistrates’ courts. The more serious offences (indicatable offences) may be dealt with by the Crown Court. The most serious indicatable offences (indicatable only offences) must be tried at the Crown Court, the remaining indicatable offences (triable-either-way) can either be tried at a magistrates’ court or Crown Court. The number of defendants prosecuted has fallen in 2016 In 2016, 1.46 million defendants were prosecuted at magistrates’ courts. The total number of defendants prosecuted has fallen by 2% over the last year. This follows two years where the total number of defendants prosecuted increased by 2% year-on-year. Prior to 2014, however, there had been an almost constant year-on-year falling trend, and the number prosecuted in 2016 is 18% lower than it was in 2006. Over the two years prior to 2016, there were increases in summary offences driving up the overall number of defendants being prosecuted. These increases have not followed through to 2016, and summary non-motoring offences have fallen by 1%. Summary motoring offences increased over the year by less than 1%. The number of defendants prosecuted for indictable offences fell by 9% in 2016 compared with 2015 and by 28% since 2006.
9 There are rare exceptions, as mentioned in the accompanying technical guide.

15
Figure 3.1 Defendants prosecuted at magistrates’ courts, 2006 to 2016, and proportions of all proceedings for 2006, 2011, and 2016 (Source: Table Q3.2)
Prosecutions for all groups of indictable offences have declined, except for possession of weapons and public order offences. The number of defendants prosecuted for possession of weapons increased by 6% in 2016 (14,800 defendants prosecuted), and was accompanied by an increase in cautions (see chapter 2). This follows a 2% increase in 2015, prior to which the series had been broadly unchanged since 2012. The number of defendants prosecuted for public order offences increased by 1%, from 17,400 to 17,500. The number of defendants prosecuted for sexual offences was broadly unchanged at 12,600 defendants. There were large falls in the number of defendants prosecuted for theft offences (15%, to 100,700 defendants), criminal damage and arson (10%, 3,100 defendants prosecuted), and robbery (17%, 6,000 defendants prosecuted). For all these offence groups, it continues the large falls seen in 2015. Over time the relative size of offence groups being prosecuted at magistrates’ courts has changed. Between 2006 and 2010 the number of defendants prosecuted for summary motoring offences declined at a faster rate than for summary non-motoring offences: in 2016 summary motoring and summary non-motoring defendants each represented the same proportion of all defendants prosecuted (40%), however, in 2006 summary motoring offences (43%) accounted for a larger proportion than summary non-motoring offences (34%).

16
There have also been some changes to the composition of indictable offences over the last decade. Defendants being prosecuted for a theft offence account for the largest proportion of indictable offence prosecutions (around one-third). This is about the same as a decade ago although it was consistently higher between 2007 and 2015 at around 36% to 38%. The proportion prosecuted for drug offences has increased by 5 percentage points since 2006 to 16%, and now represents the second largest proportion of indictable offence prosecutions. There has also been a 2 percentage point increase in the proportion of indictable offence prosecutions that are sexual offences, which now represents 4% of prosecutions for indictable offences. The proportion of defendants prosecuted for miscellaneous crimes against society has fallen by 8 percentage points over the last decade and now represents 14% of indictable offence prosecutions. The proportion of defendants prosecuted for triable-either-way-offences being committed for trial to the Crown Court has decreased Defendants prosecuted for triable-either-way offences have accounted for 91% of those prosecuted for indictable offences, remaining broadly stable and in line with the proportion over the last decade (91% to 92%). Most defendants (70%, up 2 percentage points on 2015) prosecuted for triable-either-way offences are tried within magistrates’ courts. Over the last decade this proportion has fluctuated from a low of 68% in 2013 and 2015 to a high of 71% in 2012. The proportion of defendants committed for trial at the Crown Court has fallen by 2 percentage points in 2016 to 20%. Over the last decade this proportion increased from 14% in 2006 to 22% in 2014 and 2015. In 2013 there was an increase of 4 percentage points in the proportion of defendants prosecuted for a triable-either-way offence being committed to the Crown Court over the previous year. This coincided with the abolition of committal hearings across all local justice areas in England and Wales as of May 2013. Figure 3.2: Defendants prosecuted for a triable-either-way offence by court assigned for trial, 2006 to 2016 (Source: Table Q3.1 and Magistrates’ Court tool)

17
The conviction ratio increased to its highest level over the last decade The number of defendants convicted – that is, defendants who plead or are found guilty – fell by 1% in 2016 after 2 years of increases. The increases in the previous two years had been driven by increases in the number of offenders convicted for summary offences, which more than offset decreases in convictions for indictable offences. For 2016, although there was an increase in the number of offenders convicted for summary offences, it was a smaller increase (1%) and was not enough to offset the change in convictions for indictable offences, which decreased by 8% year-on-year. The number of offenders convicted for indictable offences increased for possession of weapons (up 11%, to 12,100 convictions in 2016) and sexual offences (up 9%, to 7,500 convictions). Numbers fell in all other indictable offence groups. For summary offences the number of offenders convicted increased by 1% for non-motoring offences and 2% for motoring offences. Trends in the number of offenders convicted and sentenced at all courts are driven by two factors, the number of individuals dealt with through the courts (the trend in prosecutions) and the proportion of those individuals who are found guilty. Conviction ratios are calculated as the number of convictions as a proportion of the number of proceedings. This gives a measure of the relative number of defendants who are found guilty within a given year for a certain offences, when compared with the number who are prosecuted that year for the same offence. It is worth noting that offenders found guilty in a given year may well have been prosecuted in a previous year. Further, defendants may be found guilty of a different offence to that for which they were originally prosecuted. Between 2007 and 2015 the conviction ratio was broadly stable between 82% and 84%. In 2016, the conviction ratio increased by 1.5 percentage points to a level higher than at any point in the last decade (85.2%). Increases in the conviction ratio applied across all offence groups except public order offences which decreased by 2.9 percentage points (to 95.9%). The largest increase in the conviction ratio was for sexual offences. The conviction ratio for sexual offences peaked at 61% in 2012, falling to 52% in the following year. Since then it has been increasing steadily year-on-year, reaching 55% in 2015 before a 5.1 percentage point increase to 59.7% in 2016. Figure 3.3: Conviction ratio for all defendant proceedings and convictions at all courts, 2006 to 2016 (Source: Table Q3.3)

18
Convictions per 100,000 people continue to decrease for both adults and juveniles. Considering the number of convictions per 100,000 population enables an assessment of the rate at which a group is convicted, separate from any parallel changes in the number of that group in the population10. The rate of juvenile and adult convictions per 100,000 population have both declined in the last decade. However, juvenile convictions per 100,000 population have declined by 70% over the last decade whereas the adult rate has declined by 16%. Year on year juvenile convictions per 100,000 population have fallen at a faster rate than for adults since 2007, at between 7% and 24% a year. Although the general trend for adults is a fall, year on year this has fluctuated between a 3% increase and a 6% decrease. In 2016 the rate for juveniles decreased by 9% compared with 1% for adults. Adults mirror the trends for prosecutions and convictions more closely than juveniles, largely because adults make up 90% of the population aged 10 and over. However, there are differences in the composition of offences by juveniles and adults. This means that although there are similar year on year trends in individual offence groups for adults and juveniles, they have differing effects on the overall rate. Specifically, both age groups saw increases in the number of prosecutions and convictions for summary motoring offences in 2016 compared with the previous year. But this will have a much stronger effect on the overall adult rate, as in 2016 summary motoring offences accounted for around four-in-ten adults prosecuted and convicted, compared with under one-in-ten juveniles convicted. In contrast, indictable offences, for which the number of prosecutions and convictions has fallen for both adults and juveniles, accounted for over one-half of juveniles and under one-quarter of adults dealt with. Figure 3.4: All convictions per 100,000 population for juveniles and adults, 2006 to 2016 (Source: Prosecutions and Convictions tool and Office for National Statistics population estimates)
10 To calculate proportions of convictions per 100,000 population, the total number of convictions for a specific year are divided by the population in the previous year. Population figures come from the ONS mid-year population estimates. The population of the previous year is used due to population data available at the time of publication.
19
4. Remands
Police bail and custodial remands have been declining
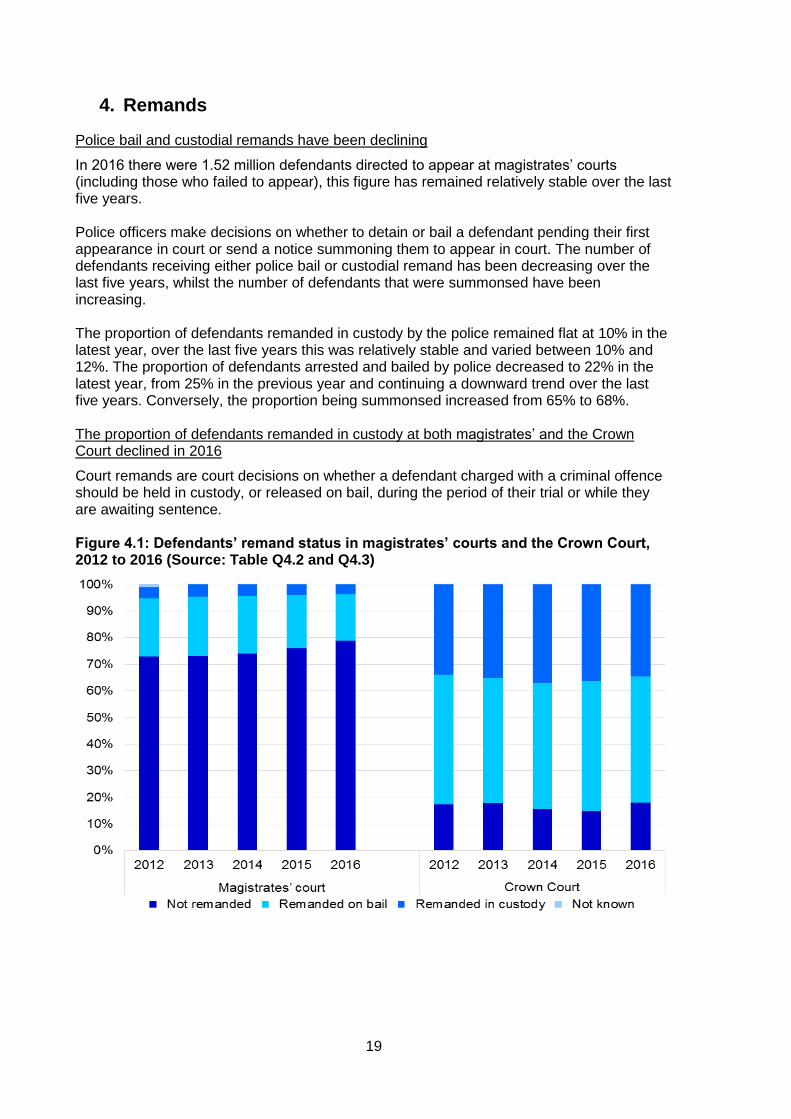
In 2016 there were 1.52 million defendants directed to appear at magistrates’ courts (including those who failed to appear), this figure has remained relatively stable over the last five years. Police officers make decisions on whether to detain or bail a defendant pending their first appearance in court or send a notice summoning them to appear in court. The number of defendants receiving either police bail or custodial remand has been decreasing over the last five years, whilst the number of defendants that were summonsed have been increasing. The proportion of defendants remanded in custody by the police remained flat at 10% in the latest year, over the last five years this was relatively stable and varied between 10% and 12%. The proportion of defendants arrested and bailed by police decreased to 22% in the latest year, from 25% in the previous year and continuing a downward trend over the last five years. Conversely, the proportion being summonsed increased from 65% to 68%. The proportion of defendants remanded in custody at both magistrates’ and the Crown Court declined in 2016
Court remands are court decisions on whether a defendant charged with a criminal offence should be held in custody, or released on bail, during the period of their trial or while they are awaiting sentence. Figure 4.1: Defendants’ remand status in magistrates’ courts and the Crown Court, 2012 to 2016 (Source: Table Q4.2 and Q4.3)

20
In the latest year, bail was granted to 17% of defendants prosecuted at magistrates’ courts, while 4% were remanded in custody and the remaining 79% were not remanded at magistrates’ courts. Defendants are more likely to be remanded in custody for more serious, indictable offences than summary offences – as a result, the proportion of defendants remanded in custody at the Crown Court is higher than at magistrates’ courts. In the latest year, the proportion of defendants tried at the Crown Court who were remanded in custody was 35%, compared with 36% in the previous year. The proportion of defendants remanded on bail was 47%, compared with 49% in the previous year. Defendants remanded in custody at the Crown Court were more likely to receive immediate custodial sentences Of those defendants remanded in custody at the Crown Court in 2016, 72% were sentenced to immediate custody. In contrast, 16% of defendants remanded in custody by magistrates’ courts were sentenced there to immediate custody; although given that 57% of defendants remanded in custody in magistrates’ courts were committed for trial or sentencing at the Crown Court, which likely reflects the more serious nature of their crimes, it is expected that considerably more will have ultimately received a custodial sentence. Figure 4.2: Outcome of proceedings for defendants remanded in custody in magistrates’ courts and the Crown Court, 2016 (Source: Table Q4.4)

21
Sentence lengths for defendants remanded in custody in the Crown Court who went on to receive an immediate custodial sentence have remained broadly similar over time. In 2016, 75% of these defendants received immediate custodial sentences of 12 months or more in duration. Figure 4.3: Custodial sentence length for defendants remanded in custody and given an immediate custodial sentence in the Crown Court, 2016 (Source: Crown Court remand tool)
22
5. Sentencing
For indictable offences, the custody rate was 30% and ACSL was 19.4 months
The custody rate for indictable offences has been increasing since 2010, from 24% to
30%.
Average custodial sentence length (ACSL) has increased for these offences from 15.2
months to 19.4 months since 2007.
The number of offenders sentenced at all courts continues to decrease, with 1.24 million
offenders sentenced in 2016; a fall of 1% since 2015, in line with a similar fall in convictions.
This has largely been driven by a 9% decrease in triable either way offences, with slight
increases seen amongst the other offence types. These trends varied by court type; the
greatest decreases were seen in magistrates’ courts.
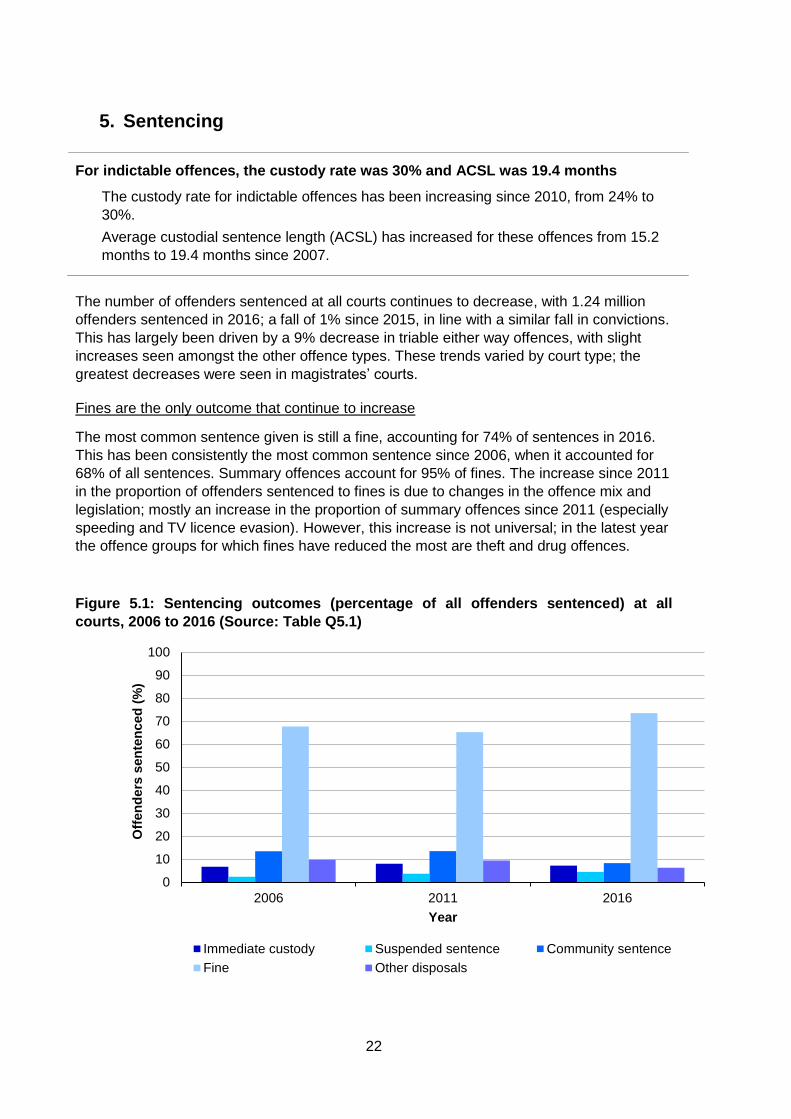
Fines are the only outcome that continue to increase
The most common sentence given is still a fine, accounting for 74% of sentences in 2016.
This has been consistently the most common sentence since 2006, when it accounted for
68% of all sentences. Summary offences account for 95% of fines. The increase since 2011
in the proportion of offenders sentenced to fines is due to changes in the offence mix and
legislation; mostly an increase in the proportion of summary offences since 2011 (especially
speeding and TV licence evasion). However, this increase is not universal; in the latest year
the offence groups for which fines have reduced the most are theft and drug offences.
Figure 5.1: Sentencing outcomes (percentage of all offenders sentenced) at all
courts, 2006 to 2016 (Source: Table Q5.1)
0
10
20
30
40
50
60
70
80
90
100
2006 2011 2016
Off
en
ders
sen
ten
ced
(%
)
Year
Immediate custody Suspended sentence Community sentence
Fine Other disposals

23
Offender outcomes vary by offence type
For indictable only offences, many more offenders (74%) receive immediate custody than
any other type of sentence. Triable either way offences receive a much wider variety of
sentences.
Figure 5.2: Sentencing outcomes for indictable only, triable-either-way and summary
offences at all courts, 2016 (Source: Table Q5.1)
0
10
20
30
40
50
60
70
80
90
100
Indictable only Triable either-way Summary offences
Off
en
ders
sen
ten
ced
(%
)
Immediate custody Suspended sentence Community sentence
Fine Other disposals
24
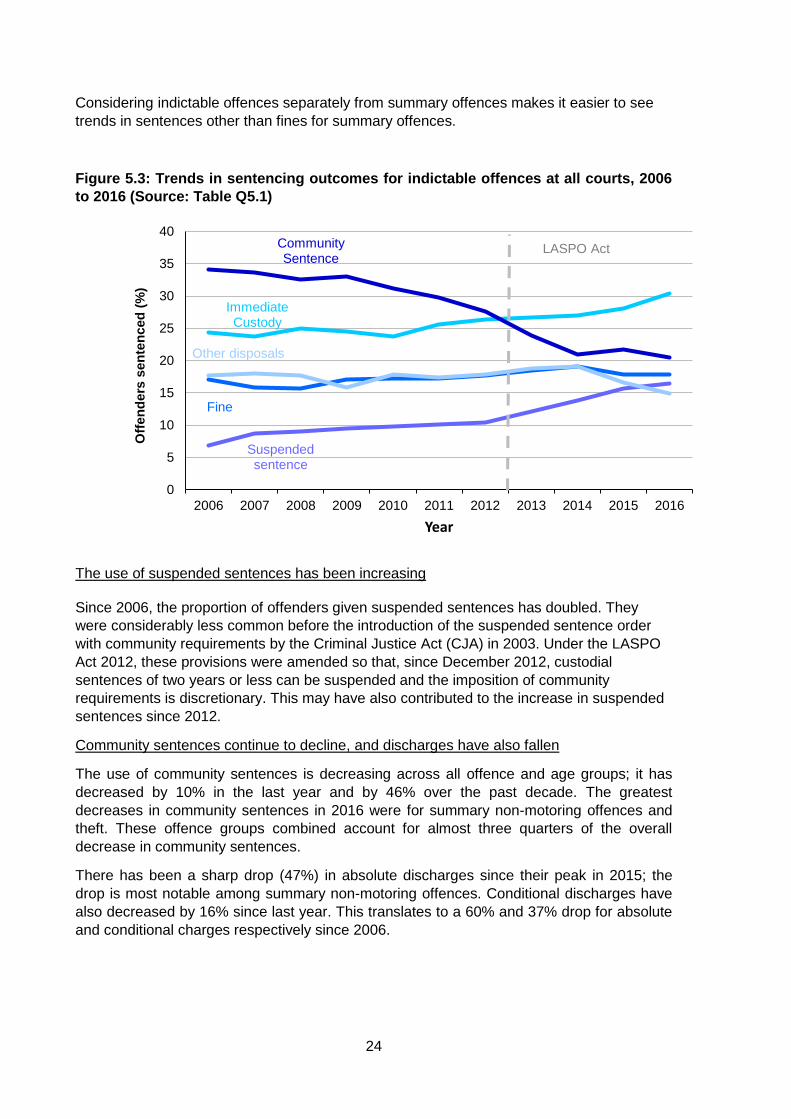
Considering indictable offences separately from summary offences makes it easier to see
trends in sentences other than fines for summary offences.
Figure 5.3: Trends in sentencing outcomes for indictable offences at all courts, 2006
to 2016 (Source: Table Q5.1)
Immediate Custody
Suspendedsentence
Community Sentence
Fine
Other disposals
0
5
10
15
20
25
30
35
40
2006 2007 2008 2009 2010 2011 2012 2013 2014 2015 2016
Off
en
ders
sen
ten
ced
(%
)
Year
LASPO Act
The use of suspended sentences has been increasing
Since 2006, the proportion of offenders given suspended sentences has doubled. They
were considerably less common before the introduction of the suspended sentence order
with community requirements by the Criminal Justice Act (CJA) in 2003. Under the LASPO
Act 2012, these provisions were amended so that, since December 2012, custodial
sentences of two years or less can be suspended and the imposition of community
requirements is discretionary. This may have also contributed to the increase in suspended
sentences since 2012.
Community sentences continue to decline, and discharges have also fallen
The use of community sentences is decreasing across all offence and age groups; it has
decreased by 10% in the last year and by 46% over the past decade. The greatest
decreases in community sentences in 2016 were for summary non-motoring offences and
theft. These offence groups combined account for almost three quarters of the overall
decrease in community sentences.
There has been a sharp drop (47%) in absolute discharges since their peak in 2015; the
drop is most notable among summary non-motoring offences. Conditional discharges have
also decreased by 16% since last year. This translates to a 60% and 37% drop for absolute
and conditional charges respectively since 2006.

25
The overall custody rate remains stable
The custody rate (i.e. the proportion of sentences which result in immediate custody) has
remained broadly stable compared to the previous year, at 7.3%. It peaked in 2011 at 8.1%,
having increased since 2007 (when it was 6.8%), but fell between 2011 and 2015.
The custody rate has decreased by almost 1 percentage point for sexual offences, but it has
increased for all other indictable offence groups. The custody rate for indictable offences
has increased by 2 percentage points since 2015, to the highest rate of the last decade,
(30.4%).
The largest increase in this period was seen in possession of weapons, from 28.6% in 2015
to 32.9% in 2016. Robbery continues to have the highest custody rate at 69.7%.
Average custodial sentence length is continuing to increase
Average custodial sentence length (ACSL) has increased since 2006 (from 12.4 to 16.4
months in 2016). This may be due to numerous changes in legislation over the decade,
including:
The LASPO Act, passed on 3rd December 2012, which abolished IPPs and
Extended Sentences for Public Protection (EPPs) and replaced them with new
Extended Determinate Sentences (EDSs). EDSs are included within the ACSL
calculation, whilst IPPs and EPPs were previously excluded.
The introduction of the Criminal Justice and Immigration Act (CJIA) in 2008 restricted
the use of indeterminate sentences for Public Protection (IPPs), which as
mentioned are excluded from ASCL. Following this, there has been an increase in
long determinate sentences (defined as for 10 years or more).
Further legislative changes have made sentence lengths longer for certain offences
– for example, the powers to sentence offenders convicted of a third domestic
burglary offence to a mandatory minimum sentence of three years custody, as
introduced by the Crime (Sentences) Act 1997 for offences committed after 30th
November 1999, have been used increasingly in the last decade.
There has, however, been a small drop in ACSL for sexual offences in the latest year, with it
being shortened by 1.8 months since 2015, although still remaining almost 50% longer than
a decade ago. The other notable decrease was for violence against the person; this fell by
0.6 months to 22.3 months. The highest increase in ACSL was for criminal damage and
arson; this increased by 3.9 months in 2016.
The longer term increase in overall ACSL is in part caused by the ACSL for sexual offences
increasing by 18.9 months since 2006. More people are being sentenced for these
offences, and these sentences were getting longer until 2014, which has driven up the
overall average. The largest increase within this offence group was for rape of a female
child under 13 by a male, for which ACSL has almost doubled and the number sentenced
has more than doubled since 2006.
The total number of persons sentenced for sexual offences in 2016 was 7,500, up from
4,900 in 2006, and this change was mirrored in proceedings and convictions. The change
could be related to improved reporting and recording of sexual offences, as well as an
increased public focus.

26
6. Motoring
Prosecutions and convictions for motoring offences have increased The number of defendants prosecuted for motoring offences has increased by 3% over the last year, from 646,000 in 2015 to 667,000, while the numbers of offenders convicted and sentenced have increased by 5%. Just over half of defendants prosecuted for motoring offences in 2016 were for prosecuted for speed limit and vehicle insurance offences (51%), with both the number of defendants prosecuted (183,000) and convicted (168,000) for speed limit offences being the highest in the last decade. Fig 6.1: Defendants prosecuted for motoring offences, 20161112 (Source – Motoring tool)
The largest increases in the number of defendants prosecuted were seen in ‘Vehicle excise and excise license offences’ (a 21% increase; from 64,000 in 2015 to 77,000 in 2016) and Failing to supply information as to identity of driver when required (a 5% increase; from 85,000 to 89,000, the highest total over the last decade). The largest proportionate increase was in vehicle test offences, a 62% increase from 3,000 to 5000. The offence showing the largest decrease in defendants prosecuted was ‘Using or causing others to use a mobile phone whilst driving’ (a 27% decrease; from 18,000 in 2015 to 13,000 in 2016), while both vehicle theft offences and careless driving (excluding mobile phone use) saw the fewest
11 Other motoring offences includes: Causing danger by interfering with a vehicle, road or traffic equipment, Using or causing others to use a mobile phone whilst driving, Careless driving offences (excl. mobile phone offences), Failing to stop or provide information after accident, Theft of a motor vehicle / aggravated vehicle taking, Driving licence related offences, Work record and employment offences, Fraud, forgery etc. associated with vehicle or driver records, Defective vehicle parts, Vehicle test offences, Neglecting road regulations (other than speeding), Failing to supply information as to identity of driver when required, Miscellaneous (other) motoring offences. 12 The Home Office publishes data on police action in relation to motoring offences including fixed penalty notices (FPNs) for speeding: www.gov.uk/government/collections/police-powers-and-procedures-england-and-wales Fixed penalty notices are available as out of court disposals where the speeding offence is
not serious enough to warrant a criminal court proceeding and where the offender does not contest being issued with the FPN. The number of FPNs fell by less than 1% between 2014 and 2015.

27
defendants prosecuted in a decade. The trends in convictions are similar to the trends in prosecutions for these offences. The most serious motoring offences, causing death and injury, saw an increase in the latest year in defendants prosecuted overall, however their proportion among all motoring offences is still very small. Trends in offenders convicted for these offences were broadly in line with those in prosecutions. Prosecutions for causing death by dangerous driving have continued to see an increase, from 144 defendants prosecuted in 2013 to 229 in 2016, reversing the decreasing trend observed between 2007 and 2013. ‘Causing death by careless or inconsiderate driving’13 also saw a small increase, from 201 defendants prosecuted in 2015 to 215 in 2016, reversing the trend seen from 2010 to 2015; and there was an increase from 30 to 32 defendants prosecuted for other offences involving death. Prosecutions for causing serious injury by dangerous driving increased for a third consecutive year14 (an increase of 21%; from 273 in 2015 to 330 in 2016). Other driving offences for causing injury saw few prosecutions. Sentencing trends for motoring offences have remained broadly stable The overall custody rate for motoring offences remained stable at around 1% in 2015, although the vast majority of offenders sentenced for ‘causing death by dangerous driving’ and ‘causing death by careless driving under influence of drink or drugs’ received immediate custody, with custody rates of 97% and 91% respectively. Furthermore, the use of fines as the main sentence for motoring offences remained stable at 94% of offenders sentenced. This has been the case since 2014, although there has been an increase of 6 percentage points over the last decade. The total number of offenders disqualified increased for the second consecutive year, an
increase of 4%, from 60,000 in 2015 to 63,000 in 2016. The total number of offenders
endorsed without disqualification (i.e. receiving points on their licence only), increased by
2%, from 348,000 in 2015 to 356,000 in 2016. These increases are in line with the increase
in defendants prosecuted and sentenced for motoring offences.
13 The offence of ‘Causing death by careless or inconsiderate driving’ was introduced by the Road Traffic Act 1988 S.2B with commencement on 18th August 2008. 14 The offence of ‘Causing serious injury by dangerous driving’, introduced by the 2012 Legal Aid, Sentencing and Punishment of Offenders (LASPO) Act, was designed to create a specific offence of causing serious injury by dangerous driving to supplement the existing offences of dangerous driving and causing death by dangerous driving.

28
7. Offending Histories
Offenders dealt with for indictable offences with no criminal history are now more likely to go to court and be convicted than they are to receive a caution
Offenders dealt with for indictable offences with no previous convictions and cautions are
now more likely to go to court and be convicted (53%) than they are to receive a caution.
22% of first time offenders went to court and were convicted 10 years ago.
Figure 6.1: First time offenders dealt with for indictable offences, by outcome, 2006 to
2016 (Source: Table Q6.1)
0%
10%
20%
30%
40%
50%
60%
70%
80%
90%
100%
2006 2007 2008 2009 2010 2011 2012 2013 2014 2015 2016
Pro
po
tio
n o
f o
ffe
nd
ers
re
ceiv
ing
a ca
uti
on
o
r co
nvi
ctio
n
Year
Convicted
Cautioned
Over the latest year the number of adult offenders receiving an immediate custodial
sentence has remained relatively stable. There has however been a slight increase (3%) in
the number of adult offenders receiving a suspended sentence – driven by an 8% increase
in the number of suspended sentences received by those with no previous criminal history.
Around 87,500 adult offenders convicted of an indictable offence had 15 or more previous
convictions or cautions (long criminal records – on average 34 previous sanctions). 38% of
adults convicted of an indictable offence had a long criminal record compared to 29% 10
years ago.
There has been a decline across all disposal types received by juvenile offenders over the
latest year, with a decline of around 20% in the number receiving a caution or immediate
custodial sentence. Over the last ten years the number of juvenile offenders has been
declining year on year – with a 15% fall over the latest year. The largest declines were seen
in theft offences and criminal damage and arson offences (26% and 23% falls respectively
over the latest year). However, over the last 5 years there has been an increase in the
proportion of the juvenile offender population made up by first time offenders – in 2016 45%
of the juvenile offender population was made up by first time offenders, this compares with
38% in 2011.

29
There were around 127,000 persistent offenders15 in 2016 who have been responsible for
around 3 million crimes through their criminal careers. Of these, 39% were given their first
official sanction for a theft offence.
The number of First Time Entrants peaked in 2007 and has fallen since then. This decline
has been much sharper for juveniles than for adults; the number of juvenile FTEs is now
around a tenth of that seen at the peak. This has in part been driven by the decline in
cautions as highlighted in chapter 2.
15 A persistent offender is an offender with 8 or more convictions or cautions. The methodology to count the number of persistent offenders has been revised from previous publications – the figure now shows the actual number of individual offenders instead of the number of sanction occasions.

30
Further information
National Statistics status
National Statistics status means that official statistics meet the highest standards of
trustworthiness, quality and public value.
All official statistics should comply with all aspects of the Code of Practice for Official
Statistics. They are awarded National Statistics status following an assessment by the
Authority’s regulatory arm. The Authority considers whether the statistics meet the highest
standards of Code compliance, including the value they add to public decisions and debate.
It is the Ministry of Justice’s responsibility to maintain compliance with the standards
expected for National Statistics. If we become concerned about whether these statistics are
still meeting the appropriate standards, we will discuss any concerns with the
Authority promptly. National Statistics status can be removed at any point
when the highest standards are not maintained, and reinstated when
standards are restored.
Contact
Press enquiries should be directed to the Ministry of Justice press office:
Tel: 020 3334 3536
Email: [email protected]
Other enquiries about these statistics should be directed to the Justice Statistics Analytical
Services division of the Ministry of Justice:
Damon Wingfield, Head of Criminal Justice Statistics
Ministry of Justice, 7th Floor, 102 Petty France, London, SW1H 9AJ
Email: [email protected]
Next update: 17 August 2017
URL: https://www.gov.uk/government/statistics/criminal-justice-system-statistics-
quarterly-december-2016
© Crown copyright
Produced by the Ministry of Justice
Alternative formats are available on request from [email protected]