publicatmicrofinance commercialization and mission drift: what about sub-saharan africa and mena...
TRANSCRIPT

IJMSS Vol.03 Issue-09 (September, 2015) ISSN: 2321-1784 International Journal in Management and Social Science (Impact Factor- 4.358)
A Monthly Double-Blind Peer Reviewed Refereed Open Access International e-Journal - Included in the International Serial Directories
International Journal in Management and Social Science http://www.ijmr.net.in email id- [email protected] Page 110
Microfinance Commercialization and mission drift: what about sub-Saharan Africa and MENA regions?
a Ati Abdessattarb & Ben Slama Mayada
a Professor of economics at the University of Tunis Elmanar, Tunisia
of econmic science at Faculty of Economics and Management of Tunis,
Address: Faculty of Economics and
Management of Tunis, BP 248 2092 Tunis El Manar II -TUNISIA
bPhD student on econmic science at Faculty of Economics and Management of Tunis
Address: Faculty of Economics and Management of Tunis Management of Tunis, BP 248 2092 Tunis El Manar II -TUNISIA
Abstract:
In this article we will try to assess commercialization and mission drift in SSA and MENA regions. According to the literature on microfinance, commercialization as represented by competition, profitability and regulation can affect loan size. After reviewing litterature facts we will address the problem empirically, with the obvious consideration that research in this field are unfortunately few. Using data from mixmarket of 49 MFIs for the two regions (including 19 from SSA and 30 from the MENA region), we use the average outstanding loan balance/GNI as dependent variable and proxy of outreach. An Unbalanced panel data model for the period 2000- 2013 was used to explain the effect of some independents variables on our dependant variable.
Keyword: Microfinance, commercialization, mission drift, Middle East and North Africa (MENA), Sub Saharan Africa (SSA)
I-Introduction:
Poor people are marginalized from conventional banking system, because they do not justify the classic conditions1. These conditions are related to the non ability to submit the criteria required in a classic banking customer2. Microfinance has solved the problem of financial exclusion of low income people.
As a consequence to the Nobel Peace Prize got by Professor Muhammad Yunus in 2006 for his innovative approach and his efforts to address the problem of poverty, microfinance programs have continued to gain ground and media popularity. In fact, opulent work demonstrates the enormous success of these programs in much developed and developing world. However, the effectiveness of microfinance
1 Poor and low income people are usually excluded from banking credit system for several reasons. These
raisons include the lack of collateral, their unstable income and the High illiteracy rates. 2 Credit rationing and collateral Requirement are the traditional means clustering Used by banks to cope with
information asymmetries in the credit market (Stiglitz & Weiss, 1981) Both methods aim lead to the exclusion of
poor borrowers.

IJMSS Vol.03 Issue-09 (September, 2015) ISSN: 2321-1784 International Journal in Management and Social Science (Impact Factor- 4.358)
A Monthly Double-Blind Peer Reviewed Refereed Open Access International e-Journal - Included in the International Serial Directories
International Journal in Management and Social Science http://www.ijmr.net.in email id- [email protected] Page 111
institutions (MFIs) in poverty reduction still in question. Moreover the phenomena of over indebtedness customers in Andra Pradesh, morocco has extended the debate about the real contribution of microfinance as a tool of development. So the litterature of the current microfinance crisis raises many questions, including the issue of over-indebtedness, commercialization and mission drift. Actually microfinance is accused for commercial tendency and researches on mission drift are rising up. According to litterature: “Mission drift in microfinance arises when a MFI finds it profitable to reach out to unbanked wealthier individuals while at the same time crowding out poor clients (Beatriz Armend´ariz and Ariane Szafarz (2011): p342)3.
In this work we tried to provide an answer to the question concerning the commercialization of MFIs and its relation to targeting the poor in both SSA and MENA regions. In other words was microfinance in both regions (MENA and SSA) tending towards a commercial strategy? If this phenomena exists does it affects the mission of MFIs to reach the poor? In this case can we speak of a mission drift phenomenon among these MFIs in both regions? In the related literature, the non availability of an accurate measure of poverty alleviation leading researchers to the average loan size resort as an indicator or proxy for targeting poor by MFIs. However, this indicator does not constitute an effective and appropriate measure to characterize the depth of outreach. Before going through empirical analysis we will check some facts related the microfinance sectors in both regions.
A- microfinance in MENA
As fluently described by (Johannes Majewski: 2001)4: “Looking at microfinance in the MENA region, one gets a rather ambiguous picture. On the one side, the sector is characterized by high returns, good portfolio quality, and continuous growth. On the other side, leverage is amongst the lowest of the world. This emphasizes the issue that currently only two countries of the region (Yemen, Syria) have MFIs that are allowed to offer savings. Also, other products, like payments or micro insurance schemes are in a nascent stage with innovation taking up only slowly in this region. Furthermore, despite recent developments, the microfinance landscape is still largely dominated by NGOs5. While having experienced an impressive development in the past, by their pure nature, they face limitations when it comes to further growth as well as product diversification”.
At the end of 2008, there were 2.81 million microcredit borrowers, with a total loan portfolio of US$1.5 billion. Microcredit is concentrated in two countries Egypt and Morocco. In 2009 47 percent of the region’s microcredit borrowers were in Egypt and 33 percent in Morocco. According to (MIX, CGAP, Sanabel, 2010)6, Jordan
3 Beatriz Armendáriz and Ariane Szafarz (2011) On Mission Drift in Microfinance Institutions. The Handbook
of Microfinance: pp. 341-366. 4 Johannes Majewski: 2001”The Regulatory Framework for Microfinance in MENA”, CGAP 2011
5 MIX and Sanabel Analysis of Key Trend 2011 Middle East and North Africa Regional Snapshot March 2012
6 Sanabel, 2010, „Microfinance in the Arab Region: An Industry Update‟, May 2010, Sanabel: the Microfinance
Network of Arab Countries.
IJMSS Vol.03 Issue-09 (September, 2015) ISSN: 2321-1784 International Journal in Management and Social Science (Impact Factor- 4.358)
A Monthly Double-Blind Peer Reviewed Refereed Open Access International e-Journal - Included in the International Serial Directories
International Journal in Management and Social Science http://www.ijmr.net.in email id- [email protected] Page 112
has the highest microcredit coverage of its poor population in the region. Tunisia and Palestine have the only other microcredit sectors in the region, although microcredit is growing in scale in Yemen, Iraq, and Syria. .
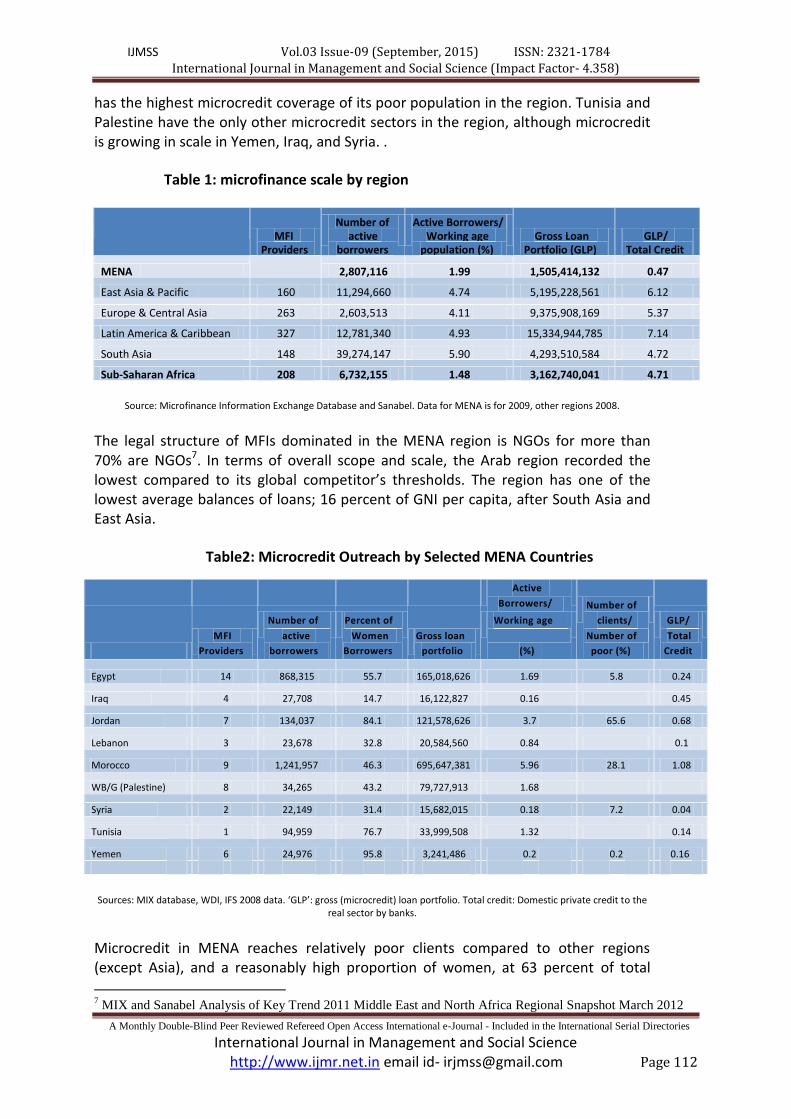
Table 1: microfinance scale by region
Number of Active Borrowers/ MFI active Working age Gross Loan GLP/
Providers borrowers population (%) Portfolio (GLP) Total Credit MENA 2,807,116 1.99 1,505,414,132 0.47 East Asia & Pacific 160 11,294,660 4.74 5,195,228,561 6.12 Europe & Central Asia 263 2,603,513 4.11 9,375,908,169 5.37 Latin America & Caribbean 327 12,781,340 4.93 15,334,944,785 7.14 South Asia 148 39,274,147 5.90 4,293,510,584 4.72 Sub-Saharan Africa 208 6,732,155 1.48 3,162,740,041 4.71
Source: Microfinance Information Exchange Database and Sanabel. Data for MENA is for 2009, other regions 2008.
The legal structure of MFIs dominated in the MENA region is NGOs for more than 70% are NGOs7. In terms of overall scope and scale, the Arab region recorded the lowest compared to its global competitor’s thresholds. The region has one of the lowest average balances of loans; 16 percent of GNI per capita, after South Asia and East Asia.
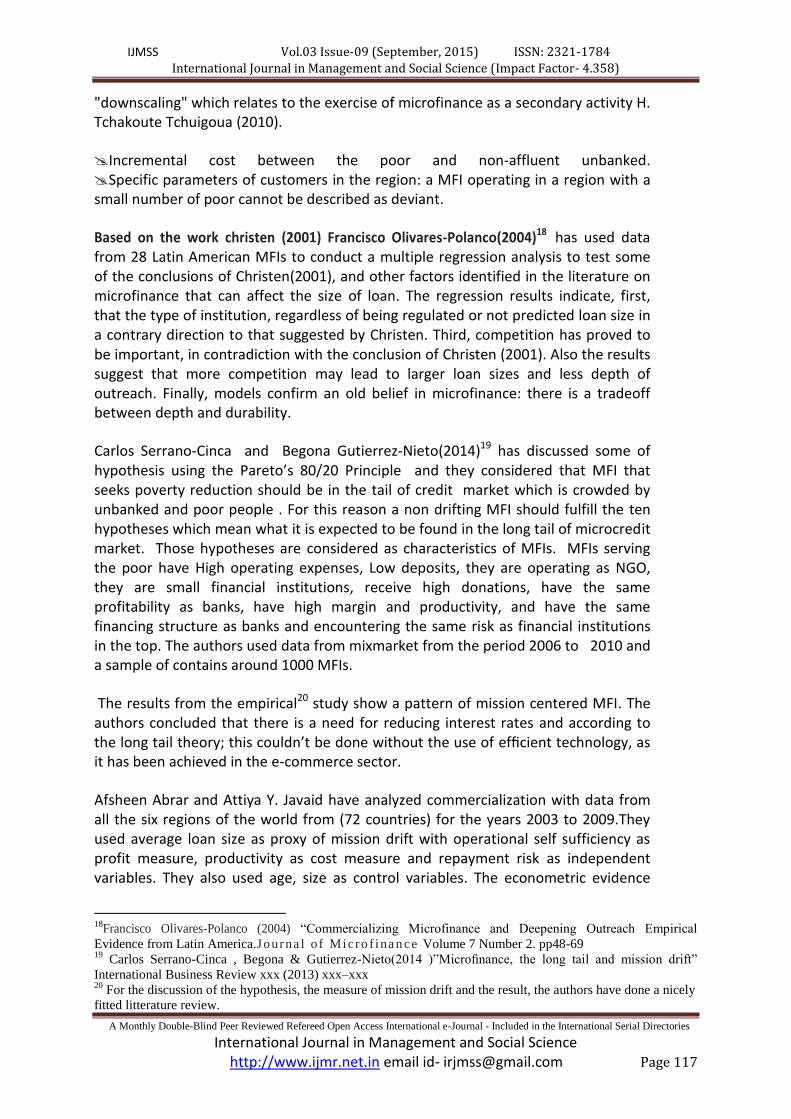
Table2: Microcredit Outreach by Selected MENA Countries
Active
Borrowers/ Number of
Number of Percent of Working age clients/ GLP/
MFI active Women Gross loan Number of Total Providers borrowers Borrowers portfolio (%) poor (%) Credit
Egypt 14 868,315 55.7 165,018,626 1.69 5.8 0.24
Iraq 4 27,708 14.7 16,122,827 0.16 0.45
Jordan 7 134,037 84.1 121,578,626 3.7 65.6 0.68
Lebanon 3 23,678 32.8 20,584,560 0.84 0.1
Morocco 9 1,241,957 46.3 695,647,381 5.96 28.1 1.08
WB/G (Palestine)
pppppppppp()(pa)
8 34,265 43.2 79,727,913 1.68
Syria 2 22,149 31.4 15,682,015 0.18 7.2 0.04
Tunisia 1 94,959 76.7 33,999,508 1.32 0.14
Yemen 6 24,976 95.8 3,241,486 0.2 0.2 0.16
Sources: MIX database, WDI, IFS 2008 data. ‘GLP’: gross (microcredit) loan portfolio. Total credit: Domestic private credit to the real sector by banks.
Microcredit in MENA reaches relatively poor clients compared to other regions (except Asia), and a reasonably high proportion of women, at 63 percent of total
7 MIX and Sanabel Analysis of Key Trend 2011 Middle East and North Africa Regional Snapshot March 2012

IJMSS Vol.03 Issue-09 (September, 2015) ISSN: 2321-1784 International Journal in Management and Social Science (Impact Factor- 4.358)
A Monthly Double-Blind Peer Reviewed Refereed Open Access International e-Journal - Included in the International Serial Directories
International Journal in Management and Social Science http://www.ijmr.net.in email id- [email protected] Page 113
microcredit borrowers. The proportion of women microcredit clients ranges from as low as 18 percent in Iraq, where female workforce participation has declined since the most recent conflict, to as high as 81 percent in Yemen and 83 percent in Jordan where many MFIs target women as part of their mission.
Table 3 compares 24 larger and better performing MFIs from across MENA with their counterparts globally, on outreach, gender, efficiency and portfolio quality. Before going though empirical framework, we will analyze some descriptive facts related to the microfinance sectors in both region.
B- microfinance in SSA
According to the 2011 report from Microfinance Information Exchange (MIX) and Consultative Group to Assist the Poor (CGAP) and despite accounting for only 8 percent of financial institution reporting to MIX, SSA has a great diversity of financial service providers that serve poor and low-income people. While there are many nonbank financial intermediaries (NBFCs), credit unions/financial cooperatives, banks serve one quarter of total borrowers and 40 percent of depositors in SSA,
The institutional differences across sub regions are, in part, explained by the specificity of the microfinance laws governing them. Te fest microfinance law (from 1993 to 2007), called “loi Parmec8”, for the eight countries of the West African Economic and Monetary Union (WAEMU), financial cooperatives only. Consequently, many microfinance providers in the sub region were compelled to select this legal form. Moreover, the first providers were created by the French and Canadian cooperative movements.
MFIs of SSA region tend toward large scale. Indeed, a third of providers of financial services in sub-Saharan Africa have reached large scale which means they have gross loan portfolio of over US $ 8 million. In 2009, these large-scale suppliers have reached more than 85 percent of all borrowers and depositors SSA. This percentage is higher than in East Asia and Pacific (EAP) and Latin America and the Caribbean (LAC) and about the same as Eastern Europe and Central Asia (ECA).
Table4: Volume and trend by region
Region/ Subregion
Borrowers thousands
Growth rate 2007-2008
Borrowers Growth rate 2007-2008
Borrowers thousand
Growth rate 2007-2008
Borrowers thousand
Growth rate 2007-2008
SSA 6,484 12% 3,089 26% 16573 40% 2,798 10%
central 269 21% 214 20% 719 120% 354 25%
Est 3,521 12% 1,481 35% 8501 330% 1,308 12%
austral 1006 14% 486 21% 1857 450% 236 -5%
Ouest 1,688 11% 908 17% 5479 560% 901 8%
Source: MIX Microfinance World: Sub-Saharan Africa Microfinance Analysis and Benchmarking Report 2010
8 A report from Microfinance Information Exchange (MIX) and Consultative Group to Assist the Poor (CGAP)
April 2011

IJMSS Vol.03 Issue-09 (September, 2015) ISSN: 2321-1784 International Journal in Management and Social Science (Impact Factor- 4.358)
A Monthly Double-Blind Peer Reviewed Refereed Open Access International e-Journal - Included in the International Serial Directories
International Journal in Management and Social Science http://www.ijmr.net.in email id- [email protected] Page 114
Only the Middle East and North Africa (MENA) and South Asia have a higher percentage of large suppliers. Among the large institutions, 38 percent are West Africa (half of which are credit / cooperative unions) and 38 Percent are in Eastern Africa (mainly banks or non-bank financial institutions). In the eight UEMOA countries, this trend will become more pronounced because the revised 2007 microfinance law calls for the consolidation of small suppliers. All types of institutions in sub-Saharan Africa offer voluntary savings products, are all banks and are cooperatives, 54 percent of NBFIs, and 29 percent of NGOs provide savings accounts. The voluntary savings offer is lower for non-bank financial institutions and NGOs as because of the regulations in many markets expressly limiting deposit mobilization, and they have traditionally followed a credit-based model. With 9.1 million depositors, banks serve more than 40 percent of sub-Saharan Africa Investor, followed by NBFIs and credit unions / financial cooperatives with 5.7 million depositors and 5.1, respectively.
According to the Afrique subsaharienne 2009 Benchmarking et analyse du secteur de la microfinance Avril 2010: microfinance in SSA is characterized by two facts, first the commercial tenancy and the large scale providers.
Fifty-seven percent of new institutions, the majority of which are NBFCs, are for-profit, compared to percent for young and mature financial service providers. Despite being fewer in number, for-profit providers accounted for over 70 percent of the total gross loan portfolio and 71 percent of total deposits in SSA in 2009, with banks alone accounting for 5percent of loan portfolio and 60 percent of deposits. Banks are experiencing the fastest growth in outreach to borrowers, with an increase of 25 percent from 2008 to 2009. Banks also experienced 8 percent increase in number of depositors, a growth second only to NBFCs’ 46 percent growth in the same. Credit unions/financial cooperatives and NBFCs accounted for 20 percent of gross loan portfolio, and 25 percent and 10 percent of deposits, respectively.
Large-scale providers play an important role in delivery of financial services One-third of financial service providers in SSA have reached large scale, that is, they have gross loan portfolios of more than US$8 million. In 2009 these large-scale providers reached over 85 percent of all SSA borrowers and all institutional types in SSA offer voluntary savings products—all banks and cooperatives, 54 percent of NBFIs, and 29 percent of NGOs provide savings accounts. It is not surprising that the offer of voluntary savings is lower for NBFIs and NGOs as regulations in many markets expressly restrict them from mobilizing deposits, and they have traditionally followed a credit-driven model. With 9.1 million depositors, banks serve over 40 percent of SSA’s savers, followed by NBFIs and credit union/ financial cooperatives with 5.7 and 5.1 million depositors, respectively.
Table4: Borrowers and depositors by sub region and charter type

IJMSS Vol.03 Issue-09 (September, 2015) ISSN: 2321-1784 International Journal in Management and Social Science (Impact Factor- 4.358)
A Monthly Double-Blind Peer Reviewed Refereed Open Access International e-Journal - Included in the International Serial Directories
International Journal in Management and Social Science http://www.ijmr.net.in email id- [email protected] Page 115
Source : Afrique subsaharienne 2009 Benchmarking et analyse du secteur de la microfinance Avril 2010
Most loans are classified as "micro" (microenterprise) and loans to households and have a term of less than one year. For non-bank financial institutions and NGOs, ready microenterprises account for 88 percent and 95 percent, respectively, of total
loans. Banks and cooperatives have a larger customer base of small businesses and households, and therefore consumer loans play a greater role in their portfolios. Cooperatives, for example, often have a deliberate strategy to target employees and officials to diversify risk and increase revenue. Microenterprise loans represent a smaller percentage of total loans for cooperatives as the development and growth of small businesses may not be the goal of these employees. The Consumer loans, on the other hand, are a larger part of total loans cooperatives because they can move towards easing typical daily expenses of employees, for example.
II-Empirical Litterature review:
As the premier source for microfinance data and analysis, Mixmarket9 uses several indicators as proxies of outreach. These indicators are classified into horizontal outreach and vertical one. The horizontal encompasses the Number of Active Borrowers, Number of Loans Outstanding, Gross Loan Portfolio, however, Percent of Women Borrowers, the depth of outrech englobe; the Average Loan Balance per Borrower, Average Loan Balance per Borrower/ GNI per Capita, Average Outstanding Balance Average Outstanding Balance/ GNI per Capita, Number of Voluntary Savers, Number of Voluntary Savings Accounts Voluntary Savings, Average Savings Balance per Saver, Average Savings Account Balance. According to the litterature on poverty reduction via microfinance a big average loan size means targeting wealthy Clients and a little one means that MFI is focusing on poor clients. However this indicator is not strong and it has been criticized for several reasons Polanco (2004)10. So the litterature use it deflated by the GNI to take the welfare and the inequality in consideration.
Differences in the size of loans found by Christen can be caused by the choice of strategy, maturity of the portfolio, client group, or a combination of these causes. Regarding the choice of strategy, Christen argued that "larger loans could simply be the result of deliberate strategy or choice of MFIs .All the oldest microfinance institutions and most established ones in Latin America began with an explicit
9 www.themix.org
10Francisco Olivares-Polanco (2004) “Commercializing Microfinance and Deepening Outreach Empirical
Evidence from Latin America.Journa l o f Micro f inance Volume 7 Number 2. pp48-69
rcategory central Eastern Southern West
Total
Borrowers Depositors Borrowers Depositors Borrowers Depositors Borrowers
Depositors Borrowers Depositors
Bank 10 109 955 6,506 903 1,801 127 722 1,892 91,39
Credit union /coppertaive
188 685 16 205 50 248 610 3,917 865 5,056
MBFI 108 154 3,161 4,671 57 184 377 3,522 5,654
NGO 68 85 386 424 98 65 835 1,159 1,388 1,732
total 374 1,033 4,519 11,806 1,171 2,171 1,757 6,571 7,771 21,582

IJMSS Vol.03 Issue-09 (September, 2015) ISSN: 2321-1784 International Journal in Management and Social Science (Impact Factor- 4.358)
A Monthly Double-Blind Peer Reviewed Refereed Open Access International e-Journal - Included in the International Serial Directories
International Journal in Management and Social Science http://www.ijmr.net.in email id- [email protected] Page 116
objective of creating jobs in the sector of urban microenterprise, so their initial mission did not reach the poorest of the poor.
The idea of commercialization of MFI goes back to the seminal work of christen (2001)11 when she analyzed the factors of commercialization in Latin America.
Therefore a MFI can choose to operate regulated or unregulated, and in this case a large loan size may simply reflect its own choice. Consequently a mature portfolio cannot always be interpreted as mission drift and may be just a natural evolution of the average balances of loans since NGOs turned into regulated financial institutions. As result, they are all engaged in incremental loans which are subsequently increased through short term. This is also strongly related with the age of institution Christen & al. (1995)12,
As the size of loan is considered as an indicator to percept the poverty intention reduction intention (Schreiner ; 200113 ; 200214 ), (Morduch (199915; 200016 ), it should be small. Thus the lower the average loan size the more the MFI penetrates poor layers. The depth of outreach is obtained by dividing this indicator by the per capita GNI to account for income levels. The more this indicator is low the more the MFI will have an impact on poor clients. De facto, if this indicator is growing up the MFI deviates from its mission to fight against poverty. According to Beatriz Armendariz & Szafarz Ariane (2011)17 several questionable conditions are making mission drift debatable.
Progressive Credit: "credit creeping" can be considered as sign of Mission gap. Indeed, the MFI can increase the average loan size over time, reducing the depth of outreach. But progressive credit, which is a natural consequence, is related to the idea of loyal client who can obtain larger amount after a good repayment records.
Cross-subsidization: there is a fine line between mission drift and cross-subsidization which implies reaching rich unbanked customers to fund a larger number of poor clients whose average loan size is relatively small. These two explanations are in line with the social objective of MFIs. This concept is called
11
Christen, R. P. (2001). Commercialization and mission drift. The transformation of microfinance in Latin
America (CGAP Occasional Paper No. 5). Washington, DC. 12
Christen, R. P., Rhyne, E., Vogel, R. C., & McKean, C. (1995). Maximizing the out reach of
microenterprise finance: An analysis of successful microfinance programs (USAID Program and Operations
Assessment Report No. 10). Washington, DC 13
Schreiner, M. (2001). Seven aspects of loan size. Journal of Microfinance, 3(2), 27–47; also available at
www.microfinance.com 14
Schreiner, M. (2002). Aspects of outreach: A framework for the discussion of the social benefits of
microfinance. Journal of International Development, 14(5), 591–603; also available at www.microfinance.com 15
Morduch, J. (1999). The microfinance promise. Journal of Economic Literature, 37(4), 1569–1614. 16
Morduch, J. (2000). The microfinance schism. World Development, 28 (4), 617. 17
Beatriz Armendariz & Ariane Szafarz (2011) “On Mission Drift in Microfinance Institutions » THE Handbook
of microfinance, pp. 341-366, B. Armendariz &M. Labie, eds., World Scientific Publishing, 2011
IJMSS Vol.03 Issue-09 (September, 2015) ISSN: 2321-1784 International Journal in Management and Social Science (Impact Factor- 4.358)
A Monthly Double-Blind Peer Reviewed Refereed Open Access International e-Journal - Included in the International Serial Directories
International Journal in Management and Social Science http://www.ijmr.net.in email id- [email protected] Page 117
"downscaling" which relates to the exercise of microfinance as a secondary activity H. Tchakoute Tchuigoua (2010).
Incremental cost between the poor and non-affluent unbanked. Specific parameters of customers in the region: a MFI operating in a region with a small number of poor cannot be described as deviant.
Based on the work christen (2001) Francisco Olivares-Polanco(2004)18 has used data from 28 Latin American MFIs to conduct a multiple regression analysis to test some of the conclusions of Christen(2001), and other factors identified in the literature on microfinance that can affect the size of loan. The regression results indicate, first, that the type of institution, regardless of being regulated or not predicted loan size in a contrary direction to that suggested by Christen. Third, competition has proved to be important, in contradiction with the conclusion of Christen (2001). Also the results suggest that more competition may lead to larger loan sizes and less depth of outreach. Finally, models confirm an old belief in microfinance: there is a tradeoff between depth and durability.
Carlos Serrano-Cinca and Begona Gutierrez-Nieto(2014)19 has discussed some of hypothesis using the Pareto’s 80/20 Principle and they considered that MFI that seeks poverty reduction should be in the tail of credit market which is crowded by unbanked and poor people . For this reason a non drifting MFI should fulfill the ten hypotheses which mean what it is expected to be found in the long tail of microcredit market. Those hypotheses are considered as characteristics of MFIs. MFIs serving the poor have High operating expenses, Low deposits, they are operating as NGO, they are small financial institutions, receive high donations, have the same profitability as banks, have high margin and productivity, and have the same financing structure as banks and encountering the same risk as financial institutions in the top. The authors used data from mixmarket from the period 2006 to 2010 and a sample of contains around 1000 MFIs.
The results from the empirical20 study show a pattern of mission centered MFI. The authors concluded that there is a need for reducing interest rates and according to the long tail theory; this couldn’t be done without the use of efficient technology, as it has been achieved in the e-commerce sector.
Afsheen Abrar and Attiya Y. Javaid have analyzed commercialization with data from all the six regions of the world from (72 countries) for the years 2003 to 2009.They used average loan size as proxy of mission drift with operational self sufficiency as profit measure, productivity as cost measure and repayment risk as independent variables. They also used age, size as control variables. The econometric evidence
18
Francisco Olivares-Polanco (2004) “Commercializing Microfinance and Deepening Outreach Empirical
Evidence from Latin America.Journa l o f Micro f inan ce Volume 7 Number 2. pp48-69 19
Carlos Serrano-Cinca , Begona & Gutierrez-Nieto(2014 )”Microfinance, the long tail and mission drift”
International Business Review xxx (2013) xxx–xxx 20
For the discussion of the hypothesis, the measure of mission drift and the result, the authors have done a nicely
fitted litterature review.
IJMSS Vol.03 Issue-09 (September, 2015) ISSN: 2321-1784 International Journal in Management and Social Science (Impact Factor- 4.358)
A Monthly Double-Blind Peer Reviewed Refereed Open Access International e-Journal - Included in the International Serial Directories
International Journal in Management and Social Science http://www.ijmr.net.in email id- [email protected] Page 118
using random effect estimation technique reveals that profitability and risk are positively related with average loan size whereas cost is in inverse relation with size of loan. The impact of age and size varies from region to region.
III-Empirical framework
In this section we will introduce the theoretical framework, defining the variables, the expected relations between dependant and independents variables and w discuss the result after.
A-Theoretical model and variables definition:
For this study, we will conduct multiple regression model to determine which of the eight variables predicts the loan size balance/GNI.
𝐴𝑉𝐿𝐵/𝐺𝑁𝐼𝑖𝑡 = 𝛼 + 𝛽1𝑂𝑆𝑆 𝑖𝑡 + 𝛽2𝑙𝑜𝑔𝐶𝑜𝑠𝑡 𝑖𝑡 + 𝛽3𝑟𝑖𝑠𝑘𝑖𝑡 + 𝛽4𝑠𝑐𝑎𝑙𝑒𝑖𝑡 + 𝛽5 𝑎𝑔𝑒𝑖𝑡 + 𝛽6𝑤𝑜𝑚𝑒𝑛𝑏𝑜𝑟𝑟𝑜𝑤𝑒𝑟𝑠 𝑖𝑡 + 𝛽7𝑙𝑒𝑔𝑎𝑙𝑠𝑡𝑎𝑡𝑢𝑠 𝑖𝑡 + 𝛽8𝑟𝑒𝑔𝑢𝑙𝑎𝑡𝑒𝑑 𝑖𝑡 + 𝛽9𝑟𝑒𝑔𝑖𝑜𝑛 𝑖𝑡+𝜀𝑖
In this model each of the variables is referring to consecutively:
AVLB/GNI: The pro poor school of the depth of outreach is the dependent variable of this model: according to the pro school, the size of credit granted is an indicator that means that the MFI reaches the poor. Thus, the smaller the credit size is the greater the target of the poor clients by the MFI. However, this idea has been criticized for the lack consistency and rigor. This indicator is emplaced by the Average loan balance per BORROWER / GNI which reflect the real wealth of the client. This indicator has been used in several social –financial performance nexus work efficiency and mission drift studies21.
Operational Self-sufficiency: literature states that the financial viability and outreach depth are perceived as conflicting objectives. The basic hypothesis states that small loans to the poor at a higher operating cost. Therefore, we assume that the greater the loan size the more profitable and sustainable is the institution. On this issue, Schreiner (2001) 22 advocates that the larger the loan usually means more profit for the lender, but less depth of outreach for the borrower. He added that the race for profits for the organization tends to improve all aspects of outreach, except perhaps depth "(Schreiner; 2002)23. However, this relation proves to compromise for some other authors who show that the social and financial ratings of MFIs are not in dichotomy and they goes in parallel.
21 Mersland, R and Strøm, R (2010). Microfinance mission drift? World Development, 38:28-36.
22
Schreiner, M. (2001). Seven aspects of loan size. Journal of Microfinance, 3(2), 27–47; also
available at www.microfinance.com 23
Schreiner, M. (2002). Aspects of outreach: A framework for the discussion of the social benefits of
microfinance. Journal of International Development, 14(5), 591–603; also available at www.microfinance.com
IJMSS Vol.03 Issue-09 (September, 2015) ISSN: 2321-1784 International Journal in Management and Social Science (Impact Factor- 4.358)
A Monthly Double-Blind Peer Reviewed Refereed Open Access International e-Journal - Included in the International Serial Directories
International Journal in Management and Social Science http://www.ijmr.net.in email id- [email protected] Page 119
The risk: to measure the degree of risk, we use the portfolio at risk (PAR 30) day) Portfolio at Risk > 30 Days: Outstanding balance, loans overdue> 30 Days/ Adjusted Gross Loan Portfolio.
The type of the microfinance institution: the type of the institution is supposed to have an impact on the depth of outreach. In other words the regulation of the MFI or not impacts the dependent variable. By comparing the size of credit regulated MFIs and unregulated Christeen in Latin America (2001) found significant differences in the credit size. This is explained by the fact that the regulated MFIs tend towards commercialization. To evaluate the effect of type of institution, we use a "dummy variable" as the unit of analysis is an NGO (0) or not (1).
The Age of the Institution: the years of operation are used to control the effect of time. In fact, Christen et al. (1995) consider that. "To judge whether an institution has achieved an extensive outreach awareness, comparisons should be made with other institutions achievements in terms of age of the program. In this case, the assumption would be more the institution is ancient the more the loan size is large. In this study we will focus on the opposition NGO Financial institution forms.
Womenborrowers: According to Naila Kabeer (2003:p26)24 "Poverty is 'gendered' because women and men experience poverty differently and unequally and become poor through different, though related, processes. Gender is measured by the percentage of clients in the portfolio. According to Isabelle Agier &Ariane Szafarz (2013)25 Most of the customers of microfinance institutions are female; and men and women do not benefit from the same credit conditions. The authors investigate this issue by presenting an original model and testing its predictions on an exceptional database comprising 34,000 loan applications from a Brazilian microfinance institution. The model determines the optimal loan size fixed by a gender-biased lender, depending on the borrower’s creditworthiness and the intensity of the lender’s bias. The empirical analysis detects no gender bias in loan denial, but uncovers disparate treatment with regard to credit conditions. In particular, they found a “glass ceiling” effect. The gender gap in loan size increases disproportionately with respect to the scale of the borrower’s project. The results are insensitive to the loan officer’s gender.
So it is assumed that the higher the percentage of women borrowers the higher the more the loan size is small. According to Labie et al. (2009); MFIs can practice some discrimination by targeting a specific population. This targeting is relative preference of MFIs who opts to serve special populations such as women and farmers on the
24
Naila Kabeer (2003)" Gender Mainstreaming in Poverty Eradication and the Millennium Development Goals
A handbook for policy-makers and other stakeholders". The Commonwealth Secretariat, 2003. ISBN: 0-85092-
752-8 25
Isabelle Agier &Ariane Szafarz (2013)25
“Microfinance and Gender: Is There a Glass Ceiling on Loan
Size? World Development Volume 42, February 2013, Pages 165–181
IJMSS Vol.03 Issue-09 (September, 2015) ISSN: 2321-1784 International Journal in Management and Social Science (Impact Factor- 4.358)
A Monthly Double-Blind Peer Reviewed Refereed Open Access International e-Journal - Included in the International Serial Directories
International Journal in Management and Social Science http://www.ijmr.net.in email id- [email protected] Page 120
basis of institutional imperatives This targeting can in turn distort loan sizes borrowers received some populations
Legal status variable: the legal status of the MFI is supposed to affect the average loan size and this because regulation is related to commercialization. Legal staus is also supposed to determine also performance of MFI: (Tchuigoua, 2011). 26
Scale: The questions regarding the diversion of MFIs away from their mission concern the relationship between the size of the MFI and its focus on the mission. We are asking if the MFIs continue to offer financial services to the poor when they reach a certain size. : It takes 0 if the MFI is large 1 otherwise.
Profit status variable: a dummy variable to match the data provided by mixmarket: it takes 0 if the MFI is non profit 1 if the MFI is for profit
The variable region is a dummy variable too used to indicate regulation among MFIs.
Finally the variable region is also a dummy variable used to categorize the tow region SSA and MENA.
The table below offers the accurate and breif description to the variable used
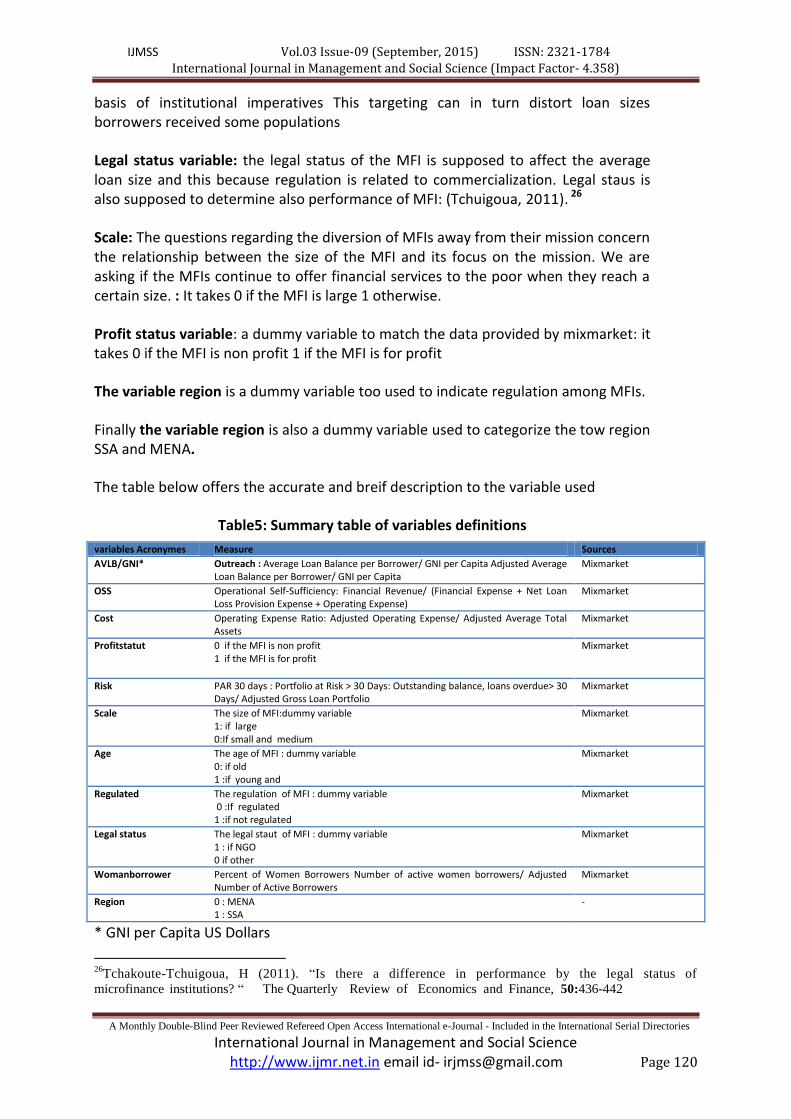
Table5: Summary table of variables definitions
variables Acronymes Measure Sources
AVLB/GNI* Outreach : Average Loan Balance per Borrower/ GNI per Capita Adjusted Average Loan Balance per Borrower/ GNI per Capita
Mixmarket
OSS Operational Self-Sufficiency: Financial Revenue/ (Financial Expense + Net Loan Loss Provision Expense + Operating Expense)
Mixmarket
Cost Operating Expense Ratio: Adjusted Operating Expense/ Adjusted Average Total Assets
Mixmarket
Profitstatut 0 if the MFI is non profit 1 if the MFI is for profit
Mixmarket
Risk PAR 30 days : Portfolio at Risk > 30 Days: Outstanding balance, loans overdue> 30 Days/ Adjusted Gross Loan Portfolio
Mixmarket
Scale The size of MFI:dummy variable 1: if large 0:If small and medium
Mixmarket
Age The age of MFI : dummy variable 0: if old 1 :if young and
Mixmarket
Regulated The regulation of MFI : dummy variable 0 :If regulated 1 :if not regulated
Mixmarket
Legal status The legal staut of MFI : dummy variable 1 : if NGO 0 if other
Mixmarket
Womanborrower Percent of Women Borrowers Number of active women borrowers/ Adjusted Number of Active Borrowers
Mixmarket
Region 0 : MENA 1 : SSA
-
* GNI per Capita US Dollars
26
Tchakoute-Tchuigoua, H (2011). “Is there a difference in performance by the legal status of
microfinance institutions? “ The Quarterly Review of Economics and Finance, 50:436-442
IJMSS Vol.03 Issue-09 (September, 2015) ISSN: 2321-1784 International Journal in Management and Social Science (Impact Factor- 4.358)
A Monthly Double-Blind Peer Reviewed Refereed Open Access International e-Journal - Included in the International Serial Directories
International Journal in Management and Social Science http://www.ijmr.net.in email id- [email protected] Page 121
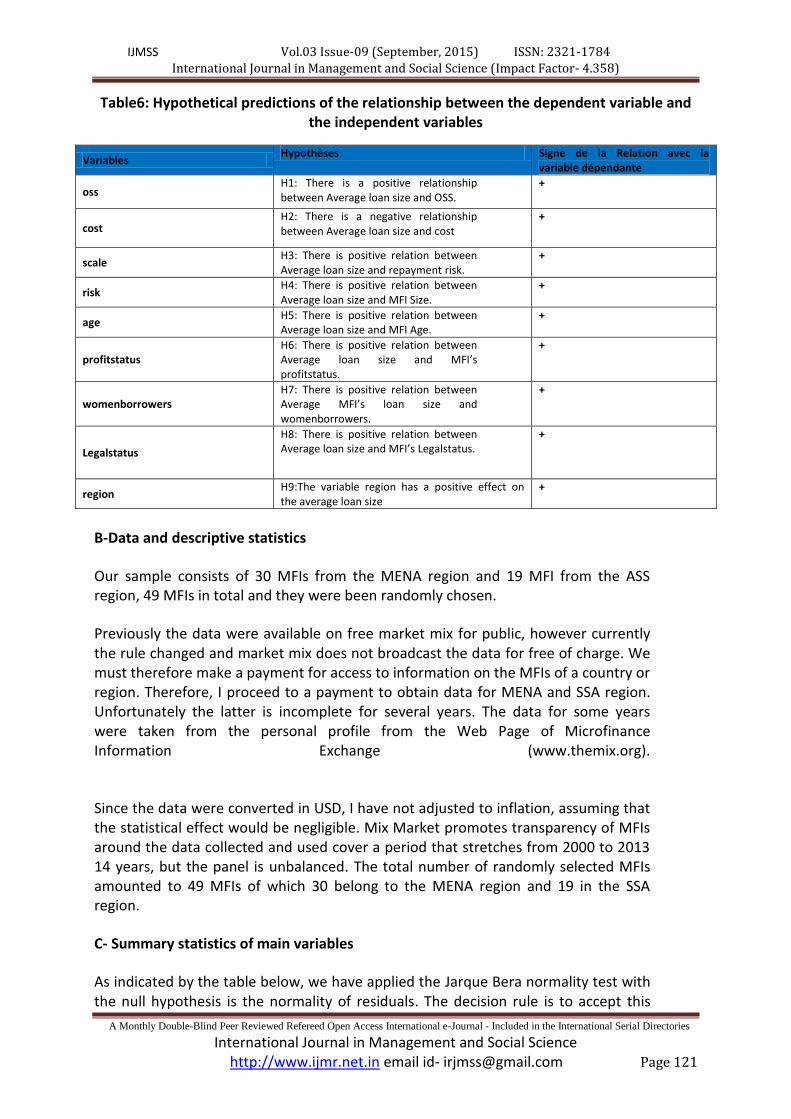
Table6: Hypothetical predictions of the relationship between the dependent variable and the independent variables
Variables Hypothèses Signe de la Relation avec la
variable dépendante
oss H1: There is a positive relationship between Average loan size and OSS.
+
cost H2: There is a negative relationship between Average loan size and cost
+
scale H3: There is positive relation between Average loan size and repayment risk.
+
risk H4: There is positive relation between Average loan size and MFI Size.
+
age H5: There is positive relation between Average loan size and MFI Age.
+
profitstatus H6: There is positive relation between Average loan size and MFI’s profitstatus.
+
womenborrowers H7: There is positive relation between Average MFI’s loan size and womenborrowers.
+
Legalstatus
H8: There is positive relation between Average loan size and MFI’s Legalstatus.
+
region H9:The variable region has a positive effect on the average loan size
+
B-Data and descriptive statistics
Our sample consists of 30 MFIs from the MENA region and 19 MFI from the ASS region, 49 MFIs in total and they were been randomly chosen.
Previously the data were available on free market mix for public, however currently the rule changed and market mix does not broadcast the data for free of charge. We must therefore make a payment for access to information on the MFIs of a country or region. Therefore, I proceed to a payment to obtain data for MENA and SSA region. Unfortunately the latter is incomplete for several years. The data for some years were taken from the personal profile from the Web Page of Microfinance Information Exchange (www.themix.org).
Since the data were converted in USD, I have not adjusted to inflation, assuming that the statistical effect would be negligible. Mix Market promotes transparency of MFIs around the data collected and used cover a period that stretches from 2000 to 2013 14 years, but the panel is unbalanced. The total number of randomly selected MFIs amounted to 49 MFIs of which 30 belong to the MENA region and 19 in the SSA region.
C- Summary statistics of main variables
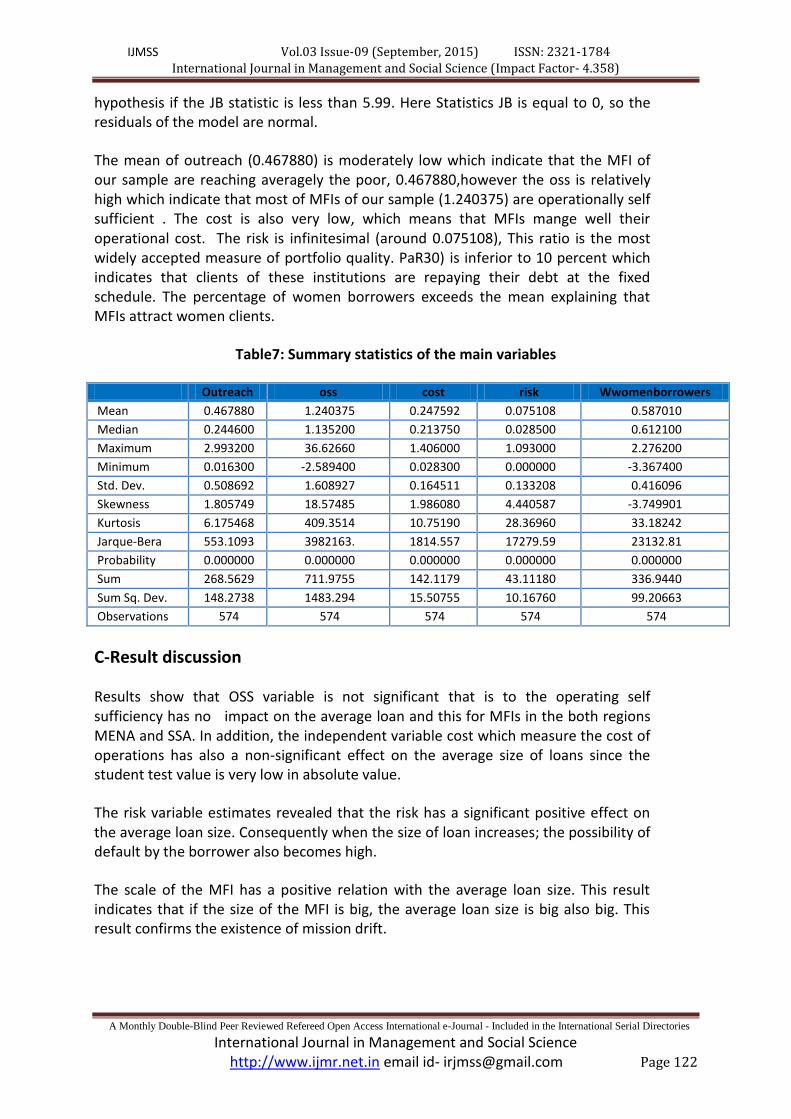
As indicated by the table below, we have applied the Jarque Bera normality test with the null hypothesis is the normality of residuals. The decision rule is to accept this
IJMSS Vol.03 Issue-09 (September, 2015) ISSN: 2321-1784 International Journal in Management and Social Science (Impact Factor- 4.358)
A Monthly Double-Blind Peer Reviewed Refereed Open Access International e-Journal - Included in the International Serial Directories
International Journal in Management and Social Science http://www.ijmr.net.in email id- [email protected] Page 122
hypothesis if the JB statistic is less than 5.99. Here Statistics JB is equal to 0, so the residuals of the model are normal.
The mean of outreach (0.467880) is moderately low which indicate that the MFI of our sample are reaching averagely the poor, 0.467880,however the oss is relatively high which indicate that most of MFIs of our sample (1.240375) are operationally self sufficient . The cost is also very low, which means that MFIs mange well their operational cost. The risk is infinitesimal (around 0.075108), This ratio is the most widely accepted measure of portfolio quality. PaR30) is inferior to 10 percent which indicates that clients of these institutions are repaying their debt at the fixed schedule. The percentage of women borrowers exceeds the mean explaining that MFIs attract women clients.
Table7: Summary statistics of the main variables
Outreach oss cost risk Wwomenborrowers
Mean 0.467880 1.240375 0.247592 0.075108 0.587010
Median 0.244600 1.135200 0.213750 0.028500 0.612100
Maximum 2.993200 36.62660 1.406000 1.093000 2.276200
Minimum 0.016300 -2.589400 0.028300 0.000000 -3.367400
Std. Dev. 0.508692 1.608927 0.164511 0.133208 0.416096
Skewness 1.805749 18.57485 1.986080 4.440587 -3.749901
Kurtosis 6.175468 409.3514 10.75190 28.36960 33.18242
Jarque-Bera 553.1093 3982163. 1814.557 17279.59 23132.81
Probability 0.000000 0.000000 0.000000 0.000000 0.000000
Sum 268.5629 711.9755 142.1179 43.11180 336.9440
Sum Sq. Dev. 148.2738 1483.294 15.50755 10.16760 99.20663
Observations 574 574 574 574 574
C-Result discussion
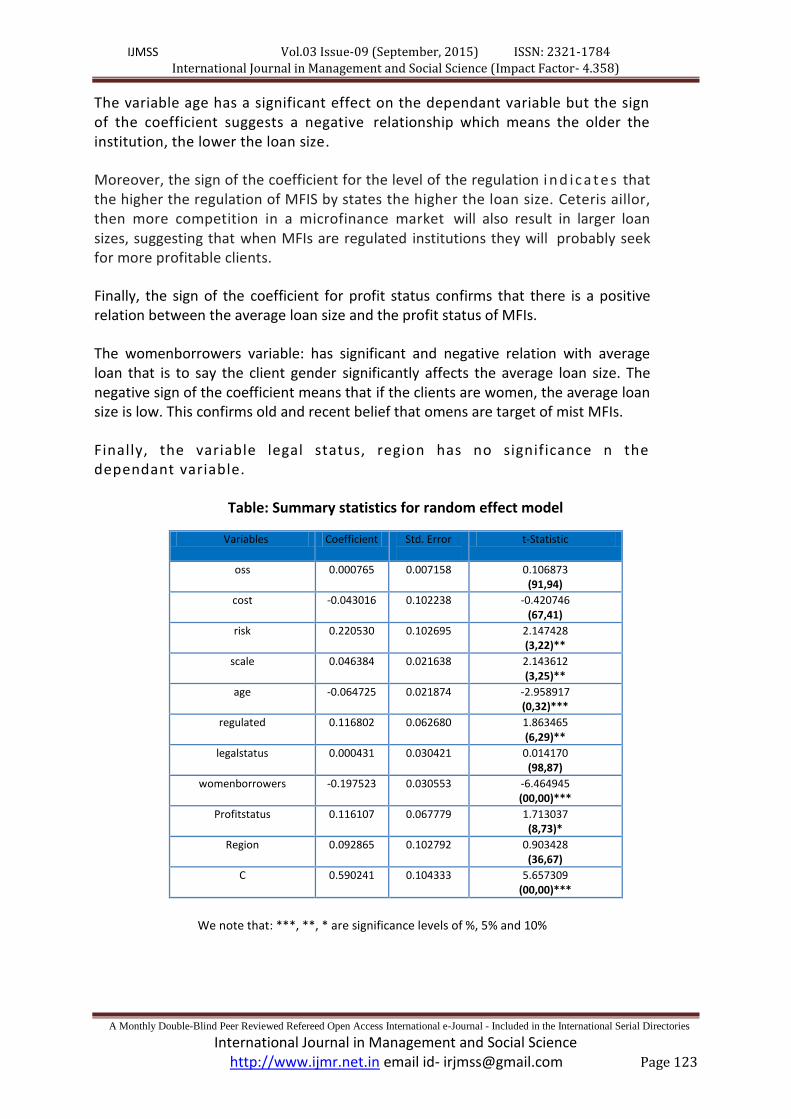
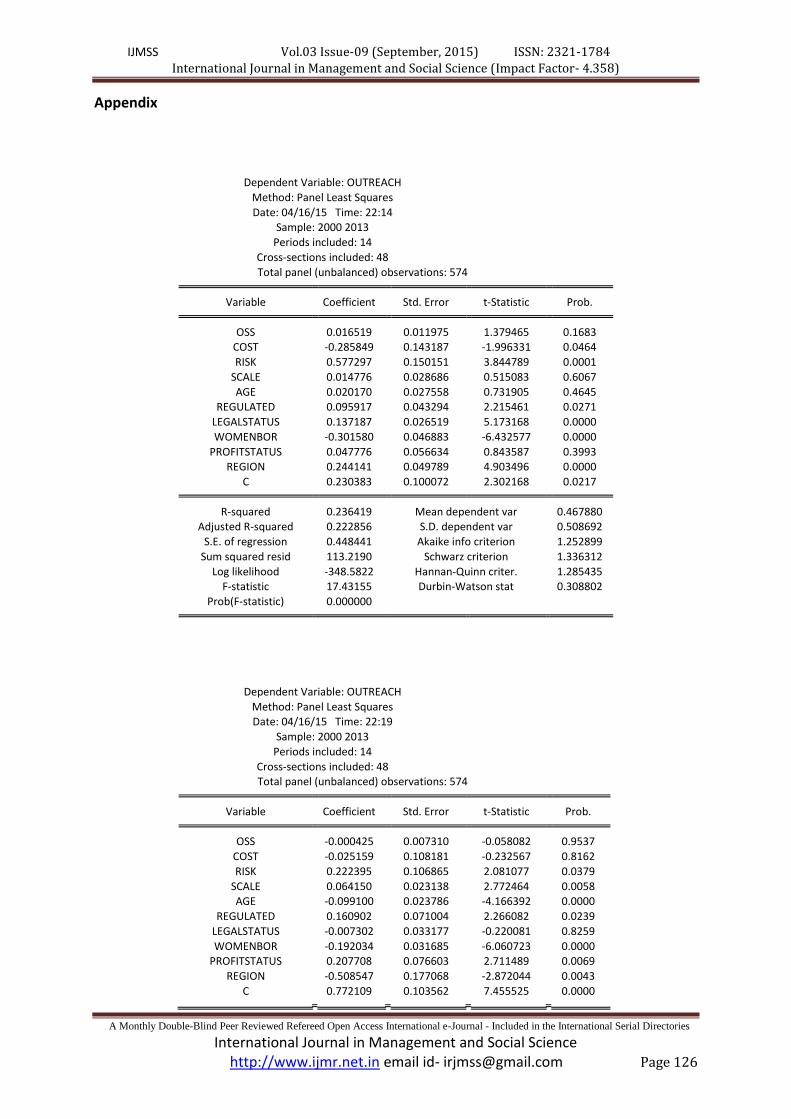
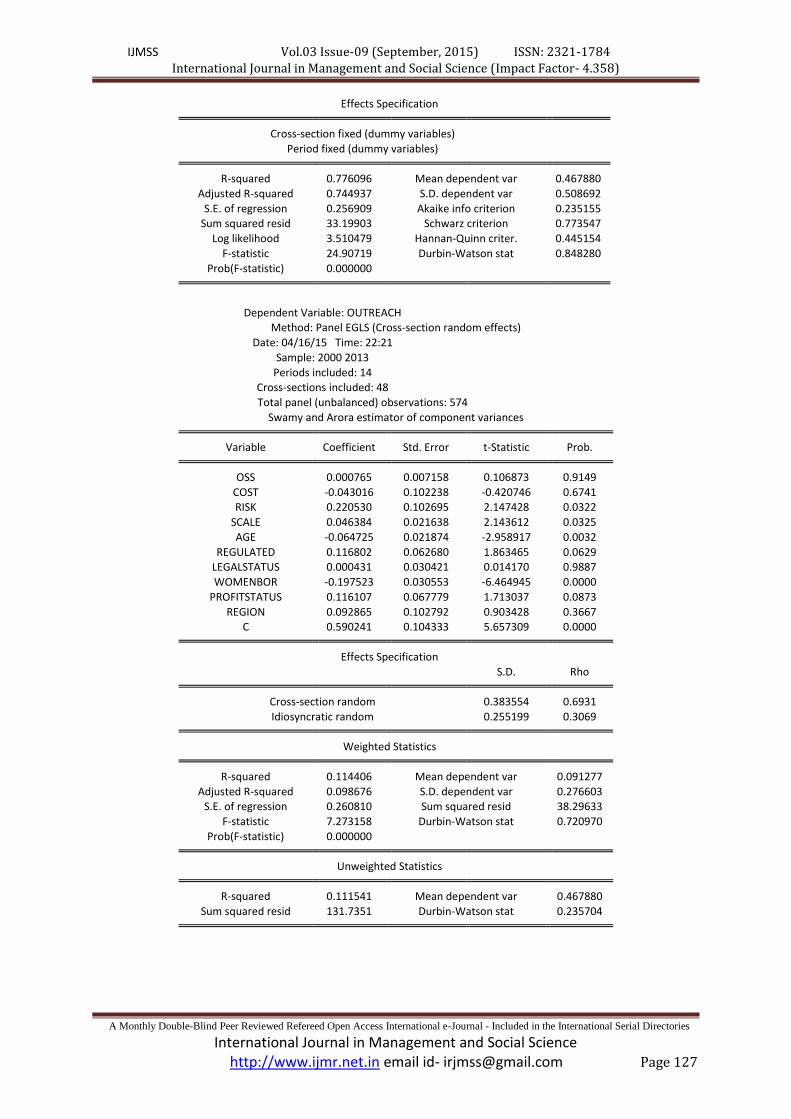
Results show that OSS variable is not significant that is to the operating self sufficiency has no impact on the average loan and this for MFIs in the both regions MENA and SSA. In addition, the independent variable cost which measure the cost of operations has also a non-significant effect on the average size of loans since the student test value is very low in absolute value.
The risk variable estimates revealed that the risk has a significant positive effect on the average loan size. Consequently when the size of loan increases; the possibility of default by the borrower also becomes high.
The scale of the MFI has a positive relation with the average loan size. This result indicates that if the size of the MFI is big, the average loan size is big also big. This result confirms the existence of mission drift.
IJMSS Vol.03 Issue-09 (September, 2015) ISSN: 2321-1784 International Journal in Management and Social Science (Impact Factor- 4.358)
A Monthly Double-Blind Peer Reviewed Refereed Open Access International e-Journal - Included in the International Serial Directories
International Journal in Management and Social Science http://www.ijmr.net.in email id- [email protected] Page 123
The variable age has a significant effect on the dependant variable but the sign of the coefficient suggests a negative relationship which means the older the institution, the lower the loan size.
Moreover, the sign of the coefficient for the level of the regulation i n d ic a t e s that the higher the regulation of MFIS by states the higher the loan size. Ceteris aillor, then more competition in a microfinance market will also result in larger loan sizes, suggesting that when MFIs are regulated institutions they will probably seek for more profitable clients.
Finally, the sign of the coefficient for profit status confirms that there is a positive relation between the average loan size and the profit status of MFIs.
The womenborrowers variable: has significant and negative relation with average loan that is to say the client gender significantly affects the average loan size. The negative sign of the coefficient means that if the clients are women, the average loan size is low. This confirms old and recent belief that omens are target of mist MFIs.
Finally, the variable legal status, region has no significance n the dependant variable.
Table: Summary statistics for random effect model
Variables Coefficient Std. Error
t-Statistic
oss 0.000765 0.007158 0.106873 (91,94)
cost -0.043016 0.102238 -0.420746 (67,41)
risk 0.220530 0.102695 2.147428 (3,22)**
scale 0.046384 0.021638 2.143612 (3,25)**
age -0.064725 0.021874 -2.958917 (0,32)***
regulated 0.116802 0.062680 1.863465 (6,29)**
legalstatus 0.000431 0.030421 0.014170 (98,87)
womenborrowers -0.197523 0.030553 -6.464945 (00,00)***
Profitstatus 0.116107 0.067779 1.713037 (8,73)*
Region 0.092865 0.102792 0.903428 (36,67)
C 0.590241 0.104333 5.657309 (00,00)***
We note that: ***, **, * are significance levels of %, 5% and 10%

IJMSS Vol.03 Issue-09 (September, 2015) ISSN: 2321-1784 International Journal in Management and Social Science (Impact Factor- 4.358)
A Monthly Double-Blind Peer Reviewed Refereed Open Access International e-Journal - Included in the International Serial Directories
International Journal in Management and Social Science http://www.ijmr.net.in email id- [email protected] Page 124
IIII- Conclusion:
If MFIs are lending to the poor, they have not to drift from their mission. But what is really happening is the opposite when some of them have been commercialized and then drifted from their mission. The theoretical framework of this study is based on an OLS panel data model to check some determinants of the poverty proxy measured by ALB/GNI. The results show mitigated facts when some variables predict well the dependant variable, some other where negatively correlated with the variable outreach and other are insignificant at all.
From organizational, legal and geographical point of view microfinance is a vague term and heterogeneous for the following raisons: MFIs operate in different regions and are thus exposed to different diets and laws. MFIs take several forms; some operate as NGOs or cooperatives while others operate as banks; some MFIs focused on credit supply only while others are diversifying their products by offering a wide range of financial service. ;some MFIs are old while other are very young .Therefore, expecting the same financial and social result is an almost absurd aspiration. According to Philippe Louis et al (2013)27 academic research should capture the heterogeneity among the MFIs for not reaching biased results. On this logic, MFIs should not be putted in one basket or under the same microscope.
Finally, we attempt first to enlarge the sample to cover all the MFIs. Also we attempt to study other additional determinants of loan size, such as urban/rural scope, saving, importance of non financial products, or business strategies for microfinance operations such as downscaling, upscaling, etc.) , by addressing questionnaires to MFIs to get in depth cracterestics. Consequently, these results should not be generalized to both regions, because these institutions do not represent all the MFIs in the Arab region neither for the SSA region. Wherefore Microcredit is part of microfinance, which provides a wider range of financial services, especially savings accounts, to the poor, we cannot judge the whole sector for a part of the service delivered.
References
Beatriz Armendariz & Ariane Szafarz (2011) “On Mission Drift in Microfinance Institutions » THE Handbook of microfinance, pp. 341-366, B. Armendariz &M. Labie, eds., World Scientific Publishing, 2011
Beatriz Armendáriz and Ariane Szafarz (2011) On Mission Drift in Microfinance Institutions. The Handbook of Microfinance: pp. 341-366.
Carlos Serrano-Cinca , Begona & Gutierrez-Nieto(2014 )”Microfinance, the long tail and mission drift” International Business Review xxx (2013) xxx–xxx
27
Philippe Louis & al (2013) « financial efficiency and social impact of microfinance institutions using self
organizing maps. World Development, Vol.46, pp.197-210 (2013)
IJMSS Vol.03 Issue-09 (September, 2015) ISSN: 2321-1784 International Journal in Management and Social Science (Impact Factor- 4.358)
A Monthly Double-Blind Peer Reviewed Refereed Open Access International e-Journal - Included in the International Serial Directories
International Journal in Management and Social Science http://www.ijmr.net.in email id- [email protected] Page 125
Christen, R. P. (2001). Commercialization and mission drift. The transformation of microfinance in Latin America (CGAP Occasional Paper No. 5). Washington, DC.
Christen, R. P., Rhyne, E., Vogel, R. C., & McKean, C. (1995). Maximizing the outreach of microenterprise finance: An analysis of successful microfinance programs (USAID Program and Operations Assessment Report No. 10). Washington, DC
Francisco Olivares-Polanco (2004) “Commercializing Microfinance and Deepening Outreach Empirical Evidence from Latin America.Journal of Microf inance Volume 7 Number 2. pp48-69
Isabelle Agier &Ariane Szafarz (2013)1 “Microfinance and Gender: Is There a Glass Ceiling on Loan Size? World Development Volume 42, February 2013, Pages 165–181
Mersland, R and Strøm, R (2010). Microfinance mission drift? World Development, 38:28-36.
MIX and Sanabel Analysis of Key Trend 2011 Middle East and North Africa Regional Snapshot March 2012
Morduch, J. (1999). The microfinance promise. Journal of Economic Literature, 37(4), 1569–1614.
Morduch, J. (2000). The microfinance schism. World Development, 28 (4), 617.
Naila Kabeer (2003)" Gender Mainstreaming in Poverty Eradication and the Millennium Development Goals A handbook for policy-makers and other stakeholders". The Commonwealth Secretariat, 2003. ISBN: 0-85092-752-8
Schreiner, M. (2001). Seven aspects of loan size. Journal of Microfinance, 3(2), 27–47; also available at www.microfinance.com
Schreiner, M. (2002). Aspects of outreach: A framework for the discussion of the social benefits of microfinance. Journal of International Development, 14(5), 591–603; also available at www.microfinance.com
Sanabel, 2010, ‘Microfinance in the Arab Region: An Industry Update’, May 2010, Sanabel: the Microfinance Network of Arab Countries.
Tchakoute-Tchuigoua, H (2011). “Is there a difference in performance by the legal status of microfinance institutions? “The Quarterly Review of Economics and Finance, 50:436-442
IJMSS Vol.03 Issue-09 (September, 2015) ISSN: 2321-1784 International Journal in Management and Social Science (Impact Factor- 4.358)
A Monthly Double-Blind Peer Reviewed Refereed Open Access International e-Journal - Included in the International Serial Directories
International Journal in Management and Social Science http://www.ijmr.net.in email id- [email protected] Page 126
Appendix
Dependent Variable: OUTREACH
Method: Panel Least Squares
Date: 04/16/15 Time: 22:14 Sample: 2000 2013
Periods included: 14
Cross-sections included: 48
Total panel (unbalanced) observations: 574 Variable Coefficient Std. Error t-Statistic Prob. OSS 0.016519 0.011975 1.379465 0.1683
COST -0.285849 0.143187 -1.996331 0.0464
RISK 0.577297 0.150151 3.844789 0.0001
SCALE 0.014776 0.028686 0.515083 0.6067
AGE 0.020170 0.027558 0.731905 0.4645 REGULATED 0.095917 0.043294 2.215461 0.0271
LEGALSTATUS 0.137187 0.026519 5.173168 0.0000
WOMENBOR -0.301580 0.046883 -6.432577 0.0000
PROFITSTATUS 0.047776 0.056634 0.843587 0.3993 REGION 0.244141 0.049789 4.903496 0.0000
C 0.230383 0.100072 2.302168 0.0217 R-squared 0.236419 Mean dependent var 0.467880
Adjusted R-squared 0.222856 S.D. dependent var 0.508692
S.E. of regression 0.448441 Akaike info criterion 1.252899
Sum squared resid 113.2190 Schwarz criterion 1.336312
Log likelihood -348.5822 Hannan-Quinn criter. 1.285435 F-statistic 17.43155 Durbin-Watson stat 0.308802
Prob(F-statistic) 0.000000
Dependent Variable: OUTREACH
Method: Panel Least Squares Date: 04/16/15 Time: 22:19
Sample: 2000 2013
Periods included: 14
Cross-sections included: 48 Total panel (unbalanced) observations: 574
Variable Coefficient Std. Error t-Statistic Prob. OSS -0.000425 0.007310 -0.058082 0.9537
COST -0.025159 0.108181 -0.232567 0.8162
RISK 0.222395 0.106865 2.081077 0.0379
SCALE 0.064150 0.023138 2.772464 0.0058 AGE -0.099100 0.023786 -4.166392 0.0000
REGULATED 0.160902 0.071004 2.266082 0.0239
LEGALSTATUS -0.007302 0.033177 -0.220081 0.8259
WOMENBOR -0.192034 0.031685 -6.060723 0.0000 PROFITSTATUS 0.207708 0.076603 2.711489 0.0069
REGION -0.508547 0.177068 -2.872044 0.0043
C 0.772109 0.103562 7.455525 0.0000
IJMSS Vol.03 Issue-09 (September, 2015) ISSN: 2321-1784 International Journal in Management and Social Science (Impact Factor- 4.358)
A Monthly Double-Blind Peer Reviewed Refereed Open Access International e-Journal - Included in the International Serial Directories
International Journal in Management and Social Science http://www.ijmr.net.in email id- [email protected] Page 127
Effects Specification Cross-section fixed (dummy variables)
Period fixed (dummy variables) R-squared 0.776096 Mean dependent var 0.467880
Adjusted R-squared 0.744937 S.D. dependent var 0.508692
S.E. of regression 0.256909 Akaike info criterion 0.235155 Sum squared resid 33.19903 Schwarz criterion 0.773547
Log likelihood 3.510479 Hannan-Quinn criter. 0.445154
F-statistic 24.90719 Durbin-Watson stat 0.848280
Prob(F-statistic) 0.000000 Dependent Variable: OUTREACH
Method: Panel EGLS (Cross-section random effects)
Date: 04/16/15 Time: 22:21
Sample: 2000 2013
Periods included: 14 Cross-sections included: 48
Total panel (unbalanced) observations: 574
Swamy and Arora estimator of component variances Variable Coefficient Std. Error t-Statistic Prob. OSS 0.000765 0.007158 0.106873 0.9149
COST -0.043016 0.102238 -0.420746 0.6741 RISK 0.220530 0.102695 2.147428 0.0322
SCALE 0.046384 0.021638 2.143612 0.0325
AGE -0.064725 0.021874 -2.958917 0.0032
REGULATED 0.116802 0.062680 1.863465 0.0629 LEGALSTATUS 0.000431 0.030421 0.014170 0.9887
WOMENBOR -0.197523 0.030553 -6.464945 0.0000
PROFITSTATUS 0.116107 0.067779 1.713037 0.0873
REGION 0.092865 0.102792 0.903428 0.3667 C 0.590241 0.104333 5.657309 0.0000 Effects Specification
S.D. Rho Cross-section random 0.383554 0.6931
Idiosyncratic random 0.255199 0.3069 Weighted Statistics R-squared 0.114406 Mean dependent var 0.091277
Adjusted R-squared 0.098676 S.D. dependent var 0.276603 S.E. of regression 0.260810 Sum squared resid 38.29633
F-statistic 7.273158 Durbin-Watson stat 0.720970
Prob(F-statistic) 0.000000 Unweighted Statistics R-squared 0.111541 Mean dependent var 0.467880
Sum squared resid 131.7351 Durbin-Watson stat 0.235704

IJMSS Vol.03 Issue-09 (September, 2015) ISSN: 2321-1784 International Journal in Management and Social Science (Impact Factor- 4.358)
A Monthly Double-Blind Peer Reviewed Refereed Open Access International e-Journal - Included in the International Serial Directories
International Journal in Management and Social Science http://www.ijmr.net.in email id- [email protected] Page 128
Correlated Random Effects - Hausman Test
Equation: Untitled
Test cross-section random effects Test Summary Chi-Sq. Statistic Chi-Sq. d.f. Prob. Cross-section random 31.814889 10 0.0004
Outreach oss cost risk scale Age Rregulated
legalstatus Wwomenborrowers
Profitstatus
Mean 0.467880 1.240375 0.247592 0.075108 2.003484 2.449477 0.325784 1.634146 0.587010 0.174216
Median 0.244600 1.135200 0.213750 0.028500 2.000000 3.000000 0.000000 1.000000 0.612100 0.000000
Maximum 2.993200 36.62660 1.406000 1.093000 3.000000 3.000000 1.000000 3.000000 2.276200 1.000000
Minimum 0.016300 -2.589400 0.028300 0.000000 1.000000 1.000000 0.000000 1.000000 -3.367400 0.000000
Std. Dev. 0.508692 1.608927 0.164511 0.133208 0.847945 0.763517 0.469076 0.787302 0.416096 0.379626
Skewness 1.805749 18.57485 1.986080 4.440587 -0.006608 -0.959689 0.743453 0.744247 -3.749901 1.717839
Kurtosis 6.175468 409.3514 10.75190 28.36960 1.393258 2.373256 1.552723 2.005619 33.18242 3.950970
Jarque-Bera 553.1093 3982163. 1814.557 17279.59 61.74790 97.50400 102.9733 76.63874 23132.81 303.9384
Probability 0.000000 0.000000 0.000000 0.000000 0.000000 0.000000 0.000000 0.000000 0.000000 0.000000
Sum 268.5629 711.9755 142.1179 43.11180 1150.000 1406.000 187.0000 938.0000 336.9440 100.0000
Sum Sq. Dev. 148.2738 1483.294 15.50755 10.16760 411.9930 334.0348 126.0784 355.1707 99.20663 82.57840
Observations 574 574 574 574 574 574 574 574 574 574