publication details, including instructions for authors ... · over a freeway (representing divided...
TRANSCRIPT

This article was downloaded by: [University of Central Florida]On: 16 July 2012, At: 09:01Publisher: Taylor & FrancisInforma Ltd Registered in England and Wales Registered Number: 1072954 Registered office: Mortimer House,37-41 Mortimer Street, London W1T 3JH, UK
Journal of Intelligent Transportation Systems:Technology, Planning, and OperationsPublication details, including instructions for authors and subscription information:http://www.tandfonline.com/loi/gits20
Driver Behavior and Preferences for ChangeableMessage Signs and Variable Speed Limits in ReducedVisibility ConditionsHany M. Hassan a b , Mohamed A. Abdel-Aty a , Keechoo Choi c & Saad A. Algadhi ba University of Central Florida, Department of Civil, Environmental, and ConstructionEngineering, Orlando, Florida, USAb King Saud University, Prince Mohamed Bin Naif Chair for Traffic Safety Research, Riyadh,Saudi Arabiac Ajou University, Department of Transportation Engineering, Woncheon-Dong, Youngtong-Ku,Suwon, Korea
Accepted author version posted online: 11 May 2012. Version of record first published: 10Jul 2012
To cite this article: Hany M. Hassan, Mohamed A. Abdel-Aty, Keechoo Choi & Saad A. Algadhi (2012): Driver Behavior andPreferences for Changeable Message Signs and Variable Speed Limits in Reduced Visibility Conditions, Journal of IntelligentTransportation Systems: Technology, Planning, and Operations, 16:3, 132-146
To link to this article: http://dx.doi.org/10.1080/15472450.2012.691842
PLEASE SCROLL DOWN FOR ARTICLE
Full terms and conditions of use: http://www.tandfonline.com/page/terms-and-conditions
This article may be used for research, teaching, and private study purposes. Any substantial or systematicreproduction, redistribution, reselling, loan, sub-licensing, systematic supply, or distribution in any form toanyone is expressly forbidden.
The publisher does not give any warranty express or implied or make any representation that the contentswill be complete or accurate or up to date. The accuracy of any instructions, formulae, and drug doses shouldbe independently verified with primary sources. The publisher shall not be liable for any loss, actions, claims,proceedings, demand, or costs or damages whatsoever or howsoever caused arising directly or indirectly inconnection with or arising out of the use of this material.

Journal of Intelligent Transportation Systems, 16(3):132–146, 2012Copyright C©© Taylor and Francis Group, LLCISSN: 1547-2450 print / 1547-2442 onlineDOI: 10.1080/15472450.2012.691842
Driver Behavior and Preferencesfor Changeable Message Signsand Variable Speed Limitsin Reduced Visibil ity Conditions
HANY M. HASSAN,1,2 MOHAMED A. ABDEL-ATY,1 KEECHOO CHOI,3
and SAAD A. ALGADHI2
1University of Central Florida, Department of Civil, Environmental, and Construction Engineering, Orlando, Florida, USA2King Saud University, Prince Mohamed Bin Naif Chair for Traffic Safety Research, Riyadh, Saudi Arabia3Ajou University, Department of Transportation Engineering, Woncheon-Dong, Youngtong-Ku, Suwon, Korea
This article investigates the factors affecting drivers’ stated behavior in adverse visibility conditions and examines whetherdrivers rely on and follow advisory or warning messages displayed on portable changeable message signs (CMS) and/orvariable speed limit (VSL) signs in different visibility and traffic conditions, and on two types of roadways: freewaysand two-lane roads. A multiple-approach survey was designed to collect opinions and stated data from Central Floridadrivers. Categorical data analysis techniques such as conditional distribution, odds ratio, and chi-squared tests were ap-plied. In addition, two modeling approaches, bivariate and multivariate probit models, were estimated. The results revealedthat gender, age, road type, visibility condition, and familiarity with VSL sign were the significant factors affecting thestated likelihood of reducing speed following CMS/VSL instructions in reduced visibility conditions. Other objectives ofthis study were to determine the content of messages that would achieve the best perceived safety and drivers’ com-pliance and to examine the best way to improve safety during these adverse visibility conditions. The results indicatedthat respondents thought that “Caution–fog ahead–reduce speed” was the best message and that using that CMS andVSL signs together was the best way to improve safety during such inclement weather situations. Based on the find-ings of the present study, several recommendations are suggested as guidelines to improve safety in reduced visibilityconditions.
Keywords Changeable Message Signs; Variable Speed Limit; Reduced Visibility; Driver Behavior; Probit Model
INTRODUCTION
Inclement weather events such as fog/smoke (FS), heavyrain (HR), high winds, and so on affect every road by impactingpavement conditions, vehicle performances, visibility distances,and drivers’ behavior. Moreover, they affect travel demand, traf-fic safety, and traffic flow characteristics. Visibility in particu-
The authors thank those who participated in the survey study and the anony-mous referees for their invaluable suggestions and comments on this work.The third author contributed to this work while supported by a National Re-search Foundation of Korea grant funded by the Korea government (MEST)(NRF-2010–0029446).
Address correspondence to Hany M. Hassan, King Saud University, PO Box800, Riyadh 11421, Saudi Arabia. E-mail: [email protected]
lar is critical to the task of driving, and reduction in visibilitydue to FS or other weather events such as HR is a major fac-tor affecting safety and proper traffic operation. Data queriedfrom the Fatality Analysis Reporting System (FARS) show that3,729 fatal crashes that occurred in the United States between2000 and 2007 were mainly due to the FS factor. Florida wasthe third state, after California and Texas, in fatal crashes dueto FS with 299 fatal crashes. Although the percentage of FS-related crashes is small compared to crashes that occurred atclear visibility conditions, these crashes tend to be more severeand involve multiple vehicles. The most recent example of fog-related crashes happened in Florida was on I-4 in Polk County inJanuary 2008, resulting in a 70-vehicle pile-up. This multivehi-cle crash caused five fatalities, many injuries, and shutting downI-4 for extended time.
132
Dow
nloa
ded
by [
Uni
vers
ity o
f C
entr
al F
lori
da]
at 0
9:01
16
July
201
2
PREFERENCES IN REDUCED VISIBILITY CONDITIONS 133
Thus, there is a need to detect any reduction in visibilityand develop ways to convey warnings to drivers in an effectiveway. A real-time measurement of visibility and/or understand-ing drivers’ responses when the visibility falls below certainacceptable level may be helpful in reducing the chances ofvisibility-related crashes.
This study aims at gaining better understanding of drivers’likely behavior under different visibility and traffic conditionsover a freeway (representing divided multilane facilities) anda two-lane road. The data used for analysis were obtainedfrom a self-reported questionnaire survey carried out for 566drivers in Central Florida. Different survey forms were de-signed to reflect the two roadway types. The survey was deliv-ered using multiple approaches: handout, interactive, and onlinequestionnaires.
To achieve the objectives of this survey, different scenariosconsisting of several visibility levels, traffic conditions, CMS,and VSL signs were designed using driving simulation soft-ware, the L-3 Scenario Editor. There is no doubt that it wouldhave been better to use real pictures in this study. However,the Scenario Editor software was used because it was not pos-sible to find real pictures for all the scenarios. Snapshots atdifferent fog levels, traffic conditions, and covering the tworoadway types were prepared before designing the two sur-vey forms. It is worth mentioning that due to limited budgetand the various scenarios that were investigated in this study,neither field studies nor driving simulator experiments werefeasible. To sum up, research issues investigated in this articleare:
1. Whether drivers follow warning messages displayed on CMSand/or VSL signs in adverse visibility conditions and rely onsuch messages.
2. Drivers’ stated responses to different visibility conditions.3. What differentiates drivers who claim to be more or less
likely to comply with CMS and VSL signs instructions?4. What is the content of warning messages that would achieve
the best perceived safety and driver stated compliance inreduced visibility conditions?
5. What are the options that would be preferred during drivingthrough FS: using CMS only, using VSL signs only, usingboth CMS and VSL signs together, or closing the road duringsuch adverse visibility conditions?
6. What are the differences in drivers’ responses to reductionin visibility for freeways versus two-lane roads?
BACKGROUND
Drivers’ responses to both traffic and environmental condi-tions can be examined through a variety of approaches, includ-ing questionnaire surveys, driving simulator experiments, andnetwork monitoring. The relatively low cost of questionnairesurveys, compared to the other approaches, has encouraged re-
searchers to use it as a way to collect data on different drivingsituations under different traffic and environmental conditions(Chatterjee, Hounsell, Firmin, & Bonsall, 2002).
In general, there are two kinds of questionnaires: a statedpreference (SP) survey, examining human response to a hypo-thetical situation, and a revealed preference (RP) survey, investi-gating human response derived from a real-life choice situationin the physical world.
The primary shortcoming of SP data is that they might notbe harmonious with actual behavior. The issues of realism, taskcomplexity, familiarity, tendency to exaggerate, and strategicbias (i.e., when the respondent provides a biased answer in orderto influence a particular outcome) are the main reasons for theirinconsistency with revealed preferences data (Lu, Fowkes, &Wardman, 2008).
A number of prior studies examined consistency between RPand SP data. By comparing SP data to actual trip data, Loomis(1993) found that SPs relating to intended trips under alter-native quality levels are valid and reliable indicators of actualbehavior. Cummings, Harrison, and Rutstrim (1995) comparedreal purchasing behavior for private goods with dichotomouschoice (DC) contingent valuation questions. They found that theproportion of DC “yes” responses exceeds the proportion of ac-tual purchases. Also, Johannesson, Liljas, and Johansson (1998)showed that hypothetical “yes” responses overestimate the realpurchases. Yannis, Kanellopoulou, Aggeloussi, and Tsamboulas(2005) indicated that some participants may have the tendencyto exaggerate when they respond to SP questions, and hence,more attention should be given to the results explanation andconclusions.
Despite those drawbacks, questionnaire surveys have beencommonly used so far to study drivers’ responses to AdvancedTraveler Information System (ATIS) and to adverse weatherconditions. Clearly, the surveys can provide valid results andindications. However, actual magnitude of these results shouldbe viewed carefully and interpreted conservatively.
The SP surveys have been widely adopted in numerous trans-portation studies. Abdel-Aty, Vaughn, Kitamura, Jovanis, andMannering (1994), Khattak Polydoropoulou, and Ben-Akiva(1996), Mahmassani, Huynh, Srinivasan, and Kraan (2003),Iraguen and Ortuzar (2004), Tilahun, Levinson, and Krizek(2007), Junyi, Akimasa, and Soe (2008), Carlsson, Daruvala,and Jaldell (2010), and Correia and Viegas (2011) used the SPmethod to identify the behaviors of drivers with ATIS deploy-ments.
Drivers’ Responses to ATIS
Many previous studies focused on studying commuters’behavior, responses and satisfaction with Intelligent Trans-portation Systems (ITS) such as Harris and Konheim (1995),Benson (1996), Emmerink et al. (1996), Abdel-Aty et al. (1994;Abdel-Aty, Jovanis, & Kitamura, 1996; Abdel-Aty, Kitamura, &Jovanis, 1997), Peeta, Ramos, and Pasupathy (2000), Chatterjee
intelligent transportation systems vol. 16 no. 3 2012
Dow
nloa
ded
by [
Uni
vers
ity o
f C
entr
al F
lori
da]
at 0
9:01
16
July
201
2

134 H. M. HASSAN ET AL.
et al. (2002), Ng, Cheu, and Lee (2006), Neale, Perez, Lee,and Doerzaph (2007), Tsirimpa and Polydoropoulou (2007),Chorus, Arentze, and Timmermans (2007), and Lee, Ran, Yang,and Loh (2010).
For example, Abdel-Aty et al. (1996, 1997) examined theeffects of advanced transit information systems on commuters’willingness to use transit. Ng et al. (2006) evaluated the ef-fect of real-time traffic information (i.e., using variable messagesigns and travel time displays) on the average truck travel timewhen an incident occurs en route. Neale et al. (2007) evaluateddrivers’ responses to signalized and stop-controlled violationwarning systems (also see Viti & van Zuylen, 2009). Tsirimpaand Polydoropoulou (2007) examined the impact of informationacquisition through ATIS on switching travel behavior. Choruset al. (2007) investigated drivers’ needs for specific types oftravel information. Lee et al. (2010) examined the factors af-fecting drivers’ route choice behavior.
In addition, a number of earlier studies have used images ofCMS to explore driver comprehension and responses to the in-formation displaying on CMS. For instance, using an SP survey,Wardman, Bonsall, and Shires (1997) evaluated the effect of in-formation provided by CMS on drivers’ route choice. Lai andWong (2000) examined driver comprehension of the traffic in-formation presented on CMS. Lai and Yen (2004) examined howCMS affected driver behavior such as changing lanes, changingroute, and decreasing speed.
Moreover, using laptop computers, Dudek and Ullman(2002) investigated the effect of flashing an entire message,flashing one line and alternating text on one line on drivers’comprehension and recall. Using driving simulation experi-ments, Wang and Cao (2005) studied the influences of CMSformat and number of message lines on drivers’ response time.Dudek, Schrock, Ullman, and Chrysler (2006) examined theeffect of displaying CMS with dynamic features on drivers’comprehension and response time. Ullman et al. (2007)investigated the ability of motorists to capture and processinformation on two CMS used in sequence. Finally, Lai (2010)examined the effects of color scheme and message lines ofCMS on driver performance.
Drivers’ Responses to Inclement Weather
Noticeably, only very few studies examined drivers’ be-havior in adverse weather such as rain, snow, and fog/smokeusing questionnaire surveys. For example, Kilpelainen and Sum-mala (2007) examined the effect of adverse weather and traf-fic weather forecasts on drivers’ behavior in Finland using aquestionnaire on perceptions of weather, pre-trip acquisition ofweather information, and possible changes in travel plans. Theprimary finding was that drivers who had acquired informationhad also made more changes to their travel plans. The results alsoshowed that drivers’ behavior is basically affected by the prevail-ing observable conditions rather than traffic weather forecasts.
Additionally, many prior research efforts investigateddrivers’ responses to adverse weather conditions such as re-duction in visibility due to FS by observing traffic spot speedsor using driving simulators, such as Hogema and Horst (1997),Edwards (1999), Pisano and Goodwin (2004), Maze, Agarwal,and Burchett (2006), MacCarley, Ackles, and Watts (2006), andBroughton, Switzer, and Scott (2007).
Considering the aforementioned studies, clearly many stud-ies have analyzed drivers’ behavior in response to ATIS,unexpected congestion, and the impact of both radio traffic in-formation and CMS information. Also, a number of studieshave concentrated on examining the effects of adverse weatherand traffic weather forecasts on drivers’ behavior. However, wesuggest that there remains a need to better understand drivers’behavior at different traffic and visibility conditions. Therefore,the primary objectives of this study are to gain a basic under-standing of the factors affecting drivers’ behavior in adversevisibility conditions, and to examine whether drivers rely onand follow warning messages displayed on CMS and/or VSLsigns in different visibility and traffic conditions.
METHODS
Participants and Sampling
Prior studies such as by the Transit Cooperative ResearchProgram (TCRP, 2006). suggested that conducting a surveyusing multiple approaches would achieve a good representativesample. Therefore, three different survey approaches were usedto collect the participants’ responses: handout, interactive, andonline questionnaires. Previous studies revealed that mail-outquestionnaires yielded low response rates and do not provideinteraction between the interviewer and the respondent. Dueto this reason and limited budget, a mail-out questionnaire wasnot undertaken. Also, phone interviews were not quite suitablefor use because of the need to incorporate images in the surveyquestions.
The surveys were undertaken in fall 2009, targeting licenseddrivers in Orange and Seminole counties of Central Florida.In total, 709 drivers participated in the survey. However, only566 responses (complete or close to being complete) were usedfor the analysis. In this regard, 279 responses (49.3%) were col-lected from the handout survey, 91 (16%) through the interactivesurvey, and 196 (34.7%) via the Internet.
Handout questionnaires were randomly distributed amongdrivers in Central Florida from different age groups. Driverswere then asked to return questionnaires back once they com-pleted them. In the interactive survey, the surveyor met a groupof people at the same time and location and explained the pur-pose of the survey and the steps they should follow to completethe questionnaire. In this survey method, after distributing thequestionnaires to the respondents, each question or picture was
intelligent transportation systems vol. 16 no. 3 2012
Dow
nloa
ded
by [
Uni
vers
ity o
f C
entr
al F
lori
da]
at 0
9:01
16
July
201
2
PREFERENCES IN REDUCED VISIBILITY CONDITIONS 135
presented on a full screen using a projector (if the interviewwas conducted inside University of Central Florida) or usinga laptop. The presentation and interaction were carefully pre-pared so that the questions could be clear without biasing theresponses. Regarding the online survey, links (URL) for eithersurvey type (freeway or two-lane road) were sent randomly toabout 200 commuters in the Central Florida region. Also, 500cards containing links to either survey forms were distributedin a random manner to drivers in Central Florida from differentage groups. It is worth mentioning that all images used in thepresent survey were printed or presented in color to help partici-pants distinguish between the different fog conditions that wereinvestigated.
Materials
Prior studies such as that of Huang et al. (2010) revealed thatmost of the FS-related crashes (48.3%) occurred on four-laneroadways, followed by two-lane roads with 33.8%. Therefore,two surveys were conducted in the present study: a freewayssurvey and a two-lane roads survey to examine drivers’ behaviorin response to reduction in visibility on those types of roadways.The two survey forms are similar in all questions; both of themcontained 31 questions. The only difference was in the imagesthat were developed. Each respondent received only one of thetwo surveys randomly.
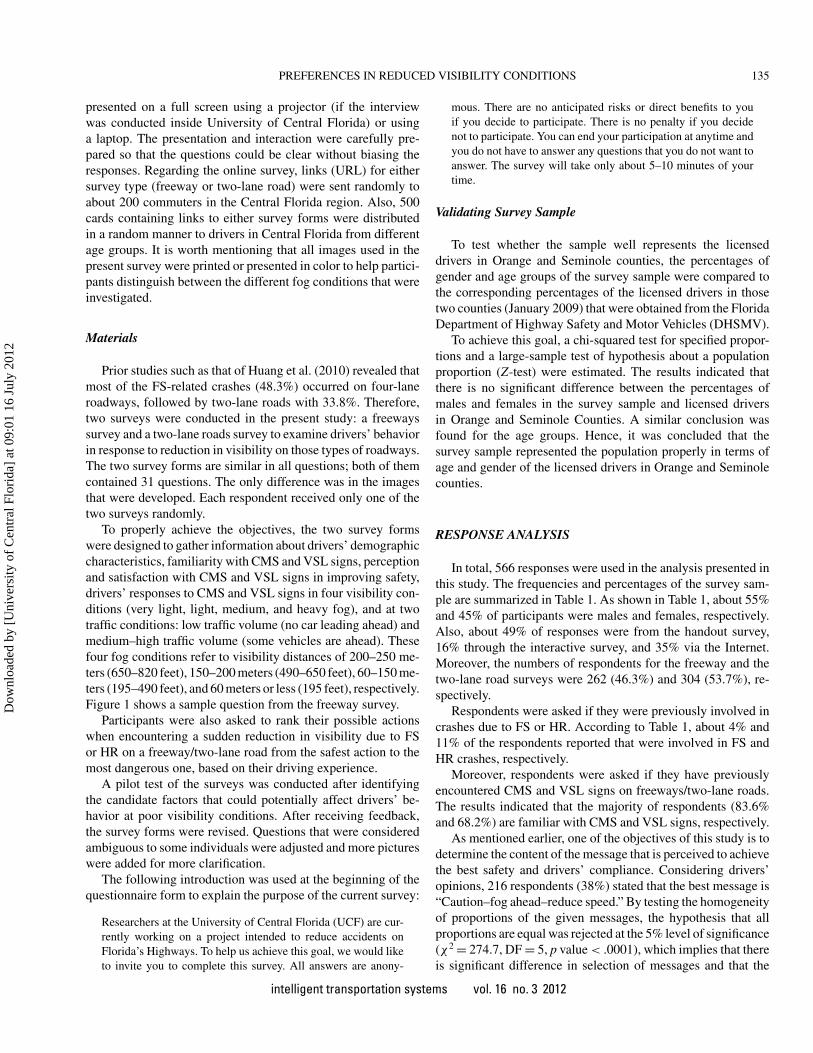
To properly achieve the objectives, the two survey formswere designed to gather information about drivers’ demographiccharacteristics, familiarity with CMS and VSL signs, perceptionand satisfaction with CMS and VSL signs in improving safety,drivers’ responses to CMS and VSL signs in four visibility con-ditions (very light, light, medium, and heavy fog), and at twotraffic conditions: low traffic volume (no car leading ahead) andmedium–high traffic volume (some vehicles are ahead). Thesefour fog conditions refer to visibility distances of 200–250 me-ters (650–820 feet), 150–200 meters (490–650 feet), 60–150 me-ters (195–490 feet), and 60 meters or less (195 feet), respectively.Figure 1 shows a sample question from the freeway survey.
Participants were also asked to rank their possible actionswhen encountering a sudden reduction in visibility due to FSor HR on a freeway/two-lane road from the safest action to themost dangerous one, based on their driving experience.
A pilot test of the surveys was conducted after identifyingthe candidate factors that could potentially affect drivers’ be-havior at poor visibility conditions. After receiving feedback,the survey forms were revised. Questions that were consideredambiguous to some individuals were adjusted and more pictureswere added for more clarification.
The following introduction was used at the beginning of thequestionnaire form to explain the purpose of the current survey:
Researchers at the University of Central Florida (UCF) are cur-rently working on a project intended to reduce accidents onFlorida’s Highways. To help us achieve this goal, we would liketo invite you to complete this survey. All answers are anony-
mous. There are no anticipated risks or direct benefits to youif you decide to participate. There is no penalty if you decidenot to participate. You can end your participation at anytime andyou do not have to answer any questions that you do not want toanswer. The survey will take only about 5–10 minutes of yourtime.
Validating Survey Sample
To test whether the sample well represents the licenseddrivers in Orange and Seminole counties, the percentages ofgender and age groups of the survey sample were compared tothe corresponding percentages of the licensed drivers in thosetwo counties (January 2009) that were obtained from the FloridaDepartment of Highway Safety and Motor Vehicles (DHSMV).
To achieve this goal, a chi-squared test for specified propor-tions and a large-sample test of hypothesis about a populationproportion (Z-test) were estimated. The results indicated thatthere is no significant difference between the percentages ofmales and females in the survey sample and licensed driversin Orange and Seminole Counties. A similar conclusion wasfound for the age groups. Hence, it was concluded that thesurvey sample represented the population properly in terms ofage and gender of the licensed drivers in Orange and Seminolecounties.
RESPONSE ANALYSIS
In total, 566 responses were used in the analysis presented inthis study. The frequencies and percentages of the survey sam-ple are summarized in Table 1. As shown in Table 1, about 55%and 45% of participants were males and females, respectively.Also, about 49% of responses were from the handout survey,16% through the interactive survey, and 35% via the Internet.Moreover, the numbers of respondents for the freeway and thetwo-lane road surveys were 262 (46.3%) and 304 (53.7%), re-spectively.
Respondents were asked if they were previously involved incrashes due to FS or HR. According to Table 1, about 4% and11% of the respondents reported that were involved in FS andHR crashes, respectively.
Moreover, respondents were asked if they have previouslyencountered CMS and VSL signs on freeways/two-lane roads.The results indicated that the majority of respondents (83.6%and 68.2%) are familiar with CMS and VSL signs, respectively.
As mentioned earlier, one of the objectives of this study is todetermine the content of the message that is perceived to achievethe best safety and drivers’ compliance. Considering drivers’opinions, 216 respondents (38%) stated that the best message is“Caution–fog ahead–reduce speed.” By testing the homogeneityof proportions of the given messages, the hypothesis that allproportions are equal was rejected at the 5% level of significance(χ2 = 274.7, DF = 5, p value < .0001), which implies that thereis significant difference in selection of messages and that the
intelligent transportation systems vol. 16 no. 3 2012
Dow
nloa
ded
by [
Uni
vers
ity o
f C
entr
al F
lori
da]
at 0
9:01
16
July
201
2

136 H. M. HASSAN ET AL.
Figure 1 Sample questions from the freeway survey (color figure available online).
aforementioned message was selected as the best message bythe larger proportion of participants. The percentages of drivers’choices for other alternative messages are listed in Table 1.
In addition, the responses revealed that the majority of re-spondents (83.2%) agree with the usefulness of using two suc-cessive CMS prior to FS zones for warning drivers about anysudden reduction in visibility. This could provide drivers withanother chance to read the content of the warning message ofthe second CMS if they missed the first one.
Furthermore, drivers were asked about their satisfaction withthe usefulness of using CMS and VSL signs on a 5-point scaleranging from strongly disagree to strongly agree. About 94%of respondents (who agree or strongly agree) reported that theyare satisfied with the usefulness of CMS, while 76% of par-ticipants (who agree or strongly agree) stated that VSL signscould be useful in reducing the number of FS crashes (as shownin Table 1). This difference could be attributed to the fact thatdrivers in Florida are not familiar with VSL signs comparedto CMS.
Another objective of this study was to investigate the bestway to improve safety during driving through FS zones basedon drivers’ expectations and preferences: using CMS only, usingVSL signs only, using CMS and VSL signs simultaneously, orclosing the road during such adverse weather conditions. Mostof the respondents (63.8%) stated that using both CMS andVSL signs together is the best way to improve safety duringthese adverse weather conditions (as shown in Table 1).
This result is logical because warning drivers that there isfog ahead using CMS only does not instruct them on what todo. Therefore, using VSL signs is also important to instructdrivers about the safe speed at every visibility conditions. Thisresult is consistent with prior studies such as Perrin, Martin, andColeman (2002). The hypothesis that the proportions of all pos-sible ways to improve safety are equal was rejected at the 5%level of significance (χ2 = 576.9, DF = 3, p-value < 0.0001)which means that using CMS and VSL signs together during ad-verse visibility conditions was preferred by the larger proportionof participants.
intelligent transportation systems vol. 16 no. 3 2012
Dow
nloa
ded
by [
Uni
vers
ity o
f C
entr
al F
lori
da]
at 0
9:01
16
July
201
2
PREFERENCES IN REDUCED VISIBILITY CONDITIONS 137
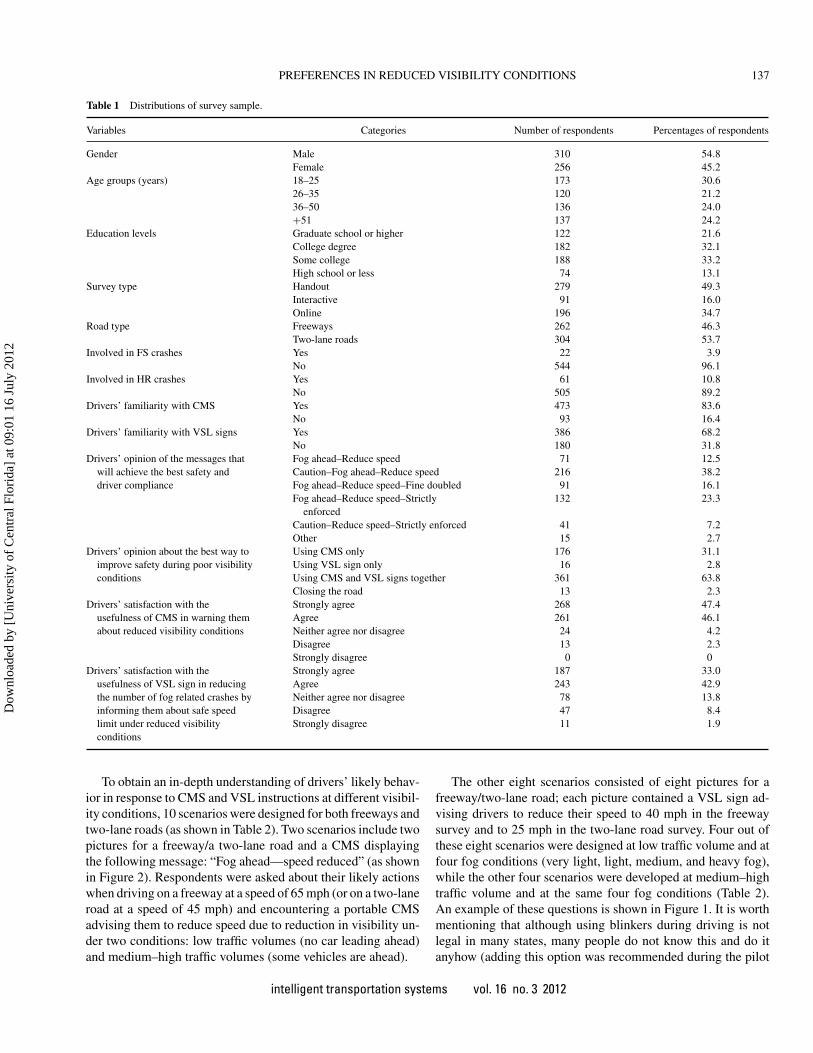
Table 1 Distributions of survey sample.
Variables Categories Number of respondents Percentages of respondents
Gender Male 310 54.8Female 256 45.2
Age groups (years) 18–25 173 30.626–35 120 21.236–50 136 24.0+51 137 24.2
Education levels Graduate school or higher 122 21.6College degree 182 32.1Some college 188 33.2High school or less 74 13.1
Survey type Handout 279 49.3Interactive 91 16.0Online 196 34.7
Road type Freeways 262 46.3Two-lane roads 304 53.7
Involved in FS crashes Yes 22 3.9No 544 96.1
Involved in HR crashes Yes 61 10.8No 505 89.2
Drivers’ familiarity with CMS Yes 473 83.6No 93 16.4
Drivers’ familiarity with VSL signs Yes 386 68.2No 180 31.8
Drivers’ opinion of the messages thatwill achieve the best safety anddriver compliance
Fog ahead–Reduce speed 71 12.5Caution–Fog ahead–Reduce speed 216 38.2Fog ahead–Reduce speed–Fine doubled 91 16.1Fog ahead–Reduce speed–Strictly
enforced132 23.3
Caution–Reduce speed–Strictly enforced 41 7.2Other 15 2.7
Drivers’ opinion about the best way toimprove safety during poor visibilityconditions
Using CMS only 176 31.1Using VSL sign only 16 2.8Using CMS and VSL signs together 361 63.8Closing the road 13 2.3
Drivers’ satisfaction with theusefulness of CMS in warning themabout reduced visibility conditions
Strongly agree 268 47.4Agree 261 46.1Neither agree nor disagree 24 4.2Disagree 13 2.3Strongly disagree 0 0
Drivers’ satisfaction with theusefulness of VSL sign in reducingthe number of fog related crashes byinforming them about safe speedlimit under reduced visibilityconditions
Strongly agree 187 33.0Agree 243 42.9Neither agree nor disagree 78 13.8Disagree 47 8.4Strongly disagree 11 1.9
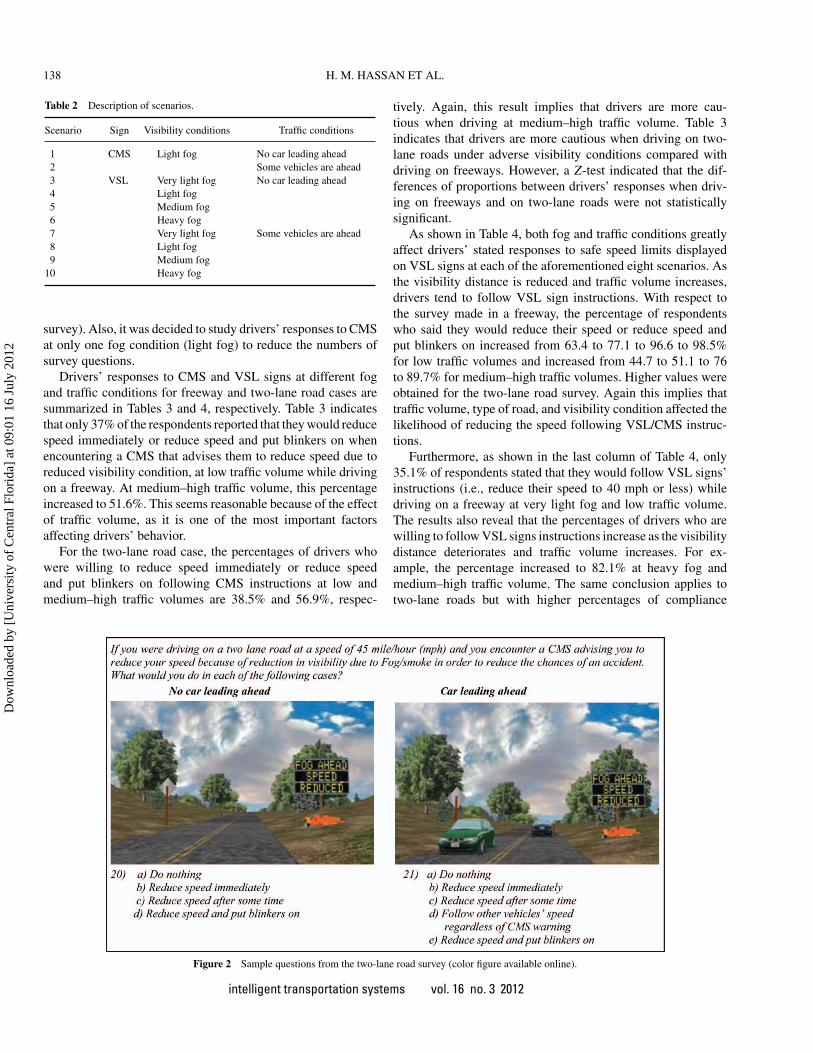
To obtain an in-depth understanding of drivers’ likely behav-ior in response to CMS and VSL instructions at different visibil-ity conditions, 10 scenarios were designed for both freeways andtwo-lane roads (as shown in Table 2). Two scenarios include twopictures for a freeway/a two-lane road and a CMS displayingthe following message: “Fog ahead—speed reduced” (as shownin Figure 2). Respondents were asked about their likely actionswhen driving on a freeway at a speed of 65 mph (or on a two-laneroad at a speed of 45 mph) and encountering a portable CMSadvising them to reduce speed due to reduction in visibility un-der two conditions: low traffic volumes (no car leading ahead)and medium–high traffic volumes (some vehicles are ahead).
The other eight scenarios consisted of eight pictures for afreeway/two-lane road; each picture contained a VSL sign ad-vising drivers to reduce their speed to 40 mph in the freewaysurvey and to 25 mph in the two-lane road survey. Four out ofthese eight scenarios were designed at low traffic volume and atfour fog conditions (very light, light, medium, and heavy fog),while the other four scenarios were developed at medium–hightraffic volume and at the same four fog conditions (Table 2).An example of these questions is shown in Figure 1. It is worthmentioning that although using blinkers during driving is notlegal in many states, many people do not know this and do itanyhow (adding this option was recommended during the pilot
intelligent transportation systems vol. 16 no. 3 2012
Dow
nloa
ded
by [
Uni
vers
ity o
f C
entr
al F
lori
da]
at 0
9:01
16
July
201
2
138 H. M. HASSAN ET AL.
Table 2 Description of scenarios.
Scenario Sign Visibility conditions Traffic conditions
1 CMS Light fog No car leading ahead2 Some vehicles are ahead3 VSL Very light fog No car leading ahead4 Light fog5 Medium fog6 Heavy fog7 Very light fog Some vehicles are ahead8 Light fog9 Medium fog
10 Heavy fog
survey). Also, it was decided to study drivers’ responses to CMSat only one fog condition (light fog) to reduce the numbers ofsurvey questions.
Drivers’ responses to CMS and VSL signs at different fogand traffic conditions for freeway and two-lane road cases aresummarized in Tables 3 and 4, respectively. Table 3 indicatesthat only 37% of the respondents reported that they would reducespeed immediately or reduce speed and put blinkers on whenencountering a CMS that advises them to reduce speed due toreduced visibility condition, at low traffic volume while drivingon a freeway. At medium–high traffic volume, this percentageincreased to 51.6%. This seems reasonable because of the effectof traffic volume, as it is one of the most important factorsaffecting drivers’ behavior.
For the two-lane road case, the percentages of drivers whowere willing to reduce speed immediately or reduce speedand put blinkers on following CMS instructions at low andmedium–high traffic volumes are 38.5% and 56.9%, respec-
tively. Again, this result implies that drivers are more cau-tious when driving at medium–high traffic volume. Table 3indicates that drivers are more cautious when driving on two-lane roads under adverse visibility conditions compared withdriving on freeways. However, a Z-test indicated that the dif-ferences of proportions between drivers’ responses when driv-ing on freeways and on two-lane roads were not statisticallysignificant.
As shown in Table 4, both fog and traffic conditions greatlyaffect drivers’ stated responses to safe speed limits displayedon VSL signs at each of the aforementioned eight scenarios. Asthe visibility distance is reduced and traffic volume increases,drivers tend to follow VSL sign instructions. With respect tothe survey made in a freeway, the percentage of respondentswho said they would reduce their speed or reduce speed andput blinkers on increased from 63.4 to 77.1 to 96.6 to 98.5%for low traffic volumes and increased from 44.7 to 51.1 to 76to 89.7% for medium–high traffic volumes. Higher values wereobtained for the two-lane road survey. Again this implies thattraffic volume, type of road, and visibility condition affected thelikelihood of reducing the speed following VSL/CMS instruc-tions.
Furthermore, as shown in the last column of Table 4, only35.1% of respondents stated that they would follow VSL signs’instructions (i.e., reduce their speed to 40 mph or less) whiledriving on a freeway at very light fog and low traffic volume.The results also reveal that the percentages of drivers who arewilling to follow VSL signs instructions increase as the visibilitydistance deteriorates and traffic volume increases. For ex-ample, the percentage increased to 82.1% at heavy fog andmedium–high traffic volume. The same conclusion applies totwo-lane roads but with higher percentages of compliance
Figure 2 Sample questions from the two-lane road survey (color figure available online).
intelligent transportation systems vol. 16 no. 3 2012
Dow
nloa
ded
by [
Uni
vers
ity o
f C
entr
al F
lori
da]
at 0
9:01
16
July
201
2

PREFERENCES IN REDUCED VISIBILITY CONDITIONS 139
Table 3 Summary of drivers’ responses to CMS instructions.
Reduce speed Follow other Reduce speed immediatelyTraffic Fog Do after some vehicles’ or reduce speed andconditions conditions nothing time speed put blinkers on
Drivers’ behavior for freeway survey (sample size = 262)Low traffic volume Light fog 56 (21.4%) 109 (41.6%) NA∗ 97 (37%)Medium–high traffic volume 20 (7.6%) 63 (24%) 44 (16.8%) 135 (51.6%)
Drivers’ behavior for two-lane road survey (sample size = 304)Low traffic volume Light fog 44 (14.5%) 143 (47%) NA∗ 117 (38.5%)Medium–high traffic volume 11 (3.6%) 71 (23.4%) 49 (16.1%) 173 (56.9%)
∗Not applicable.
with VSL signs instruction. However, using Z and chi-squaredtests, no significant differences were found between drivers’responses to VSL signs while driving on freeways versus two-lane roads or while driving at low versus medium–high trafficvolumes.
Finally drivers were asked to rank the following six optionsfrom the safest action (rank 1) that they thought would minimizethe chance of a FS crash, to the least safe one (rank 6): (1) donothing, (2) drive below speed limit, (3) drive below speedlimit following the instructions of VSL signs and/or CMS, ifthey are available, (4) follow other vehicles’ speed regardlessof CMS and VSL signs warnings, (5) drive below speed limitand put blinkers on, (6) abandon the journey and stop the carimmediately at the right shoulder of the road.
The results revealed that 36.2% of the respondents claimedthat following the instructions of CMS and VSL signs is thesafest action. Driving below the speed limit and putting blink-ers on came in the second place with 26.3%. On the otherhand, 86% stated that doing nothing is the most dangerous ac-tion. “Abandon the journey and stop the car immediately atthe right shoulder of the road” came next with about 10%.Some participants pointed out that the last option is dangerousas it might increase rear-end crashes, especially at heavy fogconditions.
Prior to the modeling process, conditional distributions, oddsratios, and chi-squared tests were used for preliminary investi-gation of the differences between drivers’ responses to CMS andVSL signs at different traffic and visibility conditions. Table 5
Table 4 Summary of drivers’ responses to VSL signs’ instructions.
Drivers’ behavior for freeway survey (sample size = 262)
Follow other Reduce speed or Reduce speedTraffic Fog Do vehicles’ reduce speed and to 40 mphconditions conditions nothing speed put blinkers on or less
Low traffic volume Very light fog 96 (36.6%) NA∗ 166 (63.4%) 92 (35.1%)Light fog 60 (22.9%) NA∗ 202 (77.1%) 104 (39.7%)Medium fog 9 (3.4%) NA∗ 253 (96.6%) 155 (59.2)Heavy fog 4 (1.5%) NA∗ 258 (98.5%) 201 (76.7%)
Medium–high traffic Very light fog 43 (16.4%) 102 (38.9%) 117 (44.7%) 93 (35.5%)volume Light fog 22 (8.4%) 106 (40.5%) 134 (51.1%) 107 (40.8%)
Medium fog 4 (1.5%) 59 (22.5%) 199 (76.0) 159 (60.7%)Heavy fog 2 (0.8%) 25 (9.5%) 235 (89.7%) 215 (82.1%)
Drivers’ behavior for two-lane road survey (sample size = 304)
Follow other Reduce speed or Reduce speedTraffic Fog Do vehicles’ reduce speed and to 25 mphconditions conditions nothing speed put blinkers on or less
Low traffic volume Very light fog 110 (36.2%) NA∗ 194 (63.8%) 108 (35.5%)Light fog 65 (21.4%) NA∗ 239 (78.6%) 127 (41.8%)Medium fog 8 (2.6%) NA∗ 296 (97.4%) 183 (60.2%)Heavy fog 2 (0.7%) NA∗ 302 (99.3%) 242 (79.6%)
Medium–high traffic Very light fog 44 (14.5%) 113 (37.2%) 147 (48.3%) 117 (38.5%)volume Light fog 24 (7.9%) 121 (39.8%) 159 (52.3%) 141 (46.4%)
Medium fog 0 (0%) 64 (21.1%) 240 (78.9%) 196 (64.5%)Heavy fog 0 (0%) 25 (8.2%) 279 (91.8%) 262 (86.2%)
∗Not applicable.
intelligent transportation systems vol. 16 no. 3 2012
Dow
nloa
ded
by [
Uni
vers
ity o
f C
entr
al F
lori
da]
at 0
9:01
16
July
201
2

140 H. M. HASSAN ET AL.
Table 5 Conditional distributions and odds ratio.
Driver’s response to VSL sign instructionsat heavy fog and medium–high traffic volume
Do nothing or follow Reduce speed or reduceFactor other vehicles’ speed speed and put blinkers on Total Odds ratio
Gender Male 48 (80%) 262 (51.8%) 310 (54.8%) 1Female 12 (20%) 244 (48.2%) 256 (45.2%) 3.7Total 60 (100%) 506 (100%) 566 (100%)
Age (years) 18–25 33 (55%) 140 (27.7%) 173 (30.6%) 126–35 14 (23.3%) 106 (20.9%) 120 (21.2%) 1.836–50 7 (11.7%) 130 (25.7%) 137 (24.2%) 4.4+51 6 (10%) 130 (25.7%) 136 (24%) 5.1Total 60 (100%) 506 (100%) 566 (100%)
Drivers’ familiarity with No 31 (51.7%) 149 (29.4%) 180 (31.8%) 1VSL signs Yes 29 (48.3%) 357 (70.6%) 386 (68.2%) 2.6
Total 60 (100%) 506 (100%) 566 (100%)
Past experience with No 19 (31.7%) 91 (18%) 110 (19.4%) 1driving at adverse Yes 41 (68.3%) 415 (82%) 456 (80.6%) 2.1visibility conditions Total 60 (100%) 506 (100%) 566 (100%)
Involved in FS crashes No 20 (90.9%) 486 (89.3%) 506 (89.4%) 1Yes 2 (9.1%) 58 (10.7%) 60 (10.6%) 1.2Total 22 (100%) 544 (100%) 566 (100%)
Involved in HR crashes No 55 (91.7%) 450 (88.9%) 505 (89.2%) 1Yes 5 (8.3%) 56 (11.1%) 61 (10.8%) 1.4Total 60 (100%) 506 (100%) 566 (100%)
Driver’s response to CMS instructions atmedium–high traffic volume
Do nothing or reduce speed after Reduce speed immediately or reduceFactor some time or follow other vehicles’ speed speed and put blinkers on Total Odds ratio
Gender Male 162 (62.8%) 148 (48.1%) 310 (54.8%) 1Female 96 (37.2%) 160 (51.9%) 256 (54.8%) 1.8Total 258 (100%) 308 (100%) 566 (100%)
Age (years) 18–25 119 (46.1%) 54 (17.5%) 173 (30.6%) 126–35 49 (19.0%) 71 (23.1%) 120 (21.2%) 3.236–50 58 (22.5%) 78 (25.3%) 136 (24.0%) 3.0+51 32 (12.4%) 105 (34.1%) 137 (24.2%) 7.2Total 258 (100%) 308 (100%) 566 (100%)
Road type Freeway 127 (49.2%) 135 (43.8%) 262 (46.3%) 1Two-lane road 131 (50.8%) 173 (56.2%) 304 (53.7%) 1.2Total 258 (100%) 308 (100%) 566 (100%)
Drivers’ familiarity with No 221 (85.7%) 252 (81.8%) 473 (83.6%) 1CMS Yes 37 (14.3%) 56 (18.2%) 93 (16.4%) 1.3
Total 258 (100%) 308 (100%) 566 (100%)Past experience with No 211 (81.8%) 245 (79.5%) 456 (80.6%) 1
driving at adverse Yes 47 (18.2%) 63 (20.5%) 110 (19.4%) 1.2visibility conditions Total 258 (100%) 308 (100%) 566 (100%)
Note. The percentage within parentheses is cell size relative to the group total.
summarizes the results of conditional distributions and odds ra-tios. The odds ratios were estimated for each group with respectto the first category of that group.
Concerning the gender, the odds ratio of females implies thatwhen driving at heavy fog and medium–high traffic volume,the odds of following VSL instructions are 3.7 times higher for
females than for males. Also regarding age, the result supportsthe hypothesis that older respondents are more likely to respondto VSL instructions than young participants. For example, theresults revealed that the likelihood of following VSL instructionsis 5.1 times higher for older drivers than for younger drivers(18–25 years old).
intelligent transportation systems vol. 16 no. 3 2012
Dow
nloa
ded
by [
Uni
vers
ity o
f C
entr
al F
lori
da]
at 0
9:01
16
July
201
2
PREFERENCES IN REDUCED VISIBILITY CONDITIONS 141
Regarding drivers’ familiarity with VSL signs, it was foundthat the odds of following VSL instructions are 2.6 times greaterfor drivers who are familiar with VSL than for those who arenot. In addition, the likelihood of following VSL instructions is2.1 times higher for experienced drivers than for drivers who arenot familiar with driving at poor visibility conditions. Similarresults were obtained for drivers’ response to CMS (Table 5).Concerning road type, it was found that the probability of fol-lowing CMS while driving on two-lane roads is 1.2 times higherthan while driving on freeways.
As expected, it was found that when driving at heavy fogand medium–high traffic volume, the odds of following VSLinstructions are higher for participants who were involved inFS crashes than those who were not involved in such crashes(1.2 times higher, as shown in Table 5). Similarly, the odds of fol-lowing VSL signs under heavy fog condition and medium–hightraffic volume is 1.4 times higher for participants who were pre-viously experienced HR crashes than for those who were notinvolved in such crashes.
A chi-squared test was developed to explore the asso-ciation between drivers’ responses to CMS/VSL signs andother factors such as age, gender, education, drivers’ famil-iarity with VSL/CMS, and experience with driving at ad-verse visibility conditions. The results showed significant as-sociation between drivers’ response to VSL/CMS and thosevariables.
In summary, all the preliminary test results revealed thatthe participants’ responses to CMS and VSL instructions varyby gender, age, familiarity with CMS and VSL signs, andexperience with driving at adverse visibility condition. Thus,to improve our understanding of the preferences of respon-dents in following VSL and CMS instructions under suchadverse visibility conditions, multivariate analyses, the bivari-ate and multivariate probit models, were employed for furtheranalyses.
DRIVERS’ REACTION TO CMS AND VSL SIGNS
This section emphasizes two methodological approaches foranalyzing drivers’ responses to CMS and VSL signs at differentvisibility and traffic conditions, namely, bivariate probit models(BPMs) and the multivariate probit model (MPM).
MPM has been widely used in agricultural, statistical, andeconomic studies for analyzing potentially correlated multivari-ate outcomes. These studies include Gibbons and Wilcox-Gok(1998), Lansink, Berg, and Huirne (2003), Lu and Song (2006),and Young, Valdez, and Kohn (2009). In addition, MPM hasbeen developed in few transportation-related studies such asChoo and Mokhtarian (2008) and Rentziou. Milioti, Gkritza,and Karlaftis (2010).
MPM is a generalization of the BPM used to estimate severalcorrelated binary outcomes jointly (Ashford & Sowden, 1970).
The model specification for the simultaneously estimated BPMcan be explained as follows:
Y∗1 = βX1 + ε1 Y1 = 1 if Y∗
1 ≥ 0; 0 otherwise (1)
Y∗2 = αX2 + ε2 Y2 = 1 if Y∗
2 ≥ 0; 0 otherwise (2)
where Y∗1 and Y
∗2 are the estimated dependent variables; Y1 and
Y2 are the observed choices for dependent variables; X1, X2 isthe vector of explanatory variables influencing choice behavior;β, α are coefficient vectors; and ε1, ε2 are random error terms.
The error terms ε1 and ε2 are estimated according to:
E[ε1/X1, X2] = E[ε1/X1, X2] = 0 (3)
Var[ε1/X1, X2] = Var[ε2/X1, X2] = 1 (4)
Cov[ε1, ε2/X1, X2] = ρ (5)
where ρ is the correlation coefficient between the two errorterms. If ρ equals zero, the bivariate probit model convergesto two separate binomial probit models. In addition, the modelparameters of the two probit equations are estimated simulta-neously using full information maximum likelihood estimation.Parameters vectors β, α, and ρ are estimated to maximize thelikelihood function. Also, significant ρ will imply the presenceof unobserved individual factors (heterogeneity) that affect bothdependent variables used in the BPM. For detailed informationregarding BPMs and MPM, the reader is referred to Meng andSchmidt (1985), Abdel-Aty et al. (1994), Mohanty (2002), andGreene (2003).
In this study, several BPM models were estimated first toidentify the dependent variables that better explain drivers’responses to CMS and VSL signs under adverse visibilityconditions. Then, these dependent variables were used to es-timate the MPM. The advantage of using MPM is that all de-pendent and explanatory factors affecting drivers’ responsesto CMS and VSL signs at different traffic and visibilityconditions can be shown and discussed in one model frameworkinstead of explaining several BPMs separately. In addition, cor-relations between several equations can also be accounted for.
It is worth mentioning that Limdep package was used to esti-mate the models presented in this article. Three bivariate probitmodels were developed after investigating several alternativemodel formations and dependent variables (Table 6). Drivers’response to VSL signs at heavy fog and medium–high trafficvolume (0 if do nothing or follow other vehicles’ speed, 1 ifreduce speed or reduce speed and put blinkers on) was the firstdependent variable in the three models.
The second dependent variables in the three fitted BPM weredrivers’ response to VSL signs at very light fog and low trafficvolume (0 if do nothing, 1 if reduce speed or reduce speed andput blinkers on), drivers’ response to CMS at low traffic volume(0 if do nothing or reduce speed after some time, 1 if reducespeed immediately or reduce speed and put blinkers on), and
intelligent transportation systems vol. 16 no. 3 2012
Dow
nloa
ded
by [
Uni
vers
ity o
f C
entr
al F
lori
da]
at 0
9:01
16
July
201
2

142 H. M. HASSAN ET AL.
drivers’ response to CMS at medium–high traffic volume (0if do nothing or reduce speed after some time or follow othervehicles’ speed, 1 if reduce speed immediately or reduce speedand put blinkers on), respectively. Level 0 was considered thebase case for each dependent variable.
The results of the three BPM revealed that gender, age,drivers’ familiarity with VSL signs, and road type were thesignificant factors affecting the likelihood of reducing speedfollowing the instructions of VSL or CMS signs in response toadverse visibility conditions. The remaining variables (such asthose shown in Table 5) were tested; however, they were foundto be statistically insignificant.
In addition, to improve our understanding of the factors af-fecting drivers’ stated behavior at different visibility and traffic
conditions, an MPM was developed. Based on the three BPMsmentioned earlier, it was found that the dependent variablesthat better explain drivers’ stated response to adverse visibil-ity conditions were drivers’ response to VSL at heavy fog andmedium–high traffic volume, drivers’ response to VSL at verylight fog and low traffic volume, and drivers’ response to CMS atmedium–high traffic volume. Therefore, these three dependentvariables were used in the MPM.
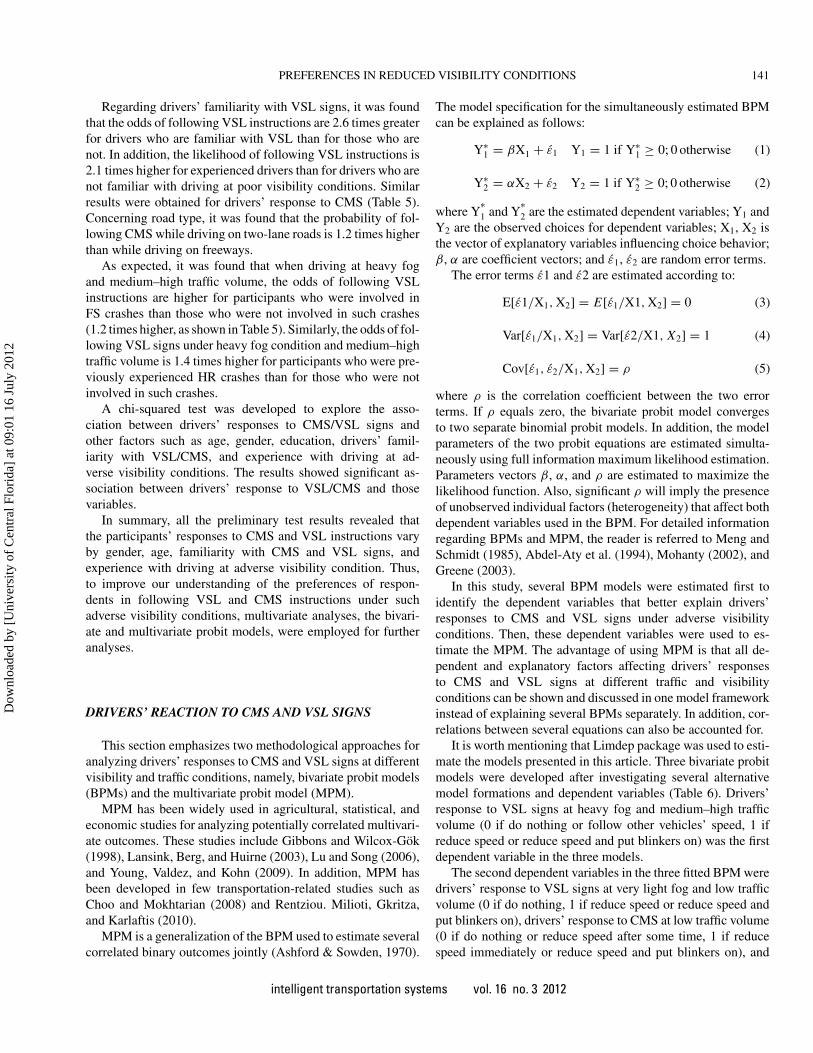
The MPM estimates, goodness-of-fit statistics, and thecorrelation coefficient ρ between every two error terms in thethree equations are presented in Table 7. As shown in Table7, the coefficient of correlation ρ is statistically different fromzero, illustrating the validity of using the multivariate probitframework.
Table 6 Summary of bivariate probit models.
First BPM model Second BPM model Third BPM model
Standard p Standard p Standard pVariable description Estimate error Value Estimate error Value Estimate error Value
First equation Drivers’ responses to VSL signs at heavy fog and medium–high traffic condition(Baseline: do nothing or follow other vehicles’ speed)
Intercept 0.6629 0.1290 0.0000 0.6896 0.1325 0.0000 0.6826 0.1299 0.0000Gender—male —a —a —a
Gender—female 0.5889 0.1702 0.0005 0.5569 0.1748 0.0014 0.5747 0.1711 0.0008Age (18–25) —a —a —a
Age (36–50) 0.6515 0.2311 0.0048 0.6219 0.2289 0.0066 0.6283 0.2232 0.0049Age (+51) 0.6556 0.2280 0.0040 0.6036 0.2180 0.0056 0.6239 0.2186 0.0043Drivers’ familiarity
with VSL signs (no)—a —a —a
Drivers’ familiaritywith VSL signs (yes)
0.5233 0.2045 0.0105 0.4807 0.2168 0.0266 0.5193 0.2075 0.0123
Road type (two–laneroad)
—a —a —a
Road type (freeway) –0.3805 0.2077 0.0670 –0.3319 0.2141 0.1212 –0.3923 0.2175 0.0713
Drivers’ responses to CMS Drivers’ responses to CMSDrivers’ responses to VSL signs at low traffic volume (Baseline: at medium–high traffic volumeat very light fog and low traffic do nothing or reduce speed (Baseline: do nothing or reduce
Second equation volumes (Baseline: do nothing) after some time) or follow other vehicles’ speed)
Intercept –0.2175 0.1032 0.0350 –1.0576 0.1241 0.0000 –0.4799 0.1149 0.0000Gender–male —a —a —a
Gender–female 0.2265 0.1166 0.0520 0.2758 0.1128 0.0145 0.3346 0.1141 0.0034Age (18–25) —a —a —a
Age (26–35) 0.4105 0.1468 0.0052 0.6540 0.1630 0.0001 0.6486 0.1534 0.0000Age (36–50) 0.5372 0.1483 0.0003 0.6067 0.1588 0.0001 0.6419 0.1506 0.0000Age (+51) 1.2097 0.1673 0.0000 1.2299 0.1589 0.0000 1.2226 0.1567 0.0000Road type (two-lane
road)—a
Road type (freeway) –0.2973 0.1139 0.0091Error terms correlation
coefficient (ρ)0.3534 0.0899 0.0001 0.3819 0.1149 0.0009 0.3785 0.0969 0.0001
Number ofobservations
566 566 566
Log-likelihood atconvergence
–499.475 –500.666 –510.442
AICb 1020.95 1023.332 1044.884Pseudo R-squared 0.14 0.12 0.11
aBase case.bAkaike information criterion.
intelligent transportation systems vol. 16 no. 3 2012
Dow
nloa
ded
by [
Uni
vers
ity o
f C
entr
al F
lori
da]
at 0
9:01
16
July
201
2
PREFERENCES IN REDUCED VISIBILITY CONDITIONS 143
According to the first model, when encountering a heavy fogcondition with some vehicles ahead (medium–high traffic vol-ume), female drivers are more likely than male drivers to reducetheir speed or reduce their speed and put the blinkers on. Thisimplies that female drivers are more cautious than male drivers.
Concerning age, as age increases, the likelihood of followingVSL instruction at heavy fog and medium–high traffic volumeincreases. The results suggest that compared to younger respon-dents (18–25 years old), older respondents (51 years old or more)are more likely to reduce their speed following VSL instruction.This indicates that maturity and experience are essential factorsthat affect the driver’s response to VSL instructions.
An expected finding is that drivers who are familiar withVSL signs are more likely to reduce their speed at heavy fogconditions. This could be attributed to the fact that drivers whoare familiar with VSL signs and aware of their importance in
avoiding a potential accident during reduced visibility due to FSare less likely to ignore their instructions.
Regarding the type of road, it was found that, at 90% con-fidence, the probability of reducing speed, following VSL in-structions at heavy fog and medium–high traffic volume whiledriving on a freeway, is less than the corresponding probabil-ity while driving on a two-lane road. This suggests that driverscould be more cautious on two-lane roads.
Similar findings were obtained from the second and thirdequations. The second model suggests that both females andold drivers (51 years old or more) are more likely to reduce theirspeed following VSL instructions at very light fog and low trafficvolume compared to males and young drivers (18–25 years old),respectively.
According to the third probit model, at medium–high traf-fic volumes and having encountering a CMS advising a
Table 7 Multivariate probit model estimates.
Variable description Estimate Standard error p Value
First equation: drivers’ responses to VSL signs at heavy fog and medium–high traffic volume (Baseline: do nothing or follow other vehicles’ speed)Intercept 0.5690 0.1463 0.0001Gender–male —Gender–female 0.5553 0.1714 0.0012Age (18–25) —a
Age (26–35) 0.2778 0.1712 0.1041Age (36–50) 0.7678 0.2408 0.0014Age (+51) 0.7637 0.2356 0.0012Drivers’ familiarity with VSL signs (no) —a
Drivers’ familiarity with VSL signs (yes) 0.5001 0.2106 0.0176Road type (2two-lane road) —a
Road type (freeway) –0.3508 0.2193 0.1097
Second equation: drivers’ responses to VSL signs at very light fog and low traffic volume (Baseline: do nothing)Intercept –0.2299 0.1038 0.0267Gender–male —a
Gender–female 0.2242 0.1174 0.0562Age (18–25) —a
Age (26–35) 0.4501 0.1527 0.0032Age (36–50) 0.5589 0.1496 0.0002Age (+51) 1.2241 0.1679 0.0000
Third equation: drivers’ responses to CMS at medium–high traffic volume (Baseline: do nothing or reducespeed after some time or follow other vehicles’ speed)
Intercept –0.5007 0.1155 0.0000Gender–male —a
Gender–female 0.3321 0.1146 0.0038Age (18–25) —a
Age (26–35) 0.6880 0.1569 0.0000Age (36–50) 0.6574 0.1510 0.0000Age (+51) 1.2322 0.1571 0.0000Road type (two-lane road) —a
Road type (freeway) –0.2694 0.1138 0.0179Error terms correlation coefficient between Eqs. 1 and 2 (ρ12) 0.3525 0.0901 0.0001Error terms correlation coefficient between Eqs. 1 and 3 (ρ13) 0.3716 0.0976 0.0001Error terms correlation coefficient between Eqs. 2 and 3 (ρ23) 0.2524 0.0698 0.0003Number of observations 566Log-likelihood at convergence –835.7581AICb 1707.5162Pseudo R-squared 0.12
aBase case.bAkaike information criterion.
intelligent transportation systems vol. 16 no. 3 2012
Dow
nloa
ded
by [
Uni
vers
ity o
f C
entr
al F
lori
da]
at 0
9:01
16
July
201
2

144 H. M. HASSAN ET AL.
reduction in speed due to poor visibility, female drivers andolder drivers are more likely to reduce their speed or re-duce their speed and put blinkers on than the correspondingmales and younger drivers. Again, this implies that females andolder drivers are more cautious than male and younger drivers,respectively.
Finally, drivers who drive on a freeway at poor visibility con-ditions are less likely to respond to CMS instructions than thosewho drive on a two-lane road. It is possible that the presence ofmedians on freeways could give drivers a better sense of pro-tection from the opposing traffic and thus contribute to morecautious driving on two-lane roads.
CONCLUSIONS AND RECOMMENDATIONS
This article presented the results of a survey-based studyaimed at examining drivers’ response to several scenarios ofvisibility and traffic conditions on two types of roadways: free-ways and two-lane roads. In total, 566 responses were usedin the analysis. Conducting this survey using three approaches(handout, interactive, and online questionnaire) achieved a veryrepresentative sample (i.e., the sample was apparently broad andfairly uniform across age, gender, and education). No significantdifferences were found in the results from these three methodsof data collection.
Several categorical data analysis techniques were appliedto understand commuters’ behavior at adverse visibility condi-tions. These methods included conditional distributions, oddsratio, and chi-squared tests. The results revealed that partic-ipants’ stated response to CMS and VSL signs’ instructionsvaries by gender, age, familiarity with CMS and VSL signs,past experience with driving at adverse visibility condition, andinvolvement in FS/HR crashes.
The findings of MPM indicated that, compared to males andyounger drivers (18–25 years old), females and older drivers(51 years old or more) claim to be more likely to reduce theirspeed in response to CMS and VSL instructions when driving indifferent visibility (heavy or very light fog) and traffic conditions(low or medium–high). The results also indicated that driverswho are familiar with VSL signs claim to be more likely tofollow its instructions under heavy fog conditions than thosewho are not. Concerning the type of road, the findings showedthat the stated likelihood of reducing speed in response to CMSand VSL signs increases when driving on a two-lane road atadverse visibility condition compared to a freeway, possiblydue to the absence of a median.
A further objective of this study was to investigate whetherdrivers would rely on and follow warning messages displayedon CMS/VSL signs at adverse visibility conditions. Only 37%of the respondents reported that they would reduce their speedimmediately or reduce their speed and put blinkers on whenencountering a CMS that advises them to reduce their speeddue to reduced visibility condition, at low traffic volume whiledriving on a freeway. Also, it was found that only 35% of the
respondents were willing to follow VSL instructions (reducingtheir speed to 40 mph or less) while driving on a freeway withvery light fog and low traffic volume. Moreover, the results showthat as the visibility distance deteriorates and traffic volumeincreases, drivers claim to be more likely to follow CMS/VSLinstructions.
Based on the findings of the present study, several recom-mendations can be drawn as follows:
• Many respondents reported that speed limits displayed onVSL signs cannot be relied on since fog thickness is change-able every minute, and thus, the sign would not reflect theaccurate safe speed limit according to the current visibilitycondition. This implies that accurate and real-time detectionof visibility conditions is critical to the achievement of drivers’compliance. In this regard, traffic departments should makesure that speed limits and advice displayed on VSL/CMS areaccurate and change according the current visibility condi-tions in a timely and effective way. Otherwise, many driversmay lose their trust in and exceed the speed limit (NHTSA,2009).
• “Caution–fog ahead–reduce speed” was perceived as thewarning message (selected by about 38% of respondents)that would achieve the best safety and drivers’ compliancein case of reduced visibility due to fog. Since most of theCMS can display two pages of messages alternatively witheach message containing three lines of up to eight char-acters, the best message that can easily be displayed onCMS may be “Caution–Fog–Ahead” on the first page with“Reduce–Speed” on the second page.
• Using CMS and VSL signs together was reported by about64% of respondents as the best way to improve safety duringsuch inclement weather conditions. This is logical becausewarning drivers about reduced visibility using CMS shouldbe followed by informing them what they should do usingVSL signs (the safe speed at each visibility condition). Thiscould lead to accomplish more homogenous speeds in suchadverse visibility conditions. This result is consistent withprior studies such as Perrin et al. (2002).
• The majority of respondents (83%) stated that using two suc-cessive CMS prior to FS zones could provide drivers withanother chance to read the content of the second CMS if theymissed the first one (i.e., if the sign was occluded by othertraffic or due to poor visibility conditions). This practice istherefore recommended.
• Education or communication campaigns are recommendedto enhance the awareness of drivers regarding the impor-tance of following the warning messages displayed on bothCMS and VSL signs, especially when driving in heavy fogconditions. In this regard, younger drivers (18–25 years old)should be targeted for more education and awareness regard-ing the importance of these signs before obtaining the fulldriving license, particularly in states where fog is common.
• Only a minority of drivers stated that they are likely to fol-low CMS and VSL advice. The figure is particularly low for
intelligent transportation systems vol. 16 no. 3 2012
Dow
nloa
ded
by [
Uni
vers
ity o
f C
entr
al F
lori
da]
at 0
9:01
16
July
201
2

PREFERENCES IN REDUCED VISIBILITY CONDITIONS 145
young male drivers. This indicates a need for more enforce-ment. Strict penalties for repeat offenders, including increaseddriver’s license points, license suspension or revocation, andhigher fines, might be considered. This could improve drivers’behavior in such adverse conditions.
To improve safety under low visibility conditions, the afore-mentioned recommendations should be included among humanfactors guidelines for road systems. They may improve drivers’behavior in reduced visibility and improve drivers’ compliancewith VSL/CMS instructions. This could achieve more homoge-neous speeds and help to reduce accidents that may occur dueto sudden onset/appearance of fog or smoke.
The shortcoming of the present study is that the stated re-sponses may not be an accurate indication of actual responses.This would be a problem if there were a large variance betweenthe stated responses and actual behavior. However, a number ofprior studies (e.g., Loomis, 1993; West, French, Kemp, & Lan-der, 1993; Yannis et al., 2005) reported good agreement betweenself-reported responses and actual ones.
Another potential limitation of this study is the possibilityof strategic bias in the responses (i.e., some participants do notreveal their true preferences when there is gained benefits fromnot doing so). An example of strategic bias in this study mightbe respondents’ selection of the best warning message that doesnot reflect fine or enforcement warnings.
While actual values or percentages should be regarded withcare (i.e., be more on the conservative side), the directions andindications of the results are probably valid. Although it mightbe difficult, validating self-reported questionnaires with fielddata could be recommended in future studies to address thisconcern.
REFERENCES
Abdel-Aty, M., Vaughn, K., Kitamura, R., Jovanis, P., & Mannering,F. (1994). Models of commuters’ information use and route choice:Initial results based on a Southern California commuter route choicesurvey. Transportation Research Record, 1453, 46–55.
Abdel-Aty M., Jovanis P., & Kitamura R. (1996). The impact of ad-vanced transit information on commuters’ mode changing. Journalof Intelligent Transportation Systems, 3(2), 129–146.
Abdel-Aty, M., Kitamura R., & Jovanis, P. (1997). Using stated pref-erence data for studying the effect of advanced traffic informationon drivers’ route choice. Transportation Research Part C, 5(1), 39–50.
Ashford, R., & Sowden, R. (1970). Multivariate probit analysis. Bio-metrics, 26, 535–546.
Benson, B. (1996). Motorist attitudes about content of variable-message signs. Transportation Research Record, 1550, 48–57.
Broughton, K., Switzer, F., & Scott, D. (2007). Car following decisionsunder three visibility conditions and two speeds tested with a drivingsimulator. Accident Analysis & Prevention, 39, 106–116.
Carlsson, F., Daruvala, D., & Jaldell H. (2010). Preferences for lives,injuries, and age: A stated preference survey. Accident Analysis andPrevention, 42, 1814–1821.
Chatterjee, K., Hounsell, N., Firmin, P., & Bonsall, P. (2002). Driverresponse to variable message sign information in London. Trans-portation Research Record, 10, 149–169.
Choo, S., & Mokhtarian, P. (2008). How do people respond to con-gestion mitigation policies? A multivariate probit model of the indi-vidual consideration of three travel-related strategy bundles. Trans-portation Research Record, 35, 145–163.
Chorus, C., Arentze, T., & Timmermans, H. (2007). Travelers’ needfor information in traffic and transit: Results from a Web survey.Journal of Intelligent Transportation Systems, 11(2), 57–67.
Correia, G., & Viegas, J. (2011). Carpooling and carpool clubs: Clarify-ing concepts and assessing value enhancement possibilities througha stated preference Web survey in Lisbon, Portugal. TransportationResearch Part A, 45, 81–90.
Cummings, G., Harrison, W., & Rutstrim, E. (1995). Homegrown val-ues and hypothetical surveys: Is the dichotomous choice approachincentive-compatible? American Economic Review, 85(1), 260–266.
Das, A., Pande, A., Abdel-Aty, M., & Santos, J. (2008). Characteristicsof urban arterial crashes relative to proximity to intersections andinjury severity. Transportation Research Record, 2083, 137–144.
Dudek, C., & Ullman, G. (2002). Flashing messages, flashing lines, andalternating one line on changeable message signs. TransportationResearch Record, 1803, 94–101.
Dudek, C., Schrock, S., Ullman, G., & Chrysler, S. (2006). Flash-ing message features on changeable message signs. TransportationResearch Record, 1959, 122–129.
Edwards, J. (1999). Speed adjustment of motorway commuter trafficto inclement weather. Transportation Research Record, 2, 1–14.
Emmerink, R., Nijkamp, P., Rietveld, P., & Van Ommeren, J. (1996).Variable message signs and radio traffic information: An integratedempirical analysis of drivers’ route choice behavior. TransportationResearch Part A, 30(2), 135–153.
Fisher, B. (2009). The effects of survey question wording on rape esti-mates: Evidence from a quasi-experimental design. Violence AgainstWomen, 15(2), 133–147.
Gibbons, R., & Wilcox-Gok, V. (1998). Health service utilization andinsurance coverage: A multivariate probit approach. American Sta-tistical Association, 93(441), 63–72.
Greene, W. (2003). Econometric analysis (5th ed.). New York: PearsonEducation.
Harris, P., & Konheim, C. (1995). Public interest in, and willingnessto pay for, enhanced traveler information as provided by IVHS inthe New York Metropolitan Area. Proceedings of the 5th AnnualMeeting of ITS America, Washington, DC, March 15–17.
Hogema, J., & Horst, R. (1997). Evaluation of A16 motorway fog-signaling system with respect to driving behavior. TransportationResearch Record, 1573, 63–67.
Huang, H., Abdel-Aty, M., Ekram, A., Oloufa, A., Chen, Y., & Morrow,R. (2010). Fog and smoke related crashes in Florida: Identifyingcrash characteristics, spatial distribution and injury severity. TRBAnnual Meeting CD-ROM, paper 10–1323.
Iraguen, P., & Ortuzar, J. (2004). Willingness-to-pay for reducing fatalaccident risk in urban areas: an Internet-based Web page statedpreference survey. Accident Analysis and Prevention, 36, 513–524.
Johannesson, M., Liljas, B., & Johansson, P. (1998). An experimentalcomparison of dichotomous choice contingent valuation questionsand real purchase decisions. Applied Economics, 30(5), 643–647.
Junyi, Z., Akimasa, F., & Soe, T. (2008). Capturing travelers’ statedmode choice preferences under influence of income in Yangon City,
intelligent transportation systems vol. 16 no. 3 2012
Dow
nloa
ded
by [
Uni
vers
ity o
f C
entr
al F
lori
da]
at 0
9:01
16
July
201
2

146 H. M. HASSAN ET AL.
Myanmar. Transportation System and Information Technology, 8(4),49–62.
Khattak, A., Polydoropoulou, A., & Ben-Akiva, M. (1996). Modelingrevealed and stated pre-trip travel response to ATIS. TransportationResearch Record, 1537, 46–54.
Kilpelainen, M., & Summala, H. (2007). Effects of weather and weatherforecasts on driver behavior. Transportation Research Part F, 10,288–299.
Lai, C. (2010). Effects of color scheme and message lines of vari-able message signs on driver performance. Accident Analysis andPrevention, 42, 1003–1008.
Lai K., & Wong W. (2000). SP approach toward driver comprehensionof message formats on VMS. Transportation Engineering, 126(3),185–281.
Lai, C., & Yen, K. (2004). Sedan drivers’ attention and response tovariable message signs on freeway in Taiwan. Presented at 4th In-ternational Conference on Traffic and Transportation Psychology,Nottingham, UK, September 5–9.
Lansink, A., Berg, M., & Huirne, R. (2003). Analysis of strategicplanning of Dutch pig farmers using a multivariate probit model.Agricultural Systems, 78, 73–84.
Lee, C., Ran, B., Yang, F., & Loh, W. (2010). A hybrid tree approach tomodeling alternate route choice behavior with online information.Journal of Intelligent Transportation Systems, 14(4), 209–219.
Loomis, J. (1993). An investigation into the reliability of intendedvisitation behavior. Environmental and Resource Economics, 3(2),183–191.
Lu, B., & Song, X. (2006). Local influence analysis of multivariateprobit latent variable models. Multivariate Analysis, 97, 1783–1798.
Lu, H., Fowkes, T., & Wardman M. (2008). Amending the incentive forstrategic bias in stated preference studies. Transportation ResearchRecord, 2049, 128–135.
MacCarley, C., Ackles, C., & Watts, T. (2006). A study of the responseof highway traffic to dynamic fog warning and speed advisory mes-sages. TRB Annual Meeting CD-ROM, paper 06–3086.
Mahmassani, H., Huynh, N., Srinivasan, K., & Kraan, M. (2003). Trip-maker choice behavior for shopping trips under real-time informa-tion: Model formulation and results of stated-preference Internet-based interactive experiments. Retailing and Consumer Services,10, 311–321.
Maze, T., Agarwal, M. & Burchett, G. (2006). Whether weather mattersto traffic demand, traffic safety, and traffic operations and flow. TRBAnnual Meeting CD-ROM, paper 06–0808.
Meng, C., & Schmidt, P. (1985). On the cost of partial observabilityin the bivariate probit model. International Economic Review, 26,71–76.
Mohanty, M. (2002). A bivariate probit approach to the determinationof employment: A study of teen employment differentials in LosAngeles County. Applied Economics, 34, 143–156.
National Highway Traffic Safety Administration. (2009). Countermea-sures that work: A highway safety countermeasures guide for statehighway safety office (4th ed.). NHTSA, Washington, DC.
Neale, V., Perez, M., Lee, S., & Doerzaph Z. (2007). Investigation ofdriver-infrastructure and driver–vehicle interfaces for an intersec-tion violation warning system. Journal of Intelligent TransportationSystems, 11(3), 133–142.
Ng, S., Cheu, R., & Lee, D. (2006). Simulation evaluation of thebenefits of real-time traffic information to trucks during inci-dents. Journal of Intelligent Transportation Systems, 10(2), 89–99.
Peeta S., Ramos J., & Pasupathy R. (2000). Content of variablemessage signs and on-line driver behavior. TRB Annual MeetingCD-ROM.
Perrin, J., Martin, P., & Coleman, B. (2002). Testing the Adverse Vis-ibility Information System Evaluation (ADVISE)—Safer driving infog. TRB Annual Meeting CD-ROM, paper 02–3140.
Pisano, P., & Goodwin, L. (2004). Research needs for weather-responsive traffic management. TRB Annual Meeting CD-ROM.
Rentziou, A., Milioti, C., Gkritza, K., & Karlaftis, M. (2010). Urbanroad pricing: Modeling public acceptability. TRB Annual MeetingCD-ROM, paper 10–0799.
Tilahun, N., Levinson, D., & Krizek, K. (2007). Trails, lanes, or traffic:Valuing bicycle facilities with an adaptive stated preference survey.Transportation Research Part A, 41, 287–301.
Transit Cooperative Research Program. (2006). Web-based survey tech-niques, A synthesis of transit practice. TRB Annual Meeting CD-ROM. Washington, DC: TCRP.
Tsirimpa, A., & Polydoropoulou, A. (2007). Development of a mixedmultinomial logit model to capture the impact of information sys-tems on travelers’ switching behavior. Journal of Intelligent Trans-portation Systems, 11(2), 79–89.
Ullman, B., Ullman, G. & Dudek, C. (2007). Driver understandingof messages displayed on sequential portable changeable mes-sage signs in work zones. TRB Annual Meeting CD-ROM, paper07–1487.
Viti, F., & van Zuylen, J. J. (2009). The dynamics and the uncer-tainty of queues at fixed and actuated controls: A probabilistic ap-proach. Journal of Intelligent Transportation Systems, 13(1), 39–51.
Wang, J., & Cao, Y. (2005). Assessing message display formats ofportable variable message signs. Transportation Research Record,1937, 113–119.
Wardman, M., Bonsall, P., & Shires, J. (1997). Driver response tovariable message signs: A stated preference investigation. Trans-portation Research Part C, 5(6), 389–405.
West, R., French, D., Kemp, R., & Lander, J. (1993). Direct observationof driving, self reports of driving behavior and accident involvement.Ergonomics, 36(5), 557–567.
Yannis, G., Kanellopoulou, A., Aggeloussi, K., & Tsamboulas, D.(2005). Modeling driver choices towards accident risk reduction.Safety Science, 43, 173–186.
Young, G., Valdez, E., & Kohn, R. (2009). Multivariate probit mod-els for conditional claim types. Mathematics and Economics, 44,214–228.
intelligent transportation systems vol. 16 no. 3 2012
Dow
nloa
ded
by [
Uni
vers
ity o
f C
entr
al F
lori
da]
at 0
9:01
16
July
201
2