public utilities commission state of hawaii annual …
TRANSCRIPT

PUBLIC UTILITIES COMMISSION
STATE OF HAWAII
ANNUAL REPORT(HAW. REV. STAT. § 269-5)
FISCAL YEAR 2010-11
NOVEMBER 2011

TABLE OF CONTENTS
I. EXECUTIVE SUMMARY..................................................................... 5
II. INTRODUCTION.................................................................................. 7
A. DIAGRAM OF RESPONSIBILITY............................................................................... 8
III. COMMISSION HISTORY AND COMMISSIONERS........................ 9
A. HISTORY ......................................................................................................................... 9
B. COMMISSIONERS ......................................................................................................... 9
C. ADMINISTRATION AND OFFICES.......................................................................... 11
IV. GOALS AND OBJECTIVES OF COMMISSION............................. 12
A. PRIMARY PURPOSE................................................................................................... 12
B. LONG-TERM GOALS.................................................................................................. 12
C. SHORT-TERM GOALS................................................................................................ 12
V. CLEAN ENERGY LEGISLATIVE MANDATES.............................. 13
A. RENEWABLE PORTFOLIO STANDARDS.............................................................. 13
B. NET ENERGY METERING ........................................................................................ 15
C. PUBLIC BENEFITS FEE ............................................................................................. 17
D. ENERGY EFFICIENCY PORTFOLIO STANDARDS............................................. 21
VI. ADMINISTRATIVE UPDATE ........................................................... 22
A. FISCAL INFORMATION............................................................................................. 23
VII. REGULATORY ISSUES AND PROCEEDINGS .............................. 26
A. DOCKET PROCEEDINGS .......................................................................................... 26
B. MAJOR REGULATORY ISSUES............................................................................... 28
C. ELECTRICITY AND ENERGY PROCEEDINGS .................................................... 29
D. GAS PROCEEDINGS ................................................................................................... 46
E. TELECOMMUNICATIONS PROCEEDINGS .......................................................... 47
F. PRIVATE WATER AND SEWAGE UTILITIES PROCEEDINGS ........................ 50
G. MOTOR CARRIERS PROCEEDINGS ...................................................................... 52
H. WATER CARRIERS PROCEEDINGS....................................................................... 57
VIII. ENFORCEMENT ACTIVITIES.................................................. 60
A. COMPLAINT RESOLUTION...................................................................................... 60
B. MOTOR CARRIER CITATIONS ............................................................................... 64
IX. INQUIRIES.......................................................................................... 65

X. HAWAII ONE CALL CENTER.......................................................... 66
XI. UTILITY COMPANY OPERATIONS, CAPITALIMPROVEMENTS, AND RATES ...................................................... 68
A. UTILITY COMPANY OPERATIONS........................................................................ 68
B. FORECASTED CAPITAL IMPROVEMENTS ......................................................... 74
C. RATES OF MAJOR UTILITY COMPANIES ............................................................. 0
XII. UTILITY COMPANY PERFORMANCE........................................... 85
A. ELECTRIC UTILITIES EFFICIENCY AND SERVICE QUALITY...................... 85
B. TELECOMMUNICATIONS SERVICE QUALITY MEASUREMENTS............. 110
XIII. LEGISLATION ENACTED BY 2011 LEGISLATUREAFFECTING PUBLIC UTILITIES................................................. 119
A. 2011 LEGISLATIVE MEASURES RELATING TO THE PUBLIC UTILITIESCOMMISSION:............................................................................................................ 119
B. OTHER 2011 LEGISLATIVE MEASURES RELATING TO UTILITIES .......... 121
XIV. FEDERAL ISSUES AND ACTIVITIES ...................................... 122
A. FEDERAL UNIVERSAL SERVICE FUND (“USF”) ELIGIBLETELECOMMUNICATIONS CARRIERS (“ETC”) – ANNUALRECERTIFICATION.................................................................................................. 122
B. PROPOSED AMENDMENTS TO UNITED STATES CLEAN AIR ACTEMISSIONS RULES AFFECTING FOSSIL FUEL-BASED ELECTRIC POWERPLANTS ........................................................................................................................ 123
XV. PREVIEW FISCAL YEAR 2011-12 ................................................. 125

Public Utilities Commission Annual Report 2010-11State of Hawaii Page 1
TERMS AND ACRONYMS USED HEREIN
“ACEEE” – American Council for an Energy-Efficient Economy
“AMI” – Advanced Metering Infrastructure
“ARMIS” – Automated Reporting Management Information System
“ARRA” – American Recovery & Reinvestment Act of 2009
“ASA” - Average Service Availability
“btu” - British thermal unit
“CAIDI” - Customer Average Interruption Duration Index
“CESP” – Clean Energy Scenario Planning
“CETC” – Competitive Eligible Telecommunications Carrier
“CFL” – Compact Fluorescent Light
“C&I” – Commercial & Industrial
“CI” – Customer Interruptions
“CID” – Customer Interruption Duration
“CIP” – capital improvement project
“CIS” – Customer Information System
“CFR” - Code of Federal Regulations
“Commission” – Hawaii Public Utilities Commission
“Consumer Advocate” – Hawaii Department of Commerce & Consumer Affairs - Division ofConsumer Advocacy
“CPCN” - certificate for public convenience and necessity
“DOE” – Department of Energy
“DSL” - Digital Subscriber Line
“DSM” - Demand Side Management
“ECAC” – Energy Cost Adjustment Clause
“EE” – energy efficiency
“EEPS” – Energy Efficiency Portfolio Standards
“EGUs” – Electric Utility Steam Generating Units

Public Utilities Commission Annual Report 2010-11State of Hawaii Page 2
“EPA” - Environmental Protection Agency
“ERAC” – Energy Rate Adjustment Clause
“ETC” – Eligible Telecommunications Carrier
“FCC” - Federal Communications Commission
“FIT” – feed-in tariff
“FY” – Fiscal Year”
“HAP” – Hazardous Air Pollutants
“HAR” – Hawaii Administrative Rules
“HECO” – Hawaiian Electric Company, Inc.
“HELCO” – Hawaii Electric Light Company, Inc.
“HRS” – Hawaii Revised Statutes
“HSCCCA” – Hawaii State Certified Common Carriers Association
“HT” – Hawaiian Telcom, Inc.
“HTSC” – Hawaiian Telcom Services Company, Inc.
“ICA” – Intermediate Court of Appeals
“IF” – Independent Facilitator
“ILEC” – Incumbent Local Exchange Carrier
“IO” – Independent Observer
“IRP” - Integrated Resource Planning
“KIUC” – Kauai Island Utility Cooperative
“kV” – kilovolts
“kw” – kilowatts
“kwh” – kilowatt hour
“LSFO” – Low Sulfur Fuel Oil
“MATS” - Mercury and Air Toxics Standards
“M&V” – Measurement & Verification
“MECO” – Maui Electric Company, Limited
“MPU” – Molokai Public Utilities, Inc.

Public Utilities Commission Annual Report 2010-11State of Hawaii Page 3
“MSFO” – Medium Sulfur Fuel Oil
“MW” – Megawatts
“MWh” – Megawatt hour
“NARUC” – National Association of Regulatory Utility Commissioners
“NEM” – Net Energy Metering
“OOS” – Out of Service
“PBF” – Public Benefits Fee
“PPA” – purchase power agreement
“PUC” – Public Utilities Commission
“PGV” – Puna Geothermal Venture
“PV” - Photovoltaic
“PY” – Program Year
“RAM” – Revenue Adjustment Mechanism
“RBA” – Revenue Balancing Account
“RCx” – Retro Commissioning
“REI” – Renewable Energy Infrastructure
“REIP” – Renewable Energy Infrastructure Program
“RFP” – request for proposal
“RFS” – request for services
“RICE NESHAP” - Reciprocating Ignition Combustion Engines National Emission Standards forHazardous Air Pollutants
“RPS” – Renewable Portfolio Standards
“RSWG” – Reliability Standards Working Group
“SAIC” – Science Applications International Corporation
“SAIDI” - System Average Interruption Duration Index
“SAIFI” - System Average Interruption Frequency Index
“SBRRB” - Small Business Regulatory Review Board
“SLH” – Session Laws of Hawaii

Public Utilities Commission Annual Report 2010-11State of Hawaii Page 4
“SNG” – synthetic natural gas
“SOP” – Statement of Position
“Special Fund” – Hawaii Public Utilities Commission Special Fund
“USF” – Universal Service Fund
“TAG” – Technical Advisory Group
“TGC” – The Gas Company
“TIER” – Times Interest Earned Ratio
“TPA” – Third Party Administrator
“TRB” – Total Resource Benefit
“TRS” – Telecommunications Relay Services
“WCPSC” – Western Conference of Public Service Commissioners
“WMTB” – Western Motor Tariff Bureau, Inc.
“WTI” – West Texas Intermediate
“YB” – Young Brothers, Limited
“YTD” – Year-to-Date

Public Utilities Commission Annual Report 2010-11State of Hawaii Page 5
I. EXECUTIVE SUMMARY
This Annual Report is prepared pursuant to Section 269-5, Hawaii RevisedStatutes (HRS), and is one of the few opportunities for the Hawaii Public UtilitiesCommission (Commission) to publicly share its goals and objectives, update itsaccomplishments, track data and trends in a comprehensive way, and shed light on the innerworkings of the Commission through a summarization of key regulatory proceedings. To reflectthe most current information where possible, please note that summaries of regulated utilityreports, financial, and budget information reflect the State’s fiscal year ended June 30, 2011,i.e., Fiscal Year (“FY”) 2011. Discussions of dockets or other proceedings before theCommission reflect a status as of November 15, 2011.
The Commission is responsible for regulating 220 utility companies, 4 water carriers,680 passenger carriers and 582 property carriers in the State (Section II.A. Diagram ofResponsibility). During the FY, the Commission opened 369 new dockets relating to thoseregulated utilities and transportation companies, completed and disposed of 363 dockets from itstotal case load, and issued 846 decisions and orders (Section VII.A. Docket Proceedings).
In addition to the Commission’s traditional duty to oversee and regulate public utilities toensure the provision of essential and reliable service at just and reasonable rates, the Legislaturehas entrusted the Commission with increased authority and discretion in implementing the State’sclean energy policies. Three major legislative mandates, the Renewable Portfolio Standard, theEnergy Efficiency Portfolio Standard and the Public Benefits Fee are key energy policies drivingthe Commission (Section V. Clean Energy Legislative Mandates). Given the State’s overalldesire to promote clean energy policies to stabilize Hawaii’s economy and move towards energyindependence, the majority of the Commission’s time and resources are devoted to this sector.
As the high cost of energy reverberates in every sector of Hawaii’s economy, theCommission is working aggressively to review fixed priced contracts in an effort to “delink”electricity prices from oil costs and provide ratepayers with stable, long-term, and predictablypriced contracts. However, the most cost-effective means of providing relief to the electricityconsumer is through energy efficiency and conservation.
According to the American Council for an Energy-Efficient Economy’s (ACEEE)2011 State Energy Efficiency Scorecard, Hawaii is ranked twelfth in energy efficiency for asecond year. The annual scorecard, in its fifth year, is a comprehensive ranking of states basedon metrics capturing best practices and effective leadership in energy efficiency policy andprogram implementation. In the amount of electricity the state actually saved, Hawaii ranked thirdin terms of overall energy savings and tenth for its energy efficiency program and policies. Thestate scored zero points in the natural gas category because there is no natural gas service inHawaii. As such, the inability to rate the state in that category, dropped Hawaii’s overall rankingfrom ten to twelve.
To view the ACEEE report in its entirety, go to http://aceee.org/research-report/e115.
Public utilities, like the customers they serve and the society and economy in which theyoperate, continue to undergo significant changes due to rapid developments in technology,markets, economic conditions, consumer needs and environmental concerns. The Commissionis not a static and reactive structure and acknowledges these changing conditions and the needto update regulatory practices and approaches to develop the requisite knowledge and skill setsto timely address and align the performance of regulated entities to serve the public interest in themost efficient and cost-effective manner. Therefore, adequate staffing and resources are ofcritical importance to the Commission’s ability to carry out its statutory duties.
Public Utilities Commission Annual Report 2010-11State of Hawaii Page 6
In response to Act 143, Session Laws of Hawaii 2006, the Commission conducted anin-depth review of its organization to develop a comprehensive plan to restructure andsupplement the Commission and its resources to function more effectively and efficiently in lightof, among other matters, changing regulatory conditions, duties, and requirements, and advancesin technology. In FY 2011, the Commission, for the first time since the approval of itsreorganization plan enacted in Act 177, Session Laws of Hawaii 2007, was appropriated fundingfor all positions recommended within the plan, increasing the Commission’s total full-time,permanent position count to 62. However, a key component to the reorganization plan, therelocation of the Commission’s entire Oahu office, was not approved. The relocation of theCommission’s office is required to accommodate all existing and newly created reorganizationpositions and to meet the Commission’s specific needs for a hearing room and adequatedocument storage space. Therefore, due to lack of adequate space, the Commission prioritizedand focused on four (4) key reorganization positions to recruit for while backfilling existingpositions. This, unfortunately, resulted in the Commission having to refrain from recruiting forseventeen (17) funded positions.
The Public Utilities Commission Special Fund (“Special Fund”) is used to cover theoperating expenses of the Commission and Consumer Advocate. The Special Fund sources ofincome include public utility fees, motor carrier fees, penalties and interest, application andintervention filing fees, Hawaii One Call Center fees and duplication fees. For FY 2011, theregulated utilities and transportation carriers paid $15,785,126 in public utility fees and$1,253,281 in motor carrier fees, respectively. The total revenues of the Commission’sSpecial Fund were $17,165,178 for FY 2011.
Pursuant to Section 269-33, HRS, any amount over $1,000,000 remaining in theSpecial Fund at the end of each fiscal year is transferred to the State’s general fund. ForFY 2011, an excess balance of $9,755,240 from the Special Fund was transferred to the generalfund. This excess balance amount transfer includes the balance of the moneys appropriatedthrough Act 180, SLH 2010, the 2010 Appropriations Act (Section VI.A. Fiscal Information).
In FY 2011, the Commission’s ARRA grant allowed for the staffing of two (2) temporarypositions and twenty (20) training opportunities attended by a total of 116 staff (many staffattended more than one training opportunity). Commission staff, through these trainingopportunities, increased their technical knowledge specifically in the evolving electricity industryand was fortunate enough to be trained by experts from entities such as the National Associationof Regulatory Utility Commissioners (NARUC), New Mexico State University’s Center for PublicUtilities, National Regulatory Research Institute, U. S. Department of Energy, Michigan StateUniversity Institute of Public Utilities, National Renewable Energy Laboratory, and SandiaNational Laboratories, among others.
As we enter FY 2012, the Commission continues to put a high priority on technical stafftraining in addition to a renewed focus on strategic planning in establishing the Commission as akey policy leader and driver, particularly in the area of energy, and to fulfill the Commission’sprimary purpose as an effective regulator to align the performance of regulated companies withthe public interest.

Public Utilities Commission Annual Report 2010-11State of Hawaii Page 7
II. INTRODUCTION
The Public Utilities Commission of the State of Hawaii submits this Annual Reportpursuant to Section 269-5, Hawaii Revised Statutes (HRS). This report summarizes theCommission’s accomplishments, state its goals and objectives and track data and trends in acomprehensive way. Typically, the report would cover the fiscal year from July 1, 2010 toJune 30, 2011. As this is one of the few opportunities for the Commission to publicly share andshed light on the inner workings of the Commission, to reflect the most current information wherepossible, the summarization of key regulatory dockets, discussion on other proceedings beforethe Commission and other narratives are as of November 15, 2011. Regulated utility reports,financial, and budget information reflect the State’s fiscal year ending June 30, 2011, i.e.,Fiscal Year (“FY”) 2011.
The Commission is responsible for regulating all chartered, franchised, certificated, andregistered public utility companies that provide electricity, gas, telecommunications, private waterand sewage, and motor and water carrier transportation services in the State. The Commissionhas statutory authority to establish and enforce applicable state statutes, administrative rules andregulations, and to set policies and standards.
It also oversees the administration of a one call center that provides advance warning toexcavators of the location of subsurface installations in the area of an excavation in order toprotect those installations from damage; and the public benefits fee surcharge, established in2010, which is used to fund and support energy efficiency programs and services implemented byan independent third party administrator on the islands of Oahu, Maui, Molokai, Lanai, andHawaii.
Public utilities, like the customers they serve and the society and economy in which theyoperate, continue to undergo significant changes due to rapid developments in technology,markets, economic conditions, consumer needs and environmental concerns. The Commissionis not a static and reactive structure and acknowledges these changing conditions and the needto update regulatory practices and approaches to develop the requisite knowledge and skill setsto timely address and align the performance of regulated entities to serve the public interest in themost efficient and cost-effective manner to provide customers with reliable services at reasonablerates.
In addition to the Commission’s traditional duty to oversee and regulate public utilities toensure the provision of essential and reliable service at just and reasonable rates, the Legislaturehas entrusted the Commission with increased authority and discretion in implementing the State’sclean energy policies. Three major legislative mandates, the Renewable Portfolio Standard, theEnergy Efficiency Portfolio Standard and the Public Benefit Fee are key energy policies drivingthe Commission. Given the State’s overall desire to promote clean energy policies to stabilizeHawaii’s economy and move towards energy independence, the majority of the Commission’stime and resources are devoted to this sector.
As described in greater detail herein, the Commission has aggressively sought toimplement the State’s energy policy through the implementation of net energy metering,feed-in-tariffs, renewable energy infrastructure surcharge program, decoupling, third partyadministration of energy efficiency programs, energy efficiency portfolio standards framework,and an update of the integrated resource planning process to incorporate clean energy scenarioplanning, among other matters.
Again, despite these additional policy-making and implementation duties, theCommission’s traditional duty to oversee and regulate public utilities so that they provide reliable

Public Utilities Commission Annual Report 2010-11State of Hawaii Page 8
service at just and reasonable rates to protect consumers remain, and the Commission mustcontinue to balance its traditional regulatory duties with the need to implement energy policy.
A. DIAGRAM OF RESPONSIBILITY
The Commission is responsible for regulating all chartered, franchised, certificated, andregistered public utility companies that provide electricity, gas, telecommunications, private waterand sewage, and motor and water carrier transportation services in the State of Hawaii. TheCommission has statutory authority to establish and enforce applicable state statutes,administrative rules and regulations, and to set policies and standards.

Public Utilities Commission Annual Report 2010-11State of Hawaii Page 9
III. COMMISSION HISTORY AND COMMISSIONERS
A. HISTORYThe Commission was established in 1913 by Act 89, SLH 1913, as a part-time,
three-member body with broad regulatory oversight and investigative authority over all publicutility companies doing business in the Territory of Hawaii. This act, amended over the years andcodified in Chapter 269, HRS, is the basis for utility regulation in Hawaii. The Commission’sauthority to regulate various classifications of motor carriers of passengers and property isderived from the Hawaii Motor Carrier Law (Chapter 271, HRS) enacted in 1961. Responsibilityfor all commercial water transportation carriers of persons and property within the State is derivedfrom the Hawaii Water Carrier Act of 1974 (Chapter 271G, HRS). Chapter 6-61, “Rules ofPractice and Procedure before the Public Utilities Commission,” of the Hawaii AdministrativeRules (“HAR”) sets forth general procedural requirements for intervention and participation inproceedings before the Commission. Other HARs and general orders of the Commission setforth the standards, rules, and other procedures governing electric, gas, telecommunications,private water and sewage, and motor and water carrier transportation services.
Today, the Commission is a full-time body comprised of three (3) Commissioners. TheGovernor, with the consent of the State Senate, appoints the Commissioners. They each servesix-year terms on a staggered basis.
B. COMMISSIONERS
Hermina M. Morita, Chair1
Hermina M. Morita was appointed to the Public Utilities Commissionand named Chair of the Commission on February 3, 2011 byGovernor Neil Abercrombie for a term to expire on June 30, 2014.Upon her confirmation on March 14, 2011, Chair Morita resignedfrom her position in the State of Hawaii House of Representativesrepresenting East and North Kauai to Chair the Commission onMarch 15, 2011. She served as a Legislator for fifteen years,thirteen years as the Chair of the House Energy & EnvironmentalProtection Committee. Prior to her experience as a Legislator,Chair Morita worked as a business manager in the retail,construction and visitor sectors. She also served on theKauai Planning Commission and Kauai Police Commission.
1Chair Morita fills the vacancy created through the resignation of Commission Leslie H.
Kondo on January 10, 2011.

Public Utilities Commission Annual Report 2010-11State of Hawaii Page 10
Carlito P. Caliboso, Commissioner2
Carlito P. Caliboso was appointed to the Public UtilitiesCommission by Governor Linda Lingle on April 30, 2003. In 2004, hewas reappointed to a full term through June 30, 2010. In 2010, hewas reappointed to another term, which he may serve throughApril 29, 2015. He served as Chairman of the Commission fromApril 2003 to March 2011.
Commissioner Caliboso is a member of the Board of Directorsof the National Association of Regulatory Utility Commissioners(“NARUC”), which is an association representing the State publicservice commissioners who regulate essential utility services
throughout the country. He served as President of the Western Conference of Public ServiceCommissioners ("WCPSC") from 2008-2009. From 2004 to 2009, Commissioner Calibososerved two terms on the Federal Communication Commission's ("FCC") IntergovernmentalAdvisory Committee (“IAC”), which is comprised of 15 elected and appointed officials ofmunicipal, county, state, and tribal governments, most recently as the Vice Chair of the IAC. In2010, the FCC appointed him to its FCC-State Joint Conference on AdvancedTelecommunications Services.
Prior to joining the Commission, Mr. Caliboso practiced law in Hawaii for over 11 years.His primary areas of practice were in business and transactional matters. CommissionerCaliboso earned a Bachelor of Business Administration degree from the College of BusinessAdministration at the University of Hawaii with a double major in Finance and in Management in1984; a Juris Doctor degree from the William S. Richardson School of Law at the University ofHawaii in 1991, and an Executive MBA degree from the Shidler College of Business at theUniversity of Hawaii in 2009.
John E. Cole, Commissioner
John E. Cole was appointed to the Commission byGovernor Linda Lingle on April 24, 2006 for a term to expire onJune 30, 2012.
Prior to his appointment, Commissioner Cole served asExecutive Director of the Division of Consumer Advocacy of theHawaii State Department of Commerce and Consumer Affairs. InMay 2005, Commissioner Cole was appointed as a member of theFCC’s Consumer Advisory Committee to advise the FCC onconsumer issues within the FCC’s jurisdiction and to facilitate theparticipation of consumers in proceedings before the FCC. He is also
a member of NARUC and serves on NARUC’s Committee on Energy Resources and theEnvironment, and the Committee on Consumer Affairs. In 2010, Commissioner Cole accepted aninvitation to participate in the State Energy Efficiency Action Network working group on CustomerInformation and Behavior.
Commissioner Cole earned a bachelor’s degree in biology from UH-Manoa and alaw degree from Washington University School of Law.
2Mr. Caliboso resigned from the Commission effective September 1, 2011. This vacancy
was filled on September 15, 2011 through an interim appointment by Governor Neil Abercrombiewhen Michael E. Champley was appointed as Commissioner subject to Article V, Section 6 of theConstitution of the State of Hawaii.

Public Utilities Commission Annual Report 2010-11State of Hawaii Page 11
C. ADMINISTRATION AND OFFICESThe Commission is comprised of three commissioners and, as of June 30, 2011, a staff
of 39 employees. These employees include an administrative director, attorneys, engineers,auditors, researchers, investigators, neighbor island representatives for Kauai, Maui County andHawaii, documentation staff, and clerical staff. The Commission has four offices locatedthroughout the State:
OAHU: Public Utilities CommissionKekuanaoa Building465 South King Street, #103Honolulu, HI 96813Phone: (808) 586-2020Fax: (808) 586-2066
KAUAI: PUC Kauai District Office3060 Eiwa Street, #302-CLihue, HI 96766Phone: (808) 274-3232Fax: (808) 274-3233
MAUI: PUC Maui District OfficeState Office Building #154 S. High Street, #218Wailuku, HI 96793Phone: (808) 984-8182Fax: (808) 984-8183
HAWAII: PUC Hawaii District Office688 Kinoole Street, #106-AHilo, HI 96720Phone: (808) 974-4533Fax: (808) 974-4534
Email: [email protected]: www.hawaii.gov/budget/puc/
For administrative purposes, the Commission is placed under the Department of Budgetand Finance.
3
3Haw. Rev. Stat. §§ 26-8, 26-35, 269-2, as amended.

Public Utilities Commission Annual Report 2010-11State of Hawaii Page 12
IV. GOALS AND OBJECTIVES OF COMMISSION
As we enter FY 2012, the Commission continues to put a high priority on technical stafftraining in addition to a renewed focus on strategic planning in establishing the Commission as akey policy leader and driver, particularly in the area of energy, and to fulfill the Commission’sprimary purpose as an effective regulator to align the performance of regulated companies withthe public interest. These strategic planning sessions will not be scheduled until early 2012,therefore, the description of the Commission’s primary purpose, long-term and short-term goalshave not been revised since the last year’s annual report.
A. PRIMARY PURPOSEThe Commission’s primary purpose is to ensure that regulated companies efficiently and
safely provide their customers with adequate and reliable services at just and reasonable rates,while providing regulated companies with a reasonable opportunity to earn a fair rate of return.
B. LONG-TERM GOALSModernize and re-organize the Commission as needed to adapt to changes in
technology, markets, economic conditions, consumer needs, and environmental concerns toimprove the efficiency and effectiveness of the Commission.
Foster and encourage competition or other alternatives where reasonably feasible in aneffort to provide consumers with meaningful choices for services at lower rates that are just andreasonable.
Promote and encourage efficient and reliable production and delivery of all utilityservices. Promote and encourage efficient and reliable electricity generation, transmission anddistribution.
Promote and encourage the use of alternative, renewable, and clean energy resourcesfor the production of electricity to increase the efficiency, reliability, and sustainability of electricitygeneration and supply for consumers.
Assist in creating an environment conducive for healthy economic growth and stability inthe public interest.
C. SHORT-TERM GOALSIncrease the transparency of the regulatory process and public access to the
Commission to ensure that the Commission efficiently, independently, fairly, and impartiallyregulates public utilities.
Streamline and modernize the regulatory process whenever reasonably feasible toincrease the efficiency of the Commission and regulated utilities.
Re-evaluate and update internal Commission staff procedures to increase the efficiencyand effectiveness of Commission activities.

Public Utilities Commission Annual Report 2010-11State of Hawaii Page 13
V. CLEAN ENERGY LEGISLATIVE MANDATES
A. RENEWABLE PORTFOLIO STANDARDS
Today’s Renewable Portfolio Standards (“RPS”) requirements, as codified in HawaiiRevised Statutes (“HRS”) §§ 269-91 through 269-95 call for each electric utility company sellingelectric power in Hawaii to meet a graduated RPS plan culminating at forty percent of netelectricity sales by December 31, 2030. RPS is defined in local statute as “the percentage ofelectrical energy sales that is represented by renewable electrical energy,” where “renewableelectrical energy” is currently defined for RPS purposes as both electrical energy generated fromrenewable energy sources and electrical energy savings from either renewable displacementtechnologies, off-set technologies, or energy efficiency technologies. However, the law statesthat electrical energy savings from any technology source will no longer be eligible to counttoward meeting a utility’s RPS requirements starting January 1, 2015. Significant provisions ofHawaii’s RPS law are included:
§269-92 Renewable portfolio standards.
(a) Each electric utility company that sells electricity for consumptionin the State shall establish a renewable portfolio standard of:
(1) Ten per cent of its net electricity sales by December 31,2010;
(2) Fifteen per cent of its net electricity sales byDecember 31, 2015;
(3) Twenty-five per cent of its net electricity sales byDecember 31, 2020; and
(4) Forty per cent of its net electricity sales by December 31,2030.

Public Utilities Commission Annual Report 2010-11State of Hawaii Page 14
For the docket proceeding discussing the most recent developments concerning RPSsee Section VII.C.1.a “Renewable Portfolio Standards Law – Docket No. 2007-0008.”
Power Purchase Agreements approved since July 1, 2010
Docket No. Island Project Size Technology2010-0179 Kauai Kapaa Solar 1 MW Solar2010-0279 Maui Kaheawa II 21 MW+Battery Wind2010-0307 Kauai Poipu Solar, LLC 3 MW Solar2011-0051 Oahu Kalaeloa Solar II 5 MW Solar2011-0060 Maui Auwahi Wind Energy LLC 21 MW + Battery Wind
Total 51 MW
Power Purchase Agreements filed this year and pending before the Commissionas of November 2011
Docket No. Island Project Size Technology2011-0015 Oahu IC Sunshine LLC (solar PV farm
in Campbell Industrial Park)5 MW Solar
2011-0040 Big Island Puna Geothermal Expansion 8 MW Geothermal2011-0032 Kauai Green Energy Team LLC 6.7 MW Biomass2011-0180 Kauai McBryde Sugar 6 MW Solar + Battery2011-0185 Oahu Kapolei Sustainable Energy Park 1 MW Solar2011-0224 Oahu Kawailoa Wind 70 MW Wind
Total 96.7 MW
Public Utilities Commission Annual Report 2010-11State of Hawaii Page 15
B. NET ENERGY METERING
In 2001, Hawaii first enacted a Net Energy Metering law that was set in HRS §§ 269-101through 269-111 in order to provide the legal framework to allow electric utility customers withpersonal electric generation capacity to feed excess energy back to electric utilities. Significantportions of Hawaii’s current Net Energy Metering law are included below:
§269-102 Standard contract or tariff; rate structure.
(a) Every electric utility shall develop a standard contract or tariffproviding for net energy metering and shall make this contractavailable to eligible customer-generators, upon request, on afirst-come-first-served basis until the time that the total ratedgenerating capacity produced by eligible customer-generatorsequals .5 per cent of the electric utility's system peak demand;provided that the public utilities commission may modify, by ruleor order, the total rated generating capacity produced by eligiblecustomer-generators; provided further that the public utilitiescommission shall ensure that a percentage of the total ratedgenerating capacity produced by eligible customer-generatorsshall be reserved for electricity produced by eligible residential orsmall commercial customer-generators. The public utilitiescommission may define, by rule or order, the maximum capacityfor eligible residential or small commercial customer-generators.Notwithstanding the generating capacity requirements of thissubsection, the public utilities commission may evaluate, on anisland-by-island basis, the applicability of the generating capacityrequirements of this subsection and, in its discretion, mayexempt an island or a utility grid system from the generatingcapacity requirements.
(b) Each net energy metering contract or tariff shall be identical, withrespect to rate structure, to the contract or tariff to which thesame customer would be assigned if the customer was not aneligible customer-generator. The charges for all retail ratecomponents for eligible customer-generators shall be basedexclusively on the eligible customer-generator's net kilowatt-hourconsumption over a monthly billing period. Any new or additionaldemand charge, standby charge, customer charge, minimummonthly charge, interconnection charge, or other charge thatwould increase an eligible customer-generator's costs beyondthose of other customers in the rate class to which the eligiblecustomer-generator would otherwise be assigned are contrary tothe intent of this section, and shall not form a part of net energymetering contracts or tariffs.
(c) The public utilities commission may amend the rate structure orstandard contract or tariff by rule or order.
For the docket proceeding discussing the most recent developments concerning NetEnergy Metering see Section VII.C.1.d “Net Energy Metering – Docket No. 2006-0084.”

Public Utilities Commission Annual Report 2010-11State of Hawaii Page 16
Current Net Energy Metered Systems Installed as of November 2011
Island NEM Installed Size (MW)Oahu 29.8Hawaii Island 7Maui 7.11Lanai .05Molokai .64Kauai 2.8
Total 47.4
Current Feed in Tariff in queue as of November 2011 – Total 35.44 MW
System Tier 1 MW Tier 2 MWHECO .421 29.1MECO .096 3.3HELCO .027 2.5
Total .544 34.9

Public Utilities Commission Annual Report 2010-11State of Hawaii Page 17
C. PUBLIC BENEFITS FEE
The Legislature has expressly provided for the use of demand-side management feesinitiated by the Commission and collected by local electric utilities, which today makes upHawaii’s Public Benefits Fee (“PBF”) law under HRS §§ 269-121 through 269-125. Today’sPBF law, in relevant part, is included:
§269-121 Public benefits fee authorization.
(a) The public utilities commission, by order or rule, may require thatall or a portion of the moneys collected by Hawaii's electricutilities from its ratepayers through a demand-side managementsurcharge be transferred to a third-party administrator contractedby the public utilities commission. The moneys transferred shallbe known as the public benefits fee.
(b) The public benefits fee shall be used to support energy-efficiencyand demand-side management programs and services, subjectto the review and approval of the public utilities commission.These moneys shall not be available to meet any current or pastgeneral obligations of the State; provided that the State mayparticipate in any energy-efficiency or demand-side managementprograms and services on the same basis as any other electricconsumer.
For the docket proceeding discussing the most recent developments concerning thePBF see Section VII.C.1.f “Third Party Administration of Energy Efficiency Programs – DocketNo. 2007-0323.”
As of June 30, 2011, Hawaii Energy completed its second program year. PreliminaryHighlights Results of the PY 2010 are presented below and are subject to Evergreen’sindependent review.
According to Hawaii Energy’s report, “Ratepayers receiving the incentives invested$99.7M of their own money to implement the rebated measures. The total customer energysavings (unverified at present) from these rebated measures was 142.2 GWh, with a cost savingsof $48.1M shown in Table 1. Over the lifetime of the rebated measures, the customer energysavings would be 1,417 GWh, with a cost savings of $473.2M, yielding a 474% return oninvestment (in 2010 dollars at 2010 electric rates).”
In their draft PY 2010 Annual Report, Hawaii Energy discussed the relationship ofCustomer, System, and Program Level Savings. The three levels are used to show how energyand demand savings are credited at the customer’s meter (Customer Level Savings), at the utilitysystem generation level (System Level Savings) and at the PBFA Contract level (Program LevelSavings).
1. Customer Level Savings (Gross at Meter) – This savings figureis the gross change in energy consumption at the customermeter that results directly from program-promoted actions takenby program participants. The savings are determined by directmetering, engineering calculations, or measurement andverification of prior installations of the particular savings

Public Utilities Commission Annual Report 2010-11State of Hawaii Page 18
measure. This is the savings level defined in the Program’sTechnical Resource Manual (TRM).
2. System Level Savings (Gross Generated) – This savings figureis realized at the utility system level and includes thetransmission, distribution and generation station energy lossesbetween the end-use customer and the utility generating units.System Level Savings has been termed Gross Level Savings inprevious reports.
3. Program Level Savings (Net Generated) - This savings figureshows the amount of energy reductions determined to be directlyattributed to PBFA Program actions by separating out theimpacts that are a result of other influences, such as consumerself-motivation or free-riders. Free-riders are rate-payers orparticipants who received an incentive and/or education by theProgram, but the incentive and/or education did not play a role intheir decision to purchase the savings measure. Theserate-payers would have taken action or purchased the energyefficient item regardless of the Program and therefore, programlevel savings removes their participation. The Net-to-Grossadjustment figure for PY 10 operations across all programs andcounties is 73%.
PY 2010 Annual Report
In the table below, Customer Level Savings are reflected in the PY 2010 CustomerEnergy Cost Savings, while in the table that reflects the Cumulative Annual Electric Savings,Program Level Savings are shown.
PY 2010 Customer Energy Cost Savings
(based on October 2011 Effective Rates)
First Year Energy Customer Energy Cost Savings
County Total Cost Savings kWh $/kWh
Honolulu $ 35,483,899 110,185,820 $ 0.322
Hawaii $ 6,821,574 16,143,096 $ 0.423
Maui $ 5,781,730 15,832,399 $ 0.365
Total $ 48,087,203 142,161,315 $ 0.338
Equipment Lifetime Energy Customer Energy Cost Savings
County Total Cost Savings kWh $/kWh
Honolulu $ 362,869,498 1,135,476,497 $ 0.320
Hawaii $ 54,460,705 128,750,744 $ 0.423
Maui $ 55,887,132 152,439,811 $ 0.367
Total $ 473,217,335 1,416,667,052 $ 0.334
Under its contract with the Commission, Hawaii Energy agreed to the following performanceindicators for PY 2010:

Public Utilities Commission Annual Report 2010-11State of Hawaii Page 19
Cumulative Annual Electric Energy Savings
The targets for the residential and business (C&I) categories were 71,245,000 kWh and61,370,000 kWh, respectively. In PY 2010, Hawaii Energy reported achieving 80% of theresidential target and 95% of the C&I target. Savings goals would have been exceededusing past savings per measure figures, however, savings per lamp for compactfluorescents (CFL) were reduced by 40% this year based on recent nationwide M&Vstudies.
Peak Demand
The Peak Demand target was designed to encourage Hawaii Energy to achieve superiorlevels of peak summer demand savings (sum across all measures of the energy savingsoccurring weekdays between 5pm and 9 pm during the months of August to Novemberdivided by the number of hours in that period). The target for PY 2010 was 23,126 kW;Hawaii Energy reported achieving 17,011 kW. The reduction in CFL savings asdiscussed above also contributed to Hawaii Energy’s reduced peak demand results.
Total Resource Benefit (TRB)
The TRB is designed to encourage Hawaii Energy to maximize energy-related and otherresource benefits by implementing energy efficient measures and projects that providepersistent energy and demand savings.
The PY 2010 TRB target was set at $148,596,954; Hawaii Energy reported a TRB of$134,710,809.
Broad Participation-Island Equity
The Commission included this performance indicator to ensure program benefits accrueto each Island commensurate with contributions from each Island to the PBF. ThePY 2010 target was set “to create direct customer energy savings within 20% of theproportion of each County’s total contribution to the PBF in PY 2010;” Hawaii Energyreported 104%, 85% and 91% for Oahu, Maui County and Hawaii County, respectively.
Market Transformation
The Market Transformation performance indicator was designed to encourage lastingchange with regard to how energy is used in businesses and residences. The PY 2010target included State demonstration projects; implementation of a Retro-commissioningprogram and the development of at least four (4) partnerships with non-profits andcommunity organizations that can carry energy efficiency goals into the community.Hawaii Energy reported no State demonstration projects; the successful implementationof a Retro-commissioning program and the development of five (5) communitypartnerships.

Public Utilities Commission Annual Report 2010-11State of Hawaii Page 20
Key Performance Metrics
PY 2010Actual
PY 2010Targets
YTD % ofTarget
PY 2010
Annual Energy Savings Impacts (Net GenerationLevel)
Residential (MWh) 56,908 71,245 80%
Business (MWh) 58,066 61,370 95%
Peak Demand (kW) 17,011 23,126 74%
TRB $134,710,809 $148,596,954 91%
Island Equity
Oahu (kWh) 89,420,180 85,913,509 104%
Maui County (kWh) 12,708,774 14,921,344 85%
Hawaii County (kWh) 12,845,058 14,139,158 91%
Market Transformation (Applications Completed)
State Demonstration Projects 0 10 0%Launch Retro Commission (RCx)Program Completed 100%
Community Partnerships 5 4 125%
PY 2010 Program Financials:
For the program year ended June 30, 2011, Hawaii Energy reported expensing just over$5 million in program administration expenses, while distributing in excess of $13 million inresidential and C&I incentives.
Financials
PY 2010Actual
PY 2010Targets
YTD % ofTarget PY
2010
Total Non-Incentives¹ $5,054,077 $5,092,150 99%
Total Incentives $13,675,272 $15,025,382 91%
Total Program Costs $18,729,349 $20,117,532 93%
¹Total Non Incentive Billed and Budgets reflect the deduction of performanceincentive fees for the award pool ($700,000).
Source: Hawaii Energy preliminary PY 2010 Performance Award Claim Summary11/1/11.
Additional information may be found on the Hawaii Energy website at www.hawaiienergy.com

Public Utilities Commission Annual Report 2010-11State of Hawaii Page 21
D. ENERGY EFFICIENCY PORTFOLIO STANDARDS
The State’s Energy Efficiency Portfolio Standards (“EEPS”) law is set out in HRS§ 269-96. EEPS is a standard or set of standards used to measure the reduction of electricityusage in the State through energy efficiency programs, such as demand reduction programs anddevice efficiency upgrades. The EEPS law holds as follows:
[§269-96] Energy-efficiency portfolio standards.
(a) The public utilities commission shall establish energy-efficiency portfoliostandards that will maximize cost-effective energy-efficiency programsand technologies.
(b) The energy-efficiency portfolio standards shall be designed to achievefour thousand three hundred gigawatt hours of electricity use reductionsstatewide by 2030; provided that the commission shall establish interimgoals for electricity use reduction to be achieved by 2015, 2020, and2025 and may also adjust the 2030 standard by rule or order tomaximize cost-effective energy-efficiency programs and technologies.
(c) The commission may establish incentives and penalties based onperformance in achieving the energy-efficiency portfolio standards byrule or order.
(d) The public utilities commission shall evaluate the energy-efficiencyportfolio standard every five years, beginning in 2013, and may revisethe standard, based on the best information available at the time, todetermine if the energy-efficiency portfolio standard established by thissection remains effective and achievable. The commission shall reportits findings and revisions to the energy-efficiency portfolio standard,based on its own studies and other information, to the legislature no laterthan twenty days before the convening of the regular session of 2014,and every five years thereafter.
(e) Beginning in 2015, electric energy savings brought about by the use ofrenewable displacement or off-set technologies, including solar waterheating and sea-water air-conditioning district cooling systems, shallcount toward this standard.
For the docket proceeding discussing the most recent developments concerning EEPSsee Section VII.C.1.b “Energy Efficiency Portfolio Standards Law – Docket No. 2010-0037.”

Public Utilities Commission Annual Report 2010-11State of Hawaii Page 22
VI. ADMINISTRATIVE UPDATE
In response to Act 143, Session Laws of Hawaii 2006, the Commission conducted anin-depth review of its organization to develop a comprehensive plan to restructure andsupplement the Commission and its resources to function more effectively and efficiently in lightof, among other matters, changing regulatory conditions, duties, and requirements, and advancesin technology. In FY 2011, the Commission, for the first time since the approval of itsreorganization plan enacted in Act 177, Session Laws of Hawaii 2007, was appropriated fundingfor all positions recommended within the plan, increasing the Commission’s total full-time,permanent position count to 62. However, a key component to the reorganization plan, therelocation of the Commission’s entire Oahu office, was not approved. The relocation of theCommission’s office is necessary to accommodate all existing and newly created reorganizationpositions and to meet the Commission’s specific needs for a hearing room and adequatedocument storage space. Presently, there is no sufficient State owned space available thatmeets the Commission’s Oahu office space requirement. Therefore, due to lack of adequatespace, the Commission prioritized and focused on four (4) key reorganization positions to recruitfor, i.e., Information Technology Specialist, Engineer, Compliance and Consumer Affairs Chiefand Legal Assistant, while backfilling existing positions. This, unfortunately, resulted in theCommission having to refrain from recruiting for seventeen (17) funded positions.
The Public Utilities Commission Special Fund (“Special Fund”) established underSection 269-33 is used to cover all Commission and Consumer Advocate expenses incurred inthe administration of Chapters 269, 271, 271G, 269E and 486J. The Special Fund sources ofincome include public utility fees, motor carrier fees, penalties and interest, application andintervention filing fees, Hawaii One Call Center fees and duplication fees from entities under itsjurisdiction pursuant to Section 269-30, Hawaii Revised Statutes. The public utility fees arebased on the entities’ gross income from the preceding year and may be recovered via asurcharge from the entities’ customers, i.e., ratepayers. All moneys in excess of $1,000,000remaining on balance in the Special Fund on June 30 of each year lapse to the State GeneralFund pursuant to Section 269-33 (d).
During FY 2011, the Commission was able to recruit and fill the following positions: PUC Attorney; American Recovery and Reinvestment Act of 2009 (“ARRA”) Electricity
Specialist (Temporary Position) ; Chairperson (Appoint by the Governor; Confirmed by the State Senate); Chief Legal Counsel; Chief Researcher (a.k.a., Chief of Policy and Research); Chief Clerk (Internal Promotion); and Office Assistant IV (Internal Promotion).
Additionally, as of November 2011, five (5) months into FY 2012, the Commission has orexpects to have filled seven (7) more positions, one of which is a Commissioner appointed by theGovernor on an interim basis, and three (3) of which are internal promotions.
In FY 2011, the Commission’s ARRA Grant allowed for the staffing of two (2) temporarypositions and twenty (20) training opportunities attended by a total of 116 staff (many staffattended more than one training opportunity). Commission staff, through these trainingopportunities, increased their technical knowledge specifically in the evolving electricity industryand was fortunate enough to be trained by experts from entities such as the National Associationof Regulatory Utility Commissioners (NARUC), New Mexico State University’s Center for PublicUtilities, National Regulatory Research Institute, United States Department of Energy, Michigan

Public Utilities Commission Annual Report 2010-11State of Hawaii Page 23
State University Institute of Public Utilities, National Renewable Energy Laboratory (NREL), andSandia National Laboratories (SNL), among others.
In FY 2012, the Commission continues to put a high priority on attending and planningexpert technical training in electricity and other areas under the Commission’s jurisdiction. InFY 2012 and beyond, technical staff training, in addition to a renewed focus on strategic planning,and the ability to fully utilize Special Fund to advance the interest of the public utility ratepayerand enhance the performance of Hawaii’s regulated utilities, is and will continue to be critical inestablishing the Commission as a key policy leader and driver, particularly in the area of energy,and to fulfill the Commission’s primary purpose as an effective regulator to align the conduct ofregulated companies with the public interest.
A. FISCAL INFORMATION
$
Ppenalties and interest, and application fees. Branch
DCCA
Special FundLegislatureauthorizes thebudgetappropriations
CA
$
$
PUC$
B&F
expenditures and hires.
All unspent funds, less $1,000,000, lapse tothe General Fund on July 1
HRS 269-33(d)
Sources of Revenueublic utility fees, motor carrier fees,
ExecutiveThe PUC is administratively attachedto the Dept. of Budget and Financeand must seek approval for all

Public Utilities Commission Annual Report 2010-11State of Hawaii Page 24
The Public Utilities Commission Special Fund (“Special Fund”) is used to cover theoperating expenses of the Commission and Consumer Advocate. The Special Fund’s sources ofincome include public utility fees, motor carrier fees, penalties and interest, application andintervention filing fees, Hawaii One Call Center fees and duplication fees. For the Fiscal Year,the regulated utilities and transportation carriers paid $15,785,126 in public utility fees and$1,253,281 motor carrier fees, respectively. The total revenues of the Commission’sSpecial Fund were $17,165,178.
The expenses of the Commission include personnel costs and other current expenses.The Commission’s other major current expenses include transfers from its Special Fund to theConsumer Advocate to fund its operations.
For the Fiscal Year, the Commission received an appropriation of $9,249,331 forpersonnel services and other current expenses as shown in the table below. Allotments for theCommission’s personnel services expenses were $3,913,770 for 51 authorized permanentpositions. The Commission was allotted $5,335,561 for other current expenses. TheCommission’s other current expenses allotment included $2,169,331 that was transferred to theConsumer Advocate to cover its operating expenses and $858,259 that was transferred toCentral Services pursuant to Section 36-37, HRS.

Public Utilities Commission Annual Report 2010-11State of Hawaii Page 25
The Commission also received the following appropriations out of the Special Fund asshown in the table below:
FY 2010-11 FY 2010-11Appropriation Allotment
Personnel Services $ 3,913,770 $ 3,913,770Other Current Expense 5,335,561 5,335,561
Total $9,249,331 $9,249,331
Pursuant to Section 269-33, HRS, any amount over $1,000,000 remaining in theSpecial Fund at the end of each fiscal year is transferred to the State’s general fund. For theFiscal Year, an excess balance of $9,755,240 from the Special Fund was transferred to thegeneral fund. This excess balance amount includes the balance of the moneys appropriatedthrough Act 180, SLH 2010 (2010 Appropriations Act).

Public Utilities Commission Annual Report 2010-11State of Hawaii Page 26
VII. REGULATORY ISSUES AND PROCEEDINGS
A. DOCKET PROCEEDINGS
As of July 1, 2010, 154 pending dockets were carried over from prior years, and 369 newdockets were opened during the Fiscal Year. Thus, during the Fiscal Year, a total of 523 docketswere before the Commission for review and consideration. Of the 523 dockets, 363 orapproximately 69 per cent of the dockets were completed by the end of the Fiscal Year.
As of June 30, 2011, 160 dockets were pending, including 40 dockets carried over fromyears prior to the Fiscal Year and 120 dockets that were opened during the Fiscal Year.
The following table summarizes the Commission’s dockets over the past three (3) fiscalyears.
DOCKETS FILED, COMPLETED AND PENDINGFISCAL YEARS 2008-09, 2009-10 AND 2010-11
FY 09 FY 10
UtilitiesBeginFY 09 Opened Closed
Pendingend FY 09
BeginFY 10 Opened Closed
Pendingend FY 10
Electric 58 32 28 62 62 32 42 53Gas 2 0 0 2 2 1 1 2Telecom 25 47 41 31 31 57 77 11Private Water 24 12 9 27 27 5 22 10
Subtotal 109 91 78 122 122 96 142 76
TransportationMotor Carrier 142 240 238 144 144 233 302 75Water Carrier 5 7 7 5 5 1 4 2
Sub Total 147 247 245 149 149 234 306 77
Petroleum 0 0 0 0 0 0 0 0One Call Center 1 0 1 1 1 0 0 1
Total 257 338 324 271 271 330 448 154

Public Utilities Commission Annual Report 2010-11State of Hawaii Page 27
FY 11
UtilitiesBeginFY 11 Opened Closed
Pendingend FY 11
Electric 53 36 44 45Gas 2 2 1 2Telecom 11 68 58 21Private Water 10 6 4 12
Subtotal 76 112 107 81
TransportationMotor Carrier 75 254 255 74Water Carrier 2 3 1 4
Sub Total 77 257 256 78
Petroleum 0 0 0 0One Call Center 1 0 0 1
Total 154 369 363 160
FY 03 FY 04 FY 05 FY 06 FY 07 FY 08 FY 09 FY 10 FY 11
Opened 439 391 371 344 510 370 338 330 369
Closed 394 294 575 377 571 315 324 448 363
Pending 349 446 242 209 202 257 271 154 160

Public Utilities Commission Annual Report 2010-11State of Hawaii Page 28
B. MAJOR REGULATORY ISSUES
The Commission is responsible for regulating 220 utility companies or entities (4 electric,1 gas, 177 telecommunications, and 38 water and sewer companies), 4 water carriers680 passenger carriers and 582 property carriers in the State. During the fiscal year, theCommission opened 369 new dockets relating to those regulated utilities and transportationcompanies, completed and disposed of 363 dockets from its total case load and issued846 decisions and orders relating to new dockets and to those carried over from prior years.
During the Fiscal Year, key proceedings in the electric utility area included theCommission’s examination of issues relating to Decoupling; Feed-in Tariffs; a competitive biddingprocess for firm renewable energy for Oahu and Maui; a competitive bidding process forrenewable energy for Oahu; and the amendment of the Commission’s framework for IntegratedResource Planning. The electric utilities requested approval of a number of power purchaseagreements with independent power providers, which were approved by the Commission. Inaddition, the Commission reviewed the following electric utility rate increase cases: HECO’srequests for general rate increases for the 2009 calendar test year and the 2011 calendar testyear; HELCO’s request for 2010 calendar test year rate case; MECO’s 2010 calendar test yearrate case; and KIUC’s request for 2010 calendar test year rate case.
In the gas utility area, the Commission completed its examination of the application forgeneral rate increase filed by The Gas Company for the 2009 calendar test year.
In the telecommunications area, the Commission approved the applicable portions of thePlan of Reorganization filed by Hawaiian Telcom Communications, Inc. with the U.S. BankruptcyCourt for the District of Hawaii.
In the water carrier transportation area, the Commission considered the application forauthority to provide service by Pasha Hawaii Transport Lines as well as Young Brothers,Limited’s request for 2011 calendar test year rate increase.
In the water and wastewater public utility area, applications for rate increases and for newor amended authority were reviewed by the Commission.
The following sections highlight significant Commission proceedings.

Public Utilities Commission Annual Report 2010-11State of Hawaii Page 29
C. ELECTRICITY AND ENERGY PROCEEDINGSThe Commission regulates four electric utility companies or entities engaged in the
production, purchase, transmission, distribution, and sale of electric energy in the State: HECO,serving the island of Oahu; MECO, serving the islands of Maui, Lanai, and Molokai; HELCO,serving the island of Hawaii (collectively, “the HECO Companies”); and Kauai Island UtilityCooperative (“KIUC”), serving the island of Kauai. MECO and HELCO are wholly ownedsubsidiaries of HECO, which is in turn a wholly owned subsidiary of Hawaiian Electric Industries,Inc.
1. COMMISSION PROCEEDINGS
a. RENEWABLE PORTFOLIO STANDARDS LAWDocket No. 2007-0008
In January 2007, the Commission opened an investigation pursuant to Act 162,SLH 2006, which amended Hawaii’s Renewable Portfolio Standards (“RPS”) Law, codified asHawaii Revised Statutes §§ 269-91 – 269-95 to examine the appropriate penalty framework fornon-compliance with the RPS.
In December 2007, the Commission approved a framework for RPS to govern electricutilities’ compliance with the RPS. It also denied a proposal by the parties for the implementationof a Renewable Energy Infrastructure (“REI”) Program, including a temporary REI Surcharge,which was proposed by the HECO Companies. Instead, the Commission determined that itwould open a separate docket to examine the proposed REI Program. At the same time, theCommission decided to further examine the subject of penalties on electric utilities that fail tomeet the RPS and required the utilities to file supplemental briefs on the matter.
In December 2008, the Commission approved a penalty of $20 for every megawatt-hour(“MWh”) that an electric utility is deficient under Hawaii’s RPS Law. In the Commission’sdiscretion, this penalty may be reduced based on the factors listed in HRS § 269-92(d) and in theRPS Framework, Section III.C.5. Any RPS penalties assessed against the HECO Companies forfailure to meet the RPS shall go into the account established for the public benefits fees and shallnot be recovered through rates. Any RPS penalties assessed against Kauai Island UtilityCooperative (“KIUC”) shall be paid into the Commission’s special fund and may be recoveredfrom its members or ratepayers.
In March 2011, KIUC filed its RPS Status Report for the year ending December 31, 2010,that indicated that renewable energy resources and energy savings supplied 12.39% ofKIUC’s net electricity sales during the 2010 calendar year. This result exceeded the 2010 RPSmandate of 10%.
In May 2011, the HECO Companies submitted their RPS Status Report for the2010 calendar year. This report indicated that the HECO Companies achieved a consolidatedRPS of 20.7% in 2010. This was an increase from the 19.0% achieved in 2009 and was primarilythe result of additional energy efficiency (“EE”) demand-side management implemented in2010 and increased installations of solar water heating and photovoltaic systems. Thus, theHECO Companies May 2011 Status Report showed that they exceeded the 2010 RPScompliance percentage of 10% required by the RPS Law. The HECO Companies noted,however, that achieving higher RPS percentages beyond 2010 will have its challenges since thecurrent RPS Law, which became effective on July 1, 2009, will not allow the electrical energysavings from EE and solar water heating technologies to count towards the RPS from January 1,2015 (the 2015 RPS target is 15%, the 2020 RPS target is 25%, and the 2030 RPS target is40%).

Public Utilities Commission Annual Report 2010-11State of Hawaii Page 30
b. ENERGY EFFICIENCY PORTFOLIO STANDARDS LAWDocket No. 2010-0037
In March 2010, the Commission instituted an investigation to examine establishingenergy efficiency portfolio standards (“EEPS”) for the State of Hawaii, pursuant to Act 155,Session Laws of Hawaii 2009 (“Act 155”) and HRS § 269-96. Act 155, as codified inHRS § 269-96 requires, among other things, that the Commission establish EEPS “designed toachieve four thousand three hundred gigawatt hours of electricity use reductions statewide by2030; provided that the commission shall establish interim goals for electricity use reduction to beachieved by 2015, 2020, and 2025 and may also adjust the 2030 standard by rule or order tomaximize cost-effective energy-efficiency programs and technologies.”
Pursuant to a Stipulated Procedural Schedule filed in the docket, the parties held a seriesof Informational Workshops in the Fall of 2010; the Commission hosted Technical Sessions inMay and August 2011; the Commission’s consultant submitted on August 5, 2011 a proposal for“A Framework for Energy Efficiency Portfolio Standards” for the parties review and comment; andFinal Statements of Position were filed by the parties on August 29, 2011.
A Commission decision is expected by December 31, 2011.
c. COMPETITIVE BIDDING PROCESS
i. COMPETITIVE BIDDING PROCESS FORRENEWABLE ENERGY ON OAHUDocket No. 2007-0331
The Commission opened this docket in October 2007 to receive filings, review approvalrequests, and resolve disputes, if any, related to Hawaiian Electric Company’s proposal tocompetitively bid approximately 100 megawatts (“MW”) of non-firm renewable energy for theisland of Oahu. Hawaiian Electric submitted two applications as a result of this proceeding: (1) inFebruary 2011, approval of a purchase power agreement with Kalaeloa Solar Two, LLC for outputproduced by a 5 MW solar photovoltaic project; and (2) in September 2011, approval of apurchase power agreement with Kawailoa Wind, LLC for output from a 69 MW wind energyproject.
ii. COMPETITIVE BIDDING PROCESS FOR FIRMGENERATING CAPACITY ON MAUIDocket No. 2011-0038
The Commission opened this docket in February 2011 to receive filings, review approvalrequests, and resolve disputes, if any, related to Maui Electric Company’s plan to proceed with acompetitive bidding process to acquire up to approximately 50 MW of new, renewable, firm,dispatchable capacity generation resources on the island of Maui, with an initial increment comingon line in the 2015 time frame. Maui Electric is actively preparing the draft request for proposal,which will be filed with the Commission near the end of 2011 and reviewed by the Commission’sconsultant, the Independent Observer, as well as by the public.
iii. COMPETITIVE BIDDING PROCESS FOR FIRMGENERATING CAPACITY ON OAHUDocket No. 2011-0039
The Commission opened this docket in February 2011 to receive filings, review approvalrequests, and resolve disputes, if any, related to Hawaiian Electric’s plan to proceed with acompetitive bidding process to acquire up to approximately 300 MW of new, renewable firm,dispatchable capacity generation resources on the island of Oahu, with the initial incrementscoming on line in the 2016 time frame and the remainder over the following two years. Hawaiian

Public Utilities Commission Annual Report 2010-11State of Hawaii Page 31
Electric is actively preparing its draft request for proposal, which will be filed with the Commissionnear the end 2011 and subsequently reviewed by the Commission’s consultant, the IndependentObserver, as well as by the public.
iv. COMPETITIVE BIDDING PROCESS FORRENEWABLE ENERGY ON OAHUDocket No. 2011-0225
The Commission opened this docket in September 2011 to receive filings, reviewapproval requests, and resolve disputes, if any, related to Hawaiian Electric’s plan tocompetitively bid at least 200 MW of renewable energy resources delivered to the island of Oahu.By order issued on July 14, 2011, in Docket No. 2009-0327, the Commission instructed HawaiianElectric to submit a draft request for proposal for a minimum of 200 MW of renewable energy fordelivery to the island of Oahu, according to the Competitive Bidding Framework, not later than90 days from the date of the Order to Bid 200 MW, or by October 14, 2011.
d. NET ENERGY METERINGDocket No. 2006-0084
This investigative docket was opened in April 2006 to evaluate whether the Commissionshould increase: (1) the maximum capacity of eligible customer-generators to more thanfifty kilowatts; and (2) the total rated generating capacity produced by eligiblecustomer-generators to an amount above 0.5 percent of an electric utility's system peak demand,under Hawaii's Net Energy Metering Law, codified as Hawaii Revised Statutes §§ 269-101to 269-111.
In Fiscal Year 2009-10, the parties filed several proposals, including: a proposed plan toaddress Net Energy Metering (“NEM”), as set forth in the Energy Agreement;
4a stipulation on the
NEM system cap filed by the HECO Companies and the Consumer Advocate; a request to foregothe development of an NEM Pilot Program for the HECO Companies; a proposed NEM PilotProgram and alternate rate structure for KIUC; and a stipulation to increase the NEM system capfor Oahu.
In January 2011, the Commission issued an order ruling on these severalNEM proposals. In particular, the Commission: approved the HECO Companies’ and ConsumerAdvocate’s proposal to eliminate NEM system-wide caps and replace them with a 15% per-circuitdistribution threshold for distributed generation penetration; denied the HECO Companies’request to forego the development of an NEM Pilot Program, and instead, ordered them to file arevised proposed NEM Pilot Program within thirty days of the Order; and approved KIUC’sproposed NEM Pilot Program and alternate rate structure. In February 2011, theHECO Companies filed their revised proposed NEM Pilot Program, which is pending review andapproval by the Commission.
4“Energy Agreement” refers to a comprehensive agreement dated October 20, 2008
between the Governor of the State of Hawaii, the State Department of Business EconomicDevelopment and Tourism, the Consumer Advocate, and the HECO Companies that is designedto move the State away from its dependence on imported fossil fuels for electricity and groundtransportation, and toward “indigenously produced renewable energy and an ethic of energyefficiency.”

Public Utilities Commission Annual Report 2010-11State of Hawaii Page 32
e. STANDARDS AND GUIDELINES FOR UTILITY FUNDINGOF RENEWABLE INFRASTRUCTURE PROJECTSASSOCIATED WITH INDEPENDENT POWERPRODUCERSDocket No. 2010-0139
On July 30, 2010, HECO, HELCO, and MECO (collectively, “HECO Companies”) filed anapplication for approval of its standards on their ability to offer to use the Renewable EnergyInfrastructure Program (“REIP”) surcharge and the terms of such offer in its negotiations withdevelopers, as required by the Decision and Order, filed on May 12, 2010, in DocketNo. 2009-0176. Specifically, the Companies are proposing guidelines and standards with respectto when they will offer to pay for interconnection and other costs traditionally paid for by theindependent power producer for the purpose of encouraging renewable energy projectdevelopment.
On July 29, 2011, the Consumer Advocate filed its statement of position, recommendingcertain revisions to the standards and guidelines proposed by the Companies. A Decision andOrder is currently pending.
f. THIRD PARTY ADMINISTRATION OF ENERGYEFFICIENCY PROGRAMSDocket No. 2007-0323
HRS Chapter 269, Part VII, pertaining to Hawaii’s Public Benefits Fee (“PBF”), authorizesthe Commission to contract with a third party administrator (“TPA”) to implement and manageenergy efficiency programs in the State of Hawaii. On March 3, 2009, following a competitivelybid selection process, the Commission selected Science Applications International Corporation(“SAIC”) to serve as the TPA of energy efficiency programs within the HECO Companies’ serviceterritories. SAIC began administering the Hawaii Energy Efficiency Program (“Hawaii Energy”) onJuly 1, 2009 and later transferred its program responsibilities to its subsidiary, R.W. Beck.
As part of the PBF implementation process, the Commission also selected Bank ofHawaii as the Fiscal Agent; James Flanagan Associates (“JFA”) as the Contract Manager;Accuity LLP (“Accuity”) as the independent auditor; and Economic Consultants Oregon Ltd.,dba ECONorthwest (“ECONorthwest”) as the independent evaluator of Hawaii Energy’sprograms. In 2011, ECONorthwest’s contract was transferred to Evergreen Economics(“Evergreen”).
In 2009, the Commission set the initial PBF surcharge amount for 2009 and 2010 at1.0% of the projected total electric revenue of the HECO Companies, plus revenue taxes. Duringthis transition year, 60% of the amount collected was allocated to the HECO Companies’ existingdemand-side management programs and 40% was allocated to the PBF.
In 2011, the Commission increased the PBF surcharge to 1.5% of the HECO Companies’projected total electric revenue, plus revenue taxes. The Commission also awarded SAIC itsperformance award of $645,598 for PY 2009 and established the PBF two-year budget forProgram Years 2011 and 2012 at $71,103,608.
g. FEED-IN TARIFFSDocket No. 2008-0273
In October 2008, the Commission instituted an investigation to examine the issues andrequirements raised by the implementation of feed-in tariffs (“FITs”) in the HECO Companies’

Public Utilities Commission Annual Report 2010-11State of Hawaii Page 33
service territories. FITs, or locked-in rates for renewable power fed into the electric grid, requirethe utility to pay a fixed rate for renewable energy as approved by the Commission.
In September 2009, the Commission issued its decision and order on the generalprinciples for the implementation of FITs in the HECO Companies’ service territories.
The Commission selected an Independent Observer (“IO”) to oversee queuing andinterconnection procedures related to FITs. The parties also filed proposed reliability standards,queuing and interconnection procedures, proposed FIT tariffs, and extensive comments andinformation requests relating thereto.
In response to a proposal filed by the HECO Companies, in August 2010, theCommission approved the creation of a Reliability Standards Working Group (“RSWG”),Technical Support Group, and Technical Review Committee to examine issues relating to gridreliability and integration of intermittent renewable resources on the HECO Companies’ systems(“RSWG Process”). Also in August 2010, the HECO Companies filed revised proposed tariffsand contracts for Commission review.
On October 13, 2010, the Commission approved: (1) proposed FITs for Tier 1 and Tier 2renewable energy generators, which includes applicable pricing, other terms and conditions, anda standard form of contract for the FIT program; and (2) proposed queuing and interconnectionprocedures for Tier 1 and Tier 2 of the FIT program.
In January 2011, the Commission selected an Independent Facilitator (“IF”) for theRSWG.
By Order issued in June 2011, the Commission set additional procedural steps forresolution of Tier 3, to address the IO’s recommendation to complete a review of the FITexperience to date, identify lessons learned, and apply those lessons to the design of Tier 3 withinput from interested parties, to be followed by one request for tariff amendments before Tier 3 isreleased, but before the conclusion of the initial FIT two-year test period. The parties arescheduled to file a combined Statement of Position on Tier 3 by September 6, 2011.
Also in June 2011, the Commission issued an Order that allowed the IF to hold the firstmeeting of the RSWG, and provided guidance on the RSWG Process.
A Commission decision is expected by November 30, 2011.
h. DECOUPLING MECHANISMDocket No. 2008-0274
By its Order Initiating Investigation, filed on October 24, 2008, the Commission openedDocket No. 2008-0274 to examine implementing a decoupling mechanism for theHECO Companies that would modify the traditional model of ratemaking for theHECO Companies by separating the HECO Companies’ revenues and profits from electricitysales.
On February 19, 2010, the Commission approved a decoupling mechanism subject to theissuance of a Final Decision and Order in Docket No. 2008-0274.
The Commission, in a 2-1 decision, issued its Final Decision and Order on August 31,2010. The decoupling mechanism approved by the Commission in the Final Decision and Orderincluded: (1) a sales decoupling component, or Revenue Balancing Account (“RBA”), which isintended to break the link between the HECO Companies’ sales and their total electric revenue;and (2) a Revenue Adjustment Mechanism (“RAM”), which is intended to compensate the

Public Utilities Commission Annual Report 2010-11State of Hawaii Page 34
HECO Companies for increases in utility costs and infrastructure investment between rate cases.As explained in the Final Decision and Order, decoupling de-links or “decouples” theHECO Companies’ revenues from the amount of electricity or kWh they sell, and is intended toremove the disincentive for the HECO Companies to aggressively pursue Hawaii’s clean energyobjectives.
In Transmittal No. 11-02, filed on March 31, 2011, Hawaiian Electric submitted itsadjustments to its decoupling tariff (in accordance with the tariff provisions) and requested thatthe Commission allow Hawaiian Electric’s initial RBA Rate Adjustment to become effective onJune 1, 2011. No protests were filed in response to Hawaiian Electric’s tariff filing. After allowingreview and comment by the Consumer Advocate, on May 31, 2011, the Commission approvedHawaiian Electric’s decoupling tariff filing, as revised, and therefore allowed Hawaiian Electric’sproposed RBA Rate Adjustment of $0.001995 per kWh, to go into effect on June 1, 2011.
i. ISLAND-WIDE POWER OUTAGE OF 12/26/08Docket No. 2009-0005
On December 26, 2008, at about 6:35 p.m., large portions of the island of Oahuexperienced power losses and, beginning on or about 8:30 p.m., an island-wide power outageoccurred on Oahu (“Power Outage”). Hawaiian Electric informed the commission that the PowerOutage was likely the result of a severe and unusual lightning storm that created instability in itssystem.
By a Decision and Order issued in February 2011, the Commission determined thatHawaiian Electric’s activities and performance prior to and during the island-wide power outagethat occurred were reasonable, and concluded that no penalties were warranted. Specifically, theCommission found that the triggering event for the 2008 Power Outage was a lightning strike orstrikes and resulting 3-phase fault at structure 29 on the Kahe-Waiau transmission line, whichcaused a series of cascading events that led to the Power Outage. Due to the relativeinfrequency of lightning induced 3-phase faults on Oahu, as well as the large magnitude of theparticular strike events which triggered the Power Outage, the Commission found that HawaiianElectric could not have reasonably prevented the damaging effects of the lightning strikes toprevent the Power Outage.
In addition, the Commission's review of the record revealed that Hawaiian Electricimplemented a prudent and efficient restoration plan, which minimized delays and potentialmishaps. Therefore, the Commission found that Hawaiian Electric could not have reasonablyshortened the duration of the Power Outage and restored power more quickly to customers. As aresult of the foregoing, the Commission found that the imposition of penalties on HawaiianElectric for the 2008 Power Outage is unwarranted. Given, however, that there have been twoisland-wide outages in the span of two years, the Commission directed Hawaiian Electric tocomply with certain conditions and recommendations set forth within the final Decision and Order,including additional studies and reporting requirements.
j. HECO’S COMMERCIAL AND RESIDENTIAL DIRECT LOADCONTROL PROGRAMSDocket Nos. 2009-0073 and 2009-0097
Hawaiian Electric’s Residential and Commercial Industrial Direct Load Control Programs,commonly referred to as the “EnergyScout™” programs, offer incentives to residential,commercial, and industrial customers who agree to curtail their electricity use for a brief periodunder specific circumstances. By reducing electricity demand through reductions by participatingcustomers, load control programs help Hawaiian Electric to meet system reserve capacity,increase electrical-grid stability and avert power outages during periods of emergency generationshortfalls.

Public Utilities Commission Annual Report 2010-11State of Hawaii Page 35
On December 29, 2009, the Commission approved Hawaiian Electric’s application for athree year extension of its EnergyScout™ programs from January 1, 2010 through December 31,2012. The Commission, however, denied Hawaiian Electric’s request to expand the programsuntil Hawaiian Electric completed an evaluation showing that its load control programs were beingimplemented efficiently and effectively. During the fiscal year, Hawaiian Electric completed animpact and process evaluation of its program and filed the evaluation reports in DocketNo. 2007-0341. The evaluation results will be considered by the Commission in connection withfuture modifications of Hawaiian Electric’s load control programs.
k. ON-BILL FINANCING INVESTIGATIONDocket No. 2011-0186
On July 8, 2011, the Governor of the State of Hawaii signed into law House Bill 1520,HD2, SD2, CDl as Act 204 Session Laws of Hawaii 2011 ("Act 204"). Act 204 directs theCommission to investigate an on-bill financing program for residential electric utility customers.Act 204 also authorizes the commission to implement the program by decision and order or byrules if the on-bill financing program is found to be viable. The intent of on-bill financing is toallow electric utility company customers who are renters or who lack the resources to invest inrenewable energy or energy efficiency to purchase or otherwise acquire such systems byproviding for billing and payment of such a system or device through an assessment on theelectric utility company customer's monthly bill.
The Commission instituted this proceeding in August 2011 to investigate the issuesrelated to on-bill financing in the Hawaiian Electric Companies' and Kauai Island UtilityCooperative’s service territories. The parties to the docket will assist the Commission inevaluating a study analyzing the following scope for the investigation:
(1) The costs and benefits associated with the establishment andadministration of the program;
(2) The ability of the program to effectively provide lifecycle cost savings toparticipating electric utility company customers;
(3) The ability of the program to make renewable energy and energyefficiency more accessible to the rental market and other underservedmarkets;
(4) Methods to structure the program to ensure that any public benefits feefunds are spent cost-effectively and in compliance with applicablestatutes;
(5) The use of non-ratepayer funds or private capital to provide financing forrenewable energy systems or energy efficient devices acquired throughthe program;
(6) Reasonable penalties, which may include fines and disconnection ofutility services, for nonpayment of on-bill financing costs;
(7) The ability of an electric utility company to recover costs incurred due tothe program; and
(8) Other issues the public utilities commission deems appropriate.
l. AMENDMENTS TO THE INTEGRATED RESOURCEPLANNING FRAMEWORKDocket No. 2009-0108
In May 2009, the Commission instituted an investigation to examine amendments to theFramework for Integrated Resource Planning that were proposed by the HECO Companies,KIUC, and the Consumer Advocate in a letter filed on April 28, 2009. In that letter, theHECO Companies, KIUC, and the Consumer Advocate proposed that the Commission open adocket to replace the IRP Framework with a Clean Energy Scenario Planning (“CESP”) process,and submitted a Proposed CESP Framework for the Commission’s review.

Public Utilities Commission Annual Report 2010-11State of Hawaii Page 36
The Commission held a panel hearing in February 2010. In March 2010, theCommission issued a letter to the parties, listing its inclinations as to what should be contained inthe final framework. In August 2010, the Parties filed their proposed frameworks and OpeningBriefs. Reply Briefs were due in September 2010.
In March 2011, the Commission issued a Decision and Order revising the framework bymodifying, updating and expanding the Framework for Integrated Resource Planning to allow fora more effective, inclusive and comprehensive planning process that acknowledges the dynamicand constantly changing utility environment that exists today.
2. HECO, HELCO, MECO, AND KIUC PROCEEDINGS
a. HECO 2009 TEST YEAR RATE INCREASE REQUESTDocket No. 2008-0083
In July 2008, Hawaiian Electric filed an application requesting a general rate increase of5.2 per cent over revenues at current effective rates. In July 2009, the Commission issued aninterim decision and order granting a revenue increase of $61,098,000, or a 4.71 per centincrease over revenues at current effective rates for a normalized 2009 test year.
Evidentiary hearings were held in October 2009, with post-hearing briefs filed inJanuary 2010.
In February 2010, the Commission issued a second Interim Decision and Order,approving the request by Hawaiian Electric to increase its rates an additional $12,671,000,resulting in an adjusted 2009 test year interim increase of $73,769,000 over revenues at currenteffective rates.
The Commission issued a final decision in this docket in December 2010, which amongother things: allowed Hawaiian Electric to implement the decoupling mechanism that wasapproved by the commission in the decoupling docket (2008-0274); ruled that the appropriatereturn on common equity for the 2009 test year is 10.00%, which reflects the Commission’sapproval of the decoupling, and other cost-recovery mechanisms for Hawaiian Electric that willcumulatively lower Hawaiian Electric’s business risk; disallowed test year salary increases andrelated expenses for Hawaiian Electric’s merit employees; and terminated Schedule E (discountfor Hawaiian Electric’s employees) as unduly discriminatory and in conflict with state energyefficiency goals.
In May 2011, the Commission approved the Consumer Advocate’s recommendations toconduct focused regulatory audits of the cost reasonableness of certain Hawaiian Electricprojects, as well as a more general audit for the purpose of determining any other specificprojects or areas in Hawaiian Electric's operations or management that should be subjects of anexpanded audit. The Commission is currently reviewing the parties’ proposals discussing thescope and time schedules for these audits.
b. MECO 2010 TEST YEAR RATE INCREASE REQUESTDocket No. 2009-0163
In September 2009, MECO filed its application, seeking an increase in revenues of$28,190,300 (approximately 9.7%), based on the January 1, 2011 to December 31, 2011 testyear, and a rate of return of 8.57%. MECO also proposed to establish: (1) a purchased poweradjustment clause/surcharge to recover non-energy purchased power agreement costs byeffectively transferring the recovery of purchased power costs from base rates to the newsurcharge that will be adjusted monthly and reconciled on a quarterly basis; and (2) a revenuebalancing account for a revenue decoupling mechanism that will remove the linkage between

Public Utilities Commission Annual Report 2010-11State of Hawaii Page 37
electric revenues and sales, if such a revenue balancing account is not otherwise approved bythe Commission in its separated revenue decoupling investigative proceeding (DocketNo. 2008-0274).
In July 2010, the Commission approved an interim increase in revenues of $10,296,200,or approximately 3.3% over revenues at current effective rates, based on total revenuerequirement of $323,885,100 (consolidated operations basis). Thereafter, in January 2011, theCommission approved an adjustment to the interim increase in revenues, which resulted in adecrease in the amount of the interim increase in revenues previously approved by theCommission, from $10,296,200 to $8,513,000, i.e., by $1,783,200. The Commission's finaldecision and order is pending, and will include the implementation of decoupling for MECO.
c. HELCO 2010 TEST YEAR RATE INCREASE REQUESTDocket No. 2009-0164
On December 9, 2009 HELCO filed an application requesting a general rate increase of$20,934,500 (approximately 6.0%) over its revenues at current effective rates. In addition,HELCO proposes to establish: (1) a purchased power adjustment clause/surcharge to recovernon-energy purchased power agreement costs by effectively transferring the recovery ofpurchased power costs from base rates to the new surcharge that will be adjusted monthly andreconciled on a quarterly basis; and (2) a revenue balancing account for a revenue decouplingmechanism that will remove the linkage between electric revenues and sales, if such a revenuebalancing account is not otherwise approved by the Commission in its separate revenuedecoupling investigative proceeding, Docket No. 2008-0274.
On November 3, 2010, the Commission issued its Interim Decision and Order, whichapproved an interim increase of $5,956,000 over revenues at present rates rather than the$20,934,500 that was requested in the application. The Commission found that, for interimpurposes, the wages, salaries, and all related accounts for all HELCO employees should beadjusted downward to reflect the 2008 recorded amounts. The Commission also found that, forinterim purposes, HELCO’s recovery of group medical, dental, vision, and life insurancepremiums should be adjusted to no more than 50% of the total premium cost. Because of theexisting labor contract between HELCO and the Local 1260 of the International Brotherhood ofElectrical Workers AFL-CIO that is in effect through December 31, 2011, the Commissiondetermined that this adjustment would be made in two phases: (1) as to all merit and executiveemployees of HELCO, the adjustment would take effect when the approved interim rates takeeffect; and (2) as to the non-merit employees of HELCO, the adjustment would take effect as ofJanuary 1, 2012, unless the Commission rules otherwise in a Final Decision and Order filedbefore that date.
On December 15, 2010, HELCO filed its Supplemental Testimonies. In its SupplementalTestimonies, HELCO proposed, among other things, for purposes of the Final Decision andOrder, to reduce its stipulated 2010 revenue requirement by an “austerity adjustment” in theamount of $400,000 in lieu of continuing the wage/salary and benefits adjustments mandated inthe Interim Decision and Order. A Final Decision and Order is currently pending.
d. KIUC 2010 TEST YEAR RATE INCREASE REQUESTDocket No. 2009-0050
On June 30, 2009, Kauai Island Utility Cooperative (“KIUC”) requested an increase inrevenues of $12,991,518 (approximately 10.45 percent) over its present total revenuerequirement of $124,276,813, which was based on an estimated total revenue requirement of$137,268,331 for the January 1, 2010 to December 31, 2010 test year, and a targeted RegulatoryTimes Interest Earned Ratio ("TIER") of 2.50, which is equivalent to a Rural Utilities Service TIERof 2.27, and a 10.04 percent rate of return.

Public Utilities Commission Annual Report 2010-11State of Hawaii Page 38
By Interim Decision and Order issued on April 29, 2010, the Commission approved inpart and denied in part the requested increase in rates for KIUC on an interim basis, as reflectedin the Parties' Joint Statement of Probable Entitlement in Support of Interim Rates, filed onApril 8, 2010. Specifically, the Commission allowed an interim net revenue increase from presentrates of $3,063,023 (approximately 1.984 percent), a TIER of 2.27, and a Test Year revenuerequirement of $157,420,296.
By Decision and Order issued on September 9, 2010, the Commission affirmed itsInterim Decision and Order by granting a net increase in revenues over present rates of$3,063,023 (approximately 1.984 percent), for KIUC, based on a Regulatory TIER of 2.27 and atotal revenue requirement of $157,420,296 for the Test Year. In so doing, the Commissionapproved the Stipulation of Settlement Agreement in Support of Final Rates jointly filed by theparties to the docket on April 28, 2010, as adjusted by the Commission in its Decision and Order.In particular, the Commission disallowed cost recovery related to the increases in non-bargainingunit employee salaries and related expenses for KIUC.
e. MECO – APPROVAL OF REVISED DEPRECIATION ANDAMORTIZATION RATESDocket No. 2009-0286
In May 2011, the Commission approved revised depreciation and amortization rates, arevised contributions-in-aid-of-construction amortization period, and other related matters forMECO, including the electric utility's use of vintage amortization accounting for certain plantaccounts.
f. HECO – APPROVAL OF REVISED DEPRECIATION ANDAMORTIZATION RATESDocket No. 2010-0053
In May 2011, the Commission approved revised depreciation and amortization rates, arevised contributions-in-aid-of-construction amortization period, and other related matters forHawaiian Electric, including the electric utility's expanded use of vintage amortization accountingfor additional plant accounts.
g. ADVANCED METERING INFRASTRUCTURE PROJECTDocket No. 2008-0303
In their application filed on December 1, 2008, the Hawaiian Electric Companiesrequested Commission approval of, among other things: (1) to commit capital funds estimated at$41,229,000 for Hawaiian Electric, $10,606,000 for Maui Electric, and $13,190,000 for HawaiiElectric Light Company for the Advanced Metering Infrastructure ("AMI") project; and (2) forapproval of the Advanced Metering Infrastructure Equipment and Services Agreement betweenthe Hawaiian Electric and Sensus Metering Systems, Inc.
On May 4, 2010, the HECO Companies filed a proposal, which consisted of a request to:(1) conduct Extended Pilot Testing for the AMI Project; (2) suspend the remaining proceduralsteps scheduled in the docket pending the completion of the proposed Extended Pilot Testing;(3) defer certain costs related to the Extended Pilot Testing; and (4) provide an update ondevelopments in the Smart Grid, CIS and cyber-security areas
By Order Closing Docket, filed on July 26, 2010, the Commission denied the HawaiianElectric Companies’ request filed on May 4, 2010 to conduct Extended Pilot Testing for theAMI Project, dismissed the application filed on December 1, 2008 without prejudice, given thatthe Companies could not complete its application without the Extended Pilot Testing, and closedthe docket. By such order, the Commission expressed concern that the Extended Pilot Testing,

Public Utilities Commission Annual Report 2010-11State of Hawaii Page 39
which would not be completed until 2011, raised additional concerns about the cost effectivenessof the Project. In addition the Commission noted that some of the Parties raised concerns aboutthe Project as a whole.
h. PV HOST PILOT PROGRAMDocket No. 2009-0098
The HECO Companies filed an application on April 30, 2009, for approval of a two-yearPhotovoltaic (“ PV”) Host Pilot Program, under which each company would target the installationof 8 MW, 4 MW and 4 MW of PV at Hawaiian Electric Company, Inc. (“HECO”), Hawaii ElectricLight Company, Inc. (“HELCO”), and Maui Electric Company, Limited (“MECO”), respectively.
In September 2009, the Commission approved the stipulated procedural order for thisdocket. The parties conducted several rounds of discovery related to the proposed program.Thereafter, the HECO Companies requested certain modifications to, and extensions of thedeadlines in, the stipulated procedural order so that they could amend the PV Host Pilot Programdesign described in the HECO Companies' April 30, 2009 application to address commentsreceived during the technical and settlement discussion processes in the proceeding, which weregranted by the Commission.
The Commission approved the HECO Companies’ extension requests. TheHECO Companies filed an amended application on August 31, 2010, deferring HELCO andMECO’s participation in the proposed program and proposing certain refinements. Upon a roundof discovery, statements of position and a reply statement of position were filed by the parties tothis proceeding. A decision on this matter is pending.
i. LIFELINE RATE PROGRAMDocket No. 2009-0096
In April 2009, the HECO Companies filed an application with the Commission to establisha Lifeline Rate Program that would provide a monthly bill credit, ranging from $25 to $35 permonth, to qualified, low-income customers.
The Consumer Advocate conducted discovery and filed its Statement of Position inDecember 2009. In February 2010, the Commission issued information requests to the HECOCompanies, to which they responded in March 2010.
j. HECO/HELCO/MECO – REQUEST TO APPROVE ABIODIESEL SUPPLY CONTRACT BETWEEN HELCOAND AINA KOA PONO-KA’U LLC, A BIOFUELSURCHARGE PROVISION, AND OTHER RELATEDMATTERS
Docket No. 2011-0005In September 2011, the Commission denied the HECO Companies' request to approve
HELCO's Biodiesel Supply Contract with Aina Koa Pono-Ka'u LLC, dated January 6, 2011, forapproximately sixteen million net United States gallons annually of locally-produced biodieselover twenty years. The Commission concluded that the contract price for the biofuel wasexcessive, not cost-effective, and thus, was unreasonable and inconsistent with the publicinterest. The Commission also expressed certain observations with respect to the HECOCompanies' proposal to establish and implement a Biofuel Surcharge Provision that was intendedto pass through the differential between the cost of the biofuel and the cost of the petroleum fuelthat the biofuel was replacing, in the event that the cost of the biofuel was higher than the cost ofthe petroleum fuel, over the customers of HECO and HELCO. This docket has been closed.

Public Utilities Commission Annual Report 2010-11State of Hawaii Page 40
k. FUEL SUPPLY CONTRACTSDuring the Fiscal Year, the Commission reviewed the following requests to amend the
HECO Companies’ existing fuel supply contracts:
HECO - Chevron Products Company’s Low Sulfur Fuel Oil Supply Contract -Docket No. 2009-0346
On May 13, 2011, the commission issued a decision and order approving theSecond Amendment to Hawaiian Electric’s Low Sulfur Fuel Oil (“LSFO”) Supply Contractwith Chevron Products Company. The Second Amendment renegotiated the pricingformula for LSFO delivered by Chevron to Hawaiian Electric, and shortened the term ofthe supply contract.
HECO - Tesoro Hawaii Corporation’s Low Sulfur Fuel Oil Supply Contract - DocketNo. 2010-0113
On May 13, 2011, the commission issued a decision and order approving:(1) the Second Amendment to Hawaiian Electric’s LSFO Supply Contract with TesoroHawaii Corporation, which renegotiated the pricing formula for LSFO delivered by Tesoroto Hawaiian Electric, shortened the contract term, and modified the volume terms underthe fuel supply contract; and (2) a Pipeline Throughput Contract between HawaiianElectric and Tesoro, which allows Hawaiian Electric to use Tesoro’s pipeline facilities forthe transport of fuel.
In approving the contracts, the commission also allowed Hawaiian Electric torecover, on a going-forward basis, the costs associated with the Second Amendment andPipeline Fuel Contract through Hawaiian Electric’s Energy Cost Adjustment Clause, tothe extent that such costs are not recovered through base rates. The commission,however, denied Hawaiian Electric’s request to apply the amended pricing formularetroactively to January 1, 2010.
MECO – Lanai Oil Company, Inc.’s Fuel Supply Contract - Docket No. 2010-0105
On October 6, 2010, the commission approved the Third Amendment to SupplyContract for No. 2 Diesel Fuel between MECO and Lanai Oil Company, Inc. Theamended fuel supply contract allows MECO to purchase ultra low sulfur diesel for use inits power generating facilities on the island of Lanai. The amendment was prompted bychanges in federal air emission standards that require existing facilities to use ultra lowsulfur diesel instead of No. 2 diesel fuel.
l. CONSTRUCTION OF OVERHEAD AND UNDERGROUNDELECTRIC LINES
During the Fiscal Year, the Commission reviewed and approved the following requestsfor the construction of electric lines:
Waimea-Keamuku 7200 Line Reconductoring Project – Docket No. 2008-0060
HELCO’s request to commit approximately $3.232 million and construct anoverhead 69 kV transmission line in connection with the Waimea-Keamuku 7200 linereconductoring project.
Naval Computer and Telecommunications Area Master Station Whitmore 46 kVLine – Docket No. 2009-0351

Public Utilities Commission Annual Report 2010-11State of Hawaii Page 41
Hawaiian Electric’s request to construct a 2.3 mile, 46 kV overheadsubtransmission line from the intersection of Kamehameha Highway and WhitmoreAvenue to Hawaiian Electric’s Whitmore Substation.
m. WAIVER OF RULE 13 TO ALLOW HECO TO PAY FORPORTION OF THE UNDERGROUND CONVERSION COST
HECO’s Rule 13.D.4 states: When mutually agreed upon by the customer or applicantand the Company, overhead facilities will be replaced with underground facilities, provided thecustomer or applicant requesting the change makes a contribution of the estimated cost installedof the underground facilities less the estimated net salvage of the overhead facilities removed.
During the last Fiscal Year, the Commission reviewed and approved the following requestfor waiver of Rule 13, to allow HECO to pay for a portion of underground conversion costs:
KALANIANAOLE HIGHWAY IMPROVEMENTS CONVERSION PROJECT - DocketNo. 2007-0217
Hawaiian Electric’s request to allow Hawaiian Electric to contribute approximately$275,344 to convert existing 12kV overhead lines to 12kV underground lines forKalanianaole Highway improvements, retaining wall at Makapuu project.
REVISED RULE 13—LINE EXTENSIONS - Docket No. 2009-0356
In August 2010, the Commission approved Hawaiian Electric's request toincorporate into its Tariff Rule 13 its existing Policy on Underground Lines; CostContribution for Placing Overhead Distribution Lines Underground/Guideline Summary,and Dedicated and System Substation Guideline. As a result of the Commission's action,Hawaiian Electric, on a going forward basis, will no longer be required to seek a waiver ofits Rule 13.D.4 whenever it proposes to pay for a portion of overhead-to-undergroundconversion costs requested by an entity. In September 2010, the Commission closedthis docket.
n. HAWAIIAN ELECTRIC LIGHT COMPANY’S PURCHASEPOWER AGREEMENT WITH PUNA GEOTHERMALVENTUREDocket No. 2011-0040
On February 25, 2011, Hawaii Electric Light Company (“HELCO”) filed an application toapprove purchase power agreements ("PPA") with Puna Geothermal Venture (“PGV”). Currently,PGV operates an existing geothermal electric generating facility in the vicinity of Pu'u Honualua,Kapoho, Hawaii, County of Hawaii that provides HELCO with up to 30 MW of energy and firmcapacity under an amended purchase power contract.
HELCO and PGV have been in extensive negotiations over the past several yearsrelating to an expansion of the existing facility. Conceptually, the parties agreed that, subject toCommission approval, PGV will make such improvements and modifications to expand itsexisting facility to enable the resulting facility to provide 38 MW of energy and firm capacity and tomeet certain operational, performance and dispatch requirements not currently required under theExisting PPA. As part of the expansion project, PGV is installing 11 MW of capacity but onlyrequiring HELCO to commit to purchase an additional 8 MW of firm capacity. The additional3 MW is going to be available to supplement the existing facility's 25 to 30 MW on-peak obligationor the additional 8 MW capacity obligation under the 8 MW expansion PPA. In return for allowingPGV to supplement the existing facility, PGV has agreed to delink the energy price paid forcertain amounts of energy under the Existing PPA from oil.

Public Utilities Commission Annual Report 2010-11State of Hawaii Page 42
The Consumer Advocate and Tawhiri Power, an intervenor in the docket, filed theirrespective statements of position on August 3, 2011, to which HELCO filed a statement inresponse on August 16, 2011. The Commission will pose questions of the parties, if any, andrender a decision shortly.
o. MAUI ELECTRIC COMPANY’S PURCHASE POWERAGREEMENT WITH KAHEAWA WIND POWER IIDocket No. 2010-0279
On February 11, 2011, the Commission approved the purchase power agreement filed byMaui Electric for as-available energy between Maui Electric and Kaheawa Power II. Theproposed project consists of an approximately 21 MW wind facility, located on a portion of theGovernment (Crown) Land of Ukumehame, Lahaina, and Wailuku, on the island of Maui.According to Maui Electric, the proposed wind facility will consist of 14 General Electric 1.5 MWwind turbine generators. The proposed wind facility will also include a 10 MW/20MWh batteryenergy storage system.
The initial term of the PPA is twenty years, commencing upon the commercial operationsdate, and will remain in effect thereafter until terminated by either party.
p. HECO POWER PURCHASE AGREEMENT –IC SUNSHINE, LLCDocket No. 2011-0145
On January 19, 2011, Hawaiian Electric filed an application requesting that theCommission: (1) approve a power purchase agreement (“PPA”) between Hawaiian Electric andIC Sunshine LLC (“IC Sunshine”); (2) authorize Hawaiian Electric to include the purchasedenergy charges that it incurs under the PPA in Hawaiian Electric’s Energy Cost AdjustmentClause (“ECAC”); (3) find that the purchased energy charges to be paid by Hawaiian Electricpursuant to the PPA are reasonable; and (4) find that Hawaiian Electric’s purchased powerarrangements under the PPA, pursuant to which Hawaiian Electric purchases energy on anas-available basis from IC Sunshine, are prudent and in the public interest; and (5) determine thatthe 46 kV line extension included as part of Hawaiian Electric’s interconnection facilities may beconstructed above the surface of the ground. Pursuant to the PPA, IC Sunshine would install,operate, and maintain an approximately five MW photovoltaic energy facility on a twenty-acreparcel of property in Campbell Estate Industrial Park, Ewa District, on the island of Oahu.
On June 9, 2011, the Consumer Advocate filed its statement of position, stating that itgenerally does not object to Hawaiian Electric’s application. The Consumer Advocate’s onlyconcern with the PPA is that Hawaiian Electric has deemed the proposed PPA’s energy chargecomparable to the proposed Feed-in Tariff (“FIT”) rate in Docket No. 2008-0273, based onIC Sunshine’s representation that it will be utilizing a 24.5% refundable State tax credit instead ofthe 35% tax credit. The Consumer Advocate contends that, as payment of the higher FIT tariffrate is dependent on the FIT developer providing evidence that it has taken the lower tax rate of24.5%, IC Sunshine should also make a similar showing before utilizing an energy charge that iscomparable to the higher FIT tariff rate. On June 30, 2011, Hawaiian Electric filed its replystatement of position, stating that it has initiated discussions with IC Sunshine to address theConsumer Advocate’s concern. According to Hawaiian Electric, if IC sunshine elects to file forthe 35% tax credit instead of the 24.5% tax credit, a lower payment for the energy will be appliedand will be reflected in an amendment to the PPA. The language in the proposed amendment iscurrently being negotiated by Hawaiian Electric and IC Sunshine. The Commission is waiting forthe proposed amendment to be filed before issuing its Decision and Order.

Public Utilities Commission Annual Report 2010-11State of Hawaii Page 43
q. MAUI ELECTRIC COMPANY’S POWER PURCHASEAGREEMENT WITH AUWAHI WIND ENERGY LLCDocket No. 2011-0060
On June 15, 2011, the Commission approved the power purchase agreement foras-available energy between Maui Electric and Auwahi Wind Energy LLC for approximately21 MW of wind from Auwahi Wind’s proposed wind facility on the island of Maui. The initial termis twenty years, commencing upon the commencing upon the commercial operations date, andwill remain in effect thereafter until terminated by either party.
r. KIUC – POWER PURCHASE CONTRACT FORAS-AVAILABLE ENERGY WITH PIONEER HI-BREDINTERNATIONAL INC.Docket No. 2010-0122
In November 2010, the Commission approved the power purchase contract foras-available energy between KIUC and Pioneer Hi-Bred International Inc. ("Pioneer"), and otherrelated matters. As a result, KIUC will purchase as-available energy generated from Pioneer's250 kW photovoltaic facility located at the Waimea Research Center.
s. KIUC – POWER PURCHASE CONTRACT FOR ASAVAILABLE ENERGY WITH GREEN ENERGY TEAM LLCDocket No. 2011-0032
On February 15, 2011, KIUC filed an application for approval of a 20-year power purchasecontract with Green Energy Team. Green Energy Team plans to build, own, and operate aproposed biomass-fueled electric generating facility that will provide KIUC with an expectedannual net electrical output of 6.7 MW on a 24-hours-a-day basis, with a normal dispatch range of4.2 MW to 7.5 MW. The proposed Facility is expected to be a biomass-fired boiler with a steamturbine and generator rated at 11 MVA. The steam which powers the Facility's generator will beprovided by a water tube boiler with moving grate. Water will be fed to the Facility's generatorfrom an on-site well or a spring to an on-site water treatment system and the primary fuel for theFacility will be wood chips supplied from an existing tree farm, woody biomass obtained fromclearing invasive and non-invasive tree species, and/or material supplied from a short rotationtree farm.
On August 16, 2011, the Consumer Advocate filed its Statement of Position indicating thatit does not object to the approval of the power purchase agreement and other requests by KIUCrequested in the application.
On October 11, 2011, KIUC and the Consumer Advocate filed a letter with theCommission supplementing the record as it pertains to the capacity charge. Specifically, pursuantto Hawaii Revised Statutes § 269-27.2(d), in order to allow for the recovery of the capacity chargeIn between general rate case proceedings, the Commission must find the capacity chargepayments to be: (1) just and reasonable; (2) not unduly prejudicial to the customers of the utility;(3) promotional of Hawaii's long-term objective of energy self-sufficiency; (4) encouraging to themaintenance or development of non-fossil fueled sources of electrical energy; and (5) in theoverall best interest of the general public. The Commission will consider the supplementedrecord and render a decision and order shortly.
t. KIUC’S POWER PURCHASE AGREEMENT WITH KAPAASOLAR LLCDocket No. 2010-0179
On March 3, 2011, the Commission approved the power purchase agreement betweenKIUC and Kapaa Solar LLC to provide approximately 1 MW from Kapaa Solar’s photovoltaic

Public Utilities Commission Annual Report 2010-11State of Hawaii Page 44
generation plant. The initial term is twenty years, commencing upon the in-service date (the dateupon which KIUC receives notification that Kapaa Solar meets all requirements under theinterconnection agreement), and will remain in effect until terminated by either party.
u. KIUC’S POWER PURCHASE AGREEMENT WITH POIPUSOLARDocket No. 2010-0307
On July 7, 2011, the Commission approved the power purchase agreement for as-availableenergy between KIUC and Poipu Solar to provide approximately 3 MW from Poipu Solar’sphotovoltaic generation plant. The initial term is twenty years, commencing upon the in-servicedate (the date upon which KIUC receives notification that Poipu Solar meets all requirementsunder the interconnection agreement, but no earlier than June 30, 2011), and will remain in effectthereafter for 5 automatic 1-year extensions until terminated by either party.
v. HECO/HELCO/MECO – ELECTRIC VEHICLE PILOTRATESTransmittal No. 10-05
In September 2010, the Commission, in a 2-1 decision, approved the establishment ofelectric vehicle pilot rates (residential and commercial customers) for HECO, HELCO, and MECOfor a three-year pilot period, from October 1, 2010 to September 30, 2013. The underlyingpurposes of the electric vehicle pilot rates are to: (1) encourage the charging of electric vehiclesduring off-peak periods, when the demand for energy from consumers is lower; (2) obtain loadprofile data from a random sampling of electric vehicle participants; and (3) utilize load controlrelays at selected Oahu locations to test the overall operational reliability of HECO's system whenelectric vehicle chargers are in-service.
w. COMMISSION APPROVAL OF CAPITALIMPROVEMENTS
Prior to July 1, 2004, electric and telecommunications utilities were required by theCommission’s administrative rules to obtain approval for all capital improvement project (“CIP”)expenditures over $500,000. Effective July 1, 2004, the threshold increased from $500,000 to$2.5 million for the electric and telecommunications utilities, resulting in a reduction in the numberof CIP applications requesting commission approval.
During the Commission’s 2010-2011 Fiscal Year, HECO was authorized to expendapproximately $16.9 million for its capital improvements. Expenditures include approximately$6.7 million for Barbers Point Fuel Oil Tank 132 Renovation, approximately $4.1 million for MobileRadio Replacement and related Equipment, and $6.1 million for Kahe Unit 1 Condenser Retubeprojects.
During this fiscal year, HELCO was authorized to expend approximately $3.2 million forWaimea-Keamuku Project.
Primarily as a result of the increase to a $2.5 million threshold, there were no CIP filingsapproved by the commission for MECO, or KIUC.

Public Utilities Commission Annual Report 2010-11State of Hawaii Page 45
Figure 1
Five-Year Comparison of Commission Approved Electric Utility CIP

Public Utilities Commission Annual Report 2010-11State of Hawaii Page 46
D. GAS PROCEEDINGSThe Gas Company, LLC (“TGC”) is a duly franchised public utility providing gas service
for residential, commercial, and industrial uses throughout the State. TGC’s operations consist ofthe purchase, production, transmission, and distribution of gas through gas pipelines, and sale ofsynthetic natural gas (“SNG”) and liquid propane gas.
A key proceeding in the gas service industry is summarized below:
1. THE GAS COMPANY’S 2010 TEST YEAR RATE CASEDocket No. 2008-0081
In August 2008, TGC filed its application for a general rate increase of $12,510,047 overrevenues at present rates for its Oahu, Maui, Kauai, Hawaii (Hilo and Kona), Molokai, and Lanaiutility districts. TGC requested rate relief based on an estimated total revenue requirement of$160,416,523 for the 2009 calendar test year (consolidated operations basis), and an overall rateof return of 8.81 per cent. Statewide public hearings were held by the Commission in Fall 2008.
In June 2009, the Commission approved, on an interim basis, an increase in revenuesover present rates of $9,519,293 based on the 2009 calendar test year.
In April 2010, the Commission issued its final decision and order, approving an increasein revenues of $9,211,450 or approximately 10.67% over revenues at present rates, forTGC based on a rate of return of 8.0 per cent and a total revenue requirement of $95,538,302 forthe Test Year (consolidated utility basis).
In June 2010, the Commission approved the Joint Refund Plan that will commenceduring the July 2010 billing cycle.
2. TGC’S BIO SYNTHESIS GAS PILOT PROJECTDocket No. 2010-0334
In December 2010, The Gas Company (“TGC”) filed an application seeking commissionapproval to: (1) expend $2,235,425 for the design and installation of its proposed Bio SynthesisPilot Project (“Pilot Project”) and to include such amounts in its rate base; and (2) include cost forthe triglyceride feedstock acquired and used for the Pilot Project in its fuel adjustment clause.TGC and Consumer Advocate’s Stipulated Procedural Order was approved by the Commission inMarch 2011. Upon a round of discovery and request for and approval of an extension of time, theConsumer Advocate submitted its Statement of Position on July 13, 2011. By letter filed onJuly 22, 2011, the Consumer Advocate confirmed TGC’s assertion filed on July 21, 2011, that theremaining steps of the approved Stipulated Procedural Order are no longer necessary. Adecision on this matter is pending.

Public Utilities Commission Annual Report 2010-11State of Hawaii Page 47
E. TELECOMMUNICATIONS PROCEEDINGSThe Commission oversees the intrastate cellular, paging, mobile telephone, and other
services of telecommunications providers in addition to the services of Hawaiian Telcom, Inc.(“Hawaiian Telcom”), formerly known as Verizon Hawaii Inc. (“Verizon Hawaii”), the State’s onlyincumbent local exchange carrier and largest provider of intrastate services.
Key activities in telecommunications are highlighted below.
1. NEW TELECOMMUNICATIONS CARRIER CERTIFICATIONSThe Commission certificated 12 new telecommunications companies in the Fiscal Year,
which were resellers of various intrastate wireless, calling card, and interexchange (long distance)telecommunications services.
2. CHAPTER 11 PLAN OF REORGANIZATION OF HAWAIIANTELCOM, INC. (“HT”) AND HAWAIIAN TELCOM SERVICESCOMPANY, INC. (“HTSC”)Docket No. 2010-0001
In January 2010, HT and HTSC filed an application requesting Commission approval of the Planof Reorganization (“Plan”) of Hawaiian Telcom Communications, Inc. and its debtor affiliatesconfirmed by the U.S. Bankruptcy Court for the District of Hawaii in In re Hawaiian TelcomCommunications, Inc., et al., Case No. 08-02005, including the security arrangements associatedwith the Plan that directly affect HT and HTSC, to the extent required. In addition, HT and HTSCrequests other Commission approvals triggered by HRS Chapter 269, including HRS §§ 269-7,269-17 and 269-19 to effectuate and carry out the Plan or any portions of the Plan.
The participants of the proceeding (tw telecom of hawaii, l.p. and the InternationalBrotherhood of Electrical Workers, Local 1357) and the Consumer Advocate conducted discoveryregarding HT and HTSC’s request and filed their position statements on May 10, 2010 andMay 6, 2010, respectively. In June 2010, HT and HTSC filed their joint Response/RebuttalStatement to the Consumer Advocate’s and Participants’ Position Statements.
In September 2010, the Commission issued its Decision and Order approving applicableportions of the Reorganization Plan. In addition, the Commission approved related financingarrangements to the extent necessary to effectuate and carryout the Reorganization Plan, andrequired HT and HTSC to adhere to certain regulatory conditions.
In October 2010, the Reorganization Plan was effectuated and HT Communications andits debtor affiliates including HT and HTSC emerged from bankruptcy
3. TELECOMMUNICATIONS RELAY SERVICES (“TRS”)CONTRIBUTION FACTOR AND FUND SIZE MODIFICATIONDocket No. 2011-0095
In May 2011, the Commission initiated an investigation to examine whether to modify theTRS carrier contribution factor and fund size, effective July 1, 2011. In June 2011, theCommission approved a contribution factor of 0.0012 and established the annual projected TRSfund size at approximately $218,640, effective July 1, 2011, for the 2011 TRS funding period andeach period going forward, until revised otherwise by the commission.
4. TRANSFER OF CONTROLHawaii Revised Statutes § 269-16.9 allows the Commission to waive regulatory
requirements applicable to telecommunications providers if it determines that competition will

Public Utilities Commission Annual Report 2010-11State of Hawaii Page 48
serve the same purpose as public interest regulation. Specifically, Hawaii Administrative Rules§ 6-80-135 permits the Commission to waive the applicability of any of the provisions ofHawaii Revised Statutes chapter 269 or any rule, upon a determination that a waiver is in thepublic interest. Waivers were granted in the following proceedings:
PUBLIC COMMUNICATIONS SERVICES, INC. and GLOBALTEL*LINK CORPORATION – Docket No. 2010-0150
PAETEC HOLDING CORP. and TALK AMERICA, INC. - DocketNo. 2010-0177
ITC^DELTACOM, INC. and EARTHLINK, INC. - Docket No. 2010-0281
STI PREPAID, LLC and VIVARO CORPORATION - DocketNo. 2010-0284
ZONE TELECOM, INC. - Docket No. 2010-0289
VOICECOM TELECOMMUNICATIONS, INC., VOICECOMTELECOMMUNICATIONS, LLC, and AMVENSYS TELECOMHOLDINGS, LLC - Docket No. 2011-0013
GLOBAL CAPACITY GROUP, INC. and GC PIVOTAL, LLC - DocketNo. 2011-0041
BELLSOUTH LONG DISTANCE, INC. – Docket No. 2011-0049
SECURUS TECHNOLOGIES, INC. – Docket No. 2011-0075
LEVEL 3 COMMUNICATIONS, INC., APOLLO AMALGAMATION SUB,LTD., LEVEL 3 COMMUNICATIONS, LLC, BROADWINGCOMMUNICATIONS, LLC, WILTEL COMMUNICATIONS, LLC andGLOBAL CROSSING NORTH AMERICA, INC., GLOBAL CROSSINGTELECOMMUNICATIONS, INC. – Docket No. 2011-0079
VALUE-ADDED COMMUNICATIONS, INC. AND GLOBAL TEL*LINKCORPORATION - Docket No. 2011-0106
5. T-MOBILE WEST CORPORATION
Docket No. 2010-0119In March 2011, the Commission designated T-Mobile West Corporation as an eligible
telecommunications carrier for the State of Hawaii (with the exception of the Hana district on theisland of Maui), thereby making the telecommunications carrier eligible to receive federaluniversal support from the federal universal service fund.

Public Utilities Commission Annual Report 2010-11State of Hawaii Page 49
6. SELECTION OF TELECOMMUNICATIONS RELAY SERVICES(“TRS”) PROVIDER
Docket No. 2010-0302In November 2010, the Commission opened a proceeding to investigate the availability of
experienced providers of quality TRS and to select the best qualified provider for the serviceperiod commencing from July 1, 2011 to June 30, 2014 (“Service Period”). To make its selection,the Commission issued a request for services (“RFS”) on March 14, 2011. Two entities,Sprint Communications Company, Inc. (“Sprint”) and Hamilton Relay, Inc., filed proposals inresponse to the RFS. An evaluation committee was formed to assess the proposals and make arecommendation to the Commission.
By Decision and Order issued in April 2011, the Commission adopted the evaluationcommittee’s selection of Sprint as the exclusive provider of intrastate TRS in the State of Hawaiifor the Service Period, conditioned upon the execution of the TRS contract with Sprint.
7. HAWAIIAN TELCOM, INC. AND HAWAIIAN TELCOM SERVICESCOMPANY, INC.’S DEBT REFINANCING
Docket No. 2011-0124On May 26, 2011, Hawaiian Telcom, Inc. and Hawaiian Telcom Services Company, Inc.
(“Applicants”) submitted an application seeking commission approval to modify their existingfinancing arrangements (i.e., $300 million secured term loan and $30 million secured revolvingcredit facility) to, among other things, obtain better terms and conditions. By Decision and Orderfiled on June 17, 2011, the Commission approved Applicants’ proposed modifications to theirfinancing arrangements and related matters as set forth in their application.
8. COMMISSION RECEIVES NO APPLICATIONS FOR APPROVALOF CAPITAL EXPENDITURES DURING FISCAL YEAR
Prior to July 1, 2004, telecommunications carriers were required by the Commission’sadministrative rules to obtain approval for all CIP expenditures over $500,000. Similar to thethreshold applicable to electric utilities, effective July 1, 2004, the threshold fortelecommunications utilities increased from $500,000 to $2.5 million. Accordingly, only thoseapplications requesting approval for CIP expenditures over $2.5 million must be submitted to theCommission for review. During the Fiscal Year, Hawaiian Telcom did not file any requests forCIP approvals. For the past five (5) years, there were no CIP filings approved by thecommission.
Public Utilities Commission Annual Report 2010-11State of Hawaii Page 50
F. PRIVATE WATER AND SEWAGE UTILITIES PROCEEDINGSThe Commission regulates 38 privately owned water and sewage treatment utilities that
serve suburban, rural, and resort areas throughout the State. The majority of these utilities arelocated on the neighbor islands.
During the Fiscal Year, the Commission’s key proceedings in this area included ratecases and requests for Certificates of Public Convenience and Necessity (“CPCNs”).
1. RATE INCREASES DOCKETSDuring this Fiscal Year, the Commission reviewed rate increases for the following water
and sewage utilities:
Hawaii Water Service Company, Inc. – Ka’anapali Division - DocketNo. 2009-0310
Hawaii-American Water Company – Docket No. 2010-0313
Olowalu Water Company, Inc. – Docket No. 2010-0340
South Kohala Water Corporation – Docket No. 2010-0064
2. NEW AND AMENDED CPCNSDuring the Fiscal Year, the Commission reviewed new and amended CPCNs for water
and sewage utilities, including the following:
South Kohala Water Corporation - Docket No. 2010-0064
Kona Water Service Company - Docket No. 2010-0180
3. MOLOKAI PUBLIC UTILITIES, INC. GENERAL RATE INCREASEREQUESTDocket No. 2009-0048
Molokai Public Utilities, Inc. ("MPU") is a public utility that provides potable water servicein the Kaluakoi area on the island of Molokai.
In June 2009, MPU filed its amended application for a general rate increase, seeking anincrease in revenues of $886,259 (approximately 201.5%), based on the July 1, 2009 to June 30,2010 test year. In May 2010, the Commission issued its Interim Decision and Order, approvingan increase in revenues over present rates of $542,724 (approximately 125%) for MPU, based ona total revenue requirement of $976,375. MPU's Phase 1 interim rates took effect on July 1,2010. In September 2010, the Commission issued its Decision and Order, approving an increasein revenues over present rates of $548,682 (approximately 126.52%) for MPU, based on a totalrevenue requirement of $982,333. MPU's Phase 1 interim rates, which took effect on July 1,2010, remained in effect for a six-month period through December 31, 2010. On January 1,2011, MPU's Phase 1 final rates took effect.

Public Utilities Commission Annual Report 2010-11State of Hawaii Page 51
In October 2010, Intervenor County of Maui appealed the Commission's Decision andOrder to the State of Hawaii, Intermediate Court of Appeals ("ICA"). Written briefs have beenfiled with the ICA by Appellant/Intervenor County of Maui, and Appellees MPU, the ConsumerAdvocate, and the Commission. The ICA's written decision is pending.
4. WAI’OLA O MOLOKA’I INC. GENERAL RATE INCREASEREQUESTDocket No. 2009-0049
In June 2009, Wai’ola filed an amended application for a general rate increase. Wai‘olais seeking additional revenues of $473,431 or an approximate 382.85 per cent increase, over thepro forma revenue requirement for the July 1, 2009 to June 30, 2010 test year and a rate of returnof 2 per cent. In addition, as part of its amended application, Wai‘ola also proposed to:(1) establish an Automatic Power Cost Adjustment Clause, which permits adjustments for electriccosts during the year, and amend Rule 20 of its Rules and Regulations to increase itsReconnection Charge from $50.00 to $100.00, which is an increase of 100 per cent.
In September 2009, the Commission held a public hearing on Wai`ola’s amendedapplication on the island of Molokai. The parties to this proceeding, Wai’ola, the ConsumerAdvocate, Molokai Properties Limited, and the County of Maui, conducted discovery and filedtheir respective direct and rebuttal testimonies in this proceeding. On May 19 and 20, 2010, theCommission held an evidentiary hearing regarding the matters of this docket.
On May 28, 2010, the Interim Decision and Order and the Dissenting Opinion ofLeslie H. Kondo, Commissioner was issued. In the Interim Decision and Order, the Commissionapproved, on an interim basis, an increase in revenues over present rates of $241,478(approximately 223%) for Wai`ola, based on the July 1, 2009 to June 30, 2010 test year, and atotal revenue requirement of $329,877. In addition, the Commission approved Wai`ola and theConsumer Advocate’s proposal to apply the increase on an “across-the-board, three-stepphased-in basis”, for interim purposes.
On February 2011, the Commission issued its Decision and Order approving an increasein revenues over present rates of $360,238 (approximately 284.5%) for Wai`ola, based on theJuly 1, 2009 to June 30, 2010 test year and total revenue requirements of $486,856. OnMarch 2011, the County of Maui, a party to the proceeding, appealed the Commission’sFebruary 2011 Decision and Order to the Intermediate Court of Appeals of the State of Hawaii(“ICA”). This matter is currently before the ICA. In June 2010, notice was provided to the partiesof the availability of the official transcripts triggering the filing of post-hearing pleadings.

Public Utilities Commission Annual Report 2010-11State of Hawaii Page 52
G. MOTOR CARRIERS PROCEEDINGS
The Commission regulates passenger and property motor carriers. Passenger carriersare classified by authorized vehicle seating capacity. They include tour companies, limousineservices, and other transportation providers. Property carriers are classified by the types ofcommodities transported and the nature of services performed, namely: general commodities,household goods, commodities in dump trucks, and specific commodities.
By law, certain transportation services, including, without limitation, taxis, school and citybuses, ambulance services, refuse haulers, farming vehicles, and persons transporting personalproperty, are exempt from Commission regulation.
Many of the State’s motor carriers are members of either the Western Motor TariffBureau, Inc. (“WMTB”) or the Hawaii State Certified Common Carriers Association (“HSCCCA”).WMTB and HSCCCA are nonprofit organizations engaged in the research, development, andpublication of motor carrier tariffs. The two organizations represent their members in ratemakingproceedings before the Commission.
In accordance with its statutory requirements, the Commission performs the followingfunctions in the regulation of motor carriers: (1) certification and licensing; (2) ratemaking; and(3) business regulation. During the Fiscal Year, the Commission issued many new certificatesand licenses, reviewed requested rate increases, and extended the zone of reasonablenessprogram for motor carriers to December 2011.
1. NEW MOTOR CARRIER CERTIFICATIONSThe Commission regulates 680 passenger carriers and 582 property carriers in the State.
During the Fiscal Year, new certificates or permits were issued to 58 motor carriers,41 passenger carriers and 17 property carriers.
In the Fiscal Year, the number of authorized passenger carriers increased over theprevious fiscal year, as shown in Figure 2.

Public Utilities Commission Annual Report 2010-11State of Hawaii Page 53
Figure 2
Number of Active Motor Carriers
0
100
200
300
400
500
600
700
800
FY
Nu
mb
er
of
Mo
tor
Carr
iers
Property Carriers 521 588 600 593 582
Passenger Carriers 590 627 651 679 680
2006-07 2007-08 2008-09 2009-10 2010-11
2. REQUESTS FOR RATE CHANGES
During the Fiscal Year, the Commission reviewed and approved rate increases anddecreases within and outside of the zone of reasonableness program, which went into effect onJanuary 1, 2004 and continues through December 31, 2011. During the Fiscal Year, all WesternMotor Tariff Bureau, Inc. (“WMTB”) motor carriers filed requests for rate changes. Of theindependent motor carriers, the Commission reviewed and approved requests from 73 motorcarriers. The Commission reviewed and approved the following motor carrier increases anddecreases:
Rate Changes Within the Ten (10) Per Cent Zone Limit.
For the rate changes that were within the zone limit of ten (10) percent, most were forrate increases of five (5) or ten (10) percent. Other rate increases ranged from less than two (2)to four (4) percent. The Commission approved the following motor carrier increases anddecreases within the zone:

Public Utilities Commission Annual Report 2010-11State of Hawaii Page 54
FISCAL YEAR JULY 2010 - JUNE 2011Rate Changes Within the Ten (10) Percent Zone Limit
Type of Carrier/Company (County) Rate Increase
or (-Decrease)Dump Truck
SKF Services, LLC Oahu 10%
Harris Trucking, Inc. Oahu (-10%)
West Maui Land Company, Inc. Maui 10%
Tri Isle Inc. Maui 8.51%
Kalaka Nui, Inc. Oahu 10%Fredstan Kaluahine dba Fredstan Kaluahine's Towing Kauai 10%
C. J. Peterson Services Inc. Oahu 10.00%
WMTB-Keaau Service Station, Inc. Hawaii 6%
WMTB - All Carriers - Maui Maui (-6%)
Conen's Freight Transport, Inc. Hawaii 10.00%
Ed Yamashiro, Inc. Oahu 4.7-5%, (-3.31%)
ER Ranch & Services, LLC Maui 10.00%
Tri Isle Inc., dba Valley Isle Express, & dba Haleakala Trans Maui 5.00%
WMTB - All Carriers - Maui Oahu 4%
WMTB - All Carriers - Maui Kauai 10%
Pomaika’i Transport Services, Inc. Oahu 10%
General Commodities
Harris Trucking, Inc. Oahu (-10%)
Hawaii Transfer Company, LTD. Oahu 4.00%
Tri Isle Inc., dba Valley Isle Express, & dba Haleakala Trans Maui 8.51%
Kalaka Nui, Inc. Oahu .7 - 10%
Pacific Transfer, LLC Oahu 5.00%
Hitco Moving & Storage dba H. Kono, Inc. Hawaii 10.00%
International Express, Inc. Oahu 5.00%
Mercantile Trucking Service, LTD. Oahu 10.00%
Hawaii Transfer Company, LTD. Oahu 2.12%
Alven Corp., dba Hawaii Logistic Services Oahu 6.00%
C. J. Peterson Services Inc. Oahu 10.00%
WMTB-Imperial Trucking, Inc. Oahu 5.00%
International Express, Inc. Oahu 8.00%
WMTB-Keaau Service Station, Inc. Hawaii 6%
Alven Corp, dba hawaii Logistic Services Oahu 1.14-9.09%
Conen's Freight Transport, Inc. Hawaii 10.00%
Dependable Hawaiian Express, Inc., dba DHX Oahu 5.00%

Public Utilities Commission Annual Report 2010-11State of Hawaii Page 55
DHX Maui, Inc. Maui 5.00%
Ed Yamashiro, Inc. Oahu 5.00%
ER Ranch & Services, LLC Maui 10.00%
Hawaii Transfer Company, LTD. Oahu 2.07-10%
International Express, Inc. Oahu 3.00%
Royal Hawaiian Movers, Inc. O,M,H,K 5%
Tri Isle Inc., dba Valley Isle Express, & dba Haleakala Trans Maui 5.00%
Direct Support Resources, Inc. Oahu 3-5%
G.P. Services LLC Maui 7-10%
Pomaika'i Transport Services, Inc. Oahu 10%
Household Goods
Honolulu Freight Service, Inc. Oahu 6.00%
WMTB-HHG - Statewide O,M,H,K 5%
Royal Hawaiian Movers, Inc. O,M,H,K 5%
Honolulu Freight Service, Inc. Oahu (-.93%)
Others (Specific Commodities)
WMTB -Bering Sea Ecotech, Inc. Oahu 1.50%
Fredstan Kaluahine dba Fredstan Kaluahine's Towing Kauai 10.00%
WMTB -Al Local & Joint Freight Carriers on Kauai Kauai 10%
Honolulu Freight Service, Inc. Oahu 5%
Break Bulk and Delivery
Tri Isle Inc. Maui 8.51%
International Express, Inc. Oahu 5.00%
Mercantile Trucking Service, LTD. Oahu 10.00%
WMTB - Hitco Moving & Storage dba H. Kono, Inc. Hawaii 10.00%
International Express, Inc. Oahu 5.00%
Hawaii Transfer Company, LTD. Oahu 5%
International Express, Inc. Oahu 3.00%
Tri Isle Inc., dba Valley Isle Express, & dba Haleakala Trans Maui 5.00%
Xpress Trucking, Inc. O,M 5%
WMTB - All Carriers on Kauai Kauai 10%
Dependable Hawaiian Express, Inc., dba DHX (Oahu) Oahu 5%

Public Utilities Commission Annual Report 2010-11State of Hawaii Page 56
Passenger
Elite Limousine Service, Inc. Oahu 2.8-6.3%
Aina Ihi Ecotours, Inc. Hawaii (-5-10%)
RDH Trans Service dba Superstar Hawaii Transit Oahu 2-5% (-4%)
Enoa Corporation Oahu 1.16%-4.16%
Enoa Corporation Oahu 1.78%-2.17%
Maui Executive Transportation Services, LLC Maui 4-10%
Carey Hawaii, LLC Oahu .3of 1% to 5.1%
Enoa Corporation Oahu (-5.28-6.25%)
KapohoKine Adventures, LLC Hawaii 10%
Rate Changes Outside the Ten (10) Per Cent Zone Limit. The Commission reviews requestsfor rate increases that do not fall within the zone of reasonableness. In its review of theserequests, the Commission requests the motor carriers to submit financial statements containingthe companies’ revenues, expenditures, and operating ratio. The Commission approves the rateincrease or decrease based on an acceptable operating ratio reported in the financial statement.During the Fiscal Year, the Commission reviewed and approved the following rate changes thatdid not fall within the zone of reasonableness:
Rate Increase
Type of Carrier/Company (County) or Decrease
Passenger
A Absolutely Affordable and Reliable Shuttle, LLC Oahu 7-40%
Jaime, Juan Jose, dba Hawaii Airport Shuttle Oahu 6.25-33.33%
Property
None

Public Utilities Commission Annual Report 2010-11State of Hawaii Page 57
H. WATER CARRIERS PROCEEDINGS
The Commission regulates four water carriers: Young Brothers, Limited (“YoungBrothers”), a provider of inter-island cargo service between all major islands; Sea Link of Hawaii,Inc. (“Sea Link”), a passenger and cargo carrier providing water transportation services betweenthe islands of Maui and Molokai; Hone Heke Corporation (“Hone Heke”), a passenger and cargocarrier providing water transportation services between the islands of Maui and Lanai; and PashaHawaii Transport Lines LLC (“Pasha”), a provider of cargo service between the ports of Honolulu,Kahului, and Hilo with authorization to make calls to Nawiliwili, Barbers Point, and Pearl Harborupon a customer’s request. Water carrier docket proceedings are summarized below.
1. YOUNG BROTHERS’ REQUEST FOR A RATE INCREASEPURSUANT TO ITS NEW ZONE PRACTICEDocket No. 2001- 0255
In June 2011, the Commission terminated the Zone of Reasonableness rate adjustmentprogram for Young Brothers, reasoning that the program was no longer consistent with the publicinterest.
2. PASHA HAWAII TRANSPORT LINES LLC’S REQUESTFOR A CPCNDocket No. 2009-0059
On September 20, 2010, the Commission issued an Interim Decision and Orderapproving Pasha Hawaii Transport Lines LLC’s (“Pasha”) application for a Certificate of PublicConvenience and Necessity (“CPCN”). The Interim Decision and Order authorizes Pasha tooperate as a water carrier of property on an interim basis through December 31, 2013. Pasha’sinterim CPCN is limited to the use of only one vessel, the M/V Jean Anne, to be operated on afortnightly service schedule (i.e., every fourteen days) between and among the ports of Honolulu,Kahului, and Hilo. Pasha is also authorized to make calls to Nawiliwili, Barbers Point, andPearl Harbor upon a customer’s request.
In granting interim approval, the Commission found that Pasha’s proposed intrastateoperations will foster competition in the intrastate shipping industry, provide consumers with achoice of intrastate water carriers, and minimize any potential harm or inconvenience to the publicif existing services were disrupted. The Commission also found no specific, verifiable evidence inthe record that Pasha’s proposed service will detrimentally harm the public or other intrastatewater carriers. At the same time, however, the Commission recognized that, without actual data,it is difficult to properly evaluate how the entry of a new carrier may affect existing services. As aresult, the Commission chose to allow Pasha to operate on an interim basis so that theCommission can obtain actual intrastate revenue, cargo volume and cost support data to make amore informed final decision.
The Interim Decision and Order allows the parties to submit supplemental comments,expert testimony, and other evidence to the Commission for consideration. It also includesextensive reporting requirements and other protections to ensure that there will be no significantadverse impacts to existing water carriers or the general public during the pendency of furtherproceedings. Furthermore, the Commission has the authority to terminate Pasha’s interimauthority to operate if, at any time, the Commission determines that Pasha’s intrastate servicecauses undue harm to existing intrastate shipping services or the public interest.
On December 29, 2010, Young Brothers, Limited (“YB”) appealed the Commission’sInterim Decision and Order to the Intermediate Court of Appeals of the State of Hawaii (“ICA”).The Division of Consumer Advocacy of the Department of Commerce and Consumer Affairs

Public Utilities Commission Annual Report 2010-11State of Hawaii Page 58
followed suit by filing a cross-appeal on January 12, 2011. Those appeals are currently pendingbefore the ICA.
In addition, Act 213 was recently enacted by the legislature to amend certain provisionsof Chapter 271G of the Hawaii Revised Statutes. Act 213, which is effective as of July 1, 2011,specifies in part that the Commission “shall not make a finding of public convenience andnecessity nor issue a certificate if the evidence in the record indicates that the issuance of thecertificate would diminish an existing water carrier’s ability to realize its allowed rate of return or ifthe certificate would allow an applicant to serve only high-margin or high profit ports or lines ofservice that are currently served by an existing carrier.” The Commission will be further reviewingPasha’s Interim CPCN in light of Act 213 and any subsequent decisions by the ICA.
3. YOUNG BROTHERS, LIMITED – APPROVAL TO ENTERINTO A LONG-TERM LEASE FOR PHOTOVOLTAICEQUIPMENT WITH PNC ENERGY CAPITAL, LLCDocket No. 2010-0282
In November 2010, the Commission approved a long-term lease between YB and PNCEnergy Capital, LLC, for the installation and operation of photovoltaic equipment atop YB'smaintenance shed in Honolulu for the purpose of powering the water carrier's shore-sidemaintenance operations.
4. YOUNG BROTHERS, LIMITED’S REQUEST FORGENERAL RATE INCREASEDocket No. 2010-0171
On September 10, 2010, Young Brothers filed a Notice of Intent to file an application for ageneral rate increase and for certain tariff changes. On December 22, 2010, Young Brothers filedan application (“December 22 Application”), seeking commission approval to: (1) increase itscommodity rates, fees, and charges; (2) make certain revisions to its Tariff 5-A; and (3) switchfrom a calendar monthly closing schedule to a closing schedule that, on a quarterly basis, woulddivide the reporting periods as follows: five weeks for the first period, four weeks for the secondperiod, and four weeks for the third period within the quarter (referred to Young Brothers as itsproposed “Five-Four-Four” quarterly schedule. Specifically, in the December 22 Application,Young Brothers requested approval to increase its revenues in the amount of $14,404,000, or by23.97 percent over revenues at current rates in the amount of $60,079,767, at a proposed rate ofreturn 14.12 percent.
On January 11, 2011, the Consumer Advocate filed its Statement of Position RegardingCompleteness of Application (“Consumer Advocate’s January 11 SOP”). Based on its review ofthe December 22 Application, the Consumer Advocate stated that Young Brothers December 22Application was incomplete since it did not comply with the filing requirements set forth in theCommission’s rules.
On January 27, 2011, Young Brothers filed a reply to the Consumer Advocate’sJanuary 11 SOP. In its Reply, Young Brothers responded to each of the points raised by theConsumer Advocate regarding the completeness of Young Brothers’ December 22 Application.
On February 3, 2011, the Commission issued an order, rejecting Young Brothers’December 22 Application without prejudice. Specifically, the Commission found that YoungBrothers’ December 22 Application lacked the recorded actual results of operations for the priorcalendar year, as required by the Commission’s rules. The Commission, however, allowedYoung Brothers to re-file a new application in accordance with the Commission’s rules.

Public Utilities Commission Annual Report 2010-11State of Hawaii Page 59
On February 11, 2011, Young Brothers filed a pleading entitled “Submission of YoungBrothers, Limited in Response to Order Rejecting Application Without Prejudice Filed February 3,2011” (“Submission”). Young Brothers, on March 1, 2011, filed a Motion for Clarification of OrderRejecting Application Without Prejudice Filed February 3, 2011, which the Commission dismissedas untimely on March 24, 2011.
On May 6, 2011, Young Brothers re-filed its Application for approval of a general rateincrease and certain tariff changes. Included within the Application, Young Brothers offers twoscenarios for the commission’s consideration. Young Brothers states that “With Pasha ImpactReflected,” it will need to increase its revenues by $16,986,000, i.e., approximately 28.68 percentover revenues at present rates in the amount of $59,216,236, and a proposed rate of return of14.12 percent on the water carrier’s average depreciated rate base (for its intrastate water carrieroperations). Young Brothers alternatively notes that “Without Pasha Impact Reflected,” it willneed an increase in revenues in the amount of $13,591,000, or approximately 22.50 percent overrevenues at present rates in the amount of $60,397,356, with a projected rate of return of11.97 percent.
On May 6, 2011, Young Brothers re-filed its application, exhibits, and direct testimonies.Specifically, Young Brothers seeks the Commission’s approval to increase its revenues by$14,195,000, and not more than $14,404,000, the rate increase requested in its originalapplication filed on December 22, 2011, or by approximately 23.97 percent over revenues atpresent rates, based on a 2011 calendar test year and a proposed rate of return of 14.12 percent,but with an effective rate of return of 11.68 percent given Young Brothers’ proposed reduction ofrevenue requirements, on the water carrier’s average depreciated rate base (for its intrastatewater carrier operations). For specific cargo types, Young Brothers proposes rate increasesranging from 14% to 38.7%, as follows: dry containers (including flatracks and platforms), 15%;refer containers, 18%; automobiles and roll-on/roll-off cargo, 14%; and G-vans, pallets, and mixedcargo, 38.7%. As part of its application, Young Brothers also proposes certain other changes toits tariff.
On July 25, 2011, the Consumer Advocate filed its testimonies, exhibits and workpaperson Young Brothers’ results of operations. On August 26, 2011, the Consumer Advocate filed itstestimonies, exhibits, and workpapers on Young Brothers’ cost of capital, revenue requirement,and rate design. On September 23, 2011, Young Brothers filed rebuttal testimonies and exhibits.
Pursuant to the parties’ request, the Commission will hold an evidentiary hearing limitedto certain issues in dispute on November 1. The Commission’s statutory deadline by which to filea final decision and order is December 16, 2011.

Public Utilities Commission Annual Report 2010-11State of Hawaii Page 60
VIII. ENFORCEMENT ACTIVITIES
The Commission enforces its rules and regulations, standards, and tariffs by monitoringthe operating practices and financial transactions of the regulated utilities and transportationcarriers. Enforcement activities involve customer complaint resolution, compliance with financialreporting and other requirements, and motor carrier citations. These enforcement activities arecritical in ensuring that customers of the regulated companies receive adequate and efficientservices.
A. COMPLAINT RESOLUTIONThe Commission’s role in protecting the public is carried out in part through its
investigation and resolution of complaints. The Commission collects and compiles utility andconsumer complaints to track trends and patterns in the utility and transportation industries. TheCommission accepts verbal and written complaints against any public utility, water carrier, motorcarrier, or others subject to the Commission’s jurisdiction. Verbal complaints are received bytelephone, or in person at the Commission’s office. There are two (2) kinds ofwritten complaints -- formal and informal.
The Commission’s rules of practice and procedure, Chapter 6-61, HAR, provide therequirements for formal and informal written complaints. Written formal complaints should: (1) bein writing; (2) comply with filing and other requirements set forth in Sections 6-61-15 to 6-61-21,HAR; (3) state the full name and address of each complainant and of each respondent; (4) setforth fully and clearly the specific act complained of; and (5) advise the respondent and theCommission completely of the facts constituting the grounds of the complaint, the injurycomplained of, and the exact relief desired. If the Commission accepts a formal complaint foradjudication, it assigns a docket number and sets the matter for an evidentiary hearing, ifnecessary.
Written informal complaints should: (1) state the name of the respondent, the date andapproximate time of the alleged act, and set forth fully and clearly the facts of the act complainedof; (2) advise the respondent and the Commission in what respects the provisions of the law orrules have been or are being violated or will be violated and should provide the facts claimed toconstitute the violation; and (3) specify the relief sought or desired. The Commission assigns atracking number to each written informal complaint filed with the Commission and also assignsthese complaints to certain Commission staff, who are tasked to, among other things, investigateand attempt to resolve the complaints through correspondence or conference rather than throughthe formal complaint process.
1. WRITTEN INFORMAL COMPLAINTS
As shown in the table below, the Commission received a total of 124 written informalcomplaints in the Fiscal Year against regulated and unregulated utility and transportationcompanies. Complaints on Oahu amounted to 76 out of 124 complaints statewide, or 61 per centof the total complaints.

Public Utilities Commission Annual Report 2010-11State of Hawaii Page 61
Total Informal Complaints 2008-09 2009-10 2010-11
Utilities
Telecommunications:
Wire line (telephone) 51 27 30
Cellular and Paging 28 36 32
Other 0 7 1
Total Telecom 79 70 63
Electricity 52 31 30
Gas 10 7 4
Water/Sewer 13 6 5
Other 0 0 5
Transportation Carriers
Water Carrier 1 1 0
Motor Carrier 18 22 17
Total Complaints 173 137 124
For all islands, the Commission received 63 written informal complaints involvingtelecommunications providers. The majority of telecommunications complaints (23) related toHawaiian Telcom and mainly involved billing disputes. The cellular and paging companiesreceived 32 complaints, mostly relating to billing problems (service contracts and charges).
The electric utilities received 30 complaints, mostly relating to billing problems(high consumption). The 4 complaints against gas utilities were related to gas leaks and highconsumption. The 5 complaints relating to water and sewer facilities dealt primarily with billing(high consumption) problems. Twelve of the 17 complaints against motor carriers were related tomoving companies. These complaints mainly involved excessive charges and damaged andmissing items.
2. INFORMAL COMPLAINT SURVEYIn an effort to improve the Commission’s service to consumers, a survey of informal
written complaints filed in the Fiscal Year with the Commission was initiated inFiscal Year 2003-04. A survey is sent to complainants whose informal complaint cases areclosed. The survey includes four (4) questions: (1) Do you feel that we responded to yourcomplaint in a reasonable amount of time?; (2) Did we provide you with a response that was clearand understandable?; (3) Was your complaint resolved to your satisfaction?; and (4) If you calledus and spoke with our staff, were they courteous and professional?
In the Fiscal Year, the Commission received 13 responses to its informal complaintsurvey. Figure 3 to 6 show the results of the survey.

Public Utilities Commission Annual Report 2010-11State of Hawaii Page 62
Figure 3
INFORMAL COMPLAINT SURVEY
Fiscal Year 2010-11
1-Do you feel w e responded to your complaint in a reasonable amount of time?
92%
8% 0%
Yes (12)
No (1)
No Response (0)
Figure 4
INFORMAL COMPLAINT SURVEY
Fiscal Year 2010-11
2-Did we provide you with a response that was clear and understandable?
92%
8% 0%
Yes (12)
No (1)
No Response (0)

Public Utilities Commission Annual Report 2010-11State of Hawaii Page 63
Figure 5
INFORMAL COMPLAINT SURVEY
Fiscal Year 2010-11
3-Was your complaint resolved to your satisfaction?
62%
38%
0%
Yes (8)
No (5)
No Response (0)
Figure 6
INFORMAL COMPLAINT SURVEY
Fiscal Year 2010-11
4-If you called us and spoke with our staff, were they courteous and
professional?
100%
0%
Yes (9)
No (0)

Public Utilities Commission Annual Report 2010-11State of Hawaii Page 64
B. MOTOR CARRIER CITATIONS
The Commission issues civil citations to motor carriers for violations of the Motor CarrierLaw, HRS Chapter 271. The citations impose a civil penalty, typically $500 or $1,000 perviolation. At the request of the Commission, the State Department of Transportation is authorizedto assign the department’s motor vehicle safety officer to assist the Commission in assessing civilpenalties.
The Commission has been successful in its efforts to enforce the law by issuing citationsto discourage illegal motor carrier activities on Oahu and the neighbor islands. Some of thecommon types of motor carrier citations relate to operating without a CPCN, the failure tomaintain the required liability insurance and improper vehicle marking. For this Fiscal Year, civilpenalties collected through motor carrier citations totaled $15,364.
The Commission enforcement officers issued 28 motor carrier citations on the followingislands: Oahu (15), Maui (7), and Hawaii (6).
Motor Carrier CitationsFY
2007FY
2008FY
2009FY
2010FY
2011
# of Citations Issued
Oahu 77 22 29 14 15
Maui, Molokai & Lanai 13 3 0 0 7
Kauai 6 0 0 0 0
Hawaii 10 5 1 2 6
Total # of Citations Issued 106 30 30 16 28
Total Civil PenaltiesCollected $52,900 $82,082 $22,000 $69,100 $15,364
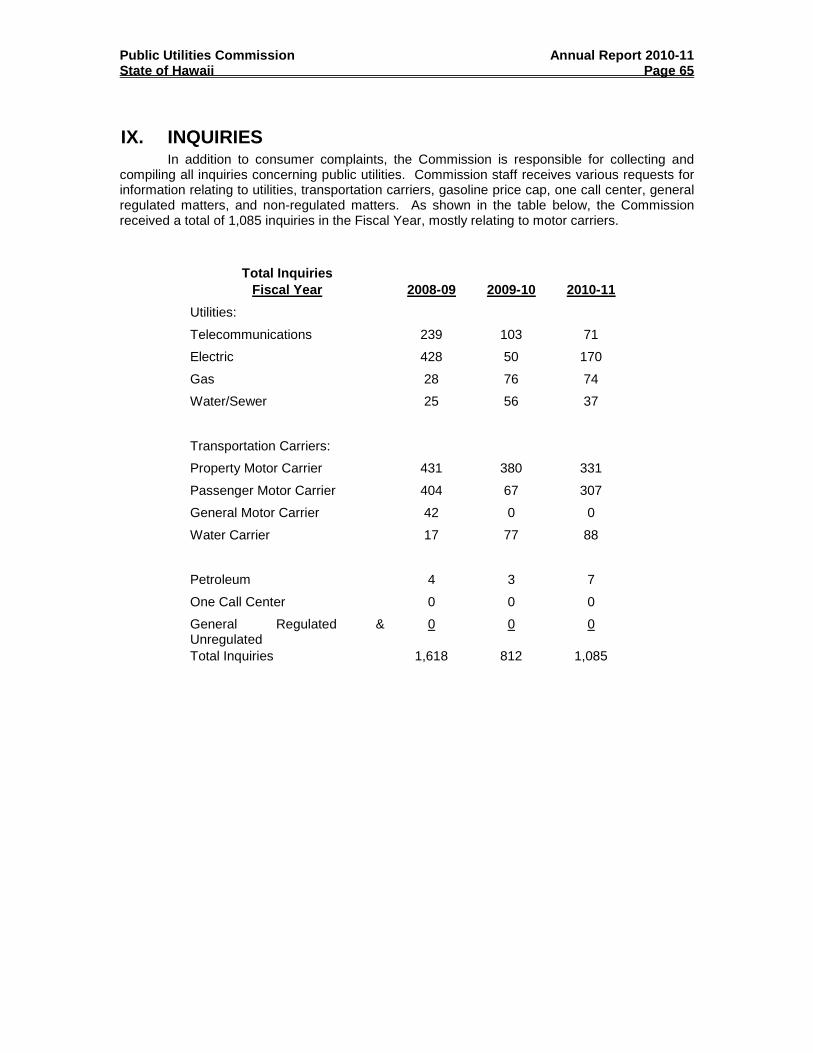
Public Utilities Commission Annual Report 2010-11State of Hawaii Page 65
IX. INQUIRIESIn addition to consumer complaints, the Commission is responsible for collecting and
compiling all inquiries concerning public utilities. Commission staff receives various requests forinformation relating to utilities, transportation carriers, gasoline price cap, one call center, generalregulated matters, and non-regulated matters. As shown in the table below, the Commissionreceived a total of 1,085 inquiries in the Fiscal Year, mostly relating to motor carriers.
Total Inquiries
Fiscal Year 2008-09 2009-10 2010-11
Utilities:
Telecommunications 239 103 71
Electric 428 50 170
Gas 28 76 74
Water/Sewer 25 56 37
Transportation Carriers:
Property Motor Carrier 431 380 331
Passenger Motor Carrier 404 67 307
General Motor Carrier 42 0 0
Water Carrier 17 77 88
Petroleum 4 3 7
One Call Center 0 0 0
General Regulated &Unregulated
0 0 0
Total Inquiries 1,618 812 1,085

Public Utilities Commission Annual Report 2010-11State of Hawaii Page 66
X. HAWAII ONE CALL CENTER
The 2004 Legislature passed Act 141, SLH 2004 (“Act 141”), which established a one callcenter to coordinate the location of subsurface installations and to provide advance notice tosubsurface installation operators of proposed excavation work. Pursuant to Act 141 (codified aschapter 269E, HRS), the Commission was required to establish a One Call Center advisorycommittee (“Committee”) to advise the Commission on the implementation of Act 141. Act 141required that the Commission establish and begin administration of the One Call Center byJanuary 1, 2006.
In November 2005, the Commission selected and contracted with One Call Concepts,Inc. (“One Call Concepts”) as the exclusive provider for the administration and operation of theHawaii One Call Center, commencing December 1, 2005 through June 30, 2009. One CallConcepts provides one call services for one call centers in Minnesota, Kansas, Louisiana,Missouri, Oregon and Washington and has been providing one call center services since itsformation in 1982. In January 2006, pursuant to HRS Chapter 269E, the Commission, throughOne Call Concepts, began operations of the One Call Center. On May 26, 2009,Governor Linda Lingle signed House Bill 1059 H.D.2 S.D.1 into law as Act 72 which changed thestatus of the State One Call Center program from a pilot program to a permanent program.Shortly thereafter, the Commission entered into a formal extension of the One Call Concepts,Inc., contract for operation of the One Call Center through June 30, 2011. On January 19, 2011,the Commission issued a Request for Proposal (RFP) to contract for the future operation of theHawaii One Call Center. On April 20, 2011, One Call Concepts was awarded as the exclusiveprovider for the administration and operation of the Hawaii One Call Center from July 1, 2011 toJune 30, 2014.
The Committee was established by the Commission under Chapter 269E, HRS to advisethe Commission in implementing the One Call Center. The Committee consists of 18 membersappointed by the Commission from various sectors of the utility industry and government. In theFY 2011, the Advisory Committee held six meetings to deliberate on a variety of issues regardingthe One Call Center. In November 2010 and May 2011, the One Call Concepts held trainingseminars on Oahu, Maui, Kauai and the Island of Hawaii. The training seminars educatedparticipants in the many facets of the One Call Center law including notification of excavation,marking of excavation sites, identification of subsurface installations by operator, excavationprocedures and more. There were approximately 200 participants who attended the trainingseminars.
The Commission and the Committee have been in the process of creating newadministrative rules to supplement Chapter 269E in establishing operating procedures for theHawaii One Call Center, the Commission, facility operators and excavators. A draft of theadministrative rules has been approved by the Committee, the Attorney General’s Office andmore recently, the Small Business Regulatory Review Board (SBRRB). After the SBRRB’sapproval of the draft of the administrative rules, the SBRRB has allowed the Commission tocommence a public hearings process for input and comments from interested parties on the draftrules. The Commission held public hearings on Maui, Kauai, Oahu and Hawaii Island.Comments from those hearings were reviewed by the Committee and the Commission. TheAttorney General’s Office is currently reviewing the draft and if approved, the draft will go theSBRRB and the Lieutenant Governor’s Office for final approval.

Public Utilities Commission Annual Report 2010-11State of Hawaii Page 67
Figure 7
Calls Made from Excavators to the Hawaii One Call Center
0100200300400500600700800
Jul-1
0
Aug-1
0
Sep-1
0
Oct-1
0
Nov-1
0
Dec-1
0
Jan-1
1
Feb-1
1
Mar-1
1
Apr-1
1
May-1
1
Jun-1
1
MONTHS
TO
TA
LS
Figure 8
Calls Made to Facility Operators By the Hawaii One Call Center
0
1000
2000
3000
4000
5000
Jul-
10
Aug-
10
Sep-
10
Oct-
10
Nov-
10
Dec-
10
Jan-
11
Feb-
11
Mar-
11
Apr-
11
May-
11
Jun-
11
MONTHS
TO
TA
LS
Figure 9
%OF EMERGENCY LOCATES
0.00
5.00
10.00
15.00
20.00
Jul-1
0
Aug-1
0
Sep-1
0
Oct-1
0
Nov-1
0
Dec-1
0
Jan-1
1
Feb-1
1
Mar-1
1
Apr-1
1
May-1
1
Jun-1
1
MONTHS
%ofto
tallo
cate
s

Public Utilities Commission Annual Report 2010-11State of Hawaii Page 68
XI. UTILITY COMPANY OPERATIONS, CAPITALIMPROVEMENTS, AND RATES
A. UTILITY COMPANY OPERATIONS
1. CUSTOMERS SERVED BY UTILITY COMPANIESThe number of customers served by electric and gas utility customers have been fairly
stable, with a slight general increase for the electric utility customer numbers during the2006 - 2010 time period, as shown in Figure 10.
5
Figure 10Number of Electric and Gas Utility Customers
2006 - 2010
5Sources: HECO 2010 Service Reliability Report, MECO 2010 Service Reliability Report,
HELCO 2010 Service Reliability Report, KIUC 2010 Service Reliability Report, and TGC 2010Annual Reports to the PUC.

Public Utilities Commission Annual Report 2010-11State of Hawaii Page 69
As shown in Figure 11, Hawaiian Telcom’s customer base, as measured by the numberof access lines that it serves, after peaking at 743,370 in 2000, has decreased over the pastfive (5) years.
6This decrease is believed to be due primarily to loss of business customers to
competitors and increased competition from wireless telecommunications carriers and cablemodem service (which does not require telephone lines for dial-up internet access).
Figure 11
Hawaiian Telcom Total Switched Access Lines
2006-2010
0
100,000
200,000
300,000
400,000
500,000
600,000
700,000
Years
Nu
mb
er
of
Ac
ce
ss
Lin
es
Total Switched Access Lines 585,434 543,230 470,000 441,000
2006 2007 2008 2009 2010
*Note: Due to the Protective Order in Hawaiian Telcom, Inc.’s Chapter 11 Bankruptcyproceeding, the 2008 switched access lines count is not disclosed.
6Hawaiian Telcom’s ARMIS Operating Data Reports (FCC Report 43-09) for 2006
through 2010.

Public Utilities Commission Annual Report 2010-11State of Hawaii Page 70
2. RATES OF RETURN EARNED BY UTILITY COMPANIESEach regulated utility is entitled to an opportunity to earn a fair rate of return. Figure 12
summarizes the recent history and trends of rates of return earned by the various regulatedutilities.
Figure 12
Util ity Rate of Return Five Year Comparison
0.00%
2.00%
4.00%
6.00%
8.00%
10.00%
12 MTD Ended June 30
Rate
of
Re
turn
Hawaii Electric Light Company,
Inc_
4.77% 7.98% 4.87% 6.52% 7.55%
Hawaiian Electric Company,Inc_
5.08% 6.60% 5.61% 6.98% 5.02%
Maui Electric Company, Ltd_ 6.59% 7.01% 5.21% 4.81% 6.52%
The Gas Company, LLC 7.20% 4.80% 4.50% 7.40% 9.20%
Jun '07 Jun '08 Jun '09 Jun '10 Jun '11

Public Utilities Commission Annual Report 2010-11State of Hawaii Page 71
As shown in Figures 13 to 15 for the most part, the utilities have not been earning their authorizedrates of return over the past five (5) years. As KIUC converted to times interest earned ratio(“TIER”) in 2002, Figure 16 shows KIUC’s TIER for the past five (5) years.
Figure 13
Five Year Rate of Return Comparison - Hawaiian Electric Company
0.00%
1.00%
2.00%
3.00%
4.00%
5.00%
6.00%
7.00%
8.00%
9.00%
10.00%
12 MTD Ended June 30
Rate
ofR
etu
rn
Authorized Rate of Return 8.66% 8.62% 8.62% 8.45% 8.16%
Ratemaking Rate of Return 5.08% 6.60% 5.61% 6.98% 5.02%
Jun '07 Jun '08 Jun '09 Jun '10 Jun '11
Figure 14
Five Year Rate of Return Comparison - Hawaii Electric Light Company, Inc.
0.00%
1.00%
2.00%
3.00%
4.00%
5.00%
6.00%
7.00%
8.00%
9.00%
10.00%
12 MTD Ended June 30
Rat
eof
Re
turn
Authorized Rate of Return 8.33% 8.33% 8.33% 8.33% 8.59%
Ratemaking Rate of Return 4.77% 7.98% 4.87% 6.52% 7.55%
Jun '07 Jun '08 Jun '09 Jun '10 Jun '11

Public Utilities Commission Annual Report 2010-11State of Hawaii Page 72
Figure 15
Five Year Rate of Return Comparison - Maui Electric Company, Ltd.
0.00%
1.00%
2.00%
3.00%
4.00%
5.00%
6.00%
7.00%
8.00%
9.00%
10.00%
12 MTD Ended June 30
Rat
eo
fR
etu
rn
Authorized Rate of Return 8.83% 8.67% 8.67% 8.67% 8.43%
Ratemaking Rate of Return 6.59% 7.01% 5.21% 4.81% 6.52%
Jun '07 Jun '08 Jun '09 Jun '10 Jun '11
Figure 16
Five Year TIER Comparison - KIUC
0.00%
50.00%
100.00%
150.00%
200.00%
250.00%
300.00%
12 MTD Ended June 30
TIE
R
Authorized TIER 2.27
TIER 1.88 2.52 1.20 1.92 2.46
Jun '07 Jun '08 Jun '09 Jun '10 Jun '11

Public Utilities Commission Annual Report 2010-11State of Hawaii Page 73
Figure 17
Five Year Rate of Return Comparison - The Gas Company, LLC
0.00%
1.00%
2.00%
3.00%
4.00%
5.00%
6.00%
7.00%
8.00%
9.00%
10.00%
12 MTD Ended June 30
Ra
teo
fR
etu
rn
Authorized Rate of Return 9.16% 9.16% 9.16% 8.00% 8.00%
Ratemak ing Rate of Return 7.20% 4.80% 4.50% 7.40% 9.20%
Jun '07 Jun '08 Jun '09 Jun '10 Jun '11

Public Utilities Commission Annual Report 2010-11State of Hawaii Page 74
B. FORECASTED CAPITAL IMPROVEMENTS
1. ELECTRIC UTILITY CIPsThe total 2011 capital expenditure budget forecasted for HECO is approximately
$194 million. The Capital Improvement Projects (“CIPs”) in HECO’s 2011 budget exceeding onemillion dollars include twenty-four Energy Delivery projects, two Clean Energy projects, andthirteen Power Supply projects.
The total 2011 capital expenditure budget forecasted for HELCO is approximately$57 million. HELCO’s more than one million dollars CIPs for 2011 include thirteen EnergyDelivery projects, two Clean Energy projects, and two Power Supply projects and one projectunder “Other” category.
The total 2011 capital expenditure budget forecasted for MECO is approximately$49 million. The CIPs more than one million dollars in MECO’s 2011 budget include ten EnergyDelivery projects, three Power Supply projects, and one project under “Other” category.
The total 2011 capital expenditure budget forecasted for KIUC is approximately$37 million. KIUC’s CIP with budget of one million dollars or above for 2011 include eightprojects.
Figure 18 shows the five (5)-year capital expenditure budget forecast for HECO, HELCO,MECO, and KIUC.
Figure 18Electric Utilities Five-Year Capital Expenditures Forecast

Public Utilities Commission Annual Report 2010-11State of Hawaii Page 75
2. GAS CIPsThe total 2011 capital expenditure budget forecasted for TGC is approximately
$8.6 million. The projects in the TGC 2011 budget higher than one million dollars include utilitymain pipeline renewal, Upgrade 10” trans to 16” at Kapolei, and BIO Oil Refinery on Oahu.
Figure 19 shows the five (5)-year capital expenditure budget forecast for TGC.
Figure 19TGC Five-Year Capital Expenditures Forecast
3. FORECASTED UTILITY CIP EXPENDITURES
Figure 20 shows the total five (5)-year capital expenditures forecast for the electric andgas utilities.
Figure 20Capital Expenditures – Forecasted

Public Utilities Commission Annual Report 2010-11State of Hawaii Page 76 (Corrected 2/23/2012)
C. RATES OF MAJOR UTILITY COMPANIES
1. ELECTRICITY RATES
In Figures 21 to 26, the electricity rates consist of the base energy rate plus the energyrate adjustment clause (“ERAC”) and other adjustments.
7The total of the base energy rate and
the ERAC is referred to herein as the “Effective Energy Rate.”
Figure 21 (Corrected 2/23/12)
Note: Corrected calculation to reflect tiered non-fuel energy charge, and to includecustomer charge in kWh rate.
7ERAC (aka fuel adjustment clause) means a provision of a rate schedule approved by
the Commission, which provides for increases or decreases, or both, without prior hearing, inrates reflecting changes in costs incurred by an electric or gas utility for fuel or purchased energydue to changes in the unit cost of fuel and purchased energy. See Chapter 6-60, HAR.
HECO Five Year Comparison of Residential Base Rates, ERAC, and Other
Adjustments (Based on 600 kWh)
-$0.050000
$0.000000
$0.050000
$0.100000
$0.150000
$0.200000
$0.250000
$0.300000
$0.350000
Year
$/k
Wh
Other Adjustments $0.012399 $0.023277 $0.024682 $0.029209 $0.034210
ERAC $0.061420 $0.085360 -$0.010250 $0.045050 $0.107770
Base Rates $0.112954 $0.171896 $0.171896 $0.171896 $0.183834 See Note
Total $0.186773 $0.280533 $0.186328 $0.246155 $0.325814 See Note
Jun '07 Jun '08 Jun '09 Jun '10 Jun '11

Public Utilities Commission Annual Report 2010-11State of Hawaii Page 77 (Corrected 2/23/2012)
Figure 22 (Corrected 2/23/2012)
HELCO Five Year Comparison of Residential Base Rates, ERAC, and
Other Adjustments (Based on 600 kWh)
$0.000000
$0.050000
$0.100000
$0.150000
$0.200000
$0.250000
$0.300000
$0.350000
$0.400000
$0.450000
$0.500000
Year
$/k
Wh
Other Adjustments $0.023022 $0.025006 $0.033998 $0.025428 $0.012336 See Note
ERAC $0.093950 $0.178710 $0.066700 $0.114970 $0.106350
Base Rates $0.191370 $0.191370 $0.191370 $0.191370 $0.318034 See Note
Total $0.308342 $0.395086 $0.292068 $0.331768 $0.436720 See Note
Jun '07 Jun '08 Jun '09 Jun '10 Jun '11
Figure 23 (Corrected 2/23/2012)
Note: Corrected calculation to reflect tiered non-fuel energy charge, and to includecustomer charge in kWh rate.
MECO - Maui Division Five Year Comparison of Residential Base Rates,
ERAC, and Other Adjustments (Based on 600 kWh)
$0.000000$0.050000$0.100000$0.150000$0.200000$0.250000$0.300000$0.350000$0.400000$0.450000
Year
$/k
Wh
Other Adjustments $0.005237 $0.015796 $0.019317 $0.014491 $0.013070 See Note
ERAC $0.127920 $0.224320 $0.077850 $0.139920 $0.081760
Base Rates $0.134231 $0.134231 $0.134231 $0.134231 $0.294203 See Note
Total $0.267388 $0.374347 $0.231398 $0.288642 $0.389033 See Note
Jun '07 Jun '08 Jun '09 Jun '10 Jun '11

Public Utilities Commission Annual Report 2010-11State of Hawaii Page 78 (Corrected 2/23/2012)
Figure 24 (Corrected 2/23/2012)
Figure 25 (Corrected 2/23/2012)
Note: Corrected calculation to reflect tiered non-fuel energy charge, and to includecustomer charge in kWh rate.
MECO - Lanai Division Five Year Comparision of Residential Base Rates,
ERAC, and Other Adjustments (Based on 600 kWh)
$0.000000$0.050000$0.100000$0.150000$0.200000$0.250000$0.300000$0.350000$0.400000$0.450000$0.500000
Year
$/k
Wh
Other Adjustments $0.005429 $0.017420 $0.014611 $0.016014 $0.015131 See Note
ERAC $0.127060 $0.228800 $0.094800 $0.173740 $0.096490
Base Rates $0.180648 $0.180648 $0.180648 $0.180648 $0.342816 See Note
Total $0.313137 $0.426868 $0.290059 $0.370402 $0.454437 See Note
Jun '07 Jun '08 Jun '09 Jun '10 Jun' 11
MECO - Molokai Division Five Year Comparision of Residential Base Rates,
ERAC,
and Other Adjustments (Based on 600 kWh)
$0.000000$0.050000$0.100000$0.150000$0.200000$0.250000$0.300000$0.350000$0.400000$0.450000$0.500000
Year
$/k
Wh
Other Adjustments $0.005330 $0.018015 $0.015250 $0.016653 $0.014421 See Note
ERAC $0.134330 $0.223920 $0.089430 $0.157610 $0.088330
Base Rates $0.174383 $0.174383 $0.174383 $0.174383 $0.356162 See Note
Total $0.314043 $0.416318 $0.279063 $0.348646 $0.458913 See Note
Jun '07 Jun '08 Jun '09 Jun '10 Jun' 11

Public Utilities Commission Annual Report 2010-11State of Hawaii Page 79 (Corrected 2/23/2012)
Figure 26 (Corrected 2/23/2012)
Figure 26 (Corrected 2/23/2012)
Figure 27 compares Effective Energy Rates (combined base rate and ERAC) for residentialelectricity customers across the State.
Figure 27 (Corrected 2/23/2012)
Note: Corrected calculation to reflect tiered non-fuel energy charge (except KIUC), and toinclude customer charge in kWh rate.
Note: Corrected calculation to reflect tiered non-fuel energy charge (except (KIUC), and toinclude customer charge in kWH rate.
KIUC Five Year Comparision of Residential Base Rate, ERAC, and Other
Adjustments (Based on 600 kWh)
-$0.050000$0.000000$0.050000$0.100000$0.150000$0.200000$0.250000$0.300000$0.350000$0.400000$0.450000$0.500000
Year
$/k
Wh
Other Adjustments $0.000303 $0.001050 $0.000264 ($0.000324) $0.000302
ERAC $0.143260 $0.263448 $0.078136 $0.006244 $0.092732
Base Rates $0.174890 $0.174890 $0.174890 $0.347430 $0.365063 See Note
Total $0.318453 $0.439388 $0.253290 $0.353350 $0.458097 See Note
Jun '07 Jun '08 Jun '09 Jun '10 Jun '11
Five Year Comparison of Residential Energy Rates, Based on 600 kWh (combined base rate,
ERAC and other adjustments)
$0.000000
$0.100000
$0.200000
$0.300000
$0.400000
$0.500000
Year
$/k
Wh
Hawaii Electric Light Company, Inc. $0.308342 $0.395086 $0.292068 $0.331768 $0.436720 See Note
Hawaiian Electric Company, Inc. $0.186773 $0.280533 $0.186328 $0.246155 $0.325814 See Note
Kauai Island Utility Cooperative $0.318453 $0.439388 $0.253290 $0.353350 $0.458097 See Note
MECO - Lanai Division $0.313137 $0.426868 $0.290059 $0.370402 $0.454437 See Note
MECO - Maui Division $0.267388 $0.374347 $0.231398 $0.288642 $0.389033 See Note
MECO - Molokai Division $0.314043 $0.416318 $0.279063 $0.348646 $0.458913 See Note
Jun '07 Jun '08 Jun '09 Jun '10 Jun '11
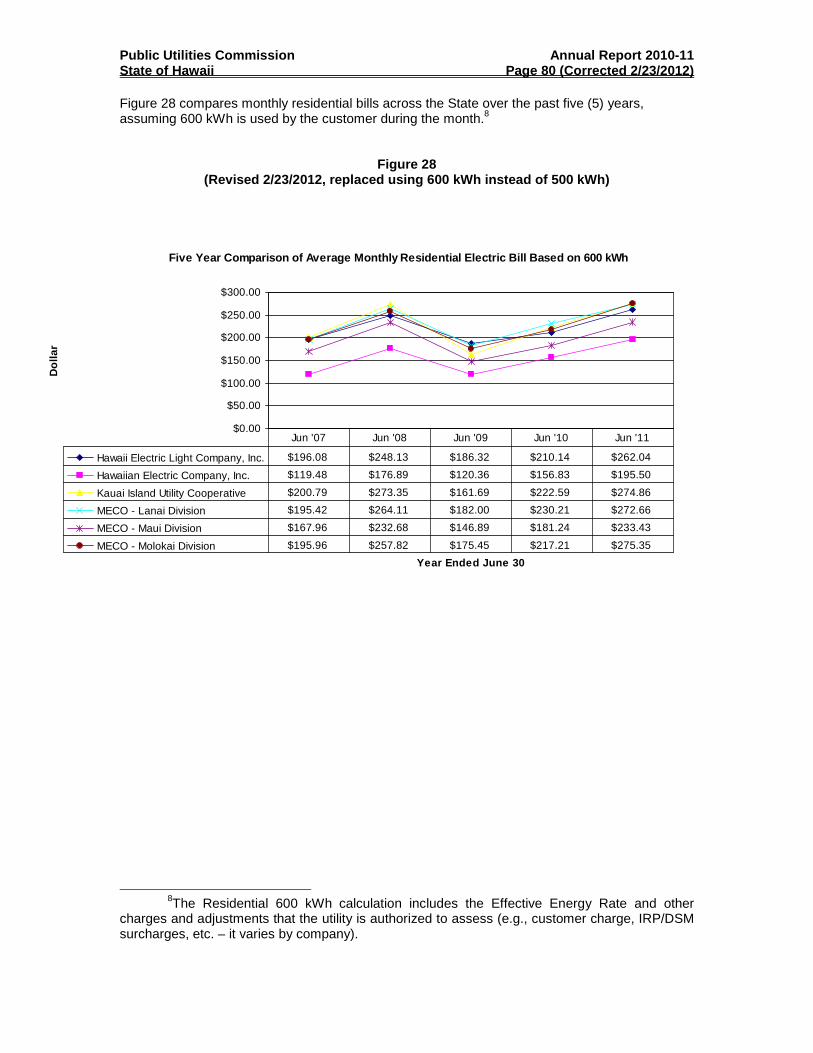
Public Utilities Commission Annual Report 2010-11State of Hawaii Page 80 (Corrected 2/23/2012)
Figure 28 compares monthly residential bills across the State over the past five (5) years,assuming 600 kWh is used by the customer during the month.
8
Figure 28(Revised 2/23/2012, replaced using 600 kWh instead of 500 kWh)
8The Residential 600 kWh calculation includes the Effective Energy Rate and other
charges and adjustments that the utility is authorized to assess (e.g., customer charge, IRP/DSMsurcharges, etc. – it varies by company).
Five Year Comparison of Average Monthly Residential Electric Bill Based on 600 kWh
$0.00
$50.00
$100.00
$150.00
$200.00
$250.00
$300.00
Year Ended June 30
Do
lla
r
Hawaii Electric Light Company, Inc. $196.08 $248.13 $186.32 $210.14 $262.04
Hawaiian Electric Company, Inc. $119.48 $176.89 $120.36 $156.83 $195.50
Kauai Island Utility Cooperative $200.79 $273.35 $161.69 $222.59 $274.86
MECO - Lanai Division $195.42 $264.11 $182.00 $230.21 $272.66
MECO - Maui Division $167.96 $232.68 $146.89 $181.24 $233.43
MECO - Molokai Division $195.96 $257.82 $175.45 $217.21 $275.35
Jun '07 Jun '08 Jun '09 Jun '10 Jun '11

Public Utilities Commission Annual Report 2010-11State of Hawaii Page 81
2. ELECTRICITY RATES AND OIL PRICESThe utilities purchase their fuel under a contract and have a certain amount of inventory
to protect against any temporary delivery disruptions. HECO generally maintains an averagesystem fuel inventory level equivalent to 47 days of forward consumption. HELCO and MECOgenerally maintain an average system fuel inventory level equivalent to approximately onemonth’s supply of both MSFO and diesel. The ECAC is based on the cost paid for the fuel usedto generate electricity during the billing period, so when prices decrease (or increase) there isabout a two month lag before the change is reflected in the ECAC.
Electricity rates also vary depending on the category of customer, such as residential,business (small, medium, and large power users), and commercial as well. For illustrativepurposes, the following data and information will summarize residential electricity rates andfluctuations in the price of oil since January 2007.
The following chart shows monthly residential effective rates ($/kilowatt hour) at 600 kWhusage, which vary primarily based on the ECAC changes, for its customers on Oahu, Hawaii(Big Island), Maui, Lanai, Molokai and Kauai. As you can see from this chart, effective electricityrates increased greatly from mid-2007 to mid-2008, and decreased significantly thereafter.
Figure 29Effective Rates at 600 kWh

Public Utilities Commission Annual Report 2010-11State of Hawaii Page 82
The following chart is a simple graph of crude oil prices during the same time period,which shows similar increases and decreases.
Figure 30Oil Prices (WTI)

Public Utilities Commission Annual Report 2010-11State of Hawaii Page 83
The next chart combines the preceding two charts and shows percentage changes fromJanuary 2007.
Figure 31Effective Rates at 600 kWh and Oil Price Changes
since January 1, 2007
As you can see from this chart, the effective rates for electricity generally correspond withchanges in crude oil prices, but there is an approximate 60-day lag due to the use of existinginventories after oil prices may change. Thus, after crude oil prices began declining afterJuly 2008, the effective rates did not start declining until October 2008, and effective rates beganto increase again after crude oil prices increased in 2009.
We hope the foregoing has been helpful. We will continue to monitor changes in theprice of oil and its effect on electricity rates. However, the data also confirms and illustrates howdependent Hawaii is on world crude oil prices. Although oil prices have retreated from their 2008summer highs, we will continue to be vulnerable to increases in oil prices until oil-fired electricitygeneration is substantially replaced with alternative resources.

Public Utilities Commission Annual Report 2010-11State of Hawaii Page 84
3. TELECOMMUNICATION RATES
Effective July 15, 2009, Act 180 Session Laws of Hawaii 2009 designated local exchangeintrastate telephone services as fully competitive. According to Act 180, “the public utilitiescommission shall treat the State's local exchange intrastate services, under the commission'sclassification of services relating to costs, rates, and pricing, as fully competitive and apply allcommission rules in accordance with that designation.” Under the Act, rates for telephoneservices do not require commission approval and are filed with the commission for informationalpurposes as long as the rates are not more than the currently effective tariff.
Hawaiian Telcom’s basic rates have remained unchanged over the past several years.the current rates have been in effect since 1995. However, since 1997, with the approval of theCommission, Hawaiian Telcom has assessed an 11.23 percent surcharge on most intrastateservices, including basic services. The following table shows residential individual line telephoneservice by island that customers have been paying since 1997 for residential service.
Island
Residential Ratew/ 11.23%Surcharge
ResidentialRate inTariff
Oahu $16.02 $14.40
Hawaii $14.57 $13.10
Maui $13.90 $12.50
Kauai $13.90 $12.50
Molokai $12.07 $10.85
Lanai $11.01 $9.90

Public Utilities Commission Annual Report 2010-11State of Hawaii Page 85
XII. UTILITY COMPANY PERFORMANCE
A. ELECTRIC UTILITIES EFFICIENCY AND SERVICE QUALITY
The following electric utility service quality report was based on or excerpted directly fromthe 2009 Service Reliability Report submitted to the Commission by HECO, MECO, HELCO, andKIUC. The report covers the 2010 calendar year (“2010”). A complete copy is available forreview at the Commission’s office or the Commission’s website(http://puc.hawaii.gov/industries/Energy/reports).
The reliability indices are calculated using the data from all sustained9
system outagesexcept customer maintenance outages. If data normalization is required, it is done using theguidelines specified in the report on reliability that was prepared for the Public UtilitiesCommission, titled "Methodology for Determining Reliability Indices for HECO Utilities," datedDecember 1990. That report indicates that normalization is allowed for "abnormal" situationssuch as hurricanes, tsunamis, earthquakes, floods, catastrophic equipment failures, and singleoutages that cascade into a loss of load greater than 10% of the system peak load. Thesenormalizations are made in calculating the reliability indices because good engineering designtakes into account safety, reliability, utility industry standards, and economics, and cannot alwaysplan for catastrophic events.
Indices measure reliability in terms of the overall availability of electrical service (ASA),the frequency or number of times a company customers experience an outage during the year(SAIF), the average length of time an interrupted customer is out of power (CAID), and theaverage length of time the company's customers are out of power during the year (SAID). SAIDis an indication of overall system reliability because it is the product of SAIF and CAID andincorporates the impact of frequency and duration of outages on the company's total customerbase.
To determine the relative level of reliability, the statistics for four prior years,2006 through 2010, are used for comparison.
1. HECO SERVICE QUALITY – NORMALIZED RESULTS
This is the 2010 annual service reliability report of the Hawaiian Electric Company(HECO). The average number of electric customers increased from 294,802 in 2009 to 295,637in 2010 (a 0.28% increase). The 2010 peak demand for the system was 1,200 MW (eveningpeak) this is 60 MW lower than the peak in 2009; however, the highest system peak demandremains at 1,327 MW set on the evening of October 12, 2004.
Annual Service Reliability Indices
The annual service reliability for 2010 was the second best in the past 5 years in termsSystem Average Interruption Frequency Index (SAIFI). The reliability results for 2010 and fourprior years are shown Table below: Annual Service Reliability Indices – All Events, and Table:Annual Service Reliability Indices – with Normalizations. No outage events were normalized in2010. All subsequent comparisons and discussion are based on the normalized data.
9An interruption of electrical service of 1 minute or longer.

Public Utilities Commission Annual Report 2010-11State of Hawaii Page 86
Table of Annual Service Reliability Indices – All Events
2006* 2007** 2008*** 2009 2010
Number of Customers 292,554 293,893 294,371 294,802 295,637
Customer Interruptions 724,280 639,886 729,784 333,908 361,334
Customer-Hours Interrupted 4,260,045 1,970,925 3,985,756 442,546 564,424
SAID (Minutes) 873.69 402.38 812.39 90.08 114.55
SAIF (Occurrences) 2.476 2.177 2.479 1.133 1.222
CAID (Minutes) 352.91 184.81 327.69 79.52 93.72
ASA (Percent) 99.834 99.923 99.846 99.983 99.978
Table of Annual Service Reliability Indices – with Normalization2006* 2007** 2008*** 2009 2010
Number of Customers 292,554 293,892 294,371 294,802 295,637
Customer Interruptions 420,749 367,837 382,124 333,908 361,334
Customer-Hours Interrupted 666,188 488,144 490,842 442,546 564,424
SAID (Minutes) 136.63 99.66 100.05 90.08 114.55
SAIF (Occurrences) 1.438 1.252 1.298 1.133 1.222
CAID (Minutes) 95.00 79.62 77.07 79.52 93.72
ASA (Percent) 99.974 99.981 99.981 99.983 99.978
NOTE: 2006* Data normalized to exclude the 6/01/06 Load Shedding OutageData normalized to exclude the 10/15/06 Earthquake Outage2007** Data normalized to exclude the 1/29/07 and 02/02/07 High Wind OutagesData normalized to exclude the 11/04/07 - 11/05/07 and 12/04/07 - 12/06/07 Storms2008*** Data normalized to exclude the 12/10/08 - 12/14/08 High Wind OutagesData normalized to exclude the 12/26/08 Island Wide Blackout
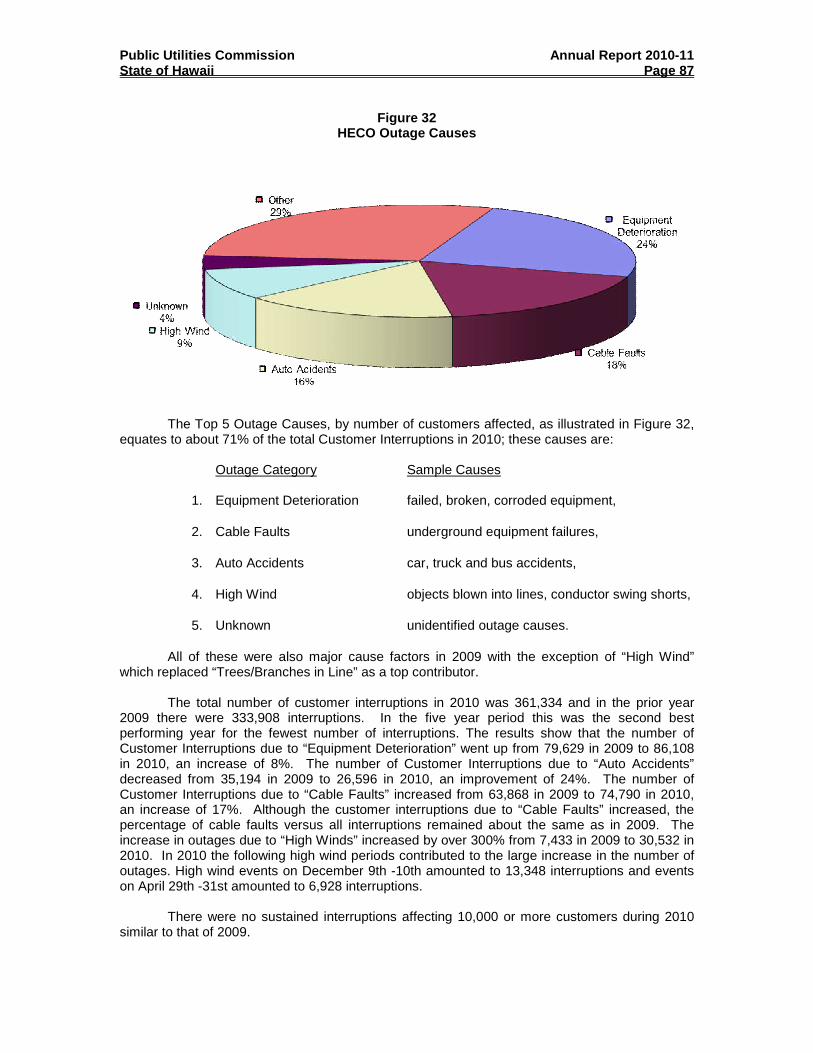
Public Utilities Commission Annual Report 2010-11State of Hawaii Page 87
Figure 32HECO Outage Causes
The Top 5 Outage Causes, by number of customers affected, as illustrated in Figure 32,equates to about 71% of the total Customer Interruptions in 2010; these causes are:
Outage Category Sample Causes
1. Equipment Deterioration failed, broken, corroded equipment,
2. Cable Faults underground equipment failures,
3. Auto Accidents car, truck and bus accidents,
4. High Wind objects blown into lines, conductor swing shorts,
5. Unknown unidentified outage causes.
All of these were also major cause factors in 2009 with the exception of “High Wind”which replaced “Trees/Branches in Line” as a top contributor.
The total number of customer interruptions in 2010 was 361,334 and in the prior year2009 there were 333,908 interruptions. In the five year period this was the second bestperforming year for the fewest number of interruptions. The results show that the number ofCustomer Interruptions due to “Equipment Deterioration” went up from 79,629 in 2009 to 86,108in 2010, an increase of 8%. The number of Customer Interruptions due to “Auto Accidents”decreased from 35,194 in 2009 to 26,596 in 2010, an improvement of 24%. The number ofCustomer Interruptions due to “Cable Faults” increased from 63,868 in 2009 to 74,790 in 2010,an increase of 17%. Although the customer interruptions due to “Cable Faults” increased, thepercentage of cable faults versus all interruptions remained about the same as in 2009. Theincrease in outages due to “High Winds” increased by over 300% from 7,433 in 2009 to 30,532 in2010. In 2010 the following high wind periods contributed to the large increase in the number ofoutages. High wind events on December 9th -10th amounted to 13,348 interruptions and eventson April 29th -31st amounted to 6,928 interruptions.
There were no sustained interruptions affecting 10,000 or more customers during 2010similar to that of 2009.

Public Utilities Commission Annual Report 2010-11State of Hawaii Page 88
The outages and transformer fire that occurred during the heavy rains on December 19thand 20th affecting Ala Moana Shopping Center, nearby businesses and customers gained muchmedia attention. The effect, however, on the reliability statistics for 2010 was relativelyinsignificant. The outages, in all, impacted about 2000 customers, or 0.6% of the customerinterruptions for 2010. The impact to the CAIDI, SAIDI and SAIFI was 13 seconds, 35.4 secondsand 0.003, respectively.
Figure 33HECO System Average Interruption Duration Index (SAIDI)
(Lower is better)
Figure 33 shows the System Average Interruption Duration (SAIDI) indices for the pastfive years. It shows that the 2010 SAIDI is 114.55 minutes, a 27% increase as compared to the2009 SAIDI results. The SAIDI is the composite of both the SAIFI and CAIDI indices andproduces a broader benchmark of system reliability by combining both the duration and thenumber of customer interruptions during a given period of time. The increase of the SAIDI resultwas due to the increase in both the CAIDI and SAIDI statistics.

Public Utilities Commission Annual Report 2010-11State of Hawaii Page 89
Figure 34HECO System Average Interruption Frequency (SAIFI)
(Lower is better)
Figure 34 shows the System Average Interruption Frequency Index (SAIFI) for the pastfive years. It shows that the 2010 SAIFI of 1.222 was the second lowest index in the pastfive years, increasing from the 30 year low of 1.133 in 2009.
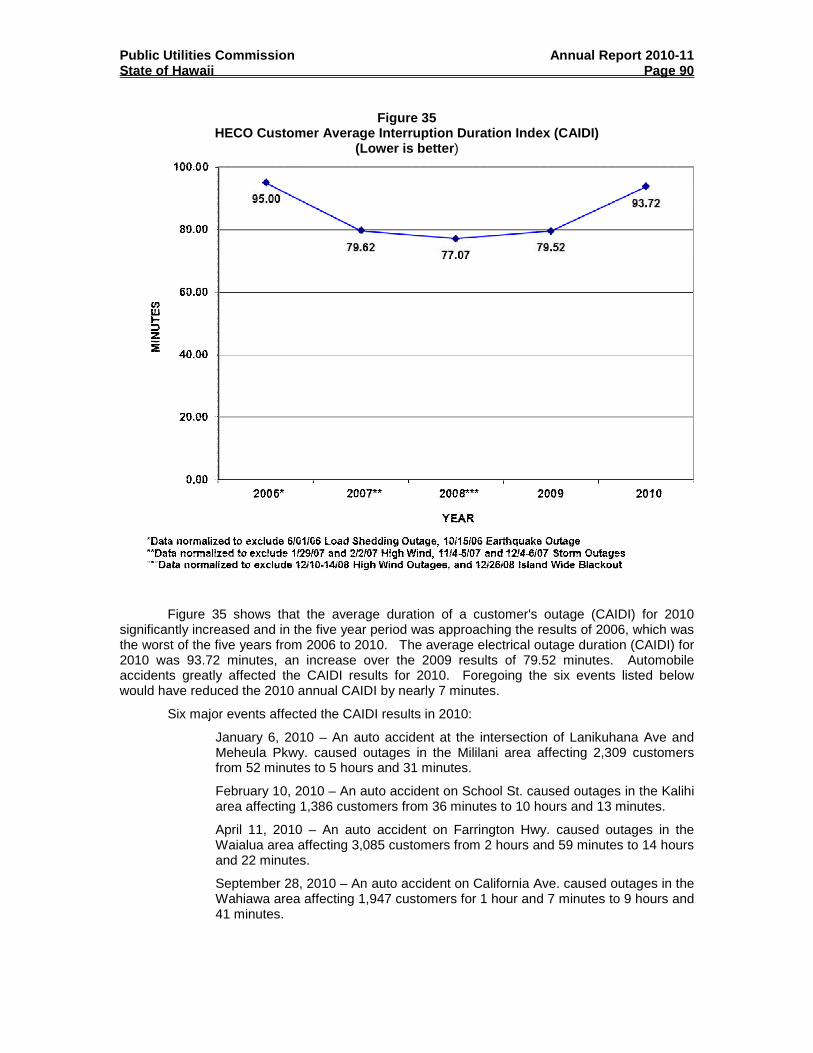
Public Utilities Commission Annual Report 2010-11State of Hawaii Page 90
Figure 35HECO Customer Average Interruption Duration Index (CAIDI)
(Lower is better)
Figure 35 shows that the average duration of a customer's outage (CAIDI) for 2010significantly increased and in the five year period was approaching the results of 2006, which wasthe worst of the five years from 2006 to 2010. The average electrical outage duration (CAIDI) for2010 was 93.72 minutes, an increase over the 2009 results of 79.52 minutes. Automobileaccidents greatly affected the CAIDI results for 2010. Foregoing the six events listed belowwould have reduced the 2010 annual CAIDI by nearly 7 minutes.
Six major events affected the CAIDI results in 2010:
January 6, 2010 – An auto accident at the intersection of Lanikuhana Ave andMeheula Pkwy. caused outages in the Mililani area affecting 2,309 customersfrom 52 minutes to 5 hours and 31 minutes.
February 10, 2010 – An auto accident on School St. caused outages in the Kalihiarea affecting 1,386 customers from 36 minutes to 10 hours and 13 minutes.
April 11, 2010 – An auto accident on Farrington Hwy. caused outages in theWaialua area affecting 3,085 customers from 2 hours and 59 minutes to 14 hoursand 22 minutes.
September 28, 2010 – An auto accident on California Ave. caused outages in theWahiawa area affecting 1,947 customers for 1 hour and 7 minutes to 9 hours and41 minutes.

Public Utilities Commission Annual Report 2010-11State of Hawaii Page 91
October 17, 2010 – An auto accident on Kukuna Rd. caused outages in theHauula area affecting 1,342 customers for 1 hour and 30 minutes to 22 hoursand 1 minute.
November 28, 2010 – An auto accident at Hele St caused outages in the Kailua areaaffecting about 1,912 customers from 1 hour and 23 minutes to 12 hours and 40 minutes.
Outages caused by automobile accidents generally incur damage to poles or equipmentthat require replacement before power can be restored to customers. In some cases the accidentscene can be isolated; restoring most customers, however there will often be a few customerswho experience extended outage durations. Nonetheless, automobile accidents, because of thedamage that is inflicted on the system, generally result in lengthy outage times for customers.
Figure 36HECO Average Service Availability (ASA)
(Higher is better)
Figure 36 shows that the 2010 ASAI index decreased when compared to the 2009 resultsafter a period of growth (higher is better) from 2006 to 2009. Approximately 27,343 morecustomers experienced sustained service interruptions during 2010 compared to the previousyear, an increase of 8.2% that caused the ASAI to decrease from 99.983% to 99.978%.

Public Utilities Commission Annual Report 2010-11State of Hawaii Page 92
2. MECO SERVICE QUALITY – NORMALIZED RESULTS
The following MECO electric utility service quality discussion is based on or excerpteddirectly from the MECO Annual Service Reliability Report 2010 submitted to the Commission byMECO. The report covers the 2010 calendar year. A complete copy is available for review at theCommission’s office.
The average number of electric customers increased from 67,126 in 2009 to 67,405 in2010 (an increase of 0.42%). The peak 2010 demand for the system was 203.8 MW (gross) thatoccurred on December 28, 2010. The peak 2010 demand was lower than the 2009 peak demandof 204.3 MW (gross) on October 21, 2009 (a decrease of -0.24%).
This analysis of the system reliability for MECO is for the year 2010. To determine therelative level of reliability, the statistics for five prior years, 2005 through 2009, are used forcomparison.
The reliability indices are calculated using the data from all sustained system outages,except customer maintenance outages. The data used for the 2005 reliability indices was notnormalized due to the lack of system events that would qualify certain data to be normalized. Thedata used for calculating the reliability indices for 2006, 2007, 2008 and 2009 was normalized.
There were 764 outages in 2006. The data used for the 2006 reliability indices for MECOwas normalized to exclude the following event:
October 15 - Earthquake
There were 693 outages in 2007. The data used for the 2007 reliabilityindices for MECO was normalized to exclude the following events:
January 29 – Kona Storm
December 5 - Kona Storm
There were 707 outages in 2008. The data used for the 2008 reliability indices for MECOwas normalized to exclude the following events:
Storms on Maui, Molokai and Lanai Various equipment failures and faults
There were 880 outages in 2009. The data used for the 2009 reliability indices for MECOwas normalized to exclude the following events:
January 16 – High Winds June 19 – High Winds Various equipment failures and faults

Public Utilities Commission Annual Report 2010-11State of Hawaii Page 93
2010 NORMALIZED RESULTS
The 2010 service reliability results were normalized to exclude the effects of variouscatastrophic equipment failures and large storms on Maui, Molokai and Lanai. There were868 outages in 2010 and 81 of these outages in 2010 were classified as "abnormal" situations(i.e., catastrophic equipment failures and major storms) that cascaded into a loss of load greaterthan 10% of the system peak load.
The data used for the 2010 reliability indices for MECO was normalized to exclude thefollowing events:
March 28, 29, 30 & 31 – High Winds April 1 & 4 – High Winds December 9 & 10 – Kona Storm Various equipment failures and faults
The 2010 service reliability results (normalized) indicate that MECO did makeimprovements in the ASA, SAIFI, CAIDI and SAIDI indices compared to 2009.
The ASA index of 99.9898% is an increase from 2009 and is ranked thehighest ASA index of the last six years. (Higher is better.)
The SAIFI index of 1.001 is a decrease from 2009 and is ranked thelowest SAIFI index of the last six years. (Lower is better.)
The CAIDI index of 53.35 minutes is a decrease from 2009 and is rankedthe second lowest CAIDI index of the last six years. (Lower is better.)
The 2009 SAIDI index of 53.41 minutes is a decrease from 2009 and isranked the lowest SAIDI index of the last six years. (Lower is better.)
MECO 2010 OUTAGE CAUSESFigure 37

Public Utilities Commission Annual Report 2010-11State of Hawaii Page 94
Scheduled outages were the leading cause of outages in 2010, with 170 outages, whichaccounted for 25.22% of all outages. This was an increase of 9.68% from 2009. Outagescaused by cable faults were the second leading cause of outages in 2010, with 136 outages andaccounted for 20.18% of all outages. This was a decrease of 4.23% from 2009.
MECO experienced 24 load shed events in 2010. Maui experienced 8 load shed events,Molokai experienced 8 load shed events and Lanai experienced 8 load shed events in 2010.
Annual Service Reliability Indices
The normalized results for 2009, the previous un-normalized indices for 2005 and thenormalized indices for 2004, 2006, 2007 and 2008 are shown in the table “Annual ServiceReliability Indices”.
MECO
Table of Annual Service Reliability Indices
SYSTEM TOTALS 2005 2006*
2007*
2008*
2009*
2010*
Number of Customers 63,103 64,405 65,728 66,810 67,126 67,405
Customer Hrs. Interrupted 126,010 235,186 186,022 114,001 173,602 60,006.6
Customer-Interruptions 162,827 249,485 170,299 75,764 108,368 67,481.0
ASA (Percent) 99.9772 99.9583 99.9692 99.9805 99.9705 99.9898
SAIFI (Occurrence) 2.580 3.874 2.593 1.134 1.614 1.001
CAIDI (Minutes) 46.43 56.56 62.52 90.28 96.12 53.35
SAIDI (Minutes) 119.81 219.10 162.13 102.38 155.17 53.41
*Data normalized per guidelines specified in the report on reliability that was prepared forthe Public Utilities Commission, titled “Methodology for Determining Reliability Indices for HECOUtilities,” dated December 1990.

Public Utilities Commission Annual Report 2010-11State of Hawaii Page 95
Figure 38MECO System Average Interruption Duration (SAIDI)
(Lower is better)
Figure 38 shows the System Average Interruption Duration Index (SAIDI) for the past sixyears. It shows that in 2010, the recorded SAIDI index was 53.41 and it had decreased from2009 by 65.58%.
The SAIDI is the composite of both the SAIFI and CAIDI indices and produces a broaderbenchmark of system reliability by combining both the duration and the number of customerinterruptions during a given period of time. The lower SAIDI result was due to a decrease in theSAIFI and CAIDI statistics as noted previously.

Public Utilities Commission Annual Report 2010-11State of Hawaii Page 96
Figure 39MECO System Average Interruption Frequency (SAIFI)
(Lower is better)
Figure 39 shows the System Average Interruption Frequency Index (SAIFI) for the pastsix years. It shows that in 2010, the recorded SAIFI index was 1.001 and it had decreased from2009 by 37.98%.
A decrease in interruptions caused by cable faults, transformer overloads and trees orbranches in lines contributed to a lower SAIFI for 2010.

Public Utilities Commission Annual Report 2010-11State of Hawaii Page 97
Figure 40MECO Customer Average Interruption Duration (CAIDI)
(Lower is better)
Figure 40 shows the Customer Average Interruption Duration index (CAIDI) for the pastsix years. The average electrical outage duration of 53.35 minutes per customer for 2010 is adecrease of 44.5% from the previous year.
The contributing factors to the decrease of the CAIDI index from 2009 were reductions ofoutage durations related to trees or branches in lines, cable faults and weather related outages(high wind, flooding and lightning). Outages due to trees or branches in lines decreased in 2010,which incurred 14,385.4 customer interruption hours, as compared to 38,834.8 customerinterruption hours in 2009. Outages due to trees or branches in lines accounted for 24.0% of allcustomer interruption hours in 2010. Outages due to cable faults decreased in 2010, whichincurred 5221.6 customer interruption hours, as compared to 10,164.3 customer interruptionhours in 2009. Outages due to cable faults accounted for 8.7% of all customer interruption hoursin 2010. Outages due to weather also decreased in 2010, which incurred 1,558.0 customerinterruption hours, as compared to 31,364.4 customer interruption hours in 2009. Outages due toweather accounted for 2.6% of all customer interruption hours in 2010.
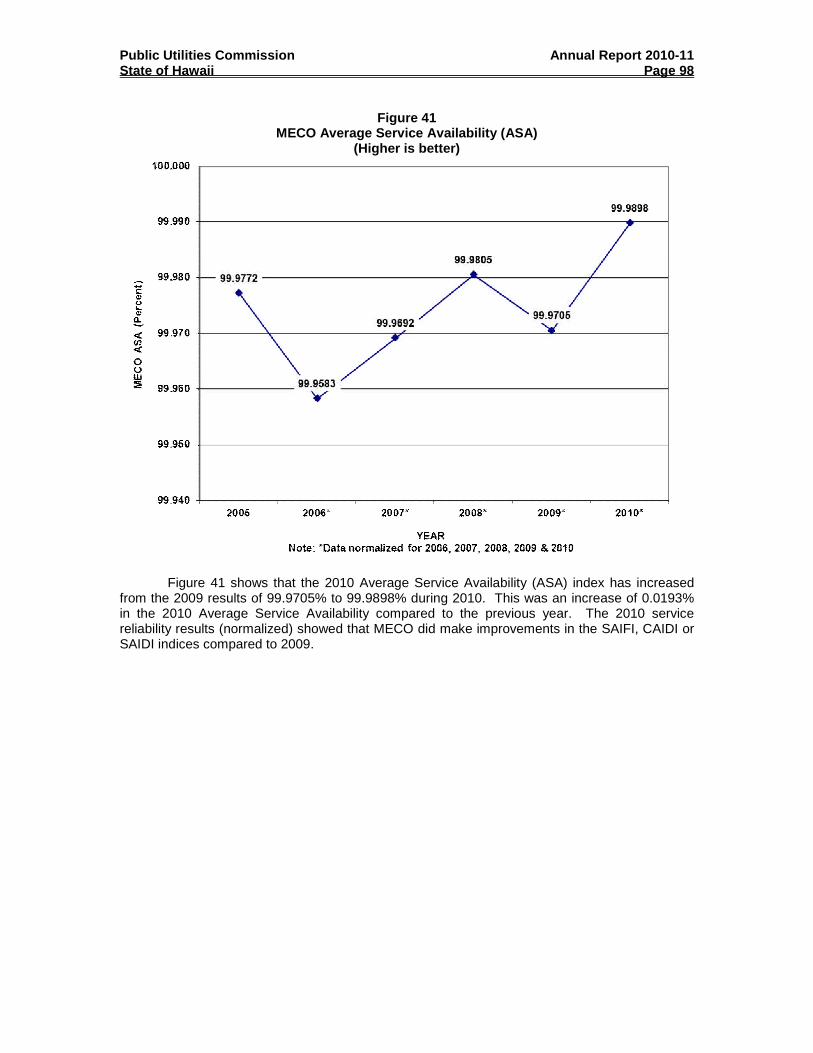
Public Utilities Commission Annual Report 2010-11State of Hawaii Page 98
Figure 41MECO Average Service Availability (ASA)
(Higher is better)
Figure 41 shows that the 2010 Average Service Availability (ASA) index has increasedfrom the 2009 results of 99.9705% to 99.9898% during 2010. This was an increase of 0.0193%in the 2010 Average Service Availability compared to the previous year. The 2010 servicereliability results (normalized) showed that MECO did make improvements in the SAIFI, CAIDI orSAIDI indices compared to 2009.

Public Utilities Commission Annual Report 2010-11State of Hawaii Page 99
3. HELCO SERVICE QUALITY – NORMALIZED ANDUNNORMALIZED RESULTS
The following HELCO electric utility service quality discussion is based on or excerpteddirectly from the HELCO Annual Service Reliability Report 2010 submitted to the Commission byHELCO. The report covers the 2010 calendar year. A complete copy is available for review atthe Commission’s office.
The average customer count increased 0.62% from 79,679 in 2009 to 80,171 in 2010.
On a Not-Normalized basis, in 2010, a total of 302,402 Customer Interruptions wererecorded for a total of 207,607 Customer Hours of Interruption. The System Average InterruptionFrequency (SAIF) index was 3.772 and the Customer Average Interruption Duration (CAID) was41.19 minutes.
On the Normalized basis, a total of 176,622 Customer Interruptions were recorded for atotal of 169,522 Customer Hours of Interruptions. The System Average Interruption Frequency(SAIF) index was 2.203 and the Customer Average Interruption Duration (CAID) was57.59 minutes.
On a Not-Normalized basis, the following were the leading causes of customerinterruptions in 2010:
1. Faulty Equipment Operation. There were 163,340 CustomerInterruptions, 162,370 (99%) of those were related to HELCOGeneration.
2. Failure of Customer Equipment. There were 51,726 CustomerInterruptions, 51,711 (nearly 100%) of those were related to IndependentPower Producers (non-HELCO Generation).
3. Trees and Branches. There were 38,489 Customer Interruptions.4. Deterioration. There were 11,530 Customer Interruptions.

Public Utilities Commission Annual Report 2010-11State of Hawaii Page 100
Figure 42HELCO Causes of Interruption
There were 214,081 generation related Customer Interruptions in 2010, of which 162,320were related to HELCO Generation sources (76%) and 51,711 were related to IndependentPower Producer (non-HELCO Generation) sources (24%). In 2010, Hamakua Energy Partners(HEP) and Pakini Nui Windfarm were the non-HELCO generation sources that caused customerinterruptions.
HELCO normalized data per guidelines specified in a special report on reliability preparedfor the Public Utilities Commission. This report, "Methodology for Determining Reliability Indicesfor HECO Utilities", dated December 1990, indicates that normalization may be utilized for"abnormal" situations such as hurricanes, tsunamis, earthquakes, floods, catastrophic equipmentfailures, and a single equipment outage that cascades into a loss of load that is greater than 10%of the system peak load. HELCO normalized four events in 2010:
Underfrequency Loadshedding event on January 26 due to Puna Planttripping off-line resulted in 10,972 Customer Interruptions and563 Customer Hours of Interruption.
Underfrequency Loadshedding event on April 9 due to Keahole CT-5,CT-4 and ST-7 tripping off-line while exporting 48.1MW resulted in28,229 Customer Interruptions and 5,524 Customer Hours ofInterruption.
Underfrequency Loadshedding event on July 3 when Keahole CT-5tripped during on-line water wash, which caused other units to ramp-up.Other units that tripped were Keahole CT-4 and ST-7, HEP CT-1, CT-2,and ST, and HRD Windfarm. This resulted in 63,329 customers and28,560 Customer Hours of Interruption.

Public Utilities Commission Annual Report 2010-11State of Hawaii Page 101
Underfrequency Loadshedding event on October 27 due to KeaholeCT-4 tripping because of a speed probe problem. HEP followed andtripped due to high temperatures, which resulted in a total of 23,250Customer Interruptions and 3,437 Customer Hours of Interruption.
Significant interruptions, contributing more than 5,000 Customer Interruptions (CI) orCustomer Interruption Duration (CID) greater than 5,000 Customer Hours of Interruption, that didnot meet the normalization criteria were:
Date Problem CI CID
January 17 Overhead conductors fell along KahakaiBoulevard due to deterioration.
1,635 5,480
February 22 Underfrequency Loadshedding – Keahole CT-5tripped offline.
9,543 755
February 27 Underfrequency Loadshedding – Puna Steam unittripped offline.
9,585 739
March 19 Underfrequency Loadshedding – Hamakua energyPartners CT-1 tripped offline.
5,406 455
April 24 Tree fell on lines affecting distribution circuit 3,282 5,074
May 7 Tree branch touching transmission lines 2,742 8,394
May 24 Underfrequency Loadshedding – Keahole CT-4 10,774 1,215
June 8 Underfrequency Loadshedding – Keahole ST-7 5,406 269
July 7 Underfrequency Loadshedding – Keahole ST-7 10,870 1,003
July 22 Brush Fire caused Waimea CB 3301 to open 1,972 6,179
July 22 Waimea CB 3301 failure 1,972 14,139
August 12 Scheduled outage to do repairs at WaimeaSwitching Station.
1,989 16,176
August 22 Underfrequency Loadshedding – Kamaoa WindFarm – broken breaker switch
10,902 730
November 18 Underfrequency Loadshedding – Keahole CT-5and ST-7
16,328 2,698
December 4 Scheduled outage maintenance to PaauiloSubstation
486 3,815
December 19 Tree fell on lines affecting distribution circuit 1,512 5,241
Total 94,404 72,362

Public Utilities Commission Annual Report 2010-11State of Hawaii Page 102
HELCO Normalized
HELCO Not-Normalized
Year ASA Number of CustomersCustomer
Interruptions CID SAIF CAID
2005 99.968 72,513 153,982 200,374 2.124 78.08
2006 99.971 75,353 188,602 190,061 2.503 60.46
2007 99.961 77,933 208,000 269,475 2.669 77.73
2008 99.973 79,386 179,862 189,156 2.266 63.10
2009 99.972 79,679 246,437 197,371 3.093 48.05
2010 99.946 80.171 176,622 169,522 2.203 57.59
Year ASA Number of CustomersCustomer
InterruptionsCID SAIF CAID
2005 99.962 72,513 246,557 239,935 3.400 58.39
2006 99.950 75,353 341,289 328,758 4.529 57.80
2007 99.955 77,933 257,924 305,681 3.310 71.11
2008 99.973 79,386 194,807 190,314 2.454 58.62
2009 99.965 79,679 298,334 246,916 3.744 49.66
2010 99.970 80.171 302,402 207,607 3.772 41.19

Public Utilities Commission Annual Report 2010-11State of Hawaii Page 103
Figure 43HELCO System Average Interruption Frequency (SAIF)
(Lower is better)
Figure 44HELCO Customer Average Interruption Duration (CAID)
(Lower is better)
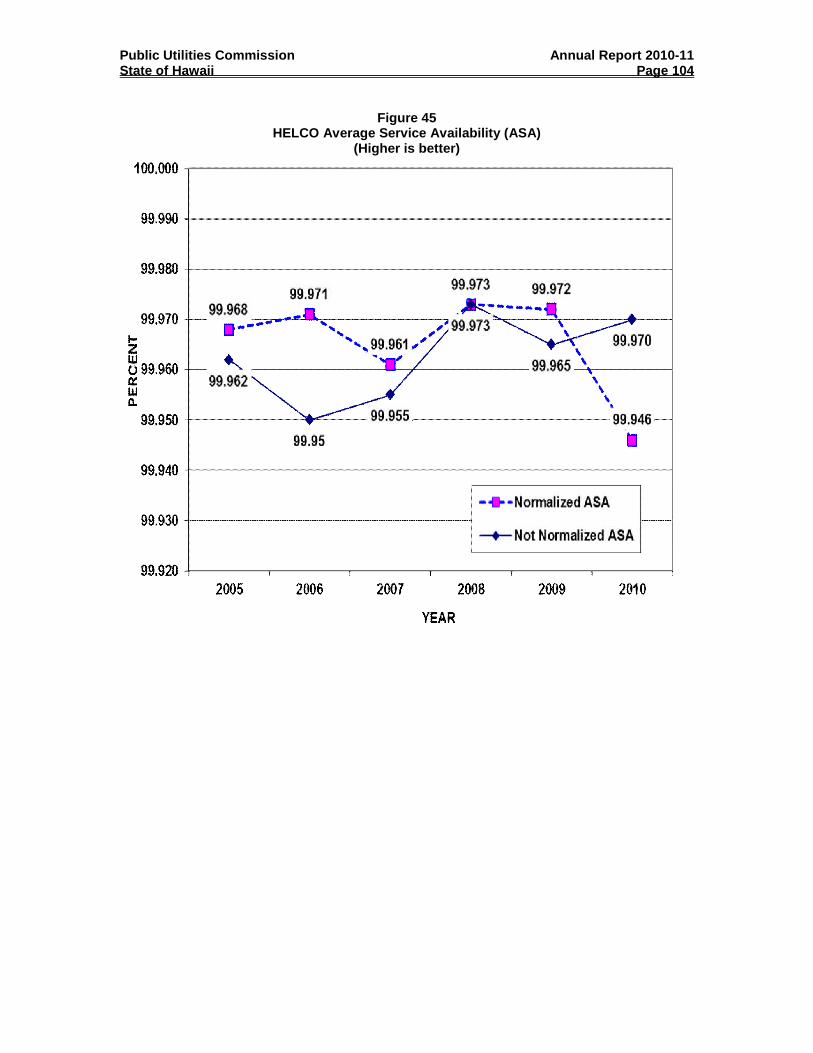
Public Utilities Commission Annual Report 2010-11State of Hawaii Page 104
Figure 45HELCO Average Service Availability (ASA)
(Higher is better)

Public Utilities Commission Annual Report 2010-11State of Hawaii Page 105
4. KIUC SERVICE QUALITY – UNNORMALIZED RESULTS
The following KIUC electric utility service quality discussion is based on or excerpteddirectly from the KIUC Annual Service Reliability Report 2010 submitted to the Commission byKIUC. The report covers the 2010 calendar year. A complete copy is available for review at theCommission’s office.
The average number of electric ratepayers increased in 2010 to 36,113 (0.30%) over2009’s 36,004. The system peak of 76.54 MW was recorded. The 2010 system peak demandincreased by 1.13 MW or 1.48% over 2009’s peak of 75.41 MW.
KIUC has not normalized any of its data for the period 2003 through 2010. The reliabilityindices are calculated using the data from all system interruptions except scheduled interruptionsfor maintenance.
The unnormalized reliability results for 2006, 2007, 2008, 2009 and 2010 are shown inthe table “KIUC Annual Service Reliability Indices.” Figures 46 to 49 contain the data discussedabove in graphical form.
KIUC Annual Service Reliability Indices
2006 2007 2008 2009 2010
System Peak (MW) 76.78 77.75 74.27 75.41 76.54
Number of Customers 34,671 35,207 35,713 36,004 36,113
ASA (Per cent) 99.969 99.961 99.983 99.983 99.980
SAIF (Occurrences) 8.17 8.43 4.45 6.17 4.76
CAID (Minutes) 20.16 24.35 19.84 14.63 20.74
SAID (Minutes) 164.7 205.15 88.18 90.28 98.72

Public Utilities Commission Annual Report 2010-11State of Hawaii Page 106
Figure 46KIUC Average Service Availability (ASA)
(High is better)
Figure 46 shows the Average System Availability (ASA) for the past five years. The 2010ASA of 99.980% is only slightly lower than the two best years of the five-year period of 99.983%and equals the five-year average of 99.975%.
Figure 47KIUC System Average Interruption Frequency Index (SAIF)
(Lower is better)
Figure 47 shows the System Average Interruption Frequency Index (SAIFI) for the pastfive years. The 2010 SAIFI of 4.76 was second best of the five-year period and better than thefive-year average of 6.39.

Public Utilities Commission Annual Report 2010-11State of Hawaii Page 107
Figure 48KIUC Customer Average Interruption Duration Index (CAID)
(Lower is better)
Figure 48 shows the Customer Average Interruption Duration Index (CAID) for the pastfive years. The 2010 CAIDI of 20.74 was similar to the five-year average of 19.94.
Figure 49KIUC Average Interruption Duration Index (SAIDI)
(Lower is better)
Figure 49 shows the System Average Interruption Duration Index (SAIDI) for the past fiveyears. The 2010 SAIDI of 98.72 increased slightly over the previous two years of the five-yearperiod but is better than the five-year average of 129.41.

Public Utilities Commission Annual Report 2010-11State of Hawaii Page 108
In the following figures, the most recent year's sustained interruption causes areexamined. Interruptions can be broken down many ways, but we will focus on two areas: causesby frequency (what caused the most interruptions), and causes by magnitude (what caused themost severe interruptions).
Figure 50Sustained Interruptions by Frequency
Figure 50 shows the breakdown by frequency. The leading cause of outages was“Distribution” – failure or malfunction of distribution equipment including cables, fuses, insulators,poles, and transformers. A close second was loss of “Power Supply” confined within KIUC. Anexample of this is generating unit problems that result in a reduction of output, causing an underfrequency load shed. Causing the third most interruptions was “Other” – persons or equipmentnot related to or owned by KIUC. Examples include auto accidents that contact utility poles orwires, non-KIUC contractors such as construction crews that dig into underground cables or treetrimmers that contact overhead wires, and trees that contact wires due to overgrowth. The fourthleading cause of interruptions was “Transmission” – failure or malfunction of transmissionequipment including insulators, large transformers, lightning arrestors, and switches. The fifth (orleast) and final cause of interruptions was “Acts of Nature” – high winds, floods, storms, etc.

Public Utilities Commission Annual Report 2010-11State of Hawaii Page 109
Figure 51Sustained Interruptions by Magnitude
Figure 51 shows the breakdown by magnitude. The same descriptions and examples thatwere described following Figure 50 apply also for Figure 51. The causes of severe interruptions,in order from most to least, were “Transmission,” “Distribution,” “Power Supply,” “Other,” and“Acts of Nature”.
5. ELECTRIC UTILITIES GENERATING EFFICIENCY RESULTSThe following provides annual heat rate values for HECO, HELCO, Maui division of
MECO, and KIUC for the past four (4) years. The annual heat rates for Lanai and Maui of MECOavailable for the past three years. Heat rates are measured in Btu/kWh, and equate to the amountof energy consumed by the generating units (in Btu) per kWh of electricity produced. The heatrates provide a measure of the generating efficiency of the utility, with a lower value indicative ofgreater generating efficiency. The heat rate is generally dependent on the age, type ofgenerating units and fuels used by a given utility. Figure 52 shows the heat rates of the electricutilities from 2007 to 2010.

Public Utilities Commission Annual Report 2010-11State of Hawaii Page 110
Figure 52Electric Utility Heat Rates
B. TELECOMMUNICATIONS SERVICE QUALITY MEASUREMENTSHawaiian Telcom files monthly reports to the Commission which measure and report the
company’s compliance with twelve telecommunications service quality objectives, as requiredunder HAR Sections 6-80-93 through -98. Regulated activity (such as installation of a primaryline) and non ILEC regulated activity (such as provision of DSL service) are not always separatelytracked by the company, and this may affect the consistency of service quality data beginning in2007. The Commission continues to monitor Hawaiian Telcom’s systems and activities to resolveissues and address customer concerns and complaints. Beginning with Hawaiian Telcom’sJune 2011 filing, these quality measurements are being filed as confidential and can’t be revealedpublicly. Therefore, the figures below do not reflect June 2011 data.
In order to compare all service quality measurements, which have different objectives,the Commission has calculated the degree to which the company has either exceeded or missedservice quality objectives for each service quality measure. A positive average service qualitycompliance level of five percent (5%) means that the company has exceeded the service qualitycompliance objective by an average of five percent (5%) over the reporting period. A negativeaverage service quality compliance level of negative five percent (-5%) means that the companymissed the service quality compliance objective by an average of five percent over the reportingperiod. If, on average, the company meets the service quality objective the average servicequality compliance level would be zero percent (0%).

Public Utilities Commission Annual Report 2010-11State of Hawaii Page 111
The following charts show Hawaiian Telcom’s Average Service Compliance Levels forFiscal Year 2010-2011 and aggregated Verizon and Hawaiian Telcom Average ServiceCompliance Levels from 2001 through 2011.
FIGURE 53
Looking at performance during Fiscal Year 2010-2011, the measurements show that, onaverage, the company usually met or exceed objectives for five of the twelve service qualityobjectives. Five (5) areas in which Hawaiian Telcom failed to meet service quality objectiveswere: (1) Percent Out-of-Service Troubles Cleared in 24 Hours; (2) Percent InstallationsCompleted Within 3 Days; (3) Repair Calls Answered w/in 20 Seconds; (4) Percent BusinessInstallation/Billing Office Calls Answered Within 20 Seconds; and (5) Repair Commitments Met.

Public Utilities Commission Annual Report 2010-11State of Hawaii Page 112
FIGURE 54
Service Quality Measurement Detail
FIGURE 55
Total Customer Trouble Reports Per 100 Lines - This performance area measurescustomer network trouble reports per 100 access lines. It is calculated by taking the totalcustomer network trouble reports divided by total access lines times 100. Since October 2007,the results include additional trouble report activity that was not previously included in this metric.Hawaiian Telcom’s systems are currently unable to exclude FCC regulated services (such asDSL) when computing these results, which may affect the consistency of the service qualitymeasurements.

Public Utilities Commission Annual Report 2010-11State of Hawaii Page 113
FIGURE 56
Dial Tone Speed - % Dial Tone Within 3 Seconds - This performance area measuresthe percentage of calls receiving dial tone within three (3) seconds. It is calculated by taking thenumber of calls in which dial tone was provided within three (3) seconds divided by the totalnumber of calls times 100.
FIGURE 57
Dial Service Results - % Completion - This performance area measures callcompletion performance on interoffice trunk groups. It is calculated by taking the number ofunblocked calls on interoffice trunk groups divided by the total number of attempts on interofficetrunk groups times 100.

Public Utilities Commission Annual Report 2010-11State of Hawaii Page 114
FIGURE 58
% OOS Trouble Cleared in 24 Hours - This performance area measures customerout-of-service (“OOS”) network trouble reports cleared within 24 working hours. It is calculated bytaking the total customer OOS network reports cleared within 24 working hours divided by thetotal customer OOS network trouble reports times 100. Since October 2007, the results includeadditional activity that was not previously included in this metric. Hawaiian Telcom’s systems arecurrently unable to exclude FCC regulated services (such as DSL) when computing these results,which may affect the consistency of the service quality measurements.
FIGURE 59
% Operator Toll Calls Answered Within 10 Seconds - This performance areameasures the number of calls handled within ten (10) seconds divided by the total number of callshandled times 100 for calls to the toll operator.

Public Utilities Commission Annual Report 2010-11State of Hawaii Page 115
FIGURE 60
% Operator Directory Assistance Calls Answered Within 10 Seconds - Thisperformance area measures the number of calls handled within ten (10) seconds divided by thetotal number of calls handled times 100 for calls to the directory assistance operator.
FIGURE 61
% Repair Calls Answered Within 20 Seconds - This performance area measures thenumber of calls answered within twenty (20) seconds divided by the total number of calls times100 for calls to the repair answer center.

Public Utilities Commission Annual Report 2010-11State of Hawaii Page 116
FIGURE 62
% Repair Commitments Met - This performance area measures the repair ticketscompleted by the committed due date. It is calculated by taking the total customer networktrouble reports for which the commitments were met divided by total customer network troublestimes 100. Since October 2007, the results include additional activity that was not previouslyincluded in this metric. Hawaiian Telcom’s systems are currently unable to exclude FCCregulated services (such as DSL) when computing these results, which may affect theconsistency of the service quality measurements.
FIGURE 63
% Installations Completed Within 3 Days - This performance area measures thepercent of basic orders completed within three (3) working days. It is calculated by taking thetotal installation (“I”), move (“M”) and change (“C”) basic orders completed withinthree (3) working days divided by the total number of I, M and C orders times 100. SinceOctober 2007, the results include additional activity that was not previously included in this metric.Hawaiian Telcom’s systems are currently unable to exclude FCC regulated services (such asDSL) when computing these results, which may affect the consistency of the service qualitymeasurements.

Public Utilities Commission Annual Report 2010-11State of Hawaii Page 117
FIGURE 64
% Combined Business Installation/Billing Office Calls Answered Within20 Seconds - This performance area measures the number of calls answered withintwenty (20) seconds divided by the total number of calls times 100 for calls to the businessinstallation and billing center.
FIGURE 65
% Combined Residence Installation/Billing Office Calls Answered Within20 Seconds - This performance area measures the number of calls answered withintwenty (20) seconds divided by the total number of calls times 100 for calls to the residenceinstallation and billing center.

Public Utilities Commission Annual Report 2010-11State of Hawaii Page 118
FIGURE 66
% Installation Commitments Met - This performance area measures the percent ofbasic orders where the work for the customer is complete and service is available for use by nolater than the commitment made to the customer. It reflects the percent as calculated by takingthe installation (“I”), move (“M”) and change (“C”) order installation commitments met divided bythe total number of I, M and C orders taken times 100. Since October 2007, the results includeadditional activity that was not previously included in this metric. Hawaiian Telcom’s systems arecurrently unable to exclude FCC regulated services (such as DSL) when computing these results,which may affect the consistency of the service quality measurements.

Public Utilities Commission Annual Report 2010-11State of Hawaii Page 119
XIII. LEGISLATION ENACTED BY 2011 LEGISLATUREAFFECTING PUBLIC UTILITIES
A. 2011 LEGISLATIVE MEASURES RELATING TO THE PUBLICUTILITIES COMMISSION:
1. (SB704 SD2) RELATING TO RENEWABLE ENERGYIn an effort by the legislature to clarify the definition of a public utility under the general
supervisory authority of the Commission, Act 9, SLH 2011, exempts certain third-party ownersand operators of on-site renewable energy systems, such as residential solar systems, from thedefinition of a “public utility.” This exemption effectively excludes such third-partyowner/operators from regulation as a public utility in the State. Such companies that enter intoarms-length, fully negotiable independent power purchase agreements are not considered toserve the same function or have the same broad impact as major electric service providers thatcurrently qualify as public utilities.
2. (SB1347 SD1 HD2 CD1) RELATING TO THE PUBLIC UTILITIESCOMMISSION
Act 69, SLH 2011, requires the Commission and the Consumer Advocate to acceptrequired documents, including applications, complaints, pleadings, and briefs, in both paper formand electronic form, beginning July 1, 2011, and to subsequently adopt rules to provide for theacceptance of these documents. The measure also requires the Commission and the ConsumerAdvocate to accept, beginning July 1, 2013, the required documents described above in eitherpaper form or electronic form. The Commission is also ordered to report to the legislature prior tothe convening of the 2012 regular session its progress in implementing an electronic filingsystem, as well as its comprehensive plan to meet future electronic filing system requirements ofthe act taking effect in 2013, additional funding requirements, and recommendations for furtherlegislation to create a working electronic filing system for the Commission.
Act 69 also authorizes the Commission to allow an electric utility company and its electricutility affiliates that aggregate their renewable portfolios in order to satisfy the State’s renewableportfolio standards to collectively share renewable portfolio costs among the company, itsaffiliates and ratepayers. The sharing of renewable portfolio costs is allowed through the use ofan automatic rate adjustment clause to be approved by the Commission.
3. (SB1482 SD1 HD1 CD1) RELATING TO THE PUBLIC UTILITIESCOMMISSION
This measure, Act 109, SLH 2011, specifically requires the Commission to consider theneed to reduce the State’s dependence on fossil fuels when exercising its regulatory authority. Indetermining the reasonableness of costs associated with a utility’s capital improvements and/oroperations, the Commission is authorized to find that short-term costs or direct costs calculated tobe higher than fossil fuel-dependent alternatives may be reasonable in light of the longer-termimpacts on the State’s use of fossil fuels.
4. (HB1342 HD1 SD2 CD1) RELATING TOTELECOMMUNICATIONS
Act 151, SLH 2011, exempts broadband infrastructure improvements from state andcounty permit requirements under certain conditions from the period January 1, 2012 toJanuary 1, 2017. In addition, all parties are generally exempted from having to replace existingutility poles when replacing or improving associated cable lines, and the Commission is
Public Utilities Commission Annual Report 2010-11State of Hawaii Page 120
authorized to allow for cost recovery by public utilities that replace utility poles in compliance withthis Act.
Act 151 also transfers the authority and responsibilities of the administrator of the cabletelevision division for the department of commerce and consumer affairs related to the State’stelework promotion and broadband assistance advisory council to the director of commerce andconsumer affairs.
5. (HB200 HD1 SD1 CD1) RELATING TO THE STATE BUDGETAct 164, SLH 2011, appropriates the Commission’s operating budget for both fiscal years
2011-2012 and 2012-2013. The Commission received an operating budget appropriation of$11,049,409.00 for fiscal year 2011-2012 that is to fund the operations of both the Commissionand the division of consumer advocacy within the department of commerce and consumer affairs,with a similar allocation of $11,386,174.00 provided for fiscal year 2012-2013 for the samepurposes.
6. (HB1520 HD2 SD2 CD1) RELATING TO RENEWABLE ENERGYAct 204, SLH 2011, requires the Commission to investigate the viability of an on-bill
financing program to allow electric utility company customers to finance purchases of renewableenergy systems or energy efficient devices through the energy savings provided by such systemsor devices. A number of specific questions are suggested in the act as focal investigation points,including the costs and benefits associated with operation of the program, the program’s ability tomake renewable energy and energy efficiency more accessible to the rental market and otherunderserved markets, and reasonable penalties for default by on-bill financing participants.
The Commission is now heavily engaged in the process of carrying out the study and itsassociated activities required under Act 204.
7. (SB98 SD2 HD1 CD1) RELATING TO WATER CARRIERSAct 213, SLH 2011, specifically sets out several new requirements for the Commission to
follow in managing the certificate for public convenience and necessity (CPCN) process for watercarrier applicants, as well as a set of requirements for the posting of documents to theCommission’s website. First, notice provided by the Commission to both the CPCN applicant andeach island to be affected by the applicant are mandated, including information required on theproposed operations, routes, services and proposed effective date of service. In addition, theCommission must provide notice and hold public hearings before approving an application for aCPCN. Restrictions are imposed on the issuance of a CPCN for water carriers, which must besupported by specific evidentiary findings in the hearing record, including a finding that “existingwater carrier services are inadequate to presently service the public or meet demonstrated andquantifiable future demands for service.” The measure also prohibits the Commission fromissuing a CPCN for a water carrier applicant if evidence indicates that such issuance wouldadversely affect the profitability of an existing water carrier. The Commission is authorized toissue temporary or interim CPCNs for water carriers only in the case of state-declaredemergencies. Lastly, the Commission is required to post a link on the Commission’s websitefront page to an electronic version of each application, and each order, including its final decisionand order.

Public Utilities Commission Annual Report 2010-11State of Hawaii Page 121
B. OTHER 2011 LEGISLATIVE MEASURES RELATING TO UTILITIES
1. (SB1346 SD2) RELATING TO RENEWABLE PORTFOLIOSTANDARDS
Act 10, SLH 2011, amends the definition of “renewable electrical energy” within Hawaii’srenewable portfolio standards section to include, starting January 1, 2015, customer-sited,grid-connected renewable energy generation. This amendment is intended to specifically targetcustomer-sited, grid-connected renewable energy generation into calculating the State’s progressin achieving its renewable portfolio standard benchmark requirements.
2. (HB855 HD1 SD1 CD1) RELATING TO ISSUANCE OF SPECIALPURPOSE REVENUE BONDS TO ASSIST PACIFIC POWERAND WATER COMPANY, INC., IN THE DEVELOPMENT OFHYDROPOWER FACILITIES IN HAWAII
This measure, Act 87, SLH 2011, authorizes the issuance of special purpose revenuebonds for the purpose of assisting Pacific Power and Water Company, Inc., with the planning,permitting, designing, constructing, equipping, and operating of hydropower plants within Hawaii.
3. (HB1000 HD2 SD2 CD1) RELATING TO ENHANCED 911SERVICES
Act 168, SLH 2011, clarifies and updates the enhanced 911 services law by providing forupdates to the enhanced 911 program membership, relevant technology, and surcharge rules.The measure now specifically includes certain telecommunications utilities in the enhanced 911board membership, and the Act makes modifications regarding certain telecommunicationsutilities’ ability to collect under the enhanced 911 surcharge.

Public Utilities Commission Annual Report 2010-11State of Hawaii Page 122
XIV. FEDERAL ISSUES AND ACTIVITIES
A. FEDERAL UNIVERSAL SERVICE FUND (“USF”) ELIGIBLETELECOMMUNICATIONS CARRIERS (“ETC”) – ANNUALRECERTIFICATIONThe Federal Universal Service Fund program, created by the U.S. Congress through the
Telecommunications Act of 1934, as amended in 1996 ("Act"), is designed: 1) to promote theavailability of quality telecommunications services at just, reasonable, and affordable rates; 2) toincrease access to advanced telecommunications services throughout the nation; 3) to advancethe availability of such services to all consumers, including those in low income, rural, insular, andhigh cost areas; and 4) at rates reasonably comparable to those charged in urban areas. The Actalso requires that all providers of telecommunications services should contribute to Federaluniversal service in some equitable and nondiscriminatory manner; that there be specific,predictable, and sufficient Federal and State mechanisms to preserve and advance universalservice; that all schools, classrooms, healthcare providers, and libraries should, generally, haveaccess to advanced telecommunications services; and finally, that the Federal-State Joint Boardand the Federal Communications Commission ("FCC") should determine those additionalprinciples that, consistent with the Act, are necessary to protect the public interest.
As provided by the Act, the USF receives contributions from providers oftelecommunications services to support four programs: 1) Lifeline/Link-up; 2) High-Cost;3) Schools and Libraries; and 4) Rural Health Care. Those contributions are then pooled andredistributed to carriers designated as ETCs, in order to assist them in recovering costs ofproviding telecommunications services in areas where otherwise it would not be financiallyfeasible.
As of June 30, 2011, the Hawaii Commission has granted ETC status to five carriers:Hawaiian Telcom, Inc. (HT), Sandwich Isles Communications, Inc. (SIC), Sprint Nextel (Sprint),Coral Wireless, LLC, d/b/a Mobi PCS (Mobi), and T-Mobile West Corporation (T-Mobile). Sprint,Mobi and T-Mobile are considered competitive eligible telecommunications (CETCs) providers.On March 14, 2011, the Commission designated T-Mobile West Corporation as an eligibletelecommunications carrier in the state of Hawaii, Docket No. 2010-0119.
In response to explosive growth in high-cost universal service fund disbursements, theFCC issued an order on May 1, 2008 which adopted an interim cap on the amount of high-costsupport that CETCs may receive. Under the interim cap, CETC support is capped at thestate-level based on the support that each state was eligible to receive in March 2008(annualized).
Sprint also has a voluntary agreement with the FCC (WT Docket No. 08-94) to reduce itshigh-cost support funding by 20% by 12/31/2008 and an additional 20% for each of the followingfour years until they receive no support. 2009 represents the second year of 20% reduction inhigh-cost funding support for Sprint. On June 7, 2011 Sprint filed an application with theCommission to relinquish its ETC designation in Hawaii, effective as of December 31, 2011.
The Hawaii PUC must annual certify to the FCC that all ETCs and CETCs that receivehigh-cost USF support are using those funds for their intended purposes. Along with FCCrequirements, the Commission established its own annual certification procedures for certificationin Decision and Order 22228 on January 16, 2006. The Commission recertified SIC, Mobi, andSprint in 2009. HT does not require certification, because it does not receive high-cost USFdisbursements. On March 14, 2011 the Commission opened docket 2011-0052 for the purposeof considering any proposed amendments to the Commission's annual certification requirementsfor Hawaii ETCs.

Public Utilities Commission Annual Report 2010-11State of Hawaii Page 123
B. PROPOSED AMENDMENTS TO UNITED STATES CLEAN AIR ACTEMISSIONS RULES AFFECTING FOSSIL FUEL-BASED ELECTRICPOWER PLANTSThe United States Environmental Protection Agency (“EPA”) is in the process of
promulgating rules that will strengthen protections against toxic air emissions from electricitygeneration operations throughout the country, including Hawaii-based electric utilities. Focusingon emissions from fossil fuel-powered electricity generating plants, new clean air rules comingonline within the next several months include 1) new Mercury and Air Toxics Standards (“MATS”)under sections 111 and 112 of the U.S. Clean Air Act, and 2) clarified rules for ReciprocatingIgnition Combustion Engines (“RICE”) as part of new National Emission Standards for HazardousAir Pollutants (“RICE NESHAP”) codified under 40 CFR 63 (Code of Federal Regulations).These proposed rules will potentially result in significant new compliance costs from newmandated operational procedures and the retrofitting of existing technologies at affected electricutilities.
Via final rules enacted October 19, 2010, and subsequently clarified via the direct finalrule process on March 9, 2011, utilities operating stationary RICE units have been directed toinstitute various measures that would increase the level of annual internal controls designed toultimately reduce the emissions of Hazardous Air Pollutants (“HAP”) from those units. The HAPstargeted under the RICE NESHAP rules include a number of potentially harmful substances likecarbon monoxide, benzene, formaldehyde, chromium, lead, mercury, and nickel. Controlsaffected by the regulations include, but are not limited to, the annual frequency of filter changesand the annual inspection of spark plugs and hoses. In addition, the RICE NESHAP rules set outspecific operating limits concerning engines using oxidation catalyst or non-selective catalyticreduction technology, and establish engine startup standards. Similar to the MATS rulesdiscussed below, the RICE NESHAP rules are expected to benefit the country throughsignificantly reduced health risks from HAP exposure. Full compliance with the proposed rules isestimated to be approximately $383 million in total national capital costs by 2013, the year of fullimplementation, and additional annual compliance costs of $253 million for all applicable unitsthroughout the nation.
On March 16, 2011, the EPA issued proposed MATS in order to set pollution limits on theamount of mercury and other toxic air pollutants that are regularly emitted from power plants,specifically chemicals released from both new and existing electric utility steam generating units(“EGUs”) located at those plants. With respect to oil-fired EGUs like those found in operation inHawaii, the proposed rules will set numerical limits on emissions of various metals and chemicals,such as mercury, arsenic, nickel, hydrogen chloride, and hydrogen fluoride. It is claimed that therelease of the pollutants mentioned into national air and water sources result in the rise ofsignificant health risks each year to affected individuals coming in close proximity to thehazardous chemicals. In addition, the proposed rules would create new work practices to preventorganic air toxin emissions, like those including dioxins and furans that can be caused byimproper combustion practices in power plants. Both the emission limits and enhanced workpractice rules for EGUs are to be reviewed through EPA-led compliance and performance testingprograms. Though the EPA estimates the national annual cost of compliance for the nearlyfourteen hundred targeted EGUs will reach over $10 billion in 2016, it is reported that compliancewith the proposed rules is fully achievable using existing EGU-serving technology.
As of the drafting of this report, the MATS process aims to enact final regulations byDecember 16, 2011 following the full public comment and hearing process for federal agencyrulemaking.
To comply with the above rules, Hawaii-based electric utilities will potentially be requiredto expend significant amounts of capital in order to bring their existing electricity generatingequipment and company procedures in line with the new requirements. Local utilities generate

Public Utilities Commission Annual Report 2010-11State of Hawaii Page 124
the vast portion of the State’s electricity from fossil fuel-fired engine technology that burnspetroleum. It is unclear what will be the precise costs for Hawaii’s electric utilities in upgradingexisting systems. However, the EPA estimates above for total annual national compliance costsfor both the RICE NESHAP rules and the MATS indicate the potential for heavy utility investmentin compliance solutions that can range from equipment retrofits, upgrades, internal restructuring,as well as monitoring, testing, and reporting activities.

Public Utilities Commission Annual Report 2010-11State of Hawaii Page 125
XV. PREVIEW FISCAL YEAR 2011-12
See PUC Website - http://puc.hawaii.gov