public sector finances, uk: october 2018 · table published alongside the main psf presentation,...
TRANSCRIPT

1 | P a g e
Public sector finances, UK: October 2018 The UK government's financial position including headline measures of borrowing and debt (PSNB ex and PSND ex). Coverage: United Kingdom Date: 21 November 2018 Geographical Area: UK and GB Theme: Economy Next release: 21 December 2018
Contact: Fraser Munro Email: [email protected] Telephone: 01633 456402
Table of contents 1. Main points 2. Things you need to know about public sector finances 3. What’s changed in this release? 4. How much is the public sector borrowing? 5. How much does the public sector owe? 6. Revisions since previous release 7. How do our figures compare with official forecasts? 8. International comparisons of borrowing and debt 9. Quality and methodology 10. Looking ahead 11. Links to data and related publications

2 | P a g e
1. Main points
• Borrowing (Public sector net borrowing excluding public sector banks) in October 2018 was £8.8 billion, £1.6 billion more than in October 2017; this was the highest October borrowing for three years (since 2015).
• Borrowing in the current financial year-to-date (YTD) was £26.7 billion: £11.2 billion less than in the same period in 2017; the lowest year-to-date for 13 years (since 2005).
• On 29 October 2018, the Office for Budget Responsibility (OBR) revised their official forecast of borrowing for the financial year ending (FYE) March 2019 down by £11.6 billion to £25.5 billion.
• Borrowing in the FYE March 2018 was £40.1 billion: £5.5 billion less than in FYE March 2017; the lowest financial year for 11 years (since FYE 2007).
• Debt (Public sector net debt excluding public sector banks) at the end of October 2018 was £1,791.6 billion (or 84.0% of gross domestic product (GDP)); an increase of £1.9 billion (or a decrease of 2.7 percentage points) on October 2017.
• Debt at the end of October 2018 excluding Bank of England (mainly quantitative easing) was £1,598.5 billion (or 75.0% of GDP); a decrease of £33.6 billion (or a decrease of 4.0 percentage points) on October 2017.
• Central government net cash requirement in the current financial YTD was £16.1 billion (£1.8 billion less than financial YTD 2017) or £17.3 billion excluding both UK Asset Resolution Ltd and Network Rail (£1.6 billion less than in financial YTD 2017).

3 | P a g e
2. Things you need to know about this release In the UK, the public sector consists of five sub-sectors: central government, local government, public non-financial corporations, Bank of England and public financial corporations (or public sector banks). Unless otherwise stated, the figures quoted in this bulletin exclude public sector banks (that is, currently only Royal Bank of Scotland (RBS)), as the reported position of debt (and to a lesser extent borrowing) would be distorted by the inclusion of RBS's balance sheet (and transactions). This is because government does not need to borrow to fund the debt of RBS, nor would surpluses achieved by RBS be passed on to government, other than through any dividends paid as a result of government equity holdings. Public sector net borrowing excluding public sector banks (PSNB ex) measures the gap between revenue raised (current receipts) and total spending (current expenditure plus net investment (capital spending less capital receipts)). Public sector net borrowing is often referred to by commentators as “the deficit”. The public sector net cash requirement (PSNCR) represents the cash needed to be raised from the financial markets over a period of time to finance the government’s activities. This can be close to the deficit for the same period but there are some transactions, for example, loans to the private sector, which need to be financed but do not contribute to the deficit. It is also close but not identical to the changes in the level of net debt between two points in time. Public sector net debt excluding public sector banks (PSND ex) represents the amount of money the public sector owes to private sector organisations including overseas institutions, largely as a result of issuing gilts and Treasury Bills, less the amount of cash and other short-term assets it holds. Public sector net debt is often referred to by commentators as “national debt”. While borrowing (or the deficit) represents the difference between total spending and receipts over a period of time, debt represents the total amount of money owed at a point in time. The debt has been built up by successive government administrations over many years. When the government borrows (that is, runs a deficit), this normally adds to the debt total. So reducing the deficit is not the same as reducing the debt.

4 | P a g e
3. What’s changed in this release? This section presents information on aspects of data or methodology that have been introduced or improved since the publication of the previous bulletin, along with supporting information users may find useful. Bank of England Asset Purchase Facility Fund
In October 2018, there was a £2.8 billion dividend transfer from the Bank of England Asset Purchase Facility Fund (BEAPFF) to HM Treasury. As with other such transfers, central government net borrowing will be reduced by an amount equivalent to the transfer, while the net borrowing of Bank of England will be increased by an equal and offsetting amount, with no impact at a public sector borrowing level. The Bank of England entrepreneurial income for the financial year ending March 2018 (April 2017 to March 2018) was calculated as £14.1 billion. This is the total amount of dividend transfers that can impact on central government net borrowing in the financial year ending March 2019 (April 2018 to March 2019). So far in this financial year-to-date (April to October 2018), £8.1 billion in dividends have transferred from the BEAPFF to HM Treasury, compared with £9.1 billion in the same period last year.

5 | P a g e
4. How much is the public sector borrowing? In October 2018, the public sector spent more money than it received in taxes and other income. This meant it had to borrow £8.8 billion; that is, £1.6 billion more than the same period in October 2017. This was the highest October borrowing for three years. Of this £8.8 billion, £7.0 billion was borrowed by central government and £1.9 billion by the Bank of England. Central government receipts in October 2018 increased by 1.2% compared with October 2017, to £59.9 billion; while total expenditure increased by 7.7% to £65.4 billion. Much of this annual growth in central government receipts in October 2018 came from Value Added Tax (VAT), Income Tax and tobacco duties; while interest and dividend receipts (largely dividend transfers from the Bank of England Asset Purchase Facility Fund) (BEAPFF) have fallen on October 2017. If we were to exclude the £2.8 billion dividend transfer from the BEAPFF to HM Treasury, then central government net borrowing in October 2018 would have been £9.8 billion, a £2.7 billion growth on October 2017, while the the Bank of England would have recorded a net surplus borrowing of £0.9 billion, £0.3 billion less of a surplus than in October 2017. This month, much of the increase in spending was in the current account, with notable growth in both the expenditure on goods and services as well as net social benefits. Over the same period, interest payments on the government’s outstanding debt have increased; due largely to movements in the Retail Prices Index to which index-linked bonds are pegged. Current transfers from central to local government increased by £0.7 billion compared with October 2017. As with other such transfers, central government net borrowing increased by an amount equivalent to the transfer, while the net borrowing of local government reduced by an equal and offsetting amount, with no impact at a public sector borrowing level.

6 | P a g e
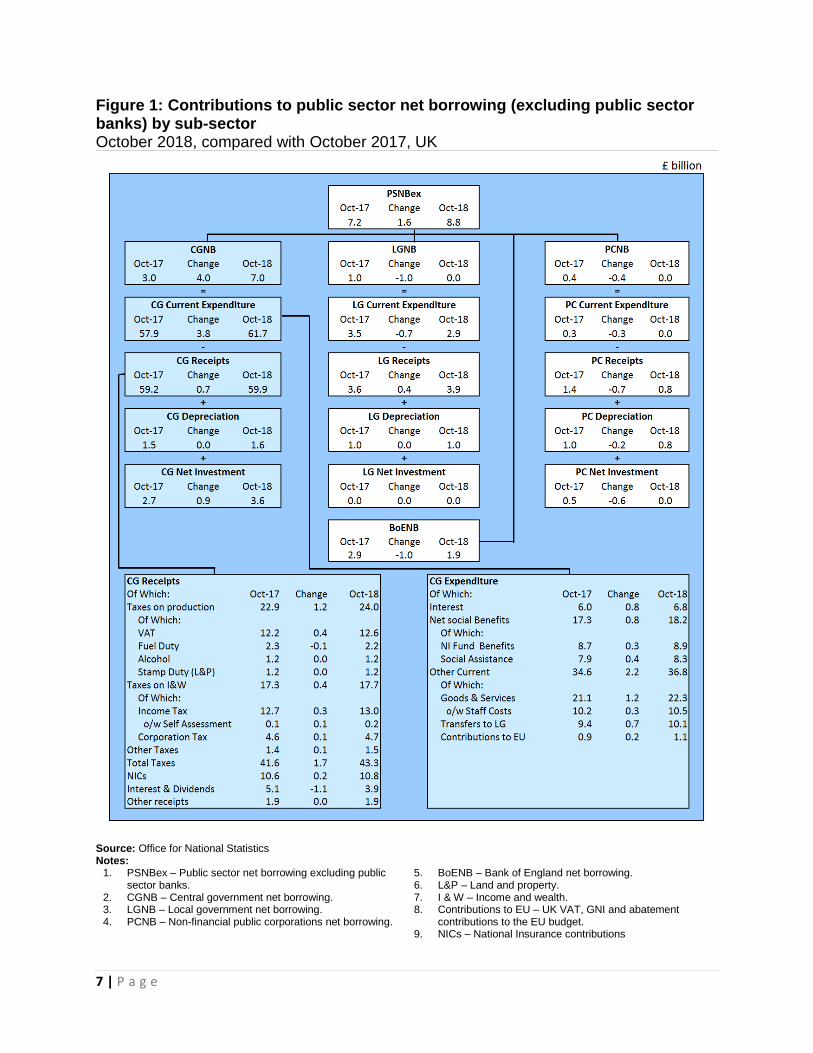
Figure 1 summarises public sector borrowing by sub-sector in October 2018 and
compares this with the equivalent measures in the same month a year earlier (October
2017). This presentation splits public sector net borrowing excluding public sector banks
(PSNB ex) into each of its four sub-sectors: central government, local government,
public corporations and Bank of England.
While local government data for October 2018 are based on budget forecasts for
England, Wales and Scotland, public corporations data remain initial estimates, with
most components calculated by Office for National Statistics (ONS) based on Office for
Budget Responsibility (OBR) forecasts. In both cases, additional administrative source
data are used to estimate transfers to each of these sectors from central government.
7 | P a g e
Figure 1: Contributions to public sector net borrowing (excluding public sector banks) by sub-sector October 2018, compared with October 2017, UK
Source: Office for National Statistics Notes:
1. PSNBex – Public sector net borrowing excluding public sector banks.
2. CGNB – Central government net borrowing. 3. LGNB – Local government net borrowing. 4. PCNB – Non-financial public corporations net borrowing.
5. BoENB – Bank of England net borrowing. 6. L&P – Land and property. 7. I & W – Income and wealth. 8. Contributions to EU – UK VAT, GNI and abatement
contributions to the EU budget. 9. NICs – National Insurance contributions

8 | P a g e
Due to the volatility of the monthly data, the cumulative financial year-to-date borrowing
figures often provide a better indication of the position of the public finances than the
individual months.
In the financial year-to-date (YTD) (April to October 2018), public sector spending
exceeded the money that it received in taxes and other income. This meant it had to
borrow £26.7 billion; that is, £11.2 billion less than the same period in 2017. Borrowing
so far this financial year was the lowest for any April to October period for 13 years.
Of this £26.7 billion borrowed by the public sector in this period, £8.9 billion related to
the cost of the “day-to-day” activities of the public sector (the current budget deficit),
while £17.8 billion was capital spending (or net investment), such as on infrastructure.
Figure 2 presents both monthly and cumulative public sector net borrowing (excluding public sector banks) in the current financial YTD (April to October 2018) and compares these with the previous financial year. Figure 2: Public sector net borrowing (excluding public sector banks) Cumulative financial year-to-date (April to October 2018) compared with the FYE March 2018 (April 2017 to March 2018), UK
Source: Office for National Statistics Notes: 1. OBR forecast for public sector net borrowing excluding public sector banks from October 2018 Economic and Fiscal Outlook
(EFO).

9 | P a g e
Figure 3 summarises the contributions of each sub-sector to public sector net borrowing
(excluding public sector banks) in the current financial YTD (April to October 2018) and
compares these with the same period in the previous financial year.
The difference between central government's income and spending makes the largest
contribution to the amount borrowed by the public sector. In the latest financial YTD
(April to October 2018), of the £26.7 billion borrowed by the public sector, £29.8 billion
was borrowed by central government, while local government was in surplus by £4.9
billion.
In the current financial YTD, central government received £413.6 billion in income,
including £309.4 billion in taxes. This was around 4% more than in the same period in
2017.
Over the same period, central government spent £432.6 billion, around 3% more than in
the same period in 2017. Of this amount, just below two-thirds was spent by central
government departments (such as health, education and defence), around one-third on
social benefits (such as pensions, unemployment payments, Child Benefit and Maternity
Pay), with the remaining being spent on capital investment and interest on
government’s outstanding debt.

10 | P a g e
Figure 3: Contributions to public sector net borrowing (excluding public sector banks) by sub-sector Current financial year-to-date (April to October 2018) compared with the same period last year, UK
Source: Office for National Statistics Notes:
1. PSNBex – Public sector net borrowing excluding public sector banks.
2. CGNB – Central government net borrowing. 3. LGNB – Local government net borrowing. 4. PCNB – Non-financial public corporations net borrowing.
5. BoENB – Bank of England net borrowing. 6. L&P – Land and property. 7. I & W – Income and wealth. 8. Contributions to EU – UK VAT, GNI and abatement
contributions to the EU budget. 9. NICs – National Insurance contributions

11 | P a g e
Figure 4 illustrates that annual borrowing has been generally falling since the peak in the financial year ending (FYE) March 2010 (April 2009 to March 2010). In the latest full financial year (April 2017 to March 2018), the £40.1 billion (or 1.9% of
gross domestic product (GDP)) borrowed by the public sector was around one-quarter
of PSNB ex in the FYE March 2010, when borrowing was £153.1 billion (or 9.9% of
GDP).
Figure 4: Public sector net borrowing (excluding public sector banks)
April 1993 to October 2018, UK
Source: Office for National Statistics Notes: 1. Financial year 2017/18 represents the financial year ending 2018 (April 2017 to March 2018). 2. Office for Budget Responsibility (OBR) full financial year forecast of £25.5 billion for public sector net borrowing excluding
public sector banks (October 2018 Economic and Fiscal Outlook). 3. Ytd equals year-to-date (April to October).

12 | P a g e
5. How much does the public sector owe? Public sector net debt (PSND ex) represents the amount of money the public sector
owes to private sector organisations (including overseas institutions), that has built up
by successive government administrations over many years.
When the government borrows, this normally adds to the debt total, but it is important to
remember that reducing the deficit is not the same as reducing the debt.
At the end of October 2018, the amount of money owed by the public sector to the
private sector stood at around £1.8 trillion (Figure 5), which equates to 84.0% of the
value of all the goods and services currently produced by the UK economy in a year (or
gross domestic product (GDP)).
Figure 5: Public sector net debt (excluding public sector banks)
March 1994 to the end of October 2018, UK
Source: Office for National Statistics Notes:
1. Includes Asset Purchase Facility (APF), which includes the Term Funding Scheme (TFS).
2. Public sector net debt excluding public sector banks (PSND ex) is the combination of PSND ex Bank of England (BoE) plus BoE contribution to PSND ex.

13 | P a g e
The introduction of the Term Funding Scheme (TFS) in September 2016 led to an increase in net debt, as the loans provided under the scheme are not liquid assets and therefore do not net off in public sector net debt (against the liabilities incurred in providing the loans). Since October 2017, the net debt associated with the Bank of England (BoE) increased
by £35.4 billion to £193.1 billion. Nearly all of this growth was due to the activities of the
Asset Purchase Facility Fund, of which the TFS is a part.
The TFS closed for drawdowns of further loans on 28 February 2018 with a loan liability
of £127.0 billion. The TFS loan liability at the end of October 2018 was £126.4 billion.
If we were to exclude the activities of the BoE in the estimation of public sector net debt
(excluding public sector banks), it would reduce by £193.1 billion, from £1,791.6 billion
to £1,598.5 billion, or from 84.0% of GDP to 75.0%.
Figure 6 breaks down outstanding public sector net debt at the end of October 2018 into
the sub-sectors of the public sector. In addition to public sector net debt excluding public
sector banks (PSND ex), this presentation includes the effect of public sector banks on
debt.

14 | P a g e
Figure 6: Contributions to public sector net debt by sub-sector at the end of
October 2018, UK
Source: Office for National Statistics Notes: 1. PSND – Public sector net debt. 2. PSBsND – Public sector banks net debt. 3. PSNDex – Public sector net debt excluding public sector banks. 4. BoEND – Bank of England's contribution to net debt. 5. PSND ex less BoE – Public sector net debt excluding both public sector banks and Bank of England. 6. NFPCND – Non-financial public corporations' net debt. 7. GGND – General government net debt.
Figure 7 incorporates the borrowing components detailed in Figure 2 to illustrate how the differences between income and spending (both current and capital) have led to the accumulation of debt in the current financial year-to-date (April to October 2018). The reconciliation between public sector net borrowing and net cash requirement is presented in more detail in Table REC1 in the Public sector finances Tables 1 to 10: Appendix A dataset.

15 | P a g e
Figure 7: Components of net debt How the differences in expenditure and receipts affect public sector net debt (excluding public sector banks), UK
Source: Office for National Statistics Notes: 1. Cash transactions in (non-financing) financial assets, which do not impact on net borrowing. 2. Timing differences between cash and accrued data. 3. Revaluation of foreign currency debt (for example, foreign currency). Debt issuances or redemptions above or below debt valuation (for example, bond premia and discounts and capital uplifts). Changes in volume of debt not due to transactions (for example, sector reclassification).

16 | P a g e
6. Revisions since previous release
Revisions can be the result of both updated data sources and methodology changes.
This month, revisions to net borrowing are as a result of updated data sources only.
It is important to note that revisions do not occur as a result of errors; errors lead to
corrections and are identified as such when they occur. This month we have no errors
to report.
Table 1 presents the revisions to the headline statistics presented in this bulletin compared with those presented in the previous publication (published on 19 October 2018). Table 1: Revisions to main aggregates
Revisions since the previous public sector finances bulletin (published 19 October 2018), UK
£ billion1 (not seasonally adjusted)
Net borrowing
Period CG2 LG3 NFPCs4 BoE5 PSNB
ex6 PSND
ex7
PSND % of GDP
PSNCR ex8
2015/16 0.0 0.0 0.0 0.0 0.0 0.0 0.0 0.0
2016/17 0.0 0.0 0.0 0.0 0.0 0.0 0.0 0.0
2017/18 0.2 0.0 0.0 0.0 0.2 0.0 -0.1 0.0
2018/19 YTD -2.0 0.0 0.0 0.0 -2.0 0.1 -0.1 0.1
2018 April 0.1 0.0 0.0 0.0 0.1 0.3 0.0 0.0
2018 May 0.0 0.0 0.0 0.0 0.0 0.2 0.0 0.0
2018 June -0.2 0.0 0.0 0.0 -0.2 0.2 0.0 0.0
2018 July -0.3 0.0 0.0 0.0 -0.3 0.2 0.0 0.0
2018 August -0.4 0.0 0.0 0.0 -0.4 -0.3 -0.1 -0.3 2018 September -1.3 0.0 0.0 0.0 -1.3 0.1 -0.1 0.5
Source: Office for National Statistics Notes: 1. Unless otherwise stated. 2. Central government. 3. Local government. 4. Non-financial public corporations. 5. Bank of England. 6. Public sector net borrowing excluding public sector banks. 7. Public sector net debt excluding public sector banks.
8. Public sector net cash requirement excluding public sector banks. 9. 2017/18 represents financial year ending 2018 (April 2017 to March 2018). 10. 2018/19 YTD refers to the current financial year-to-date (April to September 2018).

17 | P a g e
Revisions to public sector net borrowing (excluding public sector banks) in the
current financial year-to-date (April to September 2018)
The data for the latest month of every release contain some forecast data. The initial outturn estimates for the early months of the financial year, particularly April, contain more forecast data than other months, as profiles of tax receipts, along with departmental and local government spending are still provisional. This means that the data for these months are typically more prone to revision than other months and can be subject to sizeable revisions in later months. Public sector net borrowing excluding public sector banks (PSNB ex) has been revised down by £2.0 billion compared with figures presented in the previous bulletin (published on 19 October 2018), almost entirely due to new data received in the central government account. The estimate of central government receipts for the period April to September 2018 increased by £1.3 billion; with tax receipts increasing by £0.5 billion and National Insurance contributions increasing by £0.8 billion. Over the same period, estimates for central government current expenditure reduced by £0.5 billion; due largely to a decrease in expenditure on goods and services. Capital expenditure (net investment) reduced by £0.2 billion, with reductions to previous estimates of gross capital formation and transfers from central government to the private sector. Figure 8 breaks down this revision to PSNB ex by each of its four sub-sectors: central
government, local government, non-financial public corporations and Bank of England
(BoE).

18 | P a g e
Figure 8: Revisions to net borrowing
Latest data covering April to September 2018, compared with that presented in the
previous bulletin (19 October 2018), UK
Source: Office for National Statistics
19 | P a g e
Notes: 1. PSNBex – Public sector net borrowing excluding public
sector banks. 2. CGNB – Central government net borrowing. 3. LGNB – Local government net borrowing. 4. PCNB – Non-financial public corporations net borrowing.
5. BoENB – Bank of England net borrowing. 6. L&P – Land and property. 7. I & W – Income and wealth. 8. Contributions to EU – UK VAT, GNI and abatement
contributions to the EU budget. 9. NICs – National Insurance contributions
Revisions to public sector net borrowing (excluding public sector banks) in the
financial year ending March 2018
Since the last publication (19 October 2018), estimates of public sector net borrowing for the financial year ending (FYE) March 2018 have increased by £0.2 billion. Estimates of central government receipts have decreased by £0.2 billion; due largely to a £0.2 billion reduction to the estimate of Corporation Tax. Revisions to public sector net debt including public sector banks
This month we received updated public sector banks’ balance sheet data covering the period January to June 2018. These data have enabled us to update previous estimates of the net cash requirement and net debt associated with public sector banks. Further, estimates covering the period July 2018 to date have been updated to reflect this new information. As a consequence of receiving these data, our estimate of public sector net cash requirement including public sector banks for the financial year ending March 2018 (April 2017 to March 2018) has been increased by £6.0 billion; while our estimate of public sector net debt including public sector banks at the end of September 2018 has increased by £15.5 billion.

20 | P a g e
7. How do our figures compare with official forecasts?
The independent Office for Budget Responsibility (OBR) is responsible for the production of official forecasts for government. These forecasts are usually produced twice a year; spring and autumn.
The OBR forecasts used in this bulletin are based on those published in its Economic and Fiscal Outlook – October 2018.
Table 2 compares the current outturn estimates for each of our main public sector (excluding public sector banks) aggregates for the latest full financial year with corresponding OBR forecasts for the following financial year. Further, it compares the current financial year-to-date (April to October 2018) outturn estimates with those of the previous financial year.
Caution should be taken when comparing public sector finances data with OBR figures for the full financial year. Data are not finalised until some time after the financial year ends, with initial estimates made soon after the end of the financial year often subject to sizeable revisions in later months as forecasts are replaced with audited outturn data.
There may also be known methodological differences between OBR forecasts and outturn data.

21 | P a g e
Table 2: Latest outturn estimates compared with Office for Budget Responsibility forecasts Office for Budget Responsibility (OBR) forecasts in the current financial year-to-date (April to October 2018) compared with the latest full financial year (April 2017 to March 2018), UK
Excluding public sector banks £ billion1 (not seasonally adjusted)
Financial year-to-date7 Full financial year8
2017/18 2018/19 %
change 2017/18 Outturn
2018/19 OBR
Forecast9
% change
Current budget deficit2 17.9 8.9 -50.3 -1.2 15.7 -1,411.5
Net investment3 20.0 17.8 -11.1 41.2 41.2 0.0
Net borrowing 4 37.9 26.7 -29.6 40.1 25.5 -36.5
Net debt 5 1,789.7 1,791.6 0.1 1,778.9 1,810.1 1.8 Net debt as a percentage of GDP6 86.7 84.0 NA 85.0 83.7 NA
Office for National Statistics Notes 1. Unless otherwise stated. 2. Current budget deficit is the difference between current expenditure (including depreciation) and current receipts. 3. Net investment is gross investment (net capital formation plus net capital transfers) less depreciation. 4. Net borrowing is current budget deficit plus net investment. 5. Net debt is financial liabilities (for loans, deposits, currency and debt securities) less liquid assets. 6. Gross domestic product (GDP) at current market price. 7. Financial year-to-date refers to the period from April to October. 8. 2018/19 refers to financial year ending in March 2019 and 2017/18 refers to financial year ending in March 2018. 9. All OBR figures are from the OBR Economic and Fiscal Outlook published in October 2018. 10. NA means “not applicable”.

22 | P a g e
8. International comparisons of borrowing and debt
The UK government debt and deficit statistical bulletin is published quarterly (in January, April, July and December each year), to coincide with when the UK and other EU member states are required to report on their deficit (or net borrowing) and debt to the European Commission.
On 19 October 2018, we published UK government debt and deficit: June 2018, consistent with Public sector finances, UK: August 2018 (published on 21 September 2018). In this publication we stated that:
• general government gross debt was £1,763.8 billion at the end of March 2018, equivalent to 85.6% of gross domestic product (GDP); 25.6 percentage points above the Maastricht reference value of 60.0%
• general government deficit (or net borrowing) was £41.0 billion in the financial year ending (FYE) March 2018, equivalent to 2.0% of GDP; 1.0 percentage point below the Maastricht reference value of 3.0%
This bulletin presents an upward revision to general government deficit in the FYE March 2018 of £0.2 billion, to £41.2 billion, compared with that published on 19 October 2018; while the estimate of general government gross debt remains unchanged at £1,763.8 billion.
The UK general government debt and deficit data we published on 19 October 2018 was published by Eurostat on 22 October 2018 (PDF, 548KB) in context with the other 27 EU member states.
It is important to note that the GDP measure, used as the denominator in the calculation of the debt ratios in the UK government debt and deficit statistical bulletin, differs from that used within the Public sector finances statistical bulletin.

23 | P a g e
9. Quality and methodology The public sector finances Quality and Methodology Information (QMI) report contains
important information on:
• the strengths and limitations of the data and how it compares with related data
• uses and users of the data
• how the output was created
• the quality of the output including the accuracy of the data
The public sector finances methodological guide provides a comprehensive contextual
and methodological information concerning the monthly Public sector finances statistical
bulletin.
The guide sets out the conceptual and fiscal policy context for the bulletin, identifies the
main fiscal measures and explains how these are derived and inter-related. Additionally,
it details the data sources used to compile the monthly estimates of the fiscal position.
Local government forecasts
In recent years, planned expenditure initially reported in local authority budgets has
systematically been higher than the final outturn expenditure reported in the audited
accounts. We therefore include adjustments to reduce the amounts reported at the
budget stage. Further information on these and additional adjustments can be found in
the public sector finances methodological guide.

24 | P a g e
10. Looking ahead This section presents information on aspects of data or methodology that are planned but not yet included in the public sector finances. Further, in our article Looking ahead: developments in public sector finance statistics,
we provide users with early sight of those areas where the fiscal statistics may be
significantly impacted upon by methodological or classification changes during the
coming 24 months.
Fines and penalties
We are currently investigating our recording of fines and penalties for the late payment
of taxes to HM Revenue and Customs (HMRC).
Any additional revenue identified and recorded by the inclusion of such payments will
increase central government receipts and so reduce public sector net borrowing.
Based on our ongoing investigation, we expect borrowing to reduce by around £0.7
billion in the financial year ending (FYE) March 2018 due to this revenue increase. We
will introduce these changes at the earliest opportunity.
Any revisions to fines and penalties data for periods prior to FYE March 2018 will be
implemented at a future point once further investigations are concluded.
The treatment of student loans in the public sector finances
Office for National Statistics (ONS) announced on 24 April 2018 that it would review the treatment of student loans in the UK government’s accounts. This is to ensure that the way these loans are treated reflects how the system works in practice as well as being in line with international best practice. This review followed recommendations from both the Treasury Select Committee and the House of Lords Economic Affairs Committee (PDF, 1.6MB).
ONS will announce its decision on how these loans will be treated on 17 December 2018. However, it is anticipated that implementation of this decision into its headline statistics will take some time and that any change will be reflected in the public sector finances by the end of 2019.
Further information on the review can be found in the July Developments in Public Sector Finances article.

25 | P a g e
The treatment of pensions in the public sector finances
On 31 August 2018, our consultation concerning the treatment of pensions within the public sector finances closed.
Having carefully considered the responses to the consultation, we have decided to
implement each of the three recommendations made by the Public Sector Finances
Technical Advisory Group, namely:
• to include assets and liabilities of the funded public sector employment-related
pension schemes in the ex- (and consequently in the inc-) measures
• to record the Pension Protection Fund in the ex- (and consequently in the inc-)
boundary
• to report obligations of the unfunded public sector pension schemes, both
employment-related and those that cover the wider population, in a supplementary
table published alongside the main PSF presentation, but not in either the inc- or the
ex-measures
The work on implementing these recommendations has commenced and we expect it to
be completed by the end of 2019. We intend to announce the exact implementation date
in the Public sector finances (PSF) statistical bulletin, and provide estimates of the
expected impact in advance of the implementation. It should be noted that there is a
considerable time lag in the availability of outturn data on pension fund assets and
actuarial liabilities, which can exceed three years for some pension schemes. This may
lead to revisions to historic fiscal aggregates once the modelled estimates are replaced
with the outturn data.
We would like to thank respondents for their time and effort in responding to the
consultation.
The sale of railway arches On 11 September 2018, Network Rail announced they had agreed terms for the sale of
its Commercial Estate business in England and Wales, the majority of the properties in
which are railway arches. We are currently investigating the nature of the transaction in
order to ensure that the impacts will be fully reflected in the public sector finances.

26 | P a g e
East Coast Mainline
On 16 May 2018, the government announced that from 24 June 2018, London North Eastern Railway (LNER) will take over the running of East Coast Mainline services. On 31 August 2018, we announced that LNER would be classified to the public non-financial corporations sub-sector, effective from 14 February 2018. We are currently investigating the implications of this decision and our conclusions will be announced in due course. Recent announcements concerning the Term Funding Scheme On 21 June 2018, the government published a new Memorandum of Understanding between HM Treasury and the Bank of England (BoE), which sets out the financial relationship between the two institutions. This memorandum announced that during the current financial year (April 2018 to
March 2019), the £127 billion liabilities of the Term Funding Scheme (TFS ) (PDF,
1.4MB) will be transferred from the Bank of England Asset Purchase Facility Fund
(APF) to the BoE’s own balance sheet and that the HM Treasury indemnity for it was
being removed.
TFS was introduced in 2016, as a quantitative easing measure under the APF umbrella,
to enable financial institutions to cut the time in passing on interest rate reductions to
consumers and businesses.
This change will have no impact on public sector net debt (both including and excluding
public sector banks).
Further, to enable the BoE to take TFS on balance sheet without an indemnity from the
Treasury, a capital injection of £1.2 billion from HM Treasury to the BoE has been
announced. The nature of the capital injection will be formally discussed at a
classifications meeting and announced in due course.
EU withdrawal agreement
Although the Office for Budget Responsibility (OBR) discusses the EU settlement in
Annex B (PDF, 2.5MB) of their Economic and Fiscal Outlook - March 2018, the details
in the report are still subject to negotiation and so there is insufficient certainty at this
stage for us to complete a formal assessment of impact on the UK public sector
finances.

27 | P a g e
Carillion insolvency
Following Carillion Plc declaring insolvency on 15 January 2018, the UK government
announced that it will provide the necessary funding required by the Official Receiver, to
ensure continuity of public services through an orderly liquidation. The Official Receiver
has been appointed by the court as liquidator, along with partners at PwC that have
been appointed Special Managers. The defined benefit pension schemes of former
Carillion employees are currently being assessed by the Pension Protection Fund (PPF)
prior to any transition into the PPF scheme.
We are currently investigating the various impacts of the liquidation of Carillion on the
public sector finances, including in relation to the public-private partnership projects in
which Carillion was involved and the additional funding that the government has
provided in order to maintain public services. We will announce our findings in due
course.
Prior to liquidation, Carillion held approximately 450 contracts with government,
representing 38% of Carillion’s 2016 reported revenue.
Housing associations
Following the reclassification of Welsh housing associations from the public to private
sector in September 2018, only housing associations in Northern Ireland remain
classified within the public sector. The Department for Communities Northern Ireland
launched a consultation on the future of House Sales Schemes in Northern Ireland,
running between 3 July and 24 September 2018. We will review the classification of
housing associations in Northern Ireland at an appropriate time based on the outcomes
of this consultation.

28 | P a g e
11. Links to data and related publications
Time series data
All data contained within these publications are available to download via the public sector finances time series dataset. From April 1997 to date, where available, time series are presented as monthly data, with series extending further back in time, generally presented on a quarterly or financial year basis. Time series exclusive to the public sector finances borrowing by sub-sector presentation are only available as quarterly time series, though these extend back to 1946.
Supporting documentation
Documentation supporting this publication is available in appendices to the bulletin:
• Public sector finances Tables 1 to 10: Appendix A
• Large impacts on public sector fiscal measures excluding banking groups: Appendix
B
• Public sector finances revisions analysis on main fiscal aggregates: Appendix C
• Public sector current receipts: Appendix D
• Impact of the reclassification of housing associations into the public sector: Appendix
E
• Revisions to the first reported estimate of public sector net borrowing: Appendix F
Public sector borrowing by sub-sector
Each month, at 9:30am on the working day following the Public sector finances
statistical bulletin, we publish Public sector finances borrowing by sub-sector .This
release contains an extended breakdown of public sector borrowing in a matrix format
and also estimates of total managed expenditure (TME).

PSA1 Public Sector Summary
£ million unless otherwise stated
Excluding public sector banks
Net Debt Net Debtexcluding excluding
Current Bank of Bank ofBudget Net England (£ England as a Net Debt Net Debt as a Net Debt Net Debt as aDeficit Investment Net Borrowing billion) % GDP1 (£ billion) % GDP1 Net Borrowing (£ billion) % GDP
1 2 3 4 5 6 7 8 9 10
-JW2T -JW2Z -J5II CPPH CPOA HF6W HF6X -ANNX RUTN RUTO2009 99 729 55 819 155 548 925.8 59.3 940.3 60.2 128 124 2 316.9 148.42010 95 342 47 456 142 798 1 131.5 69.9 1 138.4 70.3 127 906 2 322.2 143.52011 78 463 38 607 117 070 1 244.6 74.9 1 242.4 74.8 95 434 2 303.0 138.72012 84 674 42 805 127 479 1 336.5 77.3 1 350.7 78.2 113 887 2 265.6 131.12013 71 303 28 470 99 773 1 410.3 78.1 1 453.3 80.4 90 905 2 288.0 126.6
2014 61 781 35 245 97 026 1 513.4 81.0 1 556.5 83.3 88 528 1 868.7 100.02015 41 055 36 363 77 418 1 565.8 81.1 1 608.9 83.4 70 854 1 897.6 98.32016 20 394 36 191 56 585 1 618.2 80.6 1 697.2 84.5 48 801 1 996.8 99.52017 −3 465 41 258 37 793 1 592.1 76.7 1 760.3 84.8 22 945 2 027.7 97.7
2009/10 100 455 52 680 153 135 999.5 63.5 1 011.9 64.3 131 037 2 300.8 146.32010/11 91 085 45 733 136 818 1 153.0 70.7 1 157.6 71.0 118 143 2 318.3 142.22011/12 80 692 35 981 116 673 1 258.6 75.0 1 253.1 74.7 98 033 2 247.2 134.02012/13 81 455 39 335 120 790 1 341.3 76.9 1 363.6 78.2 108 796 2 276.4 130.62013/14 67 524 30 695 98 219 1 422.6 77.9 1 464.4 80.2 89 429 2 037.5 111.5
2014/15 53 878 36 614 90 492 1 512.8 80.4 1 554.7 82.6 82 102 1 858.0 98.82015/16 38 386 34 074 72 460 1 560.7 80.1 1 602.6 82.3 65 535 1 906.5 97.92016/17 7 054 38 472 45 526 1 607.9 79.4 1 726.7 85.2 35 074 2 019.7 99.72017/18 −1 185 41 237 40 052 1 589.4 76.0 1 778.9 85.0 27 444 2 054.0 98.2
2015 Q2 18 713 6 047 24 760 1 537.5 81.1 1 580.7 83.4 22 957 1 875.2 98.9Q3 11 018 7 511 18 529 1 548.0 80.9 1 589.6 83.1 17 050 1 881.2 98.4Q4 20 821 8 036 28 857 1 565.8 81.1 1 608.9 83.4 27 378 1 897.6 98.3
2016 Q1 −12 166 12 480 314 1 560.7 80.1 1 602.6 82.3 −1 850 1 906.5 97.9Q2 14 724 6 254 20 978 1 581.5 80.3 1 624.9 82.5 18 814 1 944.1 98.7Q3 5 269 8 642 13 911 1 592.8 80.1 1 640.0 82.4 12 183 1 949.4 98.0Q4 12 567 8 815 21 382 1 618.2 80.6 1 697.2 84.5 19 654 1 996.8 99.5
2017 Q1 −25 506 14 761 −10 745 1 607.9 79.4 1 726.7 85.2 −15 577 2 019.7 99.7Q2 14 344 7 833 22 177 1 624.3 79.4 1 759.3 86.1 17 345 2 045.8 100.1Q3 −395 8 879 8 484 1 637.4 79.5 1 786.1 86.7 5 892 2 063.1 100.1Q4 8 092 9 785 17 877 1 592.1 76.7 1 760.3 84.8 15 285 2 027.7 97.7
2018 Q1 −23 226 14 740 −8 486 1 589.4 76.0 1 778.9 85.0 −11 078 2 054.0 98.2Q2 7 227 6 408 13 635 1 599.2 75.8 1 790.3 84.9 11 043 2 073.2 98.3Q3 −3 534 7 772 4 238 1 599.5 75.2 1 789.6 84.2 1 646 2 072.5 97.5
2016 Oct 4 727 2 760 7 487 1 586.2 79.5 1 642.6 82.3 6 911 1 948.7 97.7Nov 6 345 2 509 8 854 1 598.0 79.8 1 662.6 83.1 8 278 1 965.5 98.2Dec 1 495 3 546 5 041 1 618.2 80.6 1 697.2 84.5 4 465 1 996.8 99.5
2017 Jan −15 738 4 087 −11 651 1 584.9 78.7 1 681.1 83.5 −13 262 1 978.5 98.2Feb −5 215 4 009 −1 206 1 587.0 78.6 1 694.5 83.9 −2 817 1 989.8 98.5Mar −4 553 6 665 2 112 1 607.9 79.4 1 726.7 85.2 502 2 019.7 99.7Apr 7 063 1 908 8 971 1 593.6 78.4 1 720.3 84.6 7 360 2 011.1 99.0May 4 270 2 695 6 965 1 604.2 78.7 1 736.7 85.2 5 354 2 025.3 99.4Jun 3 011 3 230 6 241 1 624.3 79.4 1 759.3 86.1 4 631 2 045.8 100.1
Jul −4 084 3 218 −866 1 615.2 78.8 1 760.0 85.9 −1 730 2 043.3 99.7Aug 1 648 2 721 4 369 1 617.4 78.7 1 766.0 85.9 3 505 2 046.1 99.6Sep 2 041 2 940 4 981 1 637.4 79.5 1 786.1 86.7 4 117 2 063.1 100.1Oct 3 925 3 310 7 235 1 632.1 79.0 1 789.7 86.7 6 371 2 063.5 99.9Nov 5 134 2 894 8 028 1 575.0 76.1 1 735.8 83.9 7 164 2 006.4 96.9Dec −967 3 581 2 614 1 592.1 76.7 1 760.3 84.8 1 750 2 027.7 97.7
2018 Jan −13 615 3 997 −9 618 1 569.8 75.5 1 741.5 83.7 −10 482 2 011.6 96.7Feb −3 376 4 409 1 033 1 570.5 75.3 1 762.8 84.5 169 2 035.4 97.6Mar −6 235 6 334 99 1 589.4 76.0 1 778.9 85.0 −765 2 054.0 98.2Apr 3 609 2 229 5 838 1 583.1 75.5 1 777.1 84.7 4 974 2 054.8 98.0May 2 708 1 641 4 349 1 586.9 75.5 1 780.9 84.7 3 485 2 061.2 98.0Jun 910 2 538 3 448 1 599.2 75.8 1 790.3 84.9 2 584 2 073.2 98.3
Jul −5 919 2 040 −3 879 1 583.5 74.9 1 776.4 84.0 −4 743 2 059.2 97.4Aug 2 450 2 822 5 272 1 588.5 74.9 1 781.7 84.0 4 408 2 064.6 97.4Sep −65 2 910 2 845 1 599.5 75.2 1 789.6 84.2 1 981 2 072.5 97.5Oct 5 195 3 625 8 820 1 598.5 75.0 1 791.6 84.0 7 956 2 074.5 97.3
Relationship between columns : 3=1+21 12 month centred moving total

PSA2 Public Sector Net Borrowing : by sector
£ million
Net Borrowing
Public SectorGeneral excluding both Public Sector
government public sector Bank of England excludingCentral Local (Maastr icht Non-financial banks and BoE4 (including APF1 public sector Public sector Public Sector
government government Deficit) PCs (PSNB ex BoE) & SLS2 )3 banks (PSNB ex) banks (PSNB)
1 2 3 4 5 6 7 8 9
-NMFJ -NMOE -NNBK -CPCM -CPNZ -JW2H -J5II -IL6B -ANNX2009 146 822 8 130 154 952 5 284 160 236 −4 688 155 548 −27 424 128 1242010 144 874 2 624 147 498 3 402 150 900 −8 102 142 798 −14 892 127 9062011 119 673 3 586 123 259 2 064 125 323 −8 253 117 070 −21 636 95 4342012 129 631 7 599 137 230 −473 136 757 −9 278 127 479 −13 592 113 8872013 92 324 2 218 94 542 −685 93 857 5 916 99 773 −8 868 90 905
2014 101 276 −2 080 99 196 1 652 100 848 −3 822 97 026 −8 498 88 5282015 78 937 1 242 80 179 547 80 726 −3 308 77 418 −6 564 70 8542016 51 463 6 319 57 782 1 449 59 231 −2 646 56 585 −7 784 48 8012017 29 849 7 346 37 195 3 519 40 714 −2 921 37 793 −14 848 22 945
2009/10 148 705 6 244 154 949 4 674 159 623 −6 488 153 135 −22 098 131 0372010/11 137 723 3 951 141 674 3 113 144 787 −7 969 136 818 −18 675 118 1432011/12 114 443 9 573 124 016 1 615 125 631 −8 958 116 673 −18 640 98 0332012/13 124 014 −38 123 976 205 124 181 −3 391 120 790 −11 994 108 7962013/14 101 182 −1 284 99 898 −1 226 98 672 −453 98 219 −8 790 89 429
2014/15 89 644 279 89 923 2 294 92 217 −1 725 90 492 −8 390 82 1022015/16 72 237 3 222 75 459 265 75 724 −3 264 72 460 −6 925 65 5352016/17 39 816 7 175 46 991 1 676 48 667 −3 141 45 526 −10 452 35 0742017/18 34 589 6 562 41 151 3 216 44 367 −4 315 40 052 −12 608 27 444
2015 Q2 30 449 −6 572 23 877 85 23 962 798 24 760 −1 803 22 957Q3 17 915 2 826 20 741 118 20 859 −2 330 18 529 −1 479 17 050Q4 27 266 2 196 29 462 129 29 591 −734 28 857 −1 479 27 378
2016 Q1 −3 393 4 772 1 379 −67 1 312 −998 314 −2 164 −1 850Q2 24 765 −5 197 19 568 612 20 180 798 20 978 −2 164 18 814Q3 12 124 3 329 15 453 523 15 976 −2 065 13 911 −1 728 12 183Q4 17 967 3 415 21 382 381 21 763 −381 21 382 −1 728 19 654
2017 Q1 −15 040 5 628 −9 412 160 −9 252 −1 493 −10 745 −4 832 −15 577Q2 26 131 −6 090 20 041 1 490 21 531 646 22 177 −4 832 17 345Q3 6 801 3 142 9 943 1 368 11 311 −2 827 8 484 −2 592 5 892Q4 11 957 4 666 16 623 501 17 124 753 17 877 −2 592 15 285
2018 Q1 −10 300 4 844 −5 456 −143 −5 599 −2 887 −8 486 −2 592 −11 078Q2 17 032 −3 656 13 376 294 13 670 −35 13 635 −2 592 11 043Q3 5 813 −1 254 4 559 208 4 767 −529 4 238 −2 592 1 646
2016 Oct 5 021 394 5 415 140 5 555 1 932 7 487 −576 6 911Nov 8 093 1 753 9 846 149 9 995 −1 141 8 854 −576 8 278Dec 4 853 1 268 6 121 92 6 213 −1 172 5 041 −576 4 465
2017 Jan −14 101 1 473 −12 628 67 −12 561 910 −11 651 −1 611 −13 262Feb −3 301 3 215 −86 66 −20 −1 186 −1 206 −1 611 −2 817Mar 2 362 940 3 302 27 3 329 −1 217 2 112 −1 610 502Apr 8 821 −3 382 5 439 471 5 910 3 061 8 971 −1 611 7 360May 7 712 −67 7 645 511 8 156 −1 191 6 965 −1 611 5 354Jun 9 598 −2 641 6 957 508 7 465 −1 224 6 241 −1 610 4 631
Jul −1 289 461 −828 452 −376 −490 −866 −864 −1 730Aug 3 369 1 700 5 069 462 5 531 −1 162 4 369 −864 3 505Sep 4 721 981 5 702 454 6 156 −1 175 4 981 −864 4 117Oct 2 976 989 3 965 364 4 329 2 906 7 235 −864 6 371Nov 6 746 2 198 8 944 155 9 099 −1 071 8 028 −864 7 164Dec 2 235 1 479 3 714 −18 3 696 −1 082 2 614 −864 1 750
2018 Jan −10 399 1 640 −8 759 −56 −8 815 −803 −9 618 −864 −10 482Feb −1 104 3 222 2 118 −35 2 083 −1 050 1 033 −864 169Mar 1 203 −18 1 185 −52 1 133 −1 034 99 −864 −765Apr 6 724 −2 969 3 755 81 3 836 2 002 5 838 −864 4 974May 5 792 −569 5 223 124 5 347 −998 4 349 −864 3 485Jun 4 516 −118 4 398 89 4 487 −1 039 3 448 −864 2 584
Jul −2 575 −2 631 −5 206 78 −5 128 1 249 −3 879 −864 −4 743Aug 5 039 1 035 6 074 75 6 149 −877 5 272 −864 4 408Sep 3 349 342 3 691 55 3 746 −901 2 845 −864 1 981Oct 6 985 −20 6 965 −12 6 953 1 867 8 820 −864 7 956
Relationship between columns 3=1+2 ; 5=7-6 ; 7=3+4+6 ; 9=7+81 APF = Asset Purchase Facility2 SLS = Special Liquidity Scheme.3 Figures derived from Bank of England accounts and ONS estimates4 Bank of England

PSA3 Public Sector Current Budget Deficit, Net Borrowing andNet Cash Requirement (excluding public sector banks)
£ billion
2003 2004 2005 2006 2007 2008 2009 2010 2011 2012 2013 2014 2015 2016 2017 2018/04 /05 /06 /07 /08 /09 /10 /11 /12 /13 /14 /15 /16 /17 /18 /19
Public sector current budg et deficit excluding public sector banks: cumulative in financial year
Apr il 2.2 3.9 2.4 2.2 2.9 4.7 10.0 6.9 9.8 10.5 8.9 9.4 7.8 7.1 7.1 3.6May 7.0 7.9 5.9 5.9 7.0 10.6 22.8 17.9 18.1 21.9 17.4 18.2 13.5 12.3 11.3 6.3June 9.9 11.1 9.5 8.6 9.9 15.5 33.4 27.5 26.0 29.7 24.7 24.8 18.7 14.7 14.3 7.2July 9.8 11.3 8.7 7.5 8.2 15.8 39.5 32.5 28.1 30.2 26.5 25.9 18.3 12.2 10.3 1.3August 12.1 13.6 10.9 9.4 11.4 21.6 47.8 40.8 35.2 38.4 33.7 32.4 24.5 16.5 11.9 3.8September 14.3 16.4 11.9 12.0 12.8 25.8 56.9 50.1 43.9 46.8 40.6 39.2 29.7 20.0 13.9 3.7October 16.9 19.3 13.8 14.6 16.6 33.1 67.8 60.8 54.3 56.6 50.1 47.5 37.5 24.7 17.9 8.9November 22.0 24.0 20.8 21.4 22.6 44.7 80.8 74.8 65.4 68.6 61.4 55.6 45.4 31.1 23.0 ..December 25.0 27.0 23.6 23.0 25.1 53.3 93.0 87.9 75.3 79.3 69.1 63.4 50.6 32.6 22.0 ..Januar y 21.5 21.5 16.3 13.8 15.0 51.0 94.3 83.1 70.7 73.5 63.5 53.9 38.6 16.8 8.4 ..Febr uary 18.1 19.1 14.3 9.7 12.0 54.3 96.7 86.6 75.9 78.3 67.3 55.1 39.7 11.6 5.1 ..March 15.0 17.3 11.8 7.0 9.0 60.0 100.5 91.1 80.7 81.5 67.5 53.9 38.4 7.1 −1.2 ..
2003 2004 2005 2006 2007 2008 2009 2010 2011 2012 2013 2014 2015 2016 2017 2018/04 /05 /06 /07 /08 /09 /10 /11 /12 /13 /14 /15 /16 /17 /18 /19
Public sector net borrowing excluding public sector banks: cumulative in financial year
Apr il 3.1 7.7 4.4 4.5 3.4 6.4 10.5 8.9 11.5 21.2 10.3 10.7 9.4 9.1 9.0 5.8May 9.4 13.7 8.9 9.6 8.6 14.3 24.2 22.4 21.4 34.6 20.0 21.2 16.9 16.1 15.9 10.2June 13.8 15.8 13.5 13.5 12.9 21.2 40.6 34.6 31.5 44.1 28.8 29.5 24.8 21.0 22.2 13.6July 15.3 18.0 14.5 14.5 13.7 24.6 49.7 43.7 36.1 46.6 32.6 32.9 26.7 21.4 21.3 9.8August 19.4 22.3 18.8 18.1 19.0 33.3 61.4 55.2 45.6 56.7 41.4 41.5 35.4 28.3 25.7 15.0September 23.0 26.5 21.9 22.9 22.3 43.5 74.6 67.9 57.0 67.1 50.4 50.9 43.3 34.9 30.7 17.9October 27.3 31.4 26.4 27.0 28.4 54.3 89.1 82.1 69.7 79.3 61.9 62.2 53.7 42.4 37.9 26.7November 34.3 38.4 36.2 36.0 36.9 69.4 105.7 99.5 83.0 93.6 75.6 73.2 65.0 51.2 45.9 ..December 39.1 43.5 41.6 40.5 42.2 84.7 126.7 116.4 96.6 107.4 86.4 85.2 72.1 56.3 48.5 ..Januar y 38.9 42.2 38.1 34.9 35.5 90.2 132.6 116.0 95.7 105.5 84.4 79.6 63.3 44.6 38.9 ..Febr uary 38.6 44.1 40.1 34.5 37.8 100.2 141.0 124.5 104.8 112.1 92.6 85.0 68.0 43.4 40.0 ..March 38.8 46.1 41.6 38.0 42.9 113.5 153.1 136.8 116.7 120.8 98.2 90.5 72.5 45.5 40.1 ..
2003 2004 2005 2006 2007 2008 2009 2010 2011 2012 2013 2014 2015 2016 2017 2018/04 /05 /06 /07 /08 /09 /10 /11 /12 /13 /14 /15 /16 /17 /18 /19
Public sector net cash requirement excluding public sector banks: cumulative in financial year
Apr il −0.7 −2.0 −2.1 −1.4 −3.6 −0.3 8.9 6.9 2.8 −8.5 −1.8 −2.2 −5.3 −1.6 −12.1 −8.4May 5.1 1.4 3.1 6.2 2.5 11.7 28.0 21.9 13.5 3.1 7.5 11.4 7.9 6.2 3.8 −2.3June 15.3 12.6 15.5 18.9 12.5 26.0 50.8 42.7 33.0 20.7 16.9 27.3 22.5 22.0 24.6 12.4July 9.1 6.0 7.2 8.3 −0.7 13.9 54.0 40.3 26.5 15.0 7.5 22.3 19.2 23.1 23.2 −5.2August 12.6 9.5 12.0 12.0 4.7 25.4 65.8 46.0 37.6 24.4 16.8 26.4 18.0 27.7 25.7 −1.1September 21.1 20.3 24.2 24.4 13.5 65.1 87.3 67.6 56.8 42.9 28.3 45.9 35.1 36.1 39.3 16.6October 19.4 19.1 19.6 15.9 8.9 72.0 95.0 70.2 55.3 47.1 22.4 42.8 33.0 34.9 37.7 12.6November 24.6 28.3 28.5 23.3 18.4 85.9 111.0 87.3 65.3 59.5 34.9 51.0 40.2 52.7 53.1 ..December 37.4 43.2 44.2 37.0 34.5 135.8 167.6 112.8 87.1 80.5 56.1 73.5 51.1 86.5 80.6 ..Januar y 23.0 26.5 23.0 15.9 12.6 133.6 166.3 97.8 69.8 62.9 42.2 56.5 28.2 60.8 56.7 ..Febr uary 23.7 27.2 25.1 17.8 15.6 142.3 175.0 104.1 76.6 63.9 46.9 58.0 28.3 69.9 77.7 ..March 38.4 41.0 41.2 35.2 28.0 174.0 201.5 129.5 108.3 87.0 64.7 78.2 50.2 100.5 80.2 ..
2003 2004 2005 2006 2007 2008 2009 2010 2011 2012 2013 2014 2015 2016 2017 2018/04 /05 /06 /07 /08 /09 /10 /11 /12 /13 /14 /15 /16 /17 /18 /19
Central Government net cash requirement: cumulative in financial year
Apr il −0.4 −1.7 −1.4 1.9 −1.2 2.3 11.2 9.1 7.0 −7.3 7.7 4.0 −0.8 0.8 −15.5 −6.1May 7.4 3.5 8.0 11.0 7.7 15.9 31.5 26.7 17.2 5.5 17.3 17.3 11.4 7.6 −5.7 1.2June 17.4 14.4 19.6 23.4 17.6 30.9 54.0 50.3 40.0 26.8 28.8 34.8 28.4 27.2 12.0 14.2July 10.4 7.1 10.3 13.3 4.4 18.0 56.4 46.9 34.9 22.4 20.3 31.7 27.5 30.2 4.7 0.3August 14.3 10.6 15.9 17.2 10.9 29.6 68.0 52.4 44.6 31.0 29.4 34.3 26.0 33.9 5.7 4.7September 23.7 22.4 28.2 30.7 21.2 68.5 91.2 77.1 66.6 52.9 43.1 55.1 46.3 55.8 24.9 19.8October 21.5 20.6 22.2 22.8 15.9 75.8 96.7 78.2 63.5 55.8 35.9 50.4 44.9 51.7 18.0 16.1November 27.1 30.1 32.6 31.4 25.3 88.1 110.7 93.1 73.1 68.3 46.0 57.2 51.3 61.4 30.2 ..December 40.1 45.9 47.5 44.9 41.9 135.4 168.4 120.6 97.2 91.1 68.2 79.5 64.1 80.6 48.8 ..Januar y 25.5 28.7 26.9 23.6 19.1 131.1 165.9 104.4 80.2 74.0 54.0 60.4 42.1 52.7 21.0 ..Febr uary 26.4 29.6 29.0 20.7 20.9 136.1 171.6 107.7 85.4 72.8 58.9 63.3 40.2 48.7 18.9 ..March 39.4 41.1 43.0 37.4 33.3 163.8 198.6 134.0 117.7 95.9 78.4 84.5 60.7 67.0 38.6 ..

PSA4 Public Sector Net Debt (excluding public sector banks)
£ billion
2003 2004 2005 2006 2007 2008 2009 2010 2011 2012 2013 2014 2015 2016 2017 2018/04 /05 /06 /07 /08 /09 /10 /11 /12 /13 /14 /15 /16 /17 /18 /19
Public sector net debt1 excluding public sector banks: amount outstanding at end period
Apr il 349.2 399.9 445.4 485.9 520.9 559.2 783.4 1 017.9 1 162.1 1 253.5 1 367.1 1 469.0 1 553.7 1 607.4 1 720.3 1 777.1May 353.8 405.4 449.5 494.6 528.6 570.6 804.9 1 031.4 1 172.4 1 264.3 1 382.5 1 483.3 1 565.8 1 614.9 1 736.7 1 780.9June 362.2 417.2 461.1 508.1 540.1 589.5 830.6 1 053.5 1 192.6 1 283.8 1 397.0 1 500.8 1 580.7 1 624.9 1 759.3 1 790.3July 357.8 410.9 454.9 496.0 527.4 615.9 836.5 1 057.8 1 185.6 1 284.1 1 393.6 1 496.4 1 573.6 1 614.3 1 760.0 1 776.4August 361.1 413.7 460.1 500.2 532.1 626.9 839.8 1 067.2 1 202.2 1 286.1 1 399.4 1 500.4 1 572.7 1 622.3 1 766.0 1 781.7September 369.8 423.6 471.6 512.7 541.2 665.1 859.7 1 092.1 1 210.1 1 303.7 1 415.4 1 518.1 1 589.6 1 640.0 1 786.1 1 789.6October 369.1 421.7 467.6 504.8 537.1 672.5 868.0 1 094.7 1 210.1 1 313.9 1 416.9 1 523.8 1 592.3 1 642.6 1 789.7 1 791.6November 376.1 433.3 476.0 513.0 547.0 684.9 883.3 1 112.4 1 220.6 1 328.2 1 431.9 1 532.4 1 599.5 1 662.6 1 735.8 ..December 390.2 448.7 492.2 527.3 562.5 733.8 940.3 1 138.4 1 242.4 1 350.7 1 453.3 1 556.5 1 608.9 1 697.2 1 760.3 ..Januar y 376.0 432.5 469.6 506.2 540.3 731.9 977.1 1 125.1 1 226.7 1 332.1 1 441.3 1 534.5 1 588.8 1 681.1 1 741.5 ..Febr uary 376.8 432.6 471.7 507.0 544.9 740.7 984.3 1 132.9 1 234.9 1 337.6 1 447.4 1 538.1 1 586.6 1 694.5 1 762.8 ..March 391.0 446.5 487.2 523.6 557.2 768.3 1 011.9 1 157.6 1 253.1 1 363.6 1 464.4 1 554.7 1 602.6 1 726.7 1 778.9 ..
2003 2004 2005 2006 2007 2008 2009 2010 2011 2012 2013 2014 2015 2016 2017 2018/04 /05 /06 /07 /08 /09 /10 /11 /12 /13 /14 /15 /16 /17 /18 /19
Public sector net debt1 excluding public sector banks: as a percentage of GDP at market prices2
Apr il 28.2 30.7 32.4 33.4 34.1 35.4 50.9 64.5 71.1 74.5 78.1 80.2 82.4 82.2 84.6 84.7May 28.4 31.0 32.5 33.9 34.4 36.1 52.3 65.2 71.5 74.9 78.8 80.7 82.8 82.3 85.2 84.7June 28.9 31.8 33.2 34.7 35.0 37.3 54.0 66.4 72.5 75.8 79.3 81.4 83.4 82.5 86.1 84.9July 28.5 31.2 32.6 33.7 34.1 39.1 54.3 66.4 72.0 75.5 78.8 81.0 82.8 81.7 85.9 84.0August 28.6 31.3 32.8 33.8 34.3 40.0 54.4 66.7 72.9 75.4 78.9 81.0 82.5 81.8 85.9 84.0September 29.2 31.9 33.4 34.5 34.7 42.5 55.6 68.0 73.3 76.2 79.5 81.8 83.1 82.4 86.7 84.2October 29.0 31.6 33.0 33.8 34.3 43.1 55.9 68.0 73.2 76.5 79.2 81.9 83.0 82.3 86.7 84.0November 29.4 32.3 33.5 34.2 34.8 44.1 56.7 68.9 73.7 77.1 79.6 82.2 83.1 83.1 83.9 ..December 30.4 33.3 34.5 35.0 35.7 47.3 60.2 70.3 74.8 78.2 80.4 83.3 83.4 84.5 84.8 ..Januar y 29.2 31.9 32.7 33.5 34.2 47.3 62.4 69.4 73.6 76.9 79.5 81.9 82.1 83.5 83.7 ..Febr uary 29.1 31.8 32.7 33.4 34.5 48.0 62.7 69.7 73.9 76.9 79.5 81.9 81.7 83.9 84.5 ..March 30.1 32.7 33.6 34.4 35.2 49.9 64.3 71.0 74.7 78.2 80.2 82.6 82.3 85.2 85.0 ..
1 Net debt at the end of the month2 Gross Domestic Product for 12 months centred on the end of the month

PSA5A Long Run of Fiscal Indicators as a percentage of GDPon a financial year basis
% of GDP
Excluding public sector banks
Public Sector Public Sector Public SectorCurrent Budget Public Sector Public Sector Net Debt Public Sector Net Financial Public Sector Public Sector
Deficit 7 Net Investment Net Borrowing excluding BoE 1 2 Net Debt Liabilities 3 4 5 6 Net Borrowing Net Debt
JW2V MUB2 J5IJ CPOA HF6X CPOE J4DD RUTO1978/79 1.8 2.7 4.5 46.4 49.0 − 4.5 49.01979/80 1.2 2.5 3.7 42.5 45.0 − 3.7 45.01980/81 2.1 2.2 4.3 42.8 45.6 − 4.3 45.61981/82 0.6 1.4 2.0 42.3 45.3 − 2.0 45.31982/83 0.7 1.9 2.6 40.8 43.9 − 2.6 43.9
1983/84 1.2 2.1 3.3 40.5 43.6 − 3.3 43.61984/85 1.4 1.9 3.3 41.1 44.3 − 3.3 44.31985/86 0.6 1.5 2.1 38.6 41.7 − 2.1 41.71986/87 0.8 1.1 1.8 37.1 40.1 − 1.8 40.11987/88 − 0.9 0.9 33.1 35.6 − 0.9 35.6
1988/89 −1.7 0.7 −1.1 27.2 29.3 − −1.1 29.31989/90 −1.5 1.4 −0.1 24.5 26.2 − −0.1 26.21990/91 −0.6 1.5 0.9 22.6 24.2 − 0.9 24.21991/92 1.3 1.9 3.2 23.5 25.2 − 3.2 25.21992/93 4.5 1.9 6.4 27.8 29.0 − 6.4 29.0
1993/94 5.1 1.5 6.6 32.5 33.9 − 6.6 33.91994/95 3.9 1.5 5.4 36.0 37.5 − 5.4 37.51995/96 2.6 1.5 4.1 37.9 39.2 − 4.1 39.21996/97 2.1 0.9 3.0 38.6 36.9 − 3.0 36.91997/98 0.3 0.7 0.9 36.8 36.7 − 0.9 36.7
1998/99 −0.9 0.8 −0.1 35.1 35.0 − −0.1 35.01999/00 −1.9 0.9 −1.0 32.5 32.4 26.2 −1.0 32.42000/01 −2.3 0.8 −1.5 28.4 28.3 25.7 −1.5 28.32001/02 −1.1 1.4 0.4 27.8 27.7 26.9 0.4 27.72002/03 0.9 1.7 2.7 29.0 28.9 29.7 2.7 28.9
2003/04 1.2 1.9 3.1 30.2 30.1 29.6 3.1 30.12004/05 1.3 2.2 3.5 32.8 32.7 31.4 3.5 32.72005/06 0.8 2.1 2.9 33.8 33.6 29.9 2.9 33.62006/07 0.5 2.1 2.6 34.5 34.4 30.1 2.6 34.42007/08 0.6 2.2 2.8 35.3 35.2 32.1 2.7 41.2
2008/09 3.8 3.4 7.3 49.9 49.9 45.9 5.8 141.32009/10 6.5 3.4 9.9 63.5 64.3 52.8 8.5 146.32010/11 5.7 2.8 8.5 70.7 71.0 57.4 7.4 142.22011/12 4.9 2.2 7.1 75.0 74.7 63.7 5.9 134.02012/13 4.8 2.3 7.1 76.9 78.2 68.4 6.4 130.6
2013/14 3.8 1.7 5.5 77.9 80.2 69.6 5.0 111.52014/15 2.9 2.0 4.9 80.4 82.6 71.4 4.4 98.82015/16 2.0 1.8 3.8 80.1 82.3 72.8 3.4 97.92016/17 0.4 1.9 2.3 79.4 85.2 72.3 1.8 99.72017/18 −0.1 2.0 1.9 76.0 85.0 68.6 1.3 98.2
1 Bank of England2 £ million values in Table PSA8D3 Exper imental statistic4 £ million values in Appendix F5 Time series for PSNFL only available back to 2000 Q16 - denotes no data available for that period7 - denotes a zero

£ billion1
2018 2017 £ billion % 2018/19 2017/18 £ billion %
Central Government Current Receipts
Taxes on production NMBY 24.0 22.9 1.2 5.2 163.5 156.2 7.3 4.7
of which VAT NZGF 12.6 12.2 0.4 3.3 87.3 82.6 4.7 5.7
Taxes on income and wealth NMCU 17.7 17.3 0.4 2.3 135.1 128.2 6.9 5.4
of which income tax and capital gains tax LIBR 13.0 12.7 0.3 2.6 99.1 93.6 5.4 5.8
of which other (mainly corporation tax) LIBP 4.7 4.6 0.1 1.7 36.0 34.5 1.5 4.2
Other taxes LIQR 1.5 1.4 0.1 6.5 10.8 10.6 0.2 1.9
Compulsory social contributions (NICs) AIIH 10.8 10.6 0.2 1.7 76.8 74.0 2.8 3.8
Interest & dividends LIQP 3.9 5.1 -1.1 -22.2 14.4 14.3 0.1 0.8
of which APF5
L6BD 2.8 4.1 -1.3 -32.1 8.1 9.1 -1.0 -11.0
Other receipts LIQQ 1.9 1.9 0.0 -1.9 13.1 13.3 -0.3 -2.2
Total current receipts ANBV 59.9 59.2 0.7 1.2 413.6 396.6 17.1 4.3
Central Government Current Expenditure
Interest NMFX 6.8 6.0 0.8 12.9 33.4 35.6 -2.2 -6.2
Net social benefits GZSJ 18.2 17.3 0.8 4.6 124.8 121.5 3.2 2.7
Other LIQS 36.8 34.6 2.2 6.4 252.7 244.1 8.6 3.5
Total current expenditure ANLP 61.7 57.9 3.8 6.6 410.9 401.2 9.6 2.4
Savings, gross plus capital taxes ANPM -1.8 1.3 -3.1 -238.6 2.8 -4.7 7.4 159.3
Depreciation NSRN 1.6 1.5 0.0 1.3 10.8 10.8 0.0 0.4
Current budget deficit2
-ANLV 3.4 0.2 3.1 1,281.5 8.1 15.4 -7.4 -47.8
Central Government Net investment3
-ANNS 3.6 2.7 0.9 32.7 21.8 20.5 1.3 6.3
Central Government Net borrowing4
-NMFJ 7.0 3.0 4.0 134.7 29.8 35.9 -6.1 -16.9
Local Government Net Borrowing -NMOE 0.0 1.0 -1.0 -102.0 -4.9 -2.0 -3.0 -151.7
General Government Net Borrowing -NNBK 7.0 4.0 3.0 75.7 24.9 33.9 -9.0 -26.7
Non-financial Public Corporations Net Borrowing -CPCM 0.0 0.4 -0.4 -103.3 0.5 3.2 -2.7 -84.8
Bank of England Net Borrowing (including APF5 & SLS
6)-JW2H 1.9 2.9 -1.0 -35.8 1.3 0.7 0.6 79.7
Public Sector Net Borrowing excluding public sector banks -J5II 8.8 7.2 1.6 21.9 26.7 37.9 -11.2 -29.6
Public Sector Net Investment excluding public sector banks -JW2Z 3.6 3.3 0.3 9.5 17.8 20.0 -2.2 -11.1
Public Sector Current Budget Deficit excluding public sector banks -JW2T 5.2 3.9 1.3 32.4 8.9 17.9 -9.0 -50.3
Memo items:
Central Government Income tax and NICs KSS8 23.8 23.3 0.5 2.2 175.8 167.6 8.2 4.9
Central Government Total Expenditure (current plus net investment) DU3N 65.4 60.7 4.7 7.7 432.6 421.7 10.9 2.6
Central Government Current Expenditure (excluding debt interest payments) KSS6 54.9 51.9 3.0 5.8 377.5 365.6 11.9 3.2
Central Government Net Cash Requirement RUUW -3.6 -6.9 3.3 47.8 16.1 18.0 -1.8 -10.1
Public Sector Net Borrowing as a % of GDP excluding public sector banks7,8
- 0.4 0.4 0.0 - 1.2 1.8 -0.6 -
Public Sector Net Debt excluding public sector banks HF6W 1,791.6 1,789.7 1.9 0.1 - - - -
Public Sector Net Debt as a % of GDP excluding public sector banks7,8
HF6X 84.0 86.7 -2.7 - - - - -
1 Unless otherwise stated
2 Current Budget Deficit is the difference between current expenditure and current receipts
3 Net Investment is investment less depreciation
4 Net Borrowing is Current Budget Deficit less Net Investment
5 APF - Bank of England Asset Purchase Facility
6 SLS - Special liquidity Scheme
7 This ratio employs a 12 month centred moving average of GDP
8 Change measured in percentage points
PSA6A Net borrowing : month and full financial year comparisonsOctober Financial year-to-date (Apr to Oct)
change change

PSA6B Central Government Account : over view
£ million
Current receipts
Taxes on Interest andproduction of which Taxes on income and wealth dividends of which
Income and Assetcapital Purchase Other
Total VAT Total gains tax1 Other2 Other taxes NICs3 Total Facility receipts4 Total
1 2 3 4 5 6 7 8 9 10 11
NMBY NZGF NMCU LIBR LIBP LIQR AIIH LIQP L6BD LIQQ ANBV2014/15 233 598 124 846 213 791 169 178 44 613 16 731 110 260 19 137 10 739 23 226 616 7432015/16 243 660 130 715 221 707 175 934 45 773 17 448 114 061 17 189 8 529 22 946 637 0112016/17 253 453 135 590 239 857 185 627 54 230 17 482 126 241 18 413 10 087 23 000 678 4462017/18 267 086 142 407 246 477 188 492 57 985 17 840 132 508 18 655 9 301 22 786 705 352
2016 Oct 22 110 11 808 16 140 11 943 4 197 1 454 10 101 3 726 3 046 1 862 55 393Nov 21 705 11 635 15 900 11 730 4 170 1 403 9 948 566 − 1 853 51 375Dec 22 164 11 712 17 745 13 549 4 196 1 360 10 760 535 − 1 840 54 404
2017 Jan 20 733 11 746 36 293 31 963 4 330 1 407 10 653 2 754 2 085 2 535 74 375Feb 21 129 11 382 24 794 20 394 4 400 1 430 11 372 530 − 1 898 61 153Mar 20 737 11 148 21 079 16 333 4 746 1 584 12 971 1 305 − 1 896 59 572Apr 21 415 11 473 17 138 12 060 5 078 1 578 10 677 4 871 4 257 2 083 57 762May 21 554 11 130 16 391 11 582 4 809 1 615 10 430 843 − 1 856 52 689Jun 22 390 11 666 17 596 12 594 5 002 1 522 10 821 611 − 1 857 54 797
Jul 22 597 12 185 24 621 19 868 4 753 1 451 10 586 1 402 702 1 864 62 521Aug 22 682 11 961 17 931 12 721 5 210 1 509 10 243 707 − 1 860 54 932Sep 22 670 11 903 17 192 12 143 5 049 1 521 10 573 776 − 1 899 54 631Oct 22 859 12 244 17 314 12 672 4 642 1 443 10 620 5 068 4 094 1 926 59 230Nov 23 366 12 106 16 870 12 214 4 656 1 420 10 305 661 − 1 865 54 487Dec 23 053 12 479 19 029 14 421 4 608 1 321 11 462 597 − 1 862 57 324
2018 Jan 21 291 11 941 35 643 31 136 4 507 1 430 11 033 1 032 248 1 891 72 320Feb 21 522 11 609 24 556 20 039 4 517 1 479 11 973 781 − 1 887 62 198Mar 21 687 11 710 22 196 17 042 5 154 1 551 13 785 1 306 − 1 936 62 461Apr 23 462 12 383 17 987 12 892 5 095 1 478 11 005 3 889 3 024 1 855 59 676May 22 459 11 981 17 307 12 059 5 248 1 595 10 703 795 − 1 859 54 718Jun 23 654 12 598 18 577 13 120 5 457 1 593 11 304 750 − 1 856 57 734
Jul 23 424 12 715 26 739 21 528 5 211 1 513 11 020 3 108 2 258 1 866 67 670Aug 23 405 12 549 18 727 13 528 5 199 1 560 10 742 828 − 1 870 57 132Sep 23 037 12 436 18 032 12 955 5 077 1 570 11 188 1 072 − 1 859 56 758Oct 24 046 12 642 17 719 12 997 4 722 1 537 10 796 3 944 2 779 1 889 59 931
Current expenditureSaving, gross
Net Social plus capital Current budgetInterest Benefits Other Total taxes Depreciation deficit Net investment Net borrowing
12 13 14 15 16 17 18 19 20
NMFX GZSJ LIQS ANLP ANPM NSRN -ANLV -ANNS -NMFJ2014/15 45 371 201 316 404 822 651 509 −34 766 17 944 52 710 36 934 89 6442015/16 45 127 203 682 405 201 654 010 −16 999 18 313 35 312 36 925 72 2372016/17 48 659 204 720 408 611 661 990 16 456 18 313 1 857 37 959 39 8162017/18 55 024 208 420 418 470 681 914 23 438 18 501 −4 937 39 526 34 589
2016 Oct 4 785 16 850 34 576 56 211 −818 1 517 2 335 2 686 5 021Nov 4 105 18 592 33 049 55 746 −4 371 1 517 5 888 2 205 8 093Dec 3 199 17 609 33 655 54 463 −59 1 516 1 575 3 278 4 853
2017 Jan 3 972 16 622 34 787 55 381 18 994 1 543 −17 451 3 350 −14 101Feb 5 490 15 404 32 535 53 429 7 724 1 543 −6 181 2 880 −3 301Mar 1 303 16 767 35 810 53 880 5 692 1 543 −4 149 6 511 2 362Apr 7 157 17 423 36 789 61 369 −3 607 1 536 5 143 3 678 8 821May 4 514 17 374 33 862 55 750 −3 061 1 536 4 597 3 115 7 712Jun 4 959 17 090 37 463 59 512 −4 715 1 536 6 251 3 347 9 598
Jul 4 849 17 407 34 562 56 818 5 703 1 540 −4 163 2 874 −1 289Aug 4 394 17 599 32 599 54 592 340 1 540 1 200 2 169 3 369Sep 3 698 17 306 34 238 55 242 −611 1 540 2 151 2 570 4 721Oct 6 035 17 344 34 554 57 933 1 297 1 540 243 2 733 2 976Nov 3 914 18 897 34 485 57 296 −2 809 1 541 4 350 2 396 6 746Dec 4 419 17 662 32 616 54 697 2 627 1 541 −1 086 3 321 2 235
2018 Jan 4 224 17 256 35 540 57 020 15 300 1 550 −13 750 3 351 −10 399Feb 6 434 15 763 34 069 56 266 5 932 1 550 −4 382 3 278 −1 104Mar 427 17 299 37 693 55 419 7 042 1 551 −5 491 6 694 1 203Apr 6 145 17 382 37 396 60 923 −1 247 1 537 2 784 3 940 6 724May 3 423 18 167 34 808 56 398 −1 680 1 537 3 217 2 575 5 792Jun 4 964 17 369 35 448 57 781 −47 1 537 1 584 2 932 4 516
Jul 4 567 17 897 38 725 61 189 6 481 1 547 −4 934 2 359 −2 575Aug 4 602 18 204 34 806 57 612 −480 1 547 2 027 3 012 5 039Sep 2 864 17 596 34 769 55 229 1 529 1 547 18 3 331 3 349Oct 6 816 18 150 36 762 61 728 −1 797 1 560 3 357 3 628 6 985
Relationship between columns 11=1+3+6+7+8+10 ; 15=12+13+141 Includes capital gains tax paid by households. Includes income tax and
capital gains tax paid by cor porations.2 Mainly comprises corporation tax and petroleum revenue tax.
Relationship between columns 18=(15-11)+17 ; 20=18+193 For merly titled compulsory social contributions.4 Consists largely of gross operating surplus, equates to depreciation for govern-
ment. Also includes rent receipts.

PSA6C Central Government Account :Total Revenue , Total Expenditure and Net Borrowing
£ million
Total Revenue
Current receipts (as in PSA6B) Mar ketoutput and Current Capitaloutput for Pension grants to transfers to Less gross
Interest and Other own final contr ibutio- central central operating TotalTotal Taxes NICs1 dividends receipts2 use3 ns4 government government5 sur plus revenue
1 2 3 4 5 6 7 8 9 10 11
ANBV MF6P AIIH LIQP LIQQ MUT5 MF6Q MHA8 MFO7 -NRLN MF6R2014/15 616 743 464 120 110 260 19 137 23 226 19 085 24 339 130 2 187 −17 944 644 5402015/16 637 011 482 815 114 061 17 189 22 946 19 777 26 209 128 2 686 −18 313 667 4982016/17 678 446 510 792 126 241 18 413 23 000 21 422 27 194 318 1 135 −18 313 710 2022017/18 705 352 531 403 132 508 18 655 22 786 24 027 27 634 364 1 382 −18 501 740 258
2016 Oct 55 393 39 704 10 101 3 726 1 862 1 350 2 256 83 123 −1 517 57 688Nov 51 375 39 008 9 948 566 1 853 1 678 2 268 48 93 −1 517 53 945Dec 54 404 41 269 10 760 535 1 840 1 750 2 303 45 105 −1 516 57 091
2017 Jan 74 375 58 433 10 653 2 754 2 535 1 816 2 244 50 118 −1 543 77 060Feb 61 153 47 353 11 372 530 1 898 1 984 2 252 1 108 −1 543 63 955Mar 59 572 43 400 12 971 1 305 1 896 2 041 2 583 9 197 −1 543 62 859Apr 57 762 40 131 10 677 4 871 2 083 1 969 1 977 13 95 −1 536 60 280May 52 689 39 560 10 430 843 1 856 1 876 2 284 36 135 −1 536 55 484Jun 54 797 41 508 10 821 611 1 857 1 831 2 269 2 102 −1 536 57 465
Jul 62 521 48 669 10 586 1 402 1 864 1 865 2 269 10 50 −1 540 65 175Aug 54 932 42 122 10 243 707 1 860 1 919 2 266 10 96 −1 540 57 683Sep 54 631 41 383 10 573 776 1 899 1 946 2 284 11 161 −1 540 57 493Oct 59 230 41 616 10 620 5 068 1 926 1 937 2 306 85 73 −1 540 62 091Nov 54 487 41 656 10 305 661 1 865 1 964 2 322 77 114 −1 541 57 423Dec 57 324 43 403 11 462 597 1 862 2 048 2 334 75 162 −1 541 60 402
2018 Jan 72 320 58 364 11 033 1 032 1 891 2 171 2 330 7 39 −1 550 75 317Feb 62 198 47 557 11 973 781 1 887 2 253 2 302 7 170 −1 550 65 380Mar 62 461 45 434 13 785 1 306 1 936 2 248 2 691 31 185 −1 551 66 065Apr 59 676 42 927 11 005 3 889 1 855 1 966 2 033 5 15 −1 537 62 158May 54 718 41 361 10 703 795 1 859 2 010 2 329 23 59 −1 537 57 602Jun 57 734 43 824 11 304 750 1 856 1 985 2 319 11 189 −1 537 60 701
Jul 67 670 51 676 11 020 3 108 1 866 2 164 2 348 16 519 −1 547 71 170Aug 57 132 43 692 10 742 828 1 870 2 143 2 379 8 84 −1 547 60 199Sep 56 758 42 639 11 188 1 072 1 859 2 251 2 393 10 36 −1 547 59 901Oct 59 931 43 302 10 796 3 944 1 889 2 059 2 380 13 207 −1 560 63 030
Current expenditure Capital expenditure
Less market Less current Less capitalCurrent output and grants to transfers to
expenditure output for Less pension central Less Total current Net central Total capital(as in PSA6B) own final use3 contr ibutions4 government depreciation expenditure investment government5 Depreciation expenditure
12 13 14 15 16 17 18 19 20 21
ANLP MUT5 MF6Q MHA8 -NSRN MF6S -ANNS MFO7 NSRN MF6T2014/15 651 509 19 085 24 339 130 −17 944 677 119 36 934 2 187 17 944 57 0652015/16 654 010 19 777 26 209 128 −18 313 681 811 36 925 2 686 18 313 57 9242016/17 661 990 21 422 27 194 318 −18 313 692 611 37 959 1 135 18 313 57 4072017/18 681 914 24 027 27 634 364 −18 501 715 438 39 526 1 382 18 501 59 409
2016 Oct 56 211 1 350 2 256 83 −1 517 58 383 2 686 123 1 517 4 326Nov 55 746 1 678 2 268 48 −1 517 58 223 2 205 93 1 517 3 815Dec 54 463 1 750 2 303 45 −1 516 57 045 3 278 105 1 516 4 899
2017 Jan 55 381 1 816 2 244 50 −1 543 57 948 3 350 118 1 543 5 011Feb 53 429 1 984 2 252 1 −1 543 56 123 2 880 108 1 543 4 531Mar 53 880 2 041 2 583 9 −1 543 56 970 6 511 197 1 543 8 251Apr 61 369 1 969 1 977 13 −1 536 63 792 3 678 95 1 536 5 309May 55 750 1 876 2 284 36 −1 536 58 410 3 115 135 1 536 4 786Jun 59 512 1 831 2 269 2 −1 536 62 078 3 347 102 1 536 4 985
Jul 56 818 1 865 2 269 10 −1 540 59 422 2 874 50 1 540 4 464Aug 54 592 1 919 2 266 10 −1 540 57 247 2 169 96 1 540 3 805Sep 55 242 1 946 2 284 11 −1 540 57 943 2 570 161 1 540 4 271Oct 57 933 1 937 2 306 85 −1 540 60 721 2 733 73 1 540 4 346Nov 57 296 1 964 2 322 77 −1 541 60 118 2 396 114 1 541 4 051Dec 54 697 2 048 2 334 75 −1 541 57 613 3 321 162 1 541 5 024
2018 Jan 57 020 2 171 2 330 7 −1 550 59 978 3 351 39 1 550 4 940Feb 56 266 2 253 2 302 7 −1 550 59 278 3 278 170 1 550 4 998Mar 55 419 2 248 2 691 31 −1 551 58 838 6 694 185 1 551 8 430Apr 60 923 1 966 2 033 5 −1 537 63 390 3 940 15 1 537 5 492May 56 398 2 010 2 329 23 −1 537 59 223 2 575 59 1 537 4 171Jun 57 781 1 985 2 319 11 −1 537 60 559 2 932 189 1 537 4 658
Jul 61 189 2 164 2 348 16 −1 547 64 170 2 359 519 1 547 4 425Aug 57 612 2 143 2 379 8 −1 547 60 595 3 012 84 1 547 4 643Sep 55 229 2 251 2 393 10 −1 547 58 336 3 331 36 1 547 4 914Oct 61 728 2 059 2 380 13 −1 560 64 620 3 628 207 1 560 5 395
Relationship between columns 1+6+7+8+9+10=111 For merly titled compulsory social contributions.2 Consists largely of gross operating surplus, equates to depreciation for gov-
er nment. Also includes rent receipts.
Relationships between columns 12+13+14+15+16=17; 18+19+20=213 Includes payments for non-market output4 Contains contributions from employers and employees.5 Includes Housing Revenue account reorganisation in Mar 2012, Royal Mail
pension transfer in April 2012 and FSCS Capital Tax in Sep 2008.

PSA6C Central Government Account :Total Revenue , Total Expenditure and Net Borrowing
continued £ million
of which
Total revenue Total expenditure Total current expenditure Total capital expenditure Net borrowing
22 23 24 25 26
MF6R MF6U MF6S MF6T -NMFJ2014/15 644 540 734 184 677 119 57 065 89 6442015/16 667 498 739 735 681 811 57 924 72 2372016/17 710 202 750 018 692 611 57 407 39 8162017/18 740 258 774 847 715 438 59 409 34 589
2016 Oct 57 688 62 709 58 383 4 326 5 021Nov 53 945 62 038 58 223 3 815 8 093Dec 57 091 61 944 57 045 4 899 4 853
2017 Jan 77 060 62 959 57 948 5 011 −14 101Feb 63 955 60 654 56 123 4 531 −3 301Mar 62 859 65 221 56 970 8 251 2 362Apr 60 280 69 101 63 792 5 309 8 821May 55 484 63 196 58 410 4 786 7 712Jun 57 465 67 063 62 078 4 985 9 598
Jul 65 175 63 886 59 422 4 464 −1 289Aug 57 683 61 052 57 247 3 805 3 369Sep 57 493 62 214 57 943 4 271 4 721Oct 62 091 65 067 60 721 4 346 2 976Nov 57 423 64 169 60 118 4 051 6 746Dec 60 402 62 637 57 613 5 024 2 235
2018 Jan 75 317 64 918 59 978 4 940 −10 399Feb 65 380 64 276 59 278 4 998 −1 104Mar 66 065 67 268 58 838 8 430 1 203Apr 62 158 68 882 63 390 5 492 6 724May 57 602 63 394 59 223 4 171 5 792Jun 60 701 65 217 60 559 4 658 4 516
Jul 71 170 68 595 64 170 4 425 −2 575Aug 60 199 65 238 60 595 4 643 5 039Sep 59 901 63 250 58 336 4 914 3 349Oct 63 030 70 015 64 620 5 395 6 985
Relationships between columns 17+21=24+25=23; 23-22=26

PSA6D Central Government Account : Current Receipts
£ million
Taxes on production
of which
Stamp duty Vehicle dutyBusiness Stamp duty (land and paid by
Total VAT Alcohol Tobacco Fuel duty rates1 (shares) property)2 businesses Other3
NMBY NZGF MF6V GTAO CUDG CUKY BKST MM9F EKED MF6W2014/15 233 598 124 846 10 449 9 251 27 156 25 330 2 925 10 852 1 923 20 8662015/16 243 660 130 715 10 697 9 106 27 622 25 999 3 323 11 272 2 103 22 8232016/17 253 453 135 590 11 117 8 681 27 937 26 810 3 715 12 406 2 187 25 0102017/18 267 086 142 407 11 585 8 766 27 878 27 445 3 519 13 593 2 259 29 634
2016 Oct 22 110 11 808 1 011 717 2 361 2 255 557 1 074 182 2 145Nov 21 705 11 635 1 319 633 2 398 2 255 239 1 123 165 1 938Dec 22 164 11 712 883 910 2 396 2 251 370 1 270 165 2 207
2017 Jan 20 733 11 746 631 716 2 050 2 255 221 968 153 1 993Feb 21 129 11 382 1 005 780 2 426 2 255 267 920 183 1 911Mar 20 737 11 148 859 845 2 158 2 009 320 1 053 209 2 136Apr 21 415 11 473 812 488 2 451 2 312 217 1 113 183 2 366May 21 554 11 130 993 755 2 279 2 312 318 1 122 193 2 452Jun 22 390 11 666 975 800 2 391 2 316 334 1 132 196 2 580
Jul 22 597 12 185 926 757 2 353 2 313 272 1 267 174 2 350Aug 22 682 11 961 998 851 2 358 2 313 309 1 248 199 2 445Sep 22 670 11 903 937 753 2 349 2 318 291 1 163 203 2 753Oct 22 859 12 244 1 162 653 2 311 2 311 297 1 213 185 2 483Nov 23 366 12 106 1 409 1 170 2 440 2 311 291 1 172 178 2 289Dec 23 053 12 479 887 554 2 407 2 316 333 1 258 158 2 661
2018 Jan 21 291 11 941 689 524 2 126 2 312 259 1 061 162 2 217Feb 21 522 11 609 793 677 2 360 2 312 289 884 195 2 403Mar 21 687 11 710 1 004 784 2 053 1 999 309 960 233 2 635Apr 23 462 12 383 958 970 2 404 2 353 415 1 085 189 2 705May 22 459 11 981 1 073 651 2 302 2 353 236 976 212 2 675Jun 23 654 12 598 1 027 803 2 459 2 351 301 1 015 195 2 905
Jul 23 424 12 715 1 034 744 2 338 2 362 288 1 194 187 2 562Aug 23 405 12 549 1 003 921 2 364 2 362 296 1 240 207 2 463Sep 23 037 12 436 916 705 2 402 2 365 234 986 218 2 775Oct 24 046 12 642 1 173 1 180 2 229 2 360 421 1 196 222 2 623
Taxes on income and wealth Other taxes
of which of which
VehicleSelf duty paid
assessed Other Petroleum Televisi- byincome Capital income Corporat- revenue Miscella- on househol- Total
Total tax gains tax4 PA YE IT5 tax6 ion tax7 tax neous Total licence ds Bank levy Other8 taxes
NMCU LISB MS62 MS6W MF6X CPRN ACCJ MF6Z LIQR DH7A CDDZ KIH3 MF72 MF732014/15 213 791 23 644 5 558 140 001 −25 44 067 77 469 16 731 3 137 3 971 3 117 6 506 464 1202015/16 221 707 24 328 7 060 146 159 −1 613 45 593 −562 742 17 448 3 115 3 803 3 183 7 347 482 8152016/17 239 857 28 547 8 379 149 735 −1 034 54 257 −653 626 17 482 3 163 3 794 3 000 7 525 510 7922017/18 246 477 28 295 7 794 154 926 −2 523 57 759 −568 794 17 840 3 181 4 103 2 604 7 952 531 403
2016 Oct 16 140 30 2 11 950 −39 4 181 − 16 1 454 285 309 237 623 39 704Nov 15 900 39 14 11 758 −81 4 141 −4 33 1 403 279 277 237 610 39 008Dec 17 745 985 2 12 779 −217 4 117 −7 86 1 360 262 279 237 582 41 269
2017 Jan 36 293 13 355 5 962 12 646 − 4 432 −141 39 1 407 272 281 236 618 58 433Feb 24 794 4 667 2 095 13 550 82 4 465 −109 44 1 430 268 333 236 593 47 353Mar 21 079 595 271 15 562 −95 4 745 −23 24 1 584 269 377 236 702 43 400Apr 17 138 −106 3 12 392 −229 4 948 −1 131 1 578 249 335 228 766 40 131May 16 391 −190 3 12 150 −381 4 779 −8 38 1 615 252 347 228 788 39 560Jun 17 596 139 5 12 636 −186 4 977 −85 110 1 522 253 355 228 686 41 508
Jul 24 621 8 046 5 12 365 −548 4 938 −200 15 1 451 256 319 221 655 48 669Aug 17 931 1 344 7 11 942 −572 5 216 −24 18 1 509 263 362 221 663 42 122Sep 17 192 144 5 12 367 −373 4 918 − 131 1 521 280 373 221 647 41 383Oct 17 314 81 5 12 306 280 4 626 − 16 1 443 286 330 171 656 41 616Nov 16 870 97 6 12 098 13 4 613 9 34 1 420 274 317 171 658 41 656Dec 19 029 1 108 10 13 443 −140 4 521 −52 139 1 321 262 283 171 605 43 403
2018 Jan 35 643 12 756 5 599 12 906 −125 4 618 −140 29 1 430 271 296 248 615 58 364Feb 24 556 4 271 1 877 14 010 −119 4 549 −67 35 1 479 266 359 248 606 47 557Mar 22 196 605 269 16 311 −143 5 056 − 98 1 551 269 427 248 607 45 434Apr 17 987 −65 5 12 966 −14 5 064 −13 44 1 478 252 340 217 669 42 927May 17 307 −102 4 12 587 −430 5 185 − 63 1 595 261 388 217 729 41 361Jun 18 577 216 5 13 314 −415 5 384 −67 140 1 593 258 355 217 763 43 824
Jul 26 739 9 019 5 13 017 −513 5 328 −138 21 1 513 260 341 218 694 51 676Aug 18 727 1 340 8 12 624 −444 5 247 −62 14 1 560 264 375 218 703 43 692Sep 18 032 225 3 13 174 −447 4 937 −6 146 1 570 280 403 218 669 42 639Oct 17 719 154 5 12 718 120 4 703 − 19 1 537 290 401 169 677 43 302
1 These are National Non-Domestic Rates.2 Includes annual tax on enveloped dwellings.3 Includes taxes on betting, gaming, lottery, Camelot payments to National
Lotter y, air passenger duty, insurance premium tax, landfill tax, regulatorfees, aggregates levy, climate change levy, renewable energy obligationsand consumer credit act fees.
4 Includes legacy tax. The equivalent of HMRC published series BKLO.5 PAYE IT is Pay As You Earn Income Tax.6 Mainly consists of repayments and those tax credits recorded as negative tax-
es plus company IT and TDSI (tax deduction scheme for interest).7 Gross of tax credits. Includes diver ted profit tax.8 Includes business rates paid by non-mar ket sectors, passpor t fees and televi-
sion licence fees.

PSA6D Central Government Account : Current Receipts
continued £ million
Interest and dividends Other receipts
of which of which
GrossAsset operating
Purchase surplus Total currentTotal Taxes NICs1 Total Facility2 Other Total (imputed)3 Rent Other 4 receipts
MF73 AIIH LIQP L6BD MF74 LIQQ NRLN NMCK MF75 ANBV2014/15 464 120 110 260 19 137 10 739 8 398 23 226 17 944 1 414 3 868 616 7432015/16 482 815 114 061 17 189 8 529 8 660 22 946 18 313 1 412 3 221 637 0112016/17 510 792 126 241 18 413 10 087 8 326 23 000 18 313 1 418 3 269 678 4462017/18 531 403 132 508 18 655 9 301 9 354 22 786 18 501 1 426 2 859 705 352
2016 Oct 39 704 10 101 3 726 3 046 680 1 862 1 517 119 226 55 393Nov 39 008 9 948 566 − 566 1 853 1 517 119 217 51 375Dec 41 269 10 760 535 − 535 1 840 1 516 117 207 54 404
2017 Jan 58 433 10 653 2 754 2 085 669 2 535 1 543 120 872 74 375Feb 47 353 11 372 530 − 530 1 898 1 543 120 235 61 153Mar 43 400 12 971 1 305 − 1 305 1 896 1 543 112 241 59 572Apr 40 131 10 677 4 871 4 257 614 2 083 1 536 114 433 57 762May 39 560 10 430 843 − 843 1 856 1 536 114 206 52 689Jun 41 508 10 821 611 − 611 1 857 1 536 117 204 54 797
Jul 48 669 10 586 1 402 702 700 1 864 1 540 116 208 62 521Aug 42 122 10 243 707 − 707 1 860 1 540 116 204 54 932Sep 41 383 10 573 776 − 776 1 899 1 540 148 211 54 631Oct 41 616 10 620 5 068 4 094 974 1 926 1 540 116 270 59 230Nov 41 656 10 305 661 − 661 1 865 1 541 116 208 54 487Dec 43 403 11 462 597 − 597 1 862 1 541 114 207 57 324
2018 Jan 58 364 11 033 1 032 248 784 1 891 1 550 121 220 72 320Feb 47 557 11 973 781 − 781 1 887 1 550 121 216 62 198Mar 45 434 13 785 1 306 − 1 306 1 936 1 551 113 272 62 461Apr 42 927 11 005 3 889 3 024 865 1 855 1 537 119 199 59 676May 41 361 10 703 795 − 795 1 859 1 537 119 203 54 718Jun 43 824 11 304 750 − 750 1 856 1 537 121 198 57 734
Jul 51 676 11 020 3 108 2 258 850 1 866 1 547 122 197 67 670Aug 43 692 10 742 828 − 828 1 870 1 547 122 201 57 132Sep 42 639 11 188 1 072 − 1 072 1 859 1 547 121 191 56 758Oct 43 302 10 796 3 944 2 779 1 165 1 889 1 560 122 207 59 931
1 National Insurance Contributions, for merly titled compulsory social contribu-tions.
2 Includes only the dividend payments to central government, changes in eq-uity are recorded in the financial account.
3 Equates to depreciation in government accounts.4 Includes standardised guarantees

PSA6E Central Government Account : Current Expenditure
£ million
Current expenditure on goods and services
of which
Mar ket output andoutput for final Purchase of goods
Total Staff costs use3 4 and services5 Depreciation Subsidies Interest
NMBJ NMBG -MUT5 MF76 NSRN NMCD NMFX2014/15 234 864 107 361 −19 085 128 644 17 944 8 558 45 3712015/16 239 882 110 085 −19 777 131 261 18 313 10 362 45 1272016/17 246 820 117 050 −21 422 132 879 18 313 11 857 48 6592017/18 254 794 124 238 −24 027 136 082 18 501 13 676 55 024
2016 Oct 20 544 9 810 −1 350 10 567 1 517 1 041 4 785Nov 20 401 9 744 −1 678 10 818 1 517 1 012 4 105Dec 20 744 9 795 −1 750 11 183 1 516 1 006 3 199
2017 Jan 20 887 9 754 −1 816 11 406 1 543 1 122 3 972Feb 20 452 9 813 −1 984 11 080 1 543 1 090 5 490Mar 22 537 10 221 −2 041 12 814 1 543 1 241 1 303Apr 20 842 9 968 −1 969 11 307 1 536 1 160 7 157May 20 233 10 028 −1 876 10 545 1 536 1 099 4 514Jun 21 081 10 138 −1 831 11 238 1 536 1 060 4 959
Jul 21 279 10 351 −1 865 11 253 1 540 1 080 4 849Aug 20 477 10 116 −1 919 10 740 1 540 1 107 4 394Sep 20 888 10 154 −1 946 11 140 1 540 1 103 3 698Oct 21 134 10 244 −1 937 11 287 1 540 1 212 6 035Nov 21 055 10 243 −1 964 11 235 1 541 1 144 3 914Dec 21 666 10 643 −2 048 11 530 1 541 1 142 4 419
2018 Jan 21 390 10 716 −2 171 11 295 1 550 1 223 4 224Feb 21 342 10 651 −2 253 11 394 1 550 1 182 6 434Mar 23 407 10 986 −2 248 13 118 1 551 1 164 427Apr 21 350 10 101 −1 966 11 678 1 537 1 367 6 145May 21 216 10 260 −2 010 11 429 1 537 1 336 3 423Jun 21 902 10 397 −1 985 11 953 1 537 1 243 4 964
Jul 22 421 10 713 −2 164 12 325 1 547 1 217 4 567Aug 21 374 10 471 −2 143 11 499 1 547 1 264 4 602Sep 21 136 10 415 −2 251 11 425 1 547 1 300 2 864Oct 22 307 10 511 −2 059 12 295 1 560 1 353 6 816
Net Social Benefits
of which
Public UK VAT, GNINational Public service & abatement Current Current
insurance service pension contr ibutio- Current transfers transfers to Other Totalfund Social pension contributio- ns to the EU transfers received local current current
Total benefits1 assistance2 payments ns3 budget paid abroad from abroad3 6 government grants expenditure
GZSJ QYRJ NZGO MF77 -MF6Q M9LH NMDZ -NMDL QYJR NMFC ANLP2014/15 201 316 96 974 94 316 34 365 −24 339 11 744 7 009 −130 121 937 20 840 651 5092015/16 203 682 100 099 94 138 35 654 −26 209 11 254 7 226 −128 117 996 18 609 654 0102016/17 204 720 101 987 93 413 36 514 −27 194 9 551 7 794 −318 114 353 18 554 661 9902017/18 208 420 104 469 94 396 37 189 −27 634 10 186 8 025 −364 114 111 18 042 681 914
2016 Oct 16 850 8 474 7 757 2 875 −2 256 993 955 −83 9 706 1 420 56 211Nov 18 592 10 256 7 644 2 960 −2 268 993 759 −48 8 570 1 362 55 746Dec 17 609 8 605 8 198 3 109 −2 303 −13 1 304 −45 9 074 1 585 54 463
2017 Jan 16 622 8 456 7 572 2 838 −2 244 983 636 −50 9 610 1 599 55 381Feb 15 404 7 669 7 143 2 844 −2 252 1 198 300 −1 8 261 1 235 53 429Mar 16 767 8 466 7 860 3 024 −2 583 793 352 −9 9 607 1 289 53 880Apr 17 423 8 404 7 913 3 083 −1 977 990 767 −13 11 184 1 859 61 369May 17 374 8 691 7 992 2 975 −2 284 990 404 −36 9 178 1 994 55 750Jun 17 090 8 412 7 864 3 083 −2 269 1 251 608 −2 12 057 1 408 59 512
Jul 17 407 8 693 8 055 2 928 −2 269 990 601 −10 9 488 1 134 56 818Aug 17 599 8 682 8 072 3 111 −2 266 389 506 −10 8 447 1 683 54 592Sep 17 306 8 412 7 609 3 569 −2 284 918 607 −11 8 993 1 740 55 242Oct 17 344 8 662 7 949 3 039 −2 306 915 585 −85 9 354 1 439 57 933Nov 18 897 10 367 7 808 3 044 −2 322 915 1 625 −77 8 341 1 482 57 296Dec 17 662 8 860 8 068 3 068 −2 334 −1 170 709 −75 9 069 1 275 54 697
2018 Jan 17 256 8 666 7 880 3 040 −2 330 1 082 664 −7 9 489 1 699 57 020Feb 15 763 7 859 7 216 2 990 −2 302 1 835 322 −7 8 372 1 023 56 266Mar 17 299 8 761 7 970 3 259 −2 691 1 081 627 −31 10 139 1 306 55 419Apr 17 382 8 609 7 594 3 212 −2 033 973 467 −5 11 345 1 899 60 923May 18 167 8 946 8 345 3 205 −2 329 757 469 −23 9 678 1 375 56 398Jun 17 369 8 655 7 912 3 121 −2 319 628 541 −11 9 807 1 338 57 781
Jul 17 897 8 942 8 211 3 092 −2 348 981 617 −16 12 247 1 258 61 189Aug 18 204 8 931 8 327 3 325 −2 379 1 031 696 −8 8 713 1 736 57 612Sep 17 596 8 666 7 801 3 522 −2 393 1 075 483 −10 9 194 1 591 55 229Oct 18 150 8 915 8 300 3 315 −2 380 1 080 491 −13 10 066 1 478 61 728
1 NIF benefits are mainly pension related.2 Social assistance primar ily includes benefits related to unemployment, dis-
ability, income support and carers.3 Mar ket output, pension contributions and current grants received from
abroad are recorded as negative expenditure
4 Under ESA2010 includes some ’in-house’ Research & Development output.5 Includes both non-market production and market production of social transfers
in kind6 Excludes abatement

PSA6F Central Government Account : Net Investment
£ million
Net investment
of which of which
Capital Capital Capital CapitalCapital Capital transfers transfers transfers Capital transfers Capital
Gross Less transfers transfers from public from from transfers to public transfers Capitalcapital Depreciati- to central from local corporatio- private central to local corporatio- to pr ivate transfers
formation1 on government government2 ns3 sector4 government government2 ns5 sector3 to APF6 Total7
1 2 3 4 5 6 7 8 9 10 11
MS5Z -NSRN -MFO7 -NMGL -MM9G -ANNN MS6X MF78 MF79 ANNI MF7A -ANNS2014/15 32 190 −17 944 −2 187 −298 − −1 889 24 875 11 993 1 714 11 168 − 36 9342015/16 30 504 −18 313 −2 686 −1 122 − −1 564 27 420 12 968 1 105 13 347 − 36 9252016/17 32 135 −18 313 −1 135 −211 − −924 25 272 11 160 1 490 12 622 − 37 9592017/18 33 646 −18 501 −1 382 −197 − −1 185 25 763 10 719 979 14 065 − 39 526
2016 Oct 2 365 −1 517 −123 4 − −127 1 961 802 79 1 080 − 2 686Nov 2 209 −1 517 −93 −32 − −61 1 606 615 70 921 − 2 205Dec 2 562 −1 516 −105 −14 − −91 2 337 572 129 1 636 − 3 278
2017 Jan 3 062 −1 543 −118 −13 − −105 1 949 860 197 892 − 3 350Feb 3 163 −1 543 −108 −22 − −86 1 368 476 198 694 − 2 880Mar 4 398 −1 543 −197 −24 − −173 3 853 1 407 241 2 205 − 6 511Apr 2 167 −1 536 −95 −4 − −91 3 142 2 291 109 742 − 3 678May 2 619 −1 536 −135 −38 − −97 2 167 1 017 68 1 082 − 3 115Jun 2 850 −1 536 −102 −5 − −97 2 135 684 63 1 388 − 3 347
Jul 2 627 −1 540 −50 − − −50 1 837 682 89 1 066 − 2 874Aug 2 490 −1 540 −96 −1 − −95 1 315 485 79 751 − 2 169Sep 2 643 −1 540 −161 −42 − −119 1 628 702 83 843 − 2 570Oct 2 376 −1 540 −73 −4 − −69 1 970 720 94 1 156 − 2 733Nov 2 640 −1 541 −114 −36 − −78 1 411 556 74 781 − 2 396Dec 2 518 −1 541 −162 −7 − −155 2 506 522 20 1 964 − 3 321
2018 Jan 2 903 −1 550 −39 −14 − −25 2 037 834 108 1 095 − 3 351Feb 3 288 −1 550 −170 −40 − −130 1 710 396 86 1 228 − 3 278Mar 4 525 −1 551 −185 −6 − −179 3 905 1 830 106 1 969 − 6 694Apr 2 373 −1 537 −15 −6 − −9 3 119 1 742 55 1 322 − 3 940May 2 341 −1 537 −59 −31 − −28 1 830 1 035 11 784 − 2 575Jun 2 955 −1 537 −189 −2 − −187 1 703 433 35 1 235 − 2 932
Jul 2 759 −1 547 −519 −3 − −516 1 666 825 25 816 − 2 359Aug 2 823 −1 547 −84 −38 − −46 1 820 728 28 1 064 − 3 012Sep 2 792 −1 547 −36 −8 − −28 2 122 906 34 1 182 − 3 331Oct 3 040 −1 560 −207 −32 − −175 2 355 716 66 1 573 − 3 628
Relationship between columns 3=4+5+6 ; 7=8+9+10+11 ; 12=1+2+3+71 Includes net increase in inventor ies and valuables.2 Includes Housing Revenue Account refor m in Mar 2012.3 The large capital transfers in 2008/09 arise from movements associated
with depositor compensation payments by FSCS and HMT.4 Includes transfer of Royal Mail pension plan assets in April 2012 and
movements associated with depositor compensation payments by FSCSand HMT in 2008/09.
5 Includes capital transfers to Lloyds Banking Group and Royal Bank of Scotlandassociated with equity purchases.
6 APF = Asset Purchase Facility. Currently no capital transfers to the APF havetaken place, but transfers may be made in future.
7 Includes Housing Revenue Account refor m in Mar 2012, transfer of Royal Mailpension plan assets in April 2012 and movements associated with depositorcompensation payments by FSCS and HMT in 2008/09.

REC1 Reconciliation of Public Sector Net Borrowing and Net Cash Requirement(excluding public sector banks)
£ million
Net lending topr ivate sector and Net acquisition of Adjustment for
Net borrowing rest of wor ld company secur ities interest on gilts Accounts Other financial Net cash-B.9g F.4 F.5 F.3 receivable/payable transactions requirement1
1 2 3 4 5 6 7
-J5II JW33 JW34 JW36 JW35 JW37 JW382009 155 548 6 827 34 416 2 736 −2 456 8 747 205 8182010 142 798 −9 493 712 −8 678 15 244 6 084 146 6672011 117 070 −2 837 −29 −4 716 8 725 −14 455 103 7582012 127 479 5 573 −14 638 −5 937 −3 347 −7 468 101 6622013 99 773 4 875 −25 529 2 287 1 763 −20 504 62 665
2014 97 026 8 544 −6 549 −4 476 4 634 −17 112 82 0672015 77 418 −257 −13 345 796 4 648 −13 527 55 7332016 56 585 14 365 1 075 5 756 16 918 −9 101 85 5982017 37 793 4 356 176 −6 803 9 818 49 290 94 630
2009/10 153 135 −448 25 609 1 817 24 392 −3 038 201 4672010/11 136 818 −5 677 260 −7 819 4 327 1 550 129 4592011/12 116 673 1 484 −1 321 −2 291 −1 282 −4 951 108 3122012/13 120 790 4 359 −15 963 −5 126 2 896 −19 952 87 0042013/14 98 219 6 818 −29 088 1 761 1 027 −14 069 64 668
2014/15 90 492 7 790 −1 426 −1 396 10 464 −27 722 78 2022015/16 72 460 −44 −14 036 −1 026 14 361 −21 550 50 1652016/17 45 526 15 430 4 767 4 147 12 886 17 787 100 5432017/18 40 052 7 242 −1 910 −6 895 4 046 37 661 80 196
2015 Q2 24 760 6 654 −4 425 −5 735 −512 1 754 22 496Q3 18 529 −214 −4 600 3 995 7 −5 152 12 565Q4 28 857 −10 073 −2 996 −4 082 3 025 1 286 16 017
2016 Q1 314 3 589 −2 015 4 796 11 841 −19 438 −913Q2 20 978 5 388 −310 −5 957 −42 1 904 21 961Q3 13 911 2 090 19 11 500 27 −13 446 14 101Q4 21 382 3 298 3 381 −4 583 5 092 21 879 50 449
2017 Q1 −10 745 4 654 1 677 3 187 7 809 7 450 14 032Q2 22 177 −7 338 241 −8 874 −700 19 121 24 627Q3 8 484 5 613 −1 598 1 312 −1 827 2 648 14 632Q4 17 877 1 427 −144 −2 428 4 536 20 071 41 339
2018 Q1 −8 486 7 540 −409 3 095 2 037 −4 179 −402Q2 13 635 2 915 −3 704 −6 912 −1 839 8 302 12 397Q3 4 238 2 044 293 1 408 −4 218 426 4 191
2016 Oct 7 487 2 795 2 023 −2 984 −6 893 −3 627 −1 199Nov 8 854 740 1 350 −1 753 2 837 5 773 17 801Dec 5 041 −237 8 154 9 148 19 733 33 847
2017 Jan −11 651 3 162 534 1 943 −13 132 −6 616 −25 760Feb −1 206 1 888 897 −3 486 7 434 3 645 9 172Mar 2 112 −396 246 4 730 13 507 10 421 30 620Apr 8 971 −9 362 167 −5 177 −10 045 3 327 −12 119May 6 965 2 537 −179 −2 049 230 8 415 15 919Jun 6 241 −513 253 −1 648 9 115 7 379 20 827
Jul −866 −1 043 82 1 265 −8 901 8 024 −1 439Aug 4 369 −152 −1 815 −2 417 2 253 301 2 539Sep 4 981 6 808 135 2 464 4 821 −5 677 13 532Oct 7 235 1 693 45 −4 055 −7 934 1 436 −1 580Nov 8 028 −800 148 2 791 3 123 2 113 15 403Dec 2 614 534 −337 −1 164 9 347 16 522 27 516
2018 Jan −9 618 5 551 30 2 157 −17 914 −4 126 −23 920Feb 1 033 1 183 −245 −4 562 7 076 16 500 20 985Mar 99 806 −194 5 500 12 875 −16 553 2 533Apr 5 838 3 006 −1 409 −4 246 −12 192 643 −8 360May 4 349 −12 264 −1 094 701 1 821 6 029Jun 3 448 −79 −2 559 −1 572 9 652 5 838 14 728
Jul −3 879 231 42 1 900 −10 185 −5 725 −17 616Aug 5 272 402 −212 −2 975 671 1 009 4 167Sep 2 845 1 411 463 2 483 5 296 5 142 17 640Oct 8 820 1 253 96 −4 810 −8 112 −1 260 −4 013
Relationship between columns 7=1+2+3+4+5+61 Prior to 1997 was known as public sector borrowing requirement (PSBR)

REC2 Reconciliation of Central Government Net Borrowingand Net Cash Requirement
£ million
Net lending topr ivate sector and Net acquisition of Adjustment for
Net borrowing rest of wor ld company secur ities interest on gilts Accounts Other financial Net cash-B.9g F.4 F.5 F.3 receivable/payable transactions requirement
1 2 3 4 5 6 7
-NMFJ ANRH ANRS ANRU ANRT ANRV RUUX2009 146 822 5 101 32 421 2 735 1 884 9 489 198 4522010 144 874 −10 716 −575 −8 679 14 625 7 989 147 5182011 119 673 −4 095 −757 −4 716 5 581 −6 085 109 6012012 129 631 3 309 −14 951 −5 937 −5 687 −2 779 103 5862013 92 324 3 153 −27 093 2 287 12 903 −10 299 73 275
2014 101 276 5 663 −7 848 −4 476 12 945 −18 518 89 0422015 78 937 −3 341 −13 881 796 16 753 −10 476 68 7882016 51 463 10 215 −3 731 5 756 26 749 −15 481 74 9712017 29 849 1 064 −5 354 −6 803 21 996 −7 807 32 945
2009/10 148 705 −2 076 23 499 1 817 21 960 3 581 197 4862010/11 137 723 −6 996 −693 −7 821 6 743 3 112 132 0682011/12 114 443 −678 −1 471 −2 291 −2 863 1 504 108 6442012/13 124 014 2 069 −18 626 −5 126 1 511 −9 247 94 5952013/14 101 182 4 765 −29 312 1 761 12 445 −11 030 79 811
2014/15 89 644 4 844 −2 755 −1 396 19 609 −26 288 83 6582015/16 72 237 −3 595 −13 902 −1 026 23 567 −17 558 59 7232016/17 39 816 12 591 −4 085 4 147 23 477 −10 593 65 3532017/18 34 589 4 217 −3 372 −6 895 15 331 −8 675 35 195
2015 Q2 30 449 5 925 −5 002 −5 735 3 592 −1 036 28 193Q3 17 915 −638 −4 984 3 995 5 363 −3 708 17 943Q4 27 266 −10 192 −2 204 −4 082 2 804 3 961 17 553
2016 Q1 −3 393 1 310 −1 712 4 796 11 808 −16 775 −3 966Q2 24 765 4 643 −676 −5 957 5 222 −2 075 25 922Q3 12 124 1 245 −95 11 500 5 585 −2 395 27 964Q4 17 967 3 017 −1 248 −4 583 4 134 5 764 25 051
2017 Q1 −15 040 3 686 −2 066 3 187 8 536 −11 887 −13 584Q2 26 131 −7 772 −1 684 −8 874 5 104 −1 409 11 496Q3 6 801 4 305 −1 734 1 312 4 395 −2 660 12 419Q4 11 957 845 130 −2 428 3 961 8 149 22 614
2018 Q1 −10 300 6 839 −84 3 095 1 871 −12 755 −11 334Q2 17 032 2 262 −4 058 −6 912 3 447 2 096 13 867Q3 5 813 736 −37 1 408 3 412 −6 582 4 750
2016 Oct 5 021 2 702 −105 −4 174 −7 384 262 −3 678Nov 8 093 647 −472 −2 975 2 454 1 960 9 707Dec 4 853 −332 −671 2 566 9 064 3 542 19 022
2017 Jan −14 101 2 840 −600 681 −11 117 −5 366 −27 663Feb −3 301 1 566 −659 −4 763 5 923 −2 925 −4 159Mar 2 362 −720 −807 7 269 13 730 −3 596 18 238Apr 8 821 −9 507 −1 189 −6 471 −7 885 297 −15 934May 7 712 2 392 −460 −3 338 1 756 1 848 9 910Jun 9 598 −657 −35 935 11 233 −3 554 17 520
Jul −1 289 −1 479 −63 −28 −6 825 2 648 −7 036Aug 3 369 −588 −1 751 −3 679 3 152 98 601Sep 4 721 6 372 80 5 019 8 068 −5 406 18 854Oct 2 976 1 499 37 −5 347 −8 744 2 812 −6 767Nov 6 746 −994 55 1 504 3 991 −98 11 204Dec 2 235 340 38 1 415 8 714 5 435 18 177
2018 Jan −10 399 5 317 −20 885 −14 618 −8 798 −27 633Feb −1 104 949 −15 −5 839 4 654 −1 066 −2 421Mar 1 203 573 −49 8 049 11 835 −2 891 18 720Apr 6 724 2 788 −1 417 −5 500 −11 067 2 468 −6 004May 5 792 −230 −90 −2 325 3 297 325 6 769Jun 4 516 −296 −2 551 913 11 217 −697 13 102
Jul −2 575 −205 −64 659 −8 025 −3 824 −14 034Aug 5 039 −34 −51 −4 203 3 810 −759 3 802Sep 3 349 975 78 4 952 7 627 −1 999 14 982Oct 6 985 1 059 −15 −6 073 −8 729 2 533 −4 240
Relationship between columns 7=1+2+3+4+5+6

PSA7A Public Sector Net Cash Requirement1
£ million
Central government Local government Non-financial public corporations
of which of which Public PublicOf which: Bank of Sector NCR sector Public
NCR4 Own account NCR4 from CG other NCR4 from CG other England2 ex3 4 banks NCR4 Sector NCR4
1 2 3 4 5 6 7 8 9 10 11 12
RUUW RUUX ABEG ABEC AAZK ABEM ABEI AAZL JW2I JW38 IL6D RURQ2009 196 855 198 452 4 791 −1 488 6 279 4 673 −109 4 782 −2 098 205 818 −118 229 87 5892010 150 743 147 518 2 620 2 744 −124 3 865 481 3 384 −7 336 146 667 −142 185 4 4822011 110 697 109 601 2 148 1 027 1 121 2 056 69 1 987 −10 047 103 758 −130 698 −26 9402012 111 548 103 586 6 076 8 469 −2 393 3 861 −507 4 368 −11 861 101 662 −127 286 −25 6242013 72 943 73 275 1 921 389 1 532 345 −721 1 066 −12 876 62 665 −94 883 −32 218
2014 89 764 89 042 307 511 −204 5 149 211 4 938 −12 431 82 067 −8 588 73 4792015 69 129 68 788 −2 438 359 −2 797 2 089 −18 2 107 −12 706 55 733 −20 245 35 4882016 77 185 74 971 5 257 2 192 3 065 3 390 22 3 368 1 980 85 598 12 415 98 0132017 35 154 32 945 4 387 2 385 2 002 3 314 −176 3 490 53 984 94 630 −19 929 74 701
2009/10 198 592 197 486 4 958 368 4 590 3 308 738 2 570 −4 285 201 467 −106 428 95 0392010/11 134 013 132 068 773 1 958 −1 185 3 998 −13 4 011 −7 380 129 459 −121 184 8 2752011/12 117 672 108 644 8 816 8 793 23 2 104 235 1 869 −11 252 108 312 −162 065 −53 7532012/13 95 862 94 595 1 765 1 626 139 3 224 −359 3 583 −12 580 87 004 −106 286 −19 2822013/14 78 433 79 811 −3 048 −283 −2 765 591 −1 095 1 686 −12 686 64 668 −66 451 −1 783
2014/15 84 540 83 658 213 729 −516 6 594 153 6 441 −12 263 78 202 −10 024 68 1782015/16 60 748 59 723 2 389 888 1 501 683 137 546 −12 630 50 165 −355 49 8102016/17 66 961 65 353 4 357 1 768 2 589 3 791 −160 3 951 27 042 100 543 −6 653 93 8902017/18 38 615 35 195 5 789 3 510 2 279 1 733 −90 1 823 37 479 80 196 −11 952 68 244
2015 Q2 28 369 28 193 −3 459 485 −3 944 100 −309 409 −2 338 22 496 −6 792 15 704Q3 17 981 17 943 −1 158 −205 −953 −108 243 −351 −4 112 12 565 −3 330 9 235Q4 17 771 17 553 1 048 −2 1 050 −212 220 −432 −2 372 16 017 −3 328 12 689
2016 Q1 −3 373 −3 966 5 958 610 5 348 903 −17 920 −3 808 −913 13 095 12 182Q2 27 235 25 922 −2 479 1 164 −3 643 755 149 606 −2 237 21 961 13 097 35 058Q3 28 611 27 964 −127 547 −674 1 210 100 1 110 −14 946 14 101 −6 888 7 213Q4 24 712 25 051 1 905 −129 2 034 522 −210 732 22 971 50 449 −6 889 43 560
2017 Q1 −13 597 −13 584 5 058 186 4 872 1 304 −199 1 503 21 254 14 032 −5 973 8 059Q2 11 971 11 496 −2 410 481 −2 891 1 273 −6 1 279 14 268 24 627 −5 970 18 657Q3 12 929 12 419 −848 460 −1 308 232 50 182 2 829 14 632 −3 993 10 639Q4 23 851 22 614 2 587 1 258 1 329 505 −21 526 15 633 41 339 −3 993 37 346
2018 Q1 −10 136 −11 334 6 460 1 311 5 149 −277 −113 −164 4 749 −402 2 004 1 602Q2 14 247 13 867 −3 341 480 −3 821 249 −100 349 1 622 12 397 2 003 14 400Q3 5 522 4 750 −884 802 −1 686 −159 −30 −129 484 4 191 2 001 6 192
2016 Oct −4 143 −3 678 −992 −104 −888 147 −361 508 3 324 −1 199 −2 296 −3 495Nov 9 679 9 707 1 284 −55 1 339 223 27 196 6 587 17 801 −2 296 15 505Dec 19 176 19 022 1 613 30 1 583 152 124 28 13 060 33 847 −2 297 31 550
2017 Jan −27 859 −27 663 −1 631 10 −1 641 892 −206 1 098 2 642 −25 760 −1 991 −27 751Feb −3 965 −4 159 2 791 177 2 614 −3 17 −20 10 543 9 172 −1 991 7 181Mar 18 227 18 238 3 898 −1 3 899 415 −10 425 8 069 30 620 −1 991 28 629Apr −15 492 −15 934 −2 010 456 −2 466 536 −14 550 5 289 −12 119 −1 991 −14 110May 9 761 9 910 −339 −76 −263 382 −73 455 5 966 15 919 −1 991 13 928Jun 17 702 17 520 −61 101 −162 355 81 274 3 013 20 827 −1 988 18 839
Jul −7 247 −7 036 −2 309 17 −2 326 −521 −228 −293 8 427 −1 439 −1 331 −2 770Aug 1 005 601 1 189 178 1 011 827 226 601 −78 2 539 −1 331 1 208Sep 19 171 18 854 272 265 7 −74 52 −126 −5 520 13 532 −1 331 12 201Oct −6 948 −6 767 47 65 −18 −203 −246 43 5 343 −1 580 −1 331 −2 911Nov 12 209 11 204 1 152 870 282 243 135 108 2 804 15 403 −1 331 14 072Dec 18 590 18 177 1 388 323 1 065 465 90 375 7 486 27 516 −1 331 26 185
2018 Jan −27 788 −27 633 462 176 286 −208 −331 123 3 459 −23 920 668 −23 252Feb −2 094 −2 421 3 014 306 2 708 −142 21 −163 20 534 20 985 668 21 653Mar 19 746 18 720 2 984 829 2 155 73 197 −124 −19 244 2 533 668 3 201Apr −6 083 −6 004 −2 285 155 −2 440 90 −234 324 −161 −8 360 668 −7 692May 7 313 6 769 8 375 −367 23 169 −146 −771 6 029 668 6 697Jun 13 017 13 102 −1 064 −50 −1 014 136 −35 171 2 554 14 728 667 15 395
Jul −13 953 −14 034 −1 401 88 −1 489 43 −7 50 −2 224 −17 616 667 −16 949Aug 4 434 3 802 821 541 280 −125 91 −216 −331 4 167 667 4 834Sep 15 041 14 982 −304 173 −477 −77 −114 37 3 039 17 640 667 18 307Oct −3 630 −4 240 630 700 −70 −127 −90 −37 −276 −4 013 667 −3 346
Relationship between columns: 1=2+4+7 ; 10=2+3+6+9 ; 12=10+11GGNCR (series RUUI) =1+5
1 Previously known as the borrowing requirement of the sector concerned2 Includes Bank of England Asset Purchase Facility Fund and Special Liquid-
ity Scheme. Figures derived from Bank of England accounts and ONS esti-mates
Figures for most recent months are ONS estimates3 Excluding public sector banks4 NCR = Net Cash Requirement

PSA7C Central Government Net Cash Requirement
£ million
Central Government without NRAMand B&B and Networ k Rail1 NRAM and B&B1 Networ k Rail Central Government with NRAM and B&B and Networ k Rail1
of whichof which: Own
NCR2 4 account NCR2 3 NCR2 3 NCR2 Own account To LG To PC
1 2 3 4 5 6 7 8
M98R M98S M98W MUI2 RUUW RUUX ABEC ABEI2009 195 503 197 100 − 1 352 196 855 198 452 −1 488 −1092010 155 649 152 424 −5 987 1 081 150 743 147 518 2 744 4812011 120 083 118 987 −10 654 1 268 110 697 109 601 1 027 692012 115 091 107 129 −5 232 1 689 111 548 103 586 8 469 −5072013 73 782 74 114 −3 738 2 899 72 943 73 275 389 −721
2014 95 491 94 769 −4 633 −1 094 89 764 89 042 511 2112015 88 147 87 806 −15 739 −3 279 69 129 68 788 359 −182016 82 284 80 070 −2 693 −2 406 77 185 74 971 2 192 222017 36 946 34 737 116 −1 908 35 154 32 945 2 385 −176
2009/10 198 821 197 715 −1 566 1 337 198 592 197 486 368 7382010/11 139 626 137 681 −6 608 995 134 013 132 068 1 958 −132011/12 126 537 117 509 −10 225 1 360 117 672 108 644 8 793 2352012/13 98 582 97 315 −4 517 1 797 95 862 94 595 1 626 −3592013/14 79 251 80 629 −4 086 3 268 78 433 79 811 −283 −1 095
2014/15 92 327 91 445 −5 240 −2 547 84 540 83 658 729 1532015/16 78 522 77 497 −14 249 −3 525 60 748 59 723 888 1372016/17 71 133 69 525 −2 141 −2 031 66 961 65 353 1 768 −1602017/18 40 707 37 287 −223 −1 869 38 615 35 195 3 510 −90
2015 Q2 31 112 30 936 −1 862 −881 28 369 28 193 485 −309Q3 21 232 21 194 −2 370 −881 17 981 17 943 −205 243Q4 28 161 27 943 −9 509 −881 17 771 17 553 −2 220
2016 Q1 −1 983 −2 576 −508 −882 −3 373 −3 966 610 −17Q2 29 122 27 809 −1 379 −508 27 235 25 922 1 164 149Q3 30 039 29 392 −920 −508 28 611 27 964 547 100Q4 25 106 25 445 114 −508 24 712 25 051 −129 −210
2017 Q1 −13 134 −13 121 44 −507 −13 597 −13 584 186 −199Q2 12 357 11 882 81 −467 11 971 11 496 481 −6Q3 13 298 12 788 98 −467 12 929 12 419 460 50Q4 24 425 23 188 −107 −467 23 851 22 614 1 258 −21
2018 Q1 −9 373 −10 571 −295 −468 −10 136 −11 334 1 311 −113Q2 14 446 14 066 −64 −135 14 247 13 867 480 −100Q3 6 045 5 273 −388 −135 5 522 4 750 802 −30
2016 Oct −3 987 −3 522 13 −169 −4 143 −3 678 −104 −361Nov 9 835 9 863 13 −169 9 679 9 707 −55 27Dec 19 258 19 104 88 −170 19 176 19 022 30 124
2017 Jan −27 799 −27 603 109 −169 −27 859 −27 663 10 −206Feb −3 656 −3 850 −140 −169 −3 965 −4 159 177 17Mar 18 321 18 332 75 −169 18 227 18 238 −1 −10Apr −15 286 −15 728 −50 −156 −15 492 −15 934 456 −14May 9 839 9 988 78 −156 9 761 9 910 −76 −73Jun 17 804 17 622 53 −155 17 702 17 520 101 81
Jul −7 155 −6 944 64 −156 −7 247 −7 036 17 −228Aug 1 104 700 57 −156 1 005 601 178 226Sep 19 349 19 032 −23 −155 19 171 18 854 265 52Oct −6 728 −6 547 −64 −156 −6 948 −6 767 65 −246Nov 12 364 11 359 1 −156 12 209 11 204 870 135Dec 18 789 18 376 −44 −155 18 590 18 177 323 90
2018 Jan −27 299 −27 144 −333 −156 −27 788 −27 633 176 −331Feb −1 947 −2 274 9 −156 −2 094 −2 421 306 21Mar 19 873 18 847 29 −156 19 746 18 720 829 197Apr −6 062 −5 983 24 −45 −6 083 −6 004 155 −234May 6 909 6 365 449 −45 7 313 6 769 375 169Jun 13 599 13 684 −537 −45 13 017 13 102 −50 −35
Jul −13 796 −13 877 −112 −45 −13 953 −14 034 88 −7Aug 4 605 3 973 −126 −45 4 434 3 802 541 91Sep 15 236 15 177 −150 −45 15 041 14 982 173 −114Oct −3 188 −3 798 −397 −45 −3 630 −4 240 700 −90
Relationships between columns 1+3+4=5 ; 2+3+4=6 ; 6+7+8=51 NRAM = Norther n Rock Asset Management, B&B = Bradford and Bingley.2 NCR = Net Cash Requirement3 Does not include Net Cash Requirement to Central Government4 Negative NCR reflects change in financing as from 2014/15 new financing
requirements of Networ k Rail were met through core central governmentborrowing and are therefore included in main CGNCR.

PSA7D Central Government Net Cash Requirement on own account(receipts and outlays on a cash basis)
£ million
Cash receipts Cash outlays
HM Revenue and Customs8 Netacquisiti- Net
Total Interest on of depar tmen- Ownpaid Corporati- and Other Interest company tal account
over1 Income tax2 on tax10 NICs3 V.A.T.4 dividends receipts5 Total payments securities6 outlays 7 Total NCR9
1 2 3 4 5 6 7 8 9 10 11 12 13
MIZX RURC N445 ABLP EYOO RUUL RUUM RUUN RUUO ABIF RUUP RUUQ M98S2009 384 875 153 101 36 236 95 053 68 637 6 666 31 282 422 823 29 304 41 809 548 810 619 923 197 1002010 411 846 153 237 42 153 95 860 80 865 5 274 34 063 451 183 34 008 − 569 599 603 607 152 4242011 434 438 157 066 43 236 101 033 95 208 5 757 42 235 482 430 43 923 − 557 494 601 417 118 9872012 436 196 154 430 40 726 102 232 98 619 9 842 38 399 484 437 39 934 −14 287 565 919 591 566 107 1292013 451 668 159 730 40 417 106 702 103 726 46 577 36 652 534 897 48 025 −5 954 566 940 609 011 74 114
2014 467 588 164 107 41 576 109 238 109 165 16 854 92 517 576 959 41 777 −5 164 635 115 671 728 94 7692015 489 448 173 361 44 931 113 130 114 135 14 882 64 357 568 687 42 255 −18 070 632 308 656 493 87 8062016 516 568 179 599 47 627 121 367 119 020 16 908 38 405 571 881 51 034 −3 392 604 309 651 951 80 0702017 553 087 188 197 55 718 129 806 123 889 18 287 43 347 614 721 44 536 −17 079 622 001 649 458 34 737
2009/10 382 331 147 374 36 633 95 516 70 160 6 201 32 326 420 858 32 189 29 273 557 111 618 573 197 7152010/11 419 580 157 090 43 045 96 548 83 499 5 559 38 589 463 728 36 577 − 564 832 601 409 137 6812011/12 437 603 155 279 43 135 101 617 98 292 7 252 39 358 484 213 44 504 −747 557 965 601 722 117 5092012/13 437 357 155 955 40 482 102 037 100 570 19 730 46 410 503 497 41 131 −14 273 573 954 600 812 97 3152013/14 456 500 160 804 40 327 107 691 104 442 37 494 73 554 567 548 48 114 −9 439 609 502 648 177 80 629
2014/15 476 645 168 667 43 004 110 408 111 155 16 805 58 108 551 558 41 784 −2 682 603 901 643 003 91 4452015/16 494 864 175 510 44 408 113 703 115 748 14 813 64 721 574 398 42 228 −17 985 627 652 651 895 77 4972016/17 528 679 185 741 50 816 124 925 119 571 17 142 33 149 578 970 50 784 −4 358 602 069 648 495 69 5252017/18 557 677 187 843 56 390 130 930 125 050 16 072 41 768 615 517 44 109 −14 467 623 162 652 804 37 287
2015 Q2 113 942 38 284 9 459 28 415 27 058 5 156 10 234 129 332 7 255 −4 950 157 963 160 268 30 936Q3 121 984 42 789 10 833 28 587 28 603 2 080 17 614 141 678 14 081 −4 898 153 689 162 872 21 194Q4 115 014 34 605 12 608 26 499 28 996 3 559 19 863 138 436 7 205 −6 486 165 660 166 379 27 943
2016 Q1 143 924 59 832 11 508 30 202 31 091 4 018 17 010 164 952 13 687 −1 651 150 340 162 376 −2 576Q2 118 923 39 844 9 589 30 210 28 045 5 390 6 735 131 048 7 144 −523 152 236 158 857 27 809Q3 129 030 44 291 11 387 31 111 29 450 2 990 9 362 141 382 23 210 −12 147 576 170 774 29 392Q4 124 691 35 632 15 143 29 844 30 434 4 510 5 298 134 499 6 993 −1 206 154 157 159 944 25 445
2017 Q1 156 035 65 974 14 697 33 760 31 642 4 252 11 754 172 041 13 437 −2 617 148 100 158 920 −13 121Q2 127 295 40 411 11 655 31 814 29 942 5 902 18 535 151 732 6 784 −12 753 169 583 163 614 11 882Q3 136 608 44 697 13 457 32 899 30 817 2 446 6 376 145 430 13 286 −1 703 146 635 158 218 12 788Q4 133 149 37 115 15 909 31 333 31 488 5 687 6 682 145 518 11 029 −6 157 683 168 706 23 188
2018 Q1 160 625 65 620 15 369 34 884 32 803 2 037 10 175 172 837 13 010 −5 149 261 162 266 −10 571Q2 132 453 42 416 12 015 33 276 30 511 5 170 19 851 157 474 6 503 −8 550 173 587 171 540 14 066Q3 146 535 47 885 14 027 34 524 33 205 4 407 16 059 167 001 12 474 −5 159 805 172 274 5 273
2016 Oct 48 946 11 856 9 031 10 095 12 303 3 620 893 53 459 444 −2 49 495 49 937 −3 522Nov 38 755 11 565 2 159 9 925 10 959 462 828 40 045 957 −602 49 553 49 908 9 863Dec 36 990 12 211 3 953 9 824 7 172 428 3 577 40 995 5 592 −602 55 109 60 099 19 104
2017 Jan 73 160 32 270 10 074 11 999 13 316 2 641 1 228 77 029 4 519 −601 45 508 49 426 −27 603Feb 45 356 19 292 2 272 10 897 10 981 424 4 294 50 074 593 −1 008 46 639 46 224 −3 850Mar 37 519 14 412 2 351 10 864 7 345 1 187 6 232 44 938 8 325 −1 008 55 953 63 270 18 332Apr 53 962 16 224 7 200 11 721 13 130 4 825 1 652 60 439 366 −12 365 56 710 44 711 −15 728May 38 761 12 241 2 170 9 946 10 414 651 2 903 42 315 853 −386 51 836 52 303 9 988Jun 34 572 11 946 2 285 10 147 6 398 426 13 980 48 978 5 565 −2 61 037 66 600 17 622
Jul 58 981 20 394 8 478 12 267 12 606 1 257 679 60 917 4 502 −1 49 472 53 973 −6 944Aug 41 243 12 895 2 061 10 549 10 481 560 2 583 44 386 391 −1 701 46 396 45 086 700Sep 36 384 11 408 2 918 10 083 7 730 629 3 114 40 127 8 393 −1 50 767 59 159 19 032Oct 51 981 12 556 10 123 10 575 13 061 4 855 1 786 58 622 390 −3 51 688 52 075 −6 547Nov 42 019 11 975 1 625 10 358 11 420 449 2 247 44 715 5 113 −3 50 964 56 074 11 359Dec 39 149 12 584 4 161 10 400 7 007 383 2 649 42 181 5 526 − 55 031 60 557 18 376
2018 Jan 75 495 31 679 10 496 12 790 13 777 667 1 456 77 618 4 723 −2 45 753 50 474 −27 144Feb 46 205 18 840 2 393 11 151 11 584 421 1 518 48 144 203 −1 45 668 45 870 −2 274Mar 38 925 15 101 2 480 10 943 7 442 949 7 201 47 075 8 084 −2 57 840 65 922 18 847Apr 55 718 17 065 7 834 12 373 12 481 3 893 1 938 61 549 362 −1 371 56 575 55 566 −5 983May 40 693 13 019 2 359 10 315 10 741 661 6 194 47 548 307 −4 678 58 284 53 913 6 365Jun 36 042 12 332 1 822 10 588 7 289 616 11 719 48 377 5 834 −2 501 58 728 62 061 13 684
Jul 62 903 22 092 9 009 12 898 13 766 2 911 6 266 72 080 4 649 −2 53 556 58 203 −13 877Aug 44 390 13 752 2 201 11 028 11 243 626 4 060 49 076 337 −1 52 713 53 049 3 973Sep 39 242 12 041 2 817 10 598 8 196 870 5 733 45 845 7 488 −2 53 536 61 022 15 177Oct 54 017 13 264 10 400 11 115 13 098 3 677 3 693 61 387 432 −1 57 158 57 589 −3 798
Relationships between columns 1+6+7=8; 9+10+11=12; 12-8=131 Compr ises payments into the Consolidated Fund and all payo vers of NICS
excluding those for Norther n Ireland.2 Income tax includes capital gains tax and is gross of any tax credits treated
by HM Rev enue and Customs (HMRC) as tax deductions.3 UK receipts net of personal pension rebates; gross of Statutory Mater nity
Pa y and Statutory Sick Pay.4 Payments into Consolidated Fund.5 Including some elements of expenditure not separately identified.
6 Mainly comprises privatisation proceeds.7 Net of certain receipts, and excluding on-lending to local authorities and public
cor porations.8 A much more detailed breakdown of tax receipts is available from HMRC at
www.gov.uk/government/organisations/hm-revenue-customs9 NCR = Net Cash Requirement. Without Norther n Rock Asset Management &
Bradford and Bingley.10 Gross of tax credits. Includes diver ted profit tax.

REC3 Reconciliation of Central Government Net Cash Requirementand Changes in Net Debt
£ million
Adjustments2 related to:
Central Reclassi- Changesgovernme- Net Index Other fications Official National Other in
nt net premia / linked gilt and Official reser ves: Savings & Debt foreign centralcash discounts gilt related imputed Reserves: Special Tax Manageme- currency Other Other governme-
requirem- of gilt capital adjustme- liabilit- Revaluat- Drawing Instrume- nt revaluat- sterling liquid nt netent1 issuances uplift nts3 ies4 ions Rights nts Account ion debt assets Other debt
1 2 3 4 5 6 7 8 9 10 11 12 13 14
M98R LSIW MW7L E3VL E3VM N42A E3VX N42C N42E N42F E3VY E3VZ N42H MW4W2009 195 503 −5 125 −3 171 − −807 630 −7 891 147 − −4 −2 78 40 179 3982010 155 649 −4 771 9 134 − −824 −2 814 −334 −309 − 3 25 −67 −2 155 6902011 120 083 −6 669 6 437 − 32 −2 289 − −259 −5 4 93 −9 1 588 119 0062012 115 091 −15 060 8 576 −8 689 −6 314 1 570 − 202 −3 −5 85 95 −298 95 2502013 73 782 −2 979 672 − 19 4 444 − 169 − − −319 −41 −126 75 621
2014 95 491 −5 517 7 514 − 1 686 931 − 642 2 20 −49 614 1 089 102 4232015 88 147 −16 199 2 677 − 470 1 070 − −115 3 −46 −96 −2 476 −14 73 4212016 82 284 −20 196 −2 236 − 574 −6 110 − 396 −9 81 −143 −3 228 −646 50 7672017 36 946 −11 636 11 342 − −225 819 − 233 1 3 −64 −57 −497 36 865
2009/10 198 821 −3 053 −1 008 − −721 −763 −7 891 −154 2 −2 24 273 158 185 6862010/11 139 626 −5 230 9 603 − −891 −1 045 −334 −350 −3 2 28 −359 103 141 1502011/12 126 537 −11 290 4 504 − −6 306 −2 381 − −116 −5 −1 88 84 1 747 112 8612012/13 98 582 −11 404 8 477 −8 689 21 631 − 589 −1 − 97 −18 −1 011 87 2742013/14 79 251 −1 413 1 389 − 21 4 893 − −119 − −1 −356 74 877 84 616
2014/15 92 327 −10 410 4 470 − 1 685 1 368 − 1 007 2 −54 −54 344 626 91 3112015/16 78 522 −15 988 4 367 − 471 −1 391 − −155 2 66 −181 −3 180 −404 62 1292016/17 71 133 −18 827 −327 − 504 −4 366 − 129 −8 43 −36 −2 316 −255 45 6742017/18 40 707 −10 854 11 421 − −150 2 298 − 276 1 2 −53 −255 −523 42 870
2014 Q4 27 342 −2 893 2 663 − 1 264 740 − −58 − 21 73 598 621 30 371
2015 Q1 7 642 −4 826 −2 335 − − 67 − 548 − −74 −32 −254 1 737Q2 31 112 −3 746 3 280 − 502 1 678 − −216 1 −14 −7 −725 4 31 869Q3 21 232 −4 394 −35 − −7 −811 − −297 1 44 −40 −2 551 −15 13 127Q4 28 161 −3 233 1 767 − −25 136 − −150 1 −2 −17 1 054 −4 27 688
2016 Q1 −1 983 −4 615 −645 − 1 −2 394 − 508 −1 38 −117 −958 −389 −10 555Q2 29 122 −4 264 3 287 − 602 −3 264 − −109 −7 25 −7 −1 006 −164 24 215Q3 30 039 −7 039 −7 118 − −2 −1 274 − −3 −1 19 −9 −1 135 −93 13 384Q4 25 106 −4 278 2 240 − −27 822 − − − −1 −10 −129 − 23 723
2017 Q1 −13 134 −3 246 1 264 − −69 −650 − 241 − − −10 −46 2 −15 648Q2 12 357 −1 937 6 644 − −138 741 − −59 −1 2 −27 94 33 17 709Q3 13 298 −3 439 3 051 − 2 564 − −29 − − −9 −266 −71 13 101Q4 24 425 −3 014 383 − −20 164 − 80 2 1 −18 161 −461 21 703
2018 Q1 −9 373 −2 464 1 343 − 6 829 − 284 − −1 1 −244 −24 −9 643Q2 14 446 −907 5 153 − −29 −1 186 − −23 − − −2 −143 − 17 309Q3 6 045 −2 469 2 698 − 2 −63 − −21 −2 −1 −7 −295 31 5 918
2016 Oct −3 987 −1 767 1 459 − 3 −1 726 − 123 − − −3 −251 8 −6 141Nov 9 835 −2 471 839 − −31 2 613 − −82 − −1 −5 −33 −4 10 660Dec 19 258 −40 −58 − 1 −65 − −41 − − −2 155 −4 19 204
2017 Jan −27 799 −403 1 006 − 2 −180 − 292 1 − −4 −86 −2 −27 173Feb −3 656 −2 684 2 180 − 3 −780 − −117 −2 − −3 −29 9 −5 079Mar 18 321 −159 −1 922 − −74 310 − 66 1 − −3 69 −5 16 604Apr −15 286 −1 201 3 815 − −104 811 − 127 −1 − −22 69 19 −11 773May 9 839 −598 1 227 − −33 −474 − −35 − 2 −2 −29 19 9 916Jun 17 804 −138 1 602 − −1 404 − −151 − − −3 54 −5 19 566
Jul −7 155 −1 760 1 533 − 2 −98 − 64 1 1 −3 −18 16 −7 417Aug 1 104 −213 1 099 − 5 −1 472 − −127 −2 4 15 −120 −160 133Sep 19 349 −1 466 419 − −5 2 134 − 34 1 −5 −21 −128 73 20 385Oct −6 728 −439 2 726 − 8 −104 − −44 − 1 −6 89 218 −4 279Nov 12 364 −2 420 −3 524 − −32 480 − −32 1 − −6 33 −14 6 850Dec 18 789 −155 1 181 − 4 −212 − 156 1 − −6 39 −665 19 132
2018 Jan −27 299 −125 850 − 3 1 286 − 301 − −2 −3 −215 −12 −25 216Feb −1 947 −1 958 2 988 − 1 −1 097 − −211 − 1 5 −100 2 −2 316Mar 19 873 −381 −2 495 − 2 640 − 194 − − −1 71 −14 17 889Apr −6 062 −457 3 011 − 5 −127 − 225 − − 8 36 −12 −3 373May 6 909 −222 336 − −34 −1 385 − −142 −2 1 −4 372 9 5 838Jun 13 599 −228 1 806 − − 326 − −106 2 −1 −6 −551 3 14 844
Jul −13 796 −1 729 1 377 − 2 142 − −113 −1 − −2 −128 −14 −14 262Aug 4 605 −272 1 510 − 6 −565 − −2 − − −1 −26 53 5 308Sep 15 236 −468 −189 − −6 360 − 94 −1 −1 −4 −141 −8 14 872Oct −3 188 349 3 653 − 6 −1 473 − −244 − − −2 −142 101 −940
Relationship between columns 14=1+2+3+4+5+6+7+8+9+10+11+121 Excluding Norther n Rock Asset Management (NRAM), Bradford & Bingley
(B&B) and Networ k Rail (NR) - although cash flows relating to NRAM andB&B are included from October 2014 and for NR from April 2015
2 All adjustments reflect differences between when, and at what value, liabili-ties and assets are scored in net debt and their related cash flows
3 Includes gilts that are transferred to central government (such as those previ-ously held by the Royal Mail Pension Plan) as well as timing differences wherecash flows and debt movements were recorded in adjacent months
4 Includes the impact of imputed finance leases as well as the reclassificationsof London Continental Railway and the reorganisation of the Housing RevenueAccount

PSA8A General Government Consolidated Gross Debtnominal values at end of period
£ million
Central government gross debt
Br itish Other sterling Total centralgovernment stock Ster ling debt and foreign government (CG)
(gilts) treasury bills National savings Tax instruments currency debt1 NRAM and B&B2 Networ k Rail gross debt
1 2 3 4 5 6 7 8
BKPM BKPJ ACUA ACRV KW6Q KW6R MDL3 BKPW2010/11 918 599 63 174 97 773 679 37 029 55 571 25 666 1 198 4912011/12 1 042 347 69 933 102 045 638 47 341 42 323 29 086 1 333 7132012/13 1 142 442 56 370 101 702 633 39 616 34 084 33 737 1 408 5842013/14 1 244 355 56 453 104 747 880 37 250 28 197 34 465 1 506 3472014/15 1 300 401 65 011 123 469 1 158 41 293 22 576 32 548 1 586 456
2015/16 1 346 337 77 915 134 633 975 38 036 5 637 29 796 1 633 3292016/17 1 404 898 67 032 146 242 1 353 52 200 220 27 776 1 699 7212017/18 1 440 449 64 599 155 942 1 168 52 646 206 26 879 1 741 889
2017 Q2 1 440 365 50 521 147 805 1 550 44 825 205 28 078 1 713 349Q3 1 432 459 61 085 149 474 1 678 49 444 205 28 212 1 722 557Q4 1 445 158 79 933 152 740 1 742 59 971 210 24 951 1 764 705
2018 Q1 1 440 449 64 599 155 942 1 168 52 646 206 26 879 1 741 889Q2 1 472 615 63 651 159 163 1 113 53 479 203 25 915 1 776 139Q3 1 467 130 76 646 161 576 959 57 681 203 26 007 1 790 202
2017 Oct 1 444 285 63 548 150 208 1 693 44 865 209 26 592 1 731 400Nov 1 438 763 70 071 151 046 1 757 41 204 207 27 702 1 730 750Dec 1 445 158 79 933 152 740 1 742 59 971 210 24 951 1 764 705
2018 Jan 1 453 883 59 476 153 465 1 702 45 724 218 26 972 1 741 440Feb 1 463 213 58 680 154 738 1 376 47 416 204 27 062 1 752 689Mar 1 440 449 64 599 155 942 1 168 52 646 206 26 879 1 741 889Apr 1 451 612 59 775 157 265 1 146 50 767 205 26 991 1 747 761May 1 465 412 59 035 158 119 1 130 52 832 213 25 844 1 762 585Jun 1 472 615 63 651 159 163 1 113 53 479 203 25 915 1 776 139
Jul 1 453 056 69 462 159 949 1 108 57 257 228 25 980 1 767 040Aug 1 458 175 73 631 160 814 971 57 464 202 26 043 1 777 300Sep 1 467 130 76 646 161 576 959 57 681 203 26 007 1 790 202Oct 1 480 100 70 330 162 616 930 53 885 217 26 144 1 794 222
Relationship between columns : 8=1+2+3+4+5+6+7
Local government gross debtGeneral government
Total local (GG) consolidatedMoney mar ket government (LG) gross LG/CG cross holdings gross debt
instr uments Loans Bonds debt of debt (Maastricht)
9 10 11 12 13 14
NJHZ MUF5 NJIM EYKP KSC7 BKPX2010/11 − 70 489 1 007 71 496 −55 509 1 214 4782011/12 − 80 195 1 906 82 101 −66 138 1 349 6762012/13 − 82 328 2 301 84 629 −67 646 1 425 5672013/14 − 82 223 2 999 85 222 −69 109 1 522 4602014/15 − 83 072 3 498 86 570 −69 009 1 604 017
2015/16 − 84 891 4 085 88 976 −70 338 1 651 9672016/17 − 87 434 4 447 91 881 −71 568 1 720 0342017/18 − 92 783 4 146 96 929 −74 983 1 763 835
2017 Q2 − 88 578 4 459 93 037 −71 955 1 734 431Q3 − 89 362 4 456 93 818 −72 535 1 743 840Q4 − 91 120 4 150 95 270 −73 906 1 786 069
2018 Q1 − 92 783 4 146 96 929 −74 983 1 763 835Q2 − 93 315 4 146 97 461 −75 295 1 798 305Q3 − 93 847 4 146 97 993 −76 641 1 811 554
2017 Oct − 89 948 4 354 94 302 −72 963 1 752 739Nov − 90 534 4 252 94 786 −74 095 1 751 441Dec − 91 120 4 150 95 270 −73 906 1 786 069
2018 Jan − 91 674 4 149 95 823 −73 971 1 763 292Feb − 92 229 4 147 96 376 −73 973 1 775 092Mar − 92 783 4 146 96 929 −74 983 1 763 835Apr − 92 960 4 146 97 106 −75 328 1 769 539May − 93 138 4 146 97 284 −75 407 1 784 462Jun − 93 315 4 146 97 461 −75 295 1 798 305
Jul − 93 492 4 146 97 638 −75 773 1 788 905Aug − 93 670 4 146 97 816 −76 385 1 798 731Sep − 93 847 4 146 97 993 −76 641 1 811 554Oct − 94 024 4 146 98 170 −77 164 1 815 228
Relationship between columns : 12=9+10+11 ; 14=8+12+131 Including overdraft with Bank of England, Renminbi and Sukuk2 NRAM = Norther n Rock Asset Management, B&B = Bradford and Bingley.
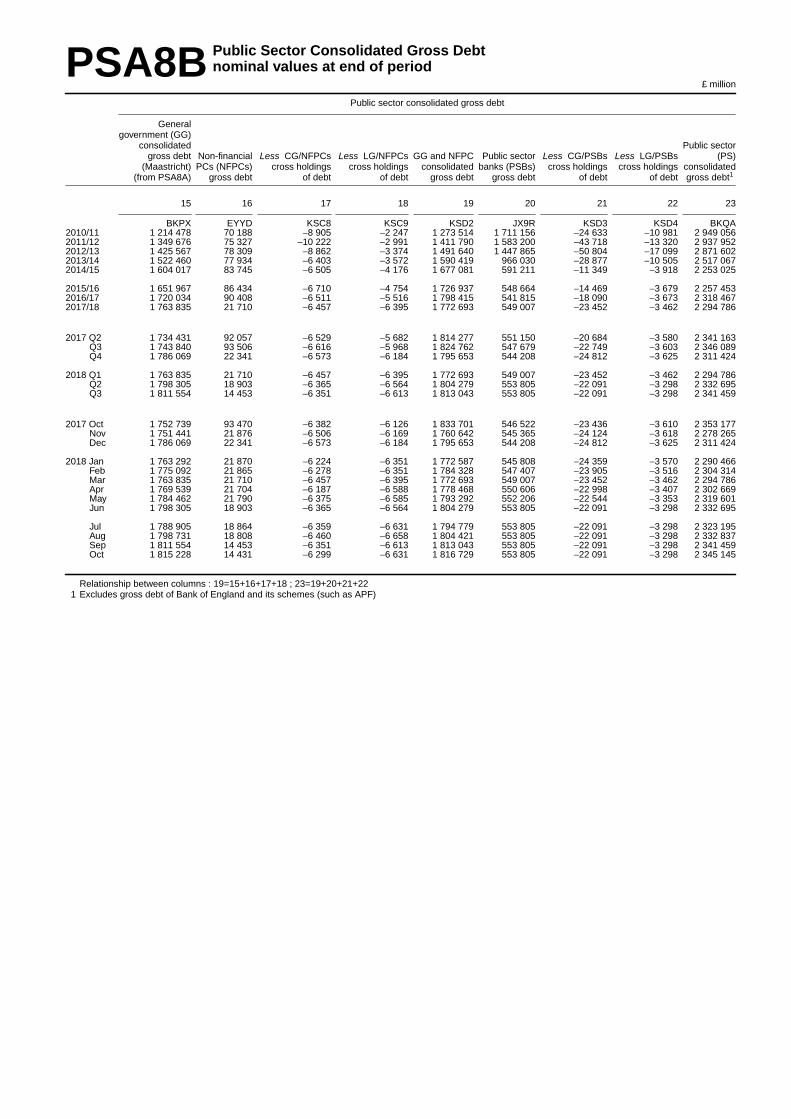
PSA8B Public Sector Consolidated Gross Debtnominal values at end of period
£ million
Public sector consolidated gross debt
Generalgovernment (GG)
consolidated Public sectorgross debt Non-financial Less CG/NFPCs Less LG/NFPCs GG and NFPC Public sector Less CG/PSBs Less LG/PSBs (PS)
(Maastr icht) PCs (NFPCs) cross holdings cross holdings consolidated banks (PSBs) cross holdings cross holdings consolidated(from PSA8A) gross debt of debt of debt gross debt gross debt of debt of debt gross debt1
15 16 17 18 19 20 21 22 23
BKPX EYYD KSC8 KSC9 KSD2 JX9R KSD3 KSD4 BKQA2010/11 1 214 478 70 188 −8 905 −2 247 1 273 514 1 711 156 −24 633 −10 981 2 949 0562011/12 1 349 676 75 327 −10 222 −2 991 1 411 790 1 583 200 −43 718 −13 320 2 937 9522012/13 1 425 567 78 309 −8 862 −3 374 1 491 640 1 447 865 −50 804 −17 099 2 871 6022013/14 1 522 460 77 934 −6 403 −3 572 1 590 419 966 030 −28 877 −10 505 2 517 0672014/15 1 604 017 83 745 −6 505 −4 176 1 677 081 591 211 −11 349 −3 918 2 253 025
2015/16 1 651 967 86 434 −6 710 −4 754 1 726 937 548 664 −14 469 −3 679 2 257 4532016/17 1 720 034 90 408 −6 511 −5 516 1 798 415 541 815 −18 090 −3 673 2 318 4672017/18 1 763 835 21 710 −6 457 −6 395 1 772 693 549 007 −23 452 −3 462 2 294 786
2017 Q2 1 734 431 92 057 −6 529 −5 682 1 814 277 551 150 −20 684 −3 580 2 341 163Q3 1 743 840 93 506 −6 616 −5 968 1 824 762 547 679 −22 749 −3 603 2 346 089Q4 1 786 069 22 341 −6 573 −6 184 1 795 653 544 208 −24 812 −3 625 2 311 424
2018 Q1 1 763 835 21 710 −6 457 −6 395 1 772 693 549 007 −23 452 −3 462 2 294 786Q2 1 798 305 18 903 −6 365 −6 564 1 804 279 553 805 −22 091 −3 298 2 332 695Q3 1 811 554 14 453 −6 351 −6 613 1 813 043 553 805 −22 091 −3 298 2 341 459
2017 Oct 1 752 739 93 470 −6 382 −6 126 1 833 701 546 522 −23 436 −3 610 2 353 177Nov 1 751 441 21 876 −6 506 −6 169 1 760 642 545 365 −24 124 −3 618 2 278 265Dec 1 786 069 22 341 −6 573 −6 184 1 795 653 544 208 −24 812 −3 625 2 311 424
2018 Jan 1 763 292 21 870 −6 224 −6 351 1 772 587 545 808 −24 359 −3 570 2 290 466Feb 1 775 092 21 865 −6 278 −6 351 1 784 328 547 407 −23 905 −3 516 2 304 314Mar 1 763 835 21 710 −6 457 −6 395 1 772 693 549 007 −23 452 −3 462 2 294 786Apr 1 769 539 21 704 −6 187 −6 588 1 778 468 550 606 −22 998 −3 407 2 302 669May 1 784 462 21 790 −6 375 −6 585 1 793 292 552 206 −22 544 −3 353 2 319 601Jun 1 798 305 18 903 −6 365 −6 564 1 804 279 553 805 −22 091 −3 298 2 332 695
Jul 1 788 905 18 864 −6 359 −6 631 1 794 779 553 805 −22 091 −3 298 2 323 195Aug 1 798 731 18 808 −6 460 −6 658 1 804 421 553 805 −22 091 −3 298 2 332 837Sep 1 811 554 14 453 −6 351 −6 613 1 813 043 553 805 −22 091 −3 298 2 341 459Oct 1 815 228 14 431 −6 299 −6 631 1 816 729 553 805 −22 091 −3 298 2 345 145
Relationship between columns : 19=15+16+17+18 ; 23=19+20+21+221 Excludes gross debt of Bank of England and its schemes (such as APF)

PSA8C General Government Net Debtnominal values at end of period
£ million
General Central government (CG) deposits and other short ter m Local government (LG) deposits and othergovernment assets shor t ter m assets
(GG)consolidated Bank and Bank and
gross debt building building General(Maastr icht) Official society Other liquid NRAM and B&B society Other liquid government
(from PSA8A) reser ves Total deposits assets liquid assets1 Total deposits assets net debt
24 25 26 27 28 29 30 31 32 33
BKPX AIPD KSD5 BKSM BKSN MDL5 KSD6 BKSO BKQG MDK22010/11 1 214 478 52 969 37 965 5 783 21 204 10 978 22 372 19 145 3 227 1 101 1722011/12 1 349 676 60 954 60 637 6 672 45 634 8 331 22 856 18 123 4 733 1 205 2292012/13 1 425 567 68 218 47 049 6 034 31 813 9 202 25 245 21 111 4 134 1 285 0552013/14 1 522 460 68 266 61 619 8 280 45 572 7 767 27 898 23 171 4 727 1 364 6772014/15 1 604 017 83 365 40 605 6 805 27 344 6 456 29 937 23 674 6 263 1 450 110
2015/16 1 651 967 93 277 31 556 8 023 20 336 3 197 29 528 22 698 6 830 1 497 6062016/17 1 720 034 107 869 42 869 8 178 33 744 947 28 009 20 260 7 749 1 541 2872017/18 1 763 835 115 545 35 281 9 625 24 830 826 26 167 17 771 8 396 1 586 842
2017 Q2 1 734 431 109 721 36 656 9 561 26 141 954 31 604 22 282 9 322 1 556 450Q3 1 743 840 110 371 31 838 9 881 21 144 813 32 692 23 544 9 148 1 568 939Q4 1 786 069 113 412 52 649 8 721 42 964 964 31 155 22 575 8 580 1 588 853
2018 Q1 1 763 835 115 545 35 281 9 625 24 830 826 26 167 17 771 8 396 1 586 842Q2 1 798 305 119 959 48 764 9 780 38 169 815 30 502 20 502 10 000 1 599 080Q3 1 811 554 120 221 56 316 11 491 44 249 576 31 766 22 064 9 702 1 603 251
2017 Oct 1 752 739 111 590 45 464 11 379 33 165 920 32 285 22 962 9 323 1 563 400Nov 1 751 441 109 231 39 212 10 021 28 274 917 31 169 23 009 8 160 1 571 829Dec 1 786 069 113 412 52 649 8 721 42 964 964 31 155 22 575 8 580 1 588 853
2018 Jan 1 763 292 113 900 51 941 9 769 41 350 822 30 693 21 737 8 956 1 566 758Feb 1 775 092 114 468 64 839 9 385 54 655 799 28 277 19 759 8 518 1 567 508Mar 1 763 835 115 545 35 281 9 625 24 830 826 26 167 17 771 8 396 1 586 842Apr 1 769 539 116 257 43 777 10 445 32 432 900 29 178 19 991 9 187 1 580 327May 1 784 462 120 697 49 904 10 438 38 124 1 342 29 556 20 290 9 266 1 584 305Jun 1 798 305 119 959 48 764 9 780 38 169 815 30 502 20 502 10 000 1 599 080
Jul 1 788 905 118 965 54 744 11 665 42 351 728 31 820 21 872 9 948 1 583 376Aug 1 798 731 122 064 56 560 11 044 44 788 728 31 363 21 932 9 431 1 588 744Sep 1 811 554 120 221 56 316 11 491 44 249 576 31 766 22 064 9 702 1 603 251Oct 1 815 228 124 863 56 347 11 627 44 280 440 31 917 21 872 10 045 1 602 101
Relationship between columns : 33=24-25-26-301 NRAM = Norther n Rock Asset Management, B&B = Bradford and Bingley.

PSA8D Public Sector Net Debtnominal values at end of period
£ million
Public Sector Net Debt ex (PSND ex)
GG and NFPC GG and NFPC liquid assets PSND excluding both Bank of Englandconsolidated gross public sector banks contr ibution to PSND excludingdebt (from PSA8B) Total General government Public corporations and BoE1 PSND2 3 4 public sector banks
34 35 36 37 38 39 40
KSD2 KSD8 MDK3 KSD7 CPOF A8J8 KSE62010/11 1 273 514 120 527 113 306 7 221 1 152 987 4 630 1 157 6172011/12 1 411 790 153 183 144 447 8 736 1 258 607 −5 464 1 253 1432012/13 1 491 640 150 383 140 512 9 871 1 341 257 22 343 1 363 6002013/14 1 590 419 167 804 157 783 10 021 1 422 615 41 763 1 464 3782014/15 1 677 081 164 252 153 907 10 345 1 512 829 41 842 1 554 671
2015/16 1 726 937 166 190 154 361 11 829 1 560 747 41 857 1 602 6042016/17 1 798 415 190 468 178 747 11 721 1 607 947 118 710 1 726 6572017/18 1 772 693 183 266 176 993 6 273 1 589 427 189 435 1 778 862
2017 Q2 1 814 277 189 950 177 981 11 969 1 624 327 134 990 1 759 317Q3 1 824 762 187 323 174 901 12 422 1 637 439 148 674 1 786 113Q4 1 795 653 203 531 197 216 6 315 1 592 122 168 155 1 760 277
2018 Q1 1 772 693 183 266 176 993 6 273 1 589 427 189 435 1 778 862Q2 1 804 279 205 107 199 225 5 882 1 599 172 191 115 1 790 287Q3 1 813 043 213 543 208 303 5 240 1 599 500 190 122 1 789 622
2017 Oct 1 833 701 201 645 189 339 12 306 1 632 056 157 663 1 789 719Nov 1 760 642 185 655 179 612 6 043 1 574 987 160 843 1 735 830Dec 1 795 653 203 531 197 216 6 315 1 592 122 168 155 1 760 277
2018 Jan 1 772 587 202 828 196 534 6 294 1 569 759 171 782 1 741 541Feb 1 784 328 213 878 207 584 6 294 1 570 450 192 344 1 762 794Mar 1 772 693 183 266 176 993 6 273 1 589 427 189 435 1 778 862Apr 1 778 468 195 409 189 212 6 197 1 583 059 193 992 1 777 051May 1 793 292 206 347 200 157 6 190 1 586 945 193 967 1 780 912Jun 1 804 279 205 107 199 225 5 882 1 599 172 191 115 1 790 287
Jul 1 794 779 211 315 205 529 5 786 1 583 464 192 889 1 776 353Aug 1 804 421 215 891 209 987 5 904 1 588 530 193 196 1 781 726Sep 1 813 043 213 543 208 303 5 240 1 599 500 190 122 1 789 622Oct 1 816 729 218 266 213 127 5 139 1 598 463 193 109 1 791 572
Relationship between columns : 40=34-35+39 ; 36=25+26+30
Public Sector Net Debt (PSND)
Public sector Public sector liquid assetsbanks (PSBs)
gross debt (from GG/PSBs cross GG and NFPC Less CG liquid Less LG liquidPSA8B) holdings of debt Total liquid assets PSBs4 assets with PSBs5 assets with PSBs5 PSND
41 42 43 44 45 46 47 48
JX9R MDL7 BKQJ KSD8 KSD9 KSE2 KSE3 BKQK2010/11 1 711 156 −35 614 635 389 120 527 525 478 −1 209 −9 407 2 318 2972011/12 1 583 200 −57 038 685 308 153 183 543 303 327 −11 505 2 247 1802012/13 1 447 865 −67 903 617 542 150 383 495 086 −12 732 −15 195 2 276 4032013/14 966 030 −39 382 521 358 167 804 363 063 −860 −8 649 2 037 4722014/15 591 211 −15 267 436 853 164 252 275 667 −847 −2 219 1 858 014
2015/16 548 664 −18 148 392 820 166 190 229 688 −1 070 −1 988 1 906 4902016/17 541 815 −21 763 417 462 190 468 229 493 −608 −1 891 2 019 7152017/18 549 007 −26 914 430 195 183 266 248 497 225 −1 793 2 054 026
2017 Q2 551 150 −24 264 430 380 189 950 242 411 −174 −1 807 2 045 773Q3 547 679 −26 352 431 703 187 323 245 477 782 −1 879 2 063 060Q4 544 208 −28 437 451 859 203 531 248 542 1 737 −1 951 2 027 720
2018 Q1 549 007 −26 914 430 195 183 266 248 497 225 −1 793 2 054 026Q2 553 805 −25 389 450 637 205 107 248 451 −1 286 −1 635 2 073 173Q3 553 805 −25 389 459 073 213 543 248 451 −1 286 −1 635 2 072 508
2017 Oct 546 522 −27 046 447 341 201 645 246 498 1 101 −1 903 2 063 499Nov 545 365 −27 742 432 666 185 655 247 520 1 418 −1 927 2 006 442Dec 544 208 −28 437 451 859 203 531 248 542 1 737 −1 951 2 027 720
2018 Jan 545 808 −27 929 450 690 202 828 248 527 1 233 −1 898 2 011 558Feb 547 407 −27 421 461 273 213 878 248 512 729 −1 846 2 035 385Mar 549 007 −26 914 430 195 183 266 248 497 225 −1 793 2 054 026Apr 550 606 −26 405 441 872 195 409 248 481 −278 −1 740 2 054 789May 552 206 −25 897 452 344 206 347 248 467 −782 −1 688 2 061 224Jun 553 805 −25 389 450 637 205 107 248 451 −1 286 −1 635 2 073 173
Jul 553 805 −25 389 456 845 211 315 248 451 −1 286 −1 635 2 059 239Aug 553 805 −25 389 461 421 215 891 248 451 −1 286 −1 635 2 064 612Sep 553 805 −25 389 459 073 213 543 248 451 −1 286 −1 635 2 072 508Oct 553 805 −25 389 463 796 218 266 248 451 −1 286 −1 635 2 074 458
Relationship between columns: 48=34+41+42-43+39=23-43+39 ;42=21+22 ; 44=35 : 48=40+(41+42)-(45+46+47)
1 Bank of England2 Figures derived from Bank of England accounts and ONS estimates
3 Includes Asset Purchase Facility (APF) & Special Liquidity Scheme (SLS)4 Transactions of the APF are a significant driver of the BoE net debt5 PSBs = Public Sector Banks

PSA9 Bank of England Asset Purchase Facility Fund (APF)Includes Bank of England Term Funding Scheme (TFS)
£ million
BoE Asset Purchase Facility Fund (APF) inc Ter m Funding Scheme (TFS)
Cash transfers to HM Treasur y Loan liabilityGilt holdings
Interest Net interest of which of which Ter m (at nominalreceivable1 Interest payable1 receivable Total Dividends Total Funding Scheme value)2
MDD6 MDD7 MDD8 MT6A L6BD MDE2 CORN MEX22014 14 308 1 865 12 443 10 898 8 682 374 911 − 326 2542015 13 769 1 866 11 903 8 685 8 685 374 900 − 325 3132016 13 983 1 507 12 476 9 903 9 903 448 482 20 665 361 6902017 15 471 1 490 13 981 11 138 11 138 547 681 102 823 371 728
2013/14 14 398 1 833 12 565 31 102 12 181 374 939 − 325 8942014/15 14 262 1 864 12 398 10 739 10 739 374 932 − 325 8312015/16 13 569 1 865 11 704 8 529 8 529 374 907 − 324 9482016/17 14 489 1 334 13 155 10 087 10 087 497 270 53 493 370 6922017/18 15 432 1 891 13 541 9 301 9 301 564 557 127 016 364 877
2013 Q4 3 589 466 3 123 4 081 − 374 991 − 326 535
2014 Q1 3 591 468 3 123 2 216 − 374 939 − 325 894Q2 3 606 466 3 140 4 107 4 107 374 939 − 325 894Q3 3 565 466 3 099 525 525 365 311 − 321 918Q4 3 546 465 3 081 4 050 4 050 374 911 − 326 254
2015 Q1 3 545 467 3 078 2 057 2 057 374 932 − 325 831Q2 3 549 466 3 083 3 904 3 904 374 932 − 325 831Q3 3 186 468 2 718 411 411 370 667 − 325 313Q4 3 489 465 3 024 2 313 2 313 374 900 − 325 313
2016 Q1 3 345 466 2 879 1 901 1 901 374 907 − 324 948Q2 3 459 467 2 992 3 808 3 808 374 907 − 324 948Q3 3 510 314 3 196 1 148 1 148 388 525 50 334 512Q4 3 669 260 3 409 3 046 3 046 448 482 20 665 361 690
2017 Q1 3 851 293 3 558 2 085 2 085 497 270 53 493 370 692Q2 3 907 315 3 592 4 257 4 257 514 211 69 259 370 692Q3 3 833 324 3 509 702 702 529 493 84 546 371 728Q4 3 880 558 3 322 4 094 4 094 547 681 102 823 371 728
2018 Q1 3 812 694 3 118 248 248 564 557 127 016 364 877Q2 3 756 714 3 042 3 024 3 024 571 303 126 461 372 058Q3 3 721 952 2 769 2 258 2 258 571 260 126 448 371 908
2016 Sep 1 192 80 1 112 − − 388 525 50 334 512Oct 1 190 82 1 108 3 046 3 046 408 494 1 279 345 738Nov 1 222 87 1 135 − − 425 649 5 779 355 928Dec 1 257 91 1 166 − − 448 482 20 665 361 690
2017 Jan 1 262 94 1 168 2 085 2 085 462 353 33 920 358 981Feb 1 277 98 1 179 − − 482 498 42 931 367 401Mar 1 312 101 1 211 − − 497 270 53 493 370 692Apr 1 294 104 1 190 4 257 4 257 502 464 57 525 370 692May 1 289 105 1 184 − − 508 262 63 301 370 692Jun 1 324 106 1 218 − − 514 211 69 259 370 692
Jul 1 293 107 1 186 702 702 523 270 78 318 370 692Aug 1 262 108 1 154 − − 521 294 82 855 366 117Sep 1 278 109 1 169 − − 529 493 84 546 371 728Oct 1 292 110 1 182 4 094 4 094 534 780 89 919 371 728Nov 1 287 223 1 064 − − 537 447 92 586 371 728Dec 1 301 225 1 076 − − 547 681 102 823 371 728
2018 Jan 1 272 227 1 045 248 248 551 705 106 867 371 728Feb 1 277 232 1 045 − − 571 854 127 016 371 728Mar 1 263 235 1 028 − − 564 557 127 016 364 877Apr 1 254 238 1 016 3 024 3 024 571 871 127 011 372 058May 1 231 238 993 − − 571 471 126 611 372 058Jun 1 271 238 1 033 − − 571 303 126 461 372 058
Jul 1 241 238 1 003 2 258 2 258 571 303 126 461 371 908Aug 1 228 357 871 − − 571 305 126 458 371 908Sep 1 252 357 895 − − 571 260 126 448 371 908Oct 1 263 357 906 2 779 2 779 571 214 126 448 371 908
1 Interest flows are HM Treasur y estimates based on publicly available data2 APF has also held and could in future hold assets other than gilts
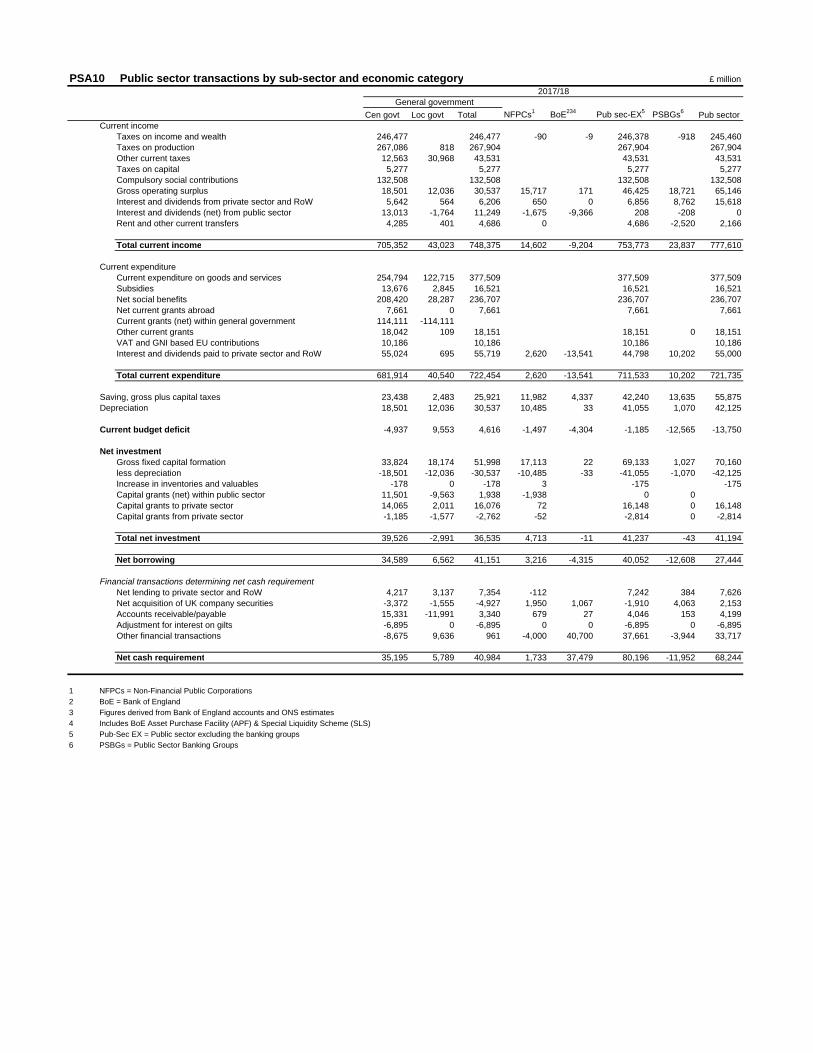
PSA10 Public sector transactions by sub-sector and economic category £ million
Cen govt Loc govt Total NFPCs1
BoE234
Pub sec-EX5
PSBGs6
Pub sector
Current income
Taxes on income and wealth 246,477 246,477 -90 -9 246,378 -918 245,460
Taxes on production 267,086 818 267,904 267,904 267,904
Other current taxes 12,563 30,968 43,531 43,531 43,531
Taxes on capital 5,277 5,277 5,277 5,277
Compulsory social contributions 132,508 132,508 132,508 132,508
Gross operating surplus 18,501 12,036 30,537 15,717 171 46,425 18,721 65,146
Interest and dividends from private sector and RoW 5,642 564 6,206 650 0 6,856 8,762 15,618
Interest and dividends (net) from public sector 13,013 -1,764 11,249 -1,675 -9,366 208 -208 0
Rent and other current transfers 4,285 401 4,686 0 4,686 -2,520 2,166
Total current income 705,352 43,023 748,375 14,602 -9,204 753,773 23,837 777,610
Current expenditure
Current expenditure on goods and services 254,794 122,715 377,509 377,509 377,509
Subsidies 13,676 2,845 16,521 16,521 16,521
Net social benefits 208,420 28,287 236,707 236,707 236,707
Net current grants abroad 7,661 0 7,661 7,661 7,661
Current grants (net) within general government 114,111 -114,111
Other current grants 18,042 109 18,151 18,151 0 18,151
VAT and GNI based EU contributions 10,186 10,186 10,186 10,186
Interest and dividends paid to private sector and RoW 55,024 695 55,719 2,620 -13,541 44,798 10,202 55,000
Total current expenditure 681,914 40,540 722,454 2,620 -13,541 711,533 10,202 721,735
Saving, gross plus capital taxes 23,438 2,483 25,921 11,982 4,337 42,240 13,635 55,875
Depreciation 18,501 12,036 30,537 10,485 33 41,055 1,070 42,125
Current budget deficit -4,937 9,553 4,616 -1,497 -4,304 -1,185 -12,565 -13,750
Net investment
Gross fixed capital formation 33,824 18,174 51,998 17,113 22 69,133 1,027 70,160
less depreciation -18,501 -12,036 -30,537 -10,485 -33 -41,055 -1,070 -42,125
Increase in inventories and valuables -178 0 -178 3 -175 -175
Capital grants (net) within public sector 11,501 -9,563 1,938 -1,938 0 0
Capital grants to private sector 14,065 2,011 16,076 72 16,148 0 16,148
Capital grants from private sector -1,185 -1,577 -2,762 -52 -2,814 0 -2,814
Total net investment 39,526 -2,991 36,535 4,713 -11 41,237 -43 41,194
Net borrowing 34,589 6,562 41,151 3,216 -4,315 40,052 -12,608 27,444
Financial transactions determining net cash requirement Net lending to private sector and RoW 4,217 3,137 7,354 -112 7,242 384 7,626
Net acquisition of UK company securities -3,372 -1,555 -4,927 1,950 1,067 -1,910 4,063 2,153
Accounts receivable/payable 15,331 -11,991 3,340 679 27 4,046 153 4,199
Adjustment for interest on gilts -6,895 0 -6,895 0 0 -6,895 0 -6,895
Other financial transactions -8,675 9,636 961 -4,000 40,700 37,661 -3,944 33,717
Net cash requirement 35,195 5,789 40,984 1,733 37,479 80,196 -11,952 68,244
1 NFPCs = Non-Financial Public Corporations
2 BoE = Bank of England
3 Figures derived from Bank of England accounts and ONS estimates
4 Includes BoE Asset Purchase Facility (APF) & Special Liquidity Scheme (SLS)
5 Pub-Sec EX = Public sector excluding the banking groups
6 PSBGs = Public Sector Banking Groups
2017/18
General government

PSNFL1 Public Sector Net Financial Liabilities excluding public sector banks(PSNFL ex) - consolidated
£ million
Liabilities
of which
Monetar y Provisions Financialgold & Non-life for call der ivativesspecial Debt insurance under and employee Other
drawing Currency & secur ities technical Pensions standardised stock Accountsrights Deposits (AF.3) [at Equity reserves entitlement- guarantees options Pa yable
Total (AF.1) (AF.2) face value] Loans (AF.4) (AF.5) (AF.61) s(AF.6M)1 (AF.66) (AF.7) (AF.8)
1 2 3 4 5 6 7 8 9 10 11
CPNG CPMU CPNH CPNI CPNN CPNO CPNP CPMV CPMW CPMX CPMY2011/12 1 550 376 9 806 433 529 925 154 85 938 − − 44 951 − 3 096 47 9022012/13 1 678 040 10 039 497 707 957 397 85 230 − − 36 072 − 2 517 89 0782013/14 1 770 362 9 411 499 285 1 057 181 82 998 − − 28 723 5 1 226 91 5332014/15 1 851 627 9 446 517 865 1 121 026 87 291 − − 18 272 30 2 260 95 4372015/16 1 911 808 9 912 522 424 1 164 955 89 517 − − 26 170 41 2 913 95 876
2016/17 2 051 878 11 042 666 726 1 162 423 95 844 − − 18 883 41 1 737 95 1822017/18 2 091 162 10 477 740 083 1 178 802 53 488 − − 13 642 33 1 366 93 271
2014 Q3 1 800 621 9 286 493 935 1 097 431 83 695 − − 19 927 21 970 95 356Q4 1 849 662 9 406 512 467 1 127 721 84 837 − − 17 696 27 1 123 96 385
2015 Q1 1 851 627 9 446 517 865 1 121 026 87 291 − − 18 272 30 2 260 95 437Q2 1 894 674 9 068 524 443 1 153 161 86 973 − − 20 743 34 1 913 98 339Q3 1 894 228 9 360 520 838 1 150 396 90 169 − − 23 740 38 2 274 97 413Q4 1 927 301 9 476 523 391 1 176 633 89 903 − − 25 890 41 2 216 99 751
2016 Q1 1 911 808 9 912 522 424 1 164 955 89 517 − − 26 170 41 2 913 95 876Q2 1 951 179 10 510 521 290 1 201 520 93 301 − − 24 929 41 1 619 97 969Q3 1 958 335 10 913 537 576 1 190 169 94 291 − − 22 862 41 3 347 99 136Q4 2 026 919 11 074 614 976 1 189 519 91 146 − − 20 663 41 1 680 97 820
2017 Q1 2 051 878 11 042 666 726 1 162 423 95 844 − − 18 883 41 1 737 95 182Q2 2 086 238 10 865 678 693 1 182 004 97 099 − − 17 479 39 1 689 98 370Q3 2 111 645 10 702 700 183 1 183 807 98 537 − − 16 259 37 1 822 100 298Q4 2 087 545 10 681 729 843 1 189 519 52 244 − − 15 029 35 1 466 88 728
2018 Q1 2 091 162 10 477 740 083 1 178 802 53 488 − − 13 642 33 1 366 93 271Q2 2 126 689 10 848 750 333 1 201 199 51 992 − − 12 116 31 1 340 98 830
Relationship between columns : 1=2+3+4+5+6+7+8+9+10+11
Assets
of which
Provisions FinancialMonetar y for call derivatives Public
gold & Non-life under and sector netspecial insurance standardis- employee Other financial
drawing Currency & Debt technical Pensions ed stock Accounts liabilitiesrights deposits secur ities Loans Equity reser ves entitlemen- guarantees options Receivable ex. (PSNFL
Total (AF.1) (AF.2) (AF.3) (AF.4) (AF.5) (AF.61) ts (AF.6M)1 (AF.66) (AF.7) (AF.8) ex)2
12 13 14 15 16 17 18 19 20 21 22 23
CPNR CPNT CPNU CPNV CPMZ CPNA CPNB CPNW CPNX CPNY CPNC CPNF2011/12 482 875 19 642 112 216 60 481 137 708 52 586 658 − − 2 980 96 604 1 067 5012012/13 485 628 19 996 107 534 46 517 141 287 64 436 699 − − 2 902 102 257 1 192 4122013/14 499 315 16 684 107 923 48 674 147 649 66 827 678 − − 2 991 107 889 1 271 0472014/15 509 268 16 915 87 478 64 868 154 918 69 338 661 − − 2 725 112 365 1 342 3592015/16 492 573 15 776 79 901 78 715 154 707 49 707 635 − − −97 113 229 1 419 235
2016/17 587 250 18 895 93 155 90 191 222 944 48 107 657 − − −5 577 118 878 1 464 6282017/18 656 750 18 031 87 635 84 503 301 629 48 242 651 − − −973 117 032 1 434 412
2014 Q3 487 538 16 306 85 338 51 692 152 071 73 382 667 − − 2 753 105 329 1 313 083Q4 501 446 16 677 93 484 55 667 150 628 75 610 674 − − 2 095 106 611 1 348 216
2015 Q1 509 268 16 915 87 478 64 868 154 918 69 338 661 − − 2 725 112 365 1 342 359Q2 527 334 16 026 99 899 63 453 161 616 68 736 654 − − 4 289 112 661 1 367 340Q3 501 885 16 257 84 465 68 971 161 381 60 370 646 − − 2 439 107 356 1 392 343Q4 496 816 16 215 91 167 71 903 149 857 57 220 639 − − 2 073 107 742 1 430 485
2016 Q1 492 573 15 776 79 901 78 715 154 707 49 707 635 − − −97 113 229 1 419 235Q2 509 982 17 481 91 909 85 647 160 694 44 828 641 − − −5 049 113 831 1 441 197Q3 507 540 18 142 82 415 88 039 162 202 46 531 644 − − −4 625 114 192 1 450 795Q4 547 463 18 258 96 774 89 354 185 467 49 565 654 − − −6 470 113 861 1 479 456
2017 Q1 587 250 18 895 93 155 90 191 222 944 48 107 657 − − −5 577 118 878 1 464 628Q2 595 526 18 578 91 093 91 023 234 192 48 062 664 − − −5 105 117 019 1 490 712Q3 614 156 18 307 92 534 86 635 252 134 50 126 665 − − −2 768 116 523 1 497 489Q4 642 182 18 048 107 243 84 848 270 160 50 809 656 − − −3 043 113 461 1 445 363
2018 Q1 656 750 18 031 87 635 84 503 301 629 48 242 651 − − −973 117 032 1 434 412Q2 675 413 18 579 97 132 94 260 303 590 48 410 658 − − −2 573 115 357 1 451 276
Relationship between columns : 12=13+14+15+16+17+18+19+20+21+22 ;23=1-12
1 Pensions entitlements, claims of pension funds on pension managers andentitlements to non-pension benefits (AF.6M)
2 Excluding public sector banks
3 Data are consistent with the public sector finances release published on 21September 2018 and government deficit and debt data published on 19 Octo-ber 2018.

PSNFL2 Public Sector Net Financial Liabilities excluding public sector banks(PSNFL ex) - sectoral split
£ million
CG net financial LG net financial GG net financial PC net financial BoE net financialliabilities liabilities liabilities liabilities liabilities PSNFL ex
1 2 3 4 5 6
CPNE CPPI CPPJ CPPK CPPL CPNF2007/08 430 717 −28 089 402 628 107 094 −2 105 507 6172008/09 536 120 13 461 549 581 158 403 −507 707 4772009/10 658 099 −9 573 648 526 163 337 18 085 829 9482010/11 784 120 −31 969 752 151 165 717 17 983 935 8512011/12 901 844 −18 948 882 896 167 966 16 639 1 067 501
2012/13 1 010 322 −34 936 975 386 171 964 45 062 1 192 4122013/14 1 094 742 −44 324 1 050 418 175 107 45 522 1 271 0472014/15 1 168 266 −58 488 1 109 778 185 321 47 260 1 342 3592015/16 1 232 441 −50 105 1 182 336 186 449 50 450 1 419 2352016/17 1 248 667 −52 766 1 195 901 191 877 76 850 1 464 628
2017/18 1 284 481 −52 144 1 232 337 123 783 78 292 1 434 412
2007 Q3 424 835 −46 377 378 458 102 977 −1 972 479 463Q4 445 342 −39 869 405 473 104 053 −1 961 507 565
2008 Q1 430 717 −28 089 402 628 107 094 −2 105 507 617Q2 469 237 −14 428 454 809 110 296 −2 446 562 659Q3 475 111 −3 650 471 461 150 691 −2 787 619 365Q4 511 874 8 058 519 932 154 015 −2 948 670 999
2009 Q1 536 120 13 461 549 581 158 403 −507 707 477Q2 581 875 5 699 587 574 158 179 11 273 757 026Q3 599 799 2 651 602 450 159 565 15 392 777 407Q4 664 998 −1 082 663 916 160 874 18 139 842 929
2010 Q1 658 099 −9 573 648 526 163 337 18 085 829 948Q2 706 269 −20 949 685 320 163 103 18 578 867 001Q3 716 266 −28 350 687 916 163 645 18 079 869 640Q4 772 028 −30 735 741 293 163 935 18 408 923 636
2011 Q1 784 120 −31 969 752 151 165 717 17 983 935 851Q2 830 314 −32 103 798 211 165 637 18 060 981 908Q3 870 493 −29 632 840 861 166 540 16 798 1 024 199Q4 909 391 −24 891 884 500 166 774 17 315 1 068 589
2012 Q1 901 844 −18 948 882 896 167 966 16 639 1 067 501Q2 954 661 −27 110 927 551 169 471 37 050 1 134 072Q3 967 101 −32 026 935 075 171 274 39 555 1 145 904Q4 995 424 −32 922 962 502 172 519 45 247 1 180 268
2013 Q1 1 010 322 −34 936 975 386 171 964 45 062 1 192 412Q2 1 045 963 −41 377 1 004 586 172 323 46 057 1 222 966Q3 1 058 795 −39 895 1 018 900 173 003 43 515 1 235 418Q4 1 084 089 −35 526 1 048 563 173 688 46 052 1 268 303
2014 Q1 1 094 742 −44 324 1 050 418 175 107 45 522 1 271 047Q2 1 134 957 −57 912 1 077 045 179 622 46 370 1 303 037Q3 1 147 199 −59 799 1 087 400 180 760 44 923 1 313 083Q4 1 174 190 −56 376 1 117 814 182 947 47 455 1 348 216
2015 Q1 1 168 266 −58 488 1 109 778 185 321 47 260 1 342 359Q2 1 192 912 −58 670 1 134 242 185 317 47 781 1 367 340Q3 1 215 662 −57 578 1 158 084 185 739 48 520 1 392 343Q4 1 246 761 −52 605 1 194 156 185 609 50 720 1 430 485
2016 Q1 1 232 441 −50 105 1 182 336 186 449 50 450 1 419 235Q2 1 255 986 −53 937 1 202 049 188 001 51 147 1 441 197Q3 1 260 282 −55 750 1 204 532 189 305 56 958 1 450 795Q4 1 274 656 −53 569 1 221 087 189 942 68 427 1 479 456
2017 Q1 1 248 667 −52 766 1 195 901 191 877 76 850 1 464 628Q2 1 274 264 −54 281 1 219 983 194 030 76 699 1 490 712Q3 1 281 362 −56 197 1 225 165 194 421 77 903 1 497 489Q4 1 296 120 −53 393 1 242 727 124 301 78 335 1 445 363
2018 Q1 1 284 481 −52 144 1 232 337 123 783 78 292 1 434 412Q2 1 305 437 −56 759 1 248 678 122 053 80 545 1 451 276
Relationship between columns 3=1+2 ; 6=3+4+51 Data are consistent with the public sector finances release published on 21
September 2018 and government deficit and debt data published on 19 Oc-tober 2018.

PSNFL3 Reconciliation between public sector net debt (PSND ex) andpublic sector net financial liabilities (PSNFL ex)
£ million
Liabilities Assets
plus less
Monetar y Provisionsgold & for call Non-life Assets that Public
Public special under insurance are not sector netsector net drawing standardis- Financial Other technical Other included as financial
debt right Pension ed der ivative accounts Equity reser ve accounts liquid liabilitiesex.(PSND liabilities entitlemen- guarantees liabilities payable Loan assets assets assets receivable assets in ex.(PSNFL
ex)3 (AF.1) ts (AF.63)1 (AF.66) (AF.7) (AF.8) (AF.4) (AF.5) (AF.61) (AF.8) PSND ex2 ex)3
1 2 3 4 5 6 7 8 9 10 11 12
KSE6 CPMU CPMV CPMW CPMX CPMY CPMZ CPNA CPNB CPNC CPND CPNF2008/09 768 330 1 994 88 613 − 479 56 393 63 153 28 395 863 101 523 14 398 707 4772009/10 1 011 947 10 155 63 666 − 3 302 53 375 109 336 75 303 807 116 273 10 778 829 9482010/11 1 157 617 9 985 38 224 − 2 857 51 145 137 432 70 954 696 102 304 12 591 935 8512011/12 1 253 143 9 806 44 951 − 3 096 47 902 137 708 52 586 658 96 604 3 841 1 067 5012012/13 1 363 600 10 039 36 072 − 2 517 89 078 141 287 64 436 699 102 257 215 1 192 412
2013/14 1 464 378 9 411 28 723 5 1 226 91 533 147 649 66 827 678 107 889 1 186 1 271 0472014/15 1 554 671 9 446 18 272 30 2 260 95 437 154 918 69 338 661 112 365 475 1 342 3592015/16 1 602 604 9 912 26 170 41 2 913 95 876 154 707 49 707 635 113 229 3 1 419 2352016/17 1 726 657 11 042 18 883 41 1 737 95 182 222 944 48 107 657 118 878 −1 672 1 464 6282017/18 1 778 862 10 477 13 642 33 1 366 93 271 301 629 48 242 651 117 032 −4 315 1 434 412
2015 Q4 1 608 912 9 476 25 890 41 2 216 99 751 149 857 57 220 639 107 742 343 1 430 485
2016 Q1 1 602 604 9 912 26 170 41 2 913 95 876 154 707 49 707 635 113 229 3 1 419 235Q2 1 624 940 10 510 24 929 41 1 619 97 969 160 694 44 828 641 113 831 −1 183 1 441 197Q3 1 640 011 10 913 22 862 41 3 347 99 136 162 202 46 531 644 114 192 1 946 1 450 795Q4 1 697 159 11 074 20 663 41 1 680 97 820 185 467 49 565 654 113 861 −566 1 479 456
2017 Q1 1 726 657 11 042 18 883 41 1 737 95 182 222 944 48 107 657 118 878 −1 672 1 464 628Q2 1 759 317 10 865 17 479 39 1 689 98 370 234 192 48 062 664 117 019 −2 890 1 490 712Q3 1 786 113 10 702 16 259 37 1 822 100 298 252 134 50 126 665 116 523 −1 706 1 497 489Q4 1 760 277 10 681 15 029 35 1 466 88 728 270 160 50 809 656 113 461 −4 233 1 445 363
2018 Q1 1 778 862 10 477 13 642 33 1 366 93 271 301 629 48 242 651 117 032 −4 315 1 434 412Q2 1 790 287 10 848 12 116 31 1 340 98 830 303 590 48 410 658 115 357 −5 839 1 451 276Q3 1 789 622 10 842 12 116 29 1 314 98 830 303 577 48 410 665 115 357 −5 839 1 450 583
2015 Oct 1 592 312 9 223 24 457 39 2 216 98 193 159 040 58 343 639 107 485 343 1 400 590Nov 1 599 528 9 267 25 173 40 2 216 98 972 156 698 57 760 639 107 613 343 1 412 143Dec 1 608 912 9 476 25 890 41 2 216 99 751 149 857 57 220 639 107 742 343 1 430 485
2016 Jan 1 588 775 9 780 25 983 41 2 913 98 459 151 474 54 712 635 109 571 3 1 409 556Feb 1 586 556 10 104 26 077 41 2 913 97 167 153 090 52 210 635 111 400 3 1 405 520Mar 1 602 604 9 912 26 170 41 2 913 95 876 154 707 49 707 635 113 229 3 1 419 235Apr 1 607 431 9 828 25 756 41 1 619 96 573 156 703 48 081 641 113 430 −1 183 1 423 576May 1 614 904 9 726 25 343 41 1 619 97 271 158 698 46 454 641 113 630 −1 183 1 430 664Jun 1 624 940 10 510 24 929 41 1 619 97 969 160 694 44 828 641 113 831 −1 183 1 441 197
Jul 1 614 299 10 716 24 240 41 3 347 98 358 161 180 45 396 644 113 951 1 946 1 427 884Aug 1 622 260 10 755 23 551 41 3 347 98 746 161 666 45 963 644 114 072 1 946 1 434 409Sep 1 640 011 10 913 22 862 41 3 347 99 136 162 202 46 531 644 114 192 1 946 1 450 795Oct 1 642 550 11 439 22 129 41 1 680 98 698 164 314 47 858 654 114 082 −566 1 450 195Nov 1 662 611 11 018 21 396 41 1 680 98 259 169 698 48 818 654 113 971 −566 1 462 430Dec 1 697 159 11 074 20 663 41 1 680 97 820 185 467 49 565 654 113 861 −566 1 479 456
2017 Jan 1 681 067 11 050 20 070 41 1 737 96 940 200 272 49 148 657 115 533 −1 672 1 446 967Feb 1 694 507 11 029 19 476 41 1 737 96 061 210 832 48 721 657 117 206 −1 672 1 447 107Mar 1 726 657 11 042 18 883 41 1 737 95 182 222 944 48 107 657 118 878 −1 672 1 464 628Apr 1 720 273 10 736 18 415 40 1 689 96 244 217 586 47 846 664 118 258 −2 890 1 465 933May 1 736 661 10 927 17 947 39 1 689 97 306 225 798 47 761 664 117 639 −2 890 1 475 597Jun 1 759 317 10 865 17 479 39 1 689 98 370 234 192 48 062 664 117 019 −2 890 1 490 712
Jul 1 759 971 10 871 17 072 38 1 822 99 013 244 136 48 750 665 116 854 −1 706 1 480 088Aug 1 765 986 11 124 16 666 37 1 822 99 655 249 558 49 438 665 116 688 −1 706 1 480 647Sep 1 786 113 10 702 16 259 37 1 822 100 298 252 134 50 126 665 116 523 −1 706 1 497 489Oct 1 789 719 10 768 15 849 36 1 466 96 441 257 423 50 354 656 115 502 −4 233 1 494 577Nov 1 735 830 10 669 15 439 35 1 466 92 583 260 007 50 581 656 114 482 −4 233 1 434 529Dec 1 760 277 10 681 15 029 35 1 466 88 728 270 160 50 809 656 113 461 −4 233 1 445 363
2018 Jan 1 741 541 10 428 14 567 34 1 366 90 242 276 629 49 953 651 114 651 −4 315 1 420 609Feb 1 762 794 10 586 14 104 33 1 366 91 757 299 204 49 098 651 115 842 −4 315 1 420 160Mar 1 778 862 10 477 13 642 33 1 366 93 271 301 629 48 242 651 117 032 −4 315 1 434 412Apr 1 777 051 10 618 13 133 32 1 340 96 027 304 022 49 134 658 116 474 −5 839 1 433 752May 1 780 912 10 773 12 625 31 1 340 97 427 301 342 50 025 658 115 915 −5 839 1 441 007Jun 1 790 287 10 848 12 116 31 1 340 98 830 303 590 48 410 658 115 357 −5 839 1 451 276
Jul 1 776 353 10 816 12 116 30 1 314 98 830 303 590 48 410 665 115 357 −5 839 1 437 276Aug 1 781 726 10 919 12 116 29 1 314 98 830 303 587 48 410 665 115 357 −5 839 1 442 754Sep 1 789 622 10 842 12 116 29 1 314 98 830 303 577 48 410 665 115 357 −5 839 1 450 583Oct 1 791 572 10 965 12 116 28 1 289 98 830 303 577 48 410 672 115 357 −5 839 1 452 623
Relationship between columns: 12 =1+2+3+4+5+6-7-8-9-10-111 Pensions entitlements, claims of pension funds on pension managers and
entitlements to non-pension benefits (AF.6M)2 Currency, deposit, debt security & financial derivatives assets that are not
included as liquid assets in PSND ex3 Excluding public sector banks4 PSND ex is as published in the monthly public sector finances on 21
November 2018
5 PSNFL ex is constrained for the period up to June 2018 to be consistent withquar terly figures based on data in the monthly public sector finances on 21September 2018 and government deficit and debt data published on 19 Octo-ber 2018.
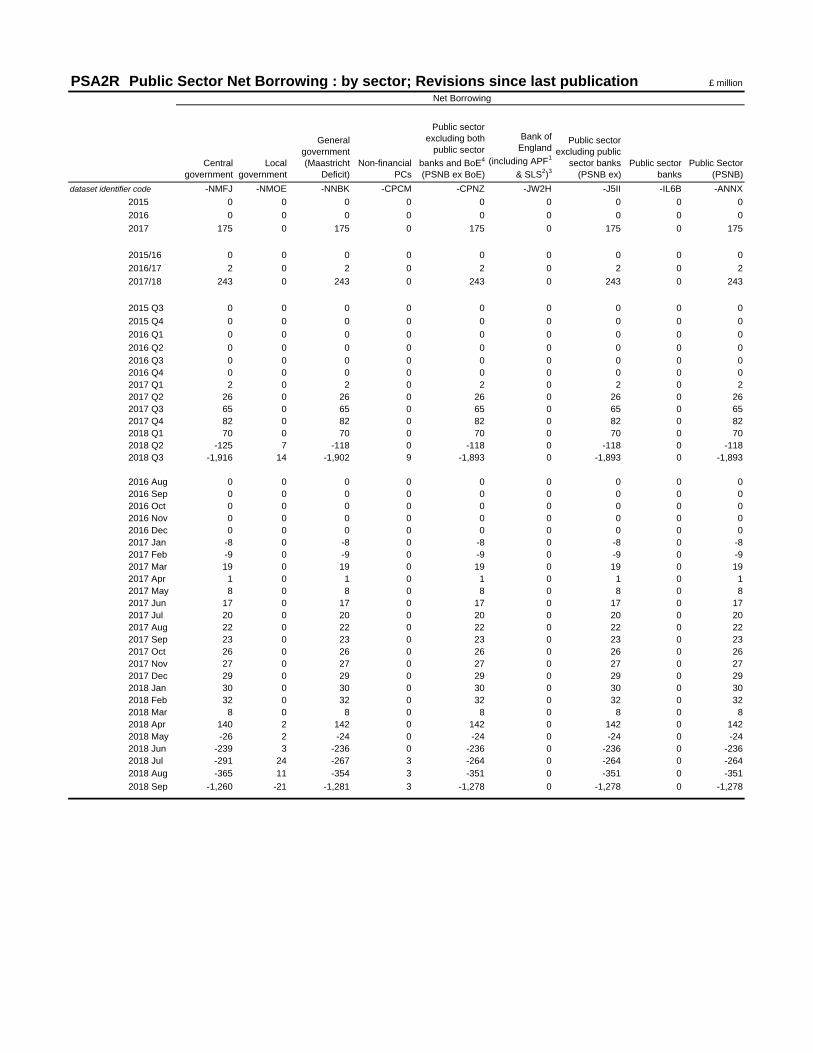
PSA2R Public Sector Net Borrowing : by sector; Revisions since last publication £ million
Central
government
Local
government
General
government
(Maastricht
Deficit)
Non-financial
PCs
Public sector
excluding both
public sector
banks and BoE4
(PSNB ex BoE)
Bank of
England
(including APF1
& SLS2)3
Public sector
excluding public
sector banks
(PSNB ex)
Public sector
banks
Public Sector
(PSNB)
dataset identifier code -NMFJ -NMOE -NNBK -CPCM -CPNZ -JW2H -J5II -IL6B -ANNX
2015 0 0 0 0 0 0 0 0 0
2016 0 0 0 0 0 0 0 0 0
2017 175 0 175 0 175 0 175 0 175
2015/16 0 0 0 0 0 0 0 0 0
2016/17 2 0 2 0 2 0 2 0 2
2017/18 243 0 243 0 243 0 243 0 243
2015 Q3 0 0 0 0 0 0 0 0 0
2015 Q4 0 0 0 0 0 0 0 0 0
2016 Q1 0 0 0 0 0 0 0 0 0
2016 Q2 0 0 0 0 0 0 0 0 0
2016 Q3 0 0 0 0 0 0 0 0 0
2016 Q4 0 0 0 0 0 0 0 0 0
2017 Q1 2 0 2 0 2 0 2 0 2
2017 Q2 26 0 26 0 26 0 26 0 26
2017 Q3 65 0 65 0 65 0 65 0 65
2017 Q4 82 0 82 0 82 0 82 0 82
2018 Q1 70 0 70 0 70 0 70 0 70
2018 Q2 -125 7 -118 0 -118 0 -118 0 -118
2018 Q3 -1,916 14 -1,902 9 -1,893 0 -1,893 0 -1,893
2016 Aug 0 0 0 0 0 0 0 0 0
2016 Sep 0 0 0 0 0 0 0 0 0
2016 Oct 0 0 0 0 0 0 0 0 0
2016 Nov 0 0 0 0 0 0 0 0 0
2016 Dec 0 0 0 0 0 0 0 0 0
2017 Jan -8 0 -8 0 -8 0 -8 0 -8
2017 Feb -9 0 -9 0 -9 0 -9 0 -9
2017 Mar 19 0 19 0 19 0 19 0 19
2017 Apr 1 0 1 0 1 0 1 0 1
2017 May 8 0 8 0 8 0 8 0 8
2017 Jun 17 0 17 0 17 0 17 0 17
2017 Jul 20 0 20 0 20 0 20 0 20
2017 Aug 22 0 22 0 22 0 22 0 22
2017 Sep 23 0 23 0 23 0 23 0 23
2017 Oct 26 0 26 0 26 0 26 0 26
2017 Nov 27 0 27 0 27 0 27 0 27
2017 Dec 29 0 29 0 29 0 29 0 29
2018 Jan 30 0 30 0 30 0 30 0 30
2018 Feb 32 0 32 0 32 0 32 0 32
2018 Mar 8 0 8 0 8 0 8 0 8
2018 Apr 140 2 142 0 142 0 142 0 142
2018 May -26 2 -24 0 -24 0 -24 0 -24
2018 Jun -239 3 -236 0 -236 0 -236 0 -236
2018 Jul -291 24 -267 3 -264 0 -264 0 -264
2018 Aug -365 11 -354 3 -351 0 -351 0 -351
2018 Sep -1,260 -21 -1,281 3 -1,278 0 -1,278 0 -1,278
Net Borrowing