public relations & information department obere ... · mr abdelhadi benzaghou he mohammed d....
TRANSCRIPT


2
Organization of the Petroleum Exporting CountriesPublic Relations & Information DepartmentObere Donaustrasse 93A-1020 ViennaAustria
Head, PR & Information DepartmentEditor-in-ChiefFarouk U. Muhammed, mni
EditorGraham Patterson
DesignAlaa Al-Saigh, Elfi Plakolm
TypesettingAndrea Birnbach, Diana Lavnick
CirculationLeo Rettenbacher
© Copyright 2000Organization of the Petroleum Exporting CountriesISSN 0474-6317
Cover photo and photos on pages 12 and 20 courtesy ofQatar General Petroleum Corporation.Photos on pages 4, 6–7, 9, 40, 44, 47 copyright OPEC
Printed in Austria by Ueberreuter Print and Digimedia

3

4
Foreword
May I welcome the reader to the 1999 edition of
the OPEC Annual Report. These are indeed spe-
cial times for the Organization of the Petroleum
Exporting Countries, since it was in September
1960 that OPEC was founded at its first Meeting
in Baghdad. Our 40th anniversary — which some
people confidently predicted that OPEC would
never reach — is truly a historic achievement.
In a previous edition of the Annual Report, I remarked that the oil price slump that began in late 1997,
and continued throughout 1998 into the early months of 1999, was akin to a violent storm that had rocked
the industry to its foundations. What a difference a year makes.
The series of voluntary output cuts made by OPEC and some non-OPEC oil producers in 1998 and 1999
has had the effect of restoring harmony and stability to the oil market. OPEC, however, has always acted
in the interests of both producers and consumers, and the Organization, in co-operation with its non-
OPEC partners, made two decisions to increase production in the first half of 2000, once again restoring
stability to a market that was threatening to overheat.
Backtracking to the events of 1999, the oil market’s recovery last year can be said to have started with
the 107th OPEC Meeting in March 1999. Prior to that date, oil prices had been languishing at rock bottom,
but the cuts implemented at the March Meeting (which totalled some 2.1 million barrels per day, with
1.7m b/d from OPEC and another 400,000 b/d from non-OPEC) proved to be a decisive turning point.
This was reflected in the average price of the OPEC Reference Basket of seven crudes in 1999, which
climbed to $17.47/b, considerably higher than the all-time low of the previous year.
In addition, the 1999 gross domestic product (GDP) growth rates of the OPEC Member Countries saw
a significant improvement.
5
Despite the increase in oil and gas revenues, many of the OPEC Member Countries continued to implement
the economic and fiscal measures that they had introduced as a response to the price slump. These meas-
ures, which will undoubtedly be beneficial for the long-term health of their economies, included moves
to reduce reliance on oil and gas revenues by boosting non-hydrocarbon exports, making cuts in gov-
ernment spending and introducing measures to privatize some utilities, where appropriate.
Thus, with their actions in seeking to balance the oil market over the past couple of years, OPEC’s Member
Countries have shown once again that they constitute an Organization which has displayed maturity and
a sense of responsibility not just towards oil-exporting countries, but towards all the players in the global
oil industry, whether they be oil exporters or importers, producers or consumers. OPEC really does
have everyone’s best interests at heart, and that can only be good for the health of the world economy.
It has become almost a cliché to describe the 20th century as ‘the age of oil’, and not without reason,
for it was during the past hundred years that inventions such as the car, the aeroplane and — perhaps
most important of all — the internal combustion engine, gave rise to the era of mass transportation and
the consequent enormous demand for oil to fuel the world economy. Now, as we stand with both feet
firmly in the 21st century, projections are that oil demand will continue to grow. Consequently, the need
for oil market stability will also be greater than ever.
Through our actions, and through close co-operation with our partners in non-OPEC, and indeed with
the consuming countries as well, OPEC remains stronger than ever in its determination to help bring
stability and harmony not just to the international oil market, but also to the global economy.
Dr Rilwanu Lukman
Secretary General

6
Heads of Delegation
Algeria
HE Chakib KhelilMinister of Energy & Mines(from December 1999)
Indonesia
HE Lt-Gen SusiloBambang YudhoyonoMinister of Mines & Energy(from October 1999)
Islamic Republic of Iran
HE Bijan Namdar ZangenehMinister of Petroleum
Kuwait
HE Sheikh Saud Nasser Al-SabahMinister of Oil
Iraq
HE Dr Amer Mohammed RasheedMinister of Oil
Socialist People’s LibyanArab Jamahiriya
HE Abdalla Salem El-BadriSecretary of the GeneralPeople’s Committee of Energy

7
Nigeria
HE Dr Rilwanu LukmanPresidential Adviser on Petroleumand Energy (from May 1999)
Qatar
HE Abdullah bin Hamad Al AttiyahMinister of Energy & Industry
Saudi Arabia
HE Ali I. NaimiMinister of Petroleum & MineralResources
United Arab Emirates
HE Obaid bin Saif Al-NasseriMinister of Petroleum & MineralResources
Venezuela
HE Alí Rodríguez AraqueMinister of Energy & Mines(from February 1999)

8
Members of the Board
Algeria
Mr Rachid Boularas (ad hoc)
Indonesia
Dr Rachmat Sudibjo (from April 1999)
Islamic Republic of Iran
HE Hossein Kazempour Ardebili
Iraq
Dr Mussab H. Al-Dujayli
Kuwait
Ms Siham Abdulrazzak Razzouqi
Socialist People’s Libyan Arab Jamahiriya
Mr Ali A. Fituri
Chairman of the OPEC Board of Governors
Nigeria
Dr Aboki Zhawa
Qatar
HE Abdulla H. Salatt
Saudi Arabia
HE Suleiman Jasir Al-Herbish
United Arab Emirates
HE Mohammed D. Al-Hamli
Venezuela
Mr Edgar Rodriguez (from September 1999)

9
The Board of Governors and the Secretary General at their 101st Meeting
Standing (left to right):
Dr Mussab H. Al-Dujayli
Mr Edgar Rodriguez
Mr Ali A. Fituri
Dr Rachmat Sudibjo
HE Hossein Kazempour Ardebili
Mr Abdelhadi Benzaghou
HE Mohammed D. Al-Hamli
Seated (left to right):
HE Abdulla H. Salatt
Dr Aboki Zhawa
Ms Siham Abdulrazzak Razzouqi
Dr Rilwanu Lukman, OPEC Secretary General
HE Suleiman Jasir Al-Herbish
of Governors

10
National Representatives
Algeria
Mr Rachid Boularas
Indonesia
Dr Kardaya Warnika
(from May 1999)
Islamic Republic of Iran
Dr Ali Akbar Gharani
Iraq
Mr Shamkhi H. Faraj
(from November 1999)
Kuwait
Mr Wael Mohammad Al-Mudhaf
Socialist People’s Libyan Arab Jamahiriya
Mr Sultan K. Abushawashi
Nigeria
Mr Mohammed S. Barkindo
Qatar
Mr Jassim Nama
Saudi Arabia
Dr Majid A. Al-Moneef
United Arab Emirates
Mr Ali Saeed Al-Badi
Venezuela
Dr Gloria Mirt
to the Economic Commission Board

11
Secretary General
HE Dr Rilwanu Lukman
Director, Research Division
Dr Shokri M. Ghanem
Head, Energy Studies Department
Dr Rezki Lounnas
Officers
Mr Hamid Dahmani
Mr Fathor Rahman
Dr Davoud Ghasemzadeh
Dr Abdul Muin
Mr Mohammad Alipour-Jeddi
Dr Faten Alawadhi
Mr Khaled Arebi
Mr Rachid Bencherif
Head, Petroleum Market Analysis
Department
Mr Javad Yarjani
Officers
Mr Aliakbar Vahidi Ale-Agha (left March 1999)
Mr Khaled Baruni (left May 1999)
Mr Uwaifo Egbe
Mr Faris A. R. Hasan
Mr Mohamed Behzad
Dr Seyed Mohammadreza Tayyebi Jazayeri
Mr Jamal Moh. D. Bahelil
Mr Oswaldo J. Salas Casanova
Mr Alaa J. Alfraih
Mr Houssein Eldarsi
Head, Data Services Department
Dr Deyaa L. Alkhateeb
Officers
Mr Mohsen Khoshzamir
Dr Jorge Goncalves (left December 1999)
Mr Vincent Job
Dr Atmane Dahmani
Head, Administration & Human Resources
Department
Dr Talal A. Dehrab
Officer
Mr Huddie Dewanto
Head, Public Relations & Information
Department
Mr Farouk U. Muhammed, mni
Officer
Mr Fernando J. Garay
Legal Officer
Mrs Dolores Dobarro
Note: As of end-1999.
Officials of the Secretariat
12
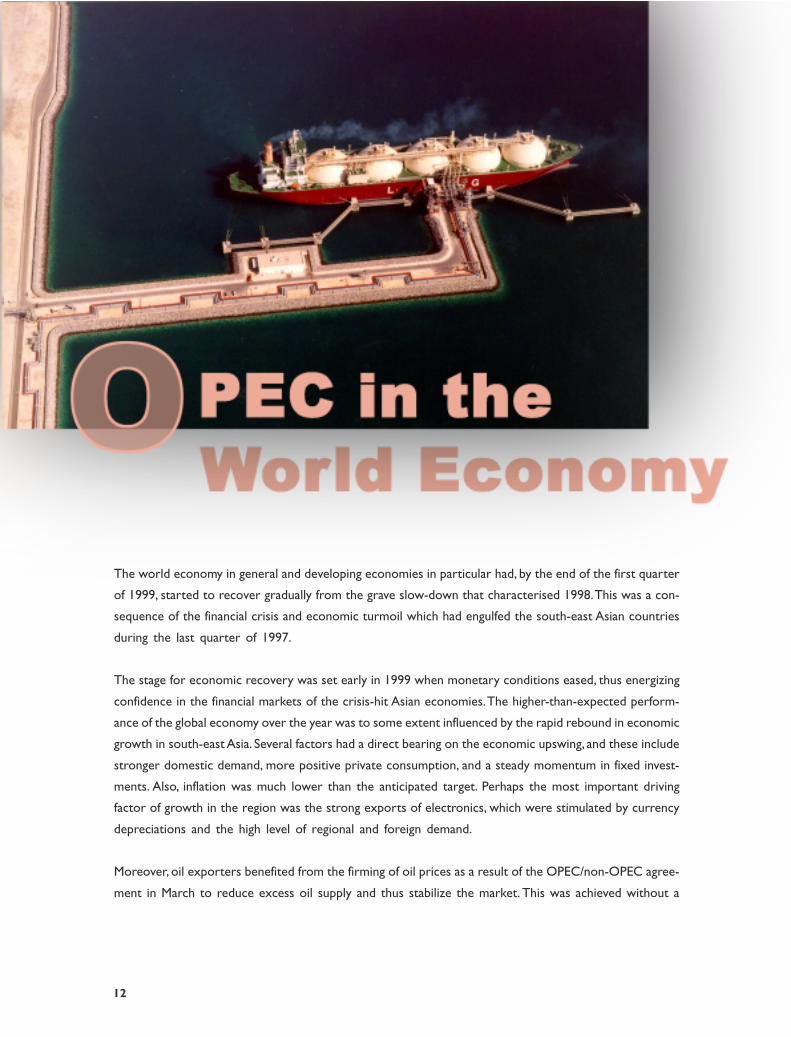
The world economy in general and developing economies in particular had, by the end of the first quarter
of 1999, started to recover gradually from the grave slow-down that characterised 1998. This was a con-
sequence of the financial crisis and economic turmoil which had engulfed the south-east Asian countries
during the last quarter of 1997.
The stage for economic recovery was set early in 1999 when monetary conditions eased, thus energizing
confidence in the financial markets of the crisis-hit Asian economies. The higher-than-expected perform-
ance of the global economy over the year was to some extent influenced by the rapid rebound in economic
growth in south-east Asia. Several factors had a direct bearing on the economic upswing, and these include
stronger domestic demand, more positive private consumption, and a steady momentum in fixed invest-
ments. Also, inflation was much lower than the anticipated target. Perhaps the most important driving
factor of growth in the region was the strong exports of electronics, which were stimulated by currency
depreciations and the high level of regional and foreign demand.
Moreover, oil exporters benefited from the firming of oil prices as a result of the OPEC/non-OPEC agree-
ment in March to reduce excess oil supply and thus stabilize the market. This was achieved without a

13
marked acceleration of inflation in consuming countries. Another factor that influenced growth in 1999
was the consistently above-average performance of the US economy. Furthermore, the anticipated dis-
ruptive effects of the Y2K bug did not really materialize, while Y2K-induced investment and consumption
may in fact have contributed to higher growth in 1999. Also, the economic downturn and effects of the
devaluations in Russia and Brazil were not as severe as expected.
Growth projections for 1999 have been significantly revised upward. Declines in many commodity prices
have eased, thereby providing relief for some commodity-exporting countries which were severely affected
by the repercussions of the slowdown of 1998. Global economic prospects have continued to improve with
the beginning of the second quarter of the year. The world GDP growth rate is estimated to have reached
3.2 per cent in 1999, as against 2.5 per cent in 1998, and is forecast to reach 3.9 per cent in 2000.
The OECD registered 2.9 per cent growth for 1999, an increase of half a percentage point from 1998’s
growth rate of 2.4 per cent. The US economy was the prime mover behind this increase, with a robust
GDP growth of 4.2 per cent. However, emerging signs of inflationary pressure, which have led to further
monetary tightening and record high US trade and current account deficits, created mounting concerns
and revived protectionist sentiments in several US industries.
The world’s developing economies as a group were estimated to have grown by 2.7 per cent in 1999,
as against 1.5 per cent in 1998 (see Table 1).
In Asia and Oceania, the speed of recovery from the recession of 1998 contributed to a notable growth
rate, which jumped from 1.2 per cent in 1998 to 3.9 per cent in 1999. This GDP growth seems to again
be approaching the pre-crisis output level. Asia-Pacific picked up significantly from the contraction of 6.7
per cent in 1998 to a robust export-led growth rate of 3.1 per cent in 1999.
Africa has maintained its economic growth at between 3.4 per cent and 3.5 per cent over the last three
years. The continent is forecast to be among the fastest-growing areas, due to improved stability, reinforced
by positive economic policies and domestic demand.
14
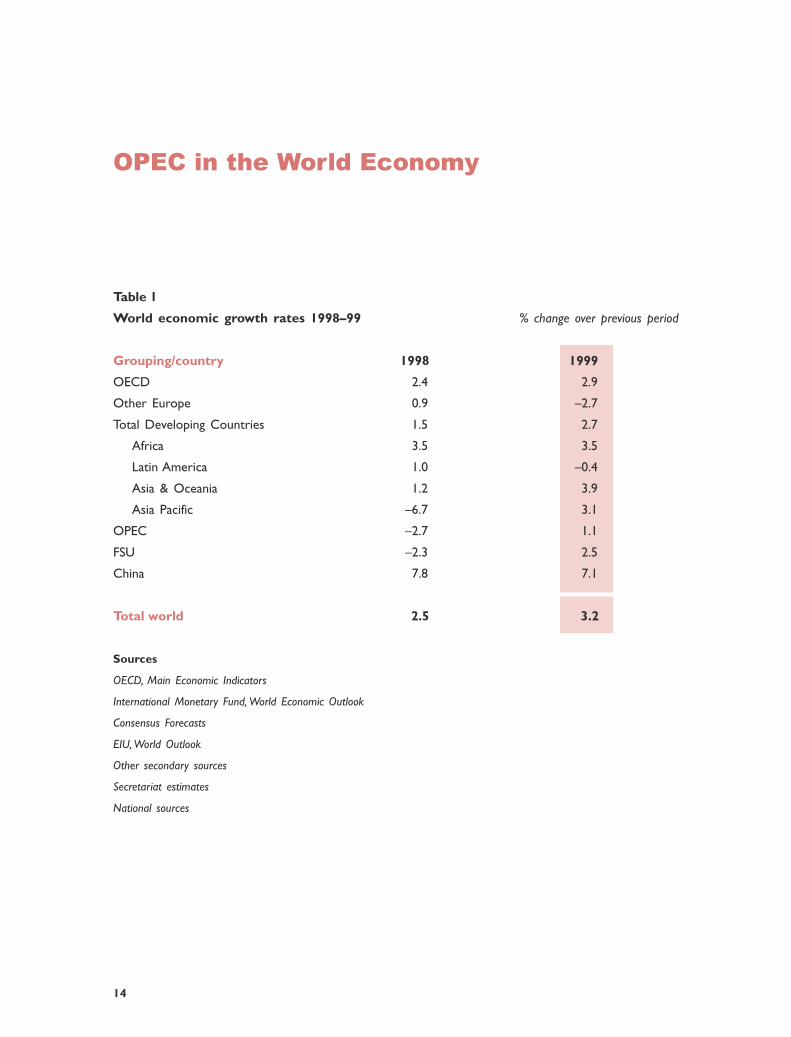
Table 1
World economic growth rates 1998–99 % change over previous period
Grouping/country 1998 1999
OECD 2.4 2.9
Other Europe 0.9 –2.7
Total Developing Countries 1.5 2.7
Africa 3.5 3.5
Latin America 1.0 –0.4
Asia & Oceania 1.2 3.9
Asia Pacific –6.7 3.1
OPEC –2.7 1.1
FSU –2.3 2.5
China 7.8 7.1
Total world 2.5 3.2
Sources
OECD, Main Economic Indicators
International Monetary Fund, World Economic Outlook
Consensus Forecasts
EIU, World Outlook
Other secondary sources
Secretariat estimates
National sources
OPEC in the World Economy

15
Table 2
OPEC Member Countries’ real GDP growth rates 1998–99 % change over previous period
Member Country 1998 1999
Algeria 5.1 4.6
Indonesia –13.5 0.2
IR Iran 1.8 1.5
Iraq 17.0 13.0
Kuwait 2.0 0.9
SP Libyan AJ 2.6 5.4
Nigeria 2.4 2.2
Qatar 12.3 2.0
Saudi Arabia 1.6 1.5
United Arab Emirates 0.4 2.5
Venezuela 0.4 2.5
Average OPEC –2.7 1.1
Sources
IMF, International Financial Statistics
IMF, World Economic Outlook
Economist Intelligence Unit, Country Reports
Asia Pacific Consensus Forecasts
Latin America Consensus Forecasts
Other secondary sources
Official OPEC Member Countries’ statistics
Secretariat estimates

16
Table 3
Comparison: OPEC and non-OPEC developing countries
1997 1998 1999
OPEC non-OPEC OPEC non-OPEC OPEC non-OPEC
Real GDP growth rate 4.3 4.1 –2.7 2.5 1.1 3.2
Petroleum export value ($bn) 166.0 58.9 109.5 38.9 155.3
Value of non-petroleum exports ($bn) 81.2 912.9 83.1 879.7 75.5
Oil exports as % of total exports 67.2 6.1 56.9 4.2 67.3
Value of imports ($bn) 170.0 1,124.4 157.5 1,020.0 165.0
Current account balance ($bn) 16.9 –84.0 –17.0 –58.4 17.2 –18.1
Average Reference Basket price ($/b) 18.68 12.28 17.47
Crude oil production (m b/d) 25.4 9.4 27.8 9.7 26.2 10.0
Reserves ($bn; excluding gold) 83.7 545.1 88.6 556.9 90.6 595.8
Note
Figures are partly estimated.
Sources
IMF, International Financial Statistics
IMF, World Economic Outlook
IMF, Direction of Trade Statistics
EIU, World Outlook and Country Reports
OPEC data bank
Secretariat’s estimates
OPEC in the World Economy
17
Latin American and the Caribbean economies experienced daunting hardship, leading to a shrinkage of
0.4 per cent in 1999, compounded by the repercussions of the Brazilian devaluation.
OPEC as a group made modest gains of 1.1 per cent growth in 1999 (see Table 2), compared to its
contraction of 2.7 per cent in 1998, which resulted largely from the repercussions of the Asian financial
crisis and the slump in oil prices.
There were a number of significant developments in 1999 in the main OPEC economic indicators. For
instance, the value of oil exports as a percentage of total OPEC exports rose from 56.9 per cent in 1998
to 67.3 per cent in 1999, which was marginally higher than 67.2 per cent in 1997. The value of imports
also increased by 4.8 per cent from $157.5bn in 1998 to $165bn in 1999.
Conversely, the value of non-petroleum exports decreased from $83.1bn in 1998 to $75.5bn in 1999,
or a drop of over 9 per cent (see Table 3). These figures indicate the significance of the oil sector, not
only as a hard currency earner or a mechanism of foreign trade, but also as the backbone of the entire
economic structure of our Member Countries.
OPEC petroleum revenues in 1999 recovered to $155.3bn, which represented an increase of almost $46bn
on the 1998 level of $109.5bn. By comparison, total petroleum revenue in 1997 stood at $166.0bn. On
the other hand, as noted above, in 1999 non-petroleum revenues were only $75.5bn, compared to $83.1bn
in 1998 and $81.2bn in 1997 (see Table 3).
If we subtract the value of OPEC’s total imports from the value of total exports in 1999, we find that
the net exports of OPEC as an economic group averaged $65.8bn, which was much higher than the $35.1bn
earned in the previous year. This gain was due to the rise in the average price of the OPEC Reference
Basket of seven crudes, which settled at $17.47/b for the whole of 1999, compared to just $12.28/b in
1998.

18
Furthermore, this increase in OPEC’s trade balance (or net exports) made a considerable contribution
to transforming the current account balance from a deficit of $17.0bn in 1998 to a surplus of $17.2bn
in 1999, which represents a very positive change. This new current account balance was even higher than
the 1997 balance of $16.9bn (see Table 3). In addition, OPEC reserves (excluding gold) in 1999 rose by
2.2 per cent to $90.6bn, from $88.6bn in the previous year.
In fact, at the beginning of the first quarter of 1999, OPEC Member Countries were still affected by the
oil price collapse. The constraints on OPEC production and low oil prices led to downward revisions
in growth prospects and a deterioration in the current account outlook.
Consequently, government budgets also reflected reduced revenues. This led to the implementation of
economic measures aimed at tackling the slump in oil prices, minimizing budget deficits, and achieving
further fiscal consolidation.
Thus, the fiscal austerity of 1998–99 included reducing government spending, diversifying income sources,
expanding the role of the private sector by privatizing public utilities, and enhancing non-oil exports.
At the end of the first quarter of 1999, the agreement in March by OPEC and non-OPEC to cut output
by a further 2.104m b/d, raised hopes of strengthening the oil price.
However, despite this optimism, most OPEC Member Countries continued to implement their austerity
measures in order to better cope with the various economic challenges. It would be reasonable to say
that the upward revision of projected growth in OPEC Member Countries, associated with the cautiously
optimistic economic outlook, has prevailed.
With the beginning of the second half of 1999, improvements in oil prices and revenues had started to
shore up Member Countries’ budget deficits. Some OPEC Member Countries committed their energy
sectors to liberalizing and utilizing their gas reserves to meet increasing domestic requirements as well
as huge export-oriented investments, such as LNG projects.
OPEC in the World Economy

19
Other Member Countries focused on economic reforms, at a time of rising oil prices, new investment
strategies and plans for establishing qualitative and competitive services.
By the end of 1999, OPEC Member Countries had benefited from improved oil prices and revenues. This
was complemented by their prudent economic policies and cautious outlook towards global economic
growth trends.
Notably, most OPEC Member Countries achieved moderate GDP growth rates, excluding Venezuela,
whose GDP contracted by 7.2 per cent in 1999 (see Table 2).
In summary, the rapid rebound in the growth rates of the crisis-hit countries of south-east Asia, coupled
with the speedy improvement in oil prices in the wake of the successful March 1999 OPEC and non-
OPEC oil supply curbs, contributed considerably towards the betterment of world economic growth in
general, and the GDP growth rates of OPEC Countries in particular.
OPEC, true to its declared intention of acting as a responsive and credible player in the world oil market
scene, has, in co-operation with other non-OPEC producers, brought an appreciable measure of success
in stabilising the world oil market so far.
The Organization’s actions have created a reasonable oil price level which, if maintained, will serve the
interests of both oil producers and consumers.
20
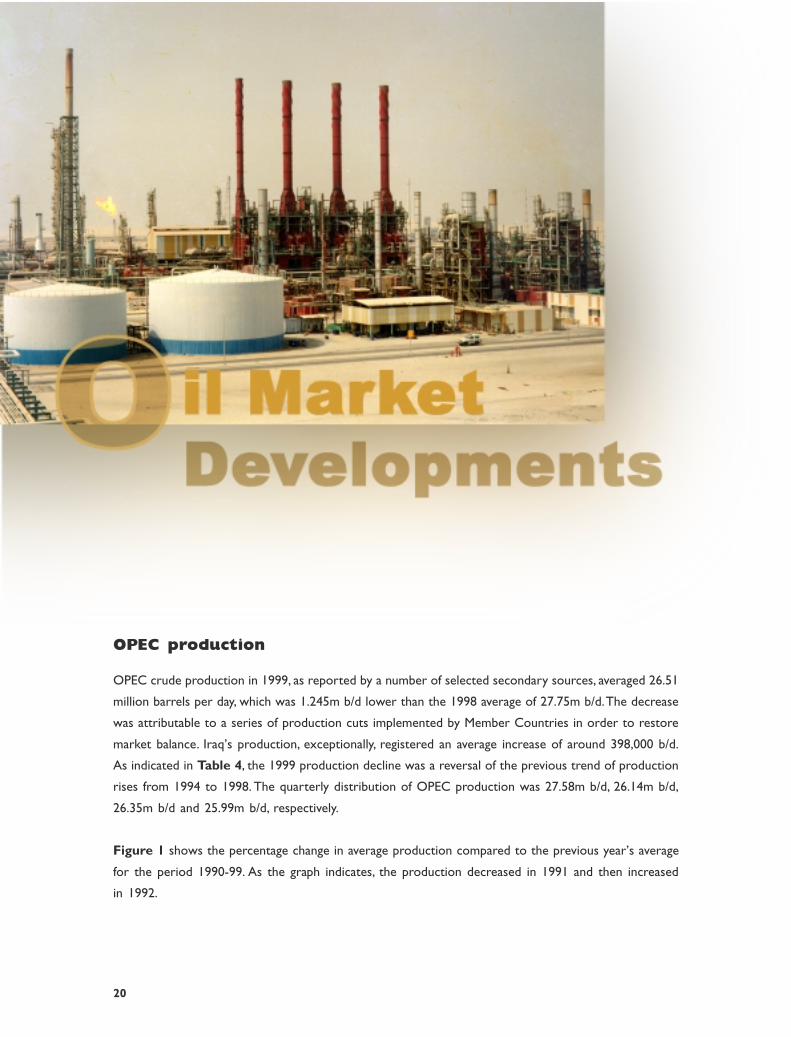
OPEC production
OPEC crude production in 1999, as reported by a number of selected secondary sources, averaged 26.51
million barrels per day, which was 1.245m b/d lower than the 1998 average of 27.75m b/d. The decrease
was attributable to a series of production cuts implemented by Member Countries in order to restore
market balance. Iraq’s production, exceptionally, registered an average increase of around 398,000 b/d.
As indicated in Table 4, the 1999 production decline was a reversal of the previous trend of production
rises from 1994 to 1998. The quarterly distribution of OPEC production was 27.58m b/d, 26.14m b/d,
26.35m b/d and 25.99m b/d, respectively.
Figure 1 shows the percentage change in average production compared to the previous year’s average
for the period 1990-99. As the graph indicates, the production decreased in 1991 and then increased
in 1992.

21
Table 4
OPEC crude oil production according to secondary sources 1,000 b/d
Average Change
1994 1995 1996 1997 1998 1Q99 2Q99 3Q99 4Q99 1999 99/98
Algeria 746 768 813 851 822 811 751 750 752 766 –56
Indonesia 1,329 1,348 1,386 1,389 1,348 1,331 1,314 1,297 1,299 1,310 –38
IR Iran 3,598 3,609 3,668 3,641 3,590 3,729 3,436 3,436 3,439 3,509 –82
Iraq 561 588 610 1,190 2,109 2,488 2,539 2,788 2,215 2,507 398
Kuwait 2,021 2,036 2,051 2,089 2,078 2,009 1,856 1,859 1,903 1,907 –172
SP Libyan AJ 1,376 1,394 1,397 1,431 1,403 1,375 1,312 1,316 1,345 1,337 –66
Nigeria 1,885 1,895 2,065 2,231 2,089 2,007 2,014 1,955 1,961 1,984 –105
Qatar 406 443 481 616 661 676 630 636 643 646 –15
Saudi Arabia 8,013 8,048 8,055 8,304 8,251 8,031 7,469 7,511 7,617 7,655 –596
UAE 2,188 2,194 2,204 2,254 2,265 2,181 2,047 2,046 2,044 2,079 –186
Venezuela 2,455 2,669 2,975 3,226 3,137 2,946 2,770 2,755 2,768 2,809 –328
Total OPEC 24,579 24,991 25,706 27,221 27,754 27,583 26,137 26,350 25,985 26,509 –1,245
Note
Totals may not add up due to independent rounding.
Source
Secretariat’s assessment of selected secondary sources
Output kept falling in both 1993 and 1994. However, the next four years registered significant rises at
an increasing rate to peak at 6 per cent in 1997 but slowing down to nearly two per cent in 1998. Reversing
the previous trend, 1999 witnessed a sharp decline of 4.5 per cent.

22
Oil Market Developments
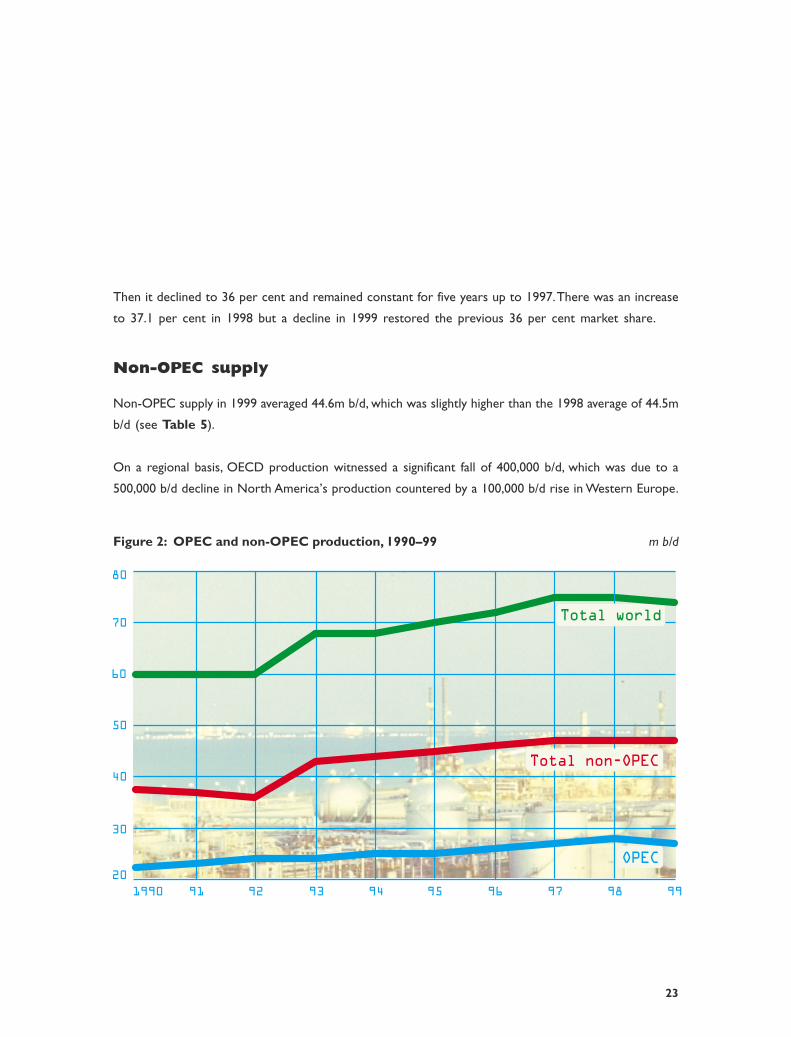
Looking at Figure 2, we can see that OPEC crude oil production grew slowly but steadily in volume
during 1990-98, rising from about 22m b/d in 1990 to nearly 28m b/d in 1998.
This was followed by a slow-down to under 27m b/d in 1999, registering a 22.7 per cent growth in comparison
to 1990. Similar growth rates for non-OPEC supply and for total world supply were 23.7 per cent and
23.3 per cent respectively.
Figure 3 provides similar information on OPEC’s share of world supply in comparison to non-OPEC
during 1990-99. As indicated, OPEC’s share grew to its peak of nearly 40 per cent in 1992.
Figure 1: Percentage change in OPEC production, 1990–99
-5
-4
-3
-2
-1
0
1
2
3
4
5
6
OPEC
9998979695949392911990
23
Figure 2: OPEC and non-OPEC production, 1990–99 m b/d
Then it declined to 36 per cent and remained constant for five years up to 1997. There was an increase
to 37.1 per cent in 1998 but a decline in 1999 restored the previous 36 per cent market share.
Non-OPEC supply
Non-OPEC supply in 1999 averaged 44.6m b/d, which was slightly higher than the 1998 average of 44.5m
b/d (see Table 5).
On a regional basis, OECD production witnessed a significant fall of 400,000 b/d, which was due to a
500,000 b/d decline in North America’s production countered by a 100,000 b/d rise in Western Europe.
20
30
40
50
60
70
80
Total world
Total non-OPEC
OPEC
9998979695949392911990

24
Oil Market Developments
On the other hand, the production in both the Developing Countries and the former Soviet Union (FSU)
rose by nearly 500,000 b/d in total. The aggregate changes thereby offset each other and resulted in an
annual average which was nearly the same as that of 1998.
World oil demand
Total world oil demand for the year registered a considerable recovery from the previous year’s level.
According to the latest estimates, oil demand during 1999 grew by 1.04m b/d; this represents an increase
of 1.4 per cent with respect to the previous year.
Figure 3: OPEC and non-OPEC market share, 1990–99 per cent
30
40
50
60
70
80
Total non-OPEC
OPEC
9998979695949392911990

25
Table 5World supply/demand balance m b/d
1996 1997 1998 1Q99 2Q99 3Q99 4Q99 1999World demandOECD 46.0 46.7 46.9 48.8 45.7 46.9 49.0 47.6North America 22.2 22.7 23.2 23.6 23.4 24.0 24.1 23.8Western Europe 14.9 15.0 15.3 15.8 14.4 14.7 15.6 15.1Pacific 8.8 9.0 8.4 9.4 7.9 8.2 9.2 8.7DCs 17.0 17.6 17.9 18.0 18.2 18.1 18.5 18.2FSU 4.2 4.3 4.2 4.1 3.6 3.8 4.0 3.9Other Europe 0.7 0.7 0.8 0.8 0.8 0.8 0.8 0.8China 3.5 4.0 3.8 4.0 4.3 4.1 4.2 4.2(a) Total world demand 71.4 73.3 73.6 75.8 72.6 73.6 76.4 74.6Non-OPEC supplyOECD 21.8 22.1 21.8 21.5 21.0 21.3 21.9 21.4North America 14.4 14.6 14.5 14.1 14.0 14.0 14.1 14.0Western Europe 6.7 6.8 6.6 6.7 6.4 6.6 7.1 6.7Pacific 0.7 0.7 0.7 0.6 0.6 0.7 0.7 0.7DCs 10.0 10.2 10.5 10.8 10.7 10.8 10.9 10.8FSU 7.0 7.2 7.2 7.3 7.4 7.4 7.6 7.41Other Europe 0.2 0.2 0.2 0.2 0.2 0.2 0.2 0.2China 3.2 3.3 3.2 3.2 3.2 3.2 3.2 3.2Processing gains 1.5 1.6 1.6 1.6 1.6 1.6 1.6 1.6Total non-OPEC supply 43.6 44.6 44.5 44.6 44.0 44.5 45.4 44.6OPEC NGLs 2.7 2.8 2.8 2.8 2.8 2.8 2.8 2.8(b) Total non-OPEC supplyand OPEC NGLs 46.3 47.4 47.3 47.4 46.8 47.3 48.2 47.4OPEC crude oil production1 25.7 27.2 27.8 27.6 26.1 26.4 26.0 26.5Total supply 72.0 74.6 75.1 74.9 72.9 73.6 74.2 73.9Balance (stock changeand miscellaneous) 0.6 1.3 1.5 -0.9 0.4 0.0 -2.2 -0.7Opening stock level (m b; outside FCPEs)OECD onland commercial 2,541 2,551 2,648 2,721 2,672 2,702 2,678 2,721OECD SPR 1,193 1,194 1,202 1,245 1,244 1,250 1,240 1,245OECD total 3,733 3,745 3,850 3,966 3,916 3,952 3,918 3,966Other onland 998 1,001 1,030 1,061 1,047 1,057 1,048 1,061Oil on water 784 797 812 852 898 822 840 852Total stocks 5,516 5,543 5,692 5,878 5,861 5,831 5,806 5,878Days of forward consumption in OECDCommercial onland stocks 55 55 56 56 58 58 55 57SPR 26 26 26 26 27 27 25 26Total 81 80 82 81 86 84 80 83Memo itemsFSU net exports 2.8 2.9 3.1 3.3 3.8 3.7 3.6 3.6[(a) – (b)] 25.2 25.9 26.2 28.5 25.8 26.3 28.2 27.2
Notes: Totals may not add up due to independent rounding.1. Secondary sources.

26
Oil Market Developments
The North America region continued to be an oil-demand power-house, growing by 2.7 per cent, or 630,000
b/d, to 23.78m b/d. The USA, as usual, continued to be the main engine driving demand. Latest estimates
suggest an increase in oil deliveries of approximately 570,000 b/d, or 3.0 per cent, year-on-year. Mexican
demand grew by a healthy 2.5 per cent, or 50,000 b/d; however, demand in Canada, the third country
in this group, showed a more moderate performance growing by just 10,000 b/d, or 0.5 per cent.
Oil demand in Western Europe, on the other hand, declined considerably with respect to the previous
year, contracting by 1.1 per cent, or 170,000 b/d. Oil demand in the ‘big four’ group of countries ex-
perienced a sharp drop falling by almost 230,000 b/d, or 2.6 per cent, year-on-year.
The modest increase in demand in the Other Western Europe group of countries (60,000 b/d) could
only partially offset the contraction in demand of the four biggest oil consuming countries in the region.
The use of hydrocarbons at the margin (fuel oil) increased during 1998 because nuclear and hydropower
were limited; however, this trend has reversed to more normal levels. Progressively less residual fuel oil
and more coal and gas are being used for power generation — coal for reasons of price and natural
gas for both price and environmental reasons.
Finally, European electricity restructuring has opened the way to higher imports of excess nuclear and
hydropower, thereby undermining the fundamentals of the residual fuel oil market.
Oil demand in the OECD Pacific countries continued to recover and is estimated to have increased by
240,000 b/d, or 2.8 per cent, with respect to 1998. South Korea continued to lead this group, with Japan
following at a lower pace.
Developing countries’ (DCs) oil demand for 1999 is projected to have increased by 310,000 b/d, or 1.7
per cent, with respect to the previous year. Apparent demand for the group of ‘Other Regions’, which
includes the FSU, Other Europe and China, is estimated to have grown by a modest 40,000 b/d, or 0.9
per cent.

27
Table 6
Closing stock level (outside FCPEs) m b
1Q99 2Q99 3Q99 4Q99
OECD onland commercial 2,671 2,703 2,678 2,470
OECD SPR 1,244 1,250 1,240 1,228
OECD total 3,915 3,953 3,918 3,699
Other onland 11,047 1,057 1,048 989
Oil on water 898 822 830 822
Total stocks 5,860 5,831 5,796 5,509
In the FSU, apparent demand declined by a considerable 7.5 per cent or 310,000 b/d. On the other hand,
Chinese apparent demand for the year is estimated to have grown by 8.8 per cent, or 340,000 b/d, in
line with the country’s strong economic growth of 7.1 per cent.
Stock movements
OECD onland commercial oil stocks showed a strong draw-down of 251m b to 2,470m b during 1999
(see Table 6), equivalent to an average rate of 688,000 b/d. This huge stock-draw was mainly due to cuts
in crude oil production by OPEC and major non-OPEC producers starting in the second quarter of 1999.
Commercial oil inventories in the DCs witnessed a draw of 72m b to 989m b, or 197,000 b/d.
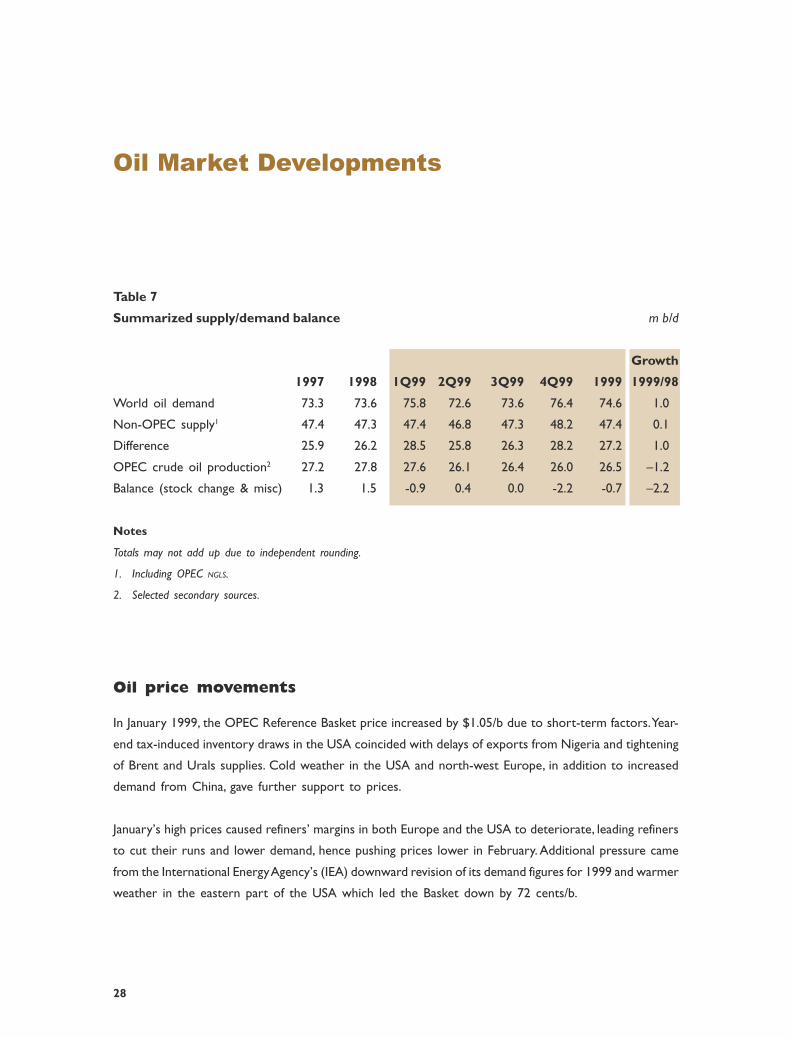
Balance of supply and demand
As indicated in Table 7, the marginal increase in non-OPEC supply was insignificant in comparison to
the rise in world demand. This resulted in a difference of nearly 27.2m b/d. The 1.2m b/d drop in OPEC
crude production contributed further to a negative supply/demand balance, that is an average yearly stock-
draw of 700,000 b/d.
28
Oil Market Developments
Oil price movements
In January 1999, the OPEC Reference Basket price increased by $1.05/b due to short-term factors. Year-
end tax-induced inventory draws in the USA coincided with delays of exports from Nigeria and tightening
of Brent and Urals supplies. Cold weather in the USA and north-west Europe, in addition to increased
demand from China, gave further support to prices.
January’s high prices caused refiners’ margins in both Europe and the USA to deteriorate, leading refiners
to cut their runs and lower demand, hence pushing prices lower in February. Additional pressure came
from the International Energy Agency’s (IEA) downward revision of its demand figures for 1999 and warmer
weather in the eastern part of the USA which led the Basket down by 72 cents/b.
Table 7
Summarized supply/demand balance m b/d
Growth
1997 1998 1Q99 2Q99 3Q99 4Q99 1999 1999/98
World oil demand 73.3 73.6 75.8 72.6 73.6 76.4 74.6 1.0
Non-OPEC supply1 47.4 47.3 47.4 46.8 47.3 48.2 47.4 0.1
Difference 25.9 26.2 28.5 25.8 26.3 28.2 27.2 1.0
OPEC crude oil production2 27.2 27.8 27.6 26.1 26.4 26.0 26.5 –1.2
Balance (stock change & misc) 1.3 1.5 -0.9 0.4 0.0 -2.2 -0.7 –2.2
Notes
Totals may not add up due to independent rounding.
1. Including OPEC NGLS.
2. Selected secondary sources.

29
The long price rally started in March when the Basket gained $2.31/b. The momentum was generated
by a series of meetings between Oil Ministers of OPEC Member Countries which were expanded to
include Ministers from non-OPEC and resulted in the formulation of The Hague Agreement. The OPEC
Conference ratified the agreement, resulting in a production ceiling of 22.98m b/d for the OPEC Member
Countries (excluding Iraq). The rise in April continued, albeit with a greater increase of $2.73/b in the
price of the Basket, with support stemming from good compliance levels by Member Countries and an-
nouncements of deep cuts in their June exports. A shut-down in the 300,000 b/d North Sea Ekofisk field
for two weeks and of 278,000 b/d of Venezuelan production kept prices moving higher.
Prices in May continued their rise, increasing by 42¢/b amid high compliance by OPEC Member Countries.
However, the rise in prices was capped by poor refiners’ margins in both Europe and the USA, which
led refiners to cut their runs in both regions. Higher product stocks in Europe and weaker gasoline demand
were the main causes of the poor margins.
The rise in the Brent price during June was reduced to 13¢/b due to volatility in the futures markets.
The main upward driver for prices was the reported high adherence level by OPEC to the agreed cuts,
in addition to heavy buying by Asian refiners. However, the downtrend was due to refinery run cuts in
the USA. The increase in OPEC’s compliance rate and statements by OPEC Member Countries that
production cuts would not be eased until there was a solid market recovery led to a big rise of
$2.67/b in July’s monthly Basket price.
Disruptions in Nigeria’s production and consecutive draws on US crude oil stocks for three weeks co-
incided with a single buyer inflating the Basket price, all these factors together giving it additional momentum.
The Basket price continued its uptrend in August, adding $1.35/b to its value, due to fundamental support
from OPEC production levels and increasing market confidence in OPEC pledges which gave the Caracas
Meeting more leverage on the market when it confirmed that the cuts would be kept until the end of
March 2000. Lower oil stocks in the USA and reports that non-OPEC supply would be limited due to
budgetary and technical constraints in oil companies countered the pressure generated by Germany’s
intention to sell some strategic reserves.

30
Oil Market Developments
10
15
20
25
Dec 2Nov 4Oct 7Sep 2Aug 5Jul 1Jun 3May 6Apr 1Mar 4Feb 4Jan 7
Basket
WTI
Brent
Dubai
Figure 4: Weekly movement of crude prices, 1999 $/b
The gain in the Basket price increased to $2.50/b in September, basically due to statements by OPEC
officials throughout the month that the cuts were to be maintained until March 2000, which were confirmed
by the OPEC Conference at the end of the month. In October, prices moved downwards as there was
a big sell-off by the funds in the futures market due to factors partly related to other commodity markets.
The sell-off was triggered by the anticipation of an increase in Norway’s output during the year 2000
and a reported decrease of two per cent in OPEC’s compliance rate, in addition to a build-up in US
crude stocks.

31
Table 8Average monthly spot prices for selected crudes, 1999 $/b
Crude (API) S%w Jan Feb Mar Apr May June July Aug Sept Oct Nov Dec Av99
OPEC Basket 10.71 9.96 12.27 15.00 15.48 15.61 18.28 19.66 22.17 21.67 23.75 24.77 17.47
Arab Light (32.5) 1.43 10.70 10.03 12.39 14.90 15.46 15.46 17.90 19.45 22.08 21.48 23.08 23.65 17.24
Dubai (32.5) 1.43 13.41 12.41 11.53 12.23 12.75 11.80 12.11 12.25 13.08 12.69 11.96 10.11 12.15
Bonny Light (36.7) 0.10 11.33 10.24 12.56 15.44 15.45 15.86 19.28 20.44 22.90 22.30 24.80 25.86 18.07
Saharan Blend (44.1) 0.10 11.57 10.41 12.73 15.10 15.23 15.78 19.40 20.52 22.86 22.27 25.05 26.13 18.12
Minas (33.9) 0.10 11.03 10.66 12.51 15.70 16.79 16.76 18.38 19.63 21.99 22.36 23.70 24.27 17.84
TJ Light (32.4) 1.20 9.70 8.84 11.32 13.82 14.44 14.54 16.97 18.45 20.95 20.16 22.50 23.61 16.31
Isthmus (32.8) 1.50 10.21 9.51 12.30 15.10 15.40 15.48 18.23 19.58 22.10 20.96 23.45 24.79 17.29
Other crudes
Arab Heavy (28.0) 3.00 9.53 9.20 11.31 13.72 14.60 14.51 16.80 18.45 21.30 21.03 22.81 23.70 16.44
Murban (39.4) 0.80 10.86 10.24 12.62 15.21 15.94 15.96 18.35 20.06 22.85 22.63 24.36 25.19 17.89
Iran Light (33.9) 1.40 10.25 9.80 11.99 14.67 15.37 15.24 17.65 19.31 22.12 22.03 23.51 24.81 17.25
Iran Heavy (31.0) 1.60 9.97 9.54 11.77 14.32 15.05 14.98 17.30 18.96 21.77 21.68 23.26 24.32 16.93
Kuwait Export (31.4) 2.60 9.78 9.35 11.54 14.17 14.82 14.73 17.10 18.76 21.65 21.53 23.13 24.20 16.75
Mandji (28.8) 1.30 9.77 8.40 11.06 13.86 13.96 14.39 17.92 19.02 21.41 20.49 23.19 24.51 16.53
Zueitina (42.3) 0.20 11.10 10.13 12.43 14.89 14.95 15.45 19.00 20.22 22.63 21.91 24.60 25.98 17.80
Es Sider (37.0) 0.50 11.37 10.21 12.72 15.17 15.30 15.63 19.23 20.53 22.93 22.21 24.77 26.11 18.04
Forcados (29.5) 0.21 11.13 10.11 12.30 15.20 15.39 15.68 19.18 20.32 22.84 22.16 24.76 25.82 17.93
Dukhan (41.4) 1.10 10.96 10.44 12.59 15.24 15.82 15.76 18.34 19.98 22.51 22.00 23.70 24.13 17.65
Oman (34.0) 0.79 10.45 9.96 12.13 14.83 15.43 15.36 17.99 19.60 22.11 21.49 23.23 24.34 17.27
Tapis (44.3) 0.20 12.43 11.37 13.61 16.24 16.73 17.03 19.65 21.72 23.88 23.64 24.76 25.30 18.90
Urals (36.1) 2.50 10.85 9.43 11.76 14.15 14.23 14.76 18.60 19.77 21.96 21.33 24.17 25.44 17.24
Suez Mix (33.0) 1.40 9.84 9.00 11.14 13.61 13.58 13.82 17.38 18.52 20.63 19.89 22.70 23.87 16.19
Brent (38.0) 0.26 11.08 10.25 12.51 15.24 15.41 15.76 19.10 20.24 22.66 22.04 24.62 25.63 17.91
Oriente (29.2) 0.90 9.53 9.31 12.17 14.83 15.11 15.14 17.66 19.16 22.34 21.04 22.97 23.78 16.95
WTI (40.0) 0.40 12.41 11.96 14.64 17.25 17.83 17.87 20.08 21.20 24.04 22.73 24.99 26.21 19.30
ANS (27.0) 1.06 10.63 10.39 13.05 15.56 15.96 15.81 18.15 20.01 23.13 21.88 23.65 24.66 17.77
Differentials
Min. RBP1–Basket 10.29 11.04 8.73 6.00 5.52 5.39 2.72 1.34 -1.17 -0.67 -2.75 -3.77 3.53
Bonny Light–Arab Heavy 1.80 1.04 1.25 1.72 0.85 1.35 2.48 1.99 1.60 1.27 1.99 2.16 1.63
Bonny Light–Saharan Blend –0.25 –0.17 –0.17 0.34 0.22 0.08 –0.12 –0.08 0.04 0.03 –0.25 –0.26 –0.05
Brent–WTI –1.34 –1.71 –2.13 –2.01 –2.41 –2.11 –0.97 –0.96 –1.38 –0.69 –0.37 –0.57 –1.39
Brent–Dubai 0.38 0.23 0.12 0.34 -0.05 0.30 1.20 0.79 0.59 0.56 1.54 1.98 0.67
Notes
1. The Minimum Reference Basket price is $21/b starting from August 1990 as set during the 87th Meeting of the OPEC Conference,
held on July 26–27 1990. Tia Juana Light spot price = (TJL netback/Isthmus netback) x Isthmus spot price, whereas the netback
values for the calculations are taken from RVM.
Source: OPEC data bank

32
Oil Market Developments
The Basket recovered significantly in October and gained $2.07/b in November in a rally led by the ex-
pectation that OPEC would extend the production cuts beyond March 2000 and increased refinery runs,
especially in Europe, due to the improved refiners’ margins at a time when US stocks dropped by a big
31.7m b, and there were forecasts of a big drop in OECD inventories during the third quarter of 1999
and the first quarter of 2000. The increase of $1.02/b in the value of the December Basket was due to
its initial high level, but prices moved sideways during the month. Positive factors were the high compliance
rate by OPEC, a 51m b draw on US total oil stocks and forecast of cold weather, while pressurising factors
were comments by the US Energy Secretary, the extension of Iraq’s ‘oil-for-food’ programme and fund
selling ahead of the new year. Figure 4 shows crude price movements in 1999, while average monthly
crude prices are given in Table 8.
The refining industry
The domestic refining capacity of OPEC Member Countries increased moderately during 1999. The crude
distillation capacity for the year 1999 was 8.49m b/d, an increase of 140,000 b/d, or 1.02 per cent, compared
with 8.35m b/d the preceding year. This rise in capacity was mostly due to changes in the Middle East,
especially the addition of the 120,000 b/d Jebel Ali refinery in the United Arab Emirates (UAE). Table 9
shows the details.
Although there was a slight decline of 2,600 b/d in vacuum distillation capacity in Kuwait, the total vacuum
distillation capacity in OPEC Member Countries climbed by almost 90,000 b/d, from 2.45m b/d in the
previous year, to hover at 2.54m b/d in 1999. The change was mainly due to increases of 42,900 b/d, 27,500
b/d, and 11,800 b/d in IR Iran, Venezuela and the UAE respectively.
Total conversion capacity also enjoyed a modest rise of about 70,000 b/d, from 1.60m b/d in 1998 to
1.67m b/d in 1999. The rise was the result of increases in the catalytic hydro-cracking capacity in IR Iran,
the UAE, and the hydro-treating in Venezuela. These increases were partially offset by a fall in catalytic
cracking, reforming, hydro-treating and hydro-cracking in Kuwait.
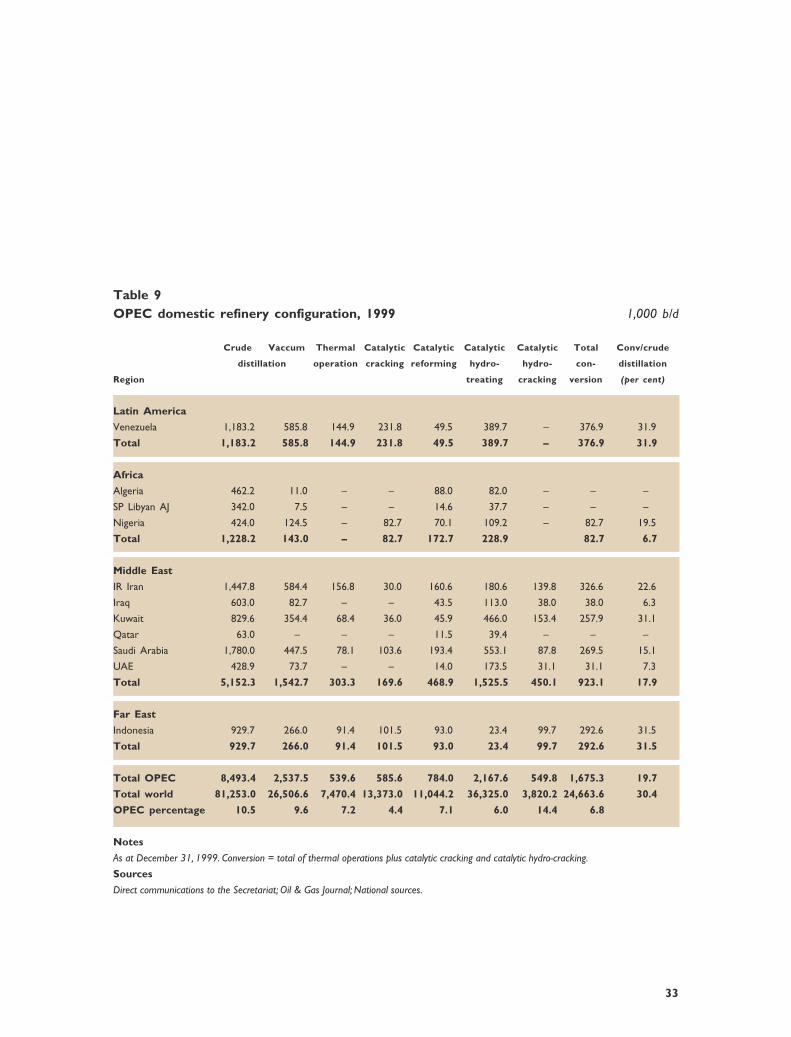
33
Table 9OPEC domestic refinery configuration, 1999 1,000 b/d
Crude Vaccum Thermal Catalytic Catalytic Catalytic Catalytic Total Conv/crude
distillation operation cracking reforming hydro- hydro- con- distillation
Region treating cracking version (per cent)
Latin America
Venezuela 1,183.2 585.8 144.9 231.8 49.5 389.7 – 376.9 31.9
Total 1,183.2 585.8 144.9 231.8 49.5 389.7 – 376.9 31.9
Africa
Algeria 462.2 11.0 – – 88.0 82.0 – – –
SP Libyan AJ 342.0 7.5 – – 14.6 37.7 – – –
Nigeria 424.0 124.5 – 82.7 70.1 109.2 – 82.7 19.5
Total 1,228.2 143.0 – 82.7 172.7 228.9 82.7 6.7
Middle East
IR Iran 1,447.8 584.4 156.8 30.0 160.6 180.6 139.8 326.6 22.6
Iraq 603.0 82.7 – – 43.5 113.0 38.0 38.0 6.3
Kuwait 829.6 354.4 68.4 36.0 45.9 466.0 153.4 257.9 31.1
Qatar 63.0 – – – 11.5 39.4 – – –
Saudi Arabia 1,780.0 447.5 78.1 103.6 193.4 553.1 87.8 269.5 15.1
UAE 428.9 73.7 – – 14.0 173.5 31.1 31.1 7.3
Total 5,152.3 1,542.7 303.3 169.6 468.9 1,525.5 450.1 923.1 17.9
Far East
Indonesia 929.7 266.0 91.4 101.5 93.0 23.4 99.7 292.6 31.5
Total 929.7 266.0 91.4 101.5 93.0 23.4 99.7 292.6 31.5
Total OPEC 8,493.4 2,537.5 539.6 585.6 784.0 2,167.6 549.8 1,675.3 19.7
Total world 81,253.0 26,506.6 7,470.4 13,373.0 11,044.2 36,325.0 3,820.2 24,663.6 30.4
OPEC percentage 10.5 9.6 7.2 4.4 7.1 6.0 14.4 6.8
Notes
As at December 31, 1999. Conversion = total of thermal operations plus catalytic cracking and catalytic hydro-cracking.
Sources
Direct communications to the Secretariat; Oil & Gas Journal; National sources.

34
Oil Market Developments
Table 10OPEC foreign downstream crude refining capacity, 1999 1,000 b/d
Based on equity ownership1 Crude supply2
Asia/Far East W Europe USA Total Asia/Far East W Europe USA Total
IR Iran 17.0 – – 17.0 15.0 – – 15.0
Kuwait – 180.0 – 180.0 – 180.0 – 180.0
SP Libyan AJ – 98.6 – 98.6 – 150.0 – 150.0
Saudi Arabia 390.3 135.3 312.5 838.1 640.0 180.0 600.0 1,420.0
UAE – 109.3 – 109.3 – 109.0 – 109.0
Venezuela3 – 282.8 1,259.2 1,542.0 – 245.0 1,029.0 1,274.0
Total 407.3 806.0 1,571.7 2,785.0 655.0 864.0 1,629.0 3,148.0
Regional refining
capacity/intake 18,580.6 14,929.2 17,805.2 51,315.0 14,938.8 13,212.3 16,950.6 45,101.7
OPEC % share 2.2 5.4 8.8 5.4 4.4 6.5 9.6 7.0
Notes1. OPEC share based on the percentage of equity ownership (excluding leased capacity)2. Supply of crude to be delivered to the refinery by the Member Country (including leased refineries)3. Excluding the 310,000 b/d leased Curacao refinery
The boost in conversion capacity translated into higher conversion-to-distillation ratios, which increased
for total OPEC from 19.1 per cent in 1998 to 19.7 per cent at the end of 1999.
Foreign refining capacity
The refining capacity of OPEC Member Countries, on the basis of equity ownership, in refineries outside
national boundaries, rose by 490,000 b/d, from 2.29m b/d in 1998 to 2.78m b/d in 1999. The change was
due to Venezuela’s addition of middle-sized upgrading refineries in Louisiana and Texas and the inclusion
of the 545,000 b/d refinery at Freeport Caribbean in our statistics, due to the restart of operations there.
On the other hand, OPEC refinery capacity declined by 56,000 b/d, due to the closure of the Skaelser
refinery in Denmark owned by Kuwait (see Table 10).

35
Overall, OPEC Member Countries’ share of foreign refining capacity climbed modestly to 5.4 per cent
of world capacity in 1999. The increase came from the USA and the Caribbean, where OPEC’s share
moved up to 8.8 per cent in 1999, 2.1 percentage points higher than in the previous year. In other areas,
OPEC’s share of equity ownership decreased in Western Europe and stayed unchanged in the Asia/Far
East region. OPEC Member Country agreements to provide crude supplies to the refiners surged to 3.15m
b/d in 1999, an increase of 210,000 b/d from the previous year.
At the regional level, similar to last year, supply agreements with the USA and the Caribbean topped the
list, with 1.63m b/d committed by Saudi Arabia and Venezuela, followed by Western Europe with total
commitments of 864,000 b/d, and the Asia/Far East region with 655,000 b/d. OPEC Member Countries’
share of crude supply to total refinery intake in the major importing regions dropped very slightly to
stay at 7.0 per cent in 1999, from 7.2 per cent in the previous year.
Tanker market
The volume of international oil trade by tankers declined by about 3.2 per cent during 1999, from about
2,075m tonnes in 1998 to an estimated 2,010m t last year. This decline was attributed mainly to the im-
plementation of cuts in crude oil production by OPEC and non-OPEC starting in April 1999 and hence
to low imports by the consuming nations.
The fall in the world volume of marine trade was directly reflected in spot tanker freight rates which
decreased on every route. Spot freight rates for VLCCs, which reacted immediately to the changing market
conditions, dropped on average by 14 points to Worldscale 49 on the Middle East/Far East route and
by 13 points to WS46 from the Middle East to the West during the year 1999.
Petroleum product freight rates also declined on all major routes, especially on the Middle East/Far East
and Singapore/Far East routes where they fell significantly by 22 points to WS161 and by 29 points to
WS181, respectively during 1999.

36
Oil Market Developments
Table 11
Tanker fleet development in OPEC Member Countries, 1995–99 1,000 dwt
1995 1996 1997 1998 1999
No dwt No dwt No dwt No dwt No dwt
Algeria 1 22 1 22 1 23 1 23 1 23
Indonesia 24 642 25 727 25 739 25 739 31 904
IR Iran 14 2,083 12 3,301 25 3,996 23 3,488 22 3,432
Iraq 17 1,493 17 1,493 17 1,517 16 1,364 9 534
Kuwait 28 3,442 28 3,442 27 3,157 26 3,343 17 2,890
SP Libyan AJ 11 1,322 10 1,235 10 1,255 9 1,114 5 527
Nigeria 3 417 2 407 3 424 2 413 2 413
Qatar 2 190 2 191 5 479 5 479 5 466
Saudi Arabia 15 778 15 786 10 509 13 659 13 659
UAE 17 1,152 15 778 15 7856 10 510 13 659
Venezuela 14 676 11 560 10 522 10 522 7 374
Total OPEC 142 11,782 138 12,958 147 13,339 140 12,665 123 10,704
Total world 3,200 281,812 3,255 288,294 3,323 292,398 3,424 300,460 3,307 287,358
OPEC percentage 4.2 4.5 4.6 4.2 3.7
Notes
Totals may not add up due to independent rounding. As at year end.
Total world includes commercial units and government-owned vessels.
Sources
World Oil Tanker Trends, Simpson and Young; Direct communications to the Secretariat.

37
Tanker capacity used for storage of oil averaged about 13.5m t during 1999, or 1.0m t above the 1998
level. The increase, despite the world-wide decline in every form of stock holding, reflected a sharp rise
in some months of the year, due to logistical contingencies by some producers in the Middle East region.
Tanker fleet size
The world tanker fleet capacity fell by 13.1m deadweight tonnes to 287.40m dwt in 1999. The 117 vessels
sent for demolition were mostly built in the 1970s, and became obsolete several years ago due to en-
vironmental safety regulations. OPEC’s tanker fleet also declined by 17 tankers, or 2.0m dwt, to 10.7m
dwt, at the end of 1999. The share of OPEC ownership in the world tanker fleet was 3.7 per cent in
1999. The OPEC liquid gas carrier fleet fared relatively better, and increased by about 230,000 cubic metres.
OPEC ended 1999 with a liquid gas carrier fleet capacity of 2.34m cu m, which amounted to 9.1 per
cent of the total world fleet. Table 11 shows the details.
Primary energy developments
After registering a marginal increase in 1998, world primary energy demand in 1999 accelerated its growth
to 1.9 per cent, increasing from 194.4m barrels of oil equivalent/day in 1998 to 198.0m boe/d in 1999.
Table 12
World primary energy demand by country group, 1998–99
1998 1999
m boe/d m boe/d % growth rate
OECD 103.2 105.0 1.7
Developing countries 48.7 49.9 2.4
Other regions 42.5 43.2 1.7
World 194.4 198.0 1.9

38
The economic recovery in the Asia-Pacific countries that had been hit by the crisis in 1998, combined
with the higher heating degree days in some countries in the northern hemisphere, were the main reasons
for this increase. In the OECD countries, primary energy demand registered moderate growth of 1.7
per cent, from 103.2m boe/d in 1998 to 105.0m boe/d in 1999. The stronger economic growth in the
DCs during 1999 has expanded their primary energy demand by a higher growth of 2.4 per cent, from
48.7m boe/d in 1998 to 49.9m boe/d in 1999, while in Other Regions, the FSU, China and Eastern European
countries, energy demand registered growth of 1.7 per cent to 43.2m boe/d in 1999. Table 12 shows
the details.
By type of fuel, global natural gas demand registered strong growth of 3.2 per cent to 40.1m boe/d in
1999, due to the relatively high rate of economic expansion in the DCs and strong fuel substitution, primarily
from oil and coal to natural gas, in some major consuming countries in Europe. World oil demand during
1999 showed moderate growth, increasing by 1.4 per cent to 72.3m boe/d. The relatively high oil prices
during the second half of 1999 have stimulated stronger oil substitution, particularly for electricity gen-
eration in the USA, reducing the potential increase in oil demand.
Table 13
World primary energy demand by fuel, 1998–99
1998 1999
m boe/d m boe/d % growth rate % share
Coal 44.7 45.5 1.7 23.0
Oil 71.3 72.3 1.4 36.5
Gas 38.8 40.1 3.2 20.2
Hydro 5.3 5.3 –0.4 2.7
Nuclear 12.7 13.1 3.0 6.6
Traditional fuels 21.4 21.7 1.4 11.1
Total 194.4 198.0 1.9 100.0
Oil Market Developments

39
Despite the decline of coal consumption in the FSU, world coal demand increased by a moderate growth
of 1.7 per cent, to 45.5m boe/d, in response to the strong increase in coal demand for the DCs.
The continued lower precipitation in the USA has substantially reduced hydro power output, and caused
global electricity demand from hydro to decline marginally by 0.4 per cent. By contrast, electricity demand
from nuclear power in 1999 registered strong growth of three per cent, from 12.7m boe/d in 1998 to
13.1m boe/d in 1999.
The improvement of the utilisation factor of nuclear operations in the USA, after the major scheduled
maintenance in 1997, has significantly increased US nuclear power output, and considerably contributed
to the strong increase of global nuclear power output. Table 13 shows the details.
The environment
In 1999, OPEC’s role in environmental activities and, in particular, in the negotiation process leading to
the Fifth Session of the Conference of the Parties to the United Nations Framework Convention on
Climate Change (UNFCCC) was very visible. The OPEC Secretariat’s activities on environmental issues
included workshops which focussed their attention on different issues stipulated in the UNFCCC and/
or the Kyoto Protocol and, in particular, on issues related to the implementation of Articles 4.8 and 4.9
of the Convention and 2.3 and 3.14 of the Kyoto Protocol, which refer to the concerns of oil-exporting
developing countries. The literature in 1999 was full of studies in which attention was focussed on the
huge losses that would be incurred by the economies of oil-exporting countries once the mitigation measures
taken by Annex I countries are implemented.
Some of these studies tried to show that the Kyoto mechanisms would substantially reduce losses to
OPEC Countries. On the contrary, OPEC’s research shows that, although the implementation of the Kyoto
mechanisms would lead to lower losses to OPEC, they cannot be eliminated and, in fact, the losses still
remain high. Additionally, OPEC Secretariat experts were invited to different fora including the workshop
organised by the UNFCCC to present their views on the same issues.

40
Press Release No 2/99, Vienna, Austria, March 23, 1999
107th Meeting of the OPEC Conference
The 107th Meeting of the Conference of the Organization of the Petroleum Exporting Countries (OPEC)
convened in Vienna, Austria, on March 23, 1999.
The Conference unanimously re-elected HE Dr Youcef Yousfi, Minister of Energy & Mines of Algeria and
Head of its Delegation, as its President. HE Abdullah bin Hamad Al Attiyah, Minister of Industry & Energy
of Qatar and Head of its Delegation, was unanimously re-elected Alternate President.
The Conference expressed its pleasure at the presence of high-level representatives of Mexico, the Sul-
tanate of Oman, and the Russian Federation, whose ongoing support of measures being taken to stabilize
the market is welcomed by the Organization.

41
Algeria 731,000
Indonesia 1,187,000
Islamic Republic of Iran 3,359,000
Kuwait 1,836,000
SP Libyan AJ 1,227,000
Nigeria 1,885,000
Qatar 593,000
Saudi Arabia 7,438,000
United Arab Emirates 2,000,000
Venezuela 2,720,000
Total 22,976,000
The Conference reviewed the Secretary General’s report, the report of the Economic Commission Board,
the report of the Ministerial Monitoring Sub-Committee (MMSC), and various administrative matters.
Having reviewed the current market situation, the Conference agreed to make further reductions in the
production of Member Countries (excluding Iraq), making individual Member Country output levels as
follows (in barrels per day):
Member Countries strongly emphasized their firm commitment to this agreement, which is effective from
April 1, 1999 and valid for one (1) year, and stressed their intention to ensure full compliance. Iraq is
not party to this agreement.
Hailing the new spirit of co-operation prevailing within OPEC and between OPEC and non-OPEC pro-
ducers, the Conference also recorded its deepest appreciation of the co-operation extended by the es-
teemed Governments of Mexico, Norway, the Sultanate of Oman, and Russia in pledging additional cuts
of 125,000 b/d, 100,000 b/d, 63,000 b/d, and 100,000 b/d, respectively, being these Countries’ contributions
to the steps being taken to restore prices to acceptable levels. The total cuts from OPEC and non-OPEC
amount to 2.104m b/d.
The Conference expressed its appreciation to the Government of the Federal Republic of Austria and
the authorities of the City of Vienna for their warm hospitality and the excellent arrangements made
for the Meeting.

42
OPEC Press Releases
The Conference passed Resolutions which will be published on April 23, 1999, after ratification by Member
Countries.
The next Ordinary Meeting of the Conference will be convened in Vienna, Austria, on September 22, 1999.
Press Release No 7/99, Vienna, Austria, September 22, 1999
108th Meeting of the OPEC Conference
The 108th Meeting of the Conference of the Organization of the Petroleum Exporting Countries (OPEC)
convened at Headquarters, Vienna, welcoming high-level representatives from Angola, Mexico, the Russian
Federation, and the Sultanate of Oman, non-OPEC oil-exporting countries whose co-operation in sup-
porting oil prices is appreciated by the Organization.
The Conference unanimously elected HE Abdullah bin Hamad Al Attiyah, Minister of Energy & Industry
of Qatar and Head of its Delegation, as its President. HE Alí Rodríguez Araque, Minister of Energy & Mines
of Venezuela and Head of its Delegation, was unanimously elected Alternate President.
The Conference appointed Dr Aboki Zhawa, Governor for Nigeria, as Chairman of the Board of Governors
for the year 2000, and Mr Abdulla H Salatt, Governor for Qatar, as Alternate Chairman for the same
period, and approved the Budget of the Organization for the year 2000.
The Conference also reviewed the Secretary General’s report, the report of the Economic Commission
Board, and the report of the Ministerial Monitoring Sub-Committee (MMSC), chaired by HE Bijan Namdar
Zangeneh, Minister of Petroleum of the Islamic Republic of Iran.

43
* Venue later changed to OPEC Secretariat, Vienna, Austria.
The Conference voiced satisfaction with the present level of adherence by Member Countries to the
production reductions agreed in March 1999, but, noting that there is room for further improvement,
urged even greater compliance with agreed production levels.
Given the remaining high level of stocks, OPEC Member Countries re-affirmed their strong commitment
to the agreement reached in March 1999 until at least the end of March 2000, at which time market
conditions will be reviewed and a decision taken that will ensure continued market stability.
The Conference decided that HE Dr Rilwanu Lukman should stay on as Secretary General until his suc-
cessor is appointed. HE Dr Lukman will continue to supervise the Secretariat, while the day-to-day activities
will be handled by the Director of Research Division, Dr Shokri Ghanem.
The Conference passed Resolutions which will be published on October 22, 1999, after ratification by
Member Countries.
The next Ordinary Meeting of the Conference will be convened in Caracas, Venezuela, on March 27, 2000.*
This will be followed at a later date by the Summit Meeting of OPEC Heads of State.
The Conference expressed its appreciation to the Government of the Federal Republic of Austria and
the authorities of the City of Vienna for their warm hospitality and the excellent arrangements made
for the Meeting.

44
Office of the Secretary General
Traditionally, the activities of the Office of the Secretary General (SGO) centre around meeting the
requirements of the Chief Executive in the execution of his duties, and 1999 was no exception. During
the year, efforts were concentrated on preparing documentation for and servicing Meetings of the Conference,
the Ministerial Monitoring Sub-Committee, and the Board of Governors, as well as various Meetings of
High-Level Experts dealing, inter alia, with OPEC’s medium-term policy and preparations for the II Summit
of OPEC Heads of State and Government, due to be held in Caracas, Venezuela, in September 2000.
In addition to co-ordinating the preparation of reports and documentation for submission to these various
Ministerial and Gubernatorial gatherings, the staff of the SGO were also occupied with minuting such
Meetings, preparing précis of the discussions held and summaries of the decisions taken, as well as preparing
formal, edited minutes of the deliberations for distribution to Ministers and Governors, as appropriate.
As is customary, the SGO also co-ordinated the Secretariat’s protocol affairs and organized the many
missions conducted by the Secretary General and other members of the Secretariat staff during the course
of the year, in addition to preparing monthly summaries of the activities of the Secretariat’s various
Departments for distribution to Member Countries.

45
Research Division
The year 1999 proved to be a rather turbulent one in the oil market. It was also marked by intense
work in the Research Division, and its continued involvement at the core of the Secretariat’s main
activities. The Division, with the new Officers who joined in 1998 and 1999 following the restructuring,
continued its extensive research activities throughout the year.
The new structure reinforces a more integrated research programme while retaining the basic mission
and responsibilities of the Division, as stated in the Organization’s Statute: it conducts a continuous programme
of research on energy and related matters; analyses and forecasts developments in the energy and pet-
rochemical industries; monitors closely oil and products markets; follows world economic and financial
issues regularly, with emphasis on the international hydrocarbons industry; as well as maintaining and ex-
panding data services in support of these activities in the Secretariat. The Director of Research supervises
and co-ordinates these efforts, meeting the specific needs of the Member Countries while also contributing
to the body of research work by the international community in these fields.
The research activities of the Division reflect a complementary work-flow, and are shared in such a way
that the assignments of the Petroleum Market Analysis Department (PMAD) aim to keep Member
Countries abreast of oil market developments in the short-term, while the Energy Studies Depart-
ment (ESD) concentrates on research studies and projects of a more long-term nature, with the support
and participation of the Data Services Department (DSD) in all areas as appropriate.
An essential part of the activities of all three departments is their close involvement in preparing reports,
studies and up-to-date data for the various Meetings of the Conference, Ministerial Monitoring Sub-Com-
mittee, Board of Governors, Economic Commission Board (ECB), and High-Level Experts.
As part of these ongoing, regular activities, various reports are prepared to provide timely assessments
of international oil market trends, and developments in the world economy. In this context, briefings on
daily oil price movements, weekly and monthly oil market reports, the monthly production monitoring

46
report, survey tables on forecasts of economic indicators, as well as contributions on environmental and
energy-related issues, are produced for submission to these meetings or for distribution to Member Coun-
tries’ representatives, with some also being made available to the public.
Detailed analysis into many key aspects of the world oil market (oil price fluctuations, netback values
and refining margins based on the Secretariat’s Replacement Value Methodology (RVM), the refining industry,
oil companies, transportation, storage, stock changes, tanker movements, oil trade, price differentials and
formulae, economic and financial developments), is further complemented by annual reports and studies
on specific issues, such as the following: Crude Oil Transportation, The Sustainable Development Agenda, Fuel
Substitution in Road Transportation, Transportation Sector Demand Growth in Major Emerging Markets, Production
Capacity Expansion Plans of OPEC Member Countries, and Non-OPEC Crude Oil Exploration and Production Costs.
The first of the regular series of Special Meeting of Experts of the ECB was successfully held in 1999,
so that Member Countries’ experts could devote more time to consideration and discussion of the specialised
studies prepared within the Division. This meeting facilitated in-depth discussion of the reports presented,
generating useful feedback and valuable suggestions on the following topics: The Use of Energy Models
in Energy Policy Analysis and Forecasting; Oil & Energy Outlook to 2020: OWEM Scenarios Report; Oil Taxation
in the OECD; World Oil and Gas Reserves and Implications for Long-term Supply; and Key Aspects of Non-OPEC
Production.
In addition, further ad-hoc tasks were undertaken, and additional studies submitted to the First Informal
Brainstorming Meeting, as well as the Meetings of High-Level Experts on Preparations for the II OPEC
Summit of Heads of State, and OPEC’s Medium-Term Policy.
Quantitative analysis, relying on models developed within the Division, in particular the OPEC World En-
ergy Model (OWEM), the World Energy Model, and RVM, provides a solid basis for its research into en-
vironmental policies, long-term energy projections for the world energy markets, demand prospects for
gas liquids and solids, regional oil trade, and crude oil pricing. The model results are extensively used to
develop a broad range of policy options and responses for the Member Countries.
Activities of the Secretariat

47
Since the inception of the Inter-disciplinary Modelling Group in 1998, the group has dynamically pursued
its goal of achieving more effective utilisation of these energy models in the various studies undertaken in
the Division. Accordingly, this intra-departmental group started generating a quarterly report on world oil
market forecasts, with the intention of integrating these results into other regular reports of a similar nature.
The annual report Oil and Energy Outlook to 2020, based on the OWEM findings, gives the Secretariat’s
latest long-term projections for the world energy market. It describes the world energy mix pattern and
the outlook for regional oil demand and production, based on its reference case assumptions. In addition
to estimated OPEC oil production requirements and trade volumes up to 2020, price sensitivity analyses
are also incorporated in the reference case.
Furthermore, a section on estimated, ultimately-recoverable oil reserves is also included in the 1999 report.
Climate change scenarios developed in the report, estimating the potential impact of the Kyoto emissions
targets on the economies of Member Countries, have proved to be a valuable reference in terms of quan-
tifying OPEC revenue losses as a result of the response measures. These scenarios were presented at
the United Nations Framework Convention on Climate Change (UNFCCC) Workshop in Bonn, Germany,
on September 21–24, 1999.
The Staff of the Secretariat pictured outside OPEC headquarters

48
Recognising the increasing importance and dynamic character of the environmental debate taking place
among international bodies, and its important implications for OPEC, the Division, as in previous years,
has further extended its research, monitoring and co-ordination activities in this field. In addition to its
regular Quarterly Environmental Report, the Environmental Task Force prepared two special reports: Common
Positions of the Member Countries on Issues Under Negotiation in the UNFCCC and Kyoto Protocol, and Minimising
the Economic Damage from Climate Change Response Measures: Policy Options for OPEC Countries.
Furthermore, the Secretariat organised a High-Level Experts Workshop on Climate Change, which re-
viewed the Organization’s participation in the climate change debate and issues relating to the co-or-
dination of Member Countries’ positions with regard to COP5, which took place in October-November
1999 in Bonn.
A new task force was established in 1999, along the lines of the successful Environmental Task Force and
Inter-disciplinary Modelling Group, whose task is to closely monitor the activities of the World Trade Or-
ganisation (WTO) and its subsidiary bodies. Research in this area produced the report entitled OPEC
and the WTO: Issues and Perspectives, while plans were also made to organise a workshop on the multilateral
trading system and energy-related issues in 2000.
The Data Services Department, while performing its major task of assuring that up-to-date, consistent
and reliable data is available in support of the Division’s ongoing projects, also responds to many ad hoc
data requests from the Member Countries. Careful analysis of the data used in drawing-up time-series,
their comparison and validation, have continued to be an uncompromising element of the Department’s
regular activities. In fulfilling these objectives, special efforts were made to maintain and expand a sat-
isfactory database through the systematic collection of information and data from numerous sources, spe-
cialised publications and direct communications.
In line with the Division’s overall priorities, work commenced on the project of establishing an extensive
environmental database. Direct input data modules for the in-house models were further developed, par-
allel to the upgrading and replacement of some software incorporated into the programme. Key, up-to-
Activities of the Secretariat

49
date information was provided to end-users through regular dissemination of electronic reports, including
such publications as the Quarterly Energy and Oil Statistics, as well as the Annual Statistical Bulletin and the
Annual Report (both published by PRID) while efforts intensified to expand the direct exchange of data
via the Internet and other electronic media.
The Department also continued its activities in systems development, technical support to other depart-
ments, database administration and maintenance, user support, network support, PC and software instal-
lations. Among other things, it commenced the development of the replacement for OPEC News Service
(ONS) using the Oracle Internet-enabled application and text server database. The existing ONS system
was ported to a 32-bit operating environment and the DEC-VAX server was replaced by the Transtel-
based system.
The Department also took action to counter the Y2K issues, namely with regard to the Oracle database
and HP-UX operating system. In addition, programme reorganization was undertaken to cope with the
change in the access system to major data sources, from dial-up modem connection to Internet access.
In addition to the acquisition of new PCs and servers, a new backup system and fibre-optic backbone
was installed. OPEC’s Internet service provider was also changed in order to get a more economical service
as Internet usage continued to increase.
On the software side, a system for managing messages from news agencies and a central server virus
checking system was implemented and made operational. Technical assistance was provided to PRID on
the maintenance of the OPEC Web site, which was transferred to a new and more powerful server, in
line with the plan to incorporate the server into the newly-designed firewall facility in 2000.
The Research Division, in liaison with other Departments, also accommodated trainees from Member
Countries during a one-week inter-disciplinary training course held at the Secretariat. This event having
proved a success, both from the point of view of content and organization, it is planned to hold such
training courses on an annual basis in future.

50
As part of ongoing efforts to enhance international co-operation, technical contacts with several organi-
sations (the International Energy Agency, the UN Conference on Trade and Development, the International
Institute for Applied Systems Analysis and the New York Mercantile Exchange) and oil companies (ENI
of Italy and Statoil of Norway) were established, and a number of lectures and presentations given, aimed
at encouraging discussions and an exchange of views on pertinent issues of common interest.
In particular, a successful Roundtable on Perspectives for Development of the World Oil Market was held at
the Secretariat, attended by representatives of the Russian Federation, from the Ministry of Fuel & Energy,
oil companies and the banking sector.
The Division also worked closely with PRID on the preparation of a number of speeches which the Sec-
retary General delivered at various international fora, on such topics as oil market challenges, OPEC’s
policies on market stability, and its objectives over the medium to long term. Research Division staff also
attended and addressed international conferences and seminars, and participated in various roundtable
discussions, expert groups and co-ordination meetings.
Public Relations and Information Department
During the year, the Public Relations and Information Department (PRID) carried on its proactive
strategy of disseminating a wide range of information about the Organization and its Member Countries
to a global audience, by a variety of well-established methods ranging from traditional print publications
to the World Wide Web and e-mail. PRID also continued to provide its regular internal news and in-
formation services via such channels as the daily News Summary, the Press Digest and briefings about
OPEC to visiting groups.
The OPEC Web site, which first went online in 1997, continued to grow in importance as a medium
for getting the Organization’s message across to a global audience. More content was added as the number
of visitors to http://www.opec.org also climbed and literally thousands of e-mail enquiries were received
and handled by the Department. As the scope and reach of the site continued to expand, a restructuring
Activities of the Secretariat

51
and redesign project was initiated to better serve the needs of the ever-growing user base, and the new
site is scheduled to go online during 2000.
In 1999, the Organization’s flagship magazine, the monthly OPEC Bulletin, published 12 issues for the third
straight year. Highlights included Conference coverage, speeches by the Secretary General and other senior
OPEC officials, and articles on various aspects of the oil and gas industry by acknowledged experts. The
Commentary continued to be a widely-read forum for the Organization’s views on a variety of topics.
Other subjects covered in the magazine included the environment and the impact on OPEC Member
Countries of greenhouse gas emission reduction measures adopted as part of the ongoing climate change
negotiations. The OPEC Bulletin published articles and interviews regarding the Organization’s 40th anni-
versary. In addition, it carried its regular oil market analyses and a broad selection of news and views
from Member Countries, the developing world and the major global energy and financial centres.
For those requiring a more scholarly look at topical issues, the quarterly OPEC Review published a total
of 17 articles in its 23rd annual volume. The subject matter covered energy, economic development and
the environment, and the themes varied from global to regional and national. The joint publishing arrange-
ment with UK company Blackwell Publishers saw a net annual return to the OPEC Review of nearly £11,000
sterling for 1999, making a total of more than £38,000 for the four years of this agreement.
Furthermore, PRID worked closely with the Research Division in bringing out the latest editions of its
two yearly publications, the Annual Statistical Bulletin, which featured its usual wealth of data on the global
oil and gas industry, and the Annual Report, focusing on economic activity in OPEC Member Countries,
the international oil market, and the Secretariat’s activities during the year.
The Department’s design and graphics unit continued to expand its activities during 1999, handling not
only PRID’s own requirements for its print publications and the increasingly popular OPEC Web site, but
also supplying services to the other departments of the Secretariat.

52
Additionally, it provided the Conferences and other numerous meetings and workshops that took place
throughout the year with design and graphics support and assistance.
The OPEC News Agency (OPECNA) continued to deliver information on OPEC and its Member Coun-
tries to its broad list of paid subscribers around the world. During the year, OPECNA produced thousands
of stories about the world petroleum industry, developing economies and environmental affairs.
The quality of the service further improved, as part of continued efforts to maintain and expand a repu-
tation built throughout 20 years of operations. This was made evident as several reputable international
organizations from the world of information sought to establish agreements with OPECNA.
The OPEC Library continued during 1999 to extend its database, now providing bibliographical details,
keywords and abstracts of over 13,000 books, reports, and conference proceedings. Work also continued
on re-cataloguing and entering in the database records of the library’s extensive collection of historical
petroleum documents.
Up-to-date access to a growing number of periodicals was made available to staff via electronic delivery,
and library research capabilities were greatly enhanced through using the many energy and petroleum
related information sources on the Internet. Visitors from Member Countries, researchers from academic
institutions, and others from international organizations regularly used the library’s facilities.
The Department’s audio-visual unit continued to provide video and photographic coverage of important
events during the year, including the OPEC Conferences, numerous other meetings, and national day ac-
tivities by the embassies of our Member Countries in Vienna.
Activities of the Secretariat

53
Administration and Human Resources Department
In addition to its routine activities, the Administration and Human Resources Department (AHRD)
made the necessary arrangements for the Meetings of the Conference and other gatherings during the
year 1999. AHRD also compiled reports for Gubernatorial Meetings on a variety of subjects and imple-
mented decisions resulting from Meetings of the Board of Governors.
One of the main events of the year was the refurbishing of the Organization’s headquarters in Vienna,
and considerable time and effort was dedicated by AHRD to intensive negotiations relating to the acquisition
of office furniture, carpeting and so on. Another major achievement during the year was the signing of
an agreement between OPEC and the Austrian Government concerning social security.

54
February 1–4 Attended Inauguration Ceremonies of Venezuelan President Hugo Chavez, Caracas,
Venezuela
February 17–18 Club Español del Petroleo’s International Oil Conference on Oil after 2000: Con-
tribution to Sustainable Development, Madrid, Spain
March 2 Japanese Ministry of Foreign Affairs’ Seminar on Energy Security Linkage between Asia
and the Middle East, Tokyo, Japan
April 19–21 10th Montreux Energy Roundtable, Montreux, Switzerland
April 22–23 Centre for Global Energy Studies (CGES) Ninth Annual Conference, London, UK
May 4–5 Financial Times Conference on Nigeria — Debt, Development and Democracy: Pros-
pects and Challenges, London, UK
May 12–13 CWC/CGES 2nd Annual Conference on Oil and Gas Investments in Africa, London, UK
May 14 CWC Symposium on Oil and Gas Investments in Nigeria, London, UK
May 24–29 Attended Inauguration Ceremonies of Nigerian President Olusegun Obasanjo, Abuja,
Nigeria
June 16 20th Annual Session of the Ministerial Council of the OPEC Fund for International
Development, Innsbruck, Austria
September 7–10 Inaugural Meeting of the 42nd Regular Session of the General Conference of the
International Atomic Energy Agency, Vienna, Austria
November 16 Institut Français du Pétrole’s 1st International Oil Conference, Paris, France
Secretary General’s Diary

55
February 26 1st OPEC/Russian Roundtable, OPEC Secretariat, Vienna
March 15–17 1st Special Meeting of the ECB, OPEC Secretariat, Vienna
March 18–19 91st Meeting of the ECB, OPEC Secretariat, Vienna
May 20–21 98th (Extraordinary) Meeting of the Board of Governors, OPEC Secretariat, Vienna
July 30 26th Meeting of the Ministerial Monitoring Sub-Committee (MMSC), OPEC Sec-
retariat, Vienna
August 23–25 99th Meeting of the Board of Governors, OPEC Secretariat, Vienna
September 13–15 92nd Meeting of the Economic Commission Board, OPEC Secretariat, Vienna
September 21 27th Meeting of the Ministerial Monitoring Sub-Committee, OPEC Secretariat,
Vienna
September 22 108th Meeting of the Conference, OPEC Secretariat, Vienna
October 4–8 Multi-Disciplinary Course for Trainees From Member Countries, OPEC Secretariat,
Vienna
October 21–22 Meeting of High-Level Experts on Climate Change, OPEC Secretariat, Vienna
November 13 Meeting of High-Level Experts on Preparations for the II OPEC Summit of Heads
of State, OPEC Secretariat, Vienna
November 14 Meeting of High-Level Experts on OPEC Medium-Term Policy, OPEC Secretariat,
Vienna
1999 Calendar