public (redacted) version report to australian energy ... strata... · and adjustments based on...
TRANSCRIPT

SP AusNet Revenue Determination: Technical Review
Findings on SP AusNet’s Revenue Proposal
PUBLIC (REDACTED) VERSION
Report to
Australian Energy Regulator
Energy Market Consulting associates Strata Energy Consulting
August 2013

Report to AER (Public) 1 August 2013
This report has been prepared to assist the Australian Energy Regulator (AER) with its determination of the appropriate revenues to be applied to the prescribed transmission services of SP AusNet from 1 April 2014 to 31 March 2017. The AER’s determination is conducted in accordance with its responsibilities under the National Electricity Rules
(NER).
This report relies on information provided to EMCa by SP AusNet. EMCa disclaims liability for any errors or omissions, for the validity of information provided to EMCa by other parties, for the use of any information in this report by any party other than the AER and for the use of this report for any purpose other than the intended purpose.
In particular, this report is not intended to be used to support business cases or business investment decisions nor is this report intended to be read as an interpretation of the application of the NER or other legal instruments. EMCa’s opinions in this report
include considerations of materiality to the requirements of the AER and opinions stated or inferred in this report should be read in relation to this over-arching purpose.
Except where specifically noted, this report was prepared based on information provided by SP AusNet prior to an Engagement Meeting on 30th May 2013 and at
which the key findings emerging from this review were discussed with SP AusNet. The findings and recommendations in this report are nevertheless considered valid based
on all information provided in response to our presentation up to 24th July 2013.
Energy Market Consulting associates PO Box 542, St Leonards, NSW 2065 Australia Phone: 0412 559 138 / Phone (intl):+61 412 559 138 Email: [email protected] Web: www.emca.com.au
Report to AER (Public) 2 August 2013
About EMCa
Energy Market Consulting associates (EMCa) is a niche firm, established in 2002 and specialising in the policy, strategy, implementation and operation of energy markets and related access and regulatory arrangements. Its Director, Paul Sell, is an energy economist and previous Partner in Ernst & Young and Vice President of Cap Gemini Ernst & Young (now Capgemini). Paul has advised on the establishment and operation of energy markets and on matters such as electricity network open access, pricing and regulation and forecasts for over 30 years.
About Strata
Strata Energy Consulting Limited specialises in providing services relating to the energy industry and energy utilisation. The Company, which was established in 2003, provides advice to clients through its own resources and through a network of Associate organisations. Strata Energy Consulting has completed work on a wide range of topics for clients in the energy sector both in New Zealand and overseas.
Authorship
Prepared by: Paul Sell and Bill Heaps, with key input from Stephen Lewis and Dave Frow.
Quality approved by: Paul Sell
Date saved: 28/08/2013 11:44 a.m.
Version: FINAL PUBLIC (REDACTED) TO AER v4.0
Acknowledgements: Analysis, report drafting assistance and QA: Mark de Laeter and Choon Yen Chee.
Review input from John Scott.

SP AusNet Review - Final Report
Report to AER (Public) 3 August 2013
Table of Contents
1 Introduction ............................................................................................ 7
1.1 Purpose of this report .................................................................................... 7
1.2 Regulatory framework .................................................................................... 7
1.3 Approach taken for the review ...................................................................... 8
1.4 Data sources .................................................................................................... 9
1.5 Structure of this report ................................................................................... 9
1.6 Our qualifications .......................................................................................... 11
2 Findings and recommendations ....................................................... 12
2.1 Findings and recommendations .................................................................. 12
2.2 Implications of these findings ..................................................................... 18
2.3 Other observations ....................................................................................... 20
3 Expenditure Trends ............................................................................... 21
3.1 Capex trends ................................................................................................. 21
3.2 Opex trends ................................................................................................... 28
4 Asset management and expenditure planning ............................. 34
4.1 Introduction ................................................................................................... 34
4.2 Overview of assets works planning and management within SP AusNet ...................................................................................................................... 34
4.3 Capex program and portfolio planning....................................................... 37
4.4 Capex project cost estimation ..................................................................... 43
4.5 Opex program and expenditure planning .................................................. 47
4.6 Overall findings on asset management and expenditure planning ......... 48
5 Replacement capex– Stations .......................................................... 51
5.1 Overview ........................................................................................................ 51
5.2 Review of CBD Substations ......................................................................... 52
5.3 Review of Major substations ....................................................................... 62
6 Asset Replacement, Safety and Compliance and Non-System Capex .......................................................................................................... 65
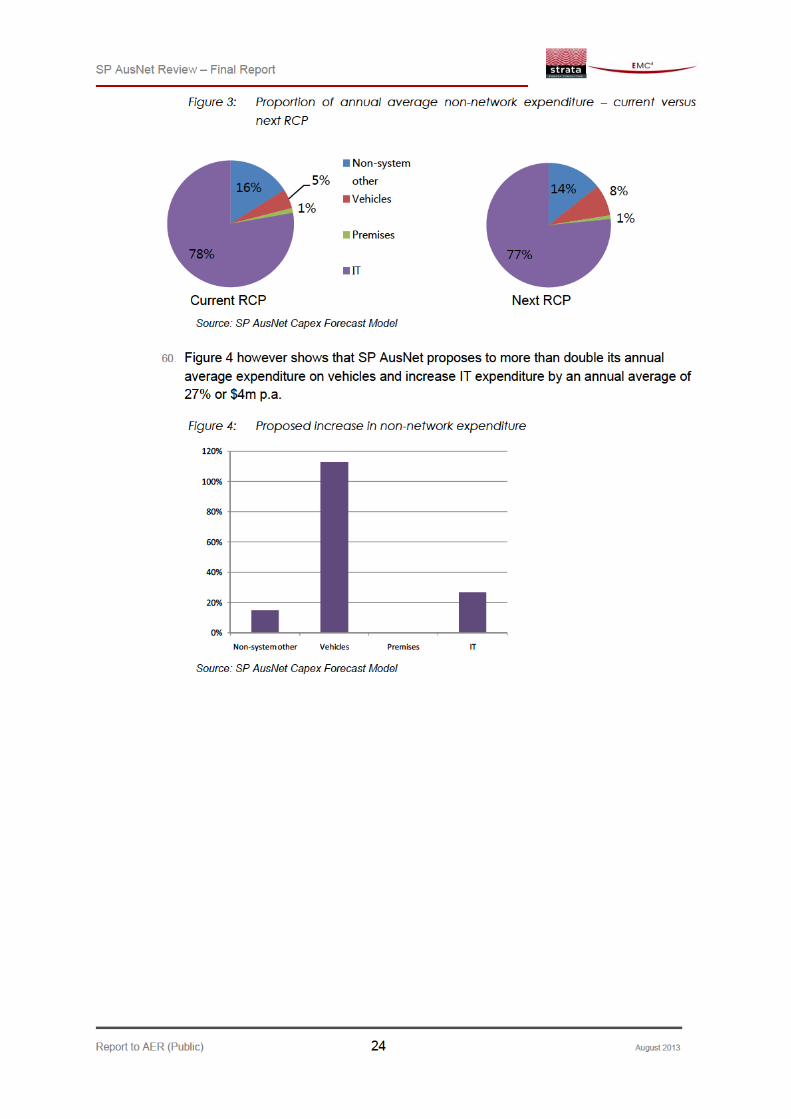
6.1 Introduction ................................................................................................... 65
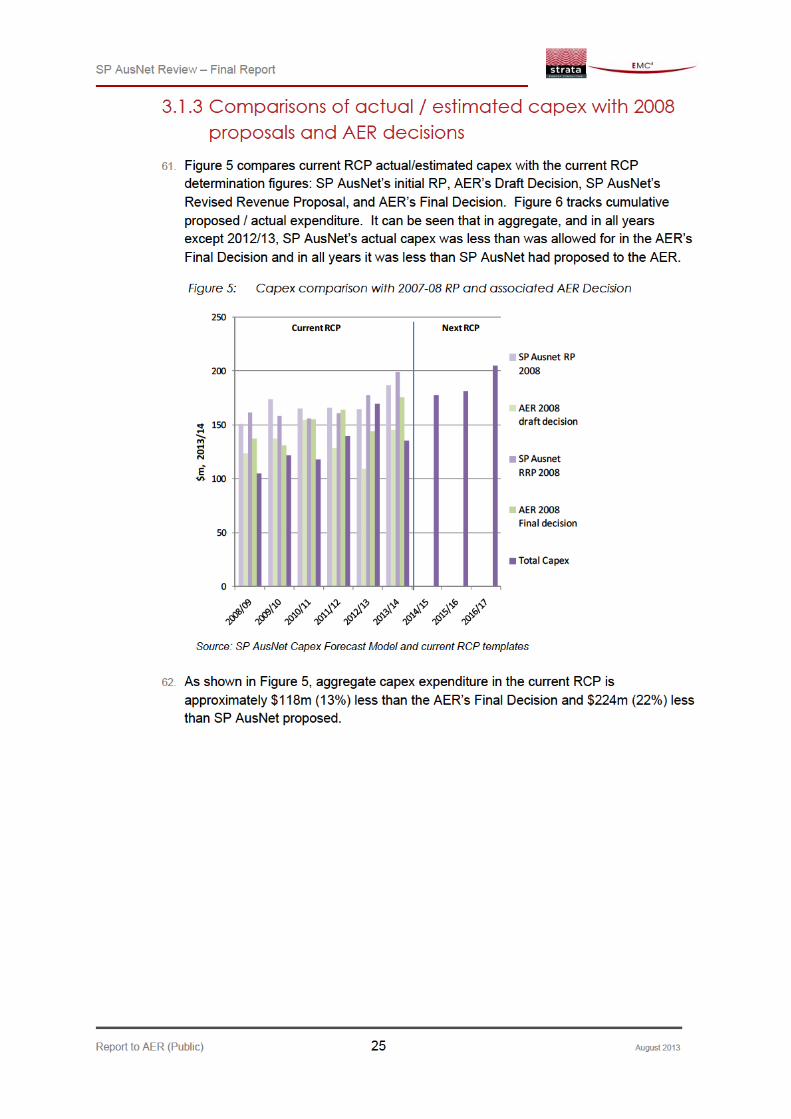
6.2 Overview ........................................................................................................ 65
6.3 Assessment of the asset replacement programs expenditure proposal .................................................................................................................... 67
6.4 Assessment of the safety, security and compliance expenditure proposal .................................................................................................................... 68
6.5 Assessment of non-system capex (excluding IT) ..................................... 68
6.6 Assessment of IT capex ............................................................................... 69
6.7 Conclusions on Asset Replacement, Safety and Compliance and Non-System Capex .................................................................................................. 77
SP AusNet Review - Final Report
Report to AER (Public) 4 August 2013
7 Opex ...................................................................................................... 79
7.1 Introduction ................................................................................................... 79
7.2 Step changes in recurrent maintenance .................................................... 80
7.3 Asset Works .................................................................................................. 89
7.4 Opex efficiency gains ................................................................................... 97
7.5 Recurrent opex – base and other adjustments .......................................... 97
8 Contingent Projects ............................................................................. 99
8.1 Overview ........................................................................................................ 99
8.2 Findings ....................................................................................................... 100
9 STPIS ...................................................................................................... 102
9.1 Overview ...................................................................................................... 102
9.2 SP AusNet’s proposed STPIS parameters ............................................... 102
9.3 Assessment of SP AusNet’s method ........................................................ 103
9.4 Findings on STPIS ...................................................................................... 104
9.5 Recommendations on STPIS parameters ................................................ 107
Appendices ..................................................................................................... 109
Annex A: Assessment of Parsons Brinkerhoff recommendations on STPIS ..... 110
Annex B: Capex and Opex trends .................................................................... 113
Annex C: Current RCP capex project variance ............................................... 116
Annex D: Addendum re WMTS ........................................................................... 118
Annex E: Resumes ............................................................................................... 122
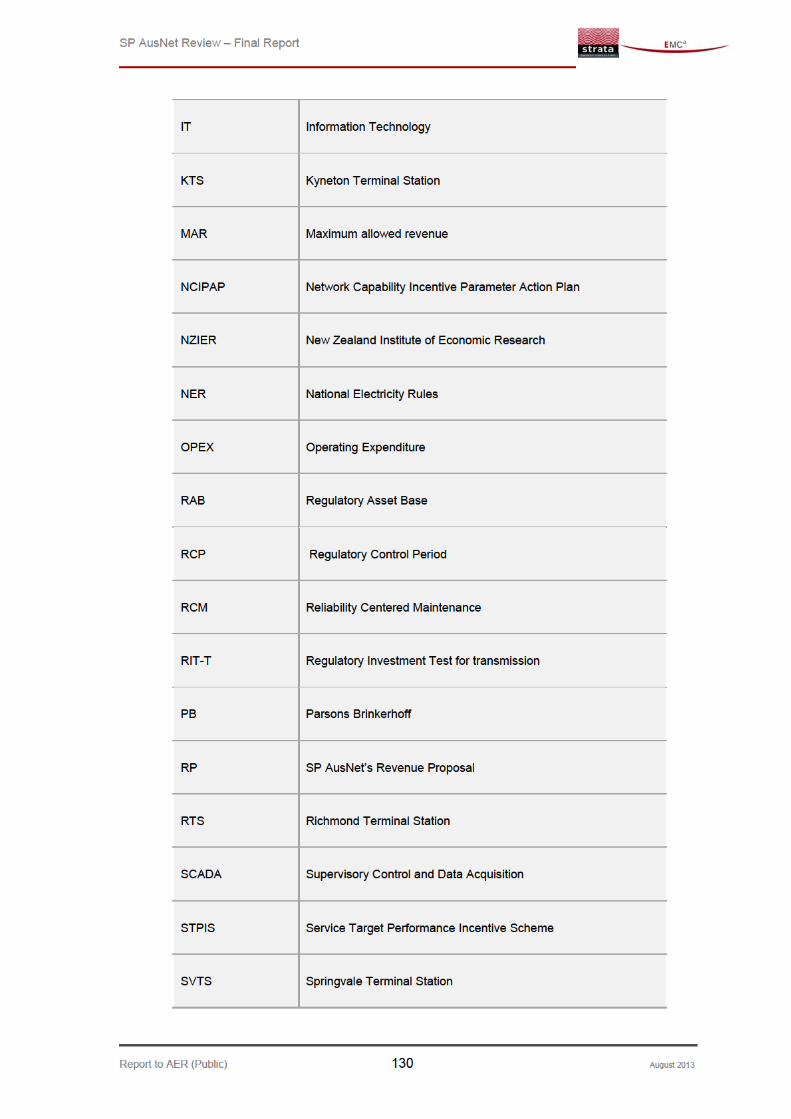
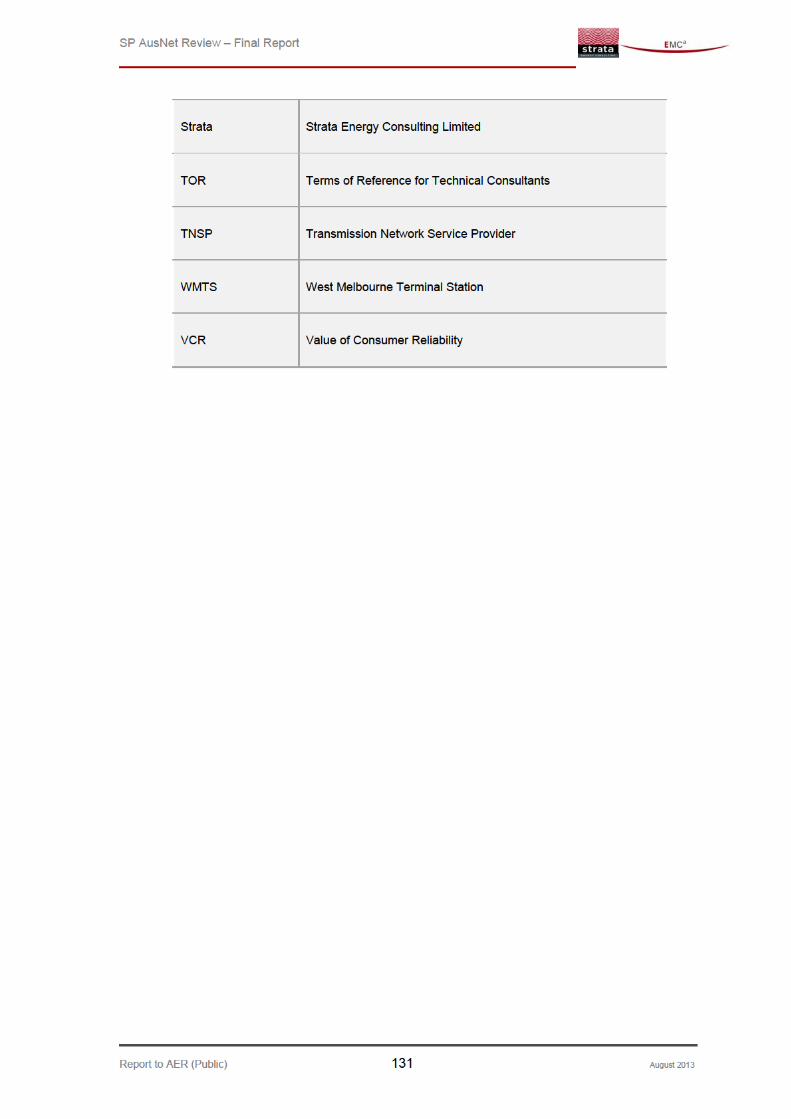
Glossary ........................................................................................................ 128
SP AusNet Review - Final Report
Report to AER (Public) 5 August 2013
Tables
Table 1: Source of capex adjustments ........................................................................................... 19 Table 2: Results of capex adjustments (by proposed expenditure category) ................................ 19 Table 3: Opex adjustment table ...................................................................................................... 20 Table 4: Capex summary – Current and next RCP ........................................................................ 22 Table 5: Capex comparisons of average annual expenditure ........................................................ 22 Table 6: Opex summary – current and next RCP .......................................................................... 29 Table 7: Opex comparisons of average annual expenditure .......................................................... 30 Table 8: Comparison between proposed and actual Opex ............................................................ 32 Table 9: Current RCP Capex comparison ...................................................................................... 38 Table 10: Analysis of projects proposed and undertaken during current RCP ................................ 41 Table 11: Proposed projects and programs of work, by type and status ......................................... 42 Table 12: Proposed cost ................................................................................................................... 52 Table 13: Effect of one-year deferral of WMTS rebuild .................................................................... 55 Table 14: GIS vs AIS comparative cost ............................................................................................ 59 Table 15: Proposed and adjusted WMTS capex allowance ............................................................. 61 Table 16: Proposed capex for major stations capex (as reviewed) ................................................. 62 Table 17: SP AusNet Group IT ......................................................................................................... 70 Table 18: Benchmarks ...................................................................................................................... 72 Table 19: Proposed opex: comparison of incremental expenditure and step changes ................... 83 Table 20: Step changes (As adjusted by EMCa) ............................................................................. 88 Table 21: Current and next RCP asset works program opex and associated metrics ..................... 92 Table 22: Current RCP and proposed asset works programs .......................................................... 95 Table 23: STPIS ............................................................................................................................. 108 Table 24: Programs ........................................................................................................................ 116 Table 25: Projects ........................................................................................................................... 116 Table 26: Roll In/ Roll Out............................................................................................................... 117 Table 27: Cost difference between GIS and AIS ............................................................................ 120
Figures
Figure 1: Proportion of annual average non-load expenditure – current versus next RCP ............. 23 Figure 2: Capex: Comparison between Current RCP and Next RCP ............................................. 23 Figure 3: Proportion of annual average non-network expenditure – current versus next RCP ....... 24 Figure 4: Proposed increase in non-network expenditure ............................................................... 24 Figure 5: Capex comparison with 2007-08 RP and associated AER Decision ............................... 25 Figure 6: Capex comparison with 2007-08 RP and associated AER Decisions - Cumulative ........ 26 Figure 7: Capex comparisons – excluding CBD Rebuilds -cumulative ........................................... 26 Figure 8: Opex : Comparison between Current RCP and Next RCP .............................................. 31 Figure 9: Opex comparison with 2007-08 RP and associated AER Decision ................................. 32 Figure 10: Opex comparison with 2007-08 RP and associated AER Decisions - Cumulative .......... 33 Figure 11: SP AusNet expenditure forecasting methodology ............................................................ 35 Figure 12: Capex comparison with 2007-08 RP and associated AER Decision ............................... 38 Figure 13: Project cost variance ........................................................................................................ 40 Figure 14: Program cost variance ...................................................................................................... 40 Figure 15: Current RCP cost estimation variance by project size ..................................................... 46 Figure 16: Capex: Comparison between Current RCP and Next RCP ............................................. 52 Figure 17: As proposed($2013/14) .................................................................................................... 55 Figure 18: As adjusted ($2013/14) .................................................................................................... 55 Figure 19: GIS Cost minus AIS Cost ($m) ......................................................................................... 58
SP AusNet Review - Final Report
Report to AER (Public) 6 August 2013
Figure 20: GIS Cost minus AIS Cost (as % of GIS Cost) .................................................................. 59 Figure 21: Asset replacement programs capex ................................................................................. 66 Figure 22: Safety, security and compliance capex ............................................................................ 66 Figure 23: Non-system capex ............................................................................................................ 67 Figure 24: SP Group IT expenditure, by regulated business............................................................. 70 Figure 25: Proportion of transmission-related IT expenditure, by IT initiative (2009 – 13) ................ 71 Figure 26: Proportion of transmission-related IT expenditure, by IT initiative (Proposed 2014 – 2017)
71 Figure 27: SP Group IT expenditure, by regulated business (%) ...................................................... 73 Figure 28: Proportion of transmission-related IT expenditure, by IT initiative (2009 – 13)) .............. 76 Figure 29: Proportion of transmission-related IT expenditure, by IT initiative ................................... 76 Figure 30: Current and next RCP recurrent opex, showing proposed step changes ........................ 81 Figure 31: SP AusNet’s categorisation of proposed step changes ................................................... 82 Figure 32: Recurrent controllable expenditure, with adjusted step changes ..................................... 89 Figure 33: Opex: Asset works ............................................................................................................ 90 Figure 34: Current RCP Asset works: 2007 Revenue Proposal and revised revenue Proposal
versus actual/estimated ($2013/14) ............................................................................................... 91 Figure 35: Capex – Detailed trending by category (RRP 2008 v current RCP Actual/Estimate)and as
proposed for next RCP ................................................................................................................ 113 Figure 36: Opex – Detailed trending by category – Current RCP (RRP 2008 vs. current RCP
Actual/current Estimate) and as proposed for next RCP ............................................................. 114
SP AusNet Review - Final Report
Report to AER (Public) 7 August 2013
1 Introduction 1.1 Purpose of this report
1. The Australian Energy Regulator (AER), in accordance with its responsibilities under the National Electricity Rules (NER), is required to conduct an assessment into the appropriate revenue to be obtained from provision of prescribed transmission services provided by SP AusNet for the years 2014/15 to 2016/17 (the next regulatory control period, or RCP). The process that the AER is required to follow is described in chapter 6A of the NER.
2. SP AusNet provided its Revenue Proposal for the period 2014-17 to the AER on 28th February 2013.
3. The AER engaged EMCa and Strata Energy Consulting (Strata) as a Technical Consultant to review and provide advice on specific areas of SP AusNet’s Revenue Proposal. The focus of the review is on SP AusNet’s past and forecast capital expenditure (capex) and operational expenditure (opex), associated policies and procedures, proposed contingent projects and its service standard proposals.
4. The purpose of this report is to provide the AER with our findings from our technical review.
1.2 Regulatory framework
1.2.1 The NER requirements 5. The main relevant chapter of the NER for our assessment of transmission revenue
proposals is Chapter 6A which deals with the rules for economic regulation of transmission services, including such services provided by SP AusNet.
6. The Revenue Proposal must establish how forecast expenditure meets SP AusNet’s regulatory obligations. To do this the forecast expenditure must meet the submission


SP AusNet Review - Final Report
Report to AER (Public) 12 August 2013
2 Findings and recommendations
17. This section of the report provides our review findings and the recommended actions
and adjustments based on those findings. We also indicate the overall impact of making the proposed adjustments.
2.1 Findings and recommendations
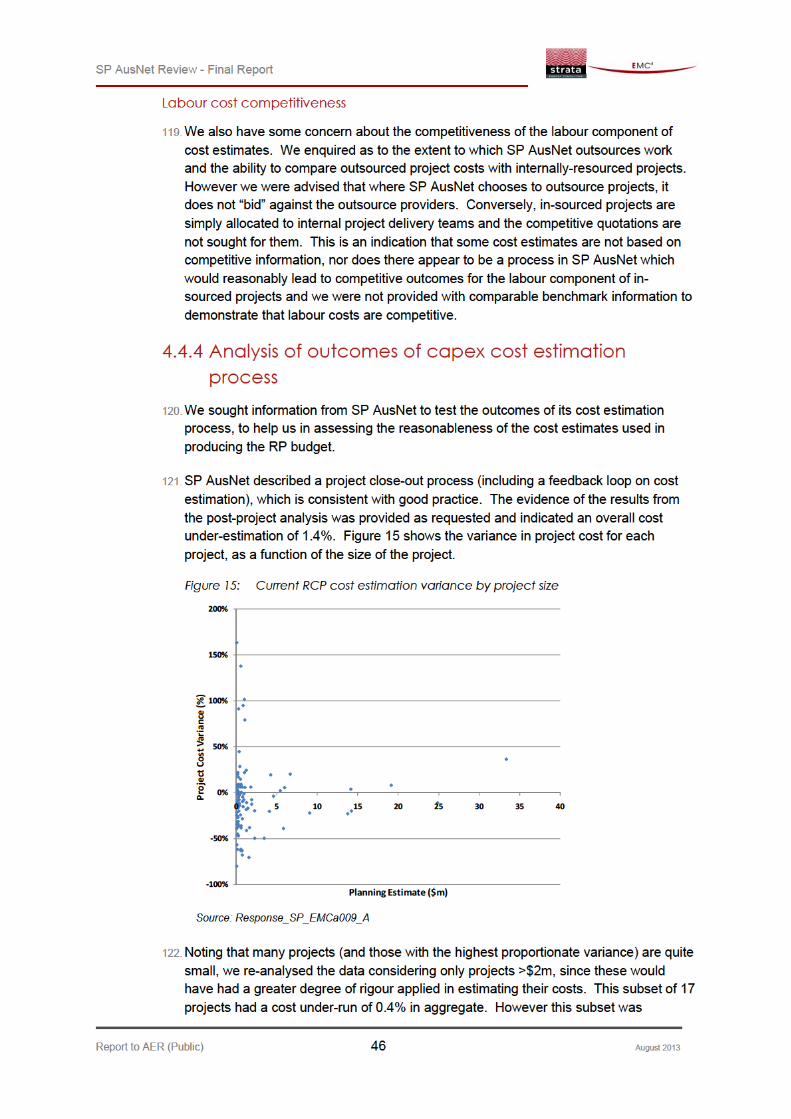
2.1.1 General observations and areas of focus 18. SP AusNet’s PAS 55 accredited asset management framework comprises well
documented asset related policies and strategies that guide the procedures used by the business to establish its capex and opex forecasts. We found that SP AusNet has introduced a two stage process for reviewing the projects and work programmes to establish a reasonable priority order for projects and programs of work. For the most part, SP AusNet undertakes appropriate analysis to establish the need, scope and proposed timing of individual projects and programs of work.
19. We have found some exceptions in which SP AusNet’s application of the asset management framework for the purposes of establishing the Revenue Proposal are not sufficiently rigorous and have led to the proposal of some items of expenditure that are not sufficiently justified. We consider also that SP AusNet has focussed overly at the individual project and program level and has paid less attention to the realism and scope of the aggregate portfolio of projects and programs that it proposes. Given SP AusNet’s considerable underspend against the similarly built-up budgets that it proposed for the current RCP, we consider this to be a weakness in the proposed budget which has led to over-forecasting the expenditure needs for the next RCP.
20. Following the initial analysis, we identified the following aspects of the proposed budget on which to focus our review:
SP AusNet Review - Final Report
Report to AER (Public) 13 August 2013
The timing, assumed technology and proposed capex budget for the West Melbourne Terminal Station project;
Proposed capex on other major stations;
Proposed IT capex and related opex savings;
Capex cost estimation, prudency and deliverability;
Proposed opex step changes;
Proposed opex asset works program;
Contingent projects;
STPIS.
2.1.2 Findings on proposed capex
Overall finding on proposed capex
21. We find that key elements of the replacement capex proposed by SP AusNet are not reasonable in terms of the NER requirements because we consider that:
The proposed level of expenditure for the replacement of West Melbourne terminal substation based on Gas Insulated Switchgear(GIS) infrastructure has been insufficiently justified and should be reduced and the proposed timetable is unlikely to be met;
The proposed expenditure on two of the major substation replacement projects has been insufficiently justified and should be reduced;
The business case for the significant level of proposed IT capex does not justify the level of expenditure.
Proposed West Melbourne Terminal Station (WMTS) expenditure
22. While we support the need for refurbishment of WMTS, we consider that:
The case for this station to be rebuilt as a GIS station is not compelling and leads to a high estimate. We are not persuaded by the arguments that a rebuild as a GIS station is required for visual amenity, space or refurbishment logistics. We do not consider SP AusNet’s costing of an AIS alternative to be a reliable estimate, and we consider that this is likely to have led to premature rejection of this option on the assumption that the costs are “close”;
We are not persuaded by arguments that SP AusNet can adequately manage the risk of undertaking this refurbishment in parallel with Richmond Terminal Station refurbishment, and major work at other major CBD-supply substations. The “risk graphs” which were produced to show the optimum timing of the WMTS do not include sufficient allowance for the additional risks arising from undertaking these projects at the same time. We therefore consider a more prudent overall risk profile can be achieved by deferring WMTS refurbishment by at least one year, and that this is the likely outcome for this project.
SP AusNet Review - Final Report
Report to AER (Public) 14 August 2013
23. On this basis we recommend that the AER adjusts the proposed capex allowance for this station, by reducing it from $107.9m as proposed, to an expenditure of $52.1m within the RCP1.
Proposed capex on other major stations
24. We find that the need for proposed refurbishment and replacement work at each of the other major stations is justified. However, we consider that aspects of the scope of two of the projects have been engineered conservatively at this initial scoping stage, and some of the proposed expenditure will not be required. Accordingly we recommend that the AER reduces the proposed capex by $3.9m for Fisherman’s Bend and by $0.4m for Hazelwood Power Station stage 4.
25. For Yallourn Power Station, while no adjustment is recommended for the proposed expenditure within the RCP, we have concerns regarding the remaining life of the station and recommend that SP AusNet do not propose any future expenditure unless the investment has only a low risk of being stranded.
Proposed IT capex
26. We find that the proposed IT expenditure is not justified. We have reviewed this from a number of perspectives and we find that:
It is above the level required to sustain ongoing IT replacement;
It is above benchmarks with other transmission businesses;
Benefits from the “strategic” element of past and proposed IT have not been quantified in business cases put to the Board, nor have the expenditure categories been specifically identified from which the benefits would be derived. Application of PAS 55 asset management methods would require economic analysis, including cost/benefit assessment, to be undertaken as an input into investment decision making;
Net benefits proposed as “negative step changes” in the current RCP are insufficient to justify the proposed expenditure;
The weighting of proposed group-wide IT expenditure on transmission, rising from 18% (historical) to 31% of the proposed spend, is disproportionate and circumstantially appears to be based on the regulatory cycle.
27. We recommend that the AER reduces the proposed IT capex of $48.5m to $31.5m.
Portfolio assessment: Cost estimation, prudency and deliverability
28. From analysis of proposed projects and outcomes in the current RCP, we find that SP AusNet has spent considerably less capex than it proposed. Setting aside the deferral of RTS and WMTS from the current period into the next period, and other proposed projects that were “rolled out” of the current RCP program, SP AusNet spent 11.7% less on site-specific projects and 12.6% less on non site-specific programs of work than it had proposed. The reasons for this appear to be a combination of portfolio-
1 These figures are before the application of the 1.4% efficiency allowance that SP AusNet has proposed.

SP AusNet Review - Final Report
Report to AER (Public) 15 August 2013
level effects including prudent reductions in scope, optimisation between projects and prudent deferrals.
29. From the stage that business cases are developed, we find that SP AusNet’s cost estimation has been relatively accurate, with a 1.4% over-estimation bias.
30. Most proposed projects and program of work do not at this stage have business cases. Accordingly we recommend the following portfolio-level adjustments to the proposed capex:
No further reductions for those projects or programs for which we have proposed specific reductions under the previous headings;
A 1.4% reduction for those projects that have business cases, but are not substantially underway;
An 11.7% reduction for the aggregate of costs for site-specific network projects (other than those above);
A 12.6% reduction for the aggregate of costs for non site-specific programs of work (other than those above).
Other capex
31. Other than the items and proposed adjustments above, we consider that the remainder of proposed capex is reasonable. We have some concerns with proposed communications opex, as the scope of the work program and the associated cost estimates appear to be provisional. However this concern is covered by the program adjustment proposed above.
2.1.3 Findings on proposed opex
Overall finding on proposed opex
32. We find that key elements of the controllable opex proposed by SP AusNet are not reasonable in terms of the NER requirements, because we consider that:
The case for accepting the aggregate of proposed step changes is not well made and a number of them are not consistent with the AER’s guideline;
The case for the level of some proposed asset works is not adequate and is inconsistent with the levels of such expenditure that SP AusNet is choosing to spend prior to the next RCP.
Proposed step changes
33. We have reviewed each of the twelve proposed step changes against the AER’s guidelines. We have sought to confirm that each step change is externally driven or arising from the application of new policies and procedures generally applicable to similar firms in the NEM, that it is not already included in the base year, and that its timing aligns with the timing of the new / changed investment driver.
34. The proposed step changes are significant, representing an increment of 18% on the base rolled–forward recurrent opex (excluding taxes, leases and insurance), and they are proposed to occur only from the commencement date of the next RCP. We found

SP AusNet Review - Final Report
Report to AER (Public) 16 August 2013
that some drivers already exist and therefore the evidence of actual and estimated expenditure in the current RCP suggests that it is either already included in recurrent expenditure or that the proposed increment at the commencement of the next RCP is not required. We also found that SP AusNet was unable for some time to provide information on current levels of expenditure for a number of items, therefore it could be reasonably inferred that the proposed increments had been developed without a satisfactory understanding of such existing expenditure. We also found that an innovation program exists already and we consider that the proposed expenditure should be considered part of an existing overall program, and internally justified.
35. We recommend:
Disallowing the following proposed step changes:
− Impact of carbon price on SF6
− Innovation program
− IT network security
− SCADA security
− Enable market reporting
− Transitional arrangements
Allowing 50% of the proposed step increase for security of critical infrastructure;
Re-classifying “corrosion management” (tower painting) as an Asset Works program;
Accepting the remaining proposed step changes.
36. The impact of this adjustment would be to reduce the proposed step changes from a total of $32.5m over the three years to $10.9m.
Proposed asset works programs
37. While the proposed level of asset works expenditure is less than was proposed for the current RCP, it would nevertheless represent an increase of around 25% on the level that SP AusNet is spending in the last four years of the current RCP and we consider that this increase for the “as-proposed“ works is not justified. We have reviewed the shortfall of $45.8m between the asset works proposed for the current RCP and the work that SP AusNet undertook, and which represents a 46% underspend2. We find that there was a tendency for SP AusNet to over-estimate unit costs for this work but that the majority of the variance is explained simply by less work having been done.
38. While SP AusNet has put forward justifications for the various programs of forward work, and we are generally satisfied that they support the need to do the work, they are at this stage indicative programs that have not been committed to and, for the most part, do not have firm metrics. As it develops its commitment plans for such work, we consider it likely that SP AusNet will find that the actual work required is less than the indicative programs suggest due to reduced need, delivery issues and opportunities to prudently de-scope and defer, as has been the case in the current RCP.
2 Figures comprise field work, plus asset works support

SP AusNet Review - Final Report
Report to AER (Public) 17 August 2013
39. We also consider that $3.4m on transformer refurbishment work at RTS and WMTS is more suitably classified as capex, on the basis that the supporting documents show that it is to extend the lives of these assets beyond their current average age of around 48 years.
40. We consider that the proposed costs for five programs should be adjusted:
Tower corrosion - ground level;
Transformer and CT failure risk;
Transmission line hardware;
Replacement of tower steelwork.
41. The recommended adjustments would retain each of these programs, but with a lower assumed expenditure level. However, offsetting these reductions, we recommend re-categorising “tower painting” from an opex step change to an asset works program. At a portfolio level, we recommend allowing the aggregate of proposed asset works opex, but with the inclusion of the tower painting program within the proposed budget of $24.6m.
Recurrent opex – base and other adjustments
42. Although we are concerned that the 2011/12 base year recurrent opex is $5m (11%) greater than was proposed3 for this year, we consider it acceptable for base year purposes on the grounds of being “actual expenditure” and it is less than the average of recurrent opex in the preceding three years.
43. We have reviewed the escalator calculations, which we consider to be satisfactory. In accordance with our scope, we have not reviewed the proposed escalators themselves.
44. We consider the “group 3 roll-in adjustment” that SP AusNet has proposed is erroneous and should be based not on the change in relativity between the unregulated and regulated asset bases, but on the value of currently-unregulated assets to be rolled into the RAB (with associated opex) relative to the replacement cost value of the RAB. Further, we consider that different scaling factors should apply, with a very low scaling applied to corporate costs. We have estimated an adjusted allowance of $2.4m in aggregate over the three-year period, compared with $5.2m as proposed by SP AusNet.
45. There are two other adjustments to base year escalated opex that flow from our consideration of other components.
46. We consider an estimate of the efficient level of opex, as is required under the NER, should take into account the continuation of efficiency improvements that can reasonably be expected. In this regard the main benefits that we can identify would be expected to flow from SP AusNet’s considerable strategic investments in IT and we have calculated that this should be of the order of $2.4m per year. This would
3 SP AusNet RRP, 2008
SP AusNet Review - Final Report
Report to AER (Public) 18 August 2013
represent approximately a 2.6% reduction in SP AusNet’s proposed controllable opex, and we consider this to be a reasonable proxy for continuous improvements generally.
47. SP AusNet advised that a number of tower steel members for which replacement is proposed under asset works, were replaced under recurrent maintenance in the current period. We estimate that an amount of $0.6m needs to be adjusted out of the base year, thereby effectively reducing next RCP recurrent opex by $1.8m
48. Finally, if the AER does not include the strategic enterprise asset management system in IT capex, then the “savings” of $0.8m that SP AusNet has estimated and allowed for, should be added back.
2.1.4 Findings on contingent projects 49.
50. For the proposed South Morang transformer replacement, we consider that the proposal would effectively provide a higher level of security than is required and that SP AusNet’s plan for the replacement of transformers at South Morang already adequately deals with contingent events.
2.1.5 Findings on STPIS 51. We consider that the rationale for the proposed STPIS parameters is unconvincing and
is biased towards achieving higher revenues to SP AusNet rather than as a balanced incentive mechanism. We consider that the statistical distributions used are not fit for purpose and different distributions should be used. We also are not persuaded of the need for an adjustment for increased capital works.
52. We have recommended alternative targets and caps and collars, based on more appropriate distributions and without the capital works adjustment. Please see the table in section 9.5 for the details of these recommendations.
2.2 Implications of these findings
2.2.1 Implications for required capex 53. The following table summarises the proposed and adjusted capex:
[C-I-C]

SP AusNet Review - Final Report
Report to AER (Public) 19 August 2013
Table 1: Source of capex adjustments
Source: EMCa analysis from SP AusNet Capex Forecast Model
Table 2: Results of capex adjustments (by proposed expenditure category)
Source: EMCa analysis from SP AusNet Capex Forecast Model
2.2.2 Implications for required opex 54. The following table summarises the proposed and adjusted opex:
($m, 2013/14)
SP AusNet forecasted capex 564.2
Adjustments:
Deferral of WMTS 55.1‐
Deferral of FBTS replacement 3.9‐
Deferral of HTS rebuild 0.6‐
Projects ‐ No business case (11.7% reduction) 9.5‐
Programs (12.6% Reduction) 21.9‐
IT 16.8‐
Adjusted Capex 107.7‐ 456.4
Implied
Adjustment Total Capex
($m, 2013/14)
Non Load
CBD rebuild 185.8 130.7 55.1‐
Major station replacement 149.8 135.9 14.0‐
Replacement Other 121.1 105.9 15.2‐
Security / Compliance 44.7 39.1 5.6‐
Non Load Subtotal 501.5 411.6 89.9‐
Non Network
Non System ‐Other 9.0 7.9 1.1‐
Vehicles 5.2 5.2 ‐
Premises 0.7 0.7 ‐
IT 47.9 31.1 16.8‐
Non Network Subtotal 62.7 44.8 17.9‐
Total Capex 564.2 456.4 107.7‐
As ProposedEMCa
adjustedDifference

SP AusNet Review - Final Report
Report to AER (Public) 20 August 2013
Table 3: Opex adjustment table4
Source: EMCa analysis from SP AusNet Opex Forecast Model
2.3 Other observations 55. We have concerns regarding the impact of the relatively high values of Value of
Customer Reliability (VCR) and the estimated cost of life which are key inputs into SP AusNet’s economic evaluations of projects. These are external inputs that we understand SP AusNet is obliged to use. Whilst sensitivity testing undertaken on a limited number of projects led to the conclusion that these inputs did not materially drive expenditure, it is considered likely that in some cases the VCR will have a material impact on both the timing and level of project expenditure.
56. We recommend that the use of the VCR is reviewed and calibrated to local conditions when it is found to have a material impact on a proposed project.
4The proposed capex and the adjustments in this table are based on SP AusNet’s proposed escalation factors. A second-order adjustment will be required if the AER decides to alter these escalation factors. The adjustments also take account of SP AusNet’s proposed capex efficiency adjustment. These may lead to minor differences between the summary amounts shown in these tables and amounts reported elsewhere in this report.
$m, 2013/14
Implied Adjustment
Total Opex
SP AusNet forecasted controllable opex 281.0
Step change adjustments:
Recurrent Maintenance 12.5-
Support SR 1.8-
System operations - Health and safety 2.5- IT 2.0- Other corporate 2.9-
Subtotal 21.7-
Adjustment to recurrent benchmarked 9.0-
Grp 3 rollin 2.8-
Asset work adjustment 0.6-
IT-enabled opex savings 6.4-
Adjusted controllable opex 40.4- 240.6
SP AusNet Review - Final Report
Report to AER (Public) 21 August 2013
3 Expenditure Trends 3.1 Capex trends
3.1.1 Comparisons between current RCP and SP AusNet’s proposal for next RCP
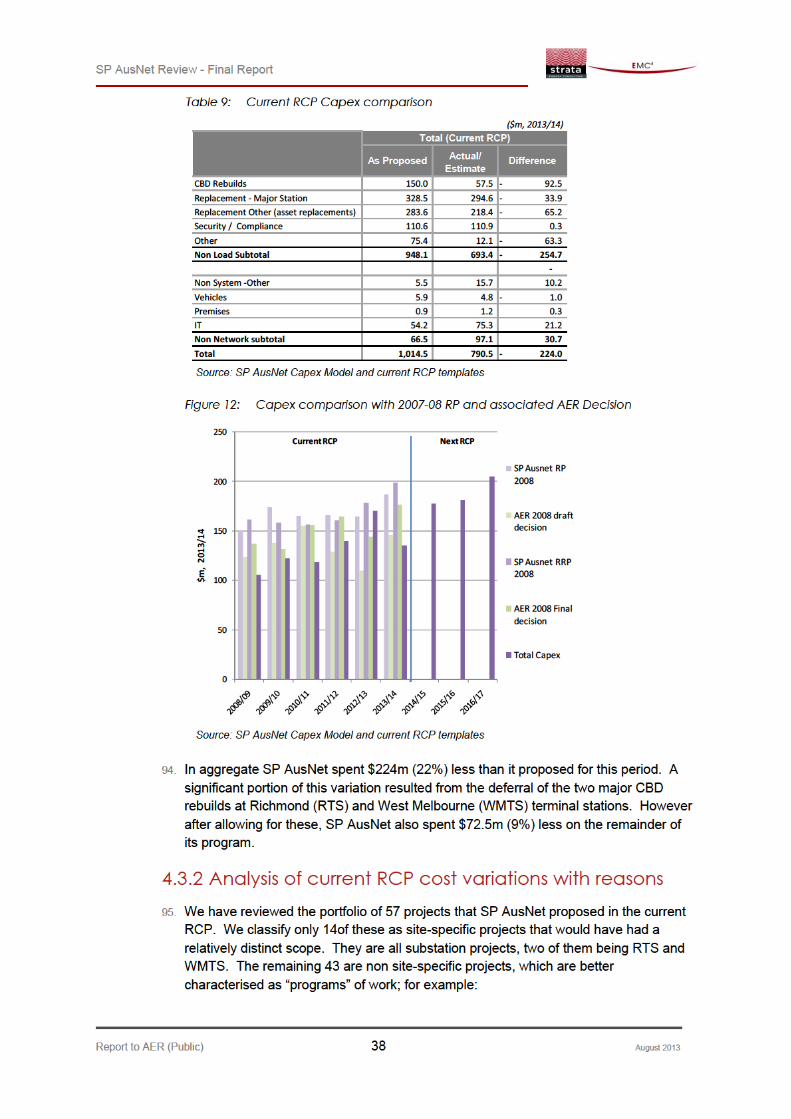
57. Tables 4 and 5 below provide a summary of the current RCP actual/estimated capex and the proposed forecast capex included in SP AusNet’s 2013 RP (for the next RCP). Because of the different time-periods of the two RCPs, it is more useful to compare expenditure on an annualised average basis. On that basis, the next RCP proposes capex that is $56m p.a. (43%) higher than in the current RCP5, 6.This is a significant increase that requires compelling justification. While most of the increase ($52m p.a.) is because of the proposed CBD rebuilds, there is also a material increase proposed for major station replacements and a proposed increase in non-network expenditure.
5 The original proposed total capex for the next RCP is $575m (real 2013/14).
6 The total capex for next RCP was then modified to $564.2m (see: EMCA019_Q4A_-TRR_SP_AusNet_Capex_Forecast_Model)

SP AusNet Review - Final Report
Report to AER (Public) 22 August 2013
Table 4: Capex summary – Current and next RCP
Source: SP AusNet Capex Forecast Model
Table 5: Capex comparisons of average annual expenditure
Source: EMCa analysis from SP AusNet Capex Forecast Model
($m, 2013/14)
2008/09 2009/10 2010/11 2011/12 2012/13 2013/14 2014/15 2015/16 2016/17 Current RCP Next RCP
Actual Actual Actual Actual Estimated Estimated Proposed Proposed Proposed
CBD Rebuilds - - - - 14.2 43.2 65.7 58.3 61.9 57.5 185.8
Replacement - Major Station 46.2 47.6 47.9 58 8 55.6 38.5 32 2 50.0 67.7 294.6 149.8
Station Rebuilds subtotal 46 20 47.6 47.9 58 8 69.8 81.7 97 8 108.2 129.6 352.0 335.7
Replacement Other (asset replacements) 26.3 40.9 35.1 34 9 52.8 28.4 38 2 38.8 44.1 218.4 121.1
Security / Compliance 16.5 20.2 16.8 30 9 23.5 3.0 16 3 14.9 13.5 110.9 44.7
Other 1.9 2.9 2.2 1.1 2.6 1.4 - - - 12.1 -
Non Load subtotal 90.90 111.6 102 125.7 148.8 114.4 152.4 161.9 187.2 693.4 501.5
Non System -Other 4.4 2.9 3.3 1.4 2.1 1.6 2.9 3.0 3.1 15.7 9.0
Vehicles 1.1 0.3 0.0- 0.2 1.6 1.6 1.9 1.9 1.3 4.8 5.2
Premises 0.3 0.3 0.1 0.1 0.2 0.2 0.2 0.2 0.2 1.2 0.7
IT 8.5 7.1 12.8 12.3 17.2 17.5 20 3 14.3 13.2 75.3 47.9
Non Network subtotal 14.2 10.6 16.2 14.0 21.1 21.0 25.4 19.4 17.8 97.1 62.7
Total Capex 105.1 122.2 118.2 139.7 169.9 135.5 177.8 181.3 205.0 790.5 564.2
Current RCP Next RCP Total
($m, 2013/14)
CBD Rebuilds 9.6 61.9 547%
Replacement - Major Station 49.1 49.9 2%
Station Rebuilds subtotal 58.7 111.9 91%
Replacement Other (asset replacements) 36.4 40.4 11%
Security / Compliance 18.5 14.9 -19%
Other 2.0 - -100%
Non Load Subtotal 115.6 167.2 45%
Non System -Other 2.6 3.0 14%
Vehicles 0.8 1.7 115%
Premises 0.2 0.2 8%
IT 12.6 16.0 27%
Non Network subtotal 16.2 20.9 29%
Total Capex 131.8 188.1 43%
Next RCP Average
Current RCP
Average


SP AusNet Review – Final Report
Report to AER (Public) 27 August 2013
65. In summary, SP AusNet has consistently underspent its previously-forecast expenditure. The reasons that have been provided by SP AusNet include:
The need was found to be less urgent and the solution could be prudently deferred;
The impact of the GFC7.
66. In addition, we have found a tendency towards estimating conservatism, in that the projects as built tended on average to cost less than was estimated. We believe this was due to a combination of prudent de-scoping, optimising the engineering design and specification, rationalising between projects, and purchasing and delivery efficiencies.
67. In regards to the GFC impact, SP AusNet has explained8 that there was a corporate drive to reduce expenditure. As Technical Advisers we are not satisfied by this explanation. While we are fully supportive of continuous improvement measures to achieve efficiencies in design, scoping and delivery of works and of the need to ensure that works are appropriately justified, we are concerned that works that were proposed as being required, justified and efficiently budgeted for and for which consumers have paid through transmission charges, have not been done. The explanations for this can only be that:
The work was conservatively over-scoped and over-estimated in the first place; or
The work was scoped and estimated appropriately, but has been de-scoped and/or deferred imprudently, from an engineering/economic perspective.
68. SP AusNet has stated that “it accepted higher risk” as a result of the reduced level of spending. We would have expected to see advice to the Board on the risk implications of these major reductions in planned replacement and refurbishment capex and similar reductions in asset works opex9. SP AusNet has advised that it does not have records of any formal advice to the Board on this matter. SP AusNet has drawn attention to statements made in its 2011 Asset Management Plan (which was approved by the Board), however these state only that work was being prioritised “to manage the most pressing reliability and supply risks” and that the “immediate increase in technical risk in 2011 from (the asset works) deferrals is minimal”.10Since SP AusNet has stated that the implications of such significant deferrals is relatively minor, the corollary is that the work was to a degree over-scoped and over-estimated in the first place, and that corporate financial pressures led to a more appropriate level of work being undertaken. Further, to the extent that there was increased risk, then that was a risk (or increase in risk) placed on consumers (of non-supply) since this is one of the two main drivers that SP AusNet has put forward to justify its work program. This situation is exacerbated by the pricing outcome, in which consumers were charged already as if this work
7 Response to information request SP_AER20_GFC_230513
8Meeting SP AusNet, AER and EMCa, 30thMay 2013
9 See section 3.2.3
10 Response SP_EMCa37 network Risk (26/06/2013)

SP AusNet Review – Final Report
Report to AER (Public) 28 August 2013
would be done, and are now being asked to “pay for it again” as it is incorporated into the proposed expenditure for the next RCP.
69. Our analysis of the significant variance between the proposed and actual expenditure in the current RCP and SP AusNet’s statements that these reductions had a relatively minor impact reduces our confidence in SP AusNet’s capital expenditure forecasts for the next RCP. As will be seen in section 4, we have undertaken a more detailed assessment of SP AusNet’s portfolio planning and expenditure budgeting, which we present in section 4, and we have also been mindful of this evidence in assessing proposed capex and risks for major projects, particularly West Melbourne Terminal Station (section 5).
3.2 Opex trends
3.2.1 Comparisons between current RCP and SP AusNet’s proposal for next RCP
70. Tables 6 and 7 below show component-level opex trends across the current RCP and as proposed for the next RCP. As can be seen in Table 6 and from the current/next RCP boundary trends in Table 7, SP AusNet is proposing a significant increase in recurrent Routine Maintenance expenditure. Further inspection of trends shows that opex declined during the current RCP from a high in 2008/09, driven by reductions in Asset Works and Corporate costs, and is estimated to increase in 2012/13 and 2013/14, driven mainly by increases in Asset Works and Routine Maintenance.

SP AusNet Review - Final Report
Report to AER (Public) 29 August 2013
Table 6: Opex summary – current and next RCP
Source: SP AusNet Opex Model
$m, 2013/14
2008/09 2009/10 2010/11 2011/12 2012/13 2013/14 2014/15 2015/16 2016/17 Current RCP Next RCPActual Actual Actual Actual Estimated Estimated Proposed Proposed Proposed
Routine maintenance - System Recurrent (SR)Maintenance 27.0 27.7 25.6 25.4 25.6 27.1 32.5 32.9 33.3 158.4 98.6 Support SR 7.1 9.0 5.8 5.1 5.1 5 2 5.7 6.0 6.1 37.3 17.8 System Operation 3.3 4.0 5.2 5.7 5.8 6.1 6.5 6.6 6.7 30.0 19.8 Heal h & Safety 0.8 0.8 1.0 0.7 0.7 0.7 2.4 2.5 2.5 4.8 7.4 Taxes/Leases 3.8 5.6 5.1 5.4 5.4 5.4 5.4 5.4 5.4 30.7 16.2 Insurance 2.8 2.9 3.2 4.0 4.6 5.2 5.7 6.3 7.0 22.7 19.1
Subtotal 44.8 50.0 45.9 46.2 47.3 49.7 58.2 59.7 61.0 283.9 178.9
Asset works - System Non Recurrent (SNR)Total SNR costs 12.4 12.4 7.8 4.2 5.8 5.0 8.0 8.0 8.5 47.5 24.6 Support SNR 1.1 0.9 1.5 1.0 1.1 1.1 1.3 1.3 1.3 6.8 3.8
Subtotal 13.5 13.3 9.3 5.2 6.9 6.1 9.2 9.3 9.8 54.3 28.4
Corporate costs - RecurrentFinance 3.5 4.0 3.1 3.6 3.6 3.7 3.7 3.7 3.8 21.5 11.2 HR 1.0 1.3 1.6 0.5 0.5 0.5 0.5 0.5 0.5 5.3 1.5 IT 2.2 6.3 7.2 6.4 6.4 6.4 7.0 7.0 7.0 34.8 20.9 Other Corporate 7.6 5.1 5.5 4.1 4.2 4.2 4.2 5.6 5.6 30.7 15.4 Management Fee 12.2 2.2 5.0 6.3 6.4 6.5 6.7 6.8 6.9 38.6 20.4
Subtotal 26.5 18.9 22.4 20.9 21.0 21.2 22.0 23.6 23.8 130.9 69.4
Savings from IT capex - - - - - - - 0.1- 0.8- - 0.8-
Grp 3 rollin (asset base growth)Total asset roll-in adjustment - - - - - - 1.7 1.7 1.8 - 5.2
Controllable Opex 84.8 82.2 77.6 72.2 75.2 77.0 91.1 94.3 95.6 469.0 281.0
Current RCP Next RCP Total
SP AusNet Review - Final Report
Report to AER (Public) 30 August 2013
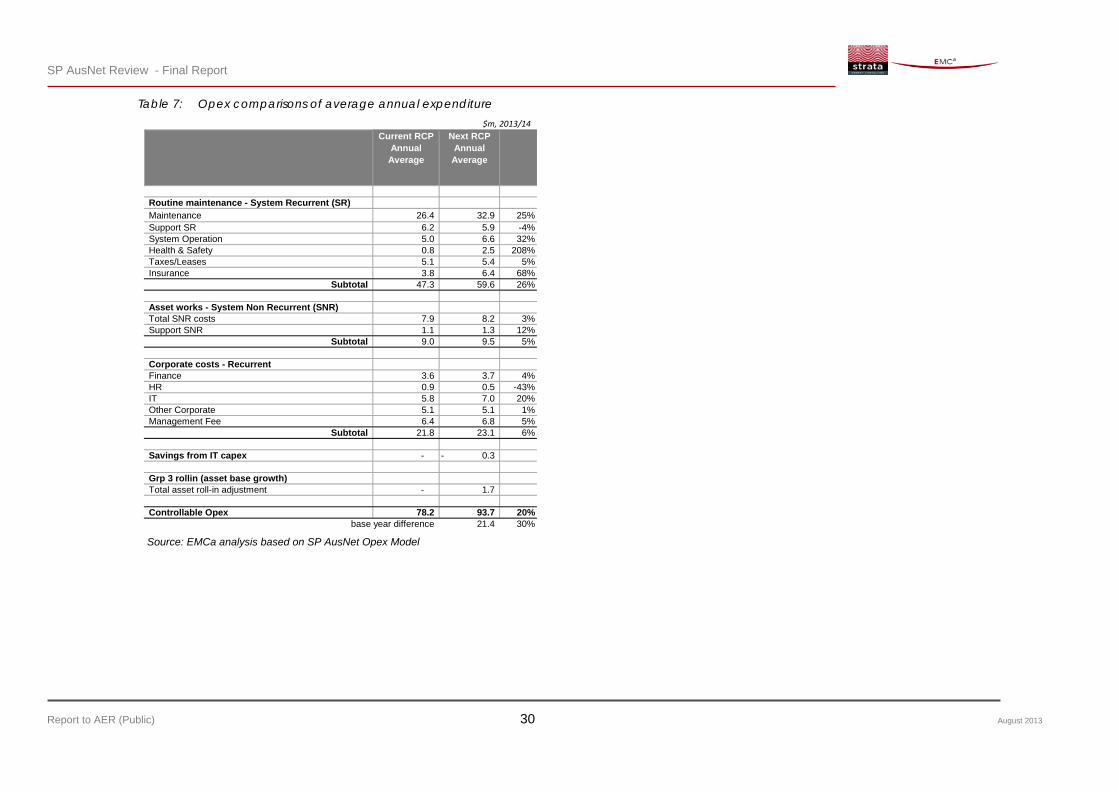
Table 7: Opex comparisons of average annual expenditure
Source: EMCa analysis based on SP AusNet Opex Model
$m, 2013/14
Routine maintenance - System Recurrent (SR)Maintenance 26.4 32.9 25%Support SR 6.2 5.9 -4%System Operation 5.0 6.6 32%Health & Safety 0.8 2.5 208%Taxes/Leases 5.1 5.4 5%Insurance 3.8 6.4 68%
Subtotal 47.3 59.6 26%
Asset works - System Non Recurrent (SNR)Total SNR costs 7.9 8.2 3%Support SNR 1.1 1.3 12%
Subtotal 9.0 9.5 5%
Corporate costs - RecurrentFinance 3.6 3.7 4%HR 0.9 0.5 -43%IT 5.8 7.0 20%Other Corporate 5.1 5.1 1%Management Fee 6.4 6.8 5%
Subtotal 21.8 23.1 6%
Savings from IT capex - 0.3-
Grp 3 rollin (asset base growth)Total asset roll-in adjustment - 1.7
Controllable Opex 78.2 93.7 20%base year difference 21.4 30%
Current RCP Annual Average
Next RCP Annual Average


SP AusNet Review - Final Report
Report to AER (Public) 34 August 2013
4 Asset management and expenditure planning
4.1 Introduction 73. In this section, we comment on the policies and processes that SP AusNet applies in
planning expenditure, and the outcomes of that process, in order to form a view on the reasonableness of the expenditure that SP AusNet has proposed in its Revenue Proposal. We first consider SP AusNet’s asset management planning policies and processes, we then consider the way in which these are applied. This includes consideration of:
Need – as identified ex ante for planning over the four years from now to the end of the next RCP11;
Likely changes to that need, that would be expected to occur with the passage of time and improved information, including opportunities for prudent deferrals, project synergies and scope optimisation; and
SP AusNet’s cost estimation processes and outcomes.
4.2 Overview of assets works planning and management within SP AusNet
74. SP AusNet has established an asset management framework that includes well documented:
Policies;
Corporate level strategies;
11 Comprised of the final year of the current RCP and the three years of the next RCP
SP AusNet Review - Final Report
Report to AER (Public) 35 August 2013
Specific asset strategies; and
Procedures.
75. The continuing PAS 55 accreditation achieved by SP AusNet provides evidence that the asset management framework meets international practice standards. In our on-site review we generally found that SP AusNet applies its policies, strategies and procedures in a systematic manner.
76. The PAS 55 requirements provide SP AusNet with an international standard benchmark against which it can establish its asset management practices and asset related replacement capex and opex expenditure forecasts. We noted that the asset management objectives set out in SP AusNet’s Asset Management Strategy did not include a specific economic efficiency objective. However, we observed economic evaluation is a key component of asset management prioritisation.
77. Given that the asset management framework is subject to periodic audits and assessments for continuing PAS 55 accreditation, our review focused primarily on SP AusNet’s application of its asset management processes when establishing its expenditure forecasts.
4.2.1 SP AusNet asset related expenditure forecasting methodology
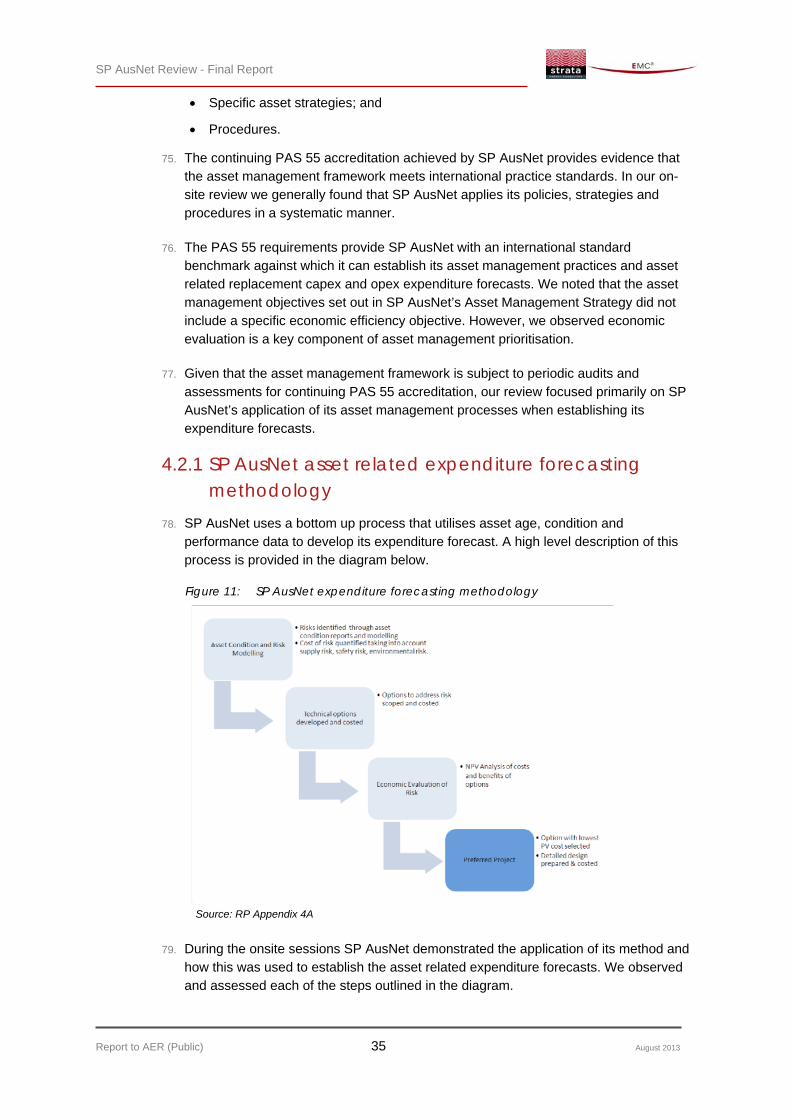
78. SP AusNet uses a bottom up process that utilises asset age, condition and performance data to develop its expenditure forecast. A high level description of this process is provided in the diagram below.
Figure 11: SP AusNet expenditure forecasting methodology
Source: RP Appendix 4A
79. During the onsite sessions SP AusNet demonstrated the application of its method and how this was used to establish the asset related expenditure forecasts. We observed and assessed each of the steps outlined in the diagram.

SP AusNet Review - Final Report
Report to AER (Public) 36 August 2013
80. On asset condition and risk modelling SP AusNet described how it uses of a range of methods to produce a definition of remaining service potential (RSP). This information is then used to establish probability of failures for each asset. We found that the collection and management of asset data was systematic and logical. Where efficient to do so, SP AusNet used sampling to establish its information on likely asset health for a specific asset type. Using the data collected, SP AusNet applies standard formulas to establish a forecast of the likelihood of failure for specific assets.
81. We observed that a feedback loop is used to calibrate the forecast failure rates established using standard formulas with actual historical asset failure rates for each asset category. We consider that this is good practice and likely to produce reliable output predictions of asset failure risk.
82. The probability of failure rating is used to develop an initial ranking of assets requiring attention. We observed that SP AusNet use the probability of failure rating to develop an initial asset works program. At this stage SP AusNet apply Total Asset Lifecycle and Reliability Centred Maintenance (RCM) techniques to determine asset management options for addressing assets with the highest failure risk.
83. The output from this second step can be considered as a work-program that is based on a bottom up process that takes into account a range of asset characteristics to determine a quantified risk based priority. The third step applies an economic evaluation, using condition based quantitative risk, to add a further level of prioritisation to the work-program.
84. The economic evaluation used by SP AusNet takes into account the consequences of failure in terms of the cost of loss of supply and potential costs of loss of life. To undertake the economic assessment SP AusNet uses the AEMO Value of Customer Reliability and a $20 million cost of a lost life. Whilst we have some concerns regarding the broad application of these values without calibration and testing for local conditions, we found that the sensitivity of the proposed expenditure to these values was not material.
85. We observed how, through use of the above methodology SP AusNet are able to determine an economic risk based asset works program that takes into account the likelihood and consequence of asset failure. Using this methodology SP AusNet is able to consider the impact of increasing or decreasing expenditure in terms of probability of failure and economic cost.
86. Each of the programs and projects produced identified from the above process are scoped and costed to produce a time based expenditure forecast.
4.2.2 Findings on asset management framework and risk based expenditure forecasting
87. SP AusNet has a well-documented asset management framework that is benchmarked against international good practice standards. We found that SP AusNet has developed and applied its asset management framework in an appropriate manner when establishing its asset work programmes.
SP AusNet Review - Final Report
Report to AER (Public) 37 August 2013
88. The gathering of asset condition data is systematic and in line with practices that we have observed in other transmission businesses aligned with good industry practice. We noted that, where appropriate, SP AusNet uses sampling techniques to determine asset health, we consider that this is pragmatic and appropriate.
89. The method used for establishing the asset related projects and programs was found to be sound and likely to result in an accurate assessment of the level of work required to maintain the asset portfolio on a bottom-up basis. However, such a forecast should also be subjected to rigorous top down assessment.
90. Whilst we observed the use of a feedback loop to calibrate the calculated failure rate predictions we did not observe a similar feedback loop for calibration of the resulting expenditure forecast. Given that the methodology is well established, we would have expected that a top down calibration against historical forecast vs actual would have been applied.
91. This aspect of SP AusNet’s process for developing its expenditure forecast is discussed in the following sections.
4.3 Capex program and portfolio planning
4.3.1 Aggregate comparisons of expenditure in the current RCP
92. In section 3, we showed SP AusNet’s historical capex program in comparison with what was proposed for the current RCP, and the trend implied by the proposed capex program. We have reviewed the RP and associated appendices supporting the capex program and we sought further information, which SP AusNet provided, in order to better understand the reason for past variances and to help in forming a view on the reasonableness of the proposed program.
93. As is shown in the Figure 12 (reproduced from section 3), SP AusNet spent considerably less capex in the current RCP than it proposed, and less also than the amount the AER allowed for in its Decision on that RP. We have reviewed the sources of these differences and the results are shown in the table below.

SP AusNet Review - Final Report
Report to AER (Public) 39 August 2013
EA15: oil containment at stations;
EA24: replacement of insulators and fittings.
96. Of the 43 proposed programs of work, no work was done in the current RCP on nine programs, nor is any proposed on these programs in the next RCP, while work on one program was commenced but significantly deferred into the next RCP. The proposed expenditure on these ten programs that were subsequently “rolled out” of the program in full or in part were $64.1m. On the other hand fourteen projects totalling $75.9m were not originally proposed, but were subsequently “rolled in” to the capex program. We would have expected more roll-ins towards the end of the RCP, however the amount was relatively evenly spread and started with $16m of additional programs in the first two years of the current RCP12.
97. We sought information from SP AusNet to establish the reasons for the significant variances in the cost of the capex program. Specifically we were interested in the extent to which it resulted from reduced volumes of work conducted under generic work programs, reduced scope of work through engineering prudency, or from cost efficiencies. SP AusNet provided information in response to request EMCa02313. With regards to programs of work, SP AusNet provided information for the 10 programs which exceeded $7.5m. In two of these projects, a greater volume of work was achieved than was proposed, in two others it was the same, in one it was less and for the remaining five no comparison was possible either because no volumes had been articulated in the original proposal or because no figures for actual volume of work were provided.
98. Similarly, SP AusNet provided further information on scope changes that may have affected the cost outcomes for the site-specific projects. For two terminal station projects - Hazelwood (HWPS) and Brooklyn (BLTS) - SP AusNet indicated that the scope had been significantly reduced or work staged/deferred14. For Kyneton (KTS) SP AusNet indicated that the scope had increased, yet expenditure was still less than proposed. Excluding the two projects for which the scope of work carried out within the period was reduced (i.e. HWPS and BLTS), the aggregate expenditure on the portfolio of site-specific projects was 18% less than was proposed. We comment further on this in the next subsection.
99. From the data provided, we observe variances that are mostly negative. The following two figures show the cost variances for single-site projects and for multi-site work programs respectively. 12 See Appendix C for the details of these projects
13Response_SP_EMCa023_-_Project_categorisation, Response_SP_EMCa023_A and Response_SP_EMCa023_B
14 Hazelwood deferral was due to the re-prioritisation of the Hazelwood Power Station redevelopment
SP AusNet has staged components of major stations projects such as Brooklyn and Ringwood Terminal Station redevelopments. This was attributed by SP AusNet to the acquisition of improved information on the condition of these assets at the detailed design stage which led to certain components of these rebuilds being efficiently deferred to the next stage of works at the station.

SP AusNet Review - Final Report
Report to AER (Public) 41 August 2013
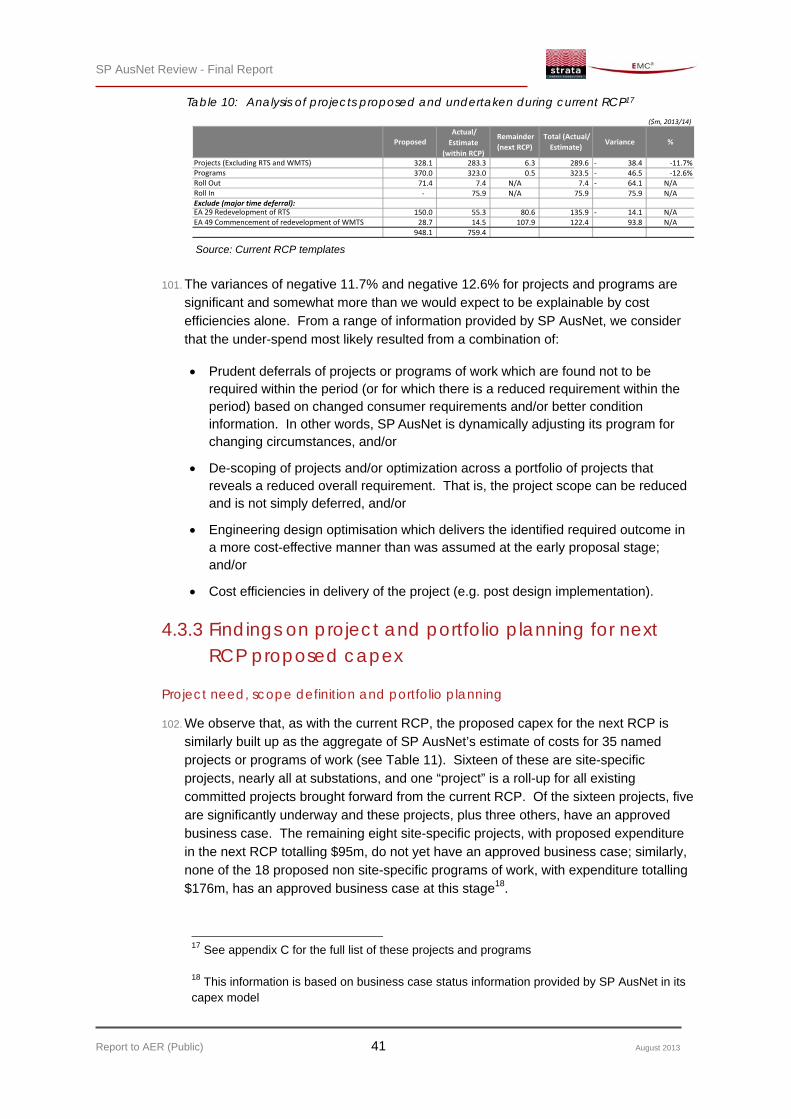
Table 10: Analysis of projects proposed and undertaken during current RCP17
Source: Current RCP templates
101. The variances of negative 11.7% and negative 12.6% for projects and programs are significant and somewhat more than we would expect to be explainable by cost efficiencies alone. From a range of information provided by SP AusNet, we consider that the under-spend most likely resulted from a combination of:
Prudent deferrals of projects or programs of work which are found not to be required within the period (or for which there is a reduced requirement within the period) based on changed consumer requirements and/or better condition information. In other words, SP AusNet is dynamically adjusting its program for changing circumstances, and/or
De-scoping of projects and/or optimization across a portfolio of projects that reveals a reduced overall requirement. That is, the project scope can be reduced and is not simply deferred, and/or
Engineering design optimisation which delivers the identified required outcome in a more cost-effective manner than was assumed at the early proposal stage; and/or
Cost efficiencies in delivery of the project (e.g. post design implementation).
4.3.3 Findings on project and portfolio planning for next RCP proposed capex
Project need, scope definition and portfolio planning
102. We observe that, as with the current RCP, the proposed capex for the next RCP is similarly built up as the aggregate of SP AusNet’s estimate of costs for 35 named projects or programs of work (see Table 11). Sixteen of these are site-specific projects, nearly all at substations, and one “project” is a roll-up for all existing committed projects brought forward from the current RCP. Of the sixteen projects, five are significantly underway and these projects, plus three others, have an approved business case. The remaining eight site-specific projects, with proposed expenditure in the next RCP totalling $95m, do not yet have an approved business case; similarly, none of the 18 proposed non site-specific programs of work, with expenditure totalling $176m, has an approved business case at this stage18.
17 See appendix C for the full list of these projects and programs
18 This information is based on business case status information provided by SP AusNet in its capex model
($m, 2013/14)
328.1 283.3 6.3 289.6 38.4‐ ‐11.7%370.0 323.0 0.5 323.5 46.5‐ ‐12.6%71.4 7.4 N/A 7.4 64.1‐ N/A‐ 75.9 N/A 75.9 75.9 N/A
150.0 55.3 80.6 135.9 14.1‐ N/A28.7 14.5 107.9 122.4 93.8 N/A
948.1 759.4
EA 29 Redevelopment of RTSEA 49 Commencement of redevelopment of WMTS
%
ProgramsProjects (Excluding RTS and WMTS)
Roll Out
Exclude (major time deferral):Roll In
Remainder
(next RCP)
Total (Actual/
Estimate) VarianceProposed
Actual/
Estimate
(within RCP)

SP AusNet Review - Final Report
Report to AER (Public) 42 August 2013
Table 11: Proposed projects and programs of work, by type and status
Source: EMCa analysis from SP AusNet Capex Forecast Model
103. We consider this situation, with a range of projects at different stages, would have also applied at the time SP AusNet proposed its capex requirements for the current RCP and is not unusual considering the timing of the projects and programs. However, in the same way, we consider it likely that SP AusNet will find opportunities to defer, de-scope, optimise and realise efficiencies relative to the expenditure that has been proposed at this stage. In section 5, we also raise concerns with risk and deliverability of the capex program as proposed. For all of these reasons we consider it likely that SP AusNet will not spend, and will not need to spend, the amount currently proposed. Accordingly we propose adjustments as set out below.
4.3.4 Proposed portfolio adjustment for project and portfolio planning and scoping prudency
104. We propose that the AER applies a reduction to the aggregate capex portfolio calculated based on the following sub-set of projects:
A 12.6% reduction to the aggregate budget proposed for “work programs”; that is, those that are not site-specific; and
An 11.7% reduction to the aggregate budget proposed for network projects that are not already substantially underway and for which no business case has yet been approved, except in the limited instances where we propose a project-specific adjustment (see section 5).
105. These portfolio-level adjustments equate to a $31.4m (5.6%) reduction of the capex portfolio.
Project churn
106. In the current RCP $64m of proposed projects were rolled out and $76m of new projects were rolled into the portfolio. We interpret this essentially as “project churn” that in aggregate is not materially biased, and is as we would expect for a portfolio of projects that are proposed with a six-year time horizon. We would expect less project churn in the next RCP, give that it is only three years. Extrapolating from the current RCP, we do not expect a churn bias in aggregate expenditure, therefore we do not see reason for any adjustment for this factor.
($m, 2013/14)
No Description
Business case
approved
Total (in next
RCP)
8 Projects Yes 245.3
8 Projects No 95.2
0.8
18 Programs No 176.5
Committed projects b/f from previous RCP
SP AusNet Review - Final Report
Report to AER (Public) 43 August 2013
4.4 Capex project cost estimation
4.4.1 Information reviewed 107. We have obtained information on the following aspects of the project management and
cost estimation processes that are relevant to the way in which SP AusNet has estimated projected costs for the proposed capex projects:
Procurement processes;
Project delivery models: in-sourced work allocation and outsourced tendering;
Project risk allocation;
Project management governance processes: approval “gates”, financial delegations, change control, etc;
Sources of unit cost information, and the process and governance for updating this information;
Project cost estimation building blocks and quantities estimation, including treatment of allowances for “provisional” sums and contingencies and risk allowances including Monte Carlo risk modelling;
Cost escalation(in regards the base for “unit costs”) and in projecting forward;
Ex-post reviews and feedback loop into continuous improvement of cost estimation.
108. Our primary reference material for SP AusNet’s methodology is Appendix 4C of the Revenue Proposal19. In addition to information provided as part of the Revenue Proposal, we conducted extensive on-site discussions with SP AusNet to clarify our understanding of the end-to-end cost estimation process. Subsequent to these meetings, we requested further documentation of the process and evidence of the application of these processes through sample projects20. We also sought and were provided with analysis that SP AusNet had undertaken of its cost estimation performance.
4.4.2 SP AusNet’s cost estimation process 109. SP AusNet undertakes cost estimation using a building block approach in which
project quantities are estimated by its project managers, and dedicated cost estimators then apply unit costs and allowances to build up project costs for budget and business case approval purposes.
110. Project cost estimation is undertaken in three stages, as follows:
Indicative estimates, used for the Initiation Phase, which includes an initial cost/benefit analysis, optimisation and prioritisation;
19Project Engineering – Project Cost Estimating Methodology TRR 2014/15 – 2016/17. Revision 1 07 February 2013
20 The majority of the information was provided as Response SP EMCa019. A number of documents were provided as part of this response.

SP AusNet Review - Final Report
Report to AER (Public) 44 August 2013
Planning estimates and (depending on risk and materiality) a Risk-adjusted estimate, which are used in the Planning Phase for development and approval of the business case;
Control estimates, used for project cost control purposes.
111. Projects are classified based on materiality and risk (class 1, 2, 3 – with class 1 project deemed to have the highest overall business risk).
112. Indicative estimates are prepared principally to support options analysis and first-pass business case analysis. These estimates are based on standardised building blocks.
113. Planning estimates are based on a more granular building block build-up, with a defined project scope and allowance for site-specific factors, and have a nominal allowance for risk and uncertainty. For “class 1” projects, a risk-adjusted estimate is produced and for this SP AusNet uses a Monte Carlo simulation, in which specific ”inherent risks” and “contingent risks” are identified and quantified. This produces a cost estimate distribution, which in turn can be interpreted to produce “P50” and “P90” estimates. P90 estimates are used for business case approval purposes and, following approval, the difference between the P90 and the P50 estimate is held as a Management Reserve (typically +5% of the P50 estimate) . For the purpose of the RP capex forecast, we have confirmed that the P50 estimates have been used2122.
114. SP AusNet includes Interest During Construction in its project costs estimates. However in calculating proposed revenue, IDC should not be included since it is inherent in the WACC that is applied to “as incurred” capex. We have confirmed that the capex proposed in the RP does not include IDC.23
4.4.3 Observations on cost estimation process 115. For the most part, we consider that the cost estimation process follows a logical path
and represents good industry practice. We observe increasing focus on risk and uncertainty for larger projects as they advance through the gate process, and a well-designed process for modelling project risk for larger projects. However, we have three concerns about the suitability of the cost estimation process:
21 In responding to information request EMCa019, SP AusNet advised that for some projects, P90 estimates had inadvertently been used for some projects proposed in the RP. SP AusNet corrected these to P50 estimates and provided a revised version of the capex model. We have used these revised costs as the basis for our review. The total capex for next RCP was modified from $575m to $564.2m (source: EMCA019_Q4A_-TRR_SP_AusNet_Capex_Forecast_Model)
22 Where an asymmetrical cost distribution arises, there is a difference between the portfolio aggregate of the P50 “most likely” estimates for each project and the mean-derived “expected value” of the portfolio. SP AusNet has not proposed a specific adjustment for asymmetric risk and, to the extent that it is inherent in the estimates provided, we consider that the adjustment that we propose later in this section nets out this factor.
23SP EMCa022_-_Historical_Capex_data_check_18042013
SP AusNet Review - Final Report
Report to AER (Public) 45 August 2013
The process for updating unit cost rates, including the lack of certain adjustments that we would have expected (e.g. for unit cost escalation) and a relatively light governance process;
A risk of errors and inconsistencies driven by the predominantly spread sheet based process, rather than using an industry-proven cost estimating tool such as Success Estimator24. Such tools support good project governance, helping to address the concerns in the first point above; and
The competitiveness of the labour component of SP AusNet’s estimates25.
Governance and unit cost rates
116. SP AusNet advised us that unit cost rates used for estimating purposes are generally based on “most recent” tenders, and that for the majority of required items, SP AusNet has pre-tendered purchase options which provide the source data. Since those tendered prices were provided at different times in the past, we asked how they are brought into “current cost” terms. SP AusNet advised that they were not escalated. For example, it would appear that unit costs that were prepared and are stated as being in $2011/12 have been used without adjustment as a basis for costing which is presented in $2013/14 terms. We consider this to be a weakness in the cost estimation methodology although, without historical escalation data and an audit of all unit costs information sources, it is not possible to say whether this has or might lead to an over- or under-estimate.
117. We have some concerns in regards to governance of the process for updating cost estimates, which appears to have less independent review and formal governance than we would expect. For example, it is good practice to:
Have a rigorous process for unit and building block costs and updates, including limiting the personnel authorised to change unit rates, change control, and regular audits of the updates (rationale and frequency);
Undertake independent value assurance for large projects (say, greater than $30m) at least once in the project development phase.
Cost estimation tools
118. Further, cost estimation is not carried out within a company-wide cost estimation tool and is essentially spreadsheet-based. While the spreadsheets as presented to us appeared to operate as we would expect, and in accordance with the methodology described by SP AusNet in accompanying documentation, we consider that there is risk of inconsistent unit cost rates being applied to different projects, of calculation errors for some projects and of factors or adjustments being applied but which may not be recognised or understood by those responsible for the forward budgets. The error referred to above, where some project cost estimates were initially P90 estimates in the RP, is an example.
24 Success Estimator is a widely used software tool in the construction industry
25 SP AusNet’s estimates assume a 60% labour component

SP AusNet Review - Final Report
Report to AER (Public) 47 August 2013
dominated by data for the TTS rebuild, which had a cost over-run of 36%. Removing this outlier, the remaining 16 projects, with an aggregate cost of $140m, had a cost under-run of 9% in aggregate.
123. The “projects” listed in the analysis that SP AusNet provided are in many cases “sub-projects” of rolled up projects that have been presented in the RP, and so we consider that they are a better indication of cost estimation variance, and are less affected by volume variances. Nevertheless there are some significant variances for individual projects which can really only be attributed to cost estimation or to scope variations, and in the main the estimates proved to be too high.
4.4.5 Findings on capex cost estimation 124. Overall we are relatively satisfied with the accuracy of cost estimation, where the
scope is known and not subject to change as condition information becomes apparent. Although we noted some concerns with the cost estimation process, for the purpose of assessing the proposed capex we have judged cost estimation by its outcomes which we consider to be within an acceptable range, albeit biased slightly upwards. We propose applying a 1.4% cost estimation reduction to all capex, based on the estimation bias revealed from the analysis that SP AusNet provided. This cost estimation adjustment is inherent in the portfolio adjustment described in the previous section and is not additive. Therefore we ascribe 1.4% of the adjustments proposed in the previous subsection to cost estimation bias, and the remainder to portfolio-level optimisation, scope reductions and prudent deferral opportunities that will be found over the course of the next RCP.
4.5 Opex program and expenditure planning 125. The proposed opex program expenditure has been determined as follows:
For recurrent expenditure items, SP AusNet has proposed a trend from a base year (2011/12) by applying escalation factors to these “benchmark” actual costs;
SP AusNet has identified 12 step changes that it considers represents reasons for departures from the escalated benchmark costs;
An Asset Works program is proposed, based on a bottom-up build;
An allowance is made for proposed IT opex savings; and
An allowance is made for the additional opex requirements resulting from “group 3 roll-in” assets.
126. We understand that cost estimates for Asset Works are developed using a similar project costing methodology as described for capex projects. However in our assessment of the opex asset works program, we have formed the view that the dominant issue is the scope and scale of programs achieved and we have focused on this, although there are also indications from the current RCP that unit costs used for opex cost estimation may also be biased towards over-estimation.
127. In section 7 we analyse the proposed step changes and asset works program and we present there our findings on their reasonableness and on adjustments to SP AusNet’s proposal. Review of SP AusNet’s base year expenditure, proposed escalation factors,

SP AusNet Review - Final Report
Report to AER (Public) 48 August 2013
non-controllable costs, management fees and other accounting matters relating to related parties, are not within the scope of our review.
4.6 Overall findings on asset management and expenditure planning
4.6.1 Asset management 128. We have found that, while SP AusNet’s asset management framework can provide a
sound basis for the management of the assets, the application of the framework when developing expenditure forecasts could be improved. We take this view because the forecast expenditures rely on a bottom-up aggregation with insufficient attention to the aggregate portfolio forecast that results, and its realism.
129. The PAS 55 accredited asset management framework adopted by SP AusNet provides a well-documented and sound theoretical basis for managing the network assets. As discussed in section 4.2.1 the projects and programs are developed on the basis of asset age, condition and performance data. SP AusNet applies an economic risk assessment to derive a first cut (bottom up) expenditure forecast.
130. Whilst we have seen evidence that SP AusNet apply top down assessments and adjustments to the bottom up derived expenditure estimates, we have remaining concerns that this has been insufficient. Our concerns are significantly influenced by our review of expenditure outcomes in the current RCP, which in many areas fall well short of what SP AusNet projected in 2007/08. For replacement capex, for example, our findings suggest that it is likely that some of the proposed works will not be undertaken and will be either deferred, re-scoped or found to be unnecessary. These concerns are covered further in other sections of this report.
131. We also have concerns that the top-down adjustments made by SP AusNet in the current RCP were made for inappropriate reasons. Namely, SP AusNet has stated that expenditure was reduced because of corporate financial constraints caused by the GFC. In our view, if the work was required for consumer needs and had a sound engineering/economic justification, then it should have been done. If it was not done because of financial constraints imposed at the corporate level, the implication is that the business acted contrary to sound engineering/economic practice or did not meet customers’ needs.
132. We suggest that SP AusNet could improve the validity of outcomes from its otherwise sound asset management framework, by addressing these issues, and thereby developing expenditure forecasts that better reflect what is likely to be spent. This could be assisted by obtaining a more strategic-level review of expenditure proposals, to strengthen the governance process.
SP AusNet Review - Final Report
Report to AER (Public) 49 August 2013
4.6.2 Findings in regards budgeting for the proposed capex portfolio
Findings
133. With some specific exceptions and which we cover in section 5, we consider that the asset management framework has been reasonably applied in first determining the need for the list of proposed projects and programs, also in estimating the timing of these projects and in producing a scope and cost estimate for these projects on bases that reflect their status as at the time the RP was being prepared.
134. At a portfolio level, we consider that there will be considerable opportunities to rationalise this program, to de-scope certain projects through prudent engineering, to prudently defer projects as more information is gathered and to refine cost estimates. We consider that the evidence from the current RCP outcomes leads to the conclusion that SP AusNet will find that it needs to spend less at a portfolio level than it has currently proposed.
Proposed adjustments
135. Based on the analysis presented in this section, we proposed applying the following adjustments:
A cost estimation adjustment of -1.4% applied to all network capex other than projects that are substantially underway; and, in addition to this:
A prudency adjustment of -10.3% (-11.7% + 1.4%) applied to all site-specific projects” that are not otherwise adjusted for specific project factors;
A prudency adjustment of -11.2% (-12.6% + 1.4%) applied to all non site-specific programs of work.
4.6.3 Findings in regards budgeting for the proposed opex portfolio
Findings
136. Specific findings on the proposed step changes and asset works programs are provided in section 7.
137. At a general level, we consider that the methodology used for planning and costing the opex program is reasonable as a bottom-up process, but that the RP budget presented by SP AusNet lacks a top-down portfolio-level assessment of the reasonableness of delivery and of the overall costs of the whole program as built up. We have undertaken such assessment in section 7.
138. SP AusNet has not made an allowance for improvements in opex efficiency that we would expect to occur. SP AusNet has stated that its strategic IT investments were justified based on opex savings and we have estimated that it would require savings of the order of $2.4m p.a. to justify these investments to date. SP AusNet had proposed such an adjustment in its revenue proposal, but only for the benefits from IT capex yet to be incurred. We consider it logical to account for the benefits of IT investment

SP AusNet Review - Final Report
Report to AER (Public) 50 August 2013
already made and we are satisfied that these benefits are not inherent in base year opex. This adjustment is equivalent to an IT-enabled opex efficiency adjustment of approximately 2.5% of controllable opex, and is required to produce a prudent and efficient expenditure forecast as required under the NER.

SP AusNet Review - Final Report
Report to AER (Public) 51 August 2013
5 Replacement capex– Stations 5.1 Overview
139. CBD substation and major substation rebuilds are the major drivers of the proposed replacement capex. We have given specific attention to these in both our desktop and on-site reviews.
140. As discussed in section 4 of this report, aggregate capex expenditure in the current RCP is approximately $118m (13%) less than the AER’s Final Decision and $224m (22%) less than SP AusNet proposed. SP AusNet gave following reasons for this underspend:
Deferral of Richmond substation replacement;
Staging of major stations due to improved condition assessment;
Reprioritisation of Hazelwood power station development.
141. Our analysis of the forecast and current expenditure for the current RCP revealed that a number of deferred projects have been ‘rolled into’ the 2013/17 RCP from the current RCP, however an allowance has not been made to take into account the project expenditure that can be expected to ‘rolled out’ of 2013/17 into the next RCP.
142. Given the above point and the ambitious replacement capex program, that includes several coincident CBD and major substation replacements, and the economic justifications for many of the programs for which timing is highly dependent on certain assumptions, we have sought objective justification from SP AusNet to assess whether there is room for prudent deferral of a proportion of this planned expenditure into the next RCP.
143. The proposed replacement capex shows large increase from the current period. As can be seen from the following Figure 16, this is attributed mainly to the CBD Station rebuilds. However, we are of the view that the CBD Stations are a sub-set of the Major Stations and we would expect to see a reasonably steady trend of expenditure with these two categories combined.

SP AusNet Review - Final Report
Report to AER (Public) 53 August 2013
149. The Board approved $137m for this rebuild in March 2010. The subsequent redesign using GIS equipment pushed the price up to $180m and the board approved this amount in 2012. However the current proposed cost is $125.3m and we have not seen a reconciliation between the two figures.
150. Most of the equipment is at the end of its useful life and four of the six major transformers have condition scores of C4 or C526 for core, windings or bushings. The B3 transformer is only 13 years old, in good condition and will be used on another site.
151. Given the age and condition of the assets we support the rebuild of this Terminal Substation, which supplies the eastern half of the Melbourne CBD plus adjacent suburbs. The rebuild includes the replacement of the 220, 66 and 22kV switchyards.
152. We have visited the site and found it to be extremely confined on all sides and we agree that the use of GIS equipment is the appropriate approach for all the Richmond switchyards. The tightness of available space and the legacy structure of the substation (e.g. location of 220kV in the centre with 22kV and 66kV switchyards either side) would present extreme difficulties and risks if AIS replacement was attempted.
153. The use of GIS will also significantly improve the visual impact of the Terminal Station from the surrounding urban area.
154. Given the site restrictions and technical challenges the logistics of the rebuild will be challenging and great care will be required to maintain system security and personnel safety throughout the job.
155. We support the inclusion of this project.
5.2.2 West Melbourne Terminal Station 156. WMTS is one of three terminal stations in Melbourne supplying the CBD plus
surrounding residential, commercial and industrial areas. Much of the existing equipment was installed in 1964 and is now considered by SP AusNet to be at high risk of failure. It is proposed to redevelop the site due to reliability considerations and load criticality.
157. The proposed rebuild will replace ageing assets with modern and more compact equivalents and the station will also be redesigned to accommodate future capacity expansions to meet future demand.
158. The project was submitted to the SP AusNet Board on 15 May 2012 for approval of the rebuild of WMTS and preliminary work has commenced. Completion is due in 2017/18.
159. The board paper dated March 2012 sought approval of $160.9m for Project Direct Expenditure and $192.8m for Project Total Expenditure. The latter figure includes contingencies, overheads, finance charges and existing asset write downs. The Board paper considered various options but did not consider the option of using 220kV AIS circuit breakers. The capex model indicates a total project cost of $125.5m, and
26SP AusNet measures asset condition with reference to an asset health index, on a scale of 1 to 5. C4 =Deteriorating and C5 = Advanced deterioration
SP AusNet Review - Final Report
Report to AER (Public) 54 August 2013
proposes expenditure of $107.9m within the next RCP. The spread of this expenditure was shown in table 12, at the beginning of section 5.2.
160. We have studied all the information supplied and have focused on the following aspects of this project27:
The justification to redevelop the Terminal Station owing to asset condition;
The timing of the redevelopment;
The justification to redevelop using GIS equipment for all voltages rather than AIS equipment;
The justification to provide for future expansion capacity;
The recommended capex allowance in the coming period for this project.
Redevelopment needed owing to asset condition
161. Three of the four 220kV transformers are some of the highest risk transformers in the network. The fourth transformer is in good condition with an estimated 30 years remaining life. Recent condition assessments indicated that most switchgear needs replacement. Most of the circuit breakers, instrument transformers and other equipment in the station is unreliable and/or poses a significant risk to safety of personnel and adjacent equipment.
162. We support redevelopment of the station to replace the ageing equipment.
The timing of the redevelopment
163. This is a complex project involving the replacement of nearly all of the major equipment in the three switchyards, whilst maintaining secure supplies to a major part of the Melbourne CBD. There is a fair risk of interruptions and the project will require very careful coordination and planning to avoid endangering both human lives and supply security. We note that the redevelopment of the Richmond Terminal Station is being carried out at the same time as WMTS and both of these stations supply parts of the CBD. We are concerned that the simultaneous redevelopment of WMTS will put additional pressure on the organisation and resources and increase the risk of outages and accidents.
164. The following table and graph shows the build-up of expenditure for the RTS and WMTS projects as proposed. This shows a rapid build- up to a peak of $66.6m ($2013/14) in 2014/15.
27 SP AusNet provided additional information to the AER on 18th June and 8th July 2013, after this Report was prepared for the AER and findings presented to SP AusNet. The AER asked EMCa to consider this information and to provide a Supplementary Briefing Paper, which is included in the current report as Annex D


SP AusNet Review - Final Report
Report to AER (Public) 56 August 2013
Use of GIS equipment for all voltages
166. SP AusNet proposes to replace all equipment with GIS equipment. The main stated reasons for this are to reduce the visual impact of the Terminal Station and to facilitate the logistics of replacing the existing equipment. Additional reasons are to free up space for future developments and to allow the installation of breaker and a half arrangement for additional flexibility and reliability. We will address each of these in turn.
The Visual Impact Argument
167. The City of Melbourne is proposing to redevelop the Arden Macauley District as a high density residential and commercial area and SP AusNet is concerned that this will bring pressure to improve the visual aspect of the Terminal Station. The triangular WMTS site is at the very south Western limit of the urban development District and is bounded on one side by a road and a railway line, on the second side by the river and another railway line, with the motorway running overhead, and on the third side by roads. It appears that the only reason WMTS is included in the area plan is because of a small area of river reserve which runs between the river and the WMTS. It should also be noted that the elevation of the switchyards is such that they sit well above the level of the surrounding roads and river. The Arden Macauley Structure Plan clearly identifies the WMTS as an electrical switchyard. It does however indicate a possible co-gen power station to be included on the edge of the existing site.
168. We are concerned that SP AusNet may have prejudiced its option for an AIS rebuild, by promoting the solution of a fully GIS Terminal Station in their discussions with authorities and by issuing a public brochure showing images and a description of the future station. This will make it difficult for it to obtain consents for the station with AIS equipment.
169. Our view of the proposed development is that significant additional expenditure for GIS is not justified on the grounds of visual improvement. The location of the site is such that it is not readily seen by many neighbours, being largely surrounded by other transport service routes. Much could be done to provide additional screening by vegetation and panelling. The site is too small to allow the addition of any reasonable sized co-gen plant so this should not be a consideration.
Small Site
170. Regarding the logistics of the redevelopment on a small site, our view is that the site is of sufficient size to allow redevelopment using AIS equipment with careful planning. We have not seen any evidence that this has been adequately considered, despite asking for a detailed options breakdown.
171. The material provided did provide cost estimates for a full AIS site, but no information on the proposed layouts, the logistics of carrying out the project nor the likely breaker arrangements were provided.
172. There is no doubt that the limitations of the site area would make redevelopment with AIS equipment a more complex job with more stages and more outages to be planned. SP AusNet has allowed an additional $4.8m for this brownfields risk which we consider to be reasonable.

SP AusNet Review - Final Report
Report to AER (Public) 58 August 2013
Cost Comparison of GIS versus AIS equipment
180. As discussed in sections 5.2.1 movements in project cost estimated have occurred as approvals were sought for GIS seen on the Richmond Terminal Station replacement project. This raised concerns regarding the accuracy of similar estimates for West Melbourne Terminal Station. The accuracy of these cost estimates are important if any credibility is to be given to the options analysis for the AIS/GIS comparisons.
181.
Figure 19: GIS Cost minus AIS Cost ($m)
182.
183.
[C-I-C]
[C-I-C]
[C-I-C]
[C-I-C]

SP AusNet Review - Final Report
Report to AER (Public) 59 August 2013
Figure 20: GIS Cost minus AIS Cost (as % of GIS Cost)
184.
185.
Table 14: GIS vs AIS comparative cost
186. The proxy AIS cost in the table above shows that there is a significant mark up in West Melbourne costs above what would have been expected from the GIS/AIS
[C-I-C]
[C-I-C]
[C-I-C]
[C-I-C]
SP AusNet Review - Final Report
Report to AER (Public) 60 August 2013
comparative costs . The majority of these additional costs are in the ‘design’ and ‘brownfields’ factors.
187. This analysis leaves us in considerable doubt as to the accuracy of the WMTS budget figures provided and we suspect that there is a large degree of contingency built in to the AIS option costs. This makes the GIS option look more favourable. We consider that a reasonable estimate for the AIS costs would fall between the proxy AIS and SP AusNet AIS cost at $94.95m (i.e. mid point between $131.6m & $58.3m). This would imply a reduction of $53.4m on the proposed total cost, or a reduction of $38.8m in the cost within the next RCP, in the absence of deferral. With the deferral that we have proposed, the net effect of this adjustment is a reduction of $29.2m within the next RCP.
188. Given our concerns regarding project timing, the periodic downwards adjustments in cost estimates seen for the Richmond Terminal Station project and the concerns we have regarding the accuracy of the West Melbourne cost estimates, we consider that the following adjustments should be made to the forecast expenditure on West Melbourne Terminal Station:
Deferral of the project by one year; and
Provide for reconstruction, but at a lower cost than the costs presented to date.
Conclusions on WMTS
189. The various arguments for and against the proposed expenditure on this project need to be weighed carefully:
We support the redevelopment of the WMTS due to age and condition of most of the equipment;
We do not support the visual amenity argument as a good case for a GIS solution;
We recommend the redevelopment project be deferred by at least one year to provide a more gradual build-up of activity of the WMTS project following the RTS project. This will reduce the risk;
We believe there is a good case to take a long term view in redeveloping this site so as to provide adequate space for additional feeders and transformers in the future. The 20-30 year horizon provided by AEMO would be approximately half life for most of the equipment and hence it would be a bad time to have to replace a large amount of the equipment to create the space required. However we recommend that the AER consider whether this should be subject to the rigour of a RIT-T approval;
We have considerable doubts about the accuracy of the cost estimates;
[C-I-C]

SP AusNet Review - Final Report
Report to AER (Public) 61 August 2013
Following our 30thMay 2013 meeting SP AusNet provided further information28 referring to a scoping investigation undertaken by BECA in 2011. SP AusNet state that the BECA investigation included:
A detailed analysis of the costs, benefits and supply risks of the AIS option was carried out at the planning stage, prior to submitting the business case for SP AusNet management and Board approval. This analysis involved establishing the step by step construction sequence (fifteen steps in total) and identifying the risk at each step29
SP AusNet say the investigation revealed:
Extraordinary cost and supply risks (compared with a normal brown field type redevelopment) for the different project development stages. The extraordinary cost and supply risks can be ascribed to the unconventional 220 kV switching configuration, restricted site space, special operation of the 220/66 kV transformers and high demand levels
190.
191. The additional information provided by SP AusNet has not been sufficient to convince our review team that the project costs, AIS comparative costs, and barriers to AIS rebuild has been sufficiently justified.
192.
Table 15: Proposed and adjusted WMTS capex allowance
Source: EMCa analysis based on SP AusNet Capex Model
28 Following this meeting and the submission of EMCa’s draft report to the AER, SP AusNet provided additional information on 18 June and 8 July 2013 on aspects of the WMTS project. The additional information provided has been incorporated into this report only where it revealed a material error or misunderstanding. Annex D sets out our consideration of the additional WMTS information.
29 SP AusNet initial response to EMCa/Strata findings
($m, 2013/14)
2012/13 2013/14 2014/15 2015/16 2016/17 Next RCP
As proposed 1.6 11.1 34.1 36.0 37.8 107.9
Adjustment (Deferral) 23.0‐ 1.9‐ 1.8‐ 26.7‐
Adjustment (Costing) 4.0‐ 12.3‐ 12.9‐ 29.2‐
Total 1.6 11.1 7.1 21.8 23.0 52.0
[C-I-C]
[C-I-C]

SP AusNet Review - Final Report
Report to AER (Public) 62 August 2013
5.3 Review of Major substations 193. A budget of $140.1m has been proposed in the RP for 16 Major Station replacement
projects. Of these we reviewed the five largest projects totalling $101.5m (72%)30. The projects reviewed were:
Table 16: Proposed capex for major stations capex (as reviewed)
Source: SP AusNet Capex Model (Revenue Proposal)
5.3.1 Fisherman’s Bend Terminal Station 194. This project includes the replacement of 1 x 150MVA 220/66kV transformer, 12 x 66kV
CTs, 12 x bulk oil circuit breakers and sundry secondary system equipment.
195. The transformers on site have been assessed as part of SP AusNet’s Condition Monitoring Programme. This has concluded that they are generally condition 3 which indicates that the proposed replacement of the first of these could be deferred until at least the following period without undue risk. Condition 4 indicates that replacement will be necessary in the not too distant future and Condition 5 indicates replacement is required as soon as reasonably possible.
196. We support the CTs and circuit breakers being replaced in the coming period but consider that the replacement of the transformer can be deferred. The capex allowed for this project should therefore be reduced by 25%.
5.3.2 Heatherton Terminal Station 197. This project includes the replacement of 3 x 150MVA 220/66kV transformers, 2 x
220kV AIS circuit breakers, 11 x 66kV AIS circuit breakers and some reconfiguration of the 220kV switchyard to alleviate operational and supply security constraints.
198. The transformer bushings and windings are in poor condition and warrant replacement in the coming period. Replacement of the CTs and circuit breakers is supported.
199. The economic modelling indicates that deferring the work in the 66kV switchyard ($12m) by 5 years is 20% more expensive.
200. This project is supported in full.
5.3.3 Hazelwood Power Station 201. The proposed expenditure in the RCP is for Stage 4 of a multi stage project of which
the first two stages are complete and stage 3 is currently underway.
30 SP AusNet modified the capex amounts subsequent to the RP
2014/15 2015/16 2016/17 Total
Fishermans Bend TS 0.5 6.2 10.4 17.0
Heatherton TS 5.7 12.4 15.3 33.5
Hazelwood PS Stage 4 ‐ 0.3 3.9 4.2
Yallourn PS 5.3 8.9 5.7 19.8
South Morang TS 7.1 12.1 7.7 26.9
Total 18.6 39.9 43.0 101.5
SP AusNet Review - Final Report
Report to AER (Public) 63 August 2013
202. This project includes the replacement of seven 220kV bulk oil circuit breakers. Four of these are for lines and three for generator connections. These breakers are considered to have a significant risk of explosive failure and thus carry a high risk cost from system security, human injury and collateral damage.
203. The three generator CBs are for G3 transformer to #1 bus, G4 to #1 bus, and G6 to #4 bus. Each of these generators currently has two CBs allowing selection to alternate busses.
204. Hazelwood Power Station was built 1965-71. Forty plus years is at the outer bounds of life for a coal fired power station. This is driven by plant condition, maintenance costs, fuel use efficiency and environmental pollution. For Hazelwood the environmental issues are a big threat to future viability and the increasing maintenance costs must be significant.
205. Considering this the provision of new CBs carries a significant risk of these assets being superfluous within a short time span.
206. Five of the generators can currently connect to one bus only, these being G1 & G2 to #1 bus, G5 to #2 bus, G7 & G8 to #3 bus. Each of these has a breaker in good condition.
207. The remaining 3 generators are currently arranged so that they can be switched to two busses. Each of these already has one breaker in good condition. G3 & G4 have new breakers on the #2 bus. In normal operation these two generators are usually selected to this bus so the older breakers on the #2 bus could be disconnected and scrapped. This would remove some flexibility but this constraint could be justified by the limited future of the generators. G6 has a good breaker on the #3 bus and the other breaker on the #4 bus could be scrapped. In this case this generator is normally connected to the #4 bus so it may be necessary to move the good breaker to the #4 bus.
208. We consider that the replacement of the four CBs connecting to lines should be approved and the three CBs for Hazelwood generator connections should be declined. This would reduce the project cost by 43% from $15.2m to $8.7m.
209. In the Revenue Proposal the Total Project Cost was $15.2m and the Period Cost was $4.2m. These were amended subsequently to $19.6m and $0.9m. Regardless of the minor period cost we recommend that the adjustment be noted as the overall cost is $19.6m. The approval for the reduced number of breakers would be on record and should not slip through in the following period.
210. We recommend allowing a Period Cost of $0.6m ($13/14) and a Total Project Cost of $11.2m (i.e. a reduction of 43% of $19.6m).
5.3.4 Yallourn Power Station 211. This is a key node in the system that connects the four Yallourn generators and
interconnects with two lines from the Hazelwood Power Station and four lines to Rowville Terminal Station. The project includes the replacement of 7 x generator circuit breakers and associated oil insulated CTs, refurbishment of 12 x circuit breakers, and replacement of the line protection relays.

SP AusNet Review - Final Report
Report to AER (Public) 64 August 2013
212. Although Yallourn is 40 years old it still generates approximately 20% of Victoria’s energy and Energy Australia says there are no plans to close it31.
213. SP AusNet have carried out an economic analysis considering various reasonable alternatives and selected an option involving some replacement and some refurbishment. The refurbished breakers will need to be replaced at some future date.
214. The proposed option is considered appropriate and is supported.
5.3.5 South Morang Terminal Station 215. This project is in two stages with the first stage scheduled for completion in 2016 and
stage 2 in 2020. The switchyard includes two 700MVA transformers (330/220kV). These transformers are critical for system security and are 45 years old. Their condition is poor but not critical, but there are no spares held of this type and rating.
216. The first stage includes the purchase of 3 x 700MVA single-phase transformers. Also included is the installation of a new double switched 330kV bay for connection of the new transformer to the No. 1 and No. 2 busses, 2 x live tank circuit breakers, 2 x CTs, 1 x VT, extensions to both busses and a new 330kV line connection. The replaced H transformer will be retained on site as a cold spare.
217. The second stage, in a later period, will include replacement of the second H transformer bank.
218. Also included in the second stage is the purchase of a spare single-phase transformer. This is considered justified because the new H transformer bank (3 x single phase transformers) is the only one of this type on the system. A failure of any one phase would take the whole bank out of service. It would not be feasible to replace it with one of the old single-phase units as it would not be a matched unit.
219. After careful review we support this project on account of its critical role in the system and the prolonged impact of a failure of any of the current 700MVA transformers.
31 Source of this information - XC18 Yallourn Switchyard Planning Report (final paragraph Page 9) and in discussions onsite with SP AusNet
SP AusNet Review - Final Report
Report to AER (Public) 65 August 2013
6 Asset Replacement, Safety and Compliance and Non-System Capex
6.1 Introduction 220. This section covers our review of the remaining aspects of the capex program, which
comprises proposed expenditure for asset replacements (other than substation replacements covered in the previous section) for safety and compliance and for non-system capex. Of non-system capex, the dominant item is IT and we have focused
6.2 Overview 221. SP AusNet is proposing to undertake $121 million of expenditure on asset
replacement programs (other than the major station programs described in the previous section) over the forthcoming regulatory control period.
222. SP AusNet considers that this expenditure is necessary to “maintain the resilience and reliability of the network and address operational or asset failure risk”. The proposed expenditure also allows for some modernisation of protection, control and communication assets so that they meet the required operating standards. There are a small number of circuit limit improvement projects (e.g. protection relay and isolator replacements) that fall under the Network Capability Incentive Parameter Action Plan (NCIPAP). These projects are additional to the proposed asset replacement expenditure. The components of the proposed asset replacement expenditure for the 2014 -17 RCP are shown in the following chart.


SP AusNet Review - Final Report
Report to AER (Public) 68 August 2013
6.4 Assessment of the safety, security and compliance expenditure proposal
230. The largest component of this expenditure category is for tower fall arrestors. This expenditure is required for SP AusNet to comply with statutory health and safety regulations. The proposed $12.5 million will allow the completion of the program which was commenced in 2008.
231. We consider that the proposed work is appropriate and the expenditure should be allowed subject to adjustments to take into account cost estimation and prudency.
232. Expenditure on instrument transformer replacements is based on condition assessment including information from dissolved gas analysis through which SP AusNet are able to identify at risk components. The proposed expenditure is to complete a replacement program that was commenced during the current RCP.
233. The proposed expenditure for cap and pin insulator and oil circuit breaker replacements are a continuation of existing programs and are required to address identified risks.
234. SP AusNet proposes to replace some components of its existing fire protection systems due to age, corrosion, obsolescence and non-compliance with the current Australian Standards. The expenditure is prioritised on asset condition and risk information and assessment.
235. SP AusNet has developed a long term plan to ensure it will become compliant with the Terrorism Community Protection Act (2003). The proposed expenditure on infrastructure security systems upgrade is required under the planed upgrade to the existing security arrangements at key sites.
236. Included in this expenditure category is $3.5 million for Communications safety and security. SP AusNet proposes to use this expenditure to purchase tools to improve communications security and to install fall prevention systems on communications towers.
237. SP AusNet must manage increasing risk and potential vulnerabilities associated with physical and cyber security of critical national infrastructure. The communications networks are critical to the safe and reliable operation of the transmission network. Security takes the form of electronic security and physical security with many communications sites located in remote locations (such as mountain tops).
238. We have reviewed the items included in this expenditure category and consider that the proposed work to be undertaken is appropriate and the expenditure should be allowed subject to adjustments to take into account cost estimation and prudency.
6.5 Assessment of non-system capex (excluding IT) 239. SP AusNet proposes to spend $700k on refurbishment and maintenance of existing
buildings, including portable offices and office equipment. The proposed expenditure is consistent with historical expenditure in this category and appears to be reasonable.
SP AusNet Review - Final Report
Report to AER (Public) 69 August 2013
240. We consider that the proposed expenditure to maintain the existing vehicle fleet at the current level of capability is appropriate given that the transmission network is not undergoing significant development during the RCP. Similarly, forecasting ‘other’ non-system expenditure at historic levels is considered to be appropriate.
6.6 Assessment of IT capex
6.6.1 Introduction 241. SP AusNet’s proposed IT capex represents approximately 8% of total proposed capex.
The estimated/proposed IT capex (i.e. for the last 2 years of the current RCP, plus as proposed for the next RCP) is 63% higher on a per annum basis than the most recent actual IT capex (i.e. in the first 4 years of the current RCP). While some of the expenditure appears to be for the transmission business alone, the majority is part of a much larger IT initiative at the group level, and as such is subject to other regulatory determinations that the AER has made or will make. For the reasons stated in section 3.2 above, EMCa understands that it is not within the scope of our technical advice to advise on the group-level IT strategy or to investigate linkages between the IT capex proposed for transmission determination purposes and the wider group-level IT program that is subject to different regulatory determinations.
242. EMCa has considered transmission related components of the proposed IT capex from a governance viewpoint, by reviewing the business needs and strategic considerations identified and presented in the business case. Our review was not required to include an assessment of IT delivery options, including IT platform requirements or the scope and cost of proposed applications software/middleware and their licensing and integration requirements.
6.6.2 Overview of proposed IT expenditure 243. Across the nine financial years 2009/17 SP AusNet’s actual and forecast IT
expenditure for its three regulated businesses is $495m. Electricity transmission IT expenditure for the same period is $108m. The allocation of SP AusNet’s annual IT expenditure across its electricity distribution, gas distribution and electricity transmission businesses is shown in the Figure 24. It can be seen that the business has and continues to make considerable investment in its IT infrastructure through to 2013/14 with a subsequent fall in years 2015/16 and 2016/17.
244. During financial years in the current RCP major components of the IT investment have been in ‘Network Management Automation (stage 1)’ and ‘Enterprise Application Integration EAI Replacement’. A major contributor to the increased expenditure in electricity distribution was ‘MDMS Upgrade’ which is not related to transmission.
245. In the 2014/17 financial years the IT whole of business focus will shift to ‘Asset& Works Management (EAM / ERP Upgrade)’ which accounts for $71m (32%) of IT expenditure across the three regulated businesses.


SP AusNet Review - Final Report
Report to AER (Public) 72 August 2013
Table 18: Benchmarks
Source: SP AusNet RP, Western Power RRP, Transgrid RRP, Powerlink RRP, ElectraNet RRP
250. The above benchmarks should be treated with caution as there are a number of differences between the businesses that need to be taken into account. For example, when looking at ‘IT capex/total capex’ it needs to be noted that for SP AusNet this excluded augmentation capex whereas for others this is included.
251. Not withstanding the above the comparison shows that SP AusNet is one of the larger investors in IT.
6.6.3 Allocation of IT expenditure to transmission 252.
IT capex/ Revenue
SP AusNet (2015 ‐ 2017) 3.2%
Western Power (2013 ‐ 2017) 1.4%
Transgrid (2010 ‐ 2014) 2.6%
Powerlink (2013 ‐ 2017) 1.7%
ElectraNet (2009 ‐ 2013) 2.5%
IT capex/ Total capex
SP AusNet (2015 ‐ 2017) 8.5%
Western Power (2013 ‐ 2017) 2.5%
Transgrid (2010 ‐ 2014) 3.9%
Powerlink (2013 ‐ 2017) 2.4%
ElectraNet (2009 ‐ 2013) 4.6%
IT opex/ Total opex
SP AusNet (2015 ‐ 2017) 7.4%
Western Power
Transgrid (2010 ‐ 2014) 8.0%
Powerlink (2013 ‐ 2017) 5.5%
ElectraNet (2009 ‐ 2013) 3.2%
[C-I-C]
SP AusNet Review - Final Report
Report to AER (Public) 73 August 2013
Figure 27: SP Group IT expenditure, by regulated business (%)
Source: Response EMCa005
253.
4
254.
255.
256. 35:
34
35
[C-I-C]
[C-I-C]
[C-I-C]
[C-I-C]
[C-I-C]
[C-I-C]
[C-I-C]

SP AusNet Review - Final Report
Report to AER (Public) 74 August 2013
257.
6.6.4 Assessment of the IT expenditure proposal 258. We have reviewed the additional information provided by SP AusNet in response to
questions we submitted subsequent to our on-site sessions. In particular we sought to obtain clear business case justification for the significant IT expenditure that has and is continuing to be made. For this scale of investment it is important that clear, unambiguous tangible and measurable benefits are identified.
259. For transmission the investment of $108m across the nine financial years is significant. The proposed $61m for the next RCP represents a step change in annual IT expenditure above previous years.
260. We are not satisfied that the documentation for the transmission related IT expenditure over the nine financial years 2009 to 2017 for the three SP AusNet regulated businesses (electricity transmission and distribution and gas distribution) has adequately justified the levels of expenditure. We would have expected to see clear efficiency and performance gains occurring across the business from the introduction of this level of investment in new technology. For the IT expenditure relevant to the next RCP we have not seen adequate business case justification for the proposed level of expenditure or for the large asset and works management upgrade.
261. We found that on page 9 of the Issue 2 (August 2010) ICT Strategy (FY 2011/15) a table setting out the costs and expected benefits of the proposed IT expenditure had not been completed. A note in the strategy stated 'Action: To insert financial benefits when complete.’ We asked SP AusNet to provide an updated table with the benefits included. SP AusNet’s response stated that:
With regards to the table (Page 9 of the Issue 2 August 2010 ICT Strategy (FY 2011/15)), no further updates of this document are available, so the requested update to the table cannot be provided. As far as we are aware, work to determine the financial benefits has not been undertaken.36
262. In its response SP AusNet provided a table describing expected benefits and, for some components of the IT investment program, a Present Value of expected operating costs savings. The total PV for all projects listed in this table was given as $641k37 ($465k + $405k – $229k). With regard to the expected benefits for the IT investment program SP AusNet state that:
The quantified benefits are estimated benefits only and do not include realised benefits because to date, SP AusNet has been unable to assess realised benefits.
36SP_EMCa034_-_ICT_Plan_Benefits
37Real 2013/14 dollars
[C-I-C]
SP AusNet Review - Final Report
Report to AER (Public) 75 August 2013
Similarly, there is no benchmarking information available to compare the benefits of these projects with similar programs. These are both issues SP AusNet would like to address in the future.
263. In response to our question asking identification of the expenditure category where quantifiable benefits would be realised SP AusNet stated that:
“The expenditure categories where the benefits would be derived have not been specifically identified but given the projects stem from the following categories, it could be assumed that costs/benefits they incur/deliver would be related to those categories.
a) Asset and works management
b) Back office management
c) Workforce collaboration
d) Analytics and reporting
e) Network management
f) ICT infrastructure and operations”
264. For the Asset & Works Management (EAM/ERP upgrade) which accounts for 35% ($21.3m) of the forecast38 IT transmission related expenditure SP AusNet consider that the project benefits are as follows:
“Adopt an asset and work management platform integrated with enterprise resources planning which will be used to manage the lifecycle of assets including investment planning, construction and maintenance programs through to asset retirement.”
265. The proposed strategic investments in IT systems should only be made if there are clear quantifiable benefits that will be derived from the investment. SP AusNet has not adequately identified where these benefits lie. To estimate the expected benefits of strategic IT investments it is necessary to identify those strategic investments.
266. IT expenditure forecasts can be considered to have both a strategic and replacement cycle component. We have calculated the replacement cycle component from an assessment of both the past, and proposed future, IT expenditure. The Figures 27 and 28 below identify in dark green what we consider to be strategic investments, replacement cycle expenditure in light green and those that are likely to have both strategic and replacement components are shaded in mid-green.
38 Figures relate to the four years of the forecast expenditure, as per SP AusNet’s responses, and include the year ended 2014. This figure represents only the transmission share of the proposed system cost. SP AusNet’s has estimated a cost of for the EAM/ERP solutions, in total across all SP Australian group businesses.
[C-I-C]

SP AusNet Review - Final Report
Report to AER (Public) 76 August 2013
Figure 28: Proportion of transmission-related IT expenditure, by IT initiative (2009 – 13))
Source: EMCa005_E
267. SP AusNet has included a 1.4% ($12m) capex efficiency benefit we consider can be attributed in part to the historical investment made in enterprise project management. This level of benefit is consistent with what we would have expected to see from the strategic IT investments. However, we have seen no equivalent quantified opex benefits, and we have calculated that the investments in strategic IT that SP AusNet has undertaken should result in opex benefits of the order of $2.4m/year.
Figure 29: Proportion of transmission-related IT expenditure, by IT initiative
Source: EMCa005_F-_Forecast_IT_Capex_by_Network_and_Project_FY14-17
268. In its IT Strategy documentation and in the Revenue Proposal SP AusNet has identified $695k benefits that will be realised from the IT investments to be made during the 2014 – 17 RCP. Given such a low level of benefits, as presented the
[C-I-C]
[C-I-C]
SP AusNet Review - Final Report
Report to AER (Public) 77 August 2013
business case for the strategic investment in the Asset and Works Management Upgrade is insufficient to justify the investment.
269. For communications projects contained in the ICT expenditure proposal we found that the projects are generally scoped and costed at a relatively high level. Whilst this raised questions regarding the accuracy of the component costs of the expenditure forecast, we found no reason to doubt that the forecast was a reasonable reflection of what SP AusNet will spend in this area.
270. We consider that:
The allowance for IT capex should be reduced by $17m, from $48.5m to an adjusted amount of $31.5m39. This would bring SP AusNet broadly into line with other TNSPs on a revenue benchmarking basis, would cover for ongoing IT lifecycle refresh and for version upgrades. It would not allow for the EAM system on the basis that this investment has not been subject to appropriate governance and quantified benefits have not been presented in the RP. The adjusted IT capex nevertheless exceeds the annualized IT capex incurred in the current RCP.
A downwards adjustment of $2.4m / year should be made to the opex forecast to reflect expected benefits that will be realised from historical strategic investments in IT; and
The $0.8m of opex benefits40 identified by SP AusNet (and which would result from the EAM system) should be added back to the forecast.
6.7 Conclusions on Asset Replacement, Safety and Compliance and Non-System Capex
6.7.1 Conclusion and recommendation on IT 271. Our conclusion on the IT forecast is that:
The allowance for IT capex should be reduced by $17m, from $48.5m to an adjusted amount of $31.5m ;
The $0.8m benefits identified by SP AusNet be added back to the forecast; and
A downwards adjustment of $2.4m / year should be made to the opex forecast to account for the benefits of previous strategic investment, and which should accrue largely to the business, but also to some extent to IT opex through the reduced need to maintain legacy and parallel duplication of systems.
39 Total over the three years, before SP AusNet’s general allowance for capex efficiency
40 Aggregate over the next RCP
SP AusNet Review - Final Report
Report to AER (Public) 78 August 2013
6.7.2 Conclusions on Asset Replacement, Safety and Compliance and Non-System Capex
272. We have reviewed the components of this expenditure category and found that the proposed work to be undertaken is appropriate and the expenditure should be allowed. Due to the proportion of cost estimates that are provisional we consider that it is appropriate to endorse the expenditure subject to adjustments to take into account cost estimation accuracy and prudency.
6.7.3 Other non-network 273. We have found the proposed expenditure to maintain ‘other’ non-system expenditure
at historic levels to be appropriate.
SP AusNet Review - Final Report
Report to AER (Public) 79 August 2013
7 Opex 7.1 Introduction
274. SP AusNet has prepared its opex proposal through a combination of:
Trend forecasting from a base year (2011/12), for recurrent expenditure;
Addition of proposed step changes to that recurrent expenditure (and which SP AusNet has estimated by a bottom-up process); and
A bottom-up build for proposed non-recurrent expenditure.
275. Our terms of reference are to provide advice on technical aspects of the proposed step changes and on those components of opex that are calculated from a “bottom-up build”. The scope of our work covers controllable opex only, and does not include the matters relating to the choice of base year, the methodology by which SP AusNet has escalated base-year costs, or the escalation factors that it has applied. We also have not considered related party costing matters and margins, including the proposed “management fee” and allowances for taxes and insurance.
276. Our primary sources of information for this aspect of the review are as follows:
Revenue Proposal, section 5, in particular sections 5.10 Step Changes and 5.11 Asset Works;
SP AusNet Opex model;
Current RCP submission templates;
Revenue Proposal Appendix 5E - Opex Step Changes;
Revenue Proposal supporting document: Corrosion Risk Mitigation;
Response SP EMCa015 – Opex asset works;
Response SP EMCa027 - Opex step changes.
SP AusNet Review - Final Report
Report to AER (Public) 80 August 2013
7.2 Step changes in recurrent maintenance
7.2.1 Review guidelines 277. SP AusNet has proposed step changes based on the AER’s guideline, section
4.3.4(c)(3) which requires that:
“the operating expenditure forecast must include any necessary adjustments for changes in responsibilities that result from compliance with a new or amended law or licence, or other statutory or regulatory requirements, including a requirement that can be demonstrated to arise directly from a recognised policy, practice or policy generally applicable to similar firms participating in the National Electricity Market”.
278. We have based our review on the application of this guideline.
279. SP AusNet sets out its views on the application of this guideline in “Table 1.2: Justification for Opex Step Changes” in the RP Appendix 5E. As a general observation, we note that SP AusNet for the most part quotes from NER obligations, licence obligations or other statutory obligations which are not new and therefore do not in themselves evidence of the need for a step change, and that SP AusNet does not provide satisfactory evidence on the timing of an applicable change. As we show in illustrating the proposed step changes in the next section, the changes in obligations would appear to have almost all appeared at this moment, that is, coincident with the commencement of the next RCP. This seems to be an unlikely alignment of circumstances and has led us to seek further evidence on the external drivers and their timing41.
280. We also sought information on the current RCP expenditures in each of the areas for which a step increase is proposed. Within the timeframe of our primary analysis, SP AusNet did not have this information available, and stated that it would require a forensic accounting exercise of around 4 weeks’ effort42. The fact that SP AusNet had proposed step increases without having information on baseline expenditure raised a degree of doubt that some of the proposed expenditure may be already inherent in baseline opex and that there may be an element of double-counting. SP AusNet subsequently provided baseline information on current RCP costs for some but not all of the proposed step change categories43. Our concerns regarding double-counting remain, given the incomplete information provided. The information that SP AusNet did provide showed (for example) that the proposed step increases in SF6 top-up costs, innovation, outage planning, terminal station security and IT security are greater than the entire amounts spent in these categories in the previous three years. Also that the proposed step increases in regulatory costs (“transitional arrangements”) and controller training are approximately the same as the entire amounts spent in these categories in the last three years.
41 Request EMCa032
42 Response SP_EMCa032, Q1, 22 May 2013.
43 Follow-up to response SP_EMCa032, 17 June 2013


SP AusNet Review - Final Report
Report to AER (Public) 83 August 2013
Table 19: Proposed opex: comparison of incremental expenditure and step changes
Source: SP AusNet Opex model
286. We sought information from SP AusNet on these apparent discrepancies, and to assist in deciding which forecasts should be considered as the definitive proposed expenditures. In its response SP EMCa027 SP AusNet has explained the differences as follows:
“The AER’s submission templates provide recurrent maintenance splits on an indicative basis only and therefore caution must be exercised when using the information reported……
As such the forecast maintenance costs in the above categories have been derived by:
1. Taking the total maintenance cost found in SP AusNet’s opex model (i.e. Row 7 of the ‘Forecast Calculation’ worksheet)
2. Allocating the total amount between asset types based on the average activity levels across the current RCP……”
287. In other words, the asset breakdown for the proposed expenditure has been pro-rated on the current RCP breakdown and cannot be aligned with the proposed step changes.
288. We consider it a weakness of the RP and a concern for the application of the AER’s approval process that the breakdowns of the proposed expenditure in the templates cannot be relied on. Nevertheless for the purposes of this review we consider that SP AusNet has made clear its methodology for estimating the proposed opex and this led us to review the step changes as proposed, without reference to the asset, driver or labour type disaggregation that SP AusNet has put forward in completing the AER’s opex model template. Because we cannot rely on the template information, there is no visibility of opex trending across the time from the current to the next RCP, by asset type. Such information, if reliable, would be useful in assessing changes in the application of opex by asset type, and thus, the alignment of the proposed expenditure with SP AusNet’s asset management strategies.
$m, 2013/14
Step Changes as advised by
SP AusNet
Incremental opex (as
calculated from Forecast
templates)
Difference
Substations 2.6 19.9 17.3- Lines 15.3 3.5 11.7
Comms 2.7 0.6 2.0 Easements - 0.3 0.3-
SUBTOTAL Recurrent Maintenance 20.5 24.3 3.8-
Support SR 1.8 2.8 0.9- System operations 1.6 3.2 1.6- Nealth and safety 5.0 5.2 0.3-
IT 2.0 1.8 0.2 Other Corporate 2.9 3.0 0.1-
TOTAL 33.8 40.3 6.6-
SP AusNet Review - Final Report
Report to AER (Public) 84 August 2013
7.2.3 Review of specific proposed step changes 289. In the following subsections we summarise our review of each of the step changes that
SP AusNet has proposed, according to each of the six drivers.
Ageing asset profile
290. SP AusNet has listed two step change expenditure amounts driven by the ageing asset profile46:
Overhead line condition assessment ($5.3m), of which $1.2m is to be incurred in the current RCP and a further $4.1m in the next RCP;
Corrosion risk management (tower painting) ($9.9m).
291. Overhead line condition assessment is an existing policy which SP AusNet states is commencing in 2013/14. We observe that in recent years other Australian transmission utilities have found condition issues with their lines that had not been fully recognised and which were being picked up only on an ad-hoc basis. These utilities have developed similar programs to embed lines condition assessment into their maintenance routines and we consider that the four routines proposed by SP AusNet (smart aerial image processing, overhead line corrosion detection, intrusive inspection of structure foundations and conductor joint testing and replacement, along with increased activity targeting connections and corrosion quantity surveying) are consistent with good transmission asset management practice. The focused corrective maintenance resulting from such inspections is likely to be justified by avoiding the need for premature replacement and, ultimately, by being able to extend line lives and the AER should seek evidence of this benefit in future regulatory reviews. While it is arguably the case that such work should have commenced earlier, we are satisfied that this work has not been previously carried out and is therefore not inherent in recurrent maintenance base expenditure, and that moving to undertake such work represents a step change that is justified by the application of good utility practice. However it is also unclear whether this work might replace other activities by which line defects were identified, and which is inherent in base year expenditure.
292. SP AusNet has also proposed the repainting of 17 towers as a step change. While we consider it possible that the condition monitoring work above may demonstrate the need for higher levels of lines corrective work such as tower painting, we do not consider that this should be covered by a step change at this stage. SP AusNet painted two steel towers and 17 steel poles under its “Asset Works” program in the current RCP, and proposes repainting a further 17 steel towers in the next RCP. Pending more comprehensive information from the condition assessment, we consider it imprudent to view tower painting at the proposed level as an on-going step change: the actual amount required may be found to be higher or lower than this level, and may fluctuate from period to period as determined by the condition assessments at that time. Until the information has been gathered to support a steady routine effort, and to quantify the size of this effort, we consider that this work (the need for which we
46 Costs quoted here are inclusive of escalation applied by SP AusNet, as per its capex model. Some costs quoted in the SP AusNet RP and associated appendices do not include such escalation
SP AusNet Review - Final Report
Report to AER (Public) 85 August 2013
accept) should be classified under Asset Works and we address the required expenditure in our review of the proposed Asset Works program.
Changes in compliance obligations
293. SP AusNet has proposed two step increases driven by changes in compliance obligations:
Changes to AEMO outage planning requirements ($0.6m);
Security of critical infrastructure ($5.0m).
294. We are satisfied that the changes to AEMO’s outage planning requirements are an additional externally driven requirement, requiring operation of a B2B process that is additional to current requirements and on the grounds of reasonableness we accept SP AusNet’s estimation of the additional cost.
295. We have considered whether the security of the transmission network as “critical infrastructure” is an additional requirement and, if so, when it has come about. While the need for enhanced security of power networks has been recognised for some time, and was brought into focus by the 9/11 terrorism attack, the mechanisms for doing so and the specific needs have been evolving. We are satisfied that enhanced measures are to be instituted and that they are representative of similar policies now being applied by similar firms in the NEM, and that an amount of expenditure should be allowed on this basis. Initially SP AusNet was unable to provide information on the amounts of such expenditure that are already being incurred, and what existing security measures might be replaced or modified. Some existing cost information was provided on 17th June. For the reasons described in paragraph 280, we are not convinced that the proposed step increase was informed by a sound understanding of existing costs nor that they reflect the net effect of changes in processes or practices. Accordingly, we recommend halving the proposed step increase (i.e. to $2.5m).
Regulatory changes and government policy initiatives
296. SP AusNet has proposed three step increases driven by regulatory changes and government policy initiatives:
Impact of carbon price on SF6 top-ups ($2.6m);
Transitional arrangements to align RCPs ($2.9m);
Changes to planning arrangements in Victoria, arising from AEMC’s transmission framework review (Placeholder, no cost proposed at this stage).
297. We propose that the AER not accept either of the first two step change increases, and should consider a step increase for any changes to planning arrangements should this be required based on government decisions.
298. We sought information from SP AusNet on the current cost of SF6 top-ups and this too was unable to be provided initially to support the calculation of the proposed increase. For the reasons described in paragraph 280, we are not convinced that the proposed step increase was informed by a sound understanding of existing costs and the information provided by SP AusNet subsequent to the 30th May Engagement Meeting indicated that the proposed step increase was equivalent to the entire current level of expenditure. Moreover the proposed amount is based on a carbon price of $29/tonne,
SP AusNet Review - Final Report
Report to AER (Public) 86 August 2013
which is considerably greater than current estimates and may be abolished in the event of a change of government. We also note the considerable amount of replacement and refurbishment work being conducted at substations, which we would expect to decrease the volumes of leakage and we would expect that SP AusNet would focus more attention still on reducing leakage in the event of a higher SF6 price.
299. The proposed step change for “transitional arrangements” is based on the asserted need for additional regulatory resources due to the transmission and distribution RCPs being aligned, with the next RCP being for only 3 years. We are not persuaded by the suggestion that the shorter RCP requires a step increase in expenditure. First, the shorter RCP is a one-off, not an on-going requirement. Second, while the coincidence of regulatory resets across the SP group will lead to a greater cyclical fluctuation of resource needs, similar businesses deal with this by re-deploying resource in the lower part of the cycle and/or by outsourcing to meet the peaks. We do not consider that this should lead to a higher cost overall. Thirdly, regulatory reset resources are by definition needed in every RCP and, whether longer or shorter, to the extent that this cost is inherent in current opex, it is reasonable to assume that it is inherent in forecast baseline opex.
Recurrent expenditure not reflected in base year
300. SP AusNet has proposed one step change for recurrent expenditure not included in the base year:
Operating expenditure on communications infrastructure ($2.7m).
301. SP AusNet states that this step change is required to reflect a transfer of such expenditure from “Asset Works”. From line-item detailed information that SP AusNet has provided listing each of its current RCP items of asset works expenditure, this expenditure does not appear. We sought further information on the current RCP expenditure and in its response SP AusNet identified this expenditure as being part of “Asset Works – Miscellaneous Works”.
302. We have considered information provided on the drivers for this expenditure, which appear to be on-going compliance requirements that have existed for many years (e.g. maintaining documentation as required under the Occupational Health and Safety Act 2004). However on the basis that this amount has historically been included in Asset Works and has not been included in base year current expenditure, we consider that this should be accepted.
IT capital works
303. SP AusNet has proposed four step change increases in IT expenditure as follows:
Controller simulator training ($1.0m);
SCADA security ($0.6m);
IT network security ($0.8m);
Enable market reporting and operations ($0.5m).
304. We consider that the proposed amount for controller simulator training should be included on the basis that it implements a policy that is good industry practice and
SP AusNet Review - Final Report
Report to AER (Public) 87 August 2013
used by other utilities in the NEM and internationally with a worthwhile benefit in improving system operational management and reducing system operational risk.
305. We do not support the inclusion of the other three proposed step increases. While we are fully supportive of the need for reasonable and prudent measures to maintain SCADA and network security, these are not new requirements. SP AusNet refers to reviews in 2009 and 2010 as drivers for SCADA security enhancements; it is difficult to understand why it proposes to introduce such measures only in 2014/15. We assume that SP AusNet as a prudent transmission system manager and operator has existing security mechanisms and protocols; further, the considerable expenditure on IT would normally bring with it enhanced security capability. As has been referred to above, SP AusNet has not been able to provide information on current levels of expenditure in these areas and has therefore provided neither context for the proposed increases, nor sufficient detail to indicate consideration of savings that might offset the costs of the proposed measures. The proposed step increases therefore present as changes in the way SP AusNet undertakes these functions, rather than increased requirements.
306. The amount proposed to “enable market reporting and operations” is for the enhanced AEMO requirements for B2B outage planning. We have proposed accepting the amount of $0.6m proposed under that heading, and which is presented as enabling this capability. There does not appear to be any additional driver to justify the further $0.5m proposed under the heading of IT. SP AusNet has not presented a breakdown of its proposed total IT opex requirements at this level of granularity and we do not consider it reasonable to add a specific resource allowance for this interface, when the total IT opex budget includes IT resource to maintain a range of B2B and internal IT interfaces.
Enhanced efficiency through technology improvements
307. SP AusNet proposes the following step increase:
Technology innovation (four specific programs listed) ($1.8m).
308. SP AusNet refers to its existing innovation program and the maintenance benefits that it has achieved from this program. We are fully supportive of well-focused R&D. This is not a program that is driven by external change, nor is it a new program. Further, the benefits of any R&D / innovation program should be realised (for example) through more efficient maintenance, reduced augmentation or replacement capex requirements or improved performance. To the extent that SP AusNet has already set what it considers to be a prudent level of expenditure on innovation, we cannot see a valid reason for this to step up at a time which coincides with the commencement of the next RCP.
309. We therefore propose that the AER does not allow this step increase, and we would nevertheless expect that SP AusNet will continue to undertake properly justified innovation programs.
7.2.4 Finding on proposed step increases 310. Our finding is that a number of the proposed step increases are not justified in
accordance with the AER’s guideline and we recommend that the AER does not allow

SP AusNet Review - Final Report
Report to AER (Public) 88 August 2013
$21.7m of the $32.5m additional recurrent maintenance that SP AusNet has proposed47. The table below summarises the proposed adjustments.
Table 20: Step changes (As adjusted by EMCa)48
Source: EMCa analysis
311. The resulting opex profile with the adjustments to the proposed step changes is shown in the diagram below.
47EMCa has moved the amount of $9.9m proposed for Corrosion Management, to Asset Works, and this amount is further considered there.
48 Amounts in this table include escalation (as proposed by SP AusNet in its opex model). Cost data presented in SP AusNet’s written proposal is generally excluding escalation, and so differs slightly from the amounts in this and similar tables.
$m, 2013/14
As proposedAs adjusted
by EMCaDifference
Impact of a Carbon Price on SF6 Top Ups 2.6 - OHL condition assessment program 4.1 4.1 Corrosion Management 9.9 - Communications Infrastructure 2.7 2.7
Recurrent Maintenance 19.2 6.8 12.5-
Innovation program 1.8 - Support SR 1.8 - 1.8-
AEMO Outage Planning Requirements 0.6 0.6 Controller Training Simulator 1.0 1.0
System operations 1.6 1.6 -
Security of Cri ical Infrastructure (Terminal Statio 5.0 2.5 Health and safety 5.0 2.5 2.5-
IT Network Security 0.8 - SCADA Security 0.6 - Enable Market Reporting and Operations 0.5 -
IT 2.0 - 2.0-
Transi ional Arrangements 2.9 - Other corporate 2.9 - 2.9-
Subtotal 32.5 10.9 21.7-


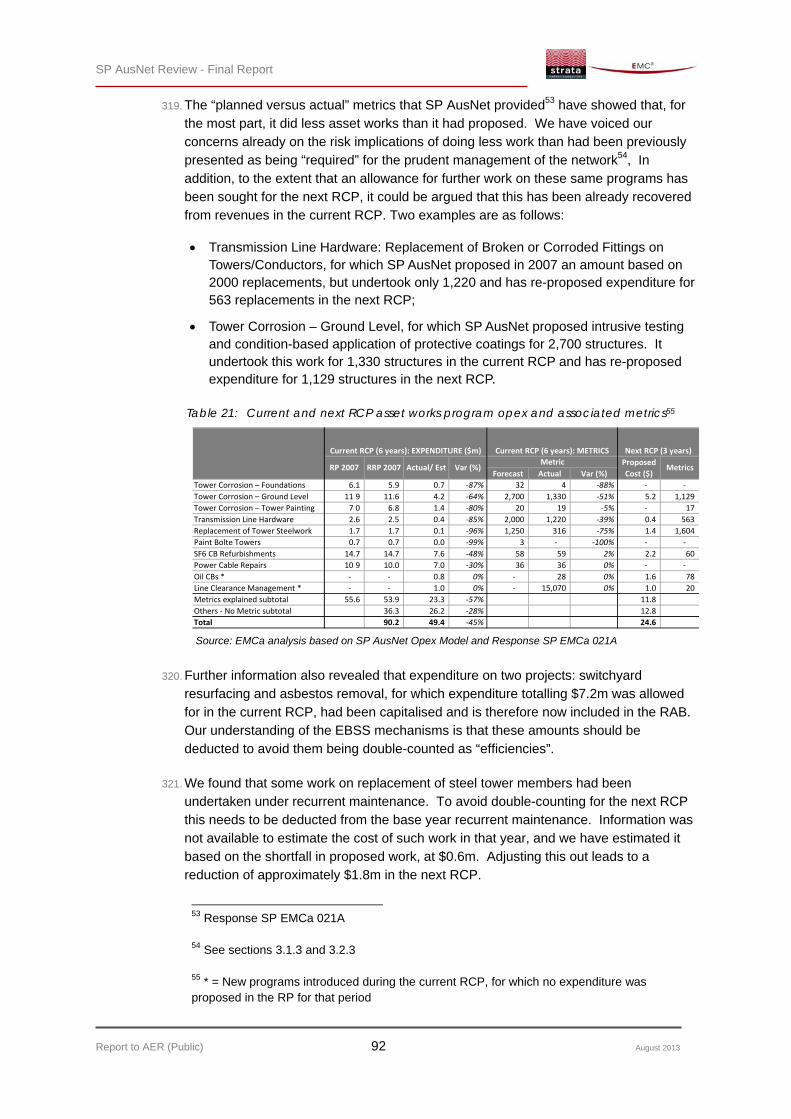
SP AusNet Review - Final Report
Report to AER (Public) 92 August 2013
319. The “planned versus actual” metrics that SP AusNet provided53 have showed that, for the most part, it did less asset works than it had proposed. We have voiced our concerns already on the risk implications of doing less work than had been previously presented as being “required” for the prudent management of the network54, In addition, to the extent that an allowance for further work on these same programs has been sought for the next RCP, it could be argued that this has been already recovered from revenues in the current RCP. Two examples are as follows:
Transmission Line Hardware: Replacement of Broken or Corroded Fittings on Towers/Conductors, for which SP AusNet proposed in 2007 an amount based on 2000 replacements, but undertook only 1,220 and has re-proposed expenditure for 563 replacements in the next RCP;
Tower Corrosion – Ground Level, for which SP AusNet proposed intrusive testing and condition-based application of protective coatings for 2,700 structures. It undertook this work for 1,330 structures in the current RCP and has re-proposed expenditure for 1,129 structures in the next RCP.
Table 21: Current and next RCP asset works program opex and associated metrics55
Source: EMCa analysis based on SP AusNet Opex Model and Response SP EMCa 021A
320. Further information also revealed that expenditure on two projects: switchyard resurfacing and asbestos removal, for which expenditure totalling $7.2m was allowed for in the current RCP, had been capitalised and is therefore now included in the RAB. Our understanding of the EBSS mechanisms is that these amounts should be deducted to avoid them being double-counted as “efficiencies”.
321. We found that some work on replacement of steel tower members had been undertaken under recurrent maintenance. To avoid double-counting for the next RCP this needs to be deducted from the base year recurrent maintenance. Information was not available to estimate the cost of such work in that year, and we have estimated it based on the shortfall in proposed work, at $0.6m. Adjusting this out leads to a reduction of approximately $1.8m in the next RCP.
53 Response SP EMCa 021A
54 See sections 3.1.3 and 3.2.3
55 * = New programs introduced during the current RCP, for which no expenditure was proposed in the RP for that period
Forecast Actual Var (%)
Tower Corrosion – Foundations 6.1 5.9 0.7 ‐87% 32 4 ‐88% ‐ ‐
Tower Corrosion – Ground Level 11 9 11.6 4.2 ‐64% 2,700 1,330 ‐51% 5.2 1,129
Tower Corrosion – Tower Painting 7 0 6.8 1.4 ‐80% 20 19 ‐5% ‐ 17
Transmission Line Hardware 2.6 2.5 0.4 ‐85% 2,000 1,220 ‐39% 0.4 563
Replacement of Tower Steelwork 1.7 1.7 0.1 ‐96% 1,250 316 ‐75% 1.4 1,604
Paint Bolte Towers 0.7 0.7 0.0 ‐99% 3 ‐ ‐100% ‐ ‐
SF6 CB Refurbishments 14.7 14.7 7.6 ‐48% 58 59 2% 2.2 60
Power Cable Repairs 10 9 10.0 7.0 ‐30% 36 36 0% ‐ ‐
Oil CBs * ‐ ‐ 0.8 0% ‐ 28 0% 1.6 78
Line Clearance Management * ‐ ‐ 1.0 0% ‐ 15,070 0% 1.0 20
Metrics explained subtotal 55.6 53.9 23.3 ‐57% 11.8
Others ‐ No Metric subtotal 36.3 26.2 ‐28% 12.8
Total 90.2 49.4 ‐45% 24.6
Current RCP (6 years): EXPENDITURE ($m) Current RCP (6 years): METRICS Next RCP (3 years)
RP 2007 RRP 2007 Actual/ Est Var (%)Metric Proposed
Cost ($)Metrics

SP AusNet Review - Final Report
Report to AER (Public) 93 August 2013
322. We also found that, while repainting of 20 steel towers had been proposed in the current RCP, SP AusNet had repainted two steel towers and 17 steel poles, hence the considerably lower cost incurred. It now plans to repaint the remaining 17 steel towers in the next RCP, and has again sought an opex allowance for this.
Analysis of underspend in current RCP – by reason
323. We have analysed the current RCP asset works program underspend according to the information provided by SP AusNet. SP AusNet under-spent on field work for the works categories that it proposed for the current RCP, by approximately $49m56. In broad terms, this can be attributed as follows:
Significant over-forecast of cost, but volume of work largely achieved: SF6 CB Refurbishment ($7.0m); Power Cables Repair ($3.0m); Tower painting ($5.4m). (Total = $15.4m);
Significant over-forecast of cost / less work achieved. Not re-proposed: Tower Corrosion – Foundation ($5.1m); Transformer Leak Repair & Oil Treatment ($4.7m); Misc. Works ($1.4M). (Total = $11.2m);
Significant over-forecast of cost / less work achieved (and re-proposed in the next RCP)57: Tower Corrosion – Ground Level ($7.4M); Transmission Line Hardware ($2.2m); Replacement of Tower Steelwork ($1.6m). (Total = $11.2m);
Significant Over Forecast / volume variance unknown (and re-proposed in next RCP): Transformer & CT Failure Risk ($0.9m); GIS Refurbishment ($1.8m). (Total = $2.7m);
Cancelled: Paint Bolte Towers ($0.7m); Bolt Replacement ($0.9M)58 .(Total = $1.6m);
Moved into Capex: Switchyard Resurfacing ($3.4M); Asbestos Removal ($3.8m). (Total = $7.2m).
324. We also noted the two items above where the work was undertaken, but was capitalised, amounting to $7.2m. We understand that the EBSS may allow an adjustment where a change in capitalisation policy has occurred. It is outside of the scope of our advice to confirm whether SP AusNet has made such adjustment but, if it has not, then there is a clear instance of double-dipping on the proposed and incurred expenditure.
Underspend- implications for revenue over-recovery
325. While some Asset Works may have been found not to be required, or at least not to be required in that timeframe, and may therefore have been “prudently deferred”, SP AusNet has nevertheless recovered revenue to undertake this work in the current
56 At the portfolio level, this was partially offset by undertaking some works that were not in the current RCP revenue proposal, leading to an aggregate underspend on field works of $43.4m.
57 Some transmission line hardware and replacement of tower steelwork was undertaken as routine maintenance. The volumes and/or costs of work proposed in the next RCP are not exactly equal to the amounts of under-spend and/or under-achievement of works in the current RCP, but at an aggregate level they are approximately equivalent on an annualised basis.
58 Unknown volume of work undertaken as routine maintenance

SP AusNet Review - Final Report
Report to AER (Public) 94 August 2013
RCP. And it is further seeking revenues to undertake what to some extent is the same work, in the next RCP. It appears to us that there is a clear issue of “double dipping” here. Moreover, the amount is substantial: SP AusNet proposed that it needed $100.1m59 but underspent this by $45.8m. And further, we understand that there is not provision in the Rules to adjust the EBSS for a lower quantity of work performed, therefore (and particularly because the underspend has largely occurred in the last 4 years) if this amount was to be allowed in the next RCP, the business would continue to enjoy an “efficiency incentive” extending into the next RCP, at the same time as it recovers for a second time the revenue required for this work.
326. We considered whether the underspend and double-dipping might be a pattern, indicative of gaming, by reviewing SP AusNet’s actual expenditure compared with its proposed expenditure in the previous RCP (i.e. commencing in 2003). However, after adjusting for inflation for comparison purposes, we found that SP AusNet’s spend was materially as it had proposed: $58m total over that five year period.
327. We bring this matter to the AER’s attention as Technical Advisers, since the implications of under-achieving previously-accepted opex asset works appears to lead to a regulatory anomaly under the current Rules.
7.3.2 Implications for the next RCP 328. It is difficult, given information on the current RCP, to have a high degree of confidence
in SP AusNet’s asset works program budget for the next RCP. Our view is that the significant variance to budget can be ascribed to one or a combination of factors and we have no evidence to suggest that these factors have materially changed. These include:
That the need was conservatively over-estimated;
That the unit costs for the program were conservatively over-estimated;
That needs that were reasonably estimated based on information available at the time of proposing for an RCP tend to be later found not to exist, or to be less than has been reasonably estimated;
Noting that recurrent expenditure was considerably higher than was proposed, starting from the first year of the current RCP, it is possible that work that was proposed as asset works has in fact been undertaken under recurrent maintenance, or has been capitalised. In either case, this would be a concern as, unless adjusted for, it leads to “double dipping”. Other than in the specific instances referred to above, we have not found further evidence for this, however it would require a regulatory accounting audit of current RCP expenditure to unequivocally rule out this possibility and it indicates a need to focus on expenditure categorisation in regulatory accounting;
That SP AusNet has held over work that reasonably should have been done, in order to obtain the three-pronged benefits of (a) increased profit and increased cashflow within the regulatory period (since revenue was not reduced for the work
59EMCa has converted all costs to $2013/14 equivalents. This amount comprises both field work (90.9m, but spent $43.4m less) and asset works support costs (9.2m, but spent 2.4m less).

SP AusNet Review - Final Report
Report to AER (Public) 95 August 2013
not done), (b) an EBSS efficiency benefit and (c) obtaining an allowance for the same work to be undertaken in its proposal for the next RCP.
7.3.3 Assessment of proposed asset works program 329. The following table shows the asset works programs that SP AusNet has proposed,
against the expenditures on “like” programs in the current RCP.
Table 22: Current RCP and proposed asset works programs
Source: SP AusNet Opex model
330. At a specific program level, we have concerns about the following four programs:
Tower corrosion - ground level
Transformer and CT failure risk
Transmission line hardware
Replacement of tower steelwork
Tower corrosion – ground level
331. In the main on-site meetings, SP AusNet described to us the reasons why achievement of corrective asset works was lower than had been originally planned. This includes the need to deal safely with asbestos. We note the current levels of work on this program, which SP AusNet does not plan to increase within the current RCP and we are not persuaded that there is a reason why this program will step up from a level of $146,000 in 2013/14 to $1.8m coinciding with the commencement of the next RCP. We consider it more likely that the program will run at approximately the rate achieved over the past four years, and we propose an adjustment to this level, resulting in $1.2m in place of the $5.2m proposed.
Transformer and CT failure risk
332. In response to our interim findings presentation, SP AusNet referred us to supporting information indicating that $3.4m of the $5.3m proposed for this item is for transformer refurbishment work at RTS and WMTS, and which is being undertaken in conjunction with the major rebuilds of these stations. On further review of that information we note that these transformers are currently 48 years old and that the work is intended to
$m, 2013/14
2008/09 2009/10 2010/11 2011/12 2012/13 2013/14 2014/15 2015/16 2016/17
Tower Corrosion – Ground Level 1.3 1.2 0.6 0.4 0.5 0.1 1.8 1.7 1.6
Transmission Line Hardware 0.0 0.2 ‐ 0.2 0.0 0.0 0.1 0.1 0.1
Replacement of Tower Steelwork 0.0 0.0 ‐ ‐ 0.0 0.0 0.4 0 5 0.5
SF6 CB Refurbishments 1.1 1.4 2.0 1.3 1.6 0.3 0.9 0 8 0.5
GIS Refurbishments 1.6 1.7 0.7 0.1‐ 0.8 1.0 0.2 0 3 0.3
Transformer and CT Failure Risk 0.4 0.4 0.8 0.3 0.2 0.3 1.8 1 5 2.0
Facilities Maintenance 1.5 0.9 0.4 0.1 0.1 0.9 0.9 0 9 ‐
Switchgear 0.0 0.1 0.1 0.3 0.4 1.2 0.3 0 3 0.0
Oil CBs 0.0 0.3 0.1 0.2 0.2 0.1 0.6 0.6 0.5
Reactive Plant 0.0 0.0 0.1 0.0 ‐ ‐ ‐ ‐ 1.6
Maintenance Support 0.1 0.1 0.1 0.2 0.6 0.2 0.3 0 3 0.3
Line Clearance Management 1.0 0.0‐ ‐ 0.0 0.0 ‐ 0.3 0.4 0.3
Civil Infrastructure at Stations ‐ ‐ ‐ ‐ ‐ ‐ 0.4 0.6 0.7
Subtotal 7.1 6.2 4.8 2.9 4.4 4.0 8.0 8 0 8.5
Others ‐ Not proposed for next RCP 5.42 6.14 3 03 1.12 2 24 2.13 ‐ ‐ ‐
Total 12.5 12.4 7.8 4.0 6.6 6.1 8.0 8.0 8.5
Category
Actual / Expected Expenditure Next RCP

SP AusNet Review - Final Report
Report to AER (Public) 96 August 2013
extend their lives60. From this supporting information we consider that this work is more appropriately capitalised and so we propose removing it from Asset Works opex. The remaining work ($1.9m over three years) would then be slightly more than the average annual level achieved over the previous four years, but would nevertheless appear to be reasonable.
Transmission line hardware and replacement of tower steelwork
333. From on-site information that we obtained, we consider that the proposed transmission line hardware and replacement of tower steelwork programs are best considered “provisions”. While we are satisfied that SP AusNet has a properly identified and justified need for asset works in these areas, we are not convinced that the quantum of work or the unit costs for such work are well-developed at this stage.
334. In the current RCP, SP AusNet has provided information that indicates that it undertook 39% less work (in volume terms) but that it spent 85% less in doing this work, indicating that the work on each item was able to be de-scoped or that the costs were over-estimated initially. For tower steelwork, SP AusNet has advised that it undertook 7% less in volume terms, though there was a 96% lower cost incurred. SP AusNet has advised that this is because the work was undertaken as part of recurrent maintenance, but as a result of accounting for the work in this way SP AusNet has not been able to advise the cost incurred under this category and therefore it is clear that this was not used in building up the future estimate.
335. As advised previously, in the current RCP SP AusNet spent 45% less than it had proposed. We consider that its proposed program and estimates are more realistic for the next RCP, but that there is nevertheless a “provisional” element to the proposed budget and that the budget built-up from the aggregate of the proposed programs, is likely to have over-estimated what will actually be spent. We propose reducing the proposed opex by 25% to account for these considerations, a reduction of $0.5m.
Aggregate adjustment
336. The recommended line-item adjustments would retain each of these programs, but with a lower assumed expenditure level. In aggregate these adjustments would reduce the assumed Asset Works opex from the $24.6m total proposed over the three years, to $16.7m.
337. However, offsetting these reductions, we have (as stated in section 7.2) recommended re-categorising “tower painting” from an opex step change to an asset works program. This adds $9.9m to the asset works program, bringing it back up to a level of $26.6m, or an average of $8.9m p.a. This would be higher than the average of $8.2m p.a. incurred in the current RCP and considerably more than the average $6.1m p.a. incurred in the most recent four years.
338. On balance we propose allowing the aggregate proposed expenditure on asset works, which averages $8.2m p.a. However this is on the basis that it includes the tower painting work which SP AusNet has proposed (under recurrent maintenance step changes) averaging $3.3m p.a. 60Supporting document provided by SP AusNet along with RP: “Transformers – Asset Works program” - section “Transmission L Transformer Life Extension Program 2014-17”

SP AusNet Review - Final Report
Report to AER (Public) 97 August 2013
339. Finally, bearing in mind the under-achievement of previously proposed work, we recommend that the AER seeks information from SP AusNet that as far as possible quantifies volume metrics for the proposed work, such that the work achievement can be assessed against the regulatory allowance over the course of the next RCP and to help inform the AER’s determination for the subsequent RCP in three years’ time.
7.4 Opex efficiency gains 340. We consider an estimate of the efficient level of opex, as is required under the NER,
should take into account the continuation of efficiency improvements that can reasonably be expected. SP AusNet is forecasting a capex efficiency gain of 1.44% from improvements due to capital project management capability and governance. (RP P21 & P83).SP AusNet has a commitment to continuous improvement and, in our experience, greater efficiencies are achievable in opex than in capex.
341. The main opex benefits that we can identify would be expected to flow from SP AusNet’s considerable strategic investments in IT. We have calculated that justification of this investment would imply an opex reduction of the order of $2.4m per year. This would represent approximately a 2.6% reduction in SP AusNet’s proposed controllable opex. We consider this to be a reasonable proxy for continuous improvements generally, resulting in an opex budget that can be considered “efficient” in terms of the requirements of the Rules and conceptually allowing for efficiencies in opex in the same manner as the capex efficiency allowance that SP AusNet has proposed.
7.5 Recurrent opex – base and other adjustments
7.5.1 Choice of base year 342. Although we are concerned that the 2011/12 base year recurrent opex is $5m (11%)
greater than was proposed61 for this year, we consider it acceptable for base year purposes on the grounds of being “actual expenditure” and it is less than the average of recurrent opex in the preceding three years.
7.5.2 Escalator calculations 343. We have reviewed the escalator calculations, which we consider to be satisfactory. In
accordance with our scope, we have not reviewed the proposed escalators themselves.
7.5.3 Group 3 roll-in adjustment 344. We consider the “group 3 roll-in adjustment” that SP AusNet has proposed is
erroneous and should be based not on the change in relativity between the unregulated and regulated asset bases, but on the value of currently-unregulated assets to be rolled into the RAB (with associated opex) relative to the replacement cost value of the RAB. Further, we consider that different scaling factors should apply, with
61 SP AusNet RRP, 2008
SP AusNet Review - Final Report
Report to AER (Public) 98 August 2013
a very low scaling applied to corporate costs. We have estimated an adjusted allowance of $2.4m in aggregate over the three-year period, compared with $5.2m as proposed by SP AusNet. This is based on the following information:
Relevant rolled in assets with a value of $105m;
An estimate of the replacement value of the RAB of $5.7 billion;
Resulting in group 3 assets in the period equivalent to 1.8% of the current volume of assets in the asset base;
Scaling factors of 95% for field work, 25% for maintenance support and 10% for corporate expenditure.
7.5.4 Adjusting for asset works undertaken as recurrent opex in current period
345. SP AusNet advised that a number of tower steel members for which replacement is proposed under asset works, were replaced under recurrent maintenance in the current period. We estimate that an amount of $0.6m needs to be adjusted out of the base year, thereby effectively reducing next RCP recurrent opex by $1.8m.
7.5.5 Adjusting for opex implications of excluding proposed Enterprise Asset Management system
346. If the AER does not include the strategic enterprise asset management system in IT capex, then the “savings” of $0.8m that SP AusNet has estimated and allowed for, should be added back.

SP AusNet Review - Final Report
Report to AER (Public) 99 August 2013
8 Contingent Projects 8.1 Overview
347. The concept of “contingent projects” is defined in the NER, and allows for the TNSP to submit projects, as part of a Revenue Proposal, that can be triggered by an event or circumstances that are pre-defined. Once triggered, there is then a further review and regulatory approval process for project costs, in which the AER may approve an amendment to the revenue determination.
348. Under NER 6A.8.1 (b) each forecast contingent project must satisfy four criteria. These criteria are:
It must be reasonably required to be undertaken in order to achieve any of the capital expenditure objectives specified in NER 6A.6.7(a);
It must not otherwise be provided for (either in part or in whole) in the total of the forecast capital expenditure;
It must reasonably reflect the capital expenditure criteria specified in NER 6A.6.7(c) representing efficient costs of a prudent operator;
It must exceed either $10million or 5% of the value of the maximum allowed revenue (MAR)62, whichever is the larger amount.
349. As the ex-ante replacement capex forecast is intended to provide a reasonable forecast of expenditure that the business needs to manage its assets, triggers for contingent projects are expected to cover circumstances beyond these needs.
350. In the Revenue Proposal SP AusNet proposed three contingent projects. All three are for the replacement or rebuild of existing substations.
62 For SP AusNet, the MAR is $502.5m for the first year of the regulatory period.
[C-I-C]
SP AusNet Review - Final Report
Report to AER (Public) 100 August 2013
351. Our assessment of each of the proposed contingent projects is provided below.
8.2 Findings South Morang Transformer Replacement – Stage 2
352. The 330/220kV H1 and H2 transformers at South Morang were installed in the mid-1060s and have been in service for around 45 years. These are single-phase transformers. An assessment of supply risk and market impact of the failure of one of these transformers shows that it is efficient to proceed with the staged replacement of one H transformer bank (three single phase transformers) at South Morang Terminal Station in the coming regulatory period.
353. This Stage 1 project of replacement of the H2 transformers with a cost of $27.4m appears to be adequately justified.
354. SP AusNet have assessed that it will be economic to carry out Stage 2 to replace the H1 transformers in 2021-25 assuming that there is no failure prior to that. The cost of this is $28.85 million as this includes the purchase of three single-phase transformers.
355. Based on the information provided in the Revenue Proposal and on-site sessions our understanding was that SP AusNet has proposed that a contingent project be included to advance Stage 2 into the coming regulatory period if one of the new transformers should fail. Based on this information we considered that this proposed contingent project is not adequately justified because the existing transformers appear to be in reasonable condition.
356. Subsequent to the meeting with SP AusNet on the 30thMay 2013, SP AusNet has clarified the trigger for this contingent project, as follows:
The trigger event for the South Morang contingent project is erroneously defined differently in the proposal document and Appendix 4G – Proposed Contingent Projects. The correct version is presented in the Appendix 4G as ‘Failure of any
[C-I-C]
[C-I-C]
[C-I-C]
SP AusNet Review - Final Report
Report to AER (Public) 101 August 2013
phase or phases of either the H1 or H2 transformers at South Morang Terminal Station’.
357. The contingent project replacement capex appears to be driven by supply risk cost rather than transformer condition. Given this we consider that:
A high level of reliability should be provided by the newly installed H2 transformer bank.
Should one of the new H2 transformers fail, it should be replaced or repaired under guarantee.
The old H2 bank will be retained as a cold spare. This will be able to be connected in place of H2 if it failed, or would provide cover for three failures of the single-phase units of the old H1 bank.
358. Our assessment of the real risk of a failure requiring Stage 2 to be advanced into the coming Regulatory period is that is a small probability and does not meet the first criterion under NER 6A.8.1 (b) of being reasonably required to be undertaken.
359.
360.
361.
362.
363.
364.
[C-I-C]
[C-I-C]
[C-I-C]
[C-I-C]
[C-I-C]
[C-I-C]
[C-I-C]
[C-I-C]
SP AusNet Review - Final Report
Report to AER (Public) 102 August 2013
9 STPIS 9.1 Overview
365. In this section we provide our assessment of the values proposed for the next RCP by SP AusNet for the Service and Network Capability Components of the Service Target Performance Incentive Scheme (STPIS). The assessment addresses the questions posed within the TOR for the Technical Consultant.
366. We also provide an assessment of methodologies and procedures for monitoring and reporting against STPIS parameters utilised by SP AusNet.
367. For the assessment of SP AusNet’s methodology the New Zealand Institute of Economic Research (NZIER) provided specialist statistical assessment and analysis. The following assessment of SP AusNet’s methodology and our proposed alternative take into account NZIER’s advice on the fitting of probability distributions and method for linking caps and collars to targets.
368. We have drawn on our team’s extensive knowledge and experience in the construction, operation and maintenance of transmission networks to make an assessment of the assumptions used for expectation of economically prudent improvement versus maintenance of current performance.
9.2 SP AusNet’s proposed STPIS parameters 369. In the Revenue Proposal, SP AusNet, has submitted proposed targets, caps and
collars in respect of the recent Final Report, Electricity Transmission Network Service Providers (TNSP), Service Target Performance Incentive Scheme (STPIS), December 2012. As such SP AusNet is the first TNSP to participate in the newly revised STPIS.
370. The revised STPIS scheme provides SP AusNet with an incentive or penalty of 1% of MAR under the Service Component. For the Service Component, the December 2012 scheme measures performance against four parameters, as follows:

SP AusNet Review - Final Report
Report to AER (Public) 103 August 2013
1) Average Circuit Outage Rate – measures the rate of both unplanned (forced and fault) outages for the sub parameters of lines, transformers and reactive plant.
2) Loss of Supply Event Frequency – measure the frequency of outages across two parameters for loss of supply events for consumers.
3) Average Outage Duration – measures the outage duration for consumers on loss of supply events.
4) Proper Operation of Equipment - requires TNSPs to report on ‘near miss’ events such as failures of protection systems, material failure of the Supervisory Control and Data Acquisition (SCADA) system and incorrect operational isolation of primary and secondary equipment. No financial incentive is required to be associated with this parameter for this RP.
371. SP AusNet has proposed a range of priority projects to improve network capability for the new Network Capability Incentive Parameter Action Plan (NCIPAP). SP AusNet is the first TNSP to utilise this parameter.
372. Chapter 6 of the Revenue Proposal contains SP AusNet’s proposed targets, caps, collars and proposed projects for the above parameters.
9.3 Assessment of SP AusNet’s method 373. SP AusNet has utilised the ‘fitted’ probability distributions recommended by Parsons
Brinkerhoff for all the service component data, except for Proper Operation of Equipment, to establish its proposed caps and collars.
374. Our assessment of the proposed values for performance targets and caps and collars and compliance with NER and AER requirements is based on an assessment of the Parsons Brinkerhoff (PB) methodology and recommendations.
375. Our preferred method of fitting distributions is not the same as the one used by PB. We prefer the ‘log-likelihood’ method or a combination of this and other tests.63 We base this view on experience using distributions and the fact that the K-S and A-D tests require more assumed knowledge about the data than the log-likelihood test.
376. Notwithstanding the above comment, there are a range of tests that can be applied to find the best fitting distribution and PB’s use of ‘fitted’ probability distributions is an acceptable, if not preferred, method.
63 This is a comparison of the statistical likelihood of a particular distribution given the data. This statistic is used only as a comparison measure - i.e. it has little information content as an absolute measure.
SP AusNet Review - Final Report
Report to AER (Public) 104 August 2013
377. We have used the log-likelihood method to assess the distributions recommended by PB as a way of cross-checking their analysis. The log likelihood method will give somewhat different results to the methods used by the PB distribution.64
378. In making our evaluation we have sought simplicity i.e. the fewer ‘parameters’ required to describe the distribution the better. This is important with so few data points to work with.
379. In general, we found that the PB methodology used to fit the distributions was reasonable because:
discrete distributions have been used to explain discrete data;
continuous distributions have been used to explain continuous data;
data which must logically be bounded at zero has been modelled using distributions bounded at zero;
for discrete distributions, the Chi-squared test has been used to choose the best performing distribution;
for continuous data, a distribution’s fit is tested using both the Kolmogorov-Smirnov (K-S) test and the Anderson-Darling (A-D) test
− The distribution with the best fit in both of the K-S and A-D tests is chosen or
− If the data is concentrated in the middle of the distribution the K-S test is used to determine best fit or
− If the data is concentrated in the tails the A-D test is used to determine best fit.
380. We also found that PB has applied the method consistently.
381. In annex A, we describe the recommendations of PB for each performance measure and provide our assessment of those recommendations. In our view, the majority of PBs recommendations are sound except the distribution chosen to describe the number of loss of supply events where system minutes exceeded 0.30 system minutes
9.4 Findings on STPIS
9.4.1 Assessment of Target Setting 382. Clause 3.2(g) of the STPIS Guideline sets out the basic requirement that proposed
performance targets for the service component must be equal to the TNSP’s average performance history over the most recent five years.
383. SP AusNet has selected to use the arithmetic mean as the average; which would be a reasonable and correct selection for normal and symmetrical distributions. Within asymmetrical distributions the use of the arithmetic mean does not provide a sound methodology by which to select caps and collars from within a fitted distribution to the
64 Note that to conduct this analysis we, like PB, had to test a wide range of distributions to gauge which looked to be performing better. We also applied judgement around the kinds of processes that might reasonably be producing the data.

SP AusNet Review - Final Report
Report to AER (Public) 105 August 2013
available data. Within asymmetric distributions the standard deviation does not provide useful information on the asymmetry.
384. Attempting to ‘connect’ the arithmetic mean by use of the standard deviation in the manner attempted by SP AusNet leads to its proposed use of ‘disconnected’ and non-meaningful asymmetric caps and collars. The current proposed caps and collars are not connected to the proposed performance targets by a sound methodology and are not appropriate.
385. For one-tailed (asymmetric) distributions we consider the appropriate and correct choice for the average of the distribution to be the 50th percentile or median point: it is the measure of central tendency which can be directly related to appropriately selected collars and caps from the distribution.
386. If SP AusNet’s use of the arithmetic mean as the average was accepted, alternate caps and collars referenced to the performance targets by a demonstrated sound methodology would be required.
387. Alternate targets based on the use of the median as the average are set out in the table in the findings sub-section.
9.4.2 Loss of Supply Event Frequency Targets Adjustments
Adjustment of target for increased volume of capital works
388. Increased capital works only increases the risk of a loss of a supply event occurring if there is an increased requirement to operate the system with single contingency network configurations. Forecast increased volume of capital works is a very crude and not very accurate methodology to identify or predict this. This is particularly so when the measure of volume is by capital expenditure in total rather than by categories associated to plant groups.
389. The adjustment being sought by SP AusNet is due to the CBD rebuilds work alone. At the onsite sessions we asked SP AusNet if it expected that large volume of works for the CBD rebuilds would increase the need to operate in a single contingency network configuration. The answer was that it would not.
390. Normally, for control purposes, events that require working outside of normal security practices (ie. single contingency network configuration), are recorded. We consider that as the work and outages for the CBD rebuilds will need to be very accurately planned, therefore, a good understanding of the need, if any, to operate with single contingency network configurations would be established. Any adjustment to the target should be made by estimating the effect of the planned requirements against the average actual incidents that occurred in the past period on a year-by-year basis.
391. We do not consider the requirement for any adjustment has been adequately demonstrated or justified.
Rounding Applied to Targets
392. SP AusNet presents a case for rounding the Number of events to 0.05 system minutes based on the premise that this provides an incentive for small performance
SP AusNet Review - Final Report
Report to AER (Public) 106 August 2013
improvements. As discussed previously we propose that the median is used for the average, measure of central tendency, and to determine the targets. On this basis rounding is not required.
Assessment of Proposed Caps and Collars
393. Clause 3.2(e) of the STPIS specifies that the proposed caps and collars must be calculated by reference to the proposed performance targets and using a sound methodology. These may result in symmetric or asymmetric incentives for the TNSP.
394. As SP AusNet have not identified objectives for each target and the associated cap and collar the appropriateness of the caps and collars cannot be linked to stated objectives.
395. In the RP SP AusNet states that:
This proposal adopts caps and collars that are two standard deviations below and above the historical average respectively. However, where this methodology results in the proposed cap being an impossible outcome (for example, the number of events is less than zero), an amount equal to one standard deviation from the target is substituted.
396. Seeking to set caps and collars at plus or minus two standard deviations to the historic arithmetic mean as the performance target, as SP AusNet has done, is only applicable and a sound methodology when the historic data can be fitted to a symmetrical distribution. There is no logical basis for applying this methodology to the parameters when all have an asymmetrical (skewed) distribution.
397. We presume that the concept of seeking to set a performance target for caps and collars at plus or minus two standard deviations to the historic arithmetic mean is based on the need to capture a significantly large part of the probable outcomes and an equal number of probable outcomes on either side of the ‘target’ selected as a point of central tendency.
398. The nearest equivalent to achieving this for asymmetrical (skewed) distributions is to select the median (50th percentile) as the performance target and use the 5th and 95th percentile for the cap and collar. Our recommendations are based on this approach.
9.4.3 Network Capability Component 399. SP AusNet has proposed 16 projects totalling $4.823 million as its Network Capability
Incentive Parameter Action Plan (NCIPAP). SP AusNet is the first TNSP to utilise this new STPIS parameter.
400. We confirm that, as required the NCIPAP that SP AusNet has included in the Revenue Proposal (appendix 6B), contains a:
List of every transmission circuit and injection point on the network, and the reason for the limit for each; and
List of priority projects to be undertaken during the forthcoming regulatory control period to improve the limit of the transmission circuits and injection points listed above.

SP AusNet Review - Final Report
Report to AER (Public) 107 August 2013
401. Because AEMO plans the transmission network in Victoria, SP AusNet prepared the NCIPAP jointly with AEMO. SP AusNet has noted that; due to the limited time available to SP AusNet and AEMO to prepare the NCIPAP, the benefits analysis of the proposed priority projects will be provided by AEMO in the form of a public submission to this Revenue Proposal in May 2013.
402. As the benefits analysis is used by to prioritise the proposed projects we have limited our review to a ‘sense check’ of the NCIPAP project list and judgement on whether each appears to the fit the criteria.
403. The projects in the NCIPAP mainly address system limitations that are arising because of network configurations that are giving rise to constraints. These projects include improved switching capability, resetting protection relays and minor assert reconfigurations. There are also a number of zero cost projects for updating asset rating in the RADAR database.
404. Also included in the list is a project to upgrade the Hazelwood – Loy Yang No.1, No.2 and No.3 500kV circuit’s System Overload Control Scheme (SOC) to enable AEMO to utilise the capacity benefits available from dynamic line rating. With a price tag of $2,000 this project should deliver a high value return from this small investment.
405. Based on the information contained in Appendix 6B of the Revenue Proposal we consider all projects tin SP AusNet’s NCIPAP are compliant with the requirements and valid.
9.5 Recommendations on STPIS parameters 406. We consider that the statistical distributions used by SP AusNet are not the best
available for the intended purpose and that different distributions should be used. This view has been supported by the expert advice received from NZIER.
407. We recommend that the EMCa proposed targets and caps and collars in the following table are adopted by the AER in their draft decision.

SP AusNet Review – Final Report
Report to AER (Public) 108 August 2013
Table 23: STPIS
Source: SP AusNet (as proposed) and EMCa analysis
Parameter Sub‐Parameter PB Distribution EMCa DistributionSP AusNet
Proposed Target
EMCa Proposed
Target
SP AusNet
Proposed Cap
EMCa Proposed
Cap
SP AusNet
Proposed Collar
EMCa Proposed
Collar
Line outage – fault Log‐logistic Log‐logistic 25.9 24.9 7.9 14.8 43.9 42
Transformer outage – fault Pearson5 Inverse gamma 16.1 14.1 7.6 7.4 33.1 31.7
Reactive plant outage –
faultLog‐logistic Log‐logistic 32.5 32 19.7 23.4 45.3 43.8
Line outage – forced Pearson5 Inverse gamma 14.9 14.7 11.5 12.3 18.3 17.7
Transformer outage –
forcedWeibull Weibull 12 12.1 5.2 6.2 18.8 17.6
Reactive plant outage –
forcedRayleigh Rayleigh 14.8 13.6 7.2 3.7 30 28.3
No. events > 0.05 system
minutesNegative binomial Negative binomial 3 1 1 0 7 6
No. events > 0.30 system
minutesInteger uniform Poisson 1 1 0 0 3 2
Average Outage Duration Average Outage Duration Exponential Exponential 98 67.9 0 5 293.9 293.5
Failure of protection
systemn/a n/a n/a n/a n/a n/a n/a n/a
Material failure of SCADA Normal Poisson 1 0 0 0 3 2
Incorrect operational
isolation of primary or
secondary equipment
n/a n/a n/a n/a n/a n/a n/a n/a
Average Circuit Outage Rate
Loss of Supply Event
Frequency
Proper Operation of
Equipment
SP AusNet Review – Final Report
Report to AER (Public) 109 August 2013
Appendices
SP AusNet Review – Final Report
Report to AER (Public) 110 August 2013
Annex A: Assessment of Parsons Brinkerhoff recommendations on STPIS
410. The following paragraphs provide a summary of our assessment on each component of Parsons Brinkerhoff’s (PB) recommendations to SP AusNet.
Average outage duration
411. An exponential distribution has been recommended by PB. We consider that this recommendation is sound.
412. Whilst our analysis suggests that a ‘generalized pareto’ distribution may provide a better fit, this distribution requires the estimation of 3 parameters so does not pass our test for simplicity.
Loss of supply event frequency
No. of events > 0.05 system minutes
413. A negative binomial distribution has been recommended by PB. We consider that this recommendation is sound and one that we would most likely have recommended if in the same position as PB.
414. However, we do not agree with values calculated by PB for this distribution (using the @RISK software). The parameter values of the distribution seem to imply a distribution that accommodates values less than one, which are infeasible. Our analysis suggests a Negative Binomial distribution with parameter values p = 1.76 (2dp) and r = 0.47 (2dp). These parameter values imply a mean of 1.5 and a standard deviation of 1.7.
No. of events > 0.30 system minutes
415. A discrete (integer) uniform distribution has been recommended by PB. We consider that this is not a sound choice. The uniform distribution admits only those values within the values in the data – unless PB have specified some other number for the maximum value possible which is the only parameter needed to specify a uniform distribution. Our analysis suggests the use of the Poisson distribution is appropriate as this distribution admits values above the range found in the data. PB had also considered the binomial distribution but this requires more parameters than the Poisson distribution and additional ‘prior’ information.65The use of a Poisson distribution implies a mean (lambda) equal to 0.8 and a standard deviation of 0.9.
Average circuit outage rate
416. SP AusNet notes that the Average Circuit Outage Rate parameter is not, and should not be interpreted as, a traditional ‘Outage Rate’ measure. This is because the numerator and the denominator of the definition are expressed in different units.
417. We take the view that to express this as a percentage, as identified in the STPIS, is incorrect due to the fact that any one circuit may have one or more events on it within
65 This trade-off doesn’t matter a great deal anyway. As the number of ‘trials’ rises the binomial distribution approaches the Poisson distribution.
SP AusNet Review – Final Report
Report to AER (Public) 111 August 2013
a year. The numerator is in the unit of events per year and the denominator is the number of circuits applicable in any one year.
418. Without seeking to express as a percentage the value provides a measure or index of nominal or average events per circuit per year. In multiplying by 100 this would ‘normalise’ it to per 100 circuits; although we are not clear that brings any real benefit to it as an index or measure.
419. We consider that it could only be a percentage if the limit of events in any one year on any circuit had a ‘binary’ position of 1 or 0.
Outage rate – lines
Faults
420. The Log Logistic distribution is recommended by PB. We consider that this is a sound choice. We found candidate distributions that fit somewhat better according to our preferred measure of fit but the difference between these and the PB approach is trivial.66
Forced
421. The ‘Pearson5’ or ‘inverse gamma’ distribution is recommended by PB. We consider that this is a sound choice.
Outage rate – reactive plant
Faults
422. PB recommends the use of the Log Logistic distribution, we accept this recommendation. Our preferred measure of fit, the ‘Burnbaum Saunders’, or ‘Inverse Gaussian’ distributions, perform better but the difference is trivial.
Forced
423. A ‘Rayleigh’ distribution has been recommended by PB. We consider that this is a sound recommendation. Our analysis suggests that a ‘generalized pareto’ distribution may provide a better fit but this distribution requires the estimation of 3 parameters so is probably just ‘over-fitted’.
Outage rate – transformer
Faults
424. The ‘Pearson5’ or ‘inverse gamma’ distribution is recommended by PB. We consider that this is a sound recommendation.
Forced
425. The ‘Weibull’ distribution is recommended by PB and we accept this recommendation. Our preferred measure of fit, the ‘Extreme Value’ distribution, performs better but the difference is trivial. 66 A ‘generalized pareto’ distribution performs best according to the criterion of maximised log-likelihood – by quite some margin. However this distribution requires 3 parameters and prior information/assumptions. Other distributions also performed a little better than the log-logistic distribution, e.g. the ‘inverse Gaussian’, but the improved fit was trivial.
SP AusNet Review – Final Report
Report to AER (Public) 112 August 2013
Proper Operation of Equipment
Material Failure of SCADA
426. SP AusNet did request PB to fit a probabilistic distribution for this parameter. It would appear SP AusNet have chosen and are proposing the use of a normal distribution. We cannot understand why this distribution was chosen and have found no basis for its choice. Its use admits values below zero. Also, it is not a discrete distribution which would normally be used to describe event data.
427. We consider that in this regard the choice of distribution is not sound and should not have been considered under the methodology used by PB.
428. We recommend the use of a Poisson distribution for describing SCADA failure events.
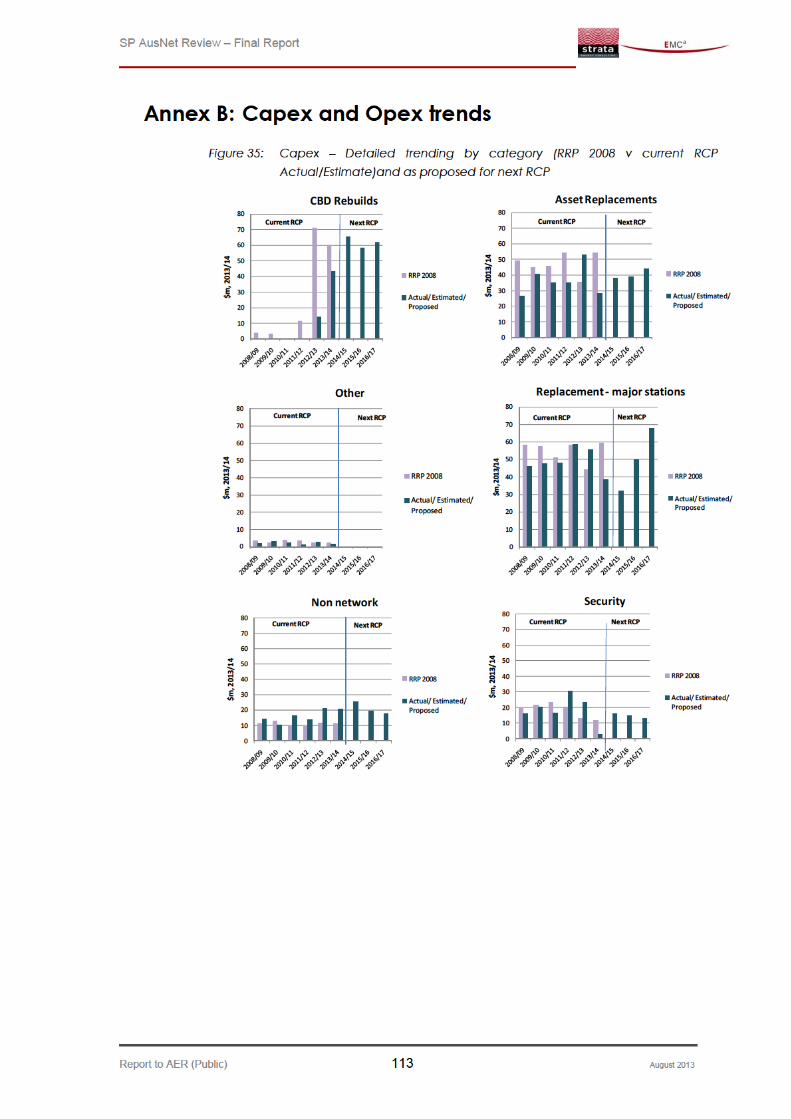


SP AusNet Review – Final Report
Report to AER (Public) 116 August 2013
Annex C: Current RCP capex project variance Table 24: Programs
Source: EMCA analysis from SP AusNet capex model
Table 25: Projects
Source: EMCa analysis from SP AusNet capex model
$m, 2013/14
Proposed cost Actual Total Variance %
EA2 response capability for primary equipment failures 9.9 2.3 7.6‐ ‐77.0%
EA5 replacement of post type CT's 28.1 18.0 10.1‐ ‐36.0%
EA6 replacement of 66 kV CB's 4.1 5.6 1.5 37.3%
EA8 Surge Arrestor replacement program 8.0 3.9 4.2‐ ‐51.8%
EA11 Response capability for Communications equipment 2.7 1.6 1.1‐ ‐40.1%
EA12 installation of OPGW 40.4 37.3 3.0‐ ‐7.5%
EA13 installation of Radio communication links 7.7 2.9 4.8‐ ‐62.7%
EA15 Oil containment at stations 14.6 11.4 3.3‐ ‐22.4%
EA16 replacement of station air conditioners 1.7 0.6 1.2‐ ‐68.0%
EA17 replacement of station hydrant systems 14.2 4.4 9.7‐ ‐68.7%
EA18 response capability for undefined works 6.8 3.2 3.6‐ ‐53.3%
EA2 response capability for lines 2.2 2.6 0.3 13.8%
EA24 replacement of insulators and fittings 34.6 34.9 0.2 0.7%
EA25 replacement of capacitor banks 6.6 1.1 5.5‐ ‐83.1%
EA25 replacement of shunt reactors 2.9 0.7 2.2‐ ‐74.4%
EA26 replacement of SVC thyristors and controls 25.0 12.0 13.0‐ ‐52.0%
EA28 synchronous condenser refurbishment 4.4 4.0 0.4‐ ‐10.1%
EA33 Fall restraints on towers 43.6 27.1 16.5‐ ‐37.9%
EA35 response capability for secondary equipment 6.5 0.1 6.4‐ ‐98.2%
EA36 replacement of station controls 10.9 15.6 4.7 43.4%
EA37 replacement of station AC&DC supplies 7.2 8.3 1.1 15.5%
EA38 replacement of station EHV protection systems 12.0 41.1 29.1 242.7%
EA39 replacement of station HV protection systems 5.4 4.4 1.0‐ ‐19.0%
EA40 replacement of energy metering 0.3 0.1 0.1‐ ‐44.0%
EA42 installation of security cameras 11.9 0.1 11.7‐ ‐98.8%
EA42 installation of station security fences 12.5 11.6 0.9‐ ‐7.3%
EA17 works to satisfy Insurance underwriters 5.8 0.8 5.1‐ ‐87.1%
EA43 replacement of transformer bushings 3.3 1.6 1.7‐ ‐52.4%
EA44 response capability for transformer failures 2.8 3.2 0.5 16.9%
EA45 replacement of station service supplies 0.7 0.5 0.1‐ ‐17.6%
EA46 transformer refurbishment 1.7 7.5 5.8 341.8%
EA47 transformer replacement 31.3 54.8 23.5 75.1%
EA42 station access control 0.0 0.2 0.2 778.4%
370.0 323.5 46.5‐ ‐12.6%
Programs
Total
$m, 2013/14
Proposed cost Actual Total Variance %
EA3 replacement of bulk oil CB's at DDTS 6.4 9.8 3.4 53.7%
EA4 Stage 2 development at HOTS 8.0 7.7 0 3‐ ‐4.3%
EA7 complete refurbishment of ROTS 13.6 11.5 2.1‐ ‐15.4%
EA10 Redevelopment of BLTS 57.2 49.8 7.4‐ ‐13.0%
EA20 Refurbishment of GTS 23.1 26.6 3 5 15.2%
EA21 Refurbishment of HWPS 42.1 20.0 22.1‐ ‐52.5%
EA22 Refurbishment of HWTS 22.7 13.5 9 2‐ ‐40.5%
EA23 Refurbishment of KTS 46.4 38.2 8 2‐ ‐17.8%
EA51 Refurbishment of MTS 1.0 2.4 1.4 147.0%
EA30 Redevelopment of RWTS 33.7 31.4 2 3‐ ‐6.9%
EA48 refurbishment of TTS 50.0 54.4 4.4 8.7%
EA19 Refurbishment of GNTS 24.0 24.6 0.6 2.5%
328.1 289.6 38.4‐ ‐11.7%
Projects
Total

SP AusNet Review – Final Report
Report to AER (Public) 117 August 2013
Table 26: Roll In/ Roll Out
Source: EMCa analysis from SP AusNet capex model
$m, 2013/14
Proposed cost Actual/
Estimate
EA1 replacement of 22 kV bays 13 3 ‐
EA9 replacement of 500 kV CB's 4 9 ‐
EA11 Installation of OPGW associated controls 0.7 ‐
EA14 Land Management 0 9 ‐
EA14 mitigation of noise from stations 0 9 ‐
EA27 replacement of reactive switchgear 1.7 ‐
EA31 upgrade station earthing installations 3.0 ‐
EA32 mitigation methods for EMF standards 2 3 ‐
EA34 management of secondary systems 10 2 7.2
EA41 replacement of station and control centre SCADA 33.6 0.1
Total 71.4 7.4
$m, 2013/14
Proposed cost Actual/
Estimate
Continuing program for communications equipment 0 4.0
BTS Rebuild 0 0.2
BATS Rebuild 0 0.6
BETS Rebuild 0 1.6
SHTS Rebuild 0 1.0
RCTS Rebuild 0 0.7
HOTS Rebuild stage 1 0 0.1
MBTS Rebuild 0 0.3
TGTS Rebuild 0 0.1
JLTS CB and CT replacements 0 0.0
HOTS Rebuild stage 2 0 ‐
Tower/Conductor replacements 0 64.4
SVTS Rebuild 0 0.0
HTS Rebuild 0 1.5
Safety Compliance 0 0.8
New category ‐ 220kv CB replacement 0 0.5
New category ‐ Oil CB Replacement Program 0 ‐
New category ‐ replacement of CTs, VTs & CVTs 0 ‐
New category ‐ Civil infrastructure 0 ‐
New category ‐ Communications safety and security 0 ‐
Total ‐ 75.9
Roll In
Roll Out

SP AusNet Review – Final Report
Report to AER (Public) 118 August 2013
Annex D: Addendum re WMTS Supplementary briefing paper on WMTS following additional information provided by SP AusNet (to 24th July 2013)
Purpose
429. The purpose of this supplementary briefing is to provide the Australian Energy Regulator (AER) with EMCa’s findings following receipt and review of additional information provided by SP AusNet in response to the AER 46 and AER 57 information requests. In particular, EMCa has been asked to advise the AER if there are any changes in the recommendations relevant to West Melbourne Terminal Station (WMTS) to that provided in EMCa’s Technical Report.
Background
430. EMCa undertook its analysis and prepared the present report in April and May 2013, and submitted its Draft to the Australian Energy Regulator (AER) on 14June 2013. The report included EMCa’s findings and recommendations on SP AusNet’s proposed rebuild of the West Melbourne Terminal Station, based on information provided in SP AusNet’s Revenue Proposal, at onsite meetings held from 18 to 21 March 2013 and in responses to subsequent information requests. Our assessment in the Technical Review is contained in section5.2.2 of the Draft Technical report
431. Following submission of the Draft of this report, SP AusNet provided additional information on 18 June and 8 July 2013 on aspects of the WMTS project. The additional information was substantial with 306 pages of documentation and two Excel workbooks contained in the following:
Response SP AER46 – WMTS Follow up (18/06/13);
BECA WMTS Options Development Report;
WMTS Planning Estimate;
AIS Top Down estimate Excel workbook;
GIS Top Down estimate Excel workbook;
Response SP AER57 – WMTS AIS GIS Follow Up (08/07/13);
West Melbourne Terminal Station Redevelopment Appraisal;
BECA Appraisal of WMTS GIS and AIS Redevelopment options;
Heatherton TS Rebuild GIS and AIS Single Line Diagrams.
432. The following sections of this briefing paper summarise EMCa’s response to the subsequent additional information provided by SP AusNet and advises changes to the conclusions that could be considered by the AER based on this information.
AIS option assessment
433. The additional information demonstrates to the assessment that SP AusNet has undertaken, of the AIS option. The options assessed include a number of AIS and AIS/GIS options and included reasonably detailed sequence diagrams sufficient to determine that AIS replacement is technically and practically achievable and the process required to undertake a like-for-like replacement in terms of technology.
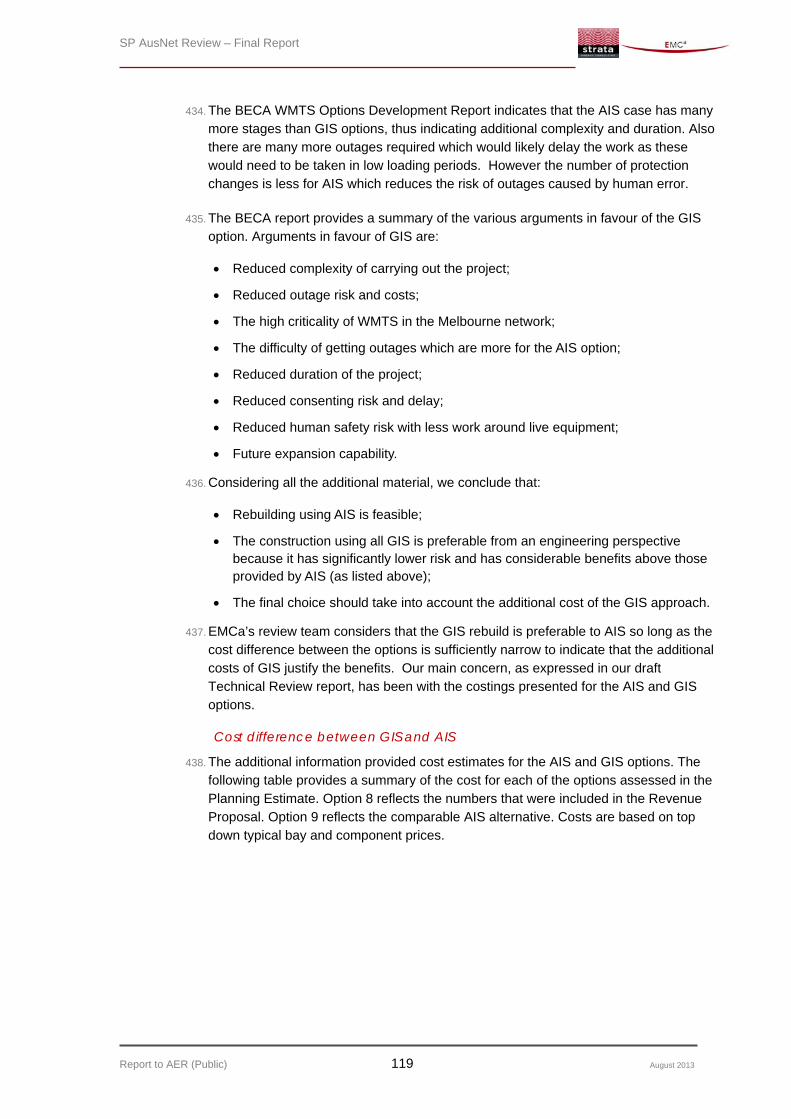
SP AusNet Review – Final Report
Report to AER (Public) 119 August 2013
434. The BECA WMTS Options Development Report indicates that the AIS case has many more stages than GIS options, thus indicating additional complexity and duration. Also there are many more outages required which would likely delay the work as these would need to be taken in low loading periods. However the number of protection changes is less for AIS which reduces the risk of outages caused by human error.
435. The BECA report provides a summary of the various arguments in favour of the GIS option. Arguments in favour of GIS are:
Reduced complexity of carrying out the project;
Reduced outage risk and costs;
The high criticality of WMTS in the Melbourne network;
The difficulty of getting outages which are more for the AIS option;
Reduced duration of the project;
Reduced consenting risk and delay;
Reduced human safety risk with less work around live equipment;
Future expansion capability.
436. Considering all the additional material, we conclude that:
Rebuilding using AIS is feasible;
The construction using all GIS is preferable from an engineering perspective because it has significantly lower risk and has considerable benefits above those provided by AIS (as listed above);
The final choice should take into account the additional cost of the GIS approach.
437. EMCa’s review team considers that the GIS rebuild is preferable to AIS so long as the cost difference between the options is sufficiently narrow to indicate that the additional costs of GIS justify the benefits. Our main concern, as expressed in our draft Technical Review report, has been with the costings presented for the AIS and GIS options.
Cost difference between GIS and AIS
438. The additional information provided cost estimates for the AIS and GIS options. The following table provides a summary of the cost for each of the options assessed in the Planning Estimate. Option 8 reflects the numbers that were included in the Revenue Proposal. Option 9 reflects the comparable AIS alternative. Costs are based on top down typical bay and component prices.
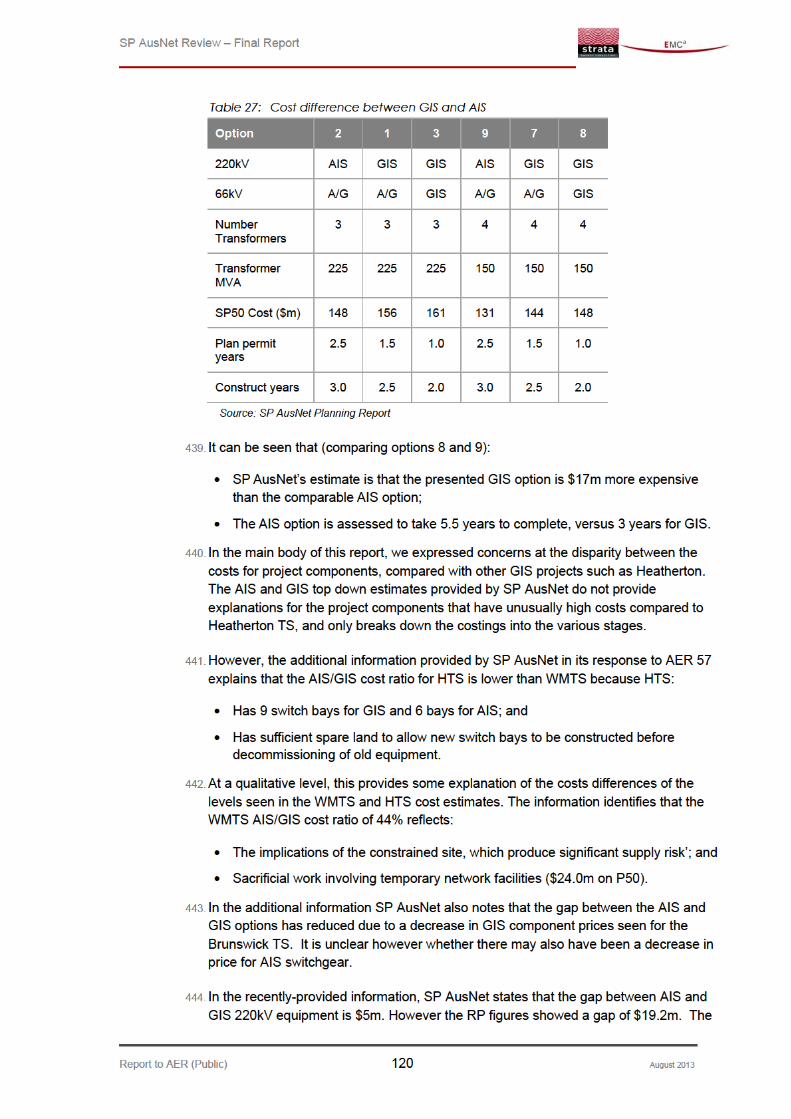

SP AusNet Review – Final Report
Report to AER (Public) 121 August 2013
reduction from $19.2m to $5m, then should reflect into the RP numbers, i.e. it implies a saving of $14.2m for the GIS option. On this basis GIS would be only around $3m more than AIS and, if these estimates could be relied on, then the advantages of GIS would seem to outweigh this small cost premium. However the continual shifting of these numbers leaves us with little confidence in the reasonableness of these estimates for the purposes of the revenue determination.
445. We also have remaining concerns regarding the AIS estimates, for example the costs of the sacrificial work and temporary network facilities and risk related components appear to be unduly high and do not reflect any recovery or reuse of materials
Revised findings and recommendations
446. Following review of the additional information, EMCa:
Supports the redevelopment of the WMTS due to age and condition of most of the equipment;
Considers that there are benefits provided by GIS rebuild above those provided by AIS;
Finds that the cost difference between AIS and GIS has not been clearly established, therefore it is unclear whether the extra cost of GIS is sufficiently low as to justify the benefits provided by GIS;
Considers that the cost estimate in the RP for a GIS rebuild should be reduced by $14.2m;
Reconfirms that for the purposes of the pricing decision, the redevelopment project should be assumed to be deferred by one year to provide a more gradual build-up of activity of the WMTS project following the RTS project.
447. EMCa considers that resolution of a reasonable cost for this project will require the AER to have sufficient opportunity to review the basis for the cost estimates for the respective AIS and GIS options, with a satisfactory reconciliation of the differences. This review should include comparisons with cost estimation assumptions for other AIS and GIS projects.
SP AusNet Review – Final Report
Report to AER (Public) 122 August 2013
Annex E: Resumes Paul Sell
Paul Sell is an energy economist, specialising in energy markets and market reforms. He has over 30 years’ experience, which includes providing major advice on restructuring, on deregulation, on the design and implementation of electricity and gas markets and on network regulatory arrangements in Australasia. He has worked extensively with energy utilities, governments, energy regulators and energy market agencies.
Career summary Managing Director of Energy Market Consulting associates (EMCa), Sydney,
NSW
Vice President of Cap Gemini Ernst & Young, Global Services Unit (GSU), Sydney, NSW
Partner of Ernst & Young Consulting, based in Sydney, NSW
Consultant/Manager/Senior Manager/Principal of Ernst & Young Consulting , Wellington, New Zealand
Economist in NZ Ministry of Energy, Planning and Forecasting Division Wellington, New Zealand
Expertise Electricity and gas utility network pricing, regulation and associated cost analysis
Energy utility analyses including investment decisions and investment justification processes, energy forecasting and planning studies, and business modelling
Electricity and gas wholesale markets design and operations
Energy utility sector reform, restructuring and deregulation policies
Retail competition in energy markets

SP AusNet Review – Final Report
Report to AER (Public) 123 August 2013
Bill Heaps
Bill Heaps is Managing Director of Strata Energy Consulting Limited. He has over 30 years’ experience in electricity utility engineering, management and consulting roles.
Bill is an electrical engineer with senior management experience in energy utilisation, distribution, retail, transmission and power generation. He has recently held three influential advisory group chairmanship roles for the New Zealand Electricity Commission and currently chairs the Investment Advisory Group for the Electricity Authority. Bill has also been Director of Orion Group Limited, one of New Zealand’s largest electricity distribution businesses.
Career summary Managing director of Strata Energy Consulting
General Manager (Commercial Services) at Transpower, New Zealand’s electricity transmission and system operating company
General Manager (Geothermal) of the Electricity Corporation of New Zealand (ECNZ)
General Manager Energy Brokers New Zealand
Expertise Wholesale electricity market – Expertise in the design, governance, regulation
and operation of electricity markets
Electricity Generation – experienced in power generation plant management and investment planning
Electricity transmission networks – experienced in the provision of transmission services, including pricing and revenue, contracts, asset management systems and performance
Electricity distribution – Experienced in distribution company governance, strategy and policy development and distribution business processes
Retail electricity markets – Expertise in retail market design and operation, including market processes, price risk management, metering, reconciliation and information systems regulation, rules and governance
Electricity Utilisation – experienced in the use of load management techniques in major industrial manufacturing plants and commercial buildings

SP AusNet Review – Final Report
Report to AER (Public) 124 August 2013
Stephen Lewis
Stephen Lewis is an electrical engineer who has over 30 years of electricity supply industry experience. His previous career with National Grid plc spanned the UK, the USA, Australia and South America.
Stephen is currently a Director of MainPower New Zealand Ltd., and a Trustee and Chair of Community Energy Action.
Up until August 2006, Stephen was the Commercial Director for National Grid Australia during the final stages of the Basslink HVDC interconnector project between Tasmania and Victoria. Prior to this, Stephen was a Vice President of National Grid USA and headed the transmission business covering the New England and New York states.
Career summary Associate consultant with Strata Energy Consulting
Director of MainPower New Zealand Ltd
Trustee and Chair of Community Energy Action
Commercial Director for National Grid Australia
Vice President of National Grid USA
Expertise Electricity transmission – Experienced in transmission governance, business
management systems and operations, mergers and acquisitions, asset management and integration of processes and systems
Electricity distribution – Experienced in distribution company governance, strategy and policy development and distribution business processes
SP AusNet Review – Final Report
Report to AER (Public) 125 August 2013
Dave Frow
Dave Frow is a former Chief Executive Officer of the Electricity Corporation of New Zealand (ECNZ), with seven years’ experience in this role which included responsibility for electricity transmission. Dave steered the company through the period of industry structural and market reform, to the creation of the separate transmission company and competitive electricity generation companies. Dave is former Chairman of Transpower (New Zealand’s national electricity transmission company), a former Director of Unison Networks Ltd (an electricity distribution company) and former Director of ETEL Ltd (providing electrical transformers).
Dave has provided international strategic management consulting advice in a range of industries, including postal, harbours, electricity and manufacturing.
Dave holds a degree in engineering from the University of Natal South Africa and is a graduate of the Harvard Business School Advanced Management Programme. He is a fellow of the Institute of Professional Engineers (IPENZ).
Career summary Chief Executive Officer of the Electricity Corporation of New Zealand (ECNZ)
Chairman of Transpower
Director of Unison Networks Ltd
Director of ETEL Ltd
Expertise International strategic management consulting advice in a range of industries,
including postal, harbours, electricity and manufacturing.

SP AusNet Review – Final Report
Report to AER (Public) 126 August 2013
Mark de Laeter
Mark de Laeter is an electrical engineer with 30 years’ experience in all aspects of the electricity industry, ranging from executive to line management positions in Western Power, a Top 500 Australian company with over 5,000 personnel.
Mark is a Senior Associate of EMCa, and is based in Perth.
Career Summary (all at Western Power) General Manager Networks at Western Power, the government trading enterprise
responsible for managing the distribution and transmission network in the south west of Western Australia.
General Manager Customer Service which, in addition to his responsibilities as the GM Networks, included accountability for all service offerings to Western Power’s 1 million customers and for engineering design
General Manager Asset Management – transmission & distribution
Manager Asset Integration - responsible for transmission asset management, engineering design, and project management
Manager Regional Power Procurement - securing Power Purchase Agreements with private generators
Construction Services Manager – responsible for transmission substation and line construction and maintenance
Expertise Electricity transmission and distribution planning
Electricity network access
Asset management practices
Project management
Advanced metering infrastructure
Electricity operations management
Customer service and community engagement

SP AusNet Review – Final Report
Report to AER (Public) 127 August 2013
Choon Yen Chee – Research analyst
Choon Yen Chee is an analyst and qualified accountant. He has experience with preparing cost/benefits models and regulatory cost projection models, including for the Victorian smart metering program, for electricity networks’ technical reviews and demand forecast reviews. In this role he collated data from information provided by the utilities, prepared spreadsheet models, audited models prepared by others, prepared graphs and tables for reporting purposes and audited data within reports.
Career Summary
Choon Yen is a Research Analyst with EMCa. He began his career as an external auditor with Deloitte Malaysia.
Expertise Financial auditing
Electricity cost analysis, pricing and regulation
Modelling of electricity utility budgets and regulatory revenue allowances
SP AusNet Review – Final Report
Report to AER (Public) 128 August 2013
Glossary