public private partnerships in healthcare. evaluation of 10 years´ experience in spain
TRANSCRIPT

Ph.D. Program in Business Administration
27th October 2014
Public-Private Partnerships in Healthcare. Evaluation of 10 years’ experiencein Spain.
Doctoral ThesisAntonio Clemente
Directors:
David Vivas Maria CaballerISBN: 978-84-606-8865-5
Doc
tora
l The
sis:
Pub
lic-P
riva
te P
artn
ersh
ips
in H
ealt
hcar
e. E
valu
atio
n of
10
year
s’ e
xper
ienc
e in
Spa
in. A
nton
io C
lem
ente

VALENCIA POLYTECHNIC UNIVERSITY
PhD in Business Administration
Public-Private Partnerships in Healthcare. Evaluation of 10 years’ experience in Spain
Author: Antonio Clemente
Directors: PhD. María Caballer
PhD. David Vivas
October, 2014
1

To my parents and brother for their constant encouragement and unconditional support to all my projects.
To my uncle Jose María for his charisma and particular way of seeing life.
To my Coach for his advice and, above all, for his trust in me.
To Jorge and my colleagues at Marina Salud because they gave me
the opportunity to develop the necessary tools to conduct this study.
Dénia has always been, is, and will, be my school in healthcare management.
To my directors María and David for their patience and devotion to this study.
2

INDEX
3

INDEX
INDEX 3
ABSTRACT 13
1. INTRODUCTION AND OBJECTIVES 18
1. Introduction 19
1.2 Research objectives 23
1.2.1 General objective 23
1.2.2 Specific objectives 23
2. BACKGROUND 25
2.1 Spanish healthcare context 26
2.2 Healthcare context in the Valencia region 302.2.1 The Alzira model 33
2.2.1.1 Basic concepts of the Alzira model 38
2.2.1.2 The beginnings of the Alzira model: La Ribera Hospital 43
2.3 A review of the literature on healthcare service assessments 45
2.3.1 Concept and measurement techniques of efficiency in the hospital industry 47
2.3.2 Efficiency analysis method 49
2.3.2.1 Multivariate methods 502.3.2.2 Non-stochastic methods 52
2.3.3 Hierarchical analysis. Clusters 57
2.3.4 Diagnosis related groups (DRGs) 592.3.4.1 Origin of the DRGs 60
4

INDEX
2.3.4.2 Development of the DRGs 61
2.3.4.3 The weightings of the DRG 61
2.3.4.4 The "product" that a hospital provides 64
2.3.5 Public-private collaboration experience in healthcare 66
3. ASSUMPTIONS AND INFORMATION SOURCES 73
3.1 Assumptions for the study 74
3.2 Information sources 74
3.2.1 Sources of economic information 77
3.2.2 Quality information sources 82
3.2.3 Information sources for the healthcare production 84
3.3 Indicators and variables used 87
3.3.1 Economic or cost variables 87
3.2.2 Quality variables 913.2.2.1 Quality indicators 92
3.2.2.2 Delay indicators 93
3.2.2.3 Qualitative economic indicators 97
3.2.2.4 Healthcare process indicators 97
3.2.2.5 Public health indicators 99
3.2.2.6 Safety indicators 100
3.2.3 Structural variables 102
3.2.4 Variables in healthcare activity 106
5
INDEX
3.3. Cost breakdown method 110
4. RESULTS 113
4.1 Cost analysis 114
4.1.1 Main healthcare indicators 114
4.1.2 Cluster analysis 118
4.1.3 Overall hospital costs in the Valencia region 120
4.1.4 Cost per equivalent patient and area 122
4.1.5 Healthcare production in equivalent patients by area 130
4.1.6 Assessment of the activity through an adjusted cost-production analysis 137
4.2 Analysis of the healthcare quality 143
4.2.1 Quality Analysis in Emergency Department 145
4.2.2 Quality analysis in the surgical area 148
4.2.3 Quality Analysis in the outpatient area. 151
4.3 Analysis of the healthcare activity 154
4.3.1 Overall healthcare production 155
4.3.2 Healthcare production in the medical area 159
4.3.3 Healthcare production in the surgical area 162
4.3.4 Healthcare production in outpatient services 166
4.3.5 Healthcare production in the emergency department 169
4.4 Study of the effect of the management model 172
6

INDEX
4.4.1 Total differences 172
4.5 Assessment of the efficiency between the PPP and the directly managed hospitals 177
4.5.1 Overall efficiency 177
4.5.2 Efficiency in the medical area 182
4.5.3 Efficiency in the surgical area 186
4.5.4 Efficiency in the outpatient service area 190
4.5.5 Efficiency in the emergency department area 194
5. DISCUSSION 199
5.1 Contribution to knowledge and new lines of research 221
6. CONCLUSIONS 224
7. BIBLIOGRAPHY 234
8. ANNEXES 249
7
TABLE INDEX
Table 1. Global competitiveness index 27
Table 2. Total budget and spending in Spain (million euros) 28Table 3. Healthcare budget per capita in 2003-2012 31
Table 4. Population in the Valencia region 32Table 5. Overall budget for the Valencia region and budget for its Health
Department. 34Table 6. Main direct expense items for H10 90
Table 7. Equivalency of the processes to calculate the equivalent patients121
Table 8. Main hospital activity indicators in 2010 115Table 9. Main indicators of ambulatory production in 2010 117
Table 10. Relative position of the Management Agreements in 2010 144Table 11. Results of the overall analysis using the general linear regression
model. 158Table 12. Results of the general linear regression analysis in the medical
area 161Table 13. Results of the general linear regression analysis in the surgical
area 165Table 14. Results of the general linear regression analysis in the outpatient
service area 168Table 15. Results of the general linear regression analysis in the emergency
department area 171Table 16. Statistics for the mean difference 173
Table 17. Results of the Mann-Whitney test 174Table 18. Variables selected for the overall efficiency analysis 178
Table 19. Score overall efficiency 180Table 20. Overall efficiency score for cluster 1 181
Table 21. Overall efficiency score for cluster 2 182
8

TABLE INDEX
183
184185
186187
188189
190191
192193
194
195196
197
Table 22. The variables selected for analyzing the medical area
Table 23. Inpatient efficiency score
Table 24. Efficiency score in the inpatient area for Cluster 1
Table 25. Efficiency score in the inpatient area for cluster 2
Table 26. The variables selected for analyzing the surgical area
Table 27. Efficiency score in the surgical area
Table 28. Efficiency score in the surgical area for cluster 1
Table 29. Efficiency score in the surgical area for cluster 2
Table 30. The variables selected for analyzing the outpatient area
Table 31. Efficiency score in the outpatient service area
Table 32. Efficiency score in the outpatient area for cluster 1
Table 33. Efficiency score in the outpatient service area for cluster 2
Table 34. The variables selected for analyzing the emergency department
area
Table 35. Efficiency score in the emergency department area
Table 36. Efficiency score in the emergency area for cluster 1
Table 37. Efficiency score in the emergency department area for cluster 2
9
198

GRAPHIC INDEX
Graphic 1. Healthcare spending as a percentage of GDP in 2007 22
Graphic 2. Healthcare spending by source and funding in 2013 29
Graphic 3. Public healthcare spending breakdown in 2012 30
Graphic 4. Population pyramid in the Valencian region in 2010 33
Graphic 5. Population breakdown by healthcare district 36
Graphic 6 Healthcare concessions in Spain 37
Graphic 7. Main principles of the Alzira Model 39
Graphic 8. Characteristics and correction factors of the per capita funding system 41
Graphic 9. Dendogram showing the clusters 119
Graphic 10. Overall direct cost per hospital in 2010 (in millions of euros)121
Graphic 11. Cost per equivalent patient in inpatient care area in 2010123
Graphic 12. Cost per equivalent patient in the surgical area in 2010126
Graphic 13. Cost per equivalent patient in the outpatient service area in 2010127
Graphic 14. Cost per equivalent patient in the emergency department area in 2010 129
Graphic 15. Equivalent patients in the medical and surgical area en el área in Cluster 1 131
Graphic 16. Equivalent patients in the outpatient service area in cluster 1132
Graphic 17. Equivalent patients in the Emergency department in Cluster 1 133
Graphic 18. Equivalent patients in the medical and surgical area in Cluster 2 134
10

GRAPHIC INDEX
Graphic 19. Equivalent patients in the outpatient service area in Cluster 2 135
Graphic 20. Equivalent patients in the Emergency department in Cluster 2 136
Graphic 21. Cost of the surgical and medical area compared to the equivalent patients 138
Graphic 22. Inpatient cost compared with the equivalent patients 140
Graphic 23. Cost of operating rooms compared with the equivalent patients142
Graphic 24. Quality analysis in the emergency department 146
Graphic 25. Quality analysis in the surgical area 149
Graphic 26. Quality analysis in the outpatient area 152
Graphic 27. Linear regression analysis of the cost and overall equivalent patients 156
Graphic 28. Linear regression of the cost and equivalent patients in the medical area 160
Graphic 29. Linear regression of the cost and equivalent patients in the surgical area 163
Graphic 30. Linear regression of the cost and equivalent patients in the outpatients area 167
Graphic 31. Linear regression of the cost and equivalent patients in the emergency department area 170
Graphic 32. Adjusted cost per capita in the Valencia region 211
11

ABSTRACT
ABSTRACT
12

ABSTRACT
Public- Private Partnerships in Healthcare. Evaluation of 10 years’
experience in Spain
Health is one of the fundamental human rights, which is included in
the World Health Organization's Constitution of July 1946:
• The enjoyment of the highest attainable standard of health is one
of the fundamental rights of every human being.
• The right to health includes access to timely, acceptable, and
affordable health care of appropriate quality.
• The right to health means that every country must generate
conditions in which everyone can be as healthy as possible.
Healthcare is also one of the fundamental mainstays of the welfare
state in developed countries. Citizens' health is an essential objective
of each country, although it requires special attention and analysis
from an economic standpoint to ensure universal access and
sustainability.
In the last decade, healthcare management options different to the
conventional ones have been developed with the aim of ensuring
good healthcare quality and optimizing public resource utilization.
Among these options, one of the models that has attracted greater
interest in Spain is the administrative concession or Public Private
Partnership (from now on PPP) .
13

ABSTRACT
The first hospital in Spain to operate under the administrative
concession was in Alzira (Valencia), after the Valencia regional
government approved Law 15/1997 of 25 April, which enabled new
forms of management. Therefore, it is a public hospital that is
managed by a private company and provides specialist and primary
healthcare to a reference population through an economic
agreement, that establishes a fixed fee for each allocated patient,
undertaking to make the necessary investments in infrastructure and
equipment.
Control methods were jointly established with the Administration in
terms of compensation payments regarding the patients treated
outside the concession and those who are cared for without belonging
to it.
This model was later extended to a total of five districts in the
Valencia region and implemented in other regions under the name of
the "Alzira Model”.
Objec&ve
This PhD dissertation is aimed at analyzing the influence of the
health management model (direct management or PPP) in terms of
economic efficiency and healthcare quality.
14
ABSTRACT
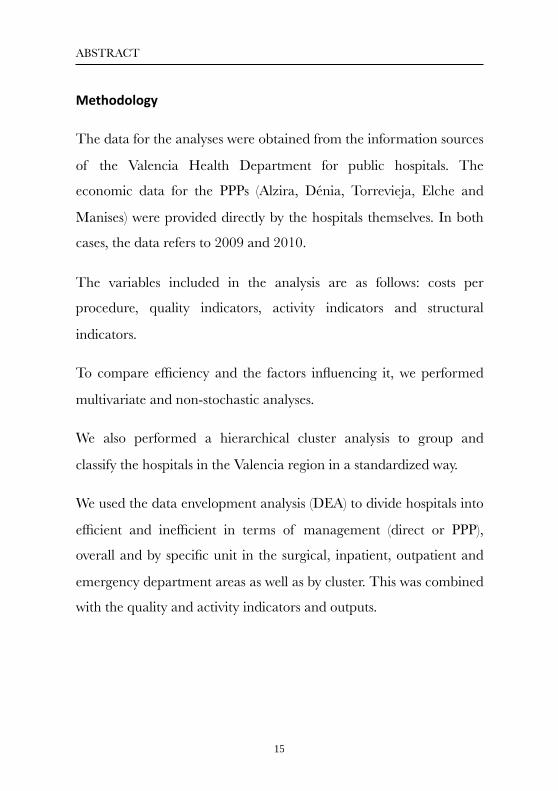
Methodology
The data for the analyses were obtained from the information sources
of the Valencia Health Department for public hospitals. The
economic data for the PPPs (Alzira, Dénia, Torrevieja, Elche and
Manises) were provided directly by the hospitals themselves. In both
cases, the data refers to 2009 and 2010.
The variables included in the analysis are as follows: costs per
procedure, quality indicators, activity indicators and structural
indicators.
To compare efficiency and the factors influencing it, we performed
multivariate and non-stochastic analyses.
We also performed a hierarchical cluster analysis to group and
classify the hospitals in the Valencia region in a standardized way.
We used the data envelopment analysis (DEA) to divide hospitals into
efficient and inefficient in terms of management (direct or PPP),
overall and by specific unit in the surgical, inpatient, outpatient and
emergency department areas as well as by cluster. This was combined
with the quality and activity indicators and outputs.
15

ABSTRACT
Results
We obtained the following results in the study:
- The fact of being a hospital run by a PPP implies that they have a
lower cost than the rest of the other hospitals in the sample.
- The cost analysis by patient, adjusted for the case mix, shows that
the PPPs have lower than average costs in the surgical and outpatient
service areas. In the inpatient area, the PPPs have higher than
average costs, but all of them were considered efficient in the DEA
when quality indicators where included.
- In the emergency department area, one of the analyzed PPPs has
higher than average costs. These results were significant in the
regression analysis.
- The PPPs scored better in the quality indicators that were analyzed.
- In the overall DEA, two of the three PPPs obtained maximum
efficiency. Nine of the nineteen directly managed hospitals that were
analyzed achieved this level.
Conclusions
The performance and efficiency analyses show that the group of
PPPs outperformed the average for the directly managed hospitals,
but they were not always better.
16

ABSTRACT
The results of this dissertation will provide a sound basis for the
future research of economic assessments for healthcare management.
Nevertheless, new studies should be conducted that include a larger
number of hospitals which use the public-private collaboration
model.
17

1. INTRODUCTION
AND OBJECTIVES
18

CHAPTER 1 INTRODUCTION AND OBJECTIVES
1. Introduction
Healthcare is one of the most complex and dynamic industries in our
society. Its function is to look after individuals' health in an
increasingly complex situation as a result of users' growing demands,
social pressure, high-cost technology and scientific advances, plus
highly qualified professionals who constantly refresh and update
themselves. Healthcare accounts for 8% of the world GDP (Spanish
Health Ministry, 2008).
In the European Union, the public healthcare systems are
characterized by the following:
- Universal coverage for the population through social security systems.
- Funding through the taxes accrued based on income.
- Coverage of hospital and pharmacy benefits through prescriptions.
- Control tools to maintain the system's sustainability.
Healthcare is one of the most complex and dynamic industries in our
society since it looks after our most valuable possession: our health.
Two forms of funding coexist in Europe: the Bismarck model (funded
with the social security system) and the Beveridge models funded by
taxes, as in the case of the Spanish National Health Service (Freire,
2006).
19

CHAPTER 1 INTRODUCTION AND OBJECTIVES
As a result of financial austerity and an ever-increasing demand for
resources, the world's healthcare organizations and systems are
currently facing a major challenge (Walshe and Smith, 2011).
Evans (2005) drafted three basic fundamental questions which should
lead to healthcare reform and, therefore, to a possible change in the
management model.
1. Who funds healthcare and how much does it cost?
2. Who receives healthcare, what type of healthcare is received, when
should it be received and who is responsible for providing it?
3. Who gets paid for providing the service and how much?
Evans suggests that the conflict between the healthcare stakeholders
is usually because of their different views on how to answer such
questions.
Healthcare users, regardless of how they are called (patients,
consumers or customers), cannot be compared to consumers of other
public services or to clients of a service provided by a private
company:
Firstly, because the existing information between patients and
healthcare providers is asymmetrical; very few patients can contradict
20

CHAPTER 1 INTRODUCTION AND OBJECTIVES
a doctor's recommendation or treatment, no matter how qualified or
informed they are.
Secondly, patients are generally emotionally vulnerable, so they are
unlikely to act independently or assertively, which is usually the case
in other public or private services.
Therefore, the healthcare organizations and their managers have an
additional responsibility to offset the unequal situation of the patients
being cared for in the health system since, in the end, all the
hospitals, whether they are public, private or administrative
concessions, share the same concern about their wellbeing.
These are clearly changing times in the world healthcare scenario,
where it will be necessary to innovate and implement new resource
management methods (Drucker, 2006). In some countries, the
governments have recently increased their control, as in the case of
Mexico and Colombia, which have implemented a social security
system (Guerrero et al., 2011).
21

CHAPTER 1 INTRODUCTION AND OBJECTIVES
Graphic 1. Healthcare spending as a percentage of GDP in 2007
Source: Spanish Healthcare Ministry, 2008
Graphic 1 shows the breakdown of healthcare spending as a
percentage of GDP in the OECD countries in 2007, based on
whether it is funded by the public or private system. The main
feature is the weighting of public funding in all the countries, even in
the United States.
22

CHAPTER 1 INTRODUCTION AND OBJECTIVES
1.2 Research objectives
1.2.1 General objective
The main objective of this PhD dissertation is to analyze and
compare the influence of the public or direct healthcare
management model with the public-private partnerships from the
standpoint of healthcare quality and economic efficiency.
1.2.2 Specific objectives
1. Analyze the existing literature in Spain and abroad with the aim of
identifying the main specific variables for benchmarking.
2. Select the most significant variables for constructing indicators
with the aim of measuring the efficiency and quality of healthcare
organizations.
3. Allocate a standard measurement with the aim of comparing the
hospitals and the cost breakdown.
4. Group the hospitals based on their structural resources and
healthcare production capacity.
5. Find the variables to explain the cost for each hospital area by
using a regression analysis.
23

CHAPTER 1 INTRODUCTION AND OBJECTIVES
6. Rank the relative efficiency of the hospitals and management
models based on this study.
24

CHAPTER 1 INTRODUCTION AND OBJECTIVES
2. BACKGROUND
25

CHAPTER 2 BACKGROUND
2.1 Spanish healthcare context
Spain is currently in a critical economic context due to record
unemployment rates. As a result of this, plus an increase in life
expectancy (boosting the number of pensioners) and the excessively
large amount of civil servants (inherited from past economic booms),
the Administrations' current expenses are substantially higher than
their revenues (Arenas, 2013).
These factors have created a considerable budgetary tension and, as a
result, the regional policies prioritize the spending allocated to
maintaining the services rather than investing in infrastructure. As a
direct consequence, Spain has fallen considerably in the global
competitiveness index drafted by the World Economic Forum (2013),
as shown in table 1.
This chapter reviews the healthcare's economic aggregates within the
nationwide and regional context in Spain. It also summarizes the main
characteristics of the public-private partnership agreements. Lastly, it shows the
main Spanish and foreign contributions to healthcare service assessments.
26

CHAPTER 2 BACKGROUND
Table 1. Global competitiveness index
Source: Schwab in the World Economic Forum, 2013.
As can be seen, Spain dropped 20 places in this index. In 2002, it was
ranked 22nd, higher than countries like France, while in 2010, it fell to
42nd.
This loss of competitiveness could jeopardize some of the
cornerstones of the welfare state: pensions, education, social services
and healthcare (Ochando, 2009).
Therefore, it is logical that one of the main debates right now is how
to cope with the growing healthcare spending (Table 2) while
establishing the necessary measures to control resource utilization,
which is somehow not being materialized but cannot be deferred any
longer.
Country/
Year2002 2007 2009 2010
USA 1 1 2 4
UK 11 12 12 12
Germany 14 7 7 5
Spain 22 29 29 42
France 30 16 16 15
Italy 39 49 49 48
27

CHAPTER 2 BACKGROUND
Table 2. Total budget and spending in Spain (million euros)
Source: the author, based on Arenas et al. (2013) and Informe Nacional de Salud 2012
Nevertheless, despite the economic situation, the Spanish healthcare
system is still considered to be one of the best in the world. This is
evidenced in the studies by Gay et al. (2011), which analyze avoidable
mortality, where Spain is ranked among the top. It is considered to be
the reference indicator for healthcare quality (Nolte and McKee,
2008).
Therefore, we believe that it would be interesting to quantify (broadly
speaking) healthcare in Spain firstly and then in the Valencia region,
so that we are aware of the magnitude and need to implement
measures to improve the system's management and efficiency.
Year Budget Total spending
Absolute deficit
Deficit (%)
2007 52,383 64,339 11,956 22.82
2008 56,559 71,170 14,611 25.74
2009 58,960 75,395 16,435 27.87
2010 59,738 74,732 14,956 25.10
Total 227,640 285,636 57,996 25.48
28

CHAPTER 2 BACKGROUND
In 2010, the Spanish Federation of Associations for the Defense of
Public Health highlighted the difficulty in maintaining annual
increases of 10% in the government healthcare budgets (Federation
of Associations for the Defense of Public Healthcare, 2010).
According to García et al. (2010), healthcare spending is funded
mainly by government taxes, as can be seen in the healthcare
spending breakdown by source in 2013 (Graphic 2), where 71% is
used mainly for the headings stated in the preceding paragraph and
for medicines.
Graphic 2. Healthcare spending by source and funding in 2013
Source: Spanish Ministry of Health, Equality and Social Affairs,2013. .
Other9%
Pharmacy20%
Primary Care16%
Specialized care55%
Copayment23%
Insurance6%
Taxes72%
29

CHAPTER 2 BACKGROUND
2.2 Healthcare context in the Valencia
region
Graphic 3 shows the healthcare spending (5.49 billion euros)
breakdown by source in 2012, where the main headings are staff and
pharmacy expenses, in terms of both hospitals and prescriptions.
Graphic 3. Public healthcare spending breakdown in 2012
Source: the author, based on the Valencia Health Department's budget for 2012..
8%8%
7%
15%
4%11%
47%
Staff PPP ProstheticsHospital pharmacy Pharmacy prescriptions Healthcare materialsGeneral expenses
30

CHAPTER 2 BACKGROUND
As can be seen in table 3, all the regions increased their healthcare
budget per capita in the 2003-2012 period, although there are
differences among them.
In 2012, the Valencia region had the lowest healthcare budget per
capita (1,110 euros) in Spain, i.e. 52% lower than Extremadura, the
region with the highest (1,692 euros).
Table 3. Healthcare budget per capita in 2003-2012
Source: the author, based on the Spanish Ministry of Healthcare, Equality and Social Services, 2012
Some factors had a strong impact on the increase in healthcare
spending in the Valencia region:
• The 25.52% growth in the registered population between
1999 and 2013 (Table 4).
31

CHAPTER 2 BACKGROUND
Table 4. Population in the Valencia region
Source: the author, based on the NaKonal StaKsKcs InsKtute, 2013.
• A change in the demand structure: the ageing of the Spanish
and registered foreign population (graphic 4) plus an increase
in chronic diseases have had a direct impact on healthcare
spending. Also, as a result of the access to healthcare
information, patients now demand more from their doctors
than ever before.
32

CHAPTER 2 BACKGROUND
Graphic 4. Population pyramid in the Valencia region in 2010
Source: Valencia Region Healthcare Plan through the PopulaKon InformaKon System (SIP) data, 2013
In 2010, healthcare spending amounted to 5.72 billion euros in the
Valencia regional government's budget (39.7% of the total). Despite
the overall reduction in the regional government's budget, the
percentage for healthcare has remained stable at around 40% since
2007 (Table 5).
Spanish males Spanish females Foreign femalesForeign males
33

CHAPTER 2 BACKGROUND
Table 5. Overall budget for the Valencia region and budget for its Health Department.
Source: Valencia Regional Budget Act, 2012
The current funding system has not yet implemented any changes to
offset this situation: users maintain their status without contributing
their part to the service provided, and demand is higher than if it
were regulated by market forces. As a result of the imbalance
between supply and demand, there is a delay in the medical
treatment given to users.
Most of the public healthcare services are supplied by the institutions,
whose political responsibility depends on the elections, so the
decisions are usually very biased.
With the aim of improving the healthcare services' economic
efficiency without jeopardizing their quality, an innovative public-
2007 2008 2009 2010 2011 2012
Valencian Regional Budget
12.893 13.828 14.286 14.392 13.713 12.784
Healthcare Budget 5.089 5.454 5.659 5.720 5.515 5.492
Healthcare as a % of the total regional budget
39,4% 39,5% 39,6% 39,7% 40,2% 39,9%
34

CHAPTER 2 BACKGROUND
private partnership plan was implemented in 1997 both in the
Valencia region and in the rest of Spain.
2.2.1 The Alzira model
The Abril Report (Abril Martorell, 1991) analyzes the National
Health System's challenges and proposes ways in which to make the
system more viable and efficient in the future. The report provides a
novel concept: it separates healthcare funding from the service
provision.
The Valencia regional government culminated the legal reform
process that began with Law 15/1997 of 25 April on new forms of
management, which "opens up the healthcare services with any legal
form allowed by law". As a result of this law, the first hospital was
created under an administrative concession in Spain in 1999: La
Ribera Hospital.
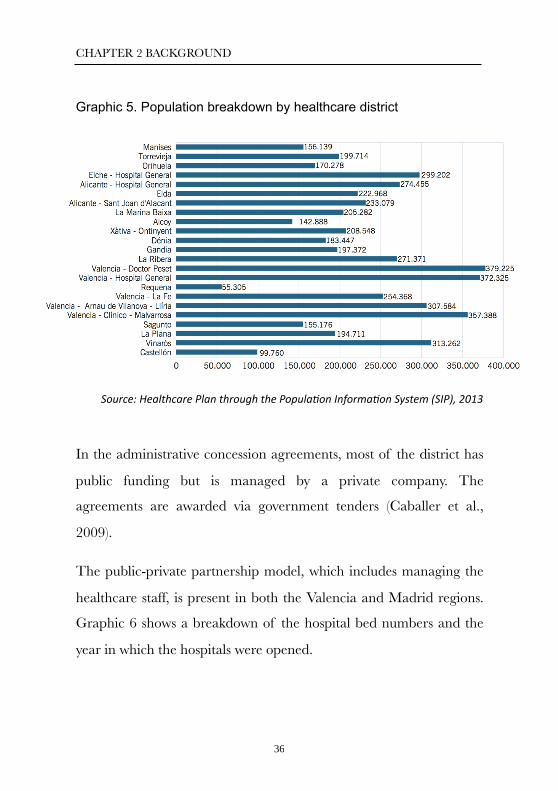
At present, five healthcare districts are partially operated by private
insurance companies under the so-called "administrative concession",
which handles approximately 20% of the Valencia region's
population, as can be seen in graphic 5, which shows the number of
reference patients by healthcare district.
35
CHAPTER 2 BACKGROUND
Graphic 5. Population breakdown by healthcare district
Source: Healthcare Plan through the PopulaKon InformaKon System (SIP), 2013
In the administrative concession agreements, most of the district has
public funding but is managed by a private company. The
agreements are awarded via government tenders (Caballer et al.,
2009).
The public-private partnership model, which includes managing the
healthcare staff, is present in both the Valencia and Madrid regions.
Graphic 6 shows a breakdown of the hospital bed numbers and the
year in which the hospitals were opened.
36

CHAPTER 2 BACKGROUND
Graphic 6. Healthcare concessions in Spain
Source: Spanish InsKtute for Healthcare Development and IntegraKon, 2013
Therefore, the five healthcare districts operated under an
administrative concession in the Valencia region are: Alzira,
Torrevieja, Dénia, Manises and Elche-Crevillente.
An administrative concession is an agreement that manages the
healthcare service of the reference population. Its purpose is to
provide comprehensive primary and specialist healthcare to the
population and it is funded by a premium per capita; the movements
of the protected population are invoiced, as well as the possible
patients from outside the district (graphics 7 and 8). The agreement
Number beds
Number beds
Number beds
Inauguration
Inauguration
Inauguration
Hospitals Others
Inauguration
37

CHAPTER 2 BACKGROUND
lasts for 15 years and can be extended to 20 years. The activity is
supervised by the Administration through the Valencia Health
Department's Commissioner (De Rosa and Marín, 2007).
This management model includes the basic principle of separating
the funding made by the public sector from the service provided by
the private sector, as set out in the Abril Report. In this case, the joint
venture that was awarded the concession agreement is responsible for
providing the service. The public sector owns, funds and controls the
healthcare service while the private sector provides the service itself,
respecting the principles that it must be a free, quality, efficient and
equitable service. One of the advantages of the model for the
regional administration is that it provides the healthcare network with
a quality public service without having to make any initial
investments and where the future costs are known and can be
planned (Tarazona et al., 2005).
2.2.1.1 Basic concepts of the Alzira model
The model is named after the Valencian town of Alzira in the La
Ribera area, where the first hospital of this type was built.
This health management model is based on the following principles
(graphic 7):
38

CHAPTER 2 BACKGROUND
Graphic 7. Main principles of the Alzira model
Source: the author, based on De Rosa and Marín, 2007
The point of view of the stakeholders in the public-private
partnership agreements (the Public Administration and the awarded
company) is summarized as follows:
The Public Administration
The following main points are deduced from the agreements'
specifications::
q The investment cost is borne by the awarded company.
39

CHAPTER 2 BACKGROUND
q If there is staff that belongs to the public administration
(statutory civil servants), their cost must be borne by the
concession company. Such services are compensated between
the concession company and the public administration,
including the social security costs.
q If the healthcare services required by the citizens allocated to
the district are not available, so they need to be taken
somewhere else or rerouted, the Law on Rates (Ley de Tasas)
are applied since it indicates the cost of such treatments, as in
the case of transplants, which are very complex treatments that
must be applied at the reference hospitals.
In both cases, the statutory civil servants and the rerouting costs form
part of the services that must be compensated between the
concession company and the Administration during the concession
period.
The awarded company
a) Funding
q Per capita: this is the amount that the company receives for
each citizen allocated to the district. This premium is updated
annually and the increase cannot exceed the average increase
for the other regions and it must be at least the consumer price
40

CHAPTER 2 BACKGROUND
index (CPI). In 2014, the per capita funding was 660 euros per
citizen in each district.
Graphic 8. Characteristics and correction factors of the per capita funding system
Source: the author
q Census: the PPP shares the population information system
(SIP) with the Administration; this system determines the
number of people and their basic contact data. Thanks to this
system, the district and the Health Department can monitor
the patients and invoice the account of the patients treated at
other hospitals. It applies the number of people at September
30, even if this figure fluctuates during the year.
41

CHAPTER 2 BACKGROUND
q Other revenue sources: the concession company can invoice
the services provided to patients outside the protected
population. The price for providing the service has a discount
with respect to the Law on Rates: 20% in the case of Alzira
and 15% in the other concessions (see graphic 8).
The concession company can provide services to patients who belong
to insurance companies and work-related mutual societies,
establishing the rates with the company in question or applying the
rates for traffic accidents.
The specifications state that the concession company will not be
compensated for the patients covered by the Valencia Health Agency
dealt with in the primary healthcare centers who do not form part of
the reference population.
b) Investments
At the end of the PPP agreement, the concession company
undertakes to deliver all the used assets to the Administration.
c) Maximum profitability
The PPP cannot earn more than a 7.5% profitability. If this occurs,
the concession company is obligated to return that surplus to the
Administration by investing it in healthcare.
42

CHAPTER 2 BACKGROUND
2.2.1.2 The beginnings of the Alzira model: La Ribera
Hospital
The first hospital under an administrative concession began at the
start of 1999. This significant event took place in La Ribera, the
former healthcare district number 10.
The model was faced with specific determining factors in terms of
both the social and economic conditions, including the following:
1. The additional problem of being the first hospital.
2. The establishment of a stable link between the Health
Department and the PPP.
3. The controversy in the public health system of a new
healthcare management formula.
4. The pressure from the media, political establishment and
trade unions.
The preceding factors were present in the social context and can be
classified as threats.
On the other hand, the model was faced with the following
challenges:
1. It would be difficult to manage only specialist healthcare.
43

CHAPTER 2 BACKGROUND
2. Since it was the latest user to enter the system, it was
expected to reach optimal quality levels right from the start.
3. The economic variables were adjusted for the premium per
capita and for a short concession period (10 years) in
principle.
4. The industrial relations needed to be particularly analyzed
because of their importance in each concession agreement
under the Alzira model. Specifically, La Ribera Hospital had
to face the following factors:
✓ For the first time in the Spanish health system, the concession
company's staff had to work with the statutory civil servants at
the same hospital.
✓ A variable economic supplement was established based on
objectives.
The initial objectives of La Ribera Hospital were conditioned by
some "needs": firstly, the need to meet the population's demands; and
secondly, the need to prove that the new healthcare management
system was viable.
Therefore, La Ribera Hospital's strategy had to include concepts like
implementing competitive differentiation factors, providing added
44
CHAPTER 2 BACKGROUND
value to its patients, creating the smallest possible conflict and taking
advantage of the private management tools.
2.3 A review of the literature on
healthcare service assessments
To make more reliable decisions, tools should also be used in the
healthcare industry that facilitate management and, in turn, provide
greater knowledge of the process efficiency.
Nevertheless, there are impressive studies such as the one conducted
by Holmberg and Rothstein (2011) which conclude that, after
analyzing the data in 120 countries, efficiency takes place when
public resources are well managed, i.e. when commissions in
developed countries and bribes in poor countries are eradicated and
when there is transparency in information and management based
on rational and not arbitrary decisions.
It has also been shown that the healthcare indicators do not have a
direct correlation to healthcare spending. In other words, higher
spending does not necessarily mean better results in health (a higher
life expectancy or a lower death rate) based on a threshold (The
National Academies, 2013).
45

CHAPTER 2 BACKGROUND
One of the usual ways to assess performance is using an indicator-
based instrument, i.e. a Balanced Scorecard (BSC), and a non-
stochastic method to assess efficiency, i.e. the data envelopment
analysis (DEA) (Amado et al., 2012). The DEA has been widely used
in the healthcare sector, where Hollingsworth's (2008) review of the
literature stands out. Another very interesting contribution is the
assessment using the methodology proposed by Ballestero and
Maldonado (2004).
We also researched the multiple objective programming methods to
determine the efficient frontiers that combine the achievements in
quality and costs, as proposed by Romero (2004) in other fields.
It was not until 1988, with the work of López-Casasnovas and
Wagstaff, that the efficiency of Spanish hospitals began to be
measured, although it was not until three years later, with the work of
Ley (1991), that the DEA was first applied to assessing a sample of
Spanish hospitals. For example, at regional level, the efficiency of the
hospitals in Galicia was analyzed by Seijas and Iglesias (2009), who
analyzed the hospitals belonging to the Galician Health Service
between 2001 and 2006.
Outside Spain, the first ones to apply the DEA to the hospital
industry were in the United States: Sherman (1984); Banker et al.
(1986); and Grosskopf and Valdmanis, (1987).
46

CHAPTER 2 BACKGROUND
The work by Puig Junoy and Dalmau (2000) and Cabasés et al. (2003
and 2007) provided evidence in this area since they made a thorough
review of the literature on the efficiency of hospital organizations in
Spain. Rodríguez-López and Sánchez Macías (2004) also made their
contribution by assessing the efficiency of the specialist healthcare
system in Spain.
The reference work regarding the stochastic efficiency frontier in
healthcare organizations was conducted by O'Neill et al. (2008), who
reviewed 79 studies using this technique, and Hollingsworth (2008),
who completed the study by reviewing 317 articles based on
measuring productivity and efficiency at hospitals, while also using
the frontier techniques.
2.3.1 Concept and measurement techniques of
efficiency in the hospital industry
"Hospitals or hospital areas must be oriented towards reaching
optimal results with a determined resource level". The first author to
introduce this concept in the literature was Debreu (1951).
Authors of economic theory take into consideration different options
when focusing on the hospitals to be assessed that will be used for
measuring efficiency. The two most usual functions are healthcare
costs and production, and these two variables are the usual ones that
47

CHAPTER 2 BACKGROUND
are used to determine and define efficiency. The production frontier
determines the maximum output that can be made based on a
certain input level. In terms of costs, it represents the minimum
economic cost with which a certain output can be produced.
When measuring efficiency in economic and objective terms, we are
referring to the overall or economic efficiency which, in turn, are
divided into overall and allocative technical efficiency. In the former,
it measures the relationship between optimal inputs and outputs; in
the case of allocative efficiency, they are the output combinations at
the price level.
The starting point for measuring overall efficiency is the methodology
presented by Debreu and Farrell (1951), which is still used at present
to assess the efficiency of hospitals and other production units.
Broadly speaking, we can make a distinction between non-frontier
methods, econometric models and other models where an optimal
reference needs to be established, and frontier methods where non-
parametric and parametric models need to be differentiated.
One of the most common methods used at healthcare organizations
is the Data Envelopment Analysis (DEA), which is the reference non-
parametric technique. The calculations are made using linear
programming since it is not necessary to establish a reference unit in
the frontier that determines the optimal level; instead, this frontier
48

CHAPTER 2 BACKGROUND
will be determined by the behavior of the other units in the sample.
One of the main features of the DEA is its deterministic nature, so
the deviations between the assessed units and the optimal frontier are
considered to be a technical inefficiency.
In the group of parametric techniques based on econometric
methodologies, the random ones based on a certain form of
production stand out (stochastic frontier). The difference with the
preceding ones (deterministic) is that, in this case, the deviations
include, apart from the technical inefficiency, external factors that do
not depend on the company management but on the context.
The methodology used in this dissertation is the Data Envelopment
Analysis (DEA) which, given its flexibility with respect to the initial
assumptions and to the lower demand in the observations, will enable
us to assess the efficiency of hospital organizations based on their
type of management.
2.3.2 Efficiency analysis method
To analyze efficiency, we will use two types of models: the
generalized linear regression models and the non-stochastic methods
using the Data Envelopment Analysis (DEA).
49

CHAPTER 2 BACKGROUND
2.3.2.1 Multivariate methods
Regression analysis (or econometric models): this is the usual
type of analysis when assessing hospital efficiency. By using the data
from all the hospitals or a particular healthcare service, we establish a
production function with several inputs as independent variables that
influence the result and a single dependent variable that determines
the performance, the procedural effectiveness or the cost efficiency.
We then estimate different regressions, assessing and determining
how the independent variables influence the dependent or
performance variable individually.
Therefore, each regression becomes the prediction of a situation. For
example, for a number of operating rooms or doctors (input), we can
determine the result, i.e. the number of hospital stays or the average
complexity in the process (output). Such predictions are obtained
using the average for the other hospitals' results. Therefore, the
difference between a hospital's performance results and the sample
average will be determined by the regression remainder.
The regression remainder will be positive in the hospitals that obtain
better results than expected. The best result for a specific hospital will
be the one that obtains the largest remainder.
50

CHAPTER 2 BACKGROUND
Our study also includes the generalized linear regression model, to
identify the variables that have a greater effect on the composition of
the overall costs, and the costs by area.
To see the effect of the management model on the several variables
addressed by our study, we analyzed the difference in the averages by
applying the T-test to the variables that meet the normality
assumptions and the Mann–Whitney U test (1947) to the variables
that do not meet Kolmogorov's normality test.
The regression analysis has certain limits when identifying the best
praxis since the efficiency information that it provides is limited. A
method such as the stochastic frontier regression (SFR) enables us to
model the error term in two parts: the first one shows the deviations
with respect to an optimal frontier, and the second one determines
the conventional statistical noise (Chirikos et al., 2000). The
stochastic frontier regression breaks down the error term and
determines the overall efficiency level based on the sample of possible
suppliers, and it subsequently calculates their deviations based on
their distance with respect to the efficiency frontier. The
aforementioned authors state that there is a need to conduct more
comparative studies of the results obtained using the DEA and SFR,
whose main characteristics are detailed in the next section.
51
CHAPTER 2 BACKGROUND
2.3.2.2 Non-stochastic methods
Data Envelopment Analysis (DEA): the DEA has become a very
valuable tool for making comparative efficiency analyses, especially in
the public sector. Efficiency studies are now conducted on hospitals to
assess their behavior based on the basic principles of microeconomic
theory, such as maximizing profits.
Using the DEA technique, efficiency is calculated by solving the
multiple linear programming problems for each hospital, calling them
decision making units (DMU), with the aim of determining their
overall efficiency level so their inputs are weighted to maximize the
weighted results between both, taking into account the restriction that
all hospitals using this weighting obtain the maximum result,
represented by the value 1, or lower than this value if they are
inefficient with respect to the others.
In this way, different ratios are obtained with the most beneficial
weightings for each hospital; such ratios and the radial efficiency
concept were established for the first time by Farrell in 1957, which is
why they are also called efficiency indexes.
The frontier is established by the healthcare units considered to be
efficient since they have an optimal reference index (1) and any linear
combination thereof; in this way, one point in the frontier dominates
or equals, in production terms, the maximum vector of outputs given
52

CHAPTER 2 BACKGROUND
certain inputs or the minimum inputs given a vector output, or any
other feasible production place or unit observed. If we want to assess
a group of "N" production units and each unit consumes "K" inputs
(x1,….,xk) and produces "M" outputs (y1,….,ym), the efficiency of
DMU 1 will be assessed by solving the following problem:
subject to:
where:
ys0 = quantity of output s per DMU,
us = weighting corresponding to output s,
xm0 = quantity of input m per DMU,
vm = weighting corresponding to input m, and where n is the
observation of the various decision making units (j = 1, 2,..., n) that
use p inputs (inputs = 1, 2,..., p) to produce v outputs (v = 1, 2,..., s),
where the variables to be weighted of both the inputs and outputs are
vi and ur, respectively, and the inputs and outputs observed are those
of the assessed unit xij0 and yrj0.
53

CHAPTER 2 BACKGROUND
The DEA model is also known as CCR because of the surnames of
its authors, Charnes, et al. (1978). They developed it with three
restrictions on technology: specifically, they referred to constant
returns to scale, convexity of the set of feasible input-output
combinations and strong disposability of inputs and outputs.
Banker et al. (1984) also contributed to the CCR model, developing it
from the original, by taking into account the fact that underlying
technology could provide a different and variable performance. This
model is called BCC and it is the methodology that we applied to
determine the efficiency of the hospitals in the Valencia region based
on their management model. The hospitals are compared with other
similar sized ones, which is why we grouped the hospitals into clusters
in our sample, so that the analyses have significant conclusions and
the efficiency indexes can determine the result of a hospital with
respect to the one with the highest productivity and efficiency, which
we will use in chapter four below.
Both the BCC and CRR models were used in their input-oriented
versions, relating the necessary inputs to reach the efficiency frontier
in a certain output. One characteristic when making the analyses is
that the hospital cannot influence the output level since they have to
care for the patients who go to the hospitals randomly and
exogenously. This is why we believe that it is more appropriate to
analyze their behavior from the point of view of the minimum use of
54

CHAPTER 2 BACKGROUND
resources to meet the healthcare demand and not the other way
around.
The efficiency results of the CCR and BCC models show the inputs'
maximum proportional reduction to reach the efficiency frontier.
Since the hospitals use different production factors (inputs) at the
same time to produce different outputs, it is necessary to use tools
that analyze both factors (input and output). In other words, it would
be interesting to know not only if the hospitals have chosen the
production level that maximizes profit but also if that production
level has been achieved with the lowest quantity of inputs or by
minimizing the production cost.
The main advantage of using the DEA is the flexibility that it gives
when analyzing the information. The inputs can be continuous
variables, ordinals or categories grouped into variables. They can also
be represented in different measurement units depending on the
analysis to be made (case mix, beds in use, delays, etc.). In the same
way, the output term can be analyzed from a much broader
perspective, including quality and performance results.
The most widely accepted advantages of using the DEA when
establishing comparative analyses in the service sector are as follows:
‣ The DEA mathematically establishes the optimal weighting for
each input and product considered. Since the DEA is a non-
55

CHAPTER 2 BACKGROUND
parametric technique, there is no need to allocate a weighting to each
variable; the DEA's methodology itself allocates a weighting to each
input and output.
‣ The DEA can make simultaneous comparative analyses of multiple
dependent performance variables (cost efficiency and results, quality
and results) and provide a scale based on the best practices. In this
way, each hospital can be compared with a similar sample and
measured from two standpoints: allocative and technical efficiency.
‣ Once the suppliers that form the efficiency frontier are determined,
the DEA can estimate the quantity of idle resources or the additional
quantity of results, quality or production that can be made by an
inefficient DMU, or hospital in our case.
The main limitations of the DEA are as follows:
‣ Since it is a non-parametric technique, it does not have any
statistical indicators to measure the error term (noise) as in the case
of regressions. This is why it is not the best technique for making
assumptions.
‣ Another technical consideration which could limit the scope of the
analysis depending on each case is the number of DMUs to be
considered. Although there are no studies or fixed rules, many
authors suggest that the number of variables should be between 4
56

CHAPTER 2 BACKGROUND
and 15 observations for each independent variable included in a
regression analysis.
‣ The same occurs with the number of input and output variables to
be included. Too many variables are considered to be
methodologically wrong, so our study does not include more than
four.
‣ When performing the DEA, the result determines the suppliers
considered to be efficient; nevertheless, the DEA does not
discriminate the relative differences between the various DMUs.
As a result of such considerations, most authors use at least two of
the preceding tools in a supplementary way with the aim of obtaining
different perspectives of the relative efficiency results, particularly in
the case of healthcare service suppliers.
2.3.3 Hierarchical analysis. Clusters
To see the different performance of the hospitals, it is fundamental to
take into account the structural and activity characteristics of each
one.
The need to compare hospitals as a way of sharing improvement was
a concept implemented in the public sector by Marshall et al. (2000),
in which standard groups or clusters were used.
57

CHAPTER 2 BACKGROUND
The cluster analysis is a group of techniques used for classifying
objects or cases into standard groups called clusters with respect to a
predetermined selection criterion (Anderberg, 1973).
The purpose of the cluster analysis is to group the observations so
that the data are very similar within the same groups (minimum
variance) and these groups are as different as possible between them
(maximum variance). In other words, if the classification is optimal,
the objects within each cluster will be similar to each other and the
different clusters will be very different from each other. In this way,
we obtain the classification of the multivariate data with the aim of
having a better understanding and the population to where they
belong. We can make a cluster analysis of cases or variables or by
blocks if variables and cases are grouped.
After selecting the variables and calculating the similarities, we began
the grouping process. Firstly, we selected the grouping's algorithm to
form the groups (clusters) and, subsequently, we determined the
number of groups to be formed. These two procedures will depend
on the results obtained and on the interpretation arising therefrom.
There are two types of grouping procedures: hierarchical and non-
hierarchical. The hierarchical cluster is characterized by a tree
hierarchy or structure (dendrogram). In that way, clusters are formed
only by the union of existing groups; therefore, any member in a
58

CHAPTER 2 BACKGROUND
cluster can trace its relationship in an unbreakable path that starts
with a simple connection.
2.3.4 Diagnosis related groups (DRGs)
In the healthcare context, we remember that no two episodes are the
same, even if the same disease is treated. Nevertheless, thanks to the
DRGs, we can group patients with a similar resource utilization level
to obtain the hospital case mix (Guadalajara, 1994).
These cases are the episodes that are treated, i.e. the patients cared
for at the hospital; therefore, when referring to the case mix, we mean
the different types of patients treated.
For professional doctors, the case mix complexity entails a clinical
complexity; in this case, a greater complexity will entail a worse
situation for the patient. Therefore, a higher case mix indicates a
worse prognosis and greater need for healthcare resources. For the
hospital managers and in the role played by the heads of department
of the administrations, a higher case mix implies greater resource
utilization which, therefore, entails higher costs.
However, the purpose of the DRGs is to relate the hospital case mix
to the demand for resources and the costs incurred by the hospital so,
from the standpoint of the DRGs, a greater case mix complexity
means that patients will need more hospital resources.
59

CHAPTER 2 BACKGROUND
As a result of using the DRG system to measure hospital complexity
in the last few years, the isolated management based on the clinical
service has evolved into a cross-sectional process management based
on the product. This has led to a style of hospital, complexity or case
mix management in which the organization's management is based
on the hospital processes.
2.3.4.1 Origin of the DRGs
The DRGs were designed and developed at the end of the 1960s at
Yale University (United States). The initial reason for developing
them was to analyze healthcare quality and the use of the hospital
services. The work, which was commissioned by the Health Care
Financing Administration, lasted just over a decade. The research
was carried out by a multidisciplinary technical team directed by
professor Robert Fetter. Specifically, the initial study focused on Yale-
New Haven Hospital (Fetter and Freeman, 1986).
The system was first implemented at a large scale at the end of the
1970s in New Jersey (US). In this case, the DRGs were used for a
specific fixed payment system based on each patient treated in
accordance with his own DRG, which determined the average cost of
treating this disease (Hsiao et al., 1986).
60

CHAPTER 2 BACKGROUND
2.3.4.2 Development of the DRGs
During the DRG development process, it was considered that the
patient classification system should have the following characteristics
so that it would be as practical and logical as possible:
‣ The information about the patient characteristics used for defining
the DRGs would had to be usually summarized in the hospital
reports. The DRGs had to be based on easily available information.
‣ The grouping had to include all the hospital patients with a
manageable number of DRGs, limiting the amount of groups to
ensure their practical use.
‣ The patients within each DRG had to have a similar resource
utilization level, implying a similar treatment cost. Even though there
could be variations in the resource volume used by the patients of a
certain group, they would be known and predictable.
‣ The patients within each DRG had to be similar from a clinical
standpoint, i.e. there had to be a clinical coherence.
2.3.4.3 The weightings of the DRG
The concept of weighting refers to the resource level that may be
needed to treat a case in a specific DRG. The weighting is calculated
based on relativizing the average cost of each patient group, i.e. it is
61

CHAPTER 2 BACKGROUND
obtained by comparing the individual costs of the various DRGs with
the average cost per patient. Therefore, the relative weighting
associated with each DRG represents the foreseeable cost of that
patient type with respect to the average cost of all the patients.
If the relative weighting of the DRG is equal to 1, this means that the
cost of treating such patients is equivalent to the average cost of the
inpatient (standard). However, if this value is higher or lower than 1,
this means that the specific cost of this DRG is higher or lower,
respectively, than the cost of the standard patient.
In Spain, the weighting of the DRGs based on the calculations made
in the United States was used until 1997 since there were no specific
studies. In 1997, the Spanish Ministry of Health and Consumption
began a study called "Analysis and development of the DRGs in the
National Health System", which was coordinated by Rivero (1997).
The various Spanish regions participated in that work since the
healthcare powers had been devolved to them. As a result, national
weightings were implemented and it provided a way of standardizing
the Spanish system of allocating costs at hospitals. The study marked
a turning point in this area and, since then, the national DRG
weightings are reviewed annually. They are calculated by using the
hospital cost information, obtained by the analytical accounting
systems, of a sample of patient discharges representing all the
62

CHAPTER 2 BACKGROUND
Spanish hospitals. At present, of all the different versions, the system
uses version 23 of the AP-GRD, which includes a total of 676 DRGs.
The combination of the DRG categories with the Spanish weightings
is a very important instrument thanks to their multiple uses. The
DRGs are mainly used as the basis for the healthcare funding,
internal management and quality improvement systems.
In the healthcare industry, the DRG weightings and costs are widely
used as a budget tool. In Spain, most of the hospitals partially or fully
fund their activity based on the DRGs.
In the Valencia region, the funding of the districts under concession
is per capita and the invoicing between hospitals is calculated based
on DRG-assessed processes.
The DRGs relate the patient type in a hospital to the costs that
should be incurred by the hospital for treating such patients;
therefore, from the management standpoint, estimating the average
costs can be used for controlling the service use and facilitating
hospital management in relation to the resource utilization.
Moreover, this provides a double reading: firstly, the hospitals have a
nationwide reference; and secondly, using the standardized
measurement, they can be compared with each other thanks to the
63

CHAPTER 2 BACKGROUND
DRGs by detecting areas for improvement at the hospitals themselves
and facilitating the decision-making of the management teams.
In the context of quality improvement in healthcare, hospitals can
use them as standard indicators, using the DRGs as a healthcare
quality management tool.
Healthcare quality improvement is based on analyzing the deviation
from the rule. When the deviation is significant, the managers must
determine the reason for this. A usual example is to use the average
stay of patients per DRG with the aim of detecting possible
complications in the procedures with hospital admission.
Therefore, a DRG is a group of patients with a certain illness that
need similar treatments and use similar resource levels (Fetter et al.,
1980). The cases that belong to the same category have similar costs,
so we know the average cost of treating the patients within the same
DRG and, therefore, the average total cost of that clinical service
area.
2.3.4.4 The "product" that a hospital provides
Healthcare organizations are currently considered to be service
companies as part of the business network. They are companies that
combine human and physical factors (real estate or supplies) in
clinical processes with the aim of optimizing the health and wellbeing
64
CHAPTER 2 BACKGROUND
of their patients. Having defined this concept, we will know talk
about the "product" that a hospital provides and how it is measured.
In 2000, a study by Brignall and Modell divided the "product" and its
performance into three sections: financial results, quality indicators
based on the performance of the organization's professionals and
resource utilization. The importance of each group is determined by
its setting and by the hospital strategy.
The hospital organizations have very diverse procedures due mainly
to the unique characteristics of the patients they care for. Therefore,
hospitals provide both tangible products (blood test or X-ray results
or prosthetics) and intangible results (the perceived service, the
clinical diagnosis, etc.). However, the "product" is defined as the care
of the patient to whom the doctor has applied a clinical treatment
(Fresneda, 1998). Even if two patients have the same disease, there
may be different underlying factors that determine the procedure and
make them different.
Therefore, a healthcare organization has both the "products" and the
patients that they care for and it is difficult to standardize them as in
other industrialized sectors. This difficulty is determined by the
differences in, and amounts of, patients cared for and the hospital
procedures.
65

CHAPTER 2 BACKGROUND
2.3.5 Public-private collaboration experience in
healthcare
Regarding the public-private collaboration level, the amount of
infrastructure for providing public services with private funding has
quadrupled in recent years (Abadie, 2008), especially in Europe (La
Forgia and Harding, 2009).
A widely used public-private collaboration model is when a private
company rebuilds a hospital whose infrastructure has become
obsolete (Gomez-Ibañez, 2003). This model is called PFI (Project
Finance Initiative) and was developed in the United Kingdom in the
early 1990s by the Labour and Conservative governments, becoming
a reference and test bed for the other European countries (Nieto,
2004).
In the United Kingdom alone, there are more than 100 projects of
this nature, with an estimated value of 25.8 trillion dollars, which
vary from hospitals for isolated communities, with a budget of
around 15 million dollars, to more than 2 trillion dollars such as the
refurbishment of the Royal London and St. Bartholomew's hospitals
in London (Barlow et al., 2013).
Regarding previous experience in comparing the models, a study was
conducted in Brazil in 2009 (La Forgia et al.), where a PPP (Public
66

CHAPTER 2 BACKGROUND
Private Partnership) was implemented to care for the low-income
population living in the periphery of São Paulo state.
That study compared 12 directly managed hospitals with 12 under
concession. Both groups were considered to be standard in terms of
size, cost per bed and complexity of the population cared for.
The increase in the use of the public-private collaboration models in
healthcare is conditioned by the current economic recession and the
tax restrictions. We will see greater development in post-Soviet
Europe, where the hospitals do not meet the patients' service demand
and manage their resources inefficiently (Coelho et al., 2009).
The European Commission has recently published an assessment
study on the public-private partnerships in Europe (EXPH, 2014).
One of the main conclusions is that there is insufficient information
to assess the PPP model compared with direct management, so this
dissertation undoubtedly provides scientific value and knowledge to
this area. In the same line, in 2012 the Spanish Society of Public
Health and Healthcare Administration (SESPAS) stated that there
was no evidence of there being any advantages in implementing
PPPs or needing to conduct studies to demonstrate this (Palomo et
al., 2012).
The study by the Commission's expert panel compares the most
frequently used PFI models in Europe. Nevertheless, hospitals in
67

CHAPTER 2 BACKGROUND
Western Europe, with more modern facilities, should be redefined by
the change in the hospital model trend towards more ambulatory
processes and management of chronic cases, thus reducing the need
for beds for acute processes (Rechel et al., 2009).
There are 19 public-private collaboration projects in the healthcare
industry in Spain (James et al., 2010), which are worth 2.3 trillion US
dollars, considerably below other countries, where these types of
contracts are used much more widely, as in the case of the United
Kingdom (stated above) and Italy, where there are 71 projects worth
5.7 trillion dollars; although considerably higher than countries such
as France, which has 16 projects worth 1.6 trillion dollars.
As stated at the start of this chapter, the PFI collaborations, apart
from funding the construction work, also have a service provision
contract to maintain the building or the central non-medical services,
such as restaurants and coffee shops, laboratories, sterilization
services, waste collection and surveillance services.
A limit to the model with respect to the market is that it does not
enable free competition due to the transaction costs for both the
establishment and maintenance.
In Spain, there is a benchmark study in the healthcare industry
conducted by Catalan company IASIST, which issued a report in
2011 based on the Minimum Basic Data Set (MBDS), whose
68

CHAPTER 2 BACKGROUND
database is one of the sources we used for our dissertation. IASIST
compares the directly managed hospitals with other forms of
management, such as foundations, consortiums, PFI and PPPs.
Arenas (2013) conducted a comparative study in the Valencia region.
The analysis compared the cost of the reference patients (per capita)
of the concession districts with those of the directly managed ones:
the cost was 31.77% lower in the case of the PPPs.
When comparing the models, there are also unfavorable opinions
about the use of the public-private collaboration model. The
SESPAS report (Sanchez-Martínez et al., 2014) states that the public
or private ownership of hospitals does not determine their results.
Likewise, it states that the discussion should be abandoned since there
are no factors that can assess the performance of both options.
In the healthcare area, there is a study which shows that quality does
not differ depending on the legal form, but it does acknowledge that
there are better results in ambulatory major surgery rates and greater
clinical effectiveness due to the concession companies' technological
equipment (Coduras et al., 2008).
A study by Salvador Peiró in 2012 comparing the efficiency of the
hospitals under concession and those directly managed shows that the
lower cost of admissions at the PPPs seems to be related to a larger
69

CHAPTER 2 BACKGROUND
number of admissions at them, so the fixed costs are spread out, thus
reducing this value.
Peiró (2013) added to the preceding study that private management
does not guarantee higher healthcare quality than direct
management or vice versa.
Outside Spain, Masson et al. (2010) state that the hospitals managed
under public-private collaboration treat less complex patients than
the other hospitals belonging to the United Kingdom's National
Health Service. Likewise, those private hospitals have a lower coding
level than the public ones.
Another comparative study of the PFI models was conducted in Italy
(Vecchi et al., 2010), which concludes that the return obtained on this
model by the investors is considerably larger than that expected in a
competitive environment.
In Germany, Herr (2008) compared the healthcare results obtained at
the hospitals using the PFI model with those directly managed, where
the average stay at public hospitals was 3.52 days less than at the PFI
ones. Likewise, the study states that only 59% of the PFI hospitals
have an ambulatory unit which, therefore, leads to greater pressure
on hospital admissions.
70

CHAPTER 2 BACKGROUND
In France, Dormon and Milcent (2012) studied a sample of 1,604
hospitals, i.e. 95% of the specialist healthcare supply in the country,
for a period of 5 years (1998-2003). To make the comparisons, they
divided those hospitals into three groups based on the number of
discharges and they weighted the stays of the DRGs based on the
equivalence tables called ISAs (Indice synthétique d´activité). Using
this indicator per hospital bed, the private hospitals are 70.6% more
efficient. This is because there are more unoccupied beds at the
public hospitals. In the same way, the French public hospitals focus
more on longer stays, while the private hospitals have a larger rate of
operations. This is particularly significant when analyzing the small
hospitals where the stay is 9.3 days at public ones and 3.8 at private
ones. Therefore, it is not surprising that there is more healthcare staff
(7.6 vs. 1.7 and 3.7 vs. 1.9) at small and medium hospitals,
respectively.
Since there is a lack of studies in Spain, we need to review the
literature from other countries that have traditionally used public-
private collaboration (PPC) but with PFI models (Barlow et al., 2013).
Based on the comparison of such PFI models in the United
Kingdom, the data show that there may be higher costs with respect
to public sector borrowing due to the higher financial costs of the
private operators and their economic margins (Hellowell and Pollock,
2007 and 2009).
71

CHAPTER 2 BACKGROUND
When comparing the results from the PFI models with those of direct
management, some authors state that the public-private collaboration
in building a hospital implies higher costs. Likewise, the authors state
that this could also mean a lower quality service in managing the
general services (McKee et al., 2006). Such authors also highlight the
studies which show the complex nature of managing a long-term
healthcare concession.
Another controversial point is the need to have control mechanisms
between the parties involved (Brown and Potosky, 2004).
There are also studies that warn about the underlying risk in public-
private collaboration beyond the PFI model.
72

CHAPTER 2 BACKGROUND
3. ASSUMPTIONS AND
INFORMATION
SOURCES
73

CHAPTER 3 ASSUMPTIONS AND INFORMATION SOURCES
3.1 Assumptions for the study
In the preceding chapter, we provided the various contributions made
to the comparisons between the public-private collaboration and the
traditional public healthcare or direct management model.
The main assumption for this PhD dissertation, which analyzes the
healthcare quality and efficiency of the economic model based on the
type of management, is that the PPP model is more efficient in terms
of healthcare quality and economics than direct management (public
sector), although this efficiency is nuanced or influenced by the
hospital area in question and will have a different result depending on
the analyzed indicators.
3.2 Information sources
We can group the various information sources used for this
dissertation based on the nature of their indicators:
Having reviewed the scientific contributions, this section will now detail the
main assumptions used for the study and show the information sources used
with their corresponding indicators, which will determine the field study and its
conclusions.
74

CHAPTER 3 ASSUMPTIONS AND INFORMATION SOURCES
-Economic information/costs: we obtained this data from the
Valencia Health Department's Economic Information system (SIE)
regarding the hospitals that are directly managed. Since the
concession companies are not included in that information system,
we asked them to complete a form with the costs based on their
source or cost pool. Once that information was collected, we adapted
the data to the SIE to standardize this.
- Quality: we obtained the quality indicator results based on the
assessment carried out by the Valencia Health Department (2010) in
the Management Agreements, where the hospitals that are directly
managed and those under concession have been assessed.
- Healthcare production: to obtain the hospital revenues, we used
the Minimum Basic Data Set (MBDS) for all the hospital discharges.
Nevertheless, to have an overall view of the specialist healthcare, we
obtained the information from the SISAL (Healthcare Activity
Information System) for the outpatient and emergency areas. Both
databases were provided by the Valencia Health Department.
- Structure: to obtain the structural aggregates of the hospitals
managed directly and those under concession, we used the
information from the SISAL system.
- Period: all the assessed data refer to 2009 and 2010.
75

CHAPTER 3 ASSUMPTIONS AND INFORMATION SOURCES
- Hospitals analyzed:
✓ Directly managed hospitals:
La Plana Hospital (Castellón)
University General Hospital (Valencia)
Castellón General Hospital
Castellón Provincial Hospital
Arnau de Vilanova Hospital (Valencia)
Requena Hospital (Valencia)
Sagunto Hospital
Vega Baja Hospital (Orihuela)
Vilajoyosa Hospital (Alicante)
San Juan Hospital (Alicante)
Clinical University Hospital (Valencia)
Malvarrosa Hospital (Valencia)
Alicante General Hospital
Verge dels Liris Hospital (Alcoi)
San Francisco de Borja Hospital (Gandía)
Dr Peset Hospital (Valencia)
Onteniente Hospital
Lluís Alcañiz Hospital (Xátiva)
76

CHAPTER 3 ASSUMPTIONS AND INFORMATION SOURCES
Elda General Hospital
Elche General Hospital
Vinaroz Hospital
La Fe Hospital
✓ Hospitals under an administrative concession (Valencia):
La Ribera Hospital (Alzira)
Elche-Vinalopó Hospital
Dénia Hospital
Torrevieja Hospital
Manises Hospital
3.2.1 Sources of economic information
"SIE is an information system that collects and analyzes the data on
activity and costs in hospitals and provides standardized indicators for
costs, activities and cost per activity which provide a comparison
between hospitals, making it a tool to help decision-making. It is used
as a healthcare management instrument, helping to improve the
effective and efficient use of the public healthcare system's
resources" (Valencia Health Department, 2002).
77

CHAPTER 3 ASSUMPTIONS AND INFORMATION SOURCES
It is an analytical accounting system based on an the activity-based
costing (ABC) model. The system comprises two large subsystems of
data collection and analysis: one for the total costs incurred by the
hospitals and the other for the activities generated by the resource
utilization. It shows the cost of each intermediate product identified
in the healthcare process, based on the actual cost of the pool and on
the activity performed in the same period.
The data with which the SIE works is obtained from other
information systems on utilization and activity that form part of the
healthcare system, such as salaries, supplies and storage, specialist
healthcare management indicators, pharmacy, prosthetics, concerted
agreements and procedure catalogues. The SIE is a flexible system,
i.e. it can adapt to the different information availabilities of each
hospital and its specific organizational features.
SIE was implemented in 1992 to improve the economic information
of the Health Department's healthcare districts, helping to make
better decisions by combining the two aspects of healthcare activity:
production and resource utilization.
Since the beginning, SIE has evolved with the aim of adapting as far
as possible to the complex healthcare structure. As a result of
standardizing the activity that is measured at hospitals through the
SIE, part of the results are used for drafting the healthcare tariffs
78

CHAPTER 3 ASSUMPTIONS AND INFORMATION SOURCES
included in the Valencia regional government's Law on Rates,
through which the compensation between districts is made.
SIE has been implemented at all the hospitals in the Valencia region's
public network and, at present, it has a single database for all the
centers.
Nuances to the economic data:
As stated previously, the data included in the SIE cover the hospitals
that are directly managed by the public sector. This means that it
does not have information about the districts managed under PPPs
(Manises, La Ribera, Dénia, Elx-Crevillent and Torrevieja). Since the
economic efficiency analysis was made for 2010, we have included
only three PPPs, Alcira (La Ribera Hospital), Dénia and Torrevieja,
as we did not have the costs for the others.
Likewise, we must remember that our data collection date is very
close to the date on which Dénia hospital was opened (2009), so there
may be inefficiencies due to the opening itself, aggravated by the fact
that it was a move and not a new opening.
Also, we did not include information about medium- and long-stay
hospitals since they do not have a Minimum Basic Data Set (MBDS/
CMBD in Spanish) and the cost per DRG cannot be calculated.
79

CHAPTER 3 ASSUMPTIONS AND INFORMATION SOURCES
We did not include the DRGs classified as indeterminate in the
MBDS (type 0) since we cannot classify such processes as either
medical or surgical.
The scope of the information is at hospital level in both cases, i.e.
direct management and under concession. This means that we did
not include the activity carried out at the outpatient services
(specialist centers, integrated hospitals, etc.) or in the primary care
units.
We grouped the information recorded at the cost and cost pools
(hereinafter, CACs) into the four large healthcare activity areas of a
hospital: outpatient, emergency, inpatient and surgical; and we
allocated their direct costs.
We did not take into account the allocation of the structural and
logistics costs such as the support units (admissions, patient care, etc.)
and secondary structural costs, or the primary structural costs (water,
electricity, maintenance, etc.).
Another limit to the information is that we did not include the costs
from the central healthcare CACs (the diagnosis and treatment
CACs: the hematology, biochemical, microbiology, radiology,
rehabilitation, lithotripsy, electrophysiology and cardio stimulation,
hemodynamics and interventional cardiology laboratories, etc.) or the
surgical area. In fact, the costs of those CACs should be passed on to
80

CHAPTER 3 ASSUMPTIONS AND INFORMATION SOURCES
the end CACs but SIE does not allocate such costs; that is the
criterion we used when allocating the information about the
concession costs.
Therefore, the costs of the end inpatient or ambulatory CACs do not
include the cost of the diagnosis and therapeutic tests made on the
inpatients or the patients dealt with in the outpatient services and
emergency units. They do include the cost of the specialization's
diagnosis and therapeutic procedures (neurology, digestive medicine
or the clinical service in question) carried out in the inpatient rooms
during the admission period.
We excluded the following ambulatory activities: the day hospital and
the home care programs.
Regarding the surgical area, we included the costs of the surgical
group and of the associated, local and general anesthesia acts which
are included separately in the SIE. Major ambulatory surgery is
considered to be a different CAC in the SIE but we included it to
cover all the surgical group's expenses.
We also excluded the CACs that are not allocated from the CAC list.
Such costs are those borne by the hospital but do not correspond to
their own activity. The pharmaceutical products dispensed to
ambulatory patients stand out since they account for a large volume
81

CHAPTER 3 ASSUMPTIONS AND INFORMATION SOURCES
of the cost, and include dispensing pharmaceutical products for
hospital use to ambulatory patients, medicines to dialysis clubs, etc.
3.2.2 Quality information sources
Management Agreements (Acuerdos de Gestión)
The Management Agreements were implemented in the Valencia
Health Agency hospitals through an agreement with the Valencia
Government's Council in 2004, which establishes a variable bonus to
motivate and differentiate the remuneration of the healthcare staff.
Meeting such targets depends on the results obtained in the quality
and efficiency indicators, which are previously agreed by the Valencia
Health Department and the management of each healthcare district.
Because of the importance of human resources in the healthcare
industry, the Strategic Plan confirms the need to develop them so that
the system can work correctly. This means that there is a need to
implement mechanisms that acknowledge and compensate the
professionals' performance, based on their participation in the Health
Department's targets.
Therefore, the Management Agreements show the strategy which
must be carried out by the hospitals that belong to the Valencia
Health Department: the healthcare districts, the public hospitals, the
chronic and long-term care hospitals, the inspection bodies, etc.
82

CHAPTER 3 ASSUMPTIONS AND INFORMATION SOURCES
Each hospital has KPI (Key Performance Indicators) with a goal and
a weighting. Through the Strategic Plan Office, the Health
Department monitors the indicators every month and makes a final
assessment at December 31, and subsequently publishes the results,
comparing the hospitals by standardized group.
The main characteristics of the Valencia Health Department's
Management Agreements are as follows:
a) There is a link between the public hospitals and all their
professionals with the strategy previously set out by the Health
Department.
b) Because of the possible differences between the hospitals and the
professionals, it is necessary to be impartial when establishing the
targets, so the requirements must be associated with each
organization's resources.
c) Teamwork will be necessary for assessing the professionals'
individual actions in their own service. Regardless of their category,
all the professionals are assessed for their individual contribution to
the results of the unit where they work.
d) The professionals and their representatives must participate in
establishing the targets.
83

CHAPTER 3 ASSUMPTIONS AND INFORMATION SOURCES
e) The economic compensation must be in proportion to meeting the
targets.
f) The process must be transparent, through publicity and control
throughout the year.
g) All the process of establishing and assessing the indicators must be
objective.
The fundamental objective of the Management Agreements is to
achieve greater efficiency in the public healthcare service provided by
the healthcare district regarding both the population allocated to it
and that from the other hospitals requiring its services.
Through the Management Agreements, the Valencia Health
Department analyzes and ranks the hospitals; from 2013, this was
carried out by dividing the hospitals into standardized groups
regarding to the management model (direct or PPP).
3.2.3 Information sources for the healthcare
production
The Minimum Basic Data Set (MBDS/CMBD in
Spanish)
84

CHAPTER 3 ASSUMPTIONS AND INFORMATION SOURCES
The basic data necessary for allocating a patient to a certain DRG
comes from the hospital discharge report. Such data is included in
the MBDS, defined as the Minimum Basic Data Set for hospital
discharges. The MBDS is a source of standardized data that contains
21 variables with administrative, demographic and clinical-
epidemiological information about the morbidity treated of the
inpatients and of the patients at the ambulatory surgical services
(Fusté et al., 2002).
After its approval by the Interregional Council, the MBDS entered
into force in Spain in 1987. Nevertheless, it was not until 1992 when
it became mandatory to include in the MBDS the data of the
patients cared for and those who have had at least one hospital stay
(see section 3.2.4) in the Valencia region.
The variables used (included in the MBDS) to classify the patients
through the DRGs are as follows:
1. Main diagnosis
2. Procedures
3. Age
4. Situation upon discharge
5. Secondary diagnoses
85

CHAPTER 3 ASSUMPTIONS AND INFORMATION SOURCES
The main diagnosis is defined as the diagnosis which, after the
patient is examined by the doctor, is established as the reason for
being admitted to a hospital. The secondary diagnoses are the
diagnoses which refer to complications or comorbidities (Nanda,
2005) which increases the complexity of the care and, therefore,
influence the duration of the patient's stay at the hospital or of the
administered treatment.
The complications are the disease processes arising during the
hospital stay, while the comorbidities are the patients' health
problems or illnesses before being admitted to hospital.
The diagnoses and procedures are coded through the International
Classification of Diseases, Ninth Revision, Clinical Modification
(ICD-9-CM). The ICD-9-CM is divided into two groups:
✓ The diseases are classified in 17 chapters.
✓ The procedures are classified in 16 chapters.
Since the MBDS does not have any information about the
ambulatory healthcare production (outpatient services and the
emergency department), we obtained this from SISAL information
system. Although the ambulatory surgical processes are not counted
as a inpatient admission, they are included in the MBDS.
86

CHAPTER 3 ASSUMPTIONS AND INFORMATION SOURCES
3.3 Indicators and variables used
3.3.1 Economic or cost variables
For this PhD dissertation, and as stated in the preceding section, we
will analyze the costs that are directly allocated, divided as follows:
A. Human resources expenses
‣ Medical staff: this group includes specialist doctors, regardless of
their activity center, pharmacist.
‣ Non-medical healthcare staff: this group includes the staff that
carries out healthcare functions but does not have a degree. They
have a nursing diploma or are midwives, assistants, optometrists,
physiotherapists or specialists.
‣ Non-healthcare staff: this group includes the other administrative
staff and the management team, regardless of their training (medical,
care and non-care personnel).
The amount that will be used refers to all the concept included in
chapter I of the budget:
- The employee salary plus the corresponding social security
contribution.
87

CHAPTER 3 ASSUMPTIONS AND INFORMATION SOURCES
- The contribution for professional training or unemployment.
- The recovery for temporary disability.
The percentage of dedication by the hospital staff, based on the
corresponding activity center, must be updated with the aim of
processing this together with the data sent by the calculation center. It
is fundamental to maintain this since the staff makes up most of the
total cost of a CAC and, furthermore, the conversion of the staff
dedication into the full-time equivalent (FTE) is used as a breakdown
criterion for many secondary structural costs and, in some cases, for
the ambulatory logistics costs.
The staff costs will be allocated to their corresponding CACs every
month.
For the medical healthcare staff, we will take the following into
account:
The cost of the continued care by the medical healthcare staff will be
allocated to the various hospital areas: inpatient, outpatient, surgical
and emergency services.
In the ordinary activity, the medical healthcare staff provides its
services to the inpatient services, ambulatory care, operating rooms
and emergency departments or in laboratories, so its cost must be
divided based on their dedication to each CAC, in accordance with
88

CHAPTER 3 ASSUMPTIONS AND INFORMATION SOURCES
the chief of the service. The cost of the non-medical healthcare staff
and non-healthcare staff will be allocated to the CAC where they
provide their services, and their cost must be allocated, if they carry
out activities in different CACs, in proportion to the time devoted to
each one.
The pension bonuses for the non-medical healthcare staff and the
service commissions (for the staff remunerated by the specialist care
center but which carries out its activities in another center) will be
included in group 9 of the CAC which is not allocated. The cost of
the residents will be allocated in the following way:
- The cost of the residents in family and community medicine is not
allocated to the SIE in specialist care since this is included in the
budget of the primary care cost pools. If they provide continuous
care at the hospital, the cost of the shifts will be allocated to the
corresponding CAC.
- The cost of residents in other specialties will be included in group 9
of the CAC which is not allocated, in the first three years, unless the
chief of the unit believes that they are carrying out activities for that
service, in which case the head of department must determine the
percentage of dedication to the corresponding CAC. If they provide
continuous care at the hospital, their cost will be allocated to the
corresponding CAC.
89

CHAPTER 3 ASSUMPTIONS AND INFORMATION SOURCES
B. Supply utilization
✓ Utilization of healthcare material
✓ Utilization of pharmaceutical products
The cost of the pharmaceutical products include those acquired from
third parties and those produced by the hospital's pharmacy service.
The CACs of which we know the product utilization with accuracy
will be allocated directly. The logistics centers corresponding to each
product line will be used for allocating the utilization costs that
cannot be differentiated and, subsequently, for breaking them down
among the corresponding inpatient area and ambulatory care centers
using an objective criterion.
As a result, we have the information per hospital with a similar
structure to that shown in table 6, where we see the cost breakdown
by area for Hospital H10.
Table 6. Main direct expense items for H10
Source: the author
90

CHAPTER 3 ASSUMPTIONS AND INFORMATION SOURCES
3.2.2 Quality variables
Based on the results of the Management Agreements, twelve
indicators were chosen for this study out of a total of 95, grouped
into six variables and provided by the Valencia Health Department:
a) Quality indicators
b) Delay indicators
c) Economic indicators
d) Healthcare process indicators
e) Public health indicators
f) Safety indicators
Likewise, we included the overall score indicator in the Management
Agreements through which the Health Department makes its annual
rankings for the hospitals. Those 13 indicators were also present in
the previous year (2009), so that we could study their evolution.
On one hand, as we said, we included the overall score of the
Management Agreements as the overall indicator, which groups both
the variables chosen for this dissertation and the others, maintaining
the targets for each indicator established by the Health Department
to obtain the hospital ranking.
91

CHAPTER 3 ASSUMPTIONS AND INFORMATION SOURCES
We will now provide details of each of the 12 indicators chosen and
of the overall score indicator which determines the final rankings, as
well as the formula used to calculate this, arranged per perspective.
3.2.2.1 Quality indicators
Synthetic satisfaction index
OBJECTIVE: To improve the satisfaction perceived by the patients
in relation to how the healthcare service works.
DEFINITION: The synthetic index obtained in the patient
satisfaction surveys conducted by the Directorate General for Quality
and Patient Care.
This is measured by combining five indexes of the quality perceived
by the patients, obtained from the results of the patient opinion
surveys. The perceived quality indexes are calculated for both
ambulatory care and hospital care, and are as follows:
1. "Satisfaction assessment" index
2. "Perceived improvement" index
3. "Information quality" index
4. "Accessibility" index
92

CHAPTER 3 ASSUMPTIONS AND INFORMATION SOURCES
5. "Comfort" index
We added the assessment of the compliance with the objectives
defined for each district and with the actions for improving patient
satisfaction to those indicators.
SOURCE: Directorate General for Quality and Patient Care.
PURPOSE: To maximize this.
NOT APPLICABLE TO: Healthcare districts or hospitals with a
critical mass of insufficient surveys.
3.2.2.2 Delay indicators
Delay in the first visit to a specialist doctor
OBJECTIVE: To reduce the patients' waiting period to visit the
specialist doctor for the first time.
DEFINITION: Average waiting time to visit the specialist doctor.
where:
D: The delay stated in days.
SOURCE: The Healthcare Information System Analysis Service.
DCE = D
93

CHAPTER 3 ASSUMPTIONS AND INFORMATION SOURCES
PURPOSE: To minimize this.
NOTE: Since this indicator depends greatly on the healthcare
districts transferring the information in the appropriate format and
characteristics, if the necessary files for assessing this indicator are not
received within an acceptable time period and in due form so that the
healthcare district can assess it, this is considered to be total non-
compliance (0 points).
Percentage of patients with surgery delayed longer than 180
days
OBJECTIVE: To ensure operating compliance with the surgery
guarantee deadlines, even when the choice is not legally required.
DEFINITION: Number of patients with surgery delayed longer than
180 days, divided by the total number of patients on the waiting list
obtained from the LEQ (surgery waiting list) system in the June and
December cutoffs.
SOURCE: The Healthcare Information System Analysis Service.
The LEQ system.
PURPOSE: To minimize this.
The average surgery delay (DMI)
94

CHAPTER 3 ASSUMPTIONS AND INFORMATION SOURCES
OBJECTIVE: To reduce the average time, stated in days, that
patients have to wait until surgery. The waiting time is defined as the
difference in days between the registered date and the cutoff date.
DEFINITION:
where:
FC: the cutoff date or the date on which the indicator is obtained.
FRSi: the date on which patient i is included in the waiting list.
N: the number of patients waiting for surgery on the cutoff date.
The sum includes the N patients who are waiting for surgery on the
cutoff date.
SOURCE: The Healthcare Information System Analysis Service.
The LEQ system.
PURPOSE: To minimize this.
Emergency department waiting times
OBJECTIVE: To reduce the patients' wait times in the emergency
department until receiving medical treatment.
95
CHAPTER 3 ASSUMPTIONS AND INFORMATION SOURCES
DEFINITION: The average waiting time (in hours) for medical
treatment in terms of a standardized emergency department (ED)
triage scale.
SOURCE: SASIS. The SIDO22 emergency information system.
PURPOSE: To minimize this.
NOT APPLICABLE TO: The healthcare districts in which the
hospitals have not implemented the SIDO22 emergency information
system.
Weeks elapsed until the start of treatment once breast
cancer is suspected after a mammogram
OBJECTIVE: To guarantee effective treatment after a breast cancer
screening.
DEFINITION: The 75th percentile of the distribution of the
number of weeks elapsed until the start of treatment.
SOURCE: The Directorate General for Public Health. The Cancer
Office.
PURPOSE: To minimize this.
NOTE: At least 75% of the women should start the treatment within
8 weeks.
96

CHAPTER 3 ASSUMPTIONS AND INFORMATION SOURCES
3.2.2.3 Qualitative economic indicators
Absenteeism index due to non-work-related temporary
disability (IT)
OBJECTIVE: To reduce the impact of non-work-related
absenteeism.
DEFINITION:
where:
ITi: the number of days with temporary disability due to a common
illness or non-work-related accident of worker i in one year.
Ti: the number of days in the contract of worker i in one year.
SOURCE: The Strategic Plan Office.
PURPOSE: To minimize this.
3.2.2.4 Healthcare process indicators
Ambulatory replacement rates
97

CHAPTER 3 ASSUMPTIONS AND INFORMATION SOURCES
OBJECTIVE: To know about the major ambulatory surgery
performed at the hospitals with respect to those that could potentially
be made ambulatory.
DEFINITION: The percentage of operations that could potentially
be part of the major ambulatory surgery.
where:
TSA: the ambulatory replacement rate
Icma: the number of operations made as part of the major
ambulatory surgery of the DRGs that could potentially be made
ambulatory.
NIPA: the total number of operations made of the DRGs that could
potentially be made ambulatory.
SOURCE: The Minimum Basic Data Set (MBDS) and SASIS.
PURPOSE: To maximize this.
Vaginal delivery rates with epidural anesthesia
DEFINITION:
PAE/V
98

CHAPTER 3 ASSUMPTIONS AND INFORMATION SOURCES
where:
PAE: the number of vaginal deliveries with epidural anesthesia
during the period calculated for the indicator.
V: the total number of vaginal deliveries during the period calculated
for the indicator.
SOURCE: The Healthcare Information System Analysis Service.
The Minimum Basic Data Set (MBDS).
PURPOSE: To maximize this.
NOT APPLICABLE TO: Healthcare district 6.
3.2.2.5 Public health indicators
Diabetes screening indicator
OBJECTIVE: To increase the diabetes diagnoses with the aim of
reducing known diabetes.
DEFINITION:
where:
99

CHAPTER 3 ASSUMPTIONS AND INFORMATION SOURCES
DR: the number of patients aged over 45 with blood glucose
recorded in the previous three years.
DT: the number of patients aged over 45 allocated to consultation.
SOURCE: The Abucasis Office. The SIA.
PURPOSE: To maximize this.
NOTE: The hospitals that have implemented Abucasis II less than 12
months are excluded.
3.2.2.6 Safety indicators
Rate of hip fracture surgery with a delay longer than 2 days
(DQFC)
OBJECTIVE: To reduce the delay in hip fracture surgery since this is
associated with poorer treatment results and greater complications.
DEFINITION:
where:
FC48: the number of operations made over 48 hours after the
emergency admission during the period calculated for the indicator.
100

CHAPTER 3 ASSUMPTIONS AND INFORMATION SOURCES
N: the total number of hip fracture operations during the period
calculated for the indicator.
SOURCE: The Healthcare Information System Analysis Service.
The Minimum Basic Data Set (MBDS).
PURPOSE: To minimize this.
OBSERVATIONS: This is calculated using Clinos.CalTM.
The denominator is calculated based on the surgical discharges with
code 820 in any diagnosis position. The numerator is obtained from
the discharges of hip fracture surgery whose pre-operative stay
(surgery date - admission date) is longer than two days.
Three-day readmission rate (RI3)
OBJECTIVE: To monitor and reduce hospital readmissions due to
insufficient treatment in previous episodes.
DEFINITION:
where:
101

CHAPTER 3 ASSUMPTIONS AND INFORMATION SOURCES
R3: the number of discharges which are readmitted within three days
for whatever reason, excluding Friday discharges that are readmitted
on Sunday during the period calculated for the indicator.
N: the total number of discharges during the period calculated for
the indicator.
SOURCE: The Healthcare Information System Analysis Service.
The Minimum Basic Data Set (MBDS).
PURPOSE: To minimize this.
NOTE: We excluded the weekend discharges since this could provide
a substantial bias at some hospitals. Although this could lead to
under-reporting, it would take place with approximately the same
degree in all the healthcare districts, so it should not affect the
comparison. The DRG and the diagnosis are not considered because
they depend on factors related to the coding, which may not detect
the readmissions which are readmissions. In this case, there could be
over-reporting which, as in the previous one, would also affect all the
areas equally.
3.2.3 Structural variables
INSTALLED BEDS: The beds that form part of the hospital's
equipment which may or may not be in service for different reasons,
102

CHAPTER 3 ASSUMPTIONS AND INFORMATION SOURCES
such as lower healthcare demand, construction work and lack of staff.
The beds can be as follows:
- Available beds: those which can be occupied.
- Non-available beds: those which are not in service at a specific time,
such as during the holidays or for the reasons stated in the first
paragraph.
- Extraordinary beds: those which, due to the hospital's needs, exceed
the supply available at the hospital.
- Working beds: the total beds installed and available for use,
including, where applicable, the extraordinary beds.
Therefore, the working beds include:
The available ones, the pediatric cots and the fixed incubators, as well
as the beds in the short-term units and the extraordinary beds. The
working beds do not include: the cots of newborn babies without
complications, the beds used for the emergency departments or the
armchairs or beds for the day hospital, pre-anesthesia, operating
rooms and dialysis.
OPERATING ROOMS: the rooms where the operations are made,
regardless of the type of surgery, with admission, ambulatory or
minor, excluding delivery rooms.
103

CHAPTER 3 ASSUMPTIONS AND INFORMATION SOURCES
DELIVERY ROOMS: the operating rooms which are devoted solely
to obstetrics.
OUTPATIENT BOXES: the outpatient unit in a hospital devoted to
outpatients.
EXAM ROOMS IN THE EMERGENCY DEPARTMENT: the
exam rooms where the emergency healthcare treatment is given and
an assessment is made before any other process (surgery or
admission), if necessary.
TREATMENT AND PLASTER ROOMS IN THE EMERGENCY
DEPARTMENT: the rooms in the Emergency Department where
treatment is provided in the first case and plaster is placed to
immobilize the injured body part in the second case.
OBSERVATION BEDS IN THE EMERGENCY DEPARTMENT:
the rooms in wards with permanent nursing staff and constant
patient monitoring.
INCUBATORS: the devices used in neonatology for premature
babies where there is an optimal temperature and humidity for the
growth of newborn babies. This closed chamber limits the exposure
of newborns to germs. They monitor heart rates, breathing rates and
brain activity.
104

CHAPTER 3 ASSUMPTIONS AND INFORMATION SOURCES
INTERVENTIONAL ROOMS: the rooms where surgical
procedures are carried out using images. Their purpose is to perform
minimally invasive processes, mainly by using needles, tubes and
catheters.
COMPUTERIZED AXIAL TOMOGRAPHY EQUIPMENT: the
equipment itself and the tests made with it are commonly known as
CT scans. It is an imaging procedure that uses X-rays to obtain cuts
or sections of anatomical objects. While conventional radiology
provides one image, the CT scan provides multiple images since the
source of the rays rotates around the body.
MAGNETIC RESONANCE EQUIPMENT: this equipment
performs a non-invasive procedure that uses nuclear magnetic
resonance to obtain information about the structure and composition
of the body to be analyzed. This information is processed in
computers and transformed into images to observe the alterations in
the tissues. They are frequently used for detecting cancer.
RENAL LITHOTRIPSY EQUIPMENT: this equipment provides a
non-invasive treatment for bladders or ureters, breaking up kidney
stones.
105

CHAPTER 3 ASSUMPTIONS AND INFORMATION SOURCES
3.2.4 Variables in healthcare activity
Healthcare production
HOSPITAL EMERGENCIES: patients cared for by the hospital's
emergency service, even if they are not admitted to hospital.
FIRST VISITS: the ambulatory healthcare received by patients from a
specialist doctor for the first time due to a specific disease.
The following are also considered to be first visits:
- The visits to the primary healthcare unit rerouted to the hospital.
- The visits from another specialist unit.
- When a hospital admission requests this for a specialist other than
the one for which it was admitted.
SUBSEQUENT VISITS: the ambulatory healthcare received by
patients for the same disease within the specialist unit. We distinguish
the following:
- Subsequent visits for results: these are the subsequent visits in which
the supplementary tests or examinations requested in the first visit are
assessed.
106

CHAPTER 3 ASSUMPTIONS AND INFORMATION SOURCES
- Ordinary subsequent/checkup visits: these are the subsequent visits
not included in the preceding definition.
HOSPITAL STAY: the unit that measures how long the patients stay in
hospital occupying a bed in a time interval (Vargas González and
Hernández Barrios, 2007).
This is usually measured at 0:00 hours. The minimum stay is
considered to be when a patient stays one night and receives one
main meal (lunch or supper) at the hospital; if the patient stays less
than this amount, it is not considered to be a stay. The following are
not considered to be a stay: observation in the emergency
department, the hemodialysis units, the day hospital or the intensive
care unit.
To calculate hospital stays, we simply subtract the date and time of
the admission from the date and time of the administrative discharge.
HOSPITAL DISCHARGE: this is understood as the moment in which
the patients admitted to hospital vacate the bed in which they stayed.
The reasons for a discharge are as follows:
- Death
- Voluntary discharge
- Medical discharge
107

CHAPTER 3 ASSUMPTIONS AND INFORMATION SOURCES
- Transfer to another hospital
If patients have to be transferred to another hospital, this is not
considered to be a discharge since the bed will not be free until their
return, once the tests or formalities have been made in the other
centre.
If this happens, the patients' stay at the other hospital continues to be
calculated, provided that they do not stay overnight at the other
center.
EQUIVALENT PATIENTS: this is the variable we use to explain the
healthcare activity since talking about medical or surgical acts or
visits is very broad due to the case mix that can take place in each
hospital episode. We used a standardized measurement to explain the
resource utilization. The higher the equivalent patient in a centre, the
higher the resource utilization should be in principle. This variable
can be for the whole hospital or for one area: inpatient, surgical,
outpatient and emergency services; in this way, we can obtain a more
in-depth analysis of the healthcare activity.
To calculate the equivalent patients based on the activity area, we
used the following equivalency table. For the medical and surgical
procedures, we calculated it by using the Minimum Basic Data Set
(MBDS) of each hospital. For the visits and the emergency
department, we used SISAL's results.
108

CHAPTER 3 ASSUMPTIONS AND INFORMATION SOURCES
Such equivalencies are a commonly used standard in the healthcare
industry (IASIST, 2009).
Table 7. Equivalency of the processes to calculate the equivalent patients
Source: IASIST
CASE MIX: a hospital's case mix is determined by the complexity of
the diseases treated at the hospital.
The term "case mix complexity" refers to the specific features of the
patients treated at the hospital, including the need for resource
utilization, the diagnosis and the severity of the illness.
Based on the relative weighting of the diagnosis-related groups
(DRGs) which we will explain in the next section, we can measure the
case mix complexity of a hospital by calculating the average for the
weighting, weighted by the number of discharges in each DRG. The
average complexity measurement of the patients cared for is included
Area Equivalency
Surgical procedures The complexity of the DRGs
Medical procedures The complexity of the DRGs
First outpatient visits 0,033
Subsequent outpatient visits 0,02
Emergency Room 0,04
109

CHAPTER 3 ASSUMPTIONS AND INFORMATION SOURCES
in this case mix index. This index enables us to compare hospitals in
relation to the type of patients treated. In turn, we can divide this
index into medical or surgical, or as a whole.
3.3. Cost breakdown method
We used the following cost breakdown method:
1. Using a hospital's Minimum Basic Data Set (MBDS) as the
baseline for a specific period (2009 and 2010), we divided it into two
files: one file with the surgical procedures that include major
ambulatory surgery (MAS) and the other which groups the medical
procedures.
2. After dividing this, we calculated the overall sum of each DRG so
that we could have all the cases and their total weighting for each
one. To do this, we weighted the total weighting of the DRG divided
by the number of cases to obtain the relative weight in equivalent
patients. With that data, we obtained the percentage of complexity of
that DRG with respect to the total equivalent patients of a hospital's
surgical or medical area in a specific period.
3. The next step was to break down the total cost of each source
(staff, healthcare material and pharmacy) based on the adjusted
110

CHAPTER 3 ASSUMPTIONS AND INFORMATION SOURCES
percentage of this procedure with respect to the total, in line with the
following function:
[(sum of the weighting of the DRG) / (equivalent patients)] x total €
allocated to the area.
4. This adjusted percentage was used for the breakdown of each cost
based on its source. In this way, we obtained the following subdivision
for each DRG per year and centre, grouping or ungrouping it as
needed:
- Cost of the medical staff
- Cost of the non-medical healthcare staff
- Cost of the non-healthcare staff
- Cost of the pharmacy
- Cost of the healthcare material
Using this information, we added the total cost per DRG and divided
it into the number of cases to obtain the average cost.
One variable that we used in the chapter on results was the COST
PER EQUIVALENT PATIENT.
This value is determined by the following expression:
111

CHAPTER 3 ASSUMPTIONS AND INFORMATION SOURCES
Cost of the hospital or area to be analyzed / Equivalent patients of
hospital or area to be analyzed.
112

CHAPTER 3 ASSUMPTIONS AND INFORMATION SOURCES
4. RESULTS
113

CHAPTER 4 RESULTS
4.1 Cost analysis
This section analyzes the cost differences by using the graphs of the
various hospitals and comparing the results from the directly
managed hospitals (H) with the Concessions (C).
4.1.1 Main healthcare indicators
Table 8 analyzes the main healthcare indicators in procedures with
hospital admission.
This chapter details the results from the efficiency assessment made on the PPPs
compared to the directly managed hospitals. Firstly, we grouped the hospitals
into clusters, a criterion that will be maintained when comparing the equivalent
patients by using comparative graphs and regression models. Lastly and to
assess the efficiency using the DEA, we added the quality indicators to the
economic and structural ones
114

CHAPTER 4 RESULTS
Table 8. Main hospital activity indicators in 2010
Source the author.
Tables 8 and 9 show the hospitals from the largest to smallest case
mix. In this case, the mix shows the complexity of the surgical and
medical procedures with respect to the total discharges. We excluded
the ambulatory activity in visits to the doctor and the emergency
department.
We calculated the average for the total of the case mix and average
stay since they are more representative than the total sum.
115

CHAPTER 4 RESULTS
The discharges at the PPPs represent a 19% of the total in the
Valencia region, with a higher percentage in surgical than medical
discharges (21% and 17%, respectively).
The number of stays at the hospitals under concession account for
13% of the total in the Valencia region. We believe that this average
stay is an interesting indicator because of its variability. In principle,
the larger the case mix, the longer the hospital stay because of the
larger complexity in the hospital procedure. We can see that the
hospitals with the largest case mix were those with a longer average
stay (H22 and H8). Nevertheless, for example, C4, which has the
fourth largest case mix in terms of discharges, has one of the shortest
average stays in the Valencia region, i.e. 4.22 days, a minimum
difference of 3 days with respect to the hospitals that deal with
greater complexity in their procedures.
The average hospital stay in the Valencia region is 6.84 days,
although all the concessions are below this value. C2, with an average
stay of 4 days, has the shortest stay among the concessions.
116

CHAPTER 4 RESULTS
Table 9. Main indicators of ambulatory production in 2010
Source: The author
The outpatient services at the PPPs represent a 22% of the total in
the Valencia region, excluding concession C5. The reason for this is
that its ratio of their subsequent to first visits does not seem coherent
in table 9. We believe that this indicator is interesting since the PPPs
are more efficient in managing their ambulatory activity in outpatient
services. The average ratio for subsequent visits to the first visit in the
Valencia region is 2.55: this indicator is 1.95 among the PPPs and
2.81 among the directly managed hospitals, i.e. 44% higher.
117
CHAPTER 4 RESULTS
The emergency services at the PPPs account for 16% of the total in
the Valencia region.
4.1.2 Cluster analysis
To calculate the clusters, we took into account the activity and
structural equipment variables. We specifically considered the
following: total equivalent patients, operating rooms, emergency
treatment rooms, interventional rooms, recovery rooms in the
emergency departments, emergency plaster rooms, renal lithotripsy
equipment, magnetic resonance equipment, CT scan equipment,
incubators, consulting rooms, delivery rooms, installed beds and
observation beds in the emergency departments.
The dendrogram in graphic 9 shows the logical representation in a
tree diagram of the formation process of the hospital groups and the
resulting three groups that are formed.
118

CHAPTER 4 RESULTS
Graphic 9. Dendrogram showing the clusters
Dendrogram that uses an average link (between groups) Rescaled distance cluster combine
Source: the author.In this way, we classified the hospitals into three groups. Four
concessions were included in group 1 (C2, C3, C4 and C5) and one
(C1) in group 2:
119

CHAPTER 4 RESULTS
Group 1: H6, H18, H7, H16, H4, C5, H12, H15, H19, H13, H21,
C2, C4, H5, H17, C3 and H14.
Group 2: H1, H20, H2, H11, C1, H8 and H10.
Group 3: H22.
Group 1 is formed by small and mid-sized area and district hospitals;
group 2 by reference hospitals with a larger structural equipment and
a broad service portfolio; and group 3 by the benchmark hospital for
the Valencia region since it is the largest and has the greatest
complexity in the procedures that it deals with.
4.1.3 Overall hospital costs in the Valencia region
Graphic 10 shows the annual direct spending in specialist healthcare
in the Valencia region in 2010.
Excluding concessions C4 and C5 since we do not have their
information, the overall cost exceeded 1.06 billion euros; the
concession with the highest cost was C1, with nearly 56 million euros.
We must remember that these data do not include the total hospital
cost because of the limitations stated in chapter 3.
The benchmark hospital H22 has a cost of 180 million euros, which
is more than double the second-largest in terms of the budget (H11).
120

CHAPTER 4 RESULTS
G
raph
ic 1
0. O
vera
ll di
rect
cos
ts p
er h
ospi
tal i
n 20
10 (
in m
illio
ns o
f eur
os)
Sour
ce: t
he a
utho
r.
Millions
121

CHAPTER 4 RESULTS
Graphic 2: Coste Global directo por hospital
4.1.4 Cost per equivalent patient and area
In this section, we will show the cost per equivalent patient (PEQ) for
each of the hospital's main activity areas:
‣ Inpatient care (medical procedures).
‣ Surgery (surgical procedures with or without admission).
‣ Outpatient services.
‣ Emergency department.
122

CHAPTER 4 RESULTS
Gra
phic
11.
Cos
t pe
r eq
uiva
lent
pat
ient
in t
he in
patie
nt c
are
area
in 2
010
Sour
ce: t
he a
utho
r
Cos
t per
Equ
ival
ent P
atie
nt (i
npat
ient
are
a)Av
erag
e
123

CHAPTER 4 RESULTS
Graphic 3: Coste por paciente equivalente en hospitalizaciónIn graphic 11, the x-axis shows the hospitals arranged from biggest to
smallest cost: hospital H6 has the biggest cost, with 2,546 euros per
equivalent patient, and H3 the smallest, with 242.1 euros. Therefore,
there is a wide variability in the medical area's costs.
This may be due partly to the fact that the surgical procedures with
admission have a part of their DRG cost allocated to the inpatient
care area.
The average cost for the hospitals in the Valencia region is 976.15
euros, with a standard deviation of 548.45 euros.
The PPPs are in 5th, 9th and 11th place in terms of the hospitals with
the highest cost per equivalent patient in the medical area; C1 and
C3 are higher than the average in the Valencia region and C2 is
practically the same as the average, although slightly higher at 979.76
euros.
124

CHAPTER 4 RESULTS
GIn graphic 12, the x-axis shows the hospitals arranged from biggest to
smallest cost per equivalent patient in the surgical area: hospital H21
has the biggest cost, with 1,490 euros per equivalent patient, and
concession C2 the smallest, with 640.35 euros.
The average cost in this case is 1,056 euros, with a standard deviation
of 231.62 euros, so the data variability is lower than in the case of the
inpatient care area.
We can see that all the surgical areas that exceed the average are
directly managed hospitals. The three PPPs are among the six
hospitals with the lowest cost per equivalent patient.
Likewise, the two hospitals with the lowest cost per equivalent patient
are concessions C2 and C1, with 706 euros and 640 euros,
respectively.
.
125

CHAPTER 4 RESULTS
Gra
phic
12.
Cos
t pe
r eq
uiva
lent
pat
ient
in t
he s
urgi
cal a
rea
in 2
010
Sour
ce: t
he a
utho
r
Aver
age
Cos
t per
sur
gica
l equ
ival
ent p
atie
nt
126

CHAPTER 4 RESULTS
Gra
phic
13.
Cos
t pe
r eq
uiva
lent
pat
ient
in
the
outp
atie
nt s
ervi
ce a
rea
in 2
010
Sour
ce: t
he a
utho
r
Aver
age
Cos
t per
equ
ival
ent p
atie
nt (o
utpa
tient
are
a)
127

CHAPTER 4 RESULTS
In graphic 13, the x-axis shows the hospitals arranged from biggest to
smallest cost per equivalent patient in the outpatient services.
As stated in chapter 3, to calculate the equivalent patients in the
outpatient services, we took into account the first and subsequent
visits, weighting the complexity of both to match their weighting in
the DRGs (table 7).
Hospital H22 had the biggest cost, with 3,393.50 euros per
equivalent patient, and hospital H18 had the lowest, with 847.67
euros.
The only concession that exceeds the average of all the hospitals is
C3, with 1,658 euros, slightly higher than the average cost of the
outpatient services, which is 1,633 euros per equivalent patient. In
the outpatient services, there is considerable variability since there is
a standard deviation of 609.2 euros, or 400.54 euros if we take out
the two outlier hospitals from the analysis (H22 and H18).
128

CHAPTER 4 RESULTS
Graphic 6 Coste por paciente equivalente en Urgencias
Gra
phic
14.
Cos
t pe
r eq
uiva
lent
pat
ient
in t
he e
mer
genc
y de
part
men
t ar
ea in
201
0 Sour
ce: t
he a
utho
r
Aver
age
Cos
t per
equ
ival
ent p
atie
nt in
Em
erge
ncy
Roo
m
129

CHAPTER 4 RESULTS
In graphic 14, the x-axis shows the hospitals arranged from biggest to
smallest cost per equivalent patient in the emergency department
area.
We weighted the activity in the emergency department in accordance
with table 7 to adjust the activity to the equivalent patients, as we did
with the outpatient services.
In this case, hospital H6 had the biggest cost, with 4,242 euros per
patient, and H18 the lowest (like the outpatient services), with 1,559
euros.
The only concession that exceeds the average of all the hospitals is
C3, with 2,998 euros; it has the fourth largest cost per equivalent
patient. The other two concessions are below the average of 2,370
euros and the standard deviation is 640.37 euros.
4.1.5 Healthcare production in equivalent patients by
area
When analyzing the hospitals' activities and comparing them, we
decided to make an adjusted analysis by area in terms of equivalent
patients by taking advantage of the cluster shown in section 4.1.2.
We used three levels:
130

CHAPTER 4 RESULTS
- Equivalent patients with medical and surgical admission, plus
the major ambulatory surgery episodes.
- Equivalent patients in the outpatient services.
- Equivalent patients in the emergency department.
CLUSTER 1
Graphic 15. Equivalent patients in the medical and surgical area in cluster 1
#
Source: the author.
In graphic 15, the x-axis shows the hospitals in the cluster, arranged
from the highest to lowest number of equivalent patients in group 1,
in the inpatient and surgical areas.
131

CHAPTER 4 RESULTS
We can see that the first in the group is concession C2, with 33,234
equivalent patients, followed by four directly managed hospitals
(H14, H17, H13 and H5, respectively). The other PPP in the group is
in sixth place out of a total of 15 hospitals analyzed. The average for
this variable is 19,312 equivalent patients, and both PPPs exceed this
value.
Graphic 16. Equivalent patients in the outpatient service area in cluster 1
#
Source the author
In graphic 16, the x-axis shows the hospitals in cluster 1, arranged
from the highest to lowest number of equivalent patients in the
outpatient service area.
Once again, we can see that concession C2 heads this group with the
largest number of equivalent patients, and concession C3 is the third
132

CHAPTER 4 RESULTS
one in the group of 15 hospitals, with 5,040 and 4,160 equivalent
patients, respectively.
On the other hand, the two hospitals with the lowest number of
patients are H6 and H18, with 2,337 and 2,318, respectively.
Graphic 17. Equivalent patients in the emergency department area in cluster 1
#
Source :the author
In graphic 17, the x-axis shows the hospitals in the cluster, arranged
from the highest to lowest number of equivalent patients in the
emergency department area.
In this case, the ranking has changed completely with respect to the
preceding ones since the first concession that appears is C2 in sixth
place and then C3 in eleventh.
133

CHAPTER 4 RESULTS
CLUSTER 2
Graphic 18. Equivalent patients in the medical and surgical area in cluster 2
Source: the author.
In graphic 18, the x-axis shows the hospitals in the cluster, arranged
from the highest to lowest number of equivalent patients in group 2,
in the inpatient and surgical areas.
The first three in this comparison are directly managed hospitals and
the fourth one is concession C1, whose number of equivalent patients
is 43,809, slightly higher than the group average of 42,300.
The hospitals that head this analysis are H11, H8 and H10.
134

CHAPTER 4 RESULTS
Graphic19. Equivalent Patients outpatient area in Cluster 2.
���Source: the author
In graphic 19, the x-axis shows the hospitals in cluster 2, arranged
from the highest to lowest number of equivalent patients in the
outpatient service area.
In this case, the breakdown changes with respect to graphic 18 which
shows the inpatient and surgical areas. Hospital H10 has the highest
value, followed by concession C1, with 8,753 and 8,097 equivalent
patients, respectively.
135

CHAPTER 4 RESULTS
Graphic 20. Equivalent patients in the emergency department area in cluster 2
Source: the author.
In graphic 20, the x-axis shows the hospitals in the cluster, arranged
from the highest to lowest number of equivalent patients in the
emergency department area.
As stated for graphic 20, the ranking changes substantially: C1 is in
fifth place, behind H8, H11, H10 and H1, respectively.
136

CHAPTER 4 RESULTS
4.1.6 Assessment of the activity through an adjusted
cost-production analysis
In this section, we analyze each area from two standpoints: on one
hand, the direct cost allocated to each area and, on the other, the
healthcare production in equivalent patients in their respective area.
In this way, we can analyze the hospitals' efficiency insofar as these
aggregates are more separate in the graphic since, the lower the cost,
the higher the volume of patients or, failing this, the more complex
the volume of patients.
The y-axis shows the cost, arranging the hospitals based on this
criterion from a larger to a lesser extent.
Graphic 21 shows the cost in the inpatient and surgical areas
compared with the equivalent patients with admission and major
ambulatory surgery, which we then disaggregate to see each one's
specific features:
• Inpatient area cost - equivalent patients
• Surgical area cost - equivalent patients
137

CHAPTER 4 RESULTS
Graphic 13: Coste quirófano y hospitalización
Gra
phic
21.
Cos
t of
the
sur
gica
l and
med
ical
are
a co
mpa
red
with
the
equ
ival
ent
patie
nts
Sour
ce: t
he a
utho
r.
Surg
ical
and
inpa
tient
cos
tEq
uiva
lent
pat
ient
s (s
urgi
cal a
nd in
patie
nt a
reas
)
Millions
Equi
vale
nt
Patie
nts
138

CHAPTER 4 RESULTS
comparado con los
Graphic 21 shows the cost of the surgical and medical area of the
patients admitted to hospital plus those operated in an ambulatory
way.
We can see that H21 and H26 are inefficient compared with the rest
of the sample since their curve of equivalent patients is below the
cost.
Regarding the concessions, the distance between the cost and
equivalent patients of C1 and C2 is greater than the rest, although
C3 is closer and, therefore, less efficient.
Hospital H10 provides the best result because of the distance
between its cost and its curve of equivalent patients.
s
139

CHAPTER 4 RESULTS
E n l a Graphic 14 representamos la distribución del
Gra
phic
22.
Inpa
tient
cos
t co
mpa
red
with
the
equ
ival
ent
patie
nts
Sour
ce :
the
auth
or
Tota
l cos
t (in
patie
nt a
rea)
Equi
vale
nt p
atie
nts
(inpa
tient
are
a)
Millions
140

CHAPTER 4 RESULTS
coste y de los
Graphic 22 shows the breakdown of the cost and equivalent patients
in the inpatient care area, with a less linear distribution than in
graphic 21.
The directly managed hospitals H6 and H21 continue to be
inefficient compared with the rest of the group. We can also see a big
difference between the various hospitals analyzed; the most efficient
ones in the comparison are H17, H14, H10 and H11.
If we break down the preceding graph into two, the PPPs are
approximately in the same efficiency range although the hospitals
with a similar cost (H8 and H10) have a larger number of equivalent
patients in the inpatient care area, although they do not stand out
with respect to the aforementioned ones.
141

CHAPTER 4 RESULTS
Gra
phic
23.
Cos
t of
ope
ratin
g ro
oms
com
pare
d w
ith t
he e
quiv
alen
t pa
tient
s
Equi
vale
nt p
atie
nts
(sur
gica
l are
a)To
tal c
ost (
surg
ical
are
a)
Millions
Sour
ce :
the
auth
or
Equi
vale
ntPa
tient
s
142

CHAPTER 4 RESULTS
Graphic 23 shows the breakdown of the cost in the surgical area with
respect to its equivalent patients.
In this comparison, few hospitals are efficient; specifically, the directly
managed hospitals H11, H10 and H8, and the concessions C1 and
C2. This efficiency is even more evident if we compare them with the
hospitals of a similar cost (H20 and H14).
The most inefficient hospitals in this analysis are H1, H20, H14 and
H2.
4.2 Analysis of the healthcare quality
Because of the importance of this factor in the healthcare industry,
we believe that it should be included in a separate section in the
chapter on results.
Firstly, we will show the position obtained by the healthcare districts
in the Management Agreements in 2010 after their corresponding 95
indicators were measured. Secondly, we will focus on the hospital
indicators that we think are most important, so that we can analyze
them together with the cost or healthcare production variables, thus
establishing whether there are significant differences depending on
the type of management.
143

CHAPTER 4 RESULTS
Table 10. Relative position of the Management Agreements in 2010
Source: Valencia Health Department .
Table 10 shows the overall score and relative position of each
healthcare district in 2010.
The top scorer is a directly managed district, H4, followed by
concession C2. In the analysis made by the Valencia Health
Department every year, four PPPs are among the top seven.
Concession C4 has the lowest score, with 73.6%, so it is 15th among
144

CHAPTER 4 RESULTS
the 25 hospitals. Nevertheless, all the PPPs are higher than the
average for the Valencia Health Department (71.69%).
We established three cost comparisons per equivalent patient with the
quality indicator of the area obtained in the Management
Agreements.
When analyzing the perception of healthcare quality, we focused on
the delay indicators by area since patients and managers consider
that a delay in a diagnosis or treatment is one of the key performance
indicators.
Specifically, we included the following:
‣ Wait time in the emergency department.
‣ Average delay for surgical operations.
‣ Delay in the first visit to the specialist doctor.
In all three cases, we excluded the hospitals that do not have the
results of both variables, i.e. the cost per equivalent patient and the
corresponding quality indicator of the area.
To highlight the qualitative results in this subsection, we arranged the
hospitals from longest to shortest delay.
4.2.1 Quality Analysis in Emergency Department
145

CHAPTER 4 RESULTS
Graphic 16: Análisis de la calidad en el área de Urgencias
Gra
phic
24.
Qua
lity
anal
ysis
in t
he e
mer
genc
y de
part
men
t
Aver
age
wai
ting
time
(min
utes
)
Sour
ce: t
he a
utho
r
Cos
t per
equ
ival
ent p
atie
nt
Min
utes
Cos
t pe
r EP
146

CHAPTER 4 RESULTS
Graphic 24 shows the wait time in the emergency department in bars
and the cost per equivalent patient in the trend line, so that we can
analyze the relationship between the following three variables: cost -
healthcare production weighted by complexity (cost per equivalent
patient) - wait time.
Hospital H10 has the longest wait time in the emergency
department, specifically an average of 12 hours, considerably
exceeding the average for the hospitals of the Valencia Health
Department which, excluding H10, is under 4 hours. We believe that
this is not a coherent result since it may be due to internal and
administrative patient discharge procedures in the emergency
department. Nevertheless, the cost per equivalent patient at H10 is
1,692 euros, which is actually below the average for the rest of the
sample.
Hospitals H10 to H17, inclusive, have a wait time of over 4 hours,
including concession C2.
Concession C2 stands out because, with a wait time similar to that of
H19 and H8, its cost per equivalent patient is 330 euros higher.
Hospital H6 also stands out because, with a delay of 192 days, it
requires a considerably higher economic effort than the other
hospitals and its cost per equivalent patient is 4,242 euros.
147

CHAPTER 4 RESULTS
Concession C1 is below the average wait time, with 223 minutes, and
its cost per equivalent patient is among the top seven in this indicator.
4.2.2 Quality analysis in the surgical area
Graphic 17 Análisis de la calidad en el área quirúrgica
148

CHAPTER 4 RESULTS
Gra
phic
25.
Qua
lity
anal
ysis
in t
he s
urgi
cal a
rea
Sour
ce: t
he a
utho
r
Cos
t per
equ
ival
ent s
urgi
cal
Aver
age
surg
ical
del
ay (d
ays)
Days
Cos
t per
EP
149

CHAPTER 4 RESULTS
Graphic 25 analyzes the average delay for operations at the various
hospitals with respect to the cost per surgical equivalent patient.
This value goes from 26 days at H7 to 81 days at H22, which is the
hospital with the lowest cost per equivalent patient with respect to the
delay.
Concession C2 has the second shortest delay, with 29 days,
considerably lower than the average for the Valencia Health
Department in the sample, with 41.5 days. C2 also has the lowest cost
per equivalent patient of all the hospitals, with 640 euros.
Concession C1 has the second lowest cost per equivalent patient,
with 706 euros, but the delay is 46 days. If we compare the hospitals
with a similar delay to that of C1, we can see that its cost per
equivalent patient is higher, as in the case of H1, which is 1,108
euros, and H5, which is 987 euros.
Concession C3 has a shorter delay and a lower cost per equivalent
patient than the average but, compared with the other hospitals that
have a similar delay, such as H10, it has a higher cost per equivalent
patient.
Hospital H12 stands out because it is very inefficient in its surgical
area since, apart from having a high cost per equivalent patient, it
also has the third longest delay for operations, with 51 days.
150

CHAPTER 4 RESULTS
4.2.3 Quality Analysis in the outpatient area.
151

CHAPTER 4 RESULTS
Gra
phic
26.
Qua
lity
anal
ysis
in t
he o
utpa
tient
are
a
Sour
ce: t
he a
utho
r.
Cos
t per
EP
Days
Aver
age
dela
y in
firs
t spe
cial
ized
vis
it (d
ays)
Cos
t per
equ
ival
ent p
atie
nt
152

CHAPTER 4 RESULTS
Graphic18: Análisis calidad en consultas externasGraphic 26 shows the delay in the first visits to the hospital with
respect to the cost per equivalent patient. This cost includes and
weights the first and subsequent visits.
We can see that the delay goes from 21 days at H7 to 136 days at
H18. The hospital with the longest delay has the lowest cost per
equivalent patient in the sample.
Conversely, H22 is in 12th place since it has the highest cost per
equivalent patient, with 3,393 euros.
The concession with the shortest delay in the first visits is C2, with 32
days and 1,206 euros in the cost per equivalent patient. The other
two hospitals with the shortest delays are H16 and H7 but their cost
per equivalent patient is considerably higher than C2, with 1,947
euros and 1,921 euros, respectively.
If we analyze C1 with respect to the hospitals with a similar delay, we
can see that it is 40 days and its cost per equivalent patient is 1,092
euros, i.e. below that of H4, which has a delay of 40.24 days and a
cost per equivalent patient of 1,421 euros, and below that of H10,
whose delay is 5 days shorter than C1 but has a higher cost per
equivalent patient, with 1,619 euros.
153
CHAPTER 4 RESULTS
4.3 Analysis of the healthcare activity
The sections below are structured in the following way: firstly, we
made a linear regression analysis, taking the overall cost as the
dependent variable and the equivalent patients as the explanatory
variable since this could be one of the variables that has the greatest
effect on the cost variable. The relationship between these variables is
set out in graphic form so that we can see where each hospital is
(graphic 27).
Subsequently, we made a general linear regression analysis, where the
dependent variable is still the cost and the variables described in
sections 3.2.3 and 3.2.4 have been included as the explanatory
variables.
The structure used for this analysis was firstly based on the overall
data and we subsequently repeated this specifically in each area:
medical, surgical, outpatient services and the emergency department.
The general linear regression analysis for the hospital areas takes into
account the importance of each variable in the actual activity of each
area so that it can be included in the model.
To analyze both the overall costs and the cost by area, we excluded
hospitals C4 and C5 because we did not have the data.
154

CHAPTER 4 RESULTS
4.3.1 Overall healthcare production
Graphic 27 shows the total costs of each hospital with respect to its
activity, i.e. with respect to the equivalent patients cared for, which
provides a very clear view of a hospital's tasks. The hospitals under
direct management are in green and PPPs are in orange.
Although the breakdown conforms quite well to the average (we
obtained a correlation coefficient of R2 = 0.926), hospital H22 has
higher total costs than the average with respect to the equivalent
patients that it cares for.
155

CHAPTER 4 RESULTS
Graphic 27. Linear regression analysis of the cost and overall equivalent patients
However, the comparison between hospitals must be made by taking
into account their structural characteristics, so the groups calculated
in section 4.1.2 should be taken as the reference.
Equivalent patients
Tota
l cos
t
Source: the author
156
CHAPTER 4 RESULTS
To obtain the equation that predicts the total cost based on the
number of equivalent patients cared for, we made a regression
analysis with the following results:
Y = -6,624,721.493 +1,394.027 X
where:
Y = total costs
X = Equivalent patients
As stated previously, this model explains 92.6% of the data variability.
In other words, to obtain the expected cost of a hospital, we would
simply replace its equivalent patients in the equation obtained:
TOTAL COST = -6,624,721 + 1,394 (equivalent patients)
Since the coefficient is negative, this equation is valid from the
number of equivalent patients in which the line crosses the abscissa
axis.
Subsequently, we made a general linear regression analysis to explain
the total costs, except the quality indicators. In other words, to
explain the variables defined in sections 3.2.3 and 3.2.4.
157

CHAPTER 4 RESULTS
Table 11 shows the three models obtained. In model 1, we included
the equivalent patients by area (surgical, emergency, medical and
outpatient) and the stays (medical and surgical). The most significant
variables were the equivalent patients in the surgical area and the
type of management. In model 2, we included the aforementioned
variables but we considered the total equivalent patients and the total
stays, and not by area as in model 1. This means that the equivalent
patients in the surgical area have a larger weighting when
determining the total cost. In model 3, we excluded the type of
management since it was the least significant variable.
We used the stepwise method to include the significant variables.
Table 11. Results of the overall analysis using the general linear regression model.
Source: the author.
VARIABLES Model 1 Model 2 Model 3Coefficients Coefficients Coefficients
Constant α 3.876.981,767 -‐9.070.831,10
Total equivalent pa&ents β1 1.255,501 1.211,854
Equivalent pa&ents in the surgical area β2
2.681,385
Type of Management β3 -‐19.818.259,95 -‐12.127.095,94No of interven&onal rooms β4 2.159.343,130 2.758.203,034R2 ,924 ,933 ,916Adjusted R2 ,917 ,923 ,91
p < 0,05 0 ,000 ,000
F 133,645 97,07 97,07
N (number of hospitals) 24
158

CHAPTER 4 RESULTS
The most explanatory is model 2, where the total cost is explained by
the "total equivalent patients", "type of management" and
"interventional rooms", as can be seen in table 11. The coefficient of
the "type of management" variable is negative, so being a PPP has a
negative effect on the total costs.
However, if we see the coefficients shown in model 2 (Bequivalent patients
= 0.811, Btype of management = -0.135 and Binterventional rooms = 0.180), the
"equivalent patients" variable is more explanatory. It is the variable
that has a considerably greater effect on the explanation for the total
costs; it obviously has a positive sign since an increase in the number
of equivalent patients will lead to a rise in costs. Model 2 can explain
92.3% of the data variability, although models 1 and 3 have a similar
explanatory capacity. All the variables that can be seen in table 11 are
significant in the analysis; in other words, t > 0.05.
4.3.2 Healthcare production in the medical area
In this section, we repeated the structure used in the preceding
analysis, focusing on the medical area.
Therefore, we firstly made a simple regression analysis by taking the
equivalent patients of the medical area as the variable which explains
the total cost of the area.
Graphic 28 shows the hospitals based on these two variables.
159

CHAPTER 4 RESULTS
Graphic 28. Linear regression of the cost and equivalent patients in the medical area
#
Source: the author.Graphic 28 shows the equation where the hospital complexity
explains the total costs of the medical area:
Y = -5,562,434.216 + 1,455.836 X
where:
Y = total hospital costs
X = Equivalent patients (medical area)
Equivalent patients (inpatient)
Inpa
tient
cos
t
160

CHAPTER 4 RESULTS
This model explains 78.7% of the data variability.
We then made a general linear regression analysis following the
criteria and guidelines stated in section 4.3; in other words, we
included all the variables addressed by the study, except the quality
indicators and the variables that do not have a direct relationship to
the activity of the hospital area, with the aim of obtaining a model
with a higher explanatory capacity.
As can be seen in table 12 for the hospital activity, we obtained a
model in which the cost is explained by the "number of installed
beds" and the "type of management".
Table 12. Results of the general linear regression analysis in the medical area
Source:the author
Non standardized coefficient
Standardized coefficients
Sig
Constant α -‐6.073.784,53 ,007
Installed beds β1 48.917,28 ,955 ,000
Type of management β2 9.289.639,82 0,247
R2 0,872
Adjusted R2 ,860
p < 0,05 ,000
F 68,4
N 23
161

CHAPTER 4 RESULTS
The following expression shows the equation of the line in which the
installed beds and type of management explain the costs of the
medical area.
Y = -6,073,784.53 + 48,917.28 (installed beds) + 9,289,639.81(type
of management).
In this case, the coefficient sign of the "type of management"
variable is positive, so the status of being an administrative
concession increases the costs in the medical area.
However, if we see the standardized coefficients, we can see that the
"installed beds" variable has a larger weighting to explain the medical
costs.
This model explains 86% of the data variability.
As in the preceding case, all the variables shown in table 12 are
significant in the analysis; in other words, t > 0.05.
4.3.3 Healthcare production in the surgical area
In this section, we made the same analyses as in section 4.3.1 but we
focused solely on the costs and activity of the surgical area.
Firstly, we obtained a scatter graph of the total surgery costs with
respect to the surgical activity. We can see that hospital H22 is
162

CHAPTER 4 RESULTS
considerably higher than the expected value. Also, the PPPs' results
are higher than the average since they are all below the regression
line.
Graphic 29. Linear regression of the cost and equivalent patients in the surgical area
#
Source: the author
Secondly, we calculated the regression line that explains the surgical
costs based on the equivalent patients in surgery. The result is shown
in the following expression:
Equivalent patients (surgical area)
Cos
ts (s
urgi
cal a
rea)
163

CHAPTER 4 RESULTS
Y = 20,060,063.157 + 800.455 X .
where:
Y = total surgery costs
X = equivalent patients in the surgical area
This model explains 95% of the data variability.
We will now show the results from the general linear regression
analysis, where we used the same steps and criteria as in section 4.2.1;
in other words, we included all the variables addressed by the study,
except the quality indicators and the variables that do not have a
direct relationship to the surgical activity.
Table 13 shows the results obtained, where all the variables are
significant in the analysis; in other words, t > 0.05:
164

CHAPTER 4 RESULTS
Table 13. Results of the general linear regression analysis in the surgical area
Source: the author
We obtained a model in which the surgical costs are explained by the
"surgical complexity" and the number of "installed beds"; the
"surgical complexity" variable has the largest effect when explaining
the cost. This model explains 98% of the data variability.
In other words, we obtained the following function for the model : 1
Surgical costs = 492.42 (equivalent patient in the surgical area)+
18,003.44 (installed beds).
Variables Non standardized coefficient
Standardized coefficients
Sig
Constant α -‐210.075,902 ,741
Equivalent pa&ents in the surgical area β1
492,418 0,598 ,000
Installed beds β2 18.003,441 0,419 ,000
R2 0,981
Adjusted R2 0,98
p < 0,05 ,000
F 529,35
N 23
We decided to use the sta:s:cal criterion of significance to include the variables in 1
the equa:on, which is why we did not include the term of the constant.
165

CHAPTER 4 RESULTS
4.3.4 Healthcare production in outpatient services
To analyze the activity of the outpatient services, we excluded the
following hospitals from the study: H3, H9, H13, H16, H18, H21,
C4 and C5, because of the lack of data of some cost items in the
outpatient services.
Graphic 30 shows the hospitals based on the following variables:
"outpatient service cost" and "outpatient service in equivalent
patients".
166
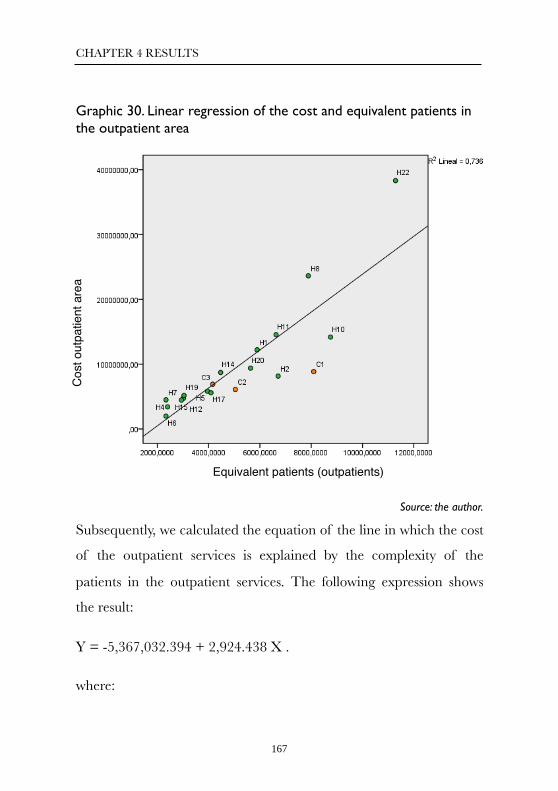
CHAPTER 4 RESULTS
Graphic 30. Linear regression of the cost and equivalent patients in the outpatient area
#
Source: the author.
Subsequently, we calculated the equation of the line in which the cost
of the outpatient services is explained by the complexity of the
patients in the outpatient services. The following expression shows
the result:
Y = -5,367,032.394 + 2,924.438 X .
where:
Equivalent patients (outpatients)
Cos
t out
patie
nt a
rea
167

CHAPTER 4 RESULTS
Y = cost of outpatient services
X = complexity of the patients in the outpatient services
This model explains 73.6% of the data variability.
To improve the model's explanatory capacity, we made a general
linear regression analysis. Table 14 shows the results. For this analysis,
we used the same criteria as in section 4.2.1; in other words, we
included all the variables addressed by the study, except the quality
indicators and the variables that do not have a direct relationship
with the outpatient services. As in the preceding cases, the significant
variables are those included in the table; in other words, t > 0.05.
Table 14. Results of the general linear regression analysis in the outpatient service area
Source: the author.
Non standardized coefficient
Standardized coefficients
Sig
Constant α -4.539.005,403 ,039
Nº outpa&ent boxes 193.932,474 ,888 ,000
R2 ,788
Adjusted R2 ,776
p < 0,05 ,000
F 63,297
N 19
168

CHAPTER 4 RESULTS
In this case, the results indicate that the variable that significantly
explains the costs in the outpatient services is the "number of
consulting rooms".
4.3.5 Healthcare production in the emergency
department
To analyze the activity in the emergency department, we excluded
the following hospitals from the study: H9, H10, H15, H19 and H21
as well as C4 and C5, since we did not have the necessary
information.
In line with the preceding sections, we firstly made a regression
analysis in which the "cost of the emergency department" is
explained by the "equivalent patients in the emergency department
area". This relationship is shown in graphic 31.
169

CHAPTER 4 RESULTS
Graphic 31. Linear regression of the cost and equivalent patients in the emergency department area
#
Source: the author.
We obtained the equation for the line that explains the cost of the
emergency department due to the patient complexity in the
emergency department.
Y = -235,119.052 + 2,444.270 X
where:
Y = cost of the emergency department
Emergency department equivalent patients
Emer
genc
y de
partm
ent c
ost
170

CHAPTER 4 RESULTS
X = patient complexity in the emergency department
This model explains 84.7% of the data variability.
Subsequently, we made a general linear regression analysis using the
same criteria and guidelines as in the previous sections. In other
words, we included all the variables addressed by the study, except the
quality indicators and the variables that do not have a direct
relationship with the outpatient services.
The results are shown in table 15, where all the variables included are
significant in the analysis; in other words, t > 0.05.
Table 15. Results of the general linear regression analysis in the emergency department area
Source: the author.
Non standardized coefficient
Standardized Coefficients
Sig
Constant α -‐1.644.273,25 .13Equivalent pa&ents in the Emergency Depart. β1
2.168,2 0,80 ,000
R2 0,883
Adjusted R2 0,869p < 0,05 0F 60,51N 19
171

CHAPTER 4 RESULTS
Once again, the standardized coefficients indicate that the variable
that has the most effect on explaining the costs in the emergency
department is the patient complexity or equivalent patients.
Therefore, we obtained a model that predicts the costs based on the
equivalent patients in the emergency department. Specifically, we
obtained the following equation:
Cost in the emergency department = 2,168.20 (equivalent patients in
the emergency department) + 1,781,866.08 (plaster room).
This model can explain 87% of the data variability, improving the
simple regression model that was obtained previously.
4.4 Study of the effect of the management
model
4.4.1 Total differences
Continuing with one of the specific objectives of this PhD
dissertation, we will identify the possible differences in terms of
performance and resource equipment between the hospitals under
direct management and those under administrative concession. We
used parametric and non-parametric models to analyze the mean
differences in the variables considered in this study. Firstly, we
172

CHAPTER 4 RESULTS
checked the normality of each variable by using the Kolmogorov-
Smirnov test.
- We applied a t-test for independent samples to the variables which
meet the assumption of normality. We also calculated the Levene test
(1960) to identify possible heteroscedasticity problems. The results are
shown in table 16:
Table 16. Statistics for the mean difference
Source: the author.
The preceding table shows the variables that have significant mean
differences of usefulness in healthcare management based on the
type of management.
Table 16 shows that the PPPs have better results in the "first visits",
"delay in first visits" and "ambulatory replacement rate".
Below we show the statistics, significance and size of the effect of
each variable. The size of effect r (in other words, the discrimination
Statistics of the groupType of
ManagementMean
Standard
devia&onFirst visits 0 Public 48.824,95 21.571,668
1 PPP 73.050,8 20.689,6Delays in the first visits (days) 0 52,67 33,48
1 14,52 20,06Ambulatory replacement rate 0 60,09% 0,149
1 80,67% 0,889348
173

CHAPTER 4 RESULTS
capacity between these variables and the type of management) was
calculated using expression (1).
(1)
First visits t(25) = -2.281 , p < 0.05, r = 0.38; delay in first visits t(23)
= 2,417 , p < 0.05, r = 0.45 ; and ambulatory replacement rate t(23)
= -2.923 , p < 0.05, r = 0.52;
The biggest difference between these variables based on the type of
management is in the ambulatory replacement rate since it has the
greatest effect (r = 0.52).
- Subsequently, we analyzed the variables that do not meet the
normality criterion by applying the Mann-Whitney (1947) non-
parametric test. Table 17 shows the results of the variables that have
shown significant differences.
Table 17. Results of the Mann-Whitney test
Management Model Statys:calCost of the healthcare material in
Emergency Room
0 PublicMedian 248.565,34
1 PPPMedian 725.782,24
174

CHAPTER 4 RESULTS
Source: the author
As can be seen in table 17, the directly managed hospitals have better
results in terms of the "cost of the healthcare material in the
emergency department" since the median is lower than at the PPPs.
Conversely, the median for the rate of hip fractures operated on with
a delay of over two days is higher in the directly managed hospitals;
the best result in this indicator is obtained at the PPPs.
Also, the PPPs show a better result in the MRI equipment since they
have more equipment and a larger overall indicator in the
Management Agreements.
MRI equipment0 Median ,00
1 Median 1,00
Overall score in Management
Agreements0 Median 73,52
1 Median 84,18
Rate of hip fractures operated on
with a delay of over 2 days0 Median 0,588
1 Median 0,169
175

CHAPTER 4 RESULTS
The statistics, significance and size of the effect of the variables are
stated below. The size of the effect is calculated in the following
expression (2).
# (2)
Emergency department material U = 8, p < 0.05, r = -0.08; MR
equipment U = 5.5, p < 0.5, r = 0.11; overall score indicator of the
Management Agreements U = 6, p < 0.05, r = -0.087; rate of hip
fractures operated on with a delay of over two days U = 4, p < 0.05,
r = -0.095; and number of cataract operations U = 6 , p < 0,05, r =
-0.09.
If we see the results of the size of the effect, the most significant
differences are in the "cost of material in the emergency department"
variable, which is lower in the directly managed hospitals, and in the
"overall score in the Management Agreements", which has a better
result among the PPPs.
Following this analysis, we can see that the biggest differences in
terms of the type of management can be found in the quality
indicators. Specifically, the size of the most significant effect is in the
indicators where the directly managed hospitals stand out because
their production capacity prevails; in other words, they perform a
176

CHAPTER 4 RESULTS
larger number of specific operations on average such as inguinal
hernias, uterus surgery and cholecystectomies. However, the PPP
provide moderately better results, for example, in the overall score
indicator in the Management Agreements.
As stated previously, these results must be treated with caution since
the sample size of the hospitals under administrative concession is
smaller than those under direct management.
4.5 Assessment of the efficiency between
the PPP and the directly managed
hospitals
4.5.1 Overall efficiency
To analyze the hospitals' overall efficiency, the variables we selected
are shown in table 18. For the inputs, we selected the human resource
cost separately because of its importance in healthcare. For the
"other costs", we used the other costs in the study, i.e. supply costs
(healthcare and pharmacy material), installed beds and operating
rooms. For the outputs, we considered the equivalent patients in the
medical, surgical and ambulatory (sum of the outpatient service and
emergency department) areas and the patients' overall satisfaction.
177

CHAPTER 4 RESULTS
Table 18. Variables selected for the overall efficiency analysis
Source: the author
Table 19 shows the results of the DEA (data envelopment analysis) of
the variables. Two of the three PPPs of which we have data are
efficient, specifically C1 and C2; also, the following directly managed
hospitals are efficient: H2, H5, H6, H12, H13, H16, H17, H18 and
H19. Concession C3 is not efficient compared with the others but it is
very close to the efficiency frontier, with a score of 91.05%, together
with H4 (96.58%) and H15 (96.1%).
In the middle scores, apart from those stated in the preceding
paragraph, we also find hospitals H7 (88.52%) H14 (85.66%) H10
(85.45%) and H8 (80.97%). Because of their degree of complexity
and their size, these hospitals' inputs are quite high but their outputs
are not sufficient for approaching or reaching the efficiency frontier.
In the bottom scores, we find H11 (68.09%), H21 (67.9%) and H22
(37.05%), where there are clearly shortages; with these hospitals'
178

CHAPTER 4 RESULTS
inputs, they should generate a higher output to reach the efficiency
frontier. H3 and H19 are not shown because we did not have their
full data.
179

CHAPTER 4 RESULTS
Table 19. Score overall efficiency
Source: the author, using the DEA SOLVER soXware
Nevertheless, to give a more approximate approach to the results, we
divided them into the two clusters which include the PPPs, so that the
comparison can be made with the standardized hospitals. The third
180
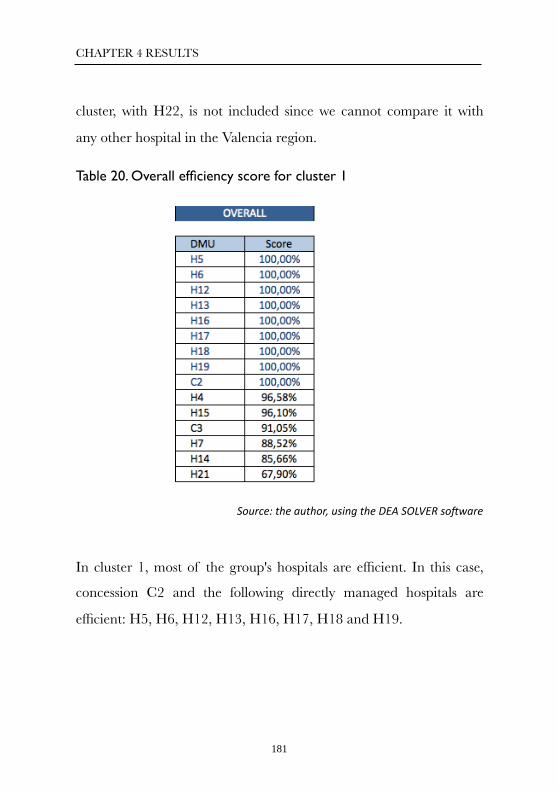
CHAPTER 4 RESULTS
cluster, with H22, is not included since we cannot compare it with
any other hospital in the Valencia region.
Table 20. Overall efficiency score for cluster 1
Source: the author, using the DEA SOLVER soXware
In cluster 1, most of the group's hospitals are efficient. In this case,
concession C2 and the following directly managed hospitals are
efficient: H5, H6, H12, H13, H16, H17, H18 and H19.
181

CHAPTER 4 RESULTS
Table 21. Overall efficiency score for cluster 2
Source: the author, using the DEA SOLVER soXware
Conversely, in cluster 2 there are only two efficient hospitals in the
group: concession C1 and the directly managed hospital H2.
4.5.2 Efficiency in the medical area
To measure hospital efficiency, the variables we selected are shown in
table 22: the average stay for the hospital procedures, the rate of
readmission three days after the discharge, and the equivalent
patients in the inpatient care area.
For the inputs, we chose the variables that explain the cost such as the
cost in the pharmacy area and the cost of the healthcare staff
(doctors, nurses and assistants), as well as the installed beds.
182

CHAPTER 4 RESULTS
Table 22. The variables selected for analyzing the medical area
Source: the author
The score obtained in the DEA for hospital efficiency is shown in
table 23. The hospitals that form the efficiency frontier are those
under direct management: H2, H6, H13, H17, H18, H4, H16 and
H10. In this case, all three concessions are efficient: C1, C2 and C3.
Hospital H19 does not appear because we did not have its full data.
183

CHAPTER 4 RESULTS
Table 23. Inpatient efficiency score
Source: the author, using the DEA SOLVER software
Dividing the results by the cluster, we obtain tables 24 and 25. Table
24 shows the score for cluster 1.
184

CHAPTER 4 RESULTS
Table 24. Efficiency score in the inpatient area for Cluster 1
Source: the author, using the DEA SOLVER software
In cluster 1, most of the hospitals in the group are efficient; from a
medical standpoint, PPPs C2 and C3 and the following directly
managed hospitals are efficient: H6, H13, H17, H18, H4 and H16.
Conversely, the hospital that is furthest from the efficiency frontier is
H21, with a score of 69.37%.
185

CHAPTER 4 RESULTS
Table 25. Efficiency score in the inpatient area for cluster 2
Source: the author, using the DEA SOLVER software
Cluster 2 is completely different than cluster 1 since there are more
inefficient than efficient hospitals.
4.5.3 Efficiency in the surgical area
To measure the efficiency in the surgical area, we selected the
variables shown in table 26. For the inputs, we considered the
structural indicators where the operations are performed (operating
rooms, interventional rooms and delivery rooms), as well as the cost
of the healthcare material since 75.3% of the total healthcare
material is used in the surgical area.
For the outputs, we selected the equivalent patients in the surgical
area and the average delay in operations stated in days.
186

CHAPTER 4 RESULTS
Table 26. The variables selected for analyzing the surgical area
Source: the author.
Table 27 shows the score obtained after the DEA analysis for the
efficiency in the surgical area.
From the standpoint of surgical efficiency, the hospitals that form the
efficiency frontier are PPPs C1 and C2 and the directly managed
hospitals H6, H18, H19, H22, H8 and H10. Hospital H2 does not
appear because we did not have the necessary data.
Hospital H22 stands out because, although it is the most inefficient
from an overall standpoint, it is efficient from a surgical point of view.
The hospitals in the middle zone are those under direct management:
H2 (98.82%), H4 (97.77%), H11 (97.42%) and C3 (91.63%).
187

CHAPTER 4 RESULTS
Table 27. Efficiency score in the surgical area
Source: the author, using the DEA SOLVER software
The most inefficient hospitals are two under direct management,
H12 (56.60%) and H13 (65.03%)
If we divide this analysis into two clusters, we obtain the comparison
shown in tables 28 and 29.
188

CHAPTER 4 RESULTS
Table 28. Efficiency score in the surgical area for cluster 1
Source: the author, using the DEA SOLVER software
If we analyze cluster 1, we see that only four hospitals are efficient:
those under direct management, H6, H18 and H19, and concession
C2. As in the preceding section, H4 (97.7%) and C3 (91,6%) are
close to the efficiency frontier.
Table 29 shows the score for cluster 2.
189

CHAPTER 4 RESULTS
Table 29. Efficiency score in the surgical area for cluster 2
Source: the author, using the DEA SOLVER software
If we analyze cluster 2, we see that the only hospitals within the
efficiency frontier are those under management, H8 and 10, and
concession C1.
4.5.4 Efficiency in the outpatient service area
To measure the efficiency in the outpatient service area, we selected
the variables shown in table 30. For the inputs, we included the
consulting rooms since, as stated in section 4.3.3, this variable best
explains the cost in the outpatient service area, as well as the direct
cost allocated to the outpatient service area. For the outputs, we chose
the equivalent patients in outpatient area and the delay in the first
visits to the specialist healthcare.
190

CHAPTER 4 RESULTS
Table 30. The variables selected for analyzing the outpatient area
Source: the author.
Table 31 shows the score obtained after the DEA for the efficiency in
the outpatient service area.
191

CHAPTER 4 RESULTS
Table 31. Efficiency score in the outpatient service area
Source: the author, using the DEA SOLVER software
From the standpoint of efficiency in the outpatient service area, only
four of the 21 hospitals of which we have full information make up
the efficiency frontier, specifically those under direct management,
H7, H13 and H18, and concession C1.
In the middle zone of the efficiency in the outpatient service area, we
have the hospitals under direct management H15 (93.73%), H2
192
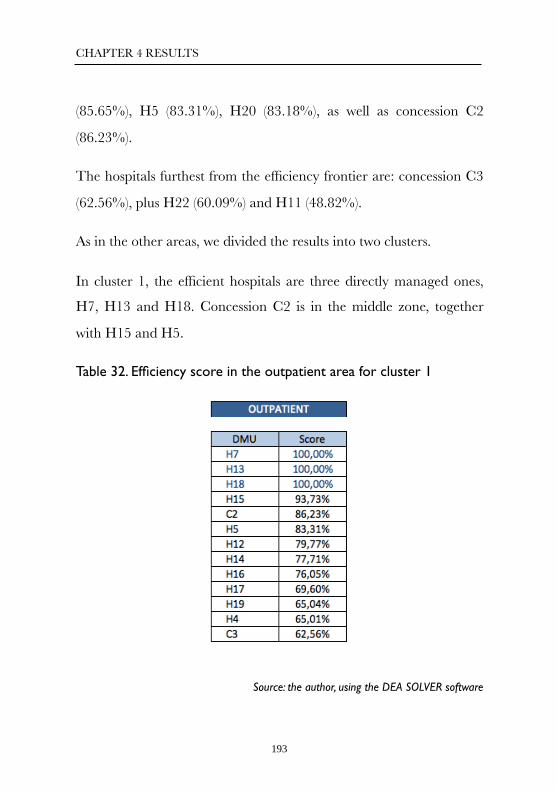
CHAPTER 4 RESULTS
(85.65%), H5 (83.31%), H20 (83.18%), as well as concession C2
(86.23%).
The hospitals furthest from the efficiency frontier are: concession C3
(62.56%), plus H22 (60.09%) and H11 (48.82%).
As in the other areas, we divided the results into two clusters.
In cluster 1, the efficient hospitals are three directly managed ones,
H7, H13 and H18. Concession C2 is in the middle zone, together
with H15 and H5.
Table 32. Efficiency score in the outpatient area for cluster 1
Source: the author, using the DEA SOLVER software
193

CHAPTER 4 RESULTS
In cluster 2, only one hospital is considered to be efficient, i.e.
concession C1. In the middle zone, we have the directly managed
hospitals H2 (85.65%) and H20 (83.18%). The most inefficient and
furthest from the efficiency frontier is H11 (48.82%).
Table 33. Efficiency score in the outpatient service area for cluster 2
Source: the author, using the DEA SOLVER software
4.5.5 Efficiency in the emergency department area
Using the same criterion as in the outpatient service area since both
are ambulatory procedures, we selected the variables which are
shown in table 34 because they are the most significant ones.
194

CHAPTER 4 RESULTS
Table 34. The variables selected for analyzing the emergency department area
Source: the author.
In the emergency department area, nine directly managed hospitals
form the efficiency frontier, specifically H2, H13, H20,H21, H11,
H7, H10, H8 and H1, but no concession-
The hospitals in the middle zone are H15, C1, H22 and H19. The
most inefficient one is concession C3, as can be seen in table 35.
195

CHAPTER 4 RESULTS
Table 35. Efficiency score in the emergency department area
Source: the author, using the DEA SOLVER software
Within the efficiency analysis, we divided the emergency department
area into the two clusters.
196

CHAPTER 4 RESULTS
Table 36. Efficiency score in the emergency area for cluster 1
Source: the author, using the DEA SOLVER software
In cluster 1, there are 3 directly managed hospitals considered
efficient H7, H13 and H7. In the middle zone we also find public
hospitals (H15, H22 and H19)
197

CHAPTER 4 RESULTS
Table 37. Efficiency score in the emergency department area for cluster 2
Source: the author, using the DEA SOLVER software
In cluster 2, the only hospital outside the efficiency frontier is
concession C1, although it is very close to the frontier. The directly
managed hospitals are all efficient: H2, H20, H11, H10, H8 and H1.
198

CHAPTER 4 RESULTS
5. DISCUSSION
199

CHAPTER 5 DISCUSSION
Despite the controversy and constant debate in the media, there is no
extensive bibliography on the assessments made of the healthcare
management models or similar experiences in other countries
(Barlow et al., 2013), although we did find a large number of articles
comparing the PFI with direct management models.
Below we will compare the main conclusions in the literature and
those obtained in this dissertation, although they are outside the
scope of this comparative study of the PPP and directly managed
hospitals.
We will also focus on those which do establish a comparison between
the management models used in this paper.
At an international level, in the United Kingdom, Mason et al. (2010)
state that the hospitals managed under the public-private
collaboration model treat less complex patients than those of the
other hospitals that belong to the National Health Service. Likewise,
In this chapter, we will analyze two factors: the results obtained in other
assessments of the PPP vs. direct management model, comparing them with the
results from this dissertation; and the limits we found in our own study.
200

CHAPTER 5 DISCUSSION
such privatized hospitals have a lower coding level than the public
ones.
This statement is a constant paradigm in the media, which state that
PPPs treat less complex patients than in the directly managed
hospitals.
Table 8 shows the case mix for all the hospitals. We can distinguish
the term "complexity" on two different levels: the patient case mix
and the gross hospital case mix. In the first case, the value is adjusted
for the patient; in the second case, a higher complexity can be due to
a larger number of patients, which may or may not be more
complex.
With respect to the first criterion and considering all the sample of
the analyzed hospitals, the PPPs have an average case mix of 1.84,
compared with 1.83 for the directly managed hospitals. Note that the
reference hospital is included in the group under direct management
and no PPPs treat diseases with that level of complexity, such as
transplants.
If we consider only the hospitals (graphic 9) that are included in the
clusters and, therefore, comparable with each other, the average case
mix for the directly managed hospitals is 1.81, compared with 1.84
for the PPPs, i.e. 2% more.
201

CHAPTER 5 DISCUSSION
When analyzing the complexity without adjusting for each case (in
our study of "equivalent patients”), we can add the following facts:
the PPPs treat 26% more total equivalent patients than the directly
managed hospitals. In the medical and surgical areas, this percentage
is 29%, in the outpatient service area, 34%, and in the emergency
department area, 7% less.
Therefore, based on our study's data, Mason's statement is not
correct since his study compares the PFI and direct management
models since, as we stated, the PPPs treat a higher complexity, even if
we consider the non-comparable hospitals, compared with the PPPs
based on the variables selected in the cluster analysis.
Likewise, in section 2.2.1, where we defined the main features of the
PPP contracts, one of the main factors is the compensation between
healthcare districts as a result of the patient rerouting. If it does take
place, the concession has to pay 100% of the DRG cost, compared
with the compensation that it receives (80%-85%) of the cost of the
patients outside its reference population (graphic 8).
In Germany, Herr (2008) compares the healthcare and efficiency
results between the private and public hospitals. His study shows that
the patients at the public hospitals have an average stay of 3.52 days
less than in the private hospitals. According to the authors, this may
202

CHAPTER 5 DISCUSSION
be due to the fact that the payment for each episode depends on the
duration of the stay.
Likewise, the study shows that only 59% of the PFI hospitals have an
ambulatory unit, thus generating greater pressure on hospital
admissions. This differs from the results in our regression analysis,
where we saw that the PPPs have a better ambulatory replacement
rate (table 16).
In our study, the patients have an average stay of 5.04 days at the
PPPs, compared with 7.17 days at the directly managed hospitals
(excluding the hospitals that do not belong to clusters 1 and 2); in
other words, 2.13 days less. All the PPPs have an ambulatory unit. In
fact, the model is tending towards a greater ambulatory service in
healthcare and operations, so the strategy of the German hospitals is
probably adjusting to the current healthcare demand.
In terms of efficiency, the study considers the costs arising from the
admissions and not from the ambulatory service, since they are
reimbursable by the insurance companies. Therefore, we can only
compare these areas.
The cost per bed is calculated by dividing the cost of supplies
(pharmacy and healthcare material) into the working beds, excluding
the staff cost. Considering these criteria, we compared Herr's results
with those obtained in our study. In the German case, the average
203

CHAPTER 5 DISCUSSION
cost per bed was 15,790 euros at the public hospitals and 17,780
euros at the private ones (12.60% higher). In our case, it was 21,160
euros at the directly managed hospitals and 34,800 euros at the PPPs
(46% higher).
In short, the cost per bed based on the cost of supplies is lower at the
public hospitals than the private ones in Germany and with respect to
the PPPs in our study. On the other hand, the conclusions of the
healthcare quantitative analysis are the opposite, both in the
management of the average stay and in the ambulatory service of the
procedures. As stated above, this is probably due to the fact that the
private sector receives a compensation from the German
Administration based on the duration of the stay when the necessary
data for the study were collected.
In France, there is a study by Dormon et al., published in 2012, with
a total sample of 1,604 hospitals, i.e. 95% of the specialist French
healthcare supply, conducted over a period of five years (1998-2003).
To make a comparison, those hospitals were divided into three
groups based on the number of discharges. The paper weights the
stays of the DRGs based on equivalency tables called ISAs (Indice
synthétique d´activité). By measuring this indicator per hospital bed,
the private hospitals are 70.6% more efficient. According to the
authors, this is because there are more unoccupied beds at the public
hospitals.
204

CHAPTER 5 DISCUSSION
In the French study, we can see that there is a significant difference in
the average stay between public and private hospitals. This is even
more evident if we divide the hospitals by group. For example, the
average stay at the small hospitals is 9.3 days compared with 3.8 days
at the private hospitals.
In our study, we also divided the hospitals into three groups, based on
variables which are more specific than the number of discharges
(section 4.1.2). This could provide a bias since it was the only
criterion when dividing the hospitals into groups but it was logical
that the authors simplified the classification since they had a sample
of such aggregates.
In the preceding comparison, we saw that the average stay at the
PPPs was 42.6% lower than at the directly managed hospitals, so we
agree with Dormon's conclusion.
Nevertheless, to see the relationship between this indicator (ISA/bed)
and our results, we divided the equivalent patients into the number
of beds: based on this criterion, the efficiency was 87% higher at the
PPPs than at the directly managed hospitals.
Therefore, it is not surprising that there is more healthcare staff in
the French public system than in the private one, 7.6 vs. 1.7, and 3.7
vs. 1.9 in the small and medium public hospitals, respectively.
205

CHAPTER 5 DISCUSSION
In the comparison between the PFI and direct management models,
McKee et al. (2006) state that the public-private collaboration to
build a hospital generates a higher cost.
We do not have any data in our study with respect to this statement,
but we do have evidence to compare such conclusions. In the PPP,
the extra cost in building a new hospital is passed on to the
concession company itself since the per capita payment includes this
item when new hospitals have to be built, so there is no setback for
the Administration and it is not very logical, even though we do not
have this information, as stated previously.
By limiting the scope of the studies to those which only provide a
comparison between the public hospitals and the PPP, we highlight
the following examples, with different opinions about implementing
the public-private collaboration model in healthcare.
The SESPAS report (Sanchez-Martínez et al., 2014) states that the
public or private ownership of a hospital does not determine its
results. It also recommends that we should abandon this debate since
there are no factors which can assess the performance of both
options. This conclusion is curious since the authors themselves
acknowledge that they do not have sufficient evident to assess this
statement.
206

CHAPTER 5 DISCUSSION
Conversely, we believe that, before implementing either option, both
should be assessed before the decision is made, even before
abandoning this debate. We suggest greater information transparency
so that studies like ours can be conducted. Also, by using
comparisons, we can find out about the best hospital practices which
can provide a greater efficiency to the system, regardless of the
management model, which has been suggested by the authors we
have named.
A PPP was implemented in Brazil (La Forgia et al., 2009) under the
name of “organizações sociais de saúde" to care for the low-income
population living in the periphery of São Paulo state.
The study compared 12 directly managed hospitals with 12 under
concession. Both groups were considered to be standard in terms of
size, cost per bed and complexity of the population cared for.
That criterion for grouping the hospitals was similar to the one we
used in this dissertation to group the hospitals into clusters so that the
conclusions could be significant (section 4.1.2).
The results of this study focus mainly on healthcare efficiency: the
data are shown in tables 8 and 9.
We see that the average stay at the directly managed hospitals in
Brazil is 5.4 days, compared with 4.2 at the PPPs. In our sample, the
207

CHAPTER 5 DISCUSSION
average stay at the directly managed hospitals is 7.25 days (including
the reference hospital), compared with 5.04 at the PPPs, i.e. 43.8%
lower. Therefore, there is greater efficiency in hospital bed utilization.
The costs upon discharge are 48% lower at the Brazilian PPPs
compared with the directly managed hospitals, without adjusting for
the equivalent patients as in our research. In the chapter on results,
using a regression analysis for the equivalent patients compared with
the cost, we showed that the PPPs were more efficient in the surgical
area (graphic 29) and only one was more efficient in the medical area
(graphic 28) with respect to the average.
With respect to the quality indicators in the Brazilian analysis, the
authors simply limited themselves to the morbidity level in the
various areas, where the PPPs obtained better results. Table 10 shows
that the PPPs are among the top positions in the Management
Agreements, which include 95 quality and patient security indicators.
One of the lessons that we can apply is that the per capita payment
in São Paulo partly conforms to the quality results obtained by the
PPPs. In the same way, we believe that this payment should conform,
apart from the quality and patient security results, to the weighting by
the morbidity of the patients cared for or the clinical risk groups
(CRG) (Vivas-Consuelo et al, 2014), since it is wrong to consider that
all the healthcare districts care for the same type of population.
208

CHAPTER 5 DISCUSSION
The study by the European Commission's expert panel (2014) focuses
on analyzing the cost effectiveness of the model based on the
payment per capita received by the concession company with respect
to the cost per capita of the traditional model. Note that, when
calculating the per capita of the PPPs in the Valencia region, major
items such as the following ones are excluded from expenses: the
pharmacy cost for prescriptions, prosthesis, healthcare transport and
oxygen therapy. This is due mainly to the fact that the prescriptions
are centralized among the professional associations, as well as the
tenders for prosthesis, healthcare transport and oxygen therapy.
Therefore, we believe that a comparison should not be made in terms
of budget per capita but based on a standardized measurement such
as the cost per equivalent patient.
Another interesting point stated in the report is the compensation
that is made between the districts when a complex episode is rerouted
to a reference hospital and the possible lack of invoicing control
among the hospitals.
One of the disadvantages and needs stated by the study, which is
stated constantly throughout the report, is the lack of comparative
studies for this model, such as the one we have conducted in this
dissertation. We agree with the expert panel that there is a need to
make the model more transparent by exchanging information and
knowledge among the managers. It should be mandatory for
209

CHAPTER 5 DISCUSSION
managers to share practices with the aim of supporting policy
decisions regarding the suitability of using either healthcare model.
Based on this need, there is a study by Bloom et al. (2010), which
states that including competition variables at the hospitals leads to an
increase in healthcare quality and higher productivity. Specifically,
this competition led to a 10.7% reduction in mortality due to heart
attacks. Such results could be more evident if we compare publicly
owned hospitals (Cooper et al, 2012).
In line with this criticism regarding the need to compare models
based on the cost per capita, there is a clarifying study by Arenas
(2013), which compares the direct management model with the
private-public one using a calculation adjusted for the per capita
expense.
210

CHAPTER 5 DISCUSSION
Graphic 32. Adjusted cost per capita in the Valencia region
Source: Carlos Arenas, with data from the Valencia Health Department, 2013
The methodology used for making the aggregates comparable was to
deduct the centralized expenses of each healthcare district, so the
average cost in the 2004-2010 period was 31.77% lower for the PPPs.
The study eliminated the districts with reference hospitals because
they are not considered to be comparable with the group of PPPs, as
well as one small area hospital since it had a scant reference
population.
By comparing the hospitals with a similar service portfolio and
eliminating the outliers, the study concludes that the PPPs are 157.68
euros cheaper per capita than the directly managed hospitals.
We believe that our study provides a good standpoint to the subject
since it also makes a comparison in the Valencia region, although it
PPPsPublic Departments
211

CHAPTER 5 DISCUSSION
could be completed by stratifying the clusters in section 4.1.2 and
grouping the hospitals by case mix, together with the structural
variables.
In the healthcare area, a study by Coduras et al. (2008) states that the
quality does not differ due to the legal form. It does, however,
acknowledge that there is a greater result in the rate of major
ambulatory surgery and greater clinical effectiveness due to the PPPs'
technological equipment. In our study, we saw that the management
model variable does have a significant effect on the results in the
Management Agreements, which measure 95 indicators regarding
mainly healthcare quality and patient security. Likewise, our study
agrees with the author's conclusion when comparing the magnetic
resonance equipment between the PPPs and directly managed
hospitals, where it is fairly higher among the PPPs (table 17). This
also occurs when analyzing the ambulatory replacement rate, which
is also higher among the PPPs, compared with the directly managed
hospitals (table 16).
A study (Peiró, 2012) on the efficiency comparison between the PPPs
and the directly managed hospitals suggests that the lower cost per
admission among the PPPs seems to be related to a larger number of
admissions at them. Therefore, this value is reduced since the fixed
costs are shared. We agree with the author that including the
structural, fixed or variable costs can distort the results when
212

CHAPTER 5 DISCUSSION
comparing the cost per admission. That is why our study allocates the
directly attributable cost by activity area to avoid this.
According to that study, the cost per capita of the hospital population
is 7.5% higher in the districts that are directly managed than at the
hospitals under concession.
We do not believe that the hospital population variable used in the
study is the most representative for assessing the management
models, although we do not have population variables in our study to
compare the results. We used the sources of our dissertation to
calculate the adjusted cost per admission of equivalent patients. The
result is that the cost at the directly managed hospitals of equivalent
patients is 950 euros, compared with 901.3 euros at the PPPs, i.e.
5.39% lower.
We will now compare the conclusions of a study conducted by
IASIST using the Minimum Basic Data Set (MBDS) for 78 Spanish
hospitals. This paper is considered to be the benchmark in the
healthcare industry. The hospitals were divided into two categories:
directly managed hospitals and "other forms of management", which
include foundations, consortiums, PFI hospitals and PPPs.
The main conclusions of that study between the hospitals with other
forms of management and those directly managed, which we will
compare with the results of our own dissertation, are as follows:
213

CHAPTER 5 DISCUSSION
1. They are smaller hospitals in terms of size and staff and they treat patients of
a similar age and complexity. In our study, we saw that the PPPs'
complexity is similar to those hospitals directly managed in the
analysis on equivalent patients at the these levels: overall, by area and
cluster, and by case mix. See table 8 and graphics 15 and 18.
2. They make a more efficient bed utilization and are more intensive in the use of
ambulatory options. We also agree with this point since, in our study, the
average stay is lower at the PPPs than at the directly managed
hospitals, so they are more efficient in bed utilization. In the same
way, in the analysis of the variables that provide different significant
averages, they have a greater ambulatory replacement rate. In other
words, the percentage of potentially ambulatory operations that were
finally made without admission was higher than at the directly
managed hospitals.
3. Their staff, which has a similar structure, generates 37% more adjusted
activity units. In our dissertation, we did not quantify the number of
full time equivalent workers. Nevertheless, we calculated the total
staff cost per equivalent patient, and the average was 14% lower for
the PPPs.
4. They are more efficient since their cost per production unit is 30% lower. We
partly agree with this conclusion since the PPPs are below the
average cost per production unit (cost per equivalent patient in our
214

CHAPTER 5 DISCUSSION
study) in the surgical area and outpatient service (visits to the doctor
and emergency department), but higher than the average for the
hospital sample in the medical area (graphics 11 to 14).
5. They obtain better results in terms of scientific and technical quality, measured
with the following indicators (mortality, complications and readmissions adjusted
for risk), than the directly managed hospitals. In the quality indicator for our
dissertation, we used the assessment of the 2010 Management
Agreements, which include the indicators that IASIST classifies as
scientific and technical quality ones. We saw that the PPPs obtained a
significantly better result than the directly managed hospitals (table
10).
6. Greater efficiency does not determine the scientific and technical quality. The
hospitals with other forms of management have the same or higher scientific and
technical quality results than those under direct administrative management. Our
study agrees with this conclusion since these indicators are based on
the MBDS discharges, i.e. on the medical and surgical episodes.
Nevertheless, in the emergency department area, we saw that the
PPPs were less efficient than the directly managed hospitals; this part
is not included in the MBDS nor, therefore, in the IASIST study.
This fact, which is stated as an inefficiency in principle, could be due
to better primary healthcare resource management. The frequency
of emergency department visits should be as low as possible since,
215

CHAPTER 5 DISCUSSION
according to studies by the Spanish Health Ministry published in
2010, "the frequency rate of emergency department visits in Spain is
considerably higher than in the United Kingdom or United States. In
Spain, it is estimated that the inappropriate use of the emergency
department varies between 24% and 79%."
That same study also states that 80% of the patients visit the hospital
emergency unit on their own account, without being referred by
other services. "Approximately 80% of the emergencies attended are
discharged to go home."
Table 17 shows the difference with respect to the conclusion that the
hospitals with other forms of management obtain the same or better
results than the directly managed hospitals. It also shows that the rate
of hip fractures operated on with a delay of over two days is fairly
lower at the PPPs than at the directly managed hospitals.
7. There are no significant differences between the two management models in
terms of the age and complexity of the inpatients. We agree with this
conclusion since, as we have seen, the average case mix is 1.83 for the
directly managed hospitals and 1.84 for the PPPs, taking into account
the hospitals in our database.
If we make this comparison between the hospitals included in the
clusters and, therefore, those comparable with each other, the case
216

CHAPTER 5 DISCUSSION
mix of the directly managed hospitals is 1.81 compared with the 1.84
stated above.
We do not have any information about the age of the patients treated
in outpatient or ER so we can not discuss this point.
Lastly, the study concludes by saying that "there are hospitals that use the
direct administrative management model which achieve notable efficiency results; it
is necessary to analyze what factors are behind such results which indicate a
certain improvement in the barriers for this management model and which can be
used as a guideline for the other hospitals of this type." As we see in the
chapter on conclusions, we agree with this statement but with
nuances adapted to our results.
In 2008, Jaume I University published a PhD dissertation by Manuel
Civera, which analyzes the patients' quality perception based on the
management model. Although this was not the main purpose of our
study, we believe that this view completes the comparison between
the healthcare management models by adding a fundamental
standpoint to our dissertation.
The methodology used to reach the conclusions detailed below was
by conducting 399 personal interviews at three hospitals with similar
aggregates and different types of management: direct management
(Sagunto Hospital), PPP (Alcira Hospital) and private hospital (9 de
Octubre Hospital). The questionnaires assessed, among others, the
217

CHAPTER 5 DISCUSSION
following factors: the healthcare staff's professionalism, the patients'
trust, the treatment received, the professional's knowledge of the
patients and the information received by the staff.
Some of the main significant differences in the patients' answers were
in the concepts and items that were assessed:
1. The staff's professionalism
a. They know how to do their work.
b. Their knowledge is updated.
c. They do not make any mistakes.
Alcira Hospital obtained a significantly better result in all three items
than the other two hospitals in terms of the medical and nursing
staff. There were no differences between 9 de Octubre Hospital and
Sagunto Hospital.
2. Trust
a. I felt completely comfortable telling them about anything.
b. I felt comfortable telling them about my doubts.
c. I trust the care that they are providing to me.
218

CHAPTER 5 DISCUSSION
In terms of the medical staff, Alcira Hospital obtained a significantly
better result in the first item; and with respect to the nursing staff, it
had a better result than the other two hospitals in all three items.
3. Treatment received
a. They gave me customized care.
b. The way they treated me made me feel comfortable.
Alcira Hospital obtained a significantly better result than Sagunto
Hospital.
4. Information received by the staff
There were no significant differences between Alcira Hospital and
Sagunto Hospital. There were, however, significant differences
between Alcira Hospital and 9 de Octubre Hospital, favoring the
former.
Therefore, there are significant differences in the factors analyzed in
favor of Alcira Hospital. Consequently, according to this study, the
conclusion is that the quality perceived by the patients cared for
under the concession model is better than the directly managed and
private hospitals, with the proviso of extrapolating the results of the
three hospitals with those of the others in the Valencia region.
219

CHAPTER 5 DISCUSSION
Despite the comparative analysis of the different standpoints between
the management models, we see that the decisions about the
suitability of applying either model have a stronger political
component than technical, as a result of the controversy among the
population. In Spain, we recently witnessed the mobilization in
Madrid against the conversion of 6 hospitals using the PFI model to
the Alzira model, which was finally stopped through legal rulings
(Afem, 2013).
We encountered limits to the scope of our study, so the conclusions
must be taken with caution.
It was very expensive to collect the information and standardize it
due mainly to two factors:
Firstly, the time that it took the Valencia Health Department's central
services to validate it, making this useless for making decisions as a
result of the current lag.
Secondly, the information is considered to be at a hospital and not
district level, leaving out all the primary healthcare, which we believe
plays a critical role in sustaining the healthcare system.
Although the Valencia region has a sample of five PPPs which, at the
date we started this research, were not all in operation or had started
recently, this can affect the efficiency results, more so if we consider
220

CHAPTER 5 DISCUSSION
the case of a transfer from a fully running hospital to a new one, with
the readjustments that this could mean.
5.1 Contribution to knowledge and new
lines of research
This dissertation provides sound research to the subject-matter stated
in the state of the art since there is greater development and tradition
of the public-private collaboration model in the healthcare industry
in the Valencia region. Several institutions and other regional and
international governments have visited the hospitals that use the
Alzira model and are interested in the results obtained by them in
collaboration with the Valencia Health Department. This
corroborates our first statement since the Valencia region is clearly
the most suitable place to make a comparison of these factors.
Likewise, for the first time, the results were treated objectively and in
a standardized way among the hospitals with the aim of obtaining
significant conclusions overall and for each area.
Based on the efficiency and performance results for the PPPs and the
directly managed hospitals shown in the dissertation, the hospital
concession model must continue to be an option to consider when
planning healthcare, more importantly than the messages based on
221

CHAPTER 5 DISCUSSION
opinions which, in many cases, are from detractors or supporters of
either management model. This study should be used by healthcare
managers as the basis for making decisions about the suitability of
developing the Alzira model in Spain and other countries.
Implementing the model in Spain is conditioned by the political
criteria which can jeopardize its development at present. However,
this should not limit its growth at international level, where the
model's future is being considered for the short and medium term. As
a matter of fact, two hospitals were opened in Peru which use the
Alzira model: specifically, Villa María del Triunfo and Callao
hospitals in Lima.
As a result of the foregoing, we believe that an interesting line of
research is being opened to assess the different healthcare
management models.
This study should be conducted with a larger number of hospitals
with the aim of obtaining more representative conclusions.
The future research arising from this dissertation should be
conducted by professionals of the various regions who provide
healthcare and efficiency indicators in a standardized way for each
hospital studied with the aim of obtaining conclusions that will lead
to a greater system efficiency and sustainability.
222

CHAPTER 5 DISCUSSION
This objective will simply be a dream unless all the healthcare
stakeholders get involved.
223

CHAPTER 5 DISCUSSION
6. CONCLUSIONS
224

CHAPTER 6 CONCLUSIONS #
The main conclusions from our PhD dissertation are as follows:
1) The performance and efficiency analyses show that the results of
the group of PPPs were higher than the average for the directly
managed hospitals, but not always better.
2) The highlights of the first analysis made of the main healthcare
indicators are as follows:
a) The PPPs have a better ambulatory rate in surgical
procedures, i.e. 20%.
b) At the hospital level, the average stay at the PPPs is 5.04 days,
compared with 7.25 days at the directly managed hospitals,
i.e. 43.8% less. This shorter stay in the group of PPPs is not
due, as could initially be thought, to an increase in
readmissions for the same diagnostic category, as was seen in
table 16.
This chapter is divided into two: firstly, we will provide the main conclusions
obtained in this work; and secondly, we will determine whether or not the
objectives set out in chapter 2 were met.
225

CHAPTER 6 CONCLUSIONS
c) In the ambulatory area, the directly managed hospitals deal
with an average of 2.81 subsequent visits for every first visit,
compared with 1.95 at the PPPs, i.e. 44% less.
3) The main conclusions from the analysis of the cost per equivalent
patient shows that:
a) The cost of the PPPs in the surgical area is lower than the
average for the sample of the hospitals in the study.
b) The cost of the PPPs in the medical area is higher than the
average.
c) In the ambulatory area (outpatient services and emergency
departments), the cost of two of the PPPs is lower than the
average with respect to the equivalent patients treated. The
cost of the other concession is slightly higher than the average
in the outpatient services.
4) The PPPs treat more complex processes than the directly managed
hospitals in terms of the case mix and the equivalent patients per
area.
5) The highlights of the cost/quality comparison using the cost per
equivalent patient and the delay per area are as follows:
226

CHAPTER 6 CONCLUSIONS
a) In the surgical area, two of the PPPs have a shorter delay
compared with the hospitals that have a similar cost per
equivalent patient.
b) In the outpatient service area, the same occurs: two of the
three PPPs have a shorter delay compared with the hospitals
that have a similar cost per equivalent patient
The directly managed hospitals have a considerably longer
delay compared with the PPPs that have a lower cost per
equivalent patient.
c) In the emergency department area, the PPPs have a higher
cost per equivalent patient compared with the hospitals that
have a similar delay.
6) The conclusions from the regression analyses which compare the
equivalent patients and cost are as follows:
a) The fact of being a hospital run by a PPP implies that they
have a lower cost than the other hospitals in the sample.
b) The variables that best explain the cost vary depending on the
area, and they are as follows:
227

CHAPTER 6 CONCLUSIONS
- In the medical area, the installed beds are the main variable
since they determine the number of admissions and, therefore,
the stays.
- In the surgical area, the most significant variables are the
installed beds once again and the equivalent patients.
- In the outpatient service area, the variable that best explains
the cost is the consulting room. In the emergency department
area, the equivalent patients are the main variable.
c) In the scatter diagram based on the overall regression analysis, we
can see that two of the three PPPs are on the lower left side. In other
words, there is a good cost/equivalent patient ratio with respect to
the average.
d) In the medical area, only one of the three PPPs has a good result
with respect to the average.
e) In the surgical area, the three PPPs are on the lower left side,
indicating that there is a better cost/patient ratio than the sample.
f) In the outpatient service area, two of the three PPPs have a better
cost/equivalent patient ratio with respect to the average for the
hospitals.
228

CHAPTER 6 CONCLUSIONS
g) In the emergency department area, only once concession has a
better ratio among the variables described in the other points with
respect to the average for the sample.
This can be explained because the PPPs are hospitals that focus on
the ambulatory procedures both in the surgical area and in the
outpatient service area with the aim of minimizing hospital
admissions and providing greater quality of life to patients.
7) When we included the quality and structural variables in the DEA,
we obtained the following conclusions per area:
a) The overall efficiency frontier of the hospitals in the Valencia
region is formed by 11 of the 23 that were studied, two of
which are PPPs and nine are directly managed hospitals.
b) In the hospital area, when we included the number of beds
and the healthcare quality variables such as the readmission
rate for the same diagnostic category and the average stay, the
three PPPs are within the efficiency frontier.
c) In the surgical area, when we included the structural variables
and the delay in operations as the quality variable in the same
way, eight of the hospitals are efficient, of which two are PPPs.
d) In the outpatient service area, when we included the
consulting rooms, the delay in the first visit, the cost and
229

CHAPTER 6 CONCLUSIONS
equivalent patients, only four hospitals are efficient, one of
which is a concession.
e) In the emergency department area, none of the PPPs are
considered to be efficient whereas the nine hospitals that form
the efficiency frontier are the directly managed ones (47% of
the hospitals in the study).
8) In the Valencia region, there are three clusters that should be used
for establishing comparisons in healthcare production and economic
efficiency results since they are determined by structural variables
and equivalent patients.
9) The PPPs obtained a better result in the Management Agreements
than the directly managed hospitals since they occupy four of the top
positions in the ranking made by the Valencia Health Department.
10) This PhD dissertation provides a starting point from which to
continue the research and comparisons between the healthcare
management models both in the Valencia region, a pioneer in
implementing this model, and other regions, so that we can obtain a
larger and, therefore, more representative sample.
OBJETIVES MET
It is interesting to see to what extent we met the objectives defined in
this research.
230

CHAPTER 6 CONCLUSIONS
We defined the main objective of this dissertation as follows:
"Analyze the influence of the healthcare management model (public or public-
private collaboration) used in the Valencia region from the point of view of
healthcare quality and economic efficiency."
As stated in the conclusions, we believe that this objective was met
but with the limits described in the discussion section from both
points of view: healthcare quality and economic efficiency. However,
the healthcare management model is determined excessively by
political decisions rather than by criteria related to objective
assessments.
The specific objectives of this dissertation were as follows, which we
will state whether or not they were met.
1. Analyze the existing literature in Spain and abroad with the aim of identifying
the main specific variables for benchmarking.
After reviewing the literature and bibliographical sources, we realized
that there were not many studies that compared both management
models. Nevertheless, we did see that the methodology used in the
dissertation and the variables we selected were the usual ones in the
healthcare industry. Therefore, we believe that this objective was met
satisfactorily.
231

CHAPTER 6 CONCLUSIONS
2. Select the most significant variables for constructing indicators with the aim of
measuring the efficiency and quality of healthcare organizations.
We believe that this objective was met since, in chapter 3, "Assumptions
and information sources", we detailed the variables selected for forming
the necessary database for measuring the hospital efficiency and
quality indicators. The cost per equivalent patient and area is the
main indicator that we used to measure the economic efficiency. We
also selected the quality indicators from among the 95 available that
provided the best explanation overall and by area.
3. Allocate a standard measurement with the aim of comparing the hospitals and
the cost breakdown.
One of the biggest efforts in this dissertation was to standardize the
information and the indicators with the aim of providing a
comparison. Based on the results obtained in chapter four and the
detail provided to us by the Valencia Health Department's current
information systems, we believe that the cost per equivalent patient is
a representative indicator for comparing the hospitals.
4. Group the hospitals based on their structural resources and healthcare
production capacity.
232
CHAPTER 6 CONCLUSIONS
This objective was met satisfactorily in section 4.1 and, as stated
above, it should be used for comparing hospitals, regardless of their
type of management model.
5. Find the variables to explain the cost for each hospital area by using a
regression analysis.
In the chapter on results, we stated which variables best explain the
cost, firstly overall and subsequently in each hospital area: medical,
surgical, outpatient services and emergency department, so we can
conclude that this objective was met satisfactorily.
6. Rank the relative efficiency of the hospitals and management models based on
this study.
We drafted a relative efficiency ranking in the last section by using the
DEA. We selected the variables considered to be most representative
in terms of cost and quality and drafted our conclusions based on the
hospitals' position in terms of the efficiency frontier in the area
analyzed.
233

CAPÍTULO 6 CONCLUSIONES
7. BIBLIOGRAPHY
234

CHAPTER 7 BIBLIOGRAPHY
Abadie, R. (2008). "Infrastructure finance-surviving the credit crunch." PWC Public Sector Research 23(12): 144-146. Abril Martorell, F. (1991). “Informe Abril”. Jano 41 (963): 45-69.
Afem (Asociación de Facultativos Especialistas de Madrid) , Cruz Ferrer J. (2013) “Sobre la inconstitucionalidad de la concesión de servicios sanitarios de hospitales y centros de salud por la Comunidad de Madrid” En línea (http://www.asociacionfacultativos.com/images/comunicados/inconstitucional.pdf).
Alfonso, JL,Blasco S. et al (2003). “La eficiencia de las organizaciones sanitarias a través del análisis envolvente de dato: las Comunidades españolas en el 2.000”. Revista Gestión Sanitaria 14 (4) 112-119.
Alfonso JL, Guerrero M. (2002). “El análisis envolvente de datos como indicador de la eficiencia aplicado a hospitales de la Comunidad Valenciana”. Revista Gestión Sanitaria (13) 77-84.
Amado, C. et al. (2012). "Integrating the Data Envelopment Analysis and the Balanced Scorecard approaches for enhanced performance assessment." Omega 40(3): 390-403.
Anderberg, M. R. (1973). “Cluster analysis for applications” Documento DTIC.
235

CHAPTER 7 BIBLIOGRAPHY
Arenas, C. (2013). “Sostenibilidad del sistema sanitario en España” Revista Española de Directivos Sanitarios (SEDISA). En línea(http://www.sedisasigloxxi.com/spip.php?article242). Arenas, C. (2012). “Eficiencia de las Concesiones Administrativas en la Comunidad Valenciana. Estudio Económico”. En línea (http://sedisasigloxxi.es/spip.php?article373).
Ballestero, E y J. A. Maldonado (2004). "Objective measurement of efficiency: applying single price model to rank hospital activities." Computers & Operations Research 31(4): 515-532. Banker, R. D., et al. (1984). "Some Models for Estimating Technical and Scale Inefficiencies in DEA." Management Science 30(9): 1078-1092. Banker, R. D., et al. (1986). "A Comparative Application of Data Envelopment Analysis and Translog Methods: An Illustrative Study of Hospital Production." Management Science 32(1): 30-44. Barlow, J., et al. (2013). "Europe Sees Mixed Results From Public-Private Partnerships For Building And Managing Health Care Facilities And Services." Health Affairs 32(1): 146-153.
Bloom N., Propper, C. et al. (2010). “The impact of competition on management quality: evidence from public hospitals. CEP Disussion
236

CHAPTER 7 BIBLIOGRAPHY
Paper. London School of Economics. En línea (http://cep.lse.ac.uk/pubs/download/dp0983.pdf).
Brignall, S. y Modell, S. (2000). “An institutional perspective on performance measurement and management in the new public sector”. Management accounting research, 11(3), 281-306.
Caballer, M., Vivas D. et al. (2009).”A model to measure hospital performance” Revisión Administración Sanitaria 7(3): 521-536.
Cabasés, J. M., et al. (2003). "La eficiencia de las organizaciones hospitalarias." Papeles de la Economía Española 35: 195-225. Charnes, A., et al. (1978). "Measuring the Efficiency of Decision Making Units." European Journal of Operational Research 2(3): 429-444. Civera, M. (2008). “Análisis de la relación entre calidad y satisfacción en el ámbito hospitalario en función del modelo de gestión establecido”. En línea (http://www.tdx.cat/bitstream/handle/10803/10357/civera.pdf ?sequence=1). Chirikos, T. and S. A. (2000). "Measuring Hospital Efficiency: A Comparison of Two Approaches." Health Services Management Research 34(6): 1389-1408.
237

CHAPTER 7 BIBLIOGRAPHY
Coduras A., Del Llano, J., Raigada,F., et al.(2008). “Gestión de tres procesos asistenciales según persona jurídica hospitalaria”.Sedisa Siglo XXI (8) 44-55.
Coelho, M., et al. (2009). "The effects on the financial crisis on public and private partnerships." International Monetary Fund Journal 3(2).
Consellería de Sanidad. Generalitat Valenciana (2002). Manual del Sistema de Información Económica de Atención Especializada.
Consellería de Sanidad. Generalitat Valenciana (2010). Manual de Indicadores para los Acuerdos de Gestión.
Consellería de Sanidad. Generalitat Valenciana (2013). Plan de Salud de la Comunidad Valenciana 2010/2013 . En línea (http://www.san.gva.es/documents/153218/167779/III_Plan_de_Salud_10_13.pdf).
De Rosa, A. y M. Marín (2007). "Las nuevas formas de gestión sanitaria. “El modelo Alzira”." Instituto de Estudios Económicos. Debreu, G. (1951). "The Coefficient of Resource Utilization." Econometrica 19(3): 273-292.
Dormont, B., Milcent, C. (2012). “Ownership and hospital productivity”. CEPREMAP working paper. En línea (http://www.cepremap.fr/depot/docweb/docweb1205.pdf).
238

CHAPTER 7 BIBLIOGRAPHY
Drucker, P. (2006). “Managing the non profit organization”. Harper Collins. Evans, R.G. (2005). “Fellow travellers on a contested path: Power purpose and the evolution of European health care systems”. Journal of Health Policy Politics and Law. Special Issue: Legacies and Latitude in European Health Policy, 30(1–2): 27793
EXPH (Expert Panel on effective ways on investing in Health) (2014). “Health and Economic Analysis for an Evaluation of the Public-Private Partnerships in Healthcare delivery across Europe”, (En línea http://ec.europa.eu/health/expert_panel/opinions/docs/003_assessmentstudyppp_en.pdf).
Farrell, M. J. (1957). "The Measurement of Technical Efficiency." Journal of the Royal Statistical Society 120(3): 237-250.
Federación de Asociaciones para la defensa de la Sanidad Pública (2010). "Los servicios sanitarios de las Comunidades Autónomas." Fetter, R. y J. Freeman (1986). "Diagnosis Related Groups: Product Line Management within Hospitals." Academic Management Review 11(1): 41-54.
Fetter, R. Youngsoo S., Freeman J, Averill R., Thompson J. (1980). “Case Mix Definition by Diagnosis-Related Groups”. Medical Care 18 (2)
239

CHAPTER 7 BIBLIOGRAPHY
Freire J. M (2006). “El Sistema Nacional de Salud español en perspectiva comparada europea; diferencias, similitudes, retos y opciones” Revista Claridad 2006 (7).
Frenk, J. (2005). Health insurance in Mexico: achieving universal coverage through structural reform. Health Affairs, 24(6), 1467-1476.
Fresneda, S. (1998). “La Contabilidad Analítica en los Hospitales Públicos”. Revista de Contabilidad 1 (1) 53-73.
Fundación Idis (2013). “Aportando valor”. En línea (http://www.fundacionidis.com/wp-content/uploads/2013/03/AnalisisSituacion_2013.pdf).
Fusté, J., Bolíbar Ribas, B. et al (2002). “Hacia la definición de un conjunto mínimo de datos de atención primaria”. Atención Primaria 30 (4) 229-235.
Gaffeny D., Pollock AM. et al (1999). “The Private Finance Initiative. NHS capital expenditureand the private finance initiative-expansion or contraction?” BMJ 319 (7204) 249-253.
García, S. et al (2010). “Spain Health System review”. Health Systems in Transition, 12 (4):1-290.
240

CHAPTER 7 BIBLIOGRAPHY
Gay, J., Paris, V. et al (2011). “Mortality amenable to healthcare in 31 OECD countries: Estimates and Methodological Issues. OECD Health Working Papers 55.
Gómez-Ibañez J.A. (2003). “Regulation Infrastructure. Monopoly, contracts and discrection” Harvard University Press.
Grosskopf, S. y V. Valdmanis (1987). "Measuring Hospital Performance: A Non-Parametric Approach." Journal of Health Economics 6(2): 1149-1162.
Guadalajara, N. (1994). “Análisis de costes en los hospitales”. M/C/Q.
Guerrero, R., Gallego, A. I., Becerril-Montekio, V., & Vásquez, J. (2011). The health system of Colombia. Salud Pública de México, 53, s144-s155.
Hellowell, M., Pollock, AM. (2007). “New development: the PFI, Scotland´s plan for expansion and its implications”. Public Money & Management (27) 351-354.
Hellowell, M., Pollock AM. (2009). “The private financing of NHS hospitals: politics, policy and practice”. Economic Affairs (29) 13-19.
Herr, A. (2008). “Cost and technical efficiency of German hospitals: does ownership matter. Health Economics. (17) 1057-1071.
241

CHAPTER 7 BIBLIOGRAPHY
Herr, A., Schmitz H. et al. (2011). “Profit efficiency and ownership of German hospitals”. Health Economics (20) 660-674.
Hollingsworth, B. (2008). "The measurement of efficiency and productivity of health care delivery." Health Economics 17(10): 1107-1128. Homberg G., Rothstein B. (2011). “Dying of corruption”. Health Economics, Policy and Law 6.
Hsiao, W., et al. (1986). "Lessons of the New Jersey DRG payment system." Health Affairs 5(2): 32-45.
IASIST (2009). “Desarrollo metodológico de los indicadores ajustados” 1 (1). En línea (http://www.iasist.es/files/Metodologia%20indicadores.pdf) IASIST (2011). "Evaluación de resultados de los hospitales en España según su modelo de gestión." 1(1): .En línea (http://www.iasist.com.es/files/Modelos_de_gestion.pdf).
James, B., et al. (2010). "De facto privatization or a renewed role for the EU? Paying for Europe´s healthcare infrastructure in a recession." Journal of The Royal Society of Medicine 103(51): 5.
242

CHAPTER 7 BIBLIOGRAPHY
La Forgia, G. M. and A. Harding (2009). "Public-Private Partnerships And Public Hospital Performance In São Paulo, Brazil." Health Affairs 28(4): 1114-1126. Levene, H. (1960). "In Contributions to Probability and Statistics: Essay in Honor of Harold Hotelling, I. Olkin et al." Stanford University Press: 278-292.
Ley, E. (1991). "Eficiencia productiva: un estudio aplicado al sector hospitalario. Respuesta." Investigaciones Económicas 15(3): 755-756. López Casasnovas, G. and A. Wagstaff (1988). "La combinación de los factores productivos en el hospital: una aproximación a la función de producción." Investigaciones Económicas 12(2): 305-327. Mann, H. and D. Whitney (1947). "On a Test of Whether one of Two Random Variables is Stochastically Larger than the Other." Annals of Matematical Statistics 18(1): 1-164. Marshall, M. N., Shekelle, P. G et al. (2000). The public release of performance data: what do we expect to gain? A review of the evidence. Jama, 283(14), 1866-1874.
Mason A., Street A., Verzulli, R. (2010) “Private sector treatment centres are treating less complex patients than the NHS”. Journal of the Royal Society of Medicine (103) 322-331.
243

CHAPTER 7 BIBLIOGRAPHY
McKee, Edwards et al . (2006). “Public-private partnerships for hospitals”, Bulletin of the World Health Organization 84.
Martín, J. J. y M. López del Almo (2007). "La medida de la eficiencia en las organizaciones hospitalarias." Presupuesto y gasto público 49: 139-161. Ministerio de Sanidad, Servicios Sociales e Igualdad. (2008). Gasto Sanitario Público. En línea(http://www.msssi.gob.es/organizacion/sns/docs/gasto08.pdf).
Ministerio de Sanidad, Servicios Sociales e Igualdad.(2012). “Informe anual del Sistema Nacional de Salud”. En línea (http://www.msssi.gob.es/estadEstudios/estadisticas/sisInfSanSNS/tablasEstadisticas/infsns2012.pdf)
Ministerio de Sanidad, Servicios Sociales e Igualdad. (2010). Unidad de Urgencias Hospitalaria. En línea (http://www.msssi.gob.es/organizacion/sns/planCalidadSNS/docs/UUH.pdf). Nieto Garrido, E. (2004). “La financiación privada de obras y servicios públicos en el Reino Unido”. Revista de Administración Pública 164.
Nolte, E. y McKee C. (2008). “Measuring the health of nations. Updating an earlier analysis”. Health Affairs 27 (1).
244

CHAPTER 7 BIBLIOGRAPHY
North American Nursing Diagnosis Association (NANDA). (2005).
“Diagnósticos enfermeros: definiciones y clasificación 2005-2006”.
Elsevier.
Ochando, C. (2009). “El Estado del Bienestar: Objetivos, Modelos y Teorías Explicativas”. Ediciones Académicas.
O’Neill, L., et al. (2008). "A cross-national comparison and taxonomy of DEA-based hospital efficiency studies." Socio-Economic Planning Sciences 42(3): 158-189.
OMS (1946): “Crónica de la OMS”.1,(31).
Palomo, L., Gené Badia, J. (2012).“Informe SESPAS 2012: Atención Primaria: Evidencias, experiencias y tendencias en clínica, gestión y política sanitaria”. Gaceta Sanitaria (26).
Peiró, S., Meneu, R., (2012) “Eficiencia en la gestión hospitalaria pública: directa vs privada por concesión”. FEDEA. En línea (http://www.fedeablogs.net/economia/?p=27263).
Peiró, S. (2013). “Colaboraciones público-privadas: ¿Qué sabemos hasta ahora?” XXXIII Jornadas de Economía de la Salud. Santander (18-21 de Junio 2013).
Puig-Junoy, J. and E. Dalmau (2000). ¿Qué sabemos acerca de la eficiencia de las organizaciones sanitarias en España? Una revisión de
245

CHAPTER 7 BIBLIOGRAPHY
la literatura económica. XX Jornadas de Economía de la Salud. Palma de Mallorca (3-5 Mayo 2000). Asociación de Economía de la Salud. Rechel, B., et al. (2009). "Investing in Hospitals of the Future." Observatory Studies Series 16(12): 89-92.
Rivero A., et al (1997) “Análisis y Desarrollo de los GRDs en el Sistema Nacional de Salud”. Ministerio de Sanidad y Consumo Rodríguez López, F. and J. I. Sánchez Macías (2004). "Especialización y eficiencia en el sistema hospitalario español." Cuadernos Económicos ICE 67: 27-47. Romero, C. (2004). "A general structure of achievement function for a goal programming model." European Journal of Operational Research 153: 675-686.
Sanchez-Martínez, F., Abellán-Perpiñán JM., Oliva-Moreno, J. (2014). “La privatización de la gestión sanitaria: efecto secundario de la crisis y síntoma del mal gobierno. Informe SESPAS 2014”. Gaceta Sanitaria (28) 75-80. Seijas, A. and G. Iglesias (2009). "Medida de la eficiencia técnica en los hospitales públicos gallegos." Revista Galega de Economía 18(1): 4-12.
246

CHAPTER 7 BIBLIOGRAPHY
Schwab, K. (2013). “The Global Competitiveness Report”. World Economic Forum. En línea(http://www3.weforum.org/docs/WEF_GlobalCompetitivenessReport_2013-14.pdf). Sherman, H. D. (1984). "Hospital Efficiency Measurement and Evaluation: Empirical Test of a New Technique." Medical Care 22(10): 922-938.
Tarazona, E., et al. (2005). "La experiencia del "modelo Alzira" del Hospital de la Ribera a la Ribera-Área 10 de salud, la consolidación del modelo." Revista Administración Sanitaria: 83-98. The National Academics (2013). “U.S. Health in international perspective: Shorter lives , poorer health”. National Academies Press.
Presupuestos Generales de la Generalitat Valenciana, (2010). LEY 17/2010, de 30 de diciembre, de Presupuestos de la Generalitat para el ejercicio 2011. Vargas González, V., Hernández Barrios, E. (2007). "Indicadores de gestión hospitalaria." Revista de Ciencias Sociales.
Vecchi, V., Hellowell, M., Longo, F. (2010). “Are Italian healthcare organizations paying too much for their public-private partnerships?”. Public Money & Management (30) 125-132.
247

CHAPTER 7 BIBLIOGRAPHY
Vivas-Consuelo, D. et al (2014). “Predictability of pharmaceutical spending in primary health services using Clinical Risks Groups”. Health Policy 116, (2-3) 188-195.
Walshe K. and Smith, J.(2011). “Healthcare Management”. McGraw-Hill Education , 20-22
248

CHAPTER 7 BIBLIOGRAPHY
8. ANNEXES249

CHAPTER 8 ANNEXES
ANNEX 1. CALCULATION OF THE COST PER PROCEDURE/DRG AT A HOSPITAL
IN ONE YEAR
IT CODE
DRG
Descrip&on of DRG Total cost (€)
Average cost (€)
StayAverag
e stay
Cost per stay (€)
H10 1 Craniotomy, age >17 with complica:ons
106,696.54
3,810.59
392 14.0 272.19H10 2 Craniotomy, age >17 without
complica:ons198,569.17
2,451.47
1065 13.1 186.45
H10 6 Carpal tunnel release50,068.
72 538.37 2 0.025,034.
36
H10 7
Opera:ons on peripheral nerves and skull and other opera:ons on the nerves with complica:ons
12,693.91
2,115.65 14 2.3 906.71
H10 8
Opera:ons on peripheral nerves and skull and other opera:ons on the nerves without complica:ons
88,160.11
1,241.69 70 1.0
1,259.43
H10 9 Spine injuries and disorders 3,586.41
1,195.47
17 5.7 210.97H10 10 Nervous system neoplasm
with complica:ons88,263.
551,961.
41405 9.0 217.93
H10 11 Nervous system neoplasm without complica:ons
36,629.96
1,046.57
355 10.1 103.18H10 12 Degenera:ve diseases of the
nervous system83,417.
661,191.
68685 9.8 121.78
H10 13 Mu l : p l e s c l e r o s i s a n d cerebellar ataxia
51,116.68
896.78 153 2.7 334.10H10 14 Ictus with infarct 372,81
7.791,515.
521990 8.1 187.35
H10 15Nonspecific cerebrovascular accident and precerebral occlusion with infarct
133,372.16
1,149.76 788 6.8 169.25
H10 16Nonspecific cerebrovascular disorders with complica:ons
12,928.63
1,436.51 85 9.4 152.10
H10 17 Nonspecific cerebrovascular disorders complica:ons
10,834.93
773.92 82 5.9 132.13H10 18 Peripheral and cranial nerve
disorders with complica:ons13,697.
481,141.
46161 13.4 85.08
H10 19 Peripheral and cranial nerve d i s o r d e r s w i t h o u t
32,619.58
741.35 196 4.5 166.43
H10 21 Viral meningi:s 3,368.18
673.64 26 5.2 129.55H10 22 Hypertensive encephalopathy 953.78 953.78 7 7.0 136.25H10 23 Nontrauma:c stupor and
coma2,046.3
0682.10 32 10.7 63.95
250

CHAPTER 8 ANNEXES #
ANNEX 2. CALCULATION OF THE COST PER PROCEDURE/DRG AT A HOSPITAL IN ONE YEAR
IT CODE
DRG Descrip&on of DRG
Weigh&ng of DRG
Cases
Sum of weighAng
Medical staff (€)
Non-‐medical healthca
re staff (€)
Non-‐healthcare staff (€)
H10 1
Craniotomy, age >17 with complica:ons 4.8838 28
136.7464
28,945
29,828.98
178.15
H10 2
Craniotomy, age >17 without complica:ons 3.1419 81
254.4939
53,868
55,513.67
331.55
H10
6 Carpal tunnel release 0.69 93 64.17
13,583
13,997.63
83.60
H10
7 Opera:ons on peripheral nerves and skull and other opera:ons on the nerves with complica:ons
2.7115 616.269
3,444 3,548.82 21.19
H10 8
Opera:ons on peripheral nerves and skull and other opera:ons on the nerves without complica:ons 1.5914 71
112.9894
23,916
24,646.78
147.20
H10 9 Spine injuries and disorders 1.4829 3
4.4487
1,471 1,612.49
161.66
H10 10
Nervous system neoplasm with complica:ons 2.433 45
109.485
36,211
39,684.34
3,978.56
H10 11
Nervous system neoplasm without complica:ons 1.2982 35
45.437
15,028
16,469.26
1,651.13
H10 12
Degenera:ve diseases of the nervous system 1.4782 70
103.474
34,223
37,505.57
3,760.12
H10
13 Mu l : p l e s c l e r o s i s a n d cerebellar ataxia
1.1124 57 63.4068
20,971
22,982.67
2,304.13
H10
14 Ictus with infarct 1.8799 246
462.4554
152,953
167,623.31
16,805.09
H10 15
Nonspecific cerebrovascular accident and precerebral occlusion with infarct 1.4262
116
165.4392
54,718
59,965.71
6,011.87
H10 16
Nonspecific cerebrovascular disorders with complica:ons 1.7819 9
16.0371
5,304 5,812.87
582.77
H10
17 Nonspecific cerebrovascular disorders complica:ons 0.96 14
13.44
4,445 4,871.51
488.39
H10 18
Peripheral and cranial nerve disorders with complica:ons 1.4159 12
16.9908
5,620 6,158.55
617.43
251

CHAPTER 8 ANNEXES #
ANNEX 3: COST PER Equivalent paKent AND AREA IT CODE
TYPE OF MANAGEMENT
CLUSTER
Cost per total
equivalent pa&ent
Cost per equivalent pa&ent in the medical
Cost per equivalent pa&ent in the surgical
Cost per equivalent pa&ent in the
outpa&en
Cost per equivalent pa&ent in the
emergencH1 0 2 1,426 1,368 1,108 2,073 1,966H2 0 2 1,248 1,061 1,293 1,215 1,882H3 0 0 1,261 242 1,383 1,136 2,840H4 0 1 1,127 718 960 1,421 3,058C1 1 2 997 1,177 707 1,093 1,968H5 0 1 1,018 580 987 1,471 2,574H6 0 1 1,895 2,546 1,201 852 4,242H7 0 1 1,458 1,571 952 1,922 2,238H8 0 2 1,309 1,267 754 2,995 1,982H9 0 0 1,261 571 1,429 1,092 0H10
0 2 984 806 780 1,619 1,691H11
0 2 1,215 1,229 827 2,194 2,333H12
0 1 1,009 453 1,247 1,570 2,356H13
0 1 970 767 1,127 952 1,649H14
0 1 1,220 691 1,219 1,950 2,598H15
0 1 967 617 1,034 1,519 1,751H16
0 1 1,311 765 1,268 1,947 3,243H17
0 1 852 361 888 1,366 2,240H18
0 1 845 502 988 848 1,559H19
0 1 1,034 373 1,242 1,701 1,985H20
0 2 1,105 791 1,103 1,664 1,668H21
0 1 1,790 1,869 1,490 1,974 2,691C2 1 1 948 980 640 1,207 2,325C4 1 0 0 0 0 0 0C3 1 1 1,317 1,369 883 1,658 2,998C5 1 0 0 0 0 0 0H22
0 3 1,567 1,730 911 3,394 3,053
252

CHAPTER 8 ANNEXES #
ANNEX 4: HEALTHCARE MATERIAL UTILIZATION GROUPED BY AREA
IT CODE
TYPE OF MANAGEMENT
CLUSTER
TOTAL MATERIAL
MATERIAL FOR THE OUTPATIE
NT SERVICE AREA
MATERIAL FOR THE
MEDICAL AREA
MATERIAL FOR THE
SURGICAL AREA
MATERIAL FOR THE EMERGEN
CY DEPARTMENT AREAH1 0 2 8,097,093.
56411,855.8
71,047,05
2.726,245,52
6.07392,658.9
0H2 0 2 3,443,100.69
150,829.35
427,246.23
2,580,922.09
284,103.02H3 0 0 787,224.6
379,212.22 0.00 639,705.
3068,307.11
H4 0 1 2,679,501.38
126,263.81
34,437.32
2,227,992.15
290,808.10C1 1 2 5,926,311.
90200,460.3
11,219,10
6.934,179,83
5.84326,908.8
1H5 0 1 2,025,004.86
198,097.99
1,295.39 1,631,055.17
194,556.31H6 0 1 1,719,787.
5933,968.14 1,276,84
3.73308,016.
37100,959.3
5H7 0 1 2,626,374.29
170,832.86
188,461.50
2,034,221.53
232,858.41H8 0 2 11,027,12
9.531,032,316
.302,057,59
0.547,407,85
7.20529,365.4
9H9 0 0 2,469,519.20
1,389.11 0.00 2,468,130.09H10 0 2 12,428,19
2.65568,768.6
41,349,04
6.139,495,04
5.101,015,332.
78H11 0 2 11,240,356.57
767,242.67
1,322.291.33
8,651,537.13
499,285.44H12 0 1 2,902,573.
3095,851.69 93,908.3
02,543,07
4.34169,738.9
7H13 0 1 3,570,309.12
121,218.70
77,260.96
3,122,029.21
249,800.25H14 0 1 6,153,757.
20332,649.2
7151.496.
065,220,79
9.24448,812.6
3H15 0 1 3,394,188.84
181,905.72
427,982.66
2,573,493.30
210,807.16H16 0 1 3,946,838.
2386,505.38 991,185.
642,621,81
6.77247,330.4
4H17 0 1 3,811,113.10
302,260.47
0.00 3,302,366.64
206,485.98H18 0 1 1,676,465.
21127,544.0
0131,341.
911,172,97
5.92244,603.3
8H19 0 1 1,977,312.55
142,812.67
71.78 1,592,520.83
241,907.27H20 0 2 8,262,901.
42348,797.6
61,054,18
8.626,556,74
6.02303,169.1
2H21 0 1 2,657,803.62
167,083.35
487,366.76
1,948,648.19
54,705.32C2 1 1 6,067,755.
71562,491.4
1579,791.
384,199,69
0.68725,782.2
5C4 1 0 0.00 0.00 0.00C3 1 1 5,024,544.
03326,723.8
8387,403.
883,490,56
2.59819,853.6
8C5 1 0 0.00 0.00 0.00H22 0 3 18,679,09
6.251,161,158
.613,192,76
5.2513,698,1
70.90627,001.4
9
253

CHAPTER 8 ANNEXES #
ANNEX 5: COSTS GROUPED BY SOURCE AND HOSPITAL
IT CODE
TYPE OF MANAGEMENT
CLUSTER
TOTAL COST
COST OF THE
OUTPATIENT
SERVICE AREA
COST OF THE EMERGENCY DEPARTMENT AREA
COST OF OPERATI
NG ROOM + HOSP.
COST OF OPERATI
NG ROOM
COST OF THE
INPATIENT CARE AREA
H1 0 2 71,280,962.69
12,210,327.55
11,482,893.23
47,587,741.91
20,180,951.31
27,406,790.61H2 0 2 33,855,2
91.828,152,43
2.175,254,950.55
20,447,909.10
9,792,319.94
10,655,589.16H3 0 0 9,257,98
6.96
2,174,103,242,106.80
3,841,771.01
3,398,515.56
443,255.45H4 0 1 26,961,5
01.663,410,86
0.527,431,826.82
16,118,814.32
9,578,305.13
6,540,509.19C1 1 2 55,892,7
11.738,848,32
7.228,154,466.40
38,889,918.12
19,040,085.07
19,849,833.05H5 0 1 29,548,8
43.315,818,34
5.566,993,991.92
16,736,505.83
9,132,385.56
7,604,120.27H6 0 1 17,876,5
07.891,991,82
6.834,506,345.04
11,378,336.02
3,552,748.29
7,825,587.73H7 0 1 30,913,3
17.674,492,42
0.766,021,148.32
20,399,748.59
7,712,485.37
12,687,263.23H8 0 2 85,236,4
24.1823,621,5
38.3312,765,080.46
48,849,805.39
22,827,152.90
26,022,652.49H9 0 0 9,010,24
4.86952,528.
510.00 8,057,71
6.357,455,10
4.70602,611.6
5H10
0 2 63,824,724.68
14,174,652.18
9,978,653.41
39,671,419.09
24,918,644.11
14,752,774.98H1
10 2 89,699,7
18.3214,545,1
26.5713,973,359.69
61,181,232.06
28,903,090.35
32,278,141.71H1
20 1 22,112,3
10.954,747,11
2.904,606,908.85
12,758,289.20
7,983,699.71
4,774,589.49H1
30 1 27,692,5
80.03
3,325,163,914,840.64
20,452,574.07
9,609,662.53
10,842,911.54H1
40 1 47,901,5
39.328,714,83
9.5910,803,167.23
28,383,532.50
16,659,545.89
11,723,986.61H1
50 1 26,163,2
42.544,468,05
4.734,857,260.26
16,837,927.56
9,121,805.06
7,716,122.50H1
60 1 31,211,6
05.764,576,80
7.578,409,063.19
18,225,735.00
9,575,458.40
8,650,276.60H1
70 1 29,463,9
70.055,588,53
9.467,689,528.10
16,185,902.49
10,813,154.07
5,372,748.42H1
80 1 10,040,4
31.031,965,09
8.062,155,471.35
5,919,861.62
3,688,715.91
2,231,145.71H1
90 1 23,003,5
07.825,170,70
0.374,890,319.11
12,942,488.34
9,582,337.18
3,360,151.16H2
00 2 48,177,8
26.129,378,31
6.916,370,705.66
32,428,803.55
19,152,104.33
13,276,699.22H2
10 1 22,607,5
78.747,044,65
2.281,430,074.03
14,132,852.43
7,113,311.54
7,019,540.89C2 1 1 38,833,1
54.576,082,86
7.566,222,285.41
26,528,001.60
11,384,260.65
15,143,740.95C4 1 0 0.00 0.00 0.00 0.00 0.00 0.00
C3 1 1 37,121,737.25
6,899,286.98
6,509,297.11
23,713,153.16
11,246,101.51
12,467,051.65C5 1 0 0.00 0.00 0.00 0.00 0.00 0.00
254

CHAPTER 8 ANNEXES #
ANNEX 6: DEA VALUES IN THE EMERGENCY DEPARTMENT AREA
DMU
Cost of the emergency department
{1}
Exam rooms in
the emergen
cy
department {1}
Observa&onal rooms in the emergency department
{1}
Wait &me {1}
Equivalent pa&ent in the emergency department
{1}
H1 11.482.893 11 34 279 5.840
H2 5.254.950 7 12 224 2.793
H4 7.431.826 13 14 170,5 2.431
C1 8.154.466 10 31 223 4.144
H5 6.993.991 9 19 268 2.717
H6 4.506.345 6 6 192 1.062
H7 6.021.148 6 13 184 2.691
H8 12.765.080 16 24 269 6.439
H10 9.978.653 23 18 770 5.900
H11 13.973.359 12 30 163 5990
H13 3.914.840 22 26 220 2373
H15 4.857.260 21 13 232 2773
H16 8.409.063 10 18 263 2593
H17 7.689.528 14 21 250 3433
C2 6.222.285 23 53 271 2676
H22 25.016.119 21 36 239 8193
C3 6.509.297 28 14 170 2171
255

CHAPTER 8 ANNEXES #
ANNEX 7: DEA VALUES IN THE SURGICAL AREA
DMUMaterial for opera&ng rooms {1}
Opera&ng rooms {1}
Interven&onal rooms {1}
Delivery rooms {1}
Average delay in opera&ons
{0}
Pa&ents in opera&ng rooms {0}
H1 6245526.07 18 3 2 47 18207
H2 2580922.09 6 1 2 35 7576
H4 2227992.15 9 1 2 36 9978
C1 4179835.84 14 2 4 46 26946
H6 308016.37 3 2 1 32 2959
H7 2034221.53 11 2 2 26 8104
H8 7407857.20 16 0 3 41 30264
H10 9495045.10 23 3 2 41 31937
H11 8651537.13 27 4 3 54 34968
H12 2543074.34 8 6 3 51 6402
H13 3122029.21 11 3 2 41 8530
H14 5220799.24 13 2 2 36 13671
H15 2573493.30 9 4 2 36 8820
H16 2621816.77 6 1 2 30 7553
H17 3302366.64 10 1 2 38 12180
C2 4199690.68 12 0 2 29 17778
C3 3490562.59 14 1 2 41 12737
H22 13698170.90 40 16 3 81 58958
256

CHAPTER 8 ANNEXES #
ANNEX 8: DEA VALUES IN THE OUTPATIENT SERVICE AREA
DMUCOST OF
OUTPATIENT SERVICE AREA
{1}
CONSULTING ROOMS {1}
PATIENTS EQUIVALENT IN VISITS {0}
Delay in first visits {0}
H1 12,210,327.5581
5,891 49.5137
H2 8,152,432.17 83 6,709 66.4975
H4 3,410,860.52 51 2,400 40.2676
C1 8,848,327.22 75 8,098 40
H5 5,818,345.56 60 3,954 124.0129
H7 4,492,420.76 22 2,338 21.4839
H8 23,621,538.33 117 7,886 51.1814
H10 14,174,652.18126
8,753 35.962
H11 14,545,126.57 134 6,628 60.571
H12 4,747,112.90 43 3,023 65.085
H13 3,325,165.32 45 3,493 74.121
H14 8,714,839.59 58 4,469 57.4019
H15 4,468,054.73 35 2,942 60.8242
H16 4,576,807.57 30 2,350 23.0694
H17 5,588,539.46 76 4,092 58.9436
H18 1,965,098.06 38 2,318 136.1291
H19 5,170,700.37 50 3,040 48.6499
H20 9,378,316.91 63 5,634 34
C2 6,082,867.56 62 5,041 32.6287
H22 38,306,312.72 174 11,288 45.759
C3 6,899,286.98 71 4,160 42.9
257

258

Ph.D. Program in Business Administration
27th October 2014
Public-Private Partnerships in Healthcare. Evaluation of 10 years’ experiencein Spain.
Doctoral ThesisAntonio Clemente
Directors:
David Vivas Maria CaballerISBN: 978-84-606-8865-5
Doc
tora
l The
sis:
Pub
lic-P
riva
te P
artn
ersh
ips
in H
ealt
hcar
e. E
valu
atio
n of
10
year
s’ e
xper
ienc
e in
Spa
in. A
nton
io C
lem
ente