public pensions in massachusetts: the true cost - beacon hill
TRANSCRIPT

BHI Policy StudyFebruary 2013
Public Pensions in Massachusetts: The True Cost
Paul Bachman, MSIE
Michael Head, MSEP
Frank Conte, MSPA
THE BEACON HILL INSTITUTE AT SUFFOLK UNIVERSITY
8 Ashburton Place Boston, MA 02108
Tel 617‐573‐8750, Fax 617‐994‐4279 E‐mail: [email protected], Web: www.beaconhill.org

© The Beacon Hill Institute 2013
2 | Public Pensions in Massachusetts: The True Cost / February 2013
TableofContentsTable of Contents ......................................................................................................................... 2
Executive Summary ..................................................................................................................... 3
Introduction .................................................................................................................................. 5
How Did We Get Here ................................................................................................................ 8
Where Are We Now? ................................................................................................................. 15
Our Model ................................................................................................................................... 19
Results .......................................................................................................................................... 23
Conclusion .................................................................................................................................. 29
Appendix ..................................................................................................................................... 30
References ................................................................................................................................... 33
About the Authors ..................................................................................................................... 36

© The Beacon Hill Institute 2013
February 2013/ Public Pensions in Massachusetts: The True Cost | 3
ExecutiveSummary
Massachusetts faces a combined $23.6 billion unfunded liability in its three largest pension funds: the State Employee’s Retirement System, the Massachusetts Teacher’s Retirement System and the Boston Teacher’s Retirement System. Under current assumptions made by the Commonwealth, fully funding the three largest pension funds would require the Commonwealth to make mortgage payments of $1.3 billion a year for the next 30 years.
Like most states, Massachusetts is facing a serious pension crisis that, without far‐reaching reform, is clearly unsustainable. The Commonwealth cannot take comfort in the fact that its pension system has not reached the crisis proportion facing states such as California and Illinois. Current assumptions clearly need to be revised. Macroeconomic conditions call into question the ability of the state to realize 8.25 percent returns for the funds that it manages.
As we will show in our discussion on pension reform, recent changes to address egregious attempts at gaming‐the‐system did close major loopholes, saving taxpayers money. The vast change in the ratio of expected liabilities to expected assets, or unfunded liability, for these pension funds over the course of four underperforming years shows how the underlying assets and assumptions applied to these assets can create distinctly different predictions of the pension’s viability. The current funding ratios may even be more optimistic than reality.
The Beacon Hill Institute at Suffolk University (BHI) used two different accounting methodologies to review three of the major public pensions in the Commonwealth. The results are sobering.
Applying Accrued Benefit Obligation (ABO) and Projected Benefit Obligation (PBO) methodology, which simplifies many assumptions made by the state and limits the view of assets and liabilities, allows us to show how important a single variable, the discount rate, is to viewing pensions risk to taxpayers. Using the states assumed discount rate, combined unfunded liabilities for the state’s three largest pensions is $3.1

© The Beacon Hill Institute 2013
4 | Public Pensions in Massachusetts: The True Cost / February 2013
billion in a ABO analysis and $12.6 billion under PBO. Using a more applicable discount rate would increase the unfunded liabilities to $22.1 billion and $47.7 billion for ABO and PBO, respectively.
Viewing these unfunded liabilities as mortgage payments over the next 30 years puts the issue in perspective. Current assumptions would require $179 million or $731 million annual payments, respectively using ABO and PBO measures of liabilities. More realistic assumptions would require $1.3 billion or $2.8 billion in annual payments, 4 percent and 8.5 percent of the proposed 2013 budget for ABO and PBO methodologies, respectively.
Paying these bills to fully fund the states three largest pension funds via tax increases spread across personal income, corporate income and sales tax would have significant negative effects on the state’s economy, depending on if ABO or PBO views are applied.
‐ Total state employment would fall by 8,640 or 18,665 jobs compared to a baseline. ‐ Investment would decrease by $185 million or $400 million. ‐ Disposable income per capita would fall by either $105 or $225 per person.
The Commonwealth is constrained by several issues facing its pension system. Foremost it is liable under the law for commitments made to past and present employees. Bold comprehensive reform including conversion to less generous pensions in the future should be an option if the Commonwealth is to place its system on sound footing.

© The Beacon Hill Institute 2013
February 2013/ Public Pensions in Massachusetts: The True Cost | 5
Introduction
Massachusetts faces a combined $23.6 billion unfunded liability in its three largest pension funds.1 Like most states, Massachusetts is facing a pension crisis that, without far‐reaching reform, is unsustainable.2 The Commonwealth currently only funds 65 percent of its pension liability, a share that we will show is overstated and which is significantly below an 80 percent benchmark established by the U.S. Government Accountability Office.3 Moreover, long‐term demographic trends, such as an aging population, suggest the problem will, if not addressed, become worse. In 2000, 13.5 percent of the Massachusetts population was over 65; by 2030, the U.S. Census Bureau projects it to rise to 20.1 percent.4 The demographic shift is stressing a pension system that is unsustainable.
The current system is beset by a mismatch. Massachusetts has likely underestimated the gap between the promises to retirees and what will be needed to meet the obligations to them. Since it was established as a pooled investment in 1983, the Pensions Returns Investment Trust (PRIT) has moved away from a pay‐as‐you‐go approach for retiring employees. Yet, 30 years later, pensions still are not fully funded. The vagaries of the market are not helpful. Shortfalls in one year take considerable time to recover. The onset of the so called “Great Recession” exposed the weakness of the current PRIT system as expected investment returns turned into large investment losses.
1 Public Employee Retirement Administration Commission Commonwealth Actuarial Valuation Report. (January 1, 2012) http://www.mass.gov/perac/valuation/2012commonwealth.pdf. 2 Mary Williams Walsh, “In Budget Crisis, States Take Aim at Pension Costs,” New York Times, June 21, 2010, http://www.nytimes.com2010/06/20/business/20pension.html. 3�U.S. General Accounting Office, “State and Local Government Retiree Benefits: Current Status of Benefit Structures, Protections, and Fiscal Outlook for Funding Future Costs,” GAO‐07‐1156, September 24, 2007. http://www.gao.gov/products/GAO‐07‐1156.4 U.S. Census Bureau, “U.S. Population Projections: State Interim Population Projections, by Age and Sex, 2004‐2030” (Table 3), April 21, 2005, http://www.census.gov/population/www/projections/projectionsagesex.html.

© The Beacon Hill Institute 2013
6 | Public Pensions in Massachusetts: The True Cost / February 2013
Debt financing is not an attractive option. State and local debt in Massachusetts accounts for 26% of Gross State Product.
The Commonwealth estimates the value of its assets will grow at 8.25 percent, a rate it classifies as moderate.5 But the Commonwealth has failed to reach that benchmark over time. The state has a net investment return history of 6.29 percent over the past 10 years.6 This net return suggests that pension funds may be failing to properly account for the risk profile of their investment portfolio.
The Commonwealth has responded to the problem. Current new hires make greater contributions to their pensions than workers who fall outside of the reform measure. These current new hires could, depending on various assumptions, bear most of the burden themselves. While other states also use indefensibly low contribution rates, such as a rate as low as five percent recently in California, Massachusetts has increased employee contribution rates, thus moving closer to a fully funded system. The recent economic downturn and tepid recovery call into question the viability of traditional public pension funding. State tax revenues across the nation are slowly recovering to pre‐recession levels. The shortfalls in pension funding are compounded by the addition of non‐pension benefits for retirees such as healthcare. Ultimately the burden of the pension unfunded liabilities fall on Massachusetts taxpayers, since reductions in the pensions of current senior employees and retirees is politically unlikely.
The volatility of business cycles, and their subsequent effect on pension fund returns, suggests that employees need to share in the investment risk. Under a defined benefit (DB) system, many of the state’s private employees not only bare the risk of their own retirement savings and investment returns, but additionally bare the risk associated with the public pension plans. Placing all of the risk on taxpayers, who have their own retirement plans to worry about, is unfair. The reliance on “smoothing” investment
5 PRIT Fund Investment Policy Statement. http://www.mapension.com/publications/. 6 Commonwealth of Massachusetts. Public Employee Retirement Administration Commission, 2011 Annual Report http://www.mass.gov/perac/11annualreport/ar11.pdf.

© The Beacon Hill Institute 2013
February 2013/ Public Pensions in Massachusetts: The True Cost | 7
gains or losses over short periods obscures true size of liabilities.7 This leads to another question: how can we translate tomorrow’s benefits obligations into current dollar?
Several states are faced with a dilemma of how they will pay their employees given the promises they have already made to them. For instance, the California State Teachers’ Retirement System faces a $63 billion unfunded liability, while the California Public Employees’ Retirement Systems is unfunded by $51 billion.8 It is easy to blame the financial crisis for the pension crisis. But recessions have a habit of exposing structural weaknesses. Delivering benefits now, while pushing costs years down the road, has created the current situation where billions of dollars are owed beyond the ability of the assets now held by the states to cover. One weakness is the reliance on optimistic rates of return and tying the discount rate to this rate of return.
7 Renee Haltom, “Fuzzy Math: Public Pensions are Under‐funded—How Bad Is It?” Region Focus, Richmond Federal Reserve (2010): 1‐4, 2010. 8 Milliman 2012 Public Pension Funding Study. http://www.milliman.com/expertise/employee‐benefits/products‐tools/public‐pension‐funding‐study/pdfs/2012‐public‐pension‐funding‐study.pdf.

© The Beacon Hill Institute 2013
8 | Public Pensions in Massachusetts: The True Cost / February 2013
HowDidWeGetHere
In 1911 Massachusetts became the second state in the nation to offer a pension system for state employees. The Massachusetts State Employees’ Retirement System (SERS) was initially implemented as a pension plan for Commonwealth teachers. Since then the retirement system has expanded to include the majority of state public sector employees, while teachers were spun‐off into a new and separate system, the Massachusetts Teachers Retirement System (MTRS).9 These pensions predated Social Security, which was established in 1935. The Boston Teachers Retirement System is one of the largest local retirement systems, and is administered the same as these two state wide systems.
A pension is a retirement allowance that is paid when a member retires or resigns, given that certain requirements are met. The value of the payment varies, dependent on a metric that takes into consideration salary, length of service and retirement age. At the SERS’s inception, members contributed five percent of their regular wage, and were guaranteed a lifelong pension. From the beginning, the pension used a ‘pay‐as‐you‐go’ method, which means that the current income for the SERS was used not to pay the payees’ future pension liability, but to pay for current retirees’ pension liability. This worked well in the early years. Those paying into the fund exceeded those receiving benefits, in both people and total dollars.
But beneficiaries faced the problem of inflation. Due to inflation the value of the pension decreases over time. To defray the effects of inflation, state pension plans included a Cost Of Living Adjustment (COLA). The COLA requires legislative approval annually and is applied to first $13,000 of a retirees’ pension. The COLA is set to match the growth of the Consumer Price Index and cannot exceed three percent. But local options allow for an additional three percent COLA.10
9 The Massachusetts Budget and Policy Center, “Demystifying the State Pension System,” (March 2011) http://massbudget.org/documentsearch/findDocument?doc_id=778&dse_id=1479. 10 Public Employee Retirement Administration Commission, “Main Guide,” http://www.mass.gov/perac/guide/mainguide15.htm.
© The Beacon Hill Institute 2013
February 2013/ Public Pensions in Massachusetts: The True Cost | 9
This form of pension is defined as a Defined Benefit (DB) plan. As long as an employee pays an annual contribution, or premium, he or she will receive a pre‐defined pension payment upon retirement, for the rest of their life. In Massachusetts, this defined benefit is calculated by finding the average of the five top earning years of the employee’s career as a public servant. This average is then multiplied by the vested percentage. The vested percentage is a function of age at retirement and years of service, varying between 15 and 80 percent.11 For example, an employee whose highest average five‐year salary was $60,000, and worked for the state from age 25 to 60, would be eligible for an annual pension of $42,000 for life. Should this person decide to work two more years, at the same average salary, they would be vested at 80 percent, and receive $48,000.
In 1975, lawmakers began to identify potential problems. Realizing that the current generous benefits were outstripping the Commonwealth’s ability to pay, lawmakers enacted the first contribution rate increase. All employees joining the pension plans after January 1, 1975 contribute seven percent of their regular compensation, as opposed to the prior five percent. In 1979, benefits again outstripped contributions, and in addition to the seven percent contribution, all salaries above $30,000 fell under a nine percent contribution rate.12
In late 1983, the Pension Reserves Investment Trust (PRIT) was established to invest and manage the state pension funds, as well as the Boston Teachers pension. With this change came a shift in thinking. Rather than choosing to rely on the pay‐as‐you‐go system, legislators took a longer view. This necessitated looking at pensions in terms of unfunded liabilities.
Unfunded liabilities take into account the total amount of benefits that have been promised (liability) as well as the expected total future value of the PRIT (assets). This change in thinking was prudent and needed, but did not fix the fact that funds were
11 Steven Grossman, Office of the Treasurer and Receiver, “Massachusetts Group 1 Retirement Percentage Chart.” http://www.mass.gov/treasury/docs/retirement/retirementchart.pdf. 12 Commonwealth of Massachusetts, Hampshire Country Board of Retirement, “Frequently Asked Questions,” http://www.hcrb.org/activemembers2/frequentlyaskedque/.

© The Beacon Hill Institute 2013
10 | Public Pensions in Massachusetts: The True Cost / February 2013
flowing out of the PRIT faster than contributions were coming in. With a goal of eliminating unfunded liabilities in the state pension system by 2025, more funds were required to bring assets up to the liabilities. Hence all pension members hired after 1984 were to contribute eight percent of their salary under $30,000 and 10 percent for income over $30,000.
Still, unfunded liabilities increased as state government grew. In 1996, the contribution rate of SERS plans increased to nine percent for the first $30,000 and 11 percent on the rest of income. At the same time, state police officers began contributing 12 percent on their first $30,000 of salary, and 14 percent on the remaining income. This same year, the contributions rates for the MTRS increased for all Group 1 employees to its current 11 percent on all salary.
Over the course of its history, the PRIT has made significant strides toward a fully‐funded pension system. In 1988 most state and local pension plans only had enough assets to account for 20 to 40 percent of their total liabilities. By 2009, “the majority of plans now have funded ratios in excess of 60 percent.”13 The SERS is currently funded at 73.8 percent, the MTRS is funded at 60.7 percent, while the Boston Teachers pension is only funded at 42.9 percent. 14 Despite historical changes in contributions the state pension unfunded liability is $7.3 billion, the state teachers’ pension a whopping $14.3 billion and, due to its smaller size, the Boston Teachers pension is $1.7 billion, based on current assumptions.
According to Commonwealth’s assumptions, these unfunded liabilities are now on track to disappear by 2040. As we will discuss in the next section, some of the actuarial assumptions are unrealistic, and unless meaningful reform is enacted, state taxpayers will be called upon to pay for these unfunded pension promises. As employees pay a larger share of their income, the contributions of their employer, the Commonwealth of Massachusetts, has been held constant relative to a growing budget. The net normal cost (employers’ contribution) for state and teachers pensions was $287.5 million in
13 Public Employee Retirement Administration Commission, 2009Annual Report, http://www.mass.gov/perac/09annualreport/AR09.pdf. 14 Public Employee Retirement Administration Commission, Commonwealth Actuarial Valuation Report. January 1, 2012. http://www.mass.gov/perac/valuation/2012commonwealth.pdf.
© The Beacon Hill Institute 2013
February 2013/ Public Pensions in Massachusetts: The True Cost | 11
2010.15 This represented 0.88 percent of the state budget of $32.49 billion. Between 2001 and 2010, the net normal cost represented up to 1 percent of the entire state budget. The net normal cost was 1.09 percent of state budget in 2000 and has declined since.16 In Fiscal Year 2011, taxpayers paid $1.4 billion from the general fund to cover the shortfall in the pension funds, this is equal to 4.3 percent of the state budget.17
Between 2000 and 2010, the amount contributed by the Commonwealth decreased from 40 percent to 23 percent on normal cost. Similarly, the state contribution has fallen as well due to changes in employee contribution rates. In FY 2011, the state contribution of payroll toward normal cost has been on the decline from 5.2 percent it was in 2000 to 2.6 percent in 2010. This is partly due to introduction of new workers (state workers and teachers) who can now share the burden of funding their own pensions.18
Recent Reform
Any system is subject to misaligned incentives, if not outright abuse. Taxpayers are less likely to see, and remember, positive contributions made by public servants than the infamy associated with bad public pension policy. The names of UMass President and former Senate President William M. Bulger and John Brennan provoked public outcry about the generosity of pension rules. In November 2003, then Governor Mitt Romney sought to overhaul pension system citing the generous housing allowance and special annuity provisions granted to Bulger. This was not fraud, but utilizing a loophole in the original pension law, allowed Bulger to argue that he could include his housing allowance and special annuity as income for retirement purposes, which could have raised his pension by $17,000 to $196,000 annually. Eventually the state Supreme Court
15 Public Employee Retirement Administration Commission, Commonwealth Actuarial Valuation Report. January 1, 2010. http://www.mass.gov/perac/valuation/2010commonwealth.pdf. 16 Massachusetts Budget and Policy Center, “Demystifying the State Pension System: The Cost of Funding Employee Pensions,” (March 7, 2011) http://www.massbudget.org/report_window.php?loc=Pension_3_11.html. 17 Ibid. 18 Ibid.

© The Beacon Hill Institute 2013
12 | Public Pensions in Massachusetts: The True Cost / February 2013
ruled that Bulger was indeed entitled to count the housing allowance as salary even though he never resided in university‐provided housing.19
Like Bulger, John Brennan did not break any laws, but ‘gamed’ the system to earn a pension higher then would be expected. After serving as a state representative and senator for 17 years, Brennan retired with a $19,000 a year pension, as was proscribed by law. Following his retirement Brennan took on the voluntary positions of Trustee at the Malden Public Library Board for 19 years. This position was largely a no‐show job, with Brennan showing up for six out of 36 meetings in the four years leading up to 2007. Despite this, upon leaving the position, he applied to have the 19 years of service included in the calculation of his pension. By adding 19 volunteer years to a salaried position of 17 years, Brennan was able to more than double his pension to $41,000 per year.20 Again public servants responded to the incentives before them.
But the problems with pension payouts run deeper than individual cases. In 2011, 176 former state employees were receiving pensions larger than $100,000, with another 27 added in 2012 alone. Thomas D. Manning, former Chancellor of UMass Medical, will receive $344,576 for life, while state police make up the largest share, with 50 former state police officers currently receiving a six‐figure pension.21 Overall, Massachusetts is among the top six states in the nation paying average annual benefit payments above $30,000 per retiree.22
As we will show in our discussion on pension reform, the changes to address these attempts at gaming did close major loopholes, saving taxpayers some money. But these measures stopped well short of extensive pension reform, leaving many savings on the table, the result of legislative proclivities to water down proposals.
19 Jonathan Saltzman, “SJC allows Bulger pension,” Boston Globe. November 10, 2006. http://www.boston.com/news/education/higher/articles/2006/11/10/sjc_allows_bulger_pension/. 20 Dwight Shepard, “State pension reform overdue agenda item,” Springfield Republican, February 15, 2009. http://www.masslive.com/opinion/index.ssf/2009/02/state_pension_reform_overdue_a.html. 21 Matt Carroll, ʺState’s pension costs on the rise,ʺ Boston Globe, March 20, 2011. http://articles.boston.com/2011‐03‐20/news/29351419_1_number‐of‐state‐retirees‐pension‐reforms‐pension‐boards. 22 U.S. Census, “Annual Survey of Public Pensions: State‐Administered Defined Benefit Data Summary Report: 2011,” (August 2012) http://www.census.gov/govs/retire.
© The Beacon Hill Institute 2013
February 2013/ Public Pensions in Massachusetts: The True Cost | 13
Between 2009 and 2011, public fervor over pension fraud, in conjunction with awareness by the public of the size and cost of many pensions led Governor Deval Patrick to embark upon a set of unprecedented pension reforms. The first phase addressed the most headline‐grabbing of the pension abuses. This included realigning regular compensation with only wages and salary and excluding housing allowances or annuities. Additionally, voluntary jobs no longer counted as years of service.23
Other reforms included the elimination of the one‐day rule, which formally allowed employees to work one day in a calendar year to gain a full year of service when calculating the vested percentage. Additionally, the MBTA pension system was reformed to preclude the option of collecting a pension after 23 years of service, regardless of age. All of these reforms represent progress, and provide a sound basis for further reform.
The second phase was focused less on specific loop holes, and more on changes to the pension system itself. None of these policy suggestions were passed, and were in turn repackaged for phase three.24 The largest proposal contained in phase three of pension reform is an increase in the retirement age for the majority of state workers. For example, the retirement age for Group 1, which covers most state general employees, was increased from between 55 and 65 to between 60 and 67. Other groups, such as Group 4, including firefighters, police officers and correction personnel, had their retirement age increased to between 50 and 57, from a low base of between 45 and 55.
Other proposed modifications change the average of the three highest years’ calculation to the highest five‐year average, to more accurately reflect the employee’s average wage. Similarly, the proposal introduced an ‘anti‐spiking rule’ which would limit the salary change to seven percent per year, excluding promotions or job changes. This last
23 Office of the Governor, “Governor Patrick pushes comprehensive pension reform,” April 06, 2009, http://www.mass.gov/?pageID=gov3pressrelease&L=1&L0=Home&sid=Agov3&b=pressrelease&f=090406_Pension_Reform&csid=Agov3. 24 Office of the Governor, “Pension Reform Phase 2: Comprehensive Pension Reform. http://www.mass.gov/bb/h1/fy11h1/exec_11/hbudbrief5.htm.

© The Beacon Hill Institute 2013
14 | Public Pensions in Massachusetts: The True Cost / February 2013
change was put in place is to prevent large bonuses or other changes in single years to drastically change pension values.25
Also contained in the third, and seemingly final, phase of pension reforms that Governor Patrick put forth were many quality proposals. Some of the original proposals put forth would have made significant changes to the future liabilities the state faced, but were watered down in the political process. Gov. Patrick proposed to cap pension benefits at $85,000. This would have reduced the pension of 64 people retiring in 2012.26 What was actually passed was a limit of pensions for newly hired employees at 64 percent of the federal cap, or $125,440, a number that increases each year since the federal cap is indexed.27 Since this only applies to new hires, the benefits will not be realized for many years as almost all retirees in the next 20 years will be grandfathered in under the old rules. If the federal cap grows at 3 percent a year, the Massachusetts pension cap will be $226,559 in 20 years, when the first fully vested retires will be subject to the cap.28
The second rule was an anti‐spiking rule of seven percent. This would have limited the amount that an individual’s pensionable earnings could have grown “to no more than 7 percent of the average pensionable earning over the last two years plus inflation” not including “bona fide promotions or job changes.”29 This proposal was increased to 10 percent when it was enacted; allowing more room for spiking to occur, thereby reducing the scope for cost savings.
The legislature did remove the Governor’s ill‐conceived proposal to reduce the contribution rate of all Group 1 employees. For pension funds with such large
25 Office of Governor Deval L. Patrick. “Governor Patrick Announces Next Phase of Pension Reform,” January 26, 2010, http://www.mass.gov/governor/pressoffice/pressreleases/2010/governor‐announces‐next‐phase‐of‐pension‐reform.html. 26 Office of the Governor, “Pension Reform Phase 2: Comprehensive Pension Reform. http://www.mass.gov/bb/h1/fy11h1/exec_11/hbudbrief5.htm. 27 PERAC Pension News. No. 24. July 2010. http://www.mass.gov/perac/news/pensionnews24.pdf. 28 =(245000*(1.03^20))*.64*.80 29 PERAC Pension News. No. 24. July 2010. http://www.mass.gov/perac/news/pensionnews24.pdf.
© The Beacon Hill Institute 2013
February 2013/ Public Pensions in Massachusetts: The True Cost | 15
unfunded liabilities, this would have been a bad idea, signaling that the state was not serious in dealing with the funding issue.30
Compared to the prior system, the vast majority of these recent reforms have been effective, making pensions fairer and reducing the opportunity for manipulation. But these reforms, welcome as they are, obscure the real problems facing the Massachusetts pension system.
WhereAreWeNow?
The current status quo for pensions is precarious public policy for two main reasons. First, policy makers assume they understand the issue, and more patchwork legislation will fix any problems that may arise. As time passes, more and more twists have been added to the long line of pension reforms. This same track has been taken with current reforms, that go far enough to correct extreme examples of individuals taking advantage of the system, but take no real steps to addressing the main problem: the unfunded liabilities. But these changes are not enough.
The pension system is a prime example of the inevitable shortcomings of the political process. Similar to long term issues with funding seen in Social Security, the funds are not out of money today, so reform is not accomplished. Costs are perpetually pushed down the road and the elected officials who avoided tackling the issue before them have left public service. But like Social Security, long term projections show that a pension system that was billed to be self‐funding will have to turn to taxpayers. This process also makes it impossible for administrators to match future liabilities with current revenues and assets.
The second reason state pensions are struggling is that public policy incentives are unbalanced and elected officials respond to these incentives. The political benefit of providing, or expanding pensions, are obvious. With a stroke of a pen, polices can put
© The Beacon Hill Institute 2013
16 | Public Pensions in Massachusetts: The True Cost / February 2013
millions of dollars into powerful constituencies. The issue is that the political costs are long term, and when terms are four years, undue weight is put on the short term effect of being reelected.
In 2009, based on PRIT probability tables and risk expectations, the SERS faced $19.02 billion in actuarial assets compared to $24.86 billion in actuarial liabilities, for a funding ratio of 76.5 percent. The MTRS is both larger, and in worse fiscal shape, with $21.26 billion in actuarial assets but $33.74 billion in liabilities, resulting in a funding ratio of only 63 percent.31 In 2008, before the economic recession reduced the value of these funds’ assets, the funds faced ratios of 89 percent and 74 percent respectively.
In its most recent report for 2012, the PRIT identifies the continued degradation of the funding of pension funds. The SERS saw assets increased to $20.51 billion, while actuarial liabilities increased more than twice as fast to $27.78 billion, reducing the funding ratio to 73.8 percent. The MTRS saw similar problems, with the funding ratio falling to 60.7 percent on assets of $22.14 billion compared to actuarial liabilities of $36.48 billion.32
The Boston Teachers fund, while much smaller than the other two, is by far the worst in terms of funding ratios. In the 2008 report, the fund reported $1.2 billion in actuarial assets verses $2.5 billion in actuarial liabilities for a funding ratio of 50.2 percent. The 2012 report shows $1.3 billion in actuarial assets, an increase of just $45 million, compared to actuarial liabilities of $3 billion, a $531 billion increase. The new funding ratio is just 42.9 percent.
The vast change in the funding ratios for these pension funds over the course of four bad year shows how the underlying assets and assumptions applied to these assets can create distinctly different predictions of the pension’s viability. As we will show, the current funding ratios are even more optimistic than reality.
31 Public Employee Retirement Administration Commission, Actuarial Valuation Report, January 1, 2010, http://www.mass.gov/perac/valuation/2010commonwealth.pdf. 32 Public Employee Retirement Administration Commission, Actuarial Valuation Report, January 1, 2012, http://www.mass.gov/perac/valuation/2012commonwealth.pdf.

© The Beacon Hill Institute 2013
February 2013/ Public Pensions in Massachusetts: The True Cost | 17
Current assumptions by the PRIT can have different outcomes. Currently the fund assumes that assets will produce returns of 8.25 percent per year. According to the 2009 Annual Public Employee Retirement Administration Commission Report, the Standards and Poor 500 has returned 7.9 percent over the last 25 years, 6.0 percent over 50 years and 6.6 percent over the last 75 years.33 Since stocks have a higher long‐term risk and reward, you would assume that the return of the pension fund, which diversifies with stocks and bonds, would have a lower return. Similarly, the ‘risk free rate’, widely considered equal to the yield on a US T‐bill, was between 0.15 percent and 0.31 percent in the first half of 2011.34 The PRIT has earned average returns of 9.7 percent over the last 25 years.
The mortality of pension holders has a large effect on unfunded liabilities. As people live longer, they receive more and more payments, despite having the same amount of payment into the fund. The PRIT uses the RP‐2000 Mortality Tables, as defined by the Society of Actuaries. While considered rather unexciting, and accepted, slight changes to this assumption can have large impacts.35
While less controversial, other assumptions have large effects on the unfunded liabilities of the Massachusetts pensions funds. The assumed interest rate on the Annuity Savings fund is set annually at 3.5 percent, while the COLA is assumed to continue at three percent, on the first $13,000 of the pension.36
The assumption about salary increases over a public employee’s career is a double‐ edged sword. On one hand, it affects the assets of the pension fund, as members have
33 Public Employee Retirement Administration Commission, Annual Report, 2009. http://www.mass.gov/perac/report/stateofpension2009.pdf. 34 U.S. Department of the Treasury. Resource Center, “Daily Treasury Yield Curve Rates,”http://www.treasury.gov/resource‐center/data‐chart‐center/interest‐rates/Pages/TextView.aspx?data=yieldYear&year=2011. 35 The Society of Actuaries, RP‐2000 Mortality Tables, (2000) http://www.soa.org/files/research/exp‐study/rp00_mortalitytables.pdf. 36 Public Employee Retirement Administration Commission, State Retirement System, Actuarial Valuation Report. (January 1, 2010) http://www.mass.gov/perac/state/stateval10.pdf.
© The Beacon Hill Institute 2013
18 | Public Pensions in Massachusetts: The True Cost / February 2013
higher salaries, their contributions to the fund increase. On the liability side, if the estimates of future employee raises are too high, then the final five‐year average salary would be estimated too high, leading to increased expected pay outs. The state actuarial valuation report’s estimates are ‘based on an analysis of past experience,” and decrease over time.37 For example, a Group 1 employee should expect an eight percent raise in their first year of service, decreasing to a six percent increase in their fifth year, and 5.25 percent in their tenth year.
Retirement expectations have a similar effect on both the asset and liability side. Should retirement ages increase, as proposed in phase two and three of Governor Patrick’s reform or due to individual decisions to work longer, unfunded liability projections will change. Assets will increase, since employees will be paying into the fund for a longer period of time. Opposing forces will pull liabilities in two different directions. On one hand, individuals will be working longer, reducing their time in retirement, but these same individuals will likely have a higher vested percentage and higher average salary.
Each of these assumptions is just that, an assumption. Many, such as the mortality table, are widely used and accepted. Others, such as the 8.25 percent expected return on investment are more controversial. Items such as the COLA assumption are impossible to accurately project, due to their implementation being dependent on a legislative vote.
37 Ibid.
© The Beacon Hill Institute 2013
February 2013/ Public Pensions in Massachusetts: The True Cost | 19
OurModel
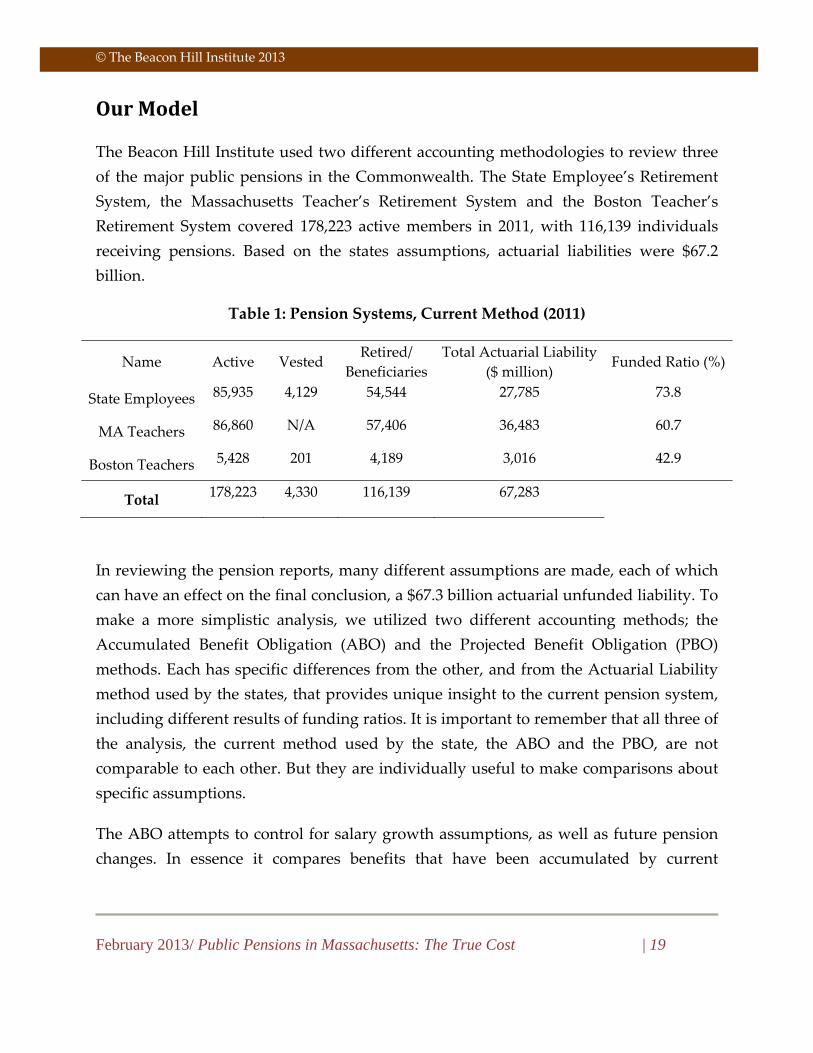
The Beacon Hill Institute used two different accounting methodologies to review three of the major public pensions in the Commonwealth. The State Employee’s Retirement System, the Massachusetts Teacher’s Retirement System and the Boston Teacher’s Retirement System covered 178,223 active members in 2011, with 116,139 individuals receiving pensions. Based on the states assumptions, actuarial liabilities were $67.2 billion.
Table 1: Pension Systems, Current Method (2011)
Name Active Vested Retired/
BeneficiariesTotal Actuarial Liability
($ million) Funded Ratio (%)
State Employees 85,935 4,129 54,544 27,785 73.8
MA Teachers 86,860 N/A 57,406 36,483 60.7
Boston Teachers 5,428 201 4,189 3,016 42.9
Total 178,223 4,330 116,139 67,283
In reviewing the pension reports, many different assumptions are made, each of which can have an effect on the final conclusion, a $67.3 billion actuarial unfunded liability. To make a more simplistic analysis, we utilized two different accounting methods; the Accumulated Benefit Obligation (ABO) and the Projected Benefit Obligation (PBO) methods. Each has specific differences from the other, and from the Actuarial Liability method used by the states, that provides unique insight to the current pension system, including different results of funding ratios. It is important to remember that all three of the analysis, the current method used by the state, the ABO and the PBO, are not comparable to each other. But they are individually useful to make comparisons about specific assumptions.
The ABO attempts to control for salary growth assumptions, as well as future pension changes. In essence it compares benefits that have been accumulated by current

© The Beacon Hill Institute 2013
20 | Public Pensions in Massachusetts: The True Cost / February 2013
employees, and values them in current dollars and compares that liability to total assets on hand. Commonwealth valuation reports ‘based on past experiences’, with minimum annual raises of 4.5 percent for employees with 20 years of service, and 8 percent raises for those with zero years of service.38 But past experiences rarely mirror future realities. Similarly, ABO does not require assumptions of employment growth rates or attrition rates, in essence taking a snap shot of current, accumulated, pension benefits. Furthermore it simplifies the ‘other side’ of the balance sheet, eliminating the need for assumptions of asset return rates.
An ABO analysis is the simplest applicable accounting method. By controlling for many of the assumptions that go into other models, such as the Commonwealth’s own actuarial valuation reports, we are able to isolate the effect of discount rates, with minimal concern about the significance and impact of many assumptions.39 An ABO analysis only uses information known today. Current members, pension’s formulas, current salaries and years of service require no assumptions to be made, making an ABO analysis an ideal first step.
The PBO method makes more assumptions than the ABO analysis. The ABO analysis freezes the current state pension liabilities, and looks at what the Commonwealth would be contractually required to pay at the time. The PBO recognizes that salaries for employees will grow in the future, increasing the pension size of employees.
The Commonwealth presents an Actuarial Valuation Report detailing the underlying assumptions and results in determining the unfunded actuarial liability of the state funds using an Entry Age normal Cost Method. While the most detailed of the three methods, the Cost Method also requires the most assumptions.40
Some of the assumptions that the state make, which were not required for either the ABO or PBO analysis were items such as:
38 Public Employee Retirement Administration Commission, Actuarial Valuation Report 2012, http://www.mass.gov/perac/valuation/2011commonwealth.pdf. 39 Jeffrey R. Brown and David W. Wilcox, ʺDiscounting State and Local Pension Liabilities,ʺ (May 2009). http://tinyurl.com/b3gag3g. 40 Public Employee Retirement Administration Commission, Actuarial Valuation Report 2011 http://www.mass.gov/perac/valuation/2011commonwealth.pdf.
© The Beacon Hill Institute 2013
February 2013/ Public Pensions in Massachusetts: The True Cost | 21
• asset return rate, • interest rate credited to the annuity savings fund, • annual retirement rate, • disability rate, • withdrawal rate, • administrative expenses, • future cost of living legislation, and • future contribution legislation.
By limiting the complexity of our pension model, we are able to review the long‐term viability of the state pension plans at the most basic of level. With a limited number of assumptions, we can review the impact of the discount rate used, which is necessary in any long term pension calculation.
The Massachusetts pension systems use a discount rate equal to their investment return assumption, of 8.25 percent. BHI believes that this assumption is incorrect in two ways, both of which we correct for in our ABO and PBO modeling. First, we argue that the discount rate and investment return rate should not be fixed equal to each other; they are vastly different concepts. Second, the discount rate is set much higher than is prudent, making liabilities seem much smaller than they actually are.
The first issue, that the discount rate is set equal to the asset return rate, should be the easiest to correct. The investment return rate, currently set at 8.25 percent is set equal to what the fund’s managers and the state treasure think the assets under management will return over the long term. Setting aside the actual rate, this concept is much different than that of a discount rate. A discount rate is the rate used to discount future liabilities to the present value, and should be calculated based on the risk of the liability.

© The Beacon Hill Institute 2013
22 | Public Pensions in Massachusetts: The True Cost / February 2013
The ‘risk’ is the level of certainty as to whether certain payments will need to be made.”41
Massachusetts most recent pension reforms face numerous legal obstacles. One is institutional: there is a set of specific levels of protection for pensions in the Massachusetts Constitution.42 That, combined with the strength of the powerful state employee’s constituency, leads to our conclusion that the risk of non‐payment of future state pensions is negligible. The obligation to honor pensions is foremost to even the most secured level of debt. Pensions will be paid before roads are slated to be paved.
Should the state accept that the asset return rate is methodologically different than the discount rate, then setting an independent discount rate would naturally follow. We suggest the Commonwealth take a cautious approach in setting the discount rate. Having an overly optimistic discount rate will result in understating unfunded liabilities which lead to underfunded pensions requiring large future contributions to pay future obligations.
The value of the discount rate is not a trivial matter. Assume an individual started working today for the Commonwealth, and we know he or she will retire in 32 years, at the age of 65 with a highest five‐year salary average of $60,000. That person would be vested at 80 percent, entitling them to a pension of $48,000 a year, 32 years from today.43 Valuing that one‐year liability, the requirement to pay $48,000 in 32 years, with an 8.25 percent discount rate leads to a liability today of $3,797.94 for the employees’ first year of pension payment.44 The Commonwealth recently sold General Obligation Bonds with maturity in 2028 with a 4 percent interest rate. Valuing the same liability using this new interest rate would result in a liability today of $13,682.78, more than 3.5 times larger.45
41 Robert Novy‐Marx and Joshua D. Rauh, ʺThe Liabilities and Risks of State‐Sponsored Pension Plans,ʺ Journal of Economic Perspectives 23 (4)191‐2010 (Fall 2009), http://rnm.simon.rochester.edu/research/JEP_Fall2009.pdf. 42 Stuart Buck, “Legal Obstacles to Pension Reform,” (August 2011), see footnotes 96 through 99 describing Massachusetts legal cases. Electronic copy available at: http://ssrn.com/abstract=1917563. 43 Massachusetts State Retirement Board, Benefit Guide for the Massachusetts State Employeesʹ Retirement System (September 2012) http://www.mass.gov/treasury/docs/retirement/retguide.pdf. 44 Calculation: 48,000/(1.082532). 45 Calculation: 48,000/(1.0432).

© The Beacon Hill Institute 2013
February 2013/ Public Pensions in Massachusetts: The True Cost | 23
Results
To review the current pension situation using both ABO and PBO analysis, we calculate a number of different scenarios by varying two key variables. The first variable is the discount rate. The baseline discount rate is 8.25 percent, the current rate utilized by the Public Employee Retirement Administration Commission. The second variable is the change in the pension fund assets. This variable was included to provide a comparative result showing how quickly the unfunded liability of the pension fund can change.
For the Discount Rate variable we examine two different change scenarios. The first is a rate of 1.81 percent. This is what we would consider the absolute minimum rate, and is the average of US 20 year TIPS bond between 2004 and 2012. 46 This is widely considered a valid proxy for discount rate calculations.47 The second rate utilized was the state general obligation bond rate for Massachusetts, at 4 percent.48
To determine the asset change variable rates, we reviewed recent historic returns and picked out three possible annual returns that the state pension funds could possibly experience. The first was the 2008 return for the PRIT Fund, which was a loss of 29.5 percent.49 The second return —less drastic but still severe — was the largest monthly loss in the Standard and Poor’s 500 Index between the start of 2000 and January 2013. The loss was 16.94 percent, resulting in a change from a closing value on September 2nd
46 Board of Governors of the Federal Reserve System, ʺSelected Interest Rates (Daily) ‐ H.15: Historical Data,” http://www.federalreserve.gov/releases/h15/data.htm. 47 Brown and Wilcox, 4. 48 Office of the Treasurer‐Receiver General, “New Money Issue. General Obligation Bonds Consolidated Loan of 2012, Series B. CUSIP 57582PG20,” (May 22, 2012) http://www.mass.gov/treasury/docs/debt/5‐22‐2012‐mass‐go‐os‐2012‐series‐b.pdf. 49 Public Employee Retirement Actuarial Commission, 2008 Financial Market & Retirement Board Performance Review, http://www.mass.gov/perac/08annualreport/financialmarketandretirementboardperformancereview08.pdf.
© The Beacon Hill Institute 2013
24 | Public Pensions in Massachusetts: The True Cost / February 2013
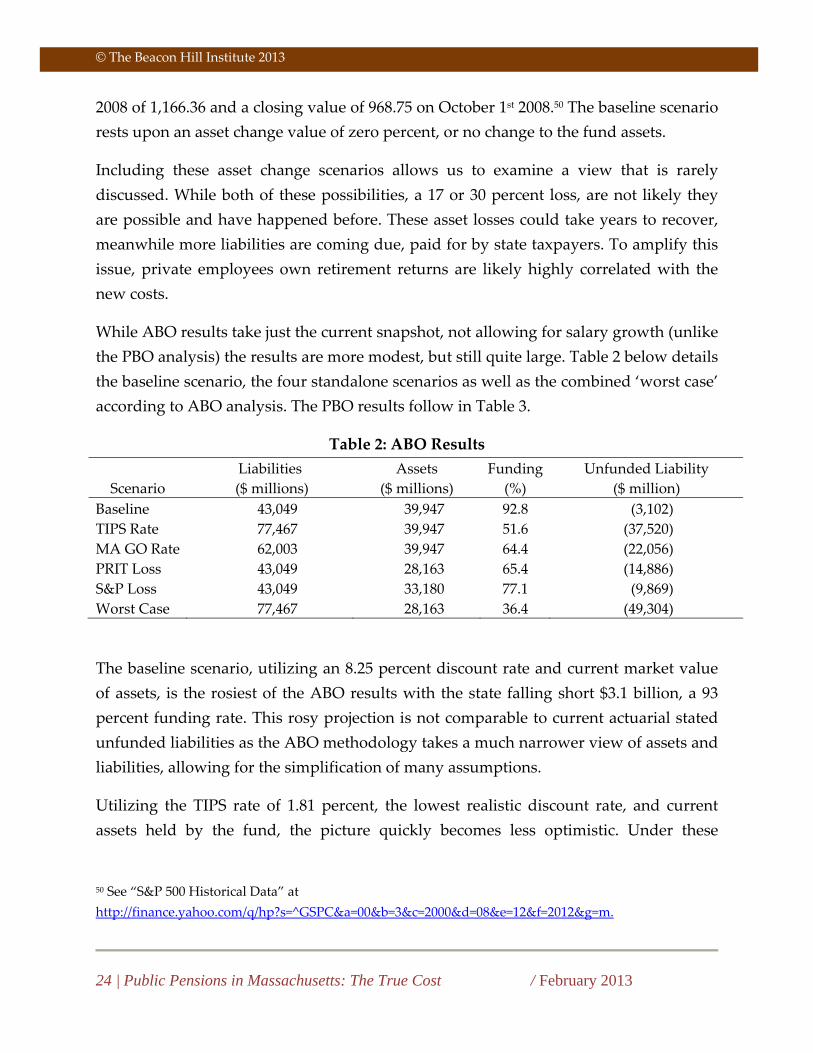
2008 of 1,166.36 and a closing value of 968.75 on October 1st 2008.50 The baseline scenario rests upon an asset change value of zero percent, or no change to the fund assets.
Including these asset change scenarios allows us to examine a view that is rarely discussed. While both of these possibilities, a 17 or 30 percent loss, are not likely they are possible and have happened before. These asset losses could take years to recover, meanwhile more liabilities are coming due, paid for by state taxpayers. To amplify this issue, private employees own retirement returns are likely highly correlated with the new costs.
While ABO results take just the current snapshot, not allowing for salary growth (unlike the PBO analysis) the results are more modest, but still quite large. Table 2 below details the baseline scenario, the four standalone scenarios as well as the combined ‘worst case’ according to ABO analysis. The PBO results follow in Table 3.
Table 2: ABO Results
Scenario Liabilities ($ millions)
Assets ($ millions)
Funding (%)
Unfunded Liability ($ million)
Baseline 43,049 39,947 92.8 (3,102)TIPS Rate 77,467 39,947 51.6 (37,520)MA GO Rate 62,003 39,947 64.4 (22,056)PRIT Loss 43,049 28,163 65.4 (14,886)S&P Loss 43,049 33,180 77.1 (9,869)Worst Case 77,467 28,163 36.4 (49,304)
The baseline scenario, utilizing an 8.25 percent discount rate and current market value of assets, is the rosiest of the ABO results with the state falling short $3.1 billion, a 93 percent funding rate. This rosy projection is not comparable to current actuarial stated unfunded liabilities as the ABO methodology takes a much narrower view of assets and liabilities, allowing for the simplification of many assumptions.
Utilizing the TIPS rate of 1.81 percent, the lowest realistic discount rate, and current assets held by the fund, the picture quickly becomes less optimistic. Under these
50 See “S&P 500 Historical Data” at http://finance.yahoo.com/q/hp?s=^GSPC&a=00&b=3&c=2000&d=08&e=12&f=2012&g=m.

© The Beacon Hill Institute 2013
February 2013/ Public Pensions in Massachusetts: The True Cost | 25
assumptions, the fund only has assets to cover about half of its liabilities. Again, keeping assets constant our median discount rate of 4 percent shows how responsive liabilities are to discount rates. This scenario had the pensions only 64 percent funded, with total unfunded liabilities of $22.1 billion.
The next two scenarios are not assumption changes, but are relevant to review how susceptible the pensions are to financial market volatility. Under these two scenarios, we kept the current assumption of an 8.25 percent discount rate to highlight the effects of a one‐time hit to the market value of currently held assets. The first scenario was a 29.5 percent decrease in assets, equal to the lowest one‐year return of the PRIT. The decrease reduced assets by more than $11 billion, resulting in a 65 percent funding ratio and unfunded liabilities of $14.9 billion. The second case, an asset loss equal to the S&P’s worst one month return since 2000, reduced the funding ratio to 77 percent, and resulted in an unfunded liability of $9.9 billion. We call the final scenario presented ‘worst case’, that is, assets experience a decrease equal to the worst annual PRIT return, and TIPS rate is used as the discount rate, assuming that the risk of nonpayment on the pensions is extraordinary low. This would result in a $49.3 billion unfunded liability, or a funding ratio of 36 percent.
Table 3 provides the same scenarios described above, but utilizing a PBO methodology. The liabilities in this method will inherently be larger, as it allows for future salary increases, based on Massachusetts actuary assumptions. As with the ABO analysis, the baseline case is the most favorable of the scenarios with a 76 percent funding ratio, $12.6 billion in unfunded liabilities. The status of the pension quickly becomes negative as lower discount rates are used. With no asset adjustments, a 1.81 percent discount rate increases unfunded liabilities to $83.3 billion dollars or a mere 32 percent funded. Employing a discount rate equal to the Commonwealth’s borrowing rate results in $47.7 billion in unfunded liabilities or a 46 percent funding ratio.

© The Beacon Hill Institute 2013
26 | Public Pensions in Massachusetts: The True Cost / February 2013
Table 3: PBO Results
Scenario Liabilities ($ million)
Assets ( $ millions)
Funding (%)
Unfunded Liability ($million)
Baseline 52,588 39,947 76.0 (12,641)TIPS Rate 123,261 39,947 32.4 (83,314)MA GO Rate 87,678 39,947 45.6 (47,731)PRIT Loss 52,588 28,167 53.6 (24,425)S&P Loss 52,588 33,180 63.1 (19,408)Worst Case 123,261 28,163 22.9 (95,098)
Keeping the 8.25 discount rate, but again evaluating the effect of how a bad year takes a toll on unfunded liabilities, if the worst year of the PRIT is repeated, unfunded liabilities increase to $24.4 billion. A 63 percent funding ratio, or $19.4 billion in unfunded liability would result if the investments by state pensions had a return equal to the worst month since 2000 for the S&P. Finally, a 1‐year loss of 29.5 percent on assets, combined with a TIPS discount rate, would lead to a funding ratio of only 23 percent, or more than $95 billion in unfunded liabilities.
The concept and impact of unfunded liabilities can be difficult to comprehend. The estimates are meant to provide a range of possibilities of what residents in the state of Massachusetts may be asked to pay to fund promises that the state have made in the past. To approach this concept in a different way, Table 4 below displays the annual mortgage payment that the state would have to pay if they wanted to eliminate their unfunded liabilities today. A fixed four‐percent borrowing rate was used to calculate the annual payment on a 30‐year mortgage.
Table 4: If Pensions were a Mortgage (Annual Payment 30 Year)
Scenario ABO
($ millions)PBO
($ millions) Baseline 179 731 TIPS Rate 2,170 4,818 MA GO Rate 1,275 2,760 PRIT Loss 861 1,413 S&P Loss 571 1,122 Worst Case 2,851 5,500

© The Beacon Hill Institute 2013
February 2013/ Public Pensions in Massachusetts: The True Cost | 27
In the case of the baseline scenario, to receive a lump payment today of $12.6 billion, enough to fully fund the PBO liabilities of the pension, state government would have to make payments of $731 million a year for the next thirty years. Employing a four percent discount rate, equal to the Massachusetts general obligation bond rate, would require annual mortgage payments of $1.3 billion or $2.8 billion, for ABO and PBO methodology respectively. That would be 3.9 percent or 8.5 percent, again for ABO and PBO methodology respectively, of the FY 2013 budget.51
The current unfunded liability according to the Commonwealth Actuarial Valuation Report is $23.3 billion. Following the methodology discussed, fully funding the pensions today through a 30 year mortgage would require annual payments of $1.4 billion. Keeping this in mind, we utilized the Massachusetts State Tax Analysis Modeling Program (MA‐STAMP®) to predict possible outcomes from this type of funding.52
The MA‐STAMP modeling allowed us to demonstrate the effects of having to fully fund pension’s liabilities. We ran three different scenarios though the MA‐STAMP, each assuming that the annual mortgage would be paid for by higher taxes, and not cuts to current spending or higher contribution rates by employees. We believe this is an appropriate assumption, as recent proposals in the Commonwealth have been about raising revenue to pay for higher spending, as opposed to tax cuts and less spending. We assumed the tax increases were distributed between the state sales tax, corporate income tax and personal income tax, according to their relative size.
Table 5 shows the economic results of the three scenarios. The first scenario is that of funding current liabilities, according to state actuarial reports. This would require $1.4 billion in higher revenue annually, and would result in 9,145 less jobs, compared to a baseline of never having to fund pensions. Additionally, investment would be $195
51 Compared to the FY2013 GAA budget of $32.477 billion, http://www.mass.gov/bb/gaa/fy2013/index.html. 52 See http://www.beaconhill.org/STAMP_Web_Brochure/STAMP_IntroductionMS.html for information about the STAMP model.

© The Beacon Hill Institute 2013
28 | Public Pensions in Massachusetts: The True Cost / February 2013
million less, and individuals would have an average of $110 less in disposable income per year.
Table 5: The Economic Effects of a Pension Mortgage Name Current Assumptions ABO PBO Total Employment (jobs) (9,145) (8,640) (18,665) Investment ($millions) (195) (185) (400) Disposable Income, Per Capita (110) (105) (225)
The second and third cases are based on the unfunded liabilities we calculated with the ABO and PBO methodology with the 4 percent discount rate assumption. The ABO results are similar to the current assumptions used by the state, with a total of 8,640 less jobs and investment that would be $185 million less annually. The PBO analysis resulted in much larger unfunded liabilities, and would be much more damaging to the state economy to fully fund. Additional annual tax payments of $2.76 billion would result in 18,665 less jobs in the state economy. Annually investment in the state would be $400 million less and individuals on average would have $225 less in disposable income.

© The Beacon Hill Institute 2013
February 2013/ Public Pensions in Massachusetts: The True Cost | 29
Conclusion
As we have shown, current unfunded liabilities are based upon many different assumptions about the future of public employment in Massachusetts. In reviewing these assumptions we believe that current asset return rates are overstated, and the discount rate utilized is incorrectly tied to this inflated asset return rate. These two numbers are different, and only when these two independently set figures are corrected can we discuss the issue of unfunded liabilities with full information. In 1983 the PRIT was formed to change the way the pension system worked. Up until a few years ago, a goal of zero unfunded liabilities was set for 2025. This target has again been kicked down the road, now with a hopeful 2040 deadline.
If the state used a more appropriate asset return rate and discount rate, stated unfunded liabilities would increase, but the liabilities and costs of the system would still be the same. However these considerations would allow for a more fully‐informed discussion of what promises lawmakers have made and the cost to taxpayers. We have shown that to fully fund the currently understated, unfunded actuarial liabilities touted by the state would have large negative on the Commonwealth’s economy.
Even if pension funding were not an issue, the method of improper incentives needs to be corrected. In its current state, the defined benefit system puts tremendous risks on state taxpayers, while state employees are insulated from possible market downturns. There is a strong correlation between PRIT returns and private employee’s retirement funds. When there is another decline in assets, private employees will feel the effects thorough losses of their own retirement savings, as well as the additional loss of having to make up the loss of assets in the PRIT.

© The Beacon Hill Institute 2013
30 | Public Pensions in Massachusetts: The True Cost / February 2013
Appendix
Methodology
We used two different accounting methodologies in this study. The first is the ABO which allowed us to calculate an estimate of Massachusetts’ ABO liabilities. We took these steps for the three largest public pension funds (state employees, state teachers and Boston teachers) in Massachusetts, for which the most widely available details are available. We calculated the assets and liabilities of each individually and then summed them together then to garner the estimated total for Massachusetts.
The first, and most basic, calculation required is the asset side of the equation. In ABO methodology, assets are equal to the market value of all assets currently held by the pension fund. The Commonwealth Actuarial Valuation Report provided us with the most recent market value of these three major funds.
The second calculation required to determine the unfunded liability is the current liabilities of the three pension funds. An ABO analysis assumes that the pension fund is shut down, so liabilities are only for current employees and retirees. For ease of calculation, we separated liabilities into two parts. The first is liabilities related to current employees, while the second is related to current retirees.
First we utilized the ‘Age by Service Distribution of Active Members’ matrix. We estimated the average age for each age group, for example in the 35‐39 age group, we estimated the average age at 37. By combining this information with the Actuarial Life Table utilized by the U.S. Social Security Administration we were able to estimate the average life expectancy for each age grouping. This number, minus 65 (our expected average retirement age) determines the time period collecting a pension for the average member from each age group.
Now that we know how long each age group can expect to receive a pension, we calculate how much that pension would be. In Massachusetts, pension allowance is equal to the benefit rate multiplied by five year average salary multiplied by years of service. We set the benefit rate equal to the average age of each age group. For example, all groups, up to the 35‐39 years of age group, had the lowest possible benefit rate of 0.1.

© The Beacon Hill Institute 2013
February 2013/ Public Pensions in Massachusetts: The True Cost | 31
For age group 40‐45, the average age was 42, which corresponds to a benefit rate of 0.2. For the five‐year average salary we set equal to the average salary of the given age group, according to the actuarial valuation report. Years of service were calculated using the weighted average length of service according to the ‘Age by Service Distribution of Active Members’ matrix.
Multiplying these three numbers together, for each age group, gave us the average pension per year for each current employee in that age group. Next, we determined the present value of the individual pension at the time of the individual’s retirement. The rate that we used varied according to which assumption was being used— either current baseline (8.25 percent), Massachusetts General Obligation Bond (4 percent) or Treasury Inflation‐Protected Securities (1.81 percent). Using the Present Value calculation in Microsoft Excel, we were able to determine the size of the pension liability at the time of retirement, by age group.
Next, we make this calculation relevant to today. Knowing the average age of each group, we can estimate when they will retire. For example in the 20‐25 age group, the average member is 22 years old, and will retire at 65, or in 43 years. Utilizing the same discount rate as in the present value calculation, we discount the pension liability to this year. This is multiplied by the number of individuals in each age group, then summed across all age groups resulted in the present value of pension liabilities according to the ABO methodology.
The second accounting method we used is the Projected Benefit Obligation (PBO). The following steps were taken for all three pension funds (state employees, state teachers and Boston teachers), then summed to produce our final numbers for Massachusetts pension numbers.
The PBO calculation is similar to the ABO calculation described, except that the PBO assumes that employees continue to work until their retirement; therefore their salary and benefit rate differ greatly. The benefit rate used is 2.5 for all age groups, equal to the benefit rate of an individual retiring at the age of 65. We calculated years of service by summing the current weighted years of service by age group with the difference

© The Beacon Hill Institute 2013
32 | Public Pensions in Massachusetts: The True Cost / February 2013
between the current average age of the group and 65, the expected retirement age. For example, the average age of the 20‐25 age group is 22, while the average service year is 2.05. Years of service at retirement is equal to 45.05 (2.05 + (65 ‐ 22)).
To determine the average salary for the last five years of service, we used the salary increase assumption from the state actuarial reports. With these numbers we can again calculate the expected pension for an individual by age group, based on pension allowance being equal to benefit rate multiplied by five year average salary multiplied by years of service. From this point we follow the ABO methodology to calculate the present value of the pension at an individual’s retirement, as well and calculating the value of that liability this year. We then multiply this number again by the number of individuals in each group, and then take the sum across all age groups, resulting in the PBO determination of liabilities.
Unfunded liabilities are defined as the amount that the calculated liabilities for each methodology exceed the assets. Funding percent is equal to the assets divided by the calculated liabilities for each method.
Three different discount rates are used in our analysis. The first is a rate of 8.25 percent, which is currently used by state actuaries to calculate unfunded liabilities. The second rate we used was the issue rate for a Massachusetts General Obligation bond issues shortly before we started our analysis, which had an interest rate of 4 percent on a bond maturing in 2028. The third was the market yield for 20‐year maturities of Treasury Inflation Protected Securities (TIPS), averaged over the last 12 years, which resulted in a discount rate of 1.81.
© The Beacon Hill Institute 2013
February 2013/ Public Pensions in Massachusetts: The True Cost | 33
ReferencesBiggs, Andrew G. 2010. “The Market Value of Public‐Sector Pension Deficits.”
American Enterprise Institute. April. http://www.aei.org/article/economics/retirement/the‐market‐value‐of‐public‐sector‐pension‐deficits/.
Boivie, Illana. 2011. “Who Killed the Private Sector DB Plan?” National Institute on Retirement Security. March. http://www.nirsonline.org/storage/nirs/documents/Who%20Killed%20DBs/final‐_who_killed_the_private_sector_db_plan.pdf.
Broadbent, John, Michael Palumbo and Elizabeth Woodman. 2006. “The Shift from Defined Benefits to Defined Contribution Pension Plans – Implications for asset allocation and risk management,” NBER Working Paper. December. http://www.bis.org/publ/wgpapers/cgfs27broadbent3.pdf.
Brown, Jeffrey R., Robert Clark and Joshua Rauh. 2011. “The Economics of State and Local Pensions.” Journal of Pension Economics and Finance 10: 161172.
Commonwealth of Massachusetts. Office of the Treasurer and Receiver.
“Massachusetts Group 1 Retirement Percentage Chart.” http://www.mass.gov/treasury/docs/retirement/retirementchart.pdf.
Commonwealth of Massachusetts, General Laws, Chapter 32 sec. 22B “Reduction of unfunded liability.” http://www.malegislature.gov/Laws/GeneralLaws/PartI/TitleIV/Chapter32/Section22B.
Commonwealth of Massachusetts. 2009. Public Employee Retirement Administration Commission. Annual Report.
Haltom, Renee. 2010 “Fuzzy Math: Public Pensions are Underfunded—How Bad Is It?” Richmond Federal Reserve Region Focus: 1‐4.
Hampden Country Board of Retirement. http://www.hcrb.org/activemembers2/frequentlyaskedque/.
© The Beacon Hill Institute 2013
34 | Public Pensions in Massachusetts: The True Cost / February 2013
Massachusetts Budget and Policy Center. 2011. “Demystifying the State Pension System: The Cost of Funding Employee Pensions.” March. http://www.massbudget.org/documentsearch/findDocument?doc_id‐778&dse_id=1479.
Massachusetts Public Employee Retirement Administration Commission. Main Guide. http://www.mass.gov/perac/guide/mainguide15.htm.
Novy‐Marx, Robert and Joshua D. Rauh. 2012. “The Revenue Demands of Public Employee Pension Promises.” October. National Bureau of Economic Research Working Paper 18489. http://www.nber.org/papers/w18489.
Public Employee Retirement Administration Commission. 2009. Annual Report http://www.mass.gov/perac/09annualreport/AR09.pdf.
Office of the Governor, Deval Patrick. 2009. Press Release. “Governor Patrick Pushes Comprehensive Pension Reform.” April. http://www.mass.gov/?pageID=gov3pressrelease&L=1&L0=Home&sid=Agov3&b=pressrelease&f=090406_Pension_Reform&csid=Agov3.
__________________ . 2006. Press Release. “Governor Patrick Announces Next Phase of Pension Reform.” (January) http://www.mass.gov/?pageID=gov3pressrelease&L=1&L0=Home&sid=Agov3&b=pressrelease&f=012610_pension_reform&csid=Agov3.
__________________ . 2011. Press Release. Governor Patrick Announces Third Phase of Pension Reform. January. http://www.mass.gov/?pageID=gov3pressrelease&L=1&L0=Home&sid=Agov3&b=pressrelease&f=110118_pension__reform_III&csid=Agov3. U.S. Department of the Treasury. Resource Center, “Daily Treasury Yield Curve Rates.” http://www.treasury.gov/resource‐center/data‐chart‐center/interest‐rates/Pages/TextView.aspx?data=yieldYear&year=2011.
Public Employee Retirement Administration Commission State Retirement System. 2010. Actuarial Valuation Report. January. http://www.mass.gov/perac/state/stateval10.pdf.
Poterba, James. Joshua Rauh, Steven Venti and David Wise. 2006. ʺDefined Contribution Plans, Defined Benefit Plans, and the Accumulation of Retirement Wealth.” Journal of Public Economics 91. October. 10: 2062‐2086.
Public Sector, Inc. 2011. “Facts and Figures,”. http://www.publicsectorinc.org/facts/.
© The Beacon Hill Institute 2013
February 2013/ Public Pensions in Massachusetts: The True Cost | 35
Rauh, Joshua. 2011. “Statement of Professor Joshua Rauh” before the Subcommittee on Courts, Commercial and Administrative Law” U.S. Congress. February.
Society of Actuaries, RP‐2000 Mortality Tables, http://www.soa.org/files/research/exp‐study/rp00_mortalitytables.pdf.
Sonnanstisne, Allan, Brian Murphy and Paul Zorn. 2003. Memorandum to Gabriel, Roeder, Smith & Company. “List of Advantages and Disadvantages for DB and DC plans,” (November 17, 2003). http://www.nasra.org/resources/GRS%20DB%20DC.pdf.
Taylor, Don. 2009. “Retirement Plan for Small Businesses,” bankrate.com. http://www.bankrate.com/finance/money‐guides/retirement‐plans‐for‐small‐businesses‐1.aspx.
Westʹs Encyclopedia of American Law. 2nd Ed. Ed. Jeffrey Lehman and Shirelle Phelps. Gale Cengage, 2005.
U.S. Census Bureau. “U.S. Population Projections: State Interim Population Projections, by Age and Sex, 2004‐2030” (Table 3), April 21, 2005. http://www.census.gov/population/www/projections/projectionsagesex.html.
__________________ _________. 2012. “Annual Survey of Public Pensions: State‐Administered Defined Benefit Data Summary Report: 2011.” August. http://www.census.gov/govs/retire.
U.S. Department of Labor, “Retirement Plans, Benefits & Savings: Types of Retirement Plans,” http://www.dol.gov/dol/topic/retirement/typesofplans.htm.

© The Beacon Hill Institute 2013
36 | Public Pensions in Massachusetts: The True Cost / February 2013
AbouttheAuthors
Paul Bachman, MSIE is Director of Research at the Beacon Hill Institute for Public Policy Research at Suffolk University and a Senior Lecturer in Economics Suffolk University. He holds a Master of Science in International Economics from Suffolk University.
Michael Head, MSEP is an Economist at the Beacon Hill Institute. He holds a Master of Science in Economic Policy from Suffolk University.
Frank Conte, MSPA is the Director of Communications and Information Systems at Beacon Hill Institute. He holds a Master of Science in Public Affairs from the University of Massachusetts‐Boston.

© The Beacon Hill Institute 2013
February 2013/ Public Pensions in Massachusetts: The True Cost | 37
The Beacon Hill Institute at Suffolk University in Boston focuses on federal, state and local economic policies as they affect citizens and businesses. The institute
conducts research and educational programs to provide timely, concise and readable analyses that help voters, policymakers and opinion leaders understand today’s
leading public policy issues.
©February 2013 by the Beacon Hill Institute at Suffolk University
THE BEACON HILL INSTITUTE
FOR PUBLIC POLICY RESEARCH
Suffolk University 8 Ashburton Place Boston, MA 02108 Phone: 617‐573‐8750 Fax: 617‐994‐4279 [email protected] www.beaconhill.org