public opinion research ontario election: may … · provincial id: liberals edge in party...
TRANSCRIPT

May 2018 © 2018 Copyright Innovative Research Group Inc.
Vote, Leadership and Political LandscapeField Dates: May 18th to May 23rd, 2018Sample Size: n=1,050
Public Opinion Research
Ontario Election: May Polling Wave 3

2
Note: Graphs and tables may not always total 100% due to rounding values rather than any
error in data. Sums are added before rounding numbers.
Methodology
• These are the findings of a special Innovative Research Group (INNOVATIVE) online poll conducted from May 18th to May 23rd, 2018 with tracking drawn for our monthly Canada This Month survey.
• This online survey of 1,074 adult Ontarians was conducted on INNOVATIVE’s Canada 20/20 national research panel with additional respondents from Léger, a leading provider of online sample. The sample is weighted to n=1,050 based on Census data from Statistics Canada.
• The panels are recruited from a wide variety of sources to reflect the age, gender, region and language characteristics of the country as a whole. Each survey is administered to a series of randomly selected samples from the panel and weighted to ensure that the overall sample's composition reflects that of the actual Canadian population according to Census data to provide results that are intended to approximate a probability sample.
• INNOVATIVE provides each panellist with a unique URL via an email invitation so that only invited panel members are able to complete the survey, and panel members can only complete a particular survey once.
• This is a representative sample. However, since the online survey was not a random probability based sample, a margin of error can not be calculated. The Marketing Research and Intelligence Association prohibits statements about margins of sampling error or population estimates with regard to most online panels.
• NOTE: References to May 2018 Wave 1 refer to our May 2018 Canada this Month survey in field from May 7th to May 9th, with a weighted sample of n=915 respondents. References to May 2018 Wave 2 refer to our first special online poll in field from May 9th to May 12th, with a weighted sample of n=1,500 respondents. The current wave of study is referred to as May 2018 Wave 3.

Ontario Weights: Age, gender, and region
Unweighted (n) Unweighted (%) Weighted (n) Weighted (%)
Males 18-34 97 9.0% 144 13.7%
Males 35-54 166 15.5% 192 18.3%
Males 55+ 278 25.9% 168 16.0%
Females 18-34 169 15.7% 147 14.0%
Females 35-54 167 15.5% 204 19.4%
Females 55+ 197 18.3% 195 18.6%
Toronto 265 24.7% 221 21.0%
Rest of GTA 263 24.5% 266 25.3%
South/West 259 24.1% 275 26.2%
North/East 287 26.7% 289 27.5%
Results for Ontario are weighted by age, gender, and region to ensure that the overall sample’s composition reflects that of the actual population according to Census data; in order to provide results that are intended to approximate a probability sample. Weighted and unweighted frequencies are reported below.
3

Provincial Vote and ID

5Provincial ID: Liberals edge in party identification down slightly but still ahead of PC partisans
Thinking about politics in Ontario, generally speaking, do you usually think of yourself as a…[asked of all respondents; n=1,050]Q
30%27%
14%
4%3%
14%
7%
Sep '14Dec '15 Mar'16
Sep '16Jan '17Feb '17 Mar'17
Apr '17 May'17
Jun '17 Aug'17
Oct '17Dec '17Jan '18Feb '18 Mar'18
Apr '18 May'18
May'18 W2
May'18 W3
Liberal Progressive Conservative NDP
Green Something else None/Independent
Don't know
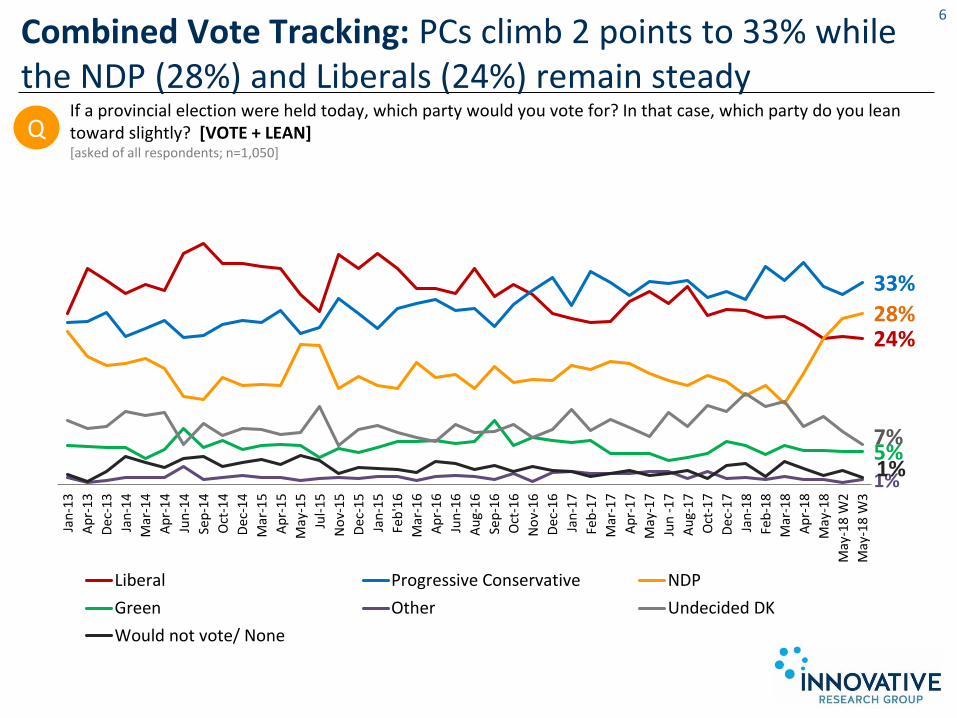
If a provincial election were held today, which party would you vote for? In that case, which party do you lean toward slightly? [VOTE + LEAN][asked of all respondents; n=1,050]
Combined Vote Tracking: PCs climb 2 points to 33% while the NDP (28%) and Liberals (24%) remain steady
6
24%
33%
28%
5%1%
7%
1%
Jan
-13
Ap
r-1
3
Dec
-13
Jan
-14
Mar
-14
Ap
r-1
4
Jun
-14
Sep
-14
Oct
-14
Dec
-14
Mar
-15
Ap
r-1
5
May
-15
Jul-
15
No
v-15
Dec
-15
Jan
-15
Feb
'16
Mar
-16
Ap
r-1
6
Jun
-16
Au
g-1
6
Sep
-16
Oct
-16
No
v-16
Dec
-16
Jan
-17
Feb
-17
Mar
-17
Ap
r-1
7
May
-17
Jun
-1
7
Au
g-1
7
Oct
-17
Dec
-17
Jan
-18
Feb
-18
Mar
-18
Ap
r-1
8
May
-18
May
-18
W2
May
-18
W3
Liberal Progressive Conservative NDP
Green Other Undecided DK
Would not vote/ None
Q

If a provincial election were held today, which party would you vote for? In that case, which party do you lean toward slightly? [VOTE + LEAN][showing all decided voters; n=968]
Decided Vote Tracking: NDP (31%) remain in second, ahead of the Liberals (26%); both trail the PCs (36%)
7
26%
36%
31%
6%
1%
Jan
-13
Ap
r-1
3
Dec
-13
Jan
-14
Mar
-14
Ap
r-1
4
Jun
-14
Sep
-14
Oct
-14
Dec
-14
Mar
-15
Ap
r-1
5
May
-15
Jul-
15
No
v-15
Dec
-15
Jan
-15
Feb
'16
Mar
-16
Ap
r-1
6
Jun
-16
Au
g-1
6
Sep
-16
Oct
-16
No
v-16
Dec
-16
Jan
-17
Feb
-17
Mar
-17
Ap
r-1
7
May
-17
Jun
-1
7
Au
g-1
7
Oct
-17
Dec
-17
Jan
-18
Feb
-18
Mar
-18
Ap
r-1
8
May
-18
May
-18
W2
May
-18
W3
Liberal Progressive Conservative NDP Green Other
Q

Decided Vote by Region: Liberals and NDP tied for first in Toronto, PCs lead in Rest of GTA and North/East
8
Toronto(n=196)
Rest of GTA(n=250)
South/West(n=250)
North/East(n=273)
Liberal 36% 26% 21% 25%
PC 24% 40% 35% 43%
NDP 36% 29% 35% 25%
Green 3% 5% 9% 5%
Other 1% 0% 1% 1%
De
cid
ed V
ote
RegionDecided Vote by Region

9Combined Vote by Party ID: Only two-thirds of OLP identifiers are voting for them; PCs and NDP mostly loyal
LiberalProgressive
ConservativeNDP Green/Other Unaligned
Liberal 63% 1% 6% 9% 15%
PC 7% 89% 3% 19% 24%
NDP 24% 8% 86% 17% 27%
Green 2% 0% 4% 41% 6%
Other 0% 0% 0% 5% 1%
Undecided/DK 3% 1% 1% 7% 23%
Would not vote/None 1% 0% 0% 2% 4%
Co
mb
ine
d V
ote
Party IDCombined Vote by Party ID

14%
7%
30%
12%
2%
22%
14%17%
10%
26%
16%
1%
17%13%
16%
8%
27%
13%
1%
21%
14%
Liberal PC NDP Green Other Undecided/Don't know
None/ Wouldnot vote
May-18 Wave 1 May-18 Wave 2 May-18 Wave 3
102nd Choice: NDP remain top second choice; undecided onsecond choice up 4 points since Wave 2
And which party would be your second choice? [asked of all respondents who have a vote choice; n=968]Q

112nd Choice by Vote: NDP are the most common second choice for any combined vote; Liberals are top second choice for NDP
LiberalProgressive
ConservativeNDP Green/Other
Liberal N/A 7% 41% 13%
PC 12% N/A 14% 13%
NDP 50% 31% N/A 42%
Green 12% 6% 23% 1%
Other 0% 3% 0% 1%
Undecided/DK 16% 27% 17% 23%
Would not vote/None 10% 25% 4% 6%
Seco
nd
Ch
oic
e
Combined VoteSecond choice vote by Combined vote (first choice)

Voting for second choice: Likelihood to switch up down to Wave 1 levels
12
How likely is it you may change your mind and vote for your second choice ?[asked of all respondents who have a second choice; n=635]Q
5%
32% 33%
22%
8%6%
36%33%
18%
7%3%
31%
39%
18%
9%
Very likely Somewhat likely Not very likely Not likely at all Don’t know
May-18 Wave 1 May-18 Wave 2 May-18 Wave 3

24%
33%28%
5%1%
7%1%
Liberal Conservative NDP Green Other Undecided DK Would not voteNone
13Likelihood by Vote: Liberal voters are more likely to switch to 2nd choice than PC and NDP voters
Overall Liberal PC NDP Green/Other
Very likely 3% 3% 2% 4% 4%
Somewhat likely 31% 35% 27% 28% 42%
Not very likely 39% 39% 38% 41% 29%
Not likely at all 18% 15% 22% 19% 14%
Don’t know 9% 8% 12% 8% 10%
Net Likely -23% -16% -31% -28% +3%Like
liho
od
to
vo
te 2
nd
cho
ice
Combined Vote
If a provincial election were held today, which party would you vote for? In that case, which party do you lean toward slightly? [VOTE + LEAN][asked of all respondents; n=1050]
Q

16%
8%
27%
13%
1%
21%
14%
Liberal PC NDP Green Other Undecided/Don't know
None/ Wouldnot vote
14Likelihood by 2nd Choice: 27% of voters are considering the NDP, but few are very likely to switch their vote (-26% net)
Overall Liberal PC NDP Green/Other
Very likely 3% 1% 9% 3% 3%
Somewhat likely 31% 36% 38% 30% 21%
Not very likely 39% 42% 33% 42% 33%
Not likely at all 18% 13% 13% 17% 30%
Don’t know 9% 8% 7% 8% 14%
Net Likely -23% -17% +2% -26% -39%Like
liho
od
to
vo
te 2
nd
cho
ice
2nd choice
And which party would be your second choice? [asked of all respondents who have a vote choice; n=968]Q

15Heard all I need: even split on whether voters have heard all they need; similar to May before the 2014 election
Which statement is closest to your view about the upcoming provincial election?
45%
44%
47%
48%
49%
47%
7%
7%
6%
May 2014
May-2018 Wave 1
May-2018 Wave 3
I have heard all I need to make up my mind in this election
I would like to hear more before I finally make up my mind in this election
Don’t know
Q

16Satisficing by Vote: 63% of PC voters have made up their minds; other party voters still more interested in hearing more
Overall Liberal PC NDP Green/Other
I have heard all I need to make up my mind in
this election47% 46% 63% 43% 37%
I would like to hear more before I finally make up my mind in
this election
47% 49% 33% 54% 55%
Don’t know 6% 4% 4% 4% 7%
He
ard
all
I ne
ed
…
Vote
24%
33%28%
5%1%
7%1%
Liberal Conservative NDP Green Other Undecided DK Would not voteNone
If a provincial election were held today, which party would you vote for? In that case, which party do you lean toward slightly? [VOTE + LEAN][asked of all respondents]
Q
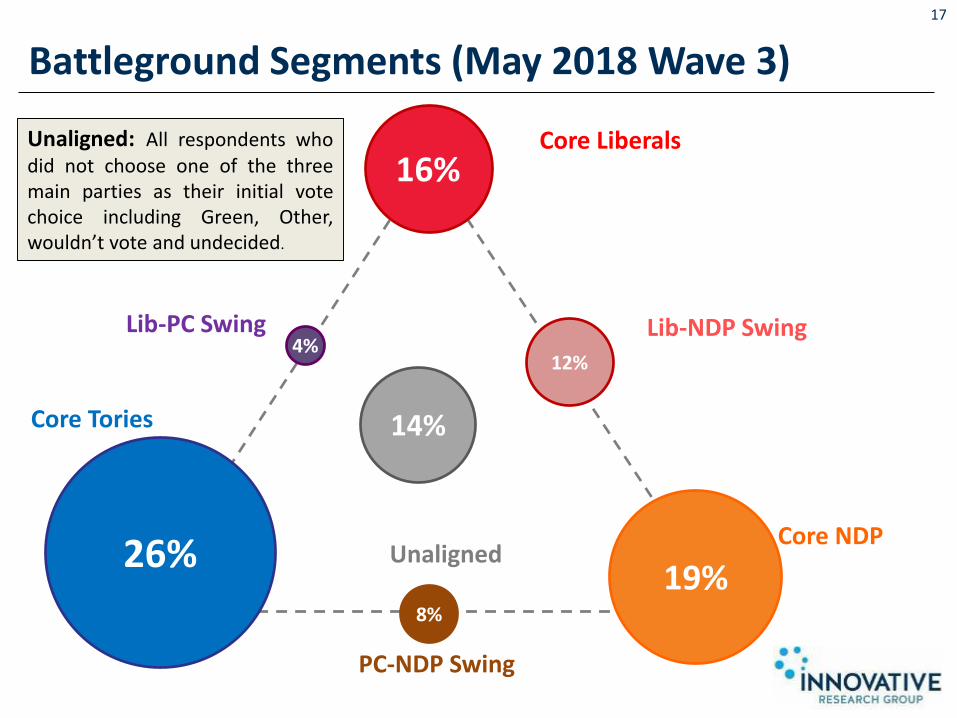
14%
16%
26%19%
12%4%
8%
Battleground Segments (May 2018 Wave 3)
17
Core Liberals
Lib-NDP Swing
Core NDP
PC-NDP Swing
Lib-PC Swing
Core Tories
Unaligned
Unaligned: All respondents whodid not choose one of the threemain parties as their initial votechoice including Green, Other,wouldn’t vote and undecided.
18
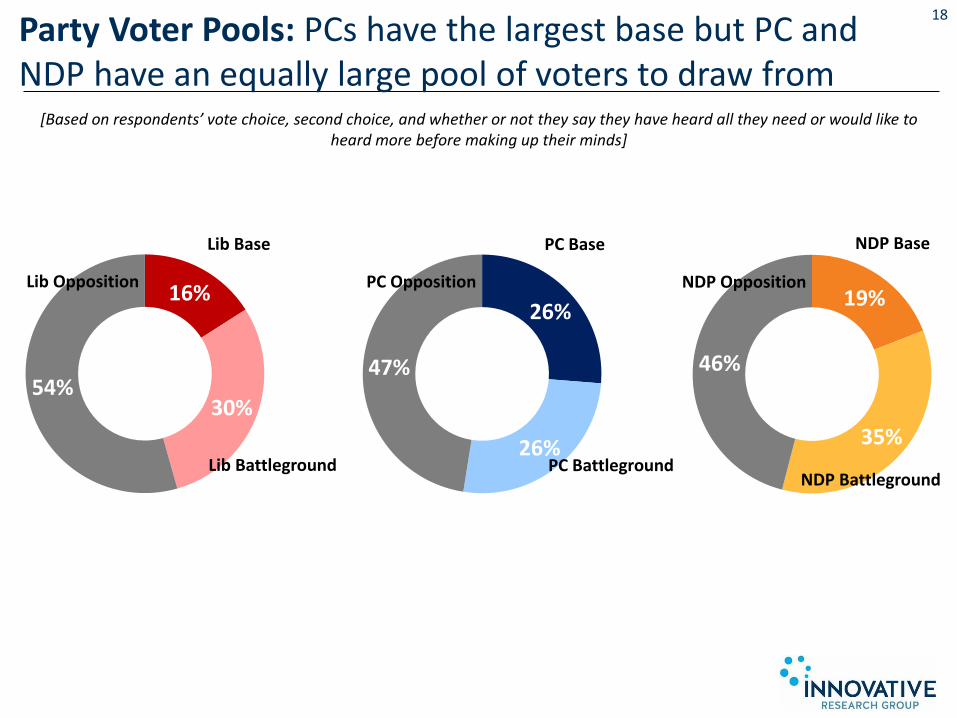
Party Voter Pools: PCs have the largest base but PC andNDP have an equally large pool of voters to draw from
[Based on respondents’ vote choice, second choice, and whether or not they say they have heard all they need or would like to heard more before making up their minds]
16%
30%54%
Lib Base
Lib Battleground
Lib Opposition
26%
26%
47%
PC Base
PC Battleground
PC Opposition19%
35%
46%
NDP Base
NDP Battleground
NDP Opposition

Party Leaders

20
7%
11%
14%
3%
17%
16%
32%
9%
13%
14%
25%
29%
15%
15%
12%
6%
46%
42%
8%
6%
3%
3%
7%
47%
Kathleen Wynne
Doug Ford
Andrea Horwath
Mike Schreiner
Very favourable Somewhat favourable
Neither favourable nor unfavourable Somewhat unfavourable
Very unfavourable Don't know + don't recognize
Leader Favourables: Near majority feel very unfavourabletoward Wynne, net favourability 7-points lower than Ford
Below are the names of several individuals who have been mentioned in the news recently. For each one, please indicate whether you have heard of that person and, if so, whether you have a very favourable, somewhat favourable, somewhat unfavourable or very unfavourable impression of that person. If you do not recognize the name, just choose that response. How about…?[asked of all respondents; n=1,050]
-37%
-30%
+26%
+1%
Net Favourability
Q

21
16%
8%
7%
4%
7%
7%
6%
6%
7%
25%
23%
16%
14%
21%
15%
15%
15%
17%
16%
16%
13%
9%
10%
14%
17%
14%
13%
12%
13%
16%
19%
15%
16%
14%
16%
15%
21%
37%
44%
51%
44%
45%
45%
46%
46%
9%
4%
3%
2%
2%
3%
3%
4%
3%
Mar '14
Dec '15
Sep '16
Mar '17
Aug '17
Feb '18
May '18
May '18 W2
May '18 W3
Very favourable Somewhat favourableNeither favourable nor unfavourable Somewhat unfavourableVery unfavourable Don't know + don't recognize
Kathleen Wynne: Nearly half (46%) say ‘very’ unfavorable, net favourability remains steadily negative since last year
Below are the names of several individuals who have been mentioned in the news recently. For each one, please indicate whether you have heard of that person and, if so, whether you have a very favourable, somewhat favourable, somewhat unfavourable or very unfavourable impression of that person. If you do not recognize the name, just choose that response. How about…Kathleen Wynne, leader of Ontario Liberal Party[asked of all respondents; n=1,050]
-37%
-41%
-37%
-39%
-30%
-52%
-37%
-18%
+7%
Net Favourability
Q

22Doug Ford: After improving earlier in May, Ford back down slightly to levels seen earlier in the year
Below are the names of several individuals who have been mentioned in the news recently. For each one, please indicate whether you have heard of that person and, if so, whether you have a very favourable, somewhat favourable, somewhat unfavourable or very unfavourable impression of that person. If you do not recognize the name, just choose that response. How about…Doug Ford, leader of the Ontario PCs[asked of all respondents; n=1,050]
7%
8%
6%
9%
8%
9%
10%
9%
13%
11%
17%
13%
16%
20%
19%
10%
11%
18%
18%
16%
19%
25%
24%
22%
27%
7%
15%
16%
13%
14%
14%
12%
13%
15%
11%
13%
14%
14%
14%
15%
33%
13%
19%
13%
21%
32%
41%
39%
38%
42%
9%
29%
22%
21%
13%
20%
9%
4%
0%
3%
Mar 2014
Dec 2015
Sep 2016
Mar 2017
Aug 2017
Jan 2018
Feb 2018
May 2018
May 2018 W2
May 2018 W3
Very favourable Somewhat favourableNeither favourable nor unfavourable Somewhat unfavourableVery unfavourable Don't know + don't recognize
Net Favourability
-30%
-22%
-26%
-34%
-26%
-5%
0%
-10%
-4%
-22%
Pat
rick
Bro
wn
Do
ug
Ford
Tim
H
ud
ak
Q

23Andrea Horwath: Favourability up dramatically from Feb 2018; steady throughout waves in May
Below are the names of several individuals who have been mentioned in the news recently. For each one, please indicate whether you have heard of that person and, if so, whether you have a very favourable, somewhat favourable, somewhat unfavourable or very unfavourable impression of that person. If you do not recognize the name, just choose that response. How about…Andrea Horwath, Leader of the Ontario NDP[asked of all respondents; n=1,050]
12%
6%
7%
9%
10%
7%
13%
12%
14%
27%
23%
23%
23%
25%
20%
30%
32%
32%
26%
36%
35%
31%
35%
38%
31%
28%
25%
13%
15%
14%
15%
16%
15%
13%
11%
12%
12%
9%
9%
9%
9%
10%
6%
6%
8%
11%
11%
11%
14%
6%
9%
6%
3%
7%
Mar '14
Dec '15
Sep '16
Mar '17
Aug '17
Feb '18
May '18
May '18 W2
May '18 W3
Very favourable Somewhat favourable
Neither favourable nor unfavourable Somewhat unfavourable
Very unfavourable Don't know + don't recognize
+26%
+27%
+24%
+3%
+10%
+8%
+7%
+5%
+14%
Net Favourability
Q
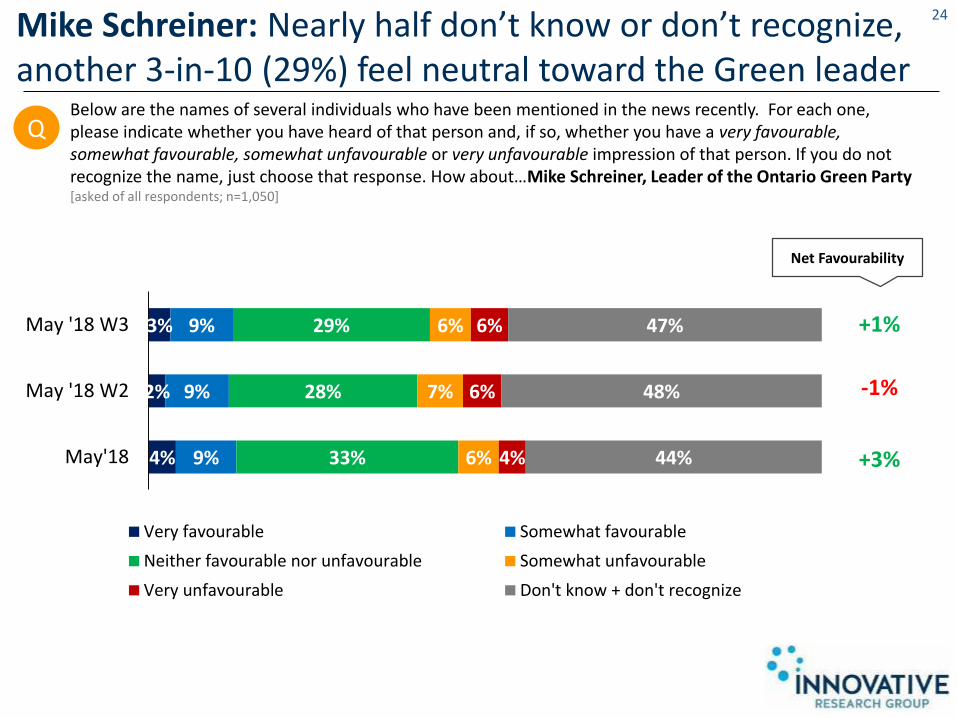
24Mike Schreiner: Nearly half don’t know or don’t recognize, another 3-in-10 (29%) feel neutral toward the Green leader
Below are the names of several individuals who have been mentioned in the news recently. For each one, please indicate whether you have heard of that person and, if so, whether you have a very favourable, somewhat favourable, somewhat unfavourable or very unfavourable impression of that person. If you do not recognize the name, just choose that response. How about…Mike Schreiner, Leader of the Ontario Green Party[asked of all respondents; n=1,050]
4%
2%
3%
9%
9%
9%
33%
28%
29%
6%
7%
6%
4%
6%
6%
44%
48%
47%
May'18
May '18 W2
May '18 W3
Very favourable Somewhat favourable
Neither favourable nor unfavourable Somewhat unfavourable
Very unfavourable Don't know + don't recognize
+1%
-1%
+3%
Net Favourability
Q

25Best Premier: Horwath maintains lead over Ford, each with about 1-in-4 saying they would make the best Premier
Which of the following leaders would make the best Premier of Ontario? [asked of all respondents; n=1050]
Note: ‘Refused” / “would not vote” not shown
19%19%20%
24%21%
26%
1%4%
11%
8%
26%
19%
Dec '12 Jan '13 June '13 Aug '13 Mar '14 Dec '15 Sep '16 Mar '17 Aug '17 Feb '18 May '18 May'18W2
May'18W3
Wynne/McGuinty Ford/Fedeli/Brown/Hudak Andrea Horwath
Other None of the above Undecided/Don't know
McGuinty Wynne Hudak BrownBrown Fedeli Ford
Q

Alienation Segmentation
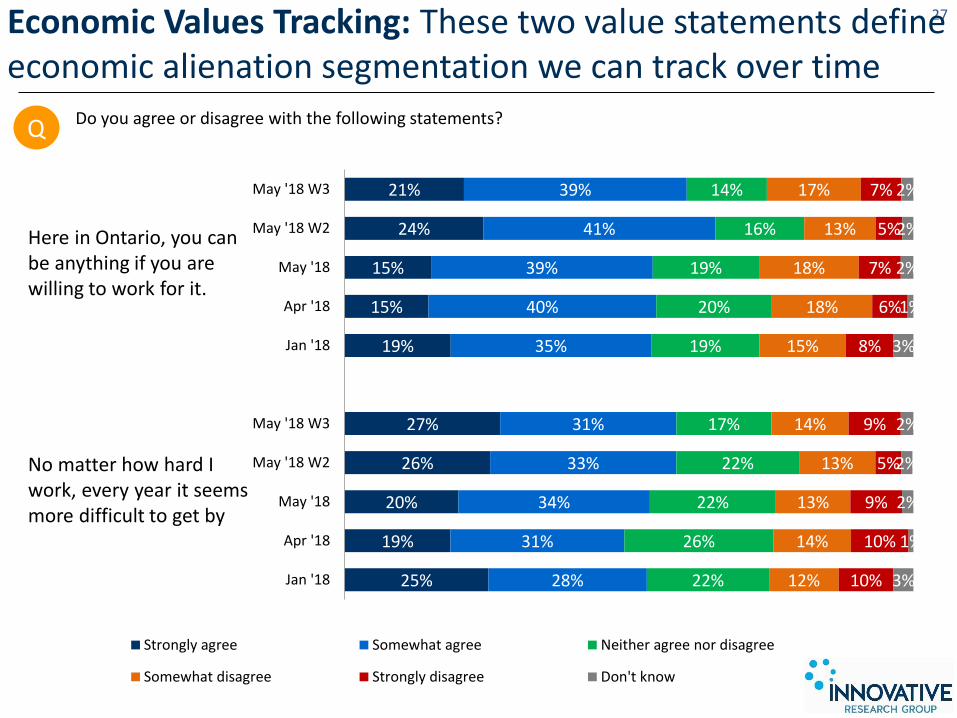
27Economic Values Tracking: These two value statements define economic alienation segmentation we can track over time
21%
24%
15%
15%
19%
27%
26%
20%
19%
25%
39%
41%
39%
40%
35%
31%
33%
34%
31%
28%
14%
16%
19%
20%
19%
17%
22%
22%
26%
22%
17%
13%
18%
18%
15%
14%
13%
13%
14%
12%
7%
5%
7%
6%
8%
9%
5%
9%
10%
10%
2%
2%
2%
1%
3%
2%
2%
2%
1%
3%
May '18 W3
May '18 W2
May '18
Apr '18
Jan '18
May '18 W3
May '18 W2
May '18
Apr '18
Jan '18
Strongly agree Somewhat agree Neither agree nor disagree
Somewhat disagree Strongly disagree Don't know
Here in Ontario, you can be anything if you are willing to work for it.
No matter how hard I work, every year it seems more difficult to get by
Do you agree or disagree with the following statements?Q
28
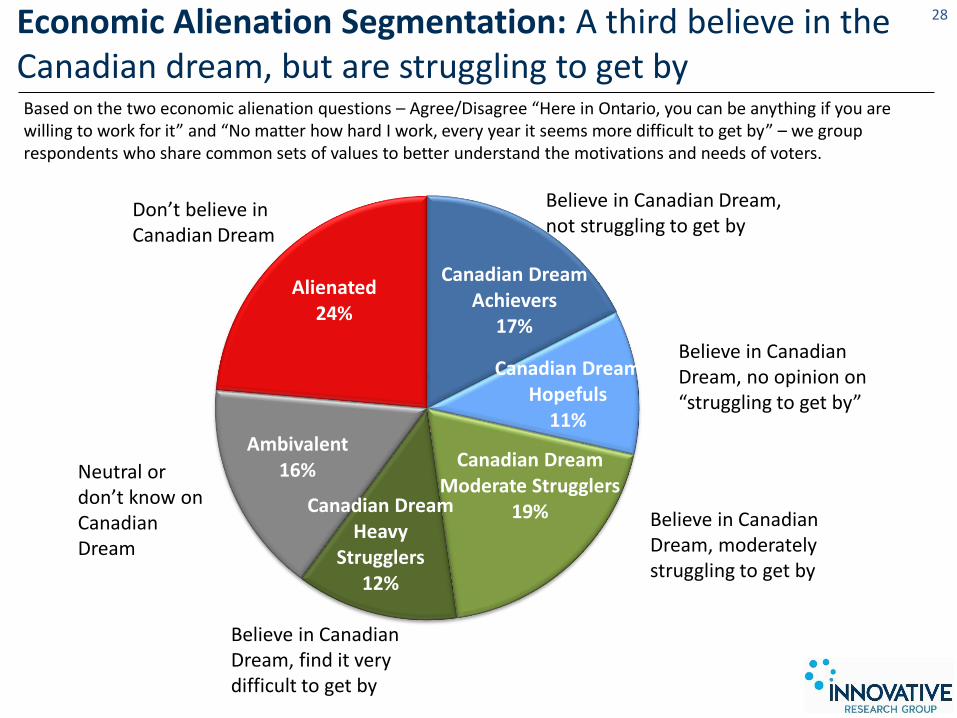
Canadian Dream Achievers
17%
Canadian Dream Hopefuls
11%
Canadian Dream Moderate Strugglers
19%Canadian Dream Heavy
Strugglers12%
Ambivalent16%
Alienated24%
Believe in Canadian Dream, not struggling to get by
Economic Alienation Segmentation: A third believe in the Canadian dream, but are struggling to get by
Believe in Canadian Dream, no opinion on “struggling to get by”
Believe in Canadian Dream, moderately struggling to get by
Believe in Canadian Dream, find it very difficult to get by
Neutral or don’t know on Canadian Dream
Don’t believe in Canadian Dream
Based on the two economic alienation questions – Agree/Disagree “Here in Ontario, you can be anything if you are willing to work for it” and “No matter how hard I work, every year it seems more difficult to get by” – we group respondents who share common sets of values to better understand the motivations and needs of voters.

29
15%
16%
15%
15%
17%
11%
13%
12%
14%
11%
16%
18%
17%
24%
19%
11%
8%
10%
13%
12%
23%
21%
21%
18%
16%
24%
24%
25%
17%
24%
Jan '18
Apr '18
May '18
May '18 W2
May '18 W3
Canadian Dream Achievers Canadian Dream Hopefuls
Canadian Dream Moderate Strugglers Canadian Dream Heavy Strugglers
Ambivalent Alienated
Economic Alienation Segmentation: After slight dip in previous wave, alienation is up; just 16% now ‘ambivalent’

30
33%37% 26%
25% 24%
32%
39% 39%34%
39%
22%18%
22%
31%31%
11%6% 12%
10%6%
Jan '18 Apr '18 May '18 May '18 W2 May '18 W3
23%25% 23% 20% 20%
35%39%
30% 34% 33%30% 25%
38% 40%38%
9% 10%7%
6% 8%
Jan '18 Apr '18 May '18 May '18 W2 May '18 W3
24% 12% 26% 25% 17%
40%
63%40% 42% 44%
29%19%
31% 27% 28%
5% 5% 3% 6%10%
Jan '18 Apr '18 May '18 May '18 W2 May '18 W3
Ambivalent
Tracking Decided Vote by Alienation Segmentation
Canadian Dream Heavy Strugglers
47%42%
34%
38% 39%
34%34%
40%
30% 32%
10%
20% 21% 27% 25%
6%2% 3% 5% 4%
Jan '18 Apr '18 May '18 May '18 W2 May '18 W3
37%35% 32%
30% 34%
41%44%
32%
36%
28%10%
16%31%
30%35%
8% 5% 4%4% 3%
Jan '18 Apr '18 May '18 May '18 W2 May '18 W3
30%
23%
26%
27% 26%
41%45% 45%
37%43%
19%
25%
24%
30% 27%
10% 7% 5% 5% 4%
Jan '18 Apr '18 May '18 May '18 W2 May '18 W3
Decided vote: Liberal PC NDP Green
Alienated
Canadian Dream HopefulsCanadian Dream Achievers
Canadian Dream Moderate Strugglers

Value Clusters

32
42%
43%
15%… brings out the worst in human nature
… teaches people the value of hard work and success
Don’t know
Which of the following statements best describes your personal point of view? The profit system …
Is the main role of government …?
65%
26%
9%
To create equal opportunity so that everyone can compete on their own to be the best they can be
To redistribute wealth so that the poor and disadvantaged have more than they would if left on their own
Don’t know
When governments make major decisions concerning spending on programs and services, do you think they should be based on …?
39%
54%
7% Their ability to afford the programsand services
The public’s need for the programs and services
Don’t know
When it comes to government decision making, which of the following statements is closest to your view?
51%34%
15%
Too often the government listens to experts instead of common sense
Provincial issues are complicated so government should listen to experts when it comes to policy
Don’t know
Core political values: These four value statements define value cluster analysis that we can compare directly to 2014
Q Q
Q Q

33
Defining value clusters
Deferential Conser-vatives
Populist Conser-vatives
Business Liberals
Left Liberals
Thrifty Moderates
Core Left
Is the main role of government to …?
Create equal opportunity
83% 97% 73% 95% 51% 0%
Redistribute wealth 11% 0% 17% 0% 21% 96%
The profit system …
Brings out worst in human nature
0% 0% 0% 78% 72% 89%
Teaches value of hard work and success
89% 91% 88% 0% 5% 0%
When gov’ts make decisions on spending on programs, do you
think they should base their decisions on…
Ability to afford 91% 96% 0% 0% 79% 0%
Public need 0% 0% 95% 95% 0% 99%
When it comes to government decision
making…
Listen to experts 0% 100% 44% 62% 48% 38%
Rely on common sense
78% 0% 40% 23% 25% 48%

34
10%
10%
11%
12%
10%
12%
17%
20%
16%
18%
15%
17%
21%
19%
21%
19%
20%
19%
15%
16%
16%
16%
20%
18%
17%
15%
17%
18%
17%
15%
19%
19%
20%
18%
18%
19%
Mar '14
June '14
Jan '18
Apr '18
May '18
May '18 W3
Deferential Conservatives Populist Conservatives Business Liberals
Left Liberals Thrify Moderates Core Left
Value Clusters: Tracking over timeThese clusters tracking back to the 2014 election are based on 4 basic values: equal opportunity versus redistribution; trust in the profit system; whether spending should be based on ability to afford or public need; and whether government should listen to experts or common sense.
Fast forward to the 2018 election
35
41%50%
40%44%
37% 30%
9% 8%
15%
7%
8% 10%
35%30%
38% 39%
47% 52%
14% 11%
6%
10%
8% 6%
Mar '14 June '14 Jan '18 Apr '18 May '18 May '18 W3
19% 22%11% 10%
6%6%
68% 67%
75%81% 79% 80%
9% 7% 8% 6%11%
11%3% 3% 3% 1% 2% 1%
Mar '14 June '14 Jan '18 Apr '18 May '18 May '18 W3
36% 31% 27%19% 20% 21%
47% 45% 55%65% 61%
53%
15%14%
9% 7%
14% 19%
3% 10%10% 8%
4%5%
Mar '14 June '14 Jan '18 Apr '18 May '18 May '18 W3
Core Left
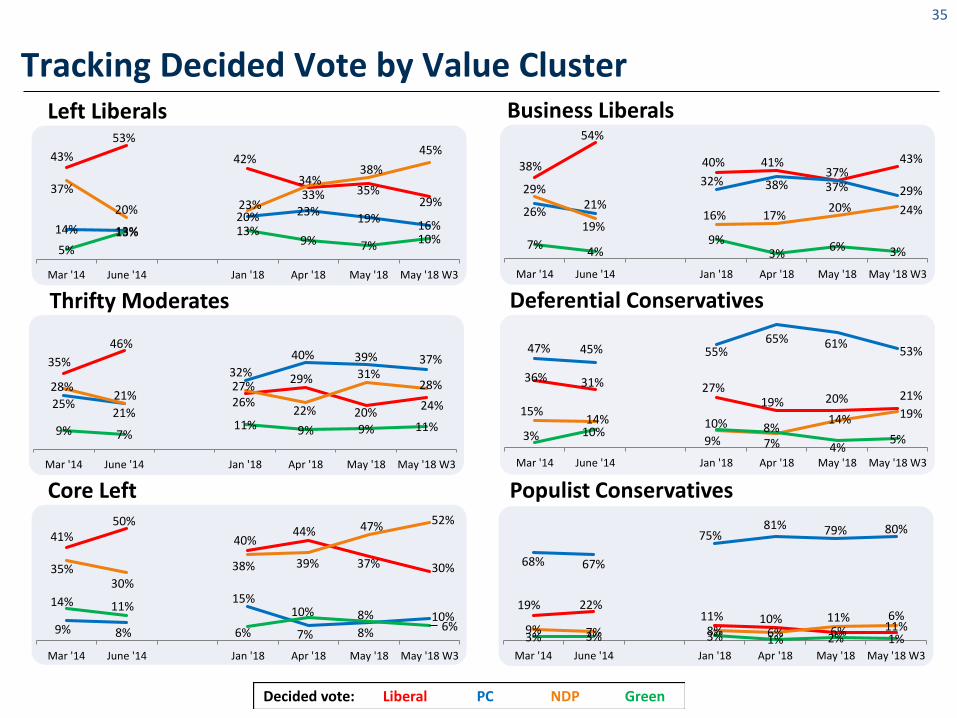
Tracking Decided Vote by Value Cluster
Deferential Conservatives
43%
53%
42%
33% 35%29%
14% 13%20% 23%
19%16%
37%
20% 23%
34%38%
45%
5%
13% 13%9% 7% 10%
Mar '14 June '14 Jan '18 Apr '18 May '18 May '18 W3
38%
54%
40% 41%
37%
43%
26%21%
32% 38%37%
29%29%
19%16% 17%
20% 24%
7%4%
9%3%
6% 3%
Mar '14 June '14 Jan '18 Apr '18 May '18 May '18 W3
35%
46%
26%
29%
20%24%25%
21%
32%
40% 39% 37%
28%21%
27%
22%
31%28%
9% 7%11% 9% 9% 11%
Mar '14 June '14 Jan '18 Apr '18 May '18 May '18 W3
Decided vote: Liberal PC NDP Green
Populist Conservatives
Business LiberalsLeft Liberals
Thrifty Moderates

Time-for-Change

37Time for Change tracking: 7-in-10 (71%) think it’s time for a change, including more than half who strongly agree (52%)
For each of the following statements please indicate if you agree or disagree? [asked of all respondents; n=1050]
52%52%
47%50%48%
40%46%47%46%46%47%
38%38%
12%10%12%11%11%11%13%
7%10%10%7%
26%12%
19%23%
22%19%
18%16%
16%18%20%
17%18%
16%20%
18%21%17%20%21%
19%21%
18%21%22%
18%20%
21%
14%15%
16%15%
16%19%
16%17%15%
13%17%
18%17%
13%16%
17%16%15%20%10%
17%15%16%
17%13%
18%
7%
5%
7%
7%
8%
8%
8%
9%
10%
7%
9%
11%
11%
12%
13%
14%
11%
11%
10%
13%
12%
14%
11%
12%
9%
14%
6%
3%
6%
7%
6%
10%
10%
6%
7%
10%
6%
13%
9%
41%
36%
37%
39%
38%
31%
38%
40%
38%
36%
40%
29%
30%
2%
2%
2%
1%
4%
7%
4%
4%
3%
7%
4%
4%
5%
3%
3%
3%
2%
5%
9%
4%
5%
3%
6%
5%
4%
5%
May '18 W3
May '18 W2
May '18
Apr '18
Jan '18 W2
Jan '18 W1
Aug '17
Feb '17
Jan '17
Sep '16
Dec '15
May '14
Mar '14
May '18 W3
May '18 W2
May '18
Apr '18
Jan '18 W2
Jan '18 W1
Aug '17
Feb '17
Jan '17
Sep '16
Dec '15
May '14
Mar '14
Strongly agree Somewhat agree Neither agree nor disagree
Somewhat disagree Strongly disagree Don't know
Total agree(Strongly + Somewhat)
71%
75%
69%
69%
66%
56%
61%
65%
66%
62%
65%
54%
58%
31%31%
29%
32%
32%
30%
34%
26%
31%
31%
26%
45%
33%
It’s time for a change in government here in Ontario
The Ontario Liberals have their problems, but they are still the best party to form government
Q

38Time for Change Tracking: Time for change group drops 5 points, now at 2nd highest levels in trackingBased on the two time-for-change questions, we group respondents who share common sets of values to better understand the motivations and needs of voters.
16%
23%
20%
15%
14%
13%
15%
15%
12%
12%
11%
6%
10%
9%
11%
9%
9%
8%
7%
10%
9%
8%
9%
8%
7%
7%
9%
12%
8%
9%
10%
6%
10%
7%
12%
12%
10%
21%
16%
12%
10%
12%
12%
10%
12%
8%
17%
11%
8%
9%
7%
6%
28%
19%
21%
21%
22%
23%
22%
23%
21%
21%
27%
21%
18%
25%
26%
30%
34%
37%
39%
35%
29%
36%
38%
34%
37%
42%
Mar '14
May '14
Dec '15
Sep '16
Jan '17
Feb '17
Aug '17
Jan '18 (W1)
Jan '18 (W2)
Apr '18
May '18
May '18 W2
May '18 W3
Core ON Liberals Soft ON Liberals Time for change ON Liberals
Uncertain Soft anti-ON Liberals Hostile
Don’t feel it is time for a change and think Liberals best to form government
Feel both that it is time for a change, and disagree that Liberals are the best option to form government.
Key conflicted voters. Feel it is time for change, but also think Liberals are still the best option.

39
8%11% 7%
10%
37% 32%29% 25%
45% 46%52%
57%
8%11%
12%
8%
May '14 May '18 W1 May '18 W2 May '18 W3 1% 0%
1%0%
69%72% 66%
66%
22%23%
28% 27%
6%3% 3% 6%
May '14 May '18 W1 May '18 W2 May '18 W3
36%32%
37%22%
16%
9%
13%
12%
34%
34% 37%
46%
10%
23%
13%
16%
May '14 May '18 W1 May '18 W2 May '18 W3
Soft anti-ON Liberals
Tracking Decided Vote by Time-for-Change Segmentation
Uncertain
91% 90% 85% 87%
0%1%
1% 0%6% 9% 11% 11%
3%0%
3% 1%
May '14 May '18 W1 May '18 W2 May '18 W3
66%80% 70% 72%
5% 0% 2% 1%
18% 17%23%
20%
11% 3% 5% 5%
May '14 May '18 W1 May '18 W2 May '18 W3
64%
42%
60%51%
6%18%
11% 15%24%
33% 23% 29%
6% 7% 6% 4%
May '14 May '18 W1 May '18 W2 May '18 W3
Decided vote: Liberal PC NDP Green
Hostile
Soft ON LiberalsCore ON Liberals
Time-for-Change ON Liberals

Political Attitudes
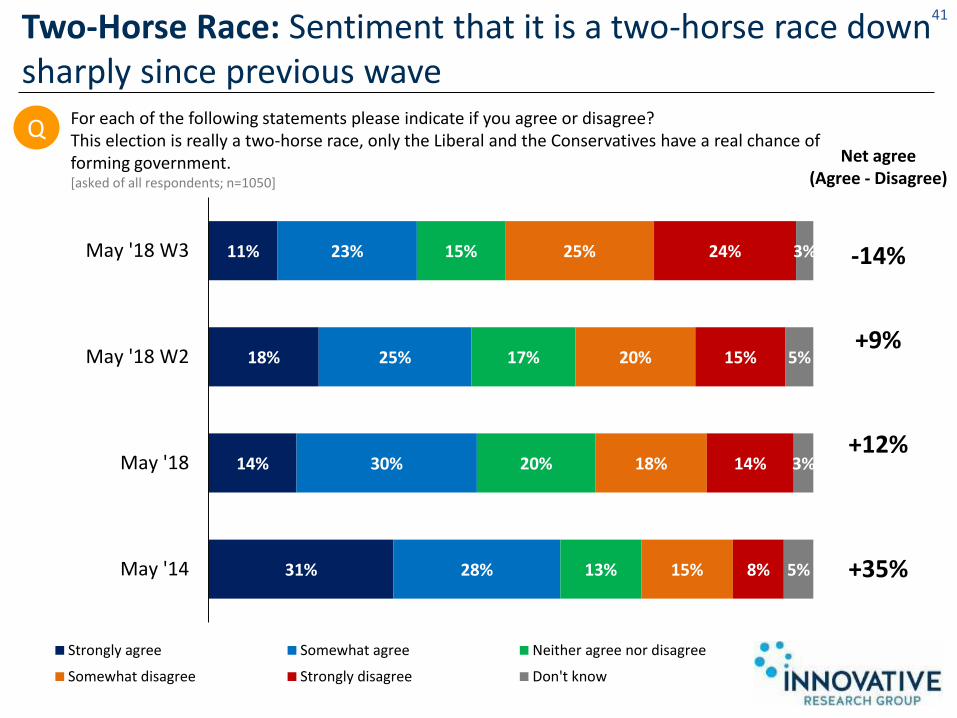
Net agree(Agree - Disagree)
-14%
+9%
+12%
+35%
41Two-Horse Race: Sentiment that it is a two-horse race down sharply since previous wave
11%
18%
14%
31%
23%
25%
30%
28%
15%
17%
20%
13%
25%
20%
18%
15%
24%
15%
14%
8%
3%
5%
3%
5%
May '18 W3
May '18 W2
May '18
May '14
Strongly agree Somewhat agree Neither agree nor disagree
Somewhat disagree Strongly disagree Don't know
For each of the following statements please indicate if you agree or disagree?This election is really a two-horse race, only the Liberal and the Conservatives have a real chance of forming government.[asked of all respondents; n=1050]
Q

42Two-Horse Race: NDP support highest among those who strongly disagree, those who agree most likely to vote PC
Co
mb
ine
d V
ote
Column %shown
Strongly agree Somewhat agreeNeither agree nor
disagreeSomewhat
disagreeStrongly disagree
W3 W2 W1 W3 W2 W1 W3 W2 W1 W3 W2 W1 W3 W2 W1
Liberal 30% 36% 31% 33% 29% 25% 32% 22% 22% 24% 25% 30% 9% 10% 11%
Progressive Conservative
48% 42% 48% 37% 35% 40% 31% 32% 29% 29% 25% 23% 30% 25% 25%
NDP 11% 15% 13% 17% 21% 18% 20% 18% 19% 33% 40% 33% 50% 53% 54%
Green 8% 2% 5% 5% 7% 7% 5% 5% 5% 6% 6% 3% 6% 5% 5%
Other 0% 0% 1% 0% 0% 0% 2% 0% 1% 1% 0% 1% 1% 0% 0%
Undecided/Don’t know
3% 3% 3% 6% 7% 10% 8% 19% 21% 7% 3% 10% 4% 5% 5%
Would not vote/none
1% 1% 0% 1% 1% 1% 2% 4% 4% 0% 0% 1% 0% 2% 0%
Combined Vote BY For each of the following statements please indicate if you agree or disagree? This election is really a two-horse race, only the Liberal and the Conservatives have a real chance of forming government[asked of all respondents; n=1050]
Note: “Don’t know” not shown due to insufficient sample size.
Two-horse race – May 2018 Tracking by Wave
Q

43Doug Ford attitudes: Majority think Doug Ford unsuitable for Premiership, ‘strong’ feeling up 8 points since April
For each of the following statements please indicate if you agree or disagree? [asked of all respondents; n=1,050]
41%
33%
42%
42%
17%
18%
18%
17%
16%
20%
13%
15%
8%
9%
7%
8%
14%
15%
18%
16%
4%
4%
2%
3%
May-2018 W3
April 2018
May-2018 W3
May-2018 W1
I fee
l Do
ug
Ford
has
ah
isto
ry o
f p
oo
r ch
oic
esan
d b
ad b
ehav
iou
rth
at m
akes
him
un
suit
able
to
be
Pre
mie
r o
f O
nta
rio
I am
afr
aid
of
wh
atD
ou
g Fo
rd a
nd
th
e P
Cs
mig
ht
do
if t
hey
fo
rmgo
vern
men
t
Strongly agree Somewhat agreeNeither agree nor disagree Somewhat disagreeStrongly disagree Don't know
Total agree(Strongly + Somewhat)
58%
52%
59%
59%
Q

44Ford Attitudes by Party ID: PC identifiers only group to see Doug Ford as suitable to be Premier
Party IDDoug Ford attitudes by Party ID
Net agreement(Total % agree minus total %
disagree)
Liberal PC NDP Green/ Other Unaligned
I feel Doug Ford has a history of poor choices and bad behaviourthat makes him unsuitable to be
Premier of Ontario
+78% -30% +72% +36% +36%
I am afraid of what Doug Ford and the PCs might do if they form
government+78% -40% +71% +38% +39%

45Ford Attitudes by ID and Region: Voters in Toronto have the most negative view of Doug FordAttitudes by Party ID and Region
Net agreement(Total % agree minus total %
disagree)
Toronto Rest of GTA South/West North/East
I feel Doug Ford has a history of poor choices and bad
behaviour that makes him unsuitable to be Premier of
Ontario
+48% +30% +29% +37%
I am afraid of what Doug Ford and the PCs might do if they
form government+52% +26% +28% +32%
Region

Ford Attitudes by Value Cluster: Populist and Deferential conservatives polarized on their views about Ford
46
Attitudes BY Value Cluster
Net agreement(Total % agree minus total %
disagree)
Deferential Conservatives
Populist Conservatives
Business Liberals
Left LiberalsThrify
ModeratesCore Left
I feel Doug Ford has a history of poor choices and bad behaviourthat makes him unsuitable to be
Premier of Ontario
+27% -38% +50% +60% +28% +76%
I am afraid of what Doug Ford and the PCs might do if they form
government+21% -45% +50% +60% +27% +76%

Ford Attitudes by Econ. Alienation: Heavy Strugglers most open to Ford; Achievers and Hopefuls least open
47
Attitudes BY Economic Alienation
Achievers HopefulsModerate Strugglers
Heavy Strugglers
Ambivalent Alienated
I feel Doug Ford has a history of poor choices and bad behaviourthat makes him unsuitable to be
Premier of Ontario
+52% +55% +30% +6% +31% +37%
I am afraid of what Doug Ford and the PCs might do if they form
government+48% +47% +29% +7% +29% +38%
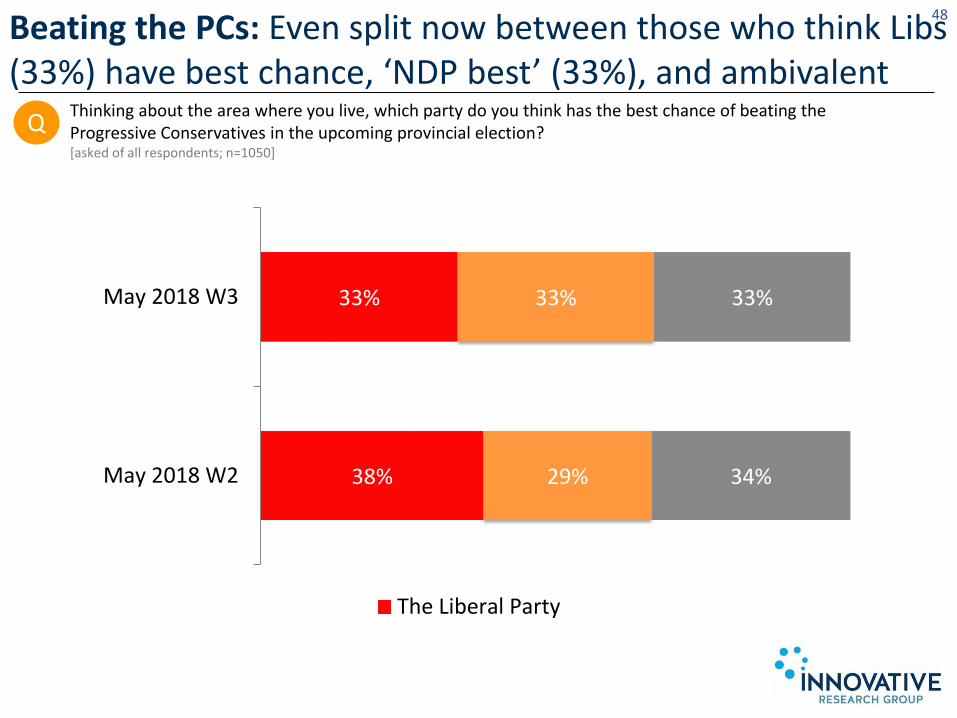
48Beating the PCs: Even split now between those who think Libs (33%) have best chance, ‘NDP best’ (33%), and ambivalent
Thinking about the area where you live, which party do you think has the best chance of beating the Progressive Conservatives in the upcoming provincial election?[asked of all respondents; n=1050]
33%
38%
33%
29%
33%
34%
May 2018 W3
May 2018 W2
The Liberal Party
Q

49Beating the PCs: Among NDP/Lib battleground voters who they think will win closely linked to their vote choice
Who would beat the PCs?
Column % shownTOTAL Liberals NDP Don’t know
Liberal 20% 43% 12% 7%
PC 16% 15% 20% 14%
NDP 21% 23% 30% 14%
Green/other 19% 14% 23% 20%
Undecided/would not vote
24% 5% 15% 45%
Co
mb
ine
d V
ote
Vote among Liberal and NDP battleground voters BY who they think will beat the PCs

Read, seen, heard

Read, seen, heard: Two-thirds (66%) have heard about Ford, less have heard about Wynne (54%) and Horwath (52%)
51
Have you read, seen or heard anything about [Leader and party] in the last few days?
Kathleen Wynne and the Ontario Liberal Party
Doug Ford and the Ontario PCs Andrea Horwath and the Ontario NDP
Yes54%
No46%
Yes66%
No34%
Yes52%
No48%
Did what you read, see or hear leave you feeling a lot more favourable, somewhat more favourable, somewhat less favourable or a lot less favourable towards [Leader and party], or did it make no difference?
8%14% 12%13% 10%
27%
39%31%
35%
11%15% 13%
30% 31%
13%
Kathleen Wynne and theOntario Liberal Party
Doug Ford and the OntarioPCs
Andrea Horwath and theOntario NDP
A lot more favourable Somewhat more favourable Made no differenceSomewhat less favourable A lot less favourable
Net Impact
- 19Net Impact
+ 13Net Impact
- 22
Q
Q

Liberal read, seen, heard: Less have heard of the Liberal than in the last wave, impact remains moderately negative
52
Have you read, seen or heard anything about Kathleen Wynne and the Ontario Liberal Party in the last few days?
62%
54%
38%
46%
May-2018 Wave 2
May-2018 Wave 3
Yes No
Did what you read, see or hear leave you feeling a lot more favourable, somewhat more favourable, somewhat less favourable or a lot less favourable towards Kathleen Wynne and the Ontario Liberal Party or did it make no difference?
8%
6%
13%
13%
39%
41%
11%
14%
30%
26%
May-2018 Wave 3
May-2018 Wave 2
A lot more favourable Somewhat more favourable Made no difference
Somewhat less favourable A lot less favourable
Net Impact
-19
-20
Q
Q

More fav. Less fav. NET
0% 89% -89%6% 58% -53%0% 80% -80%
31% 44% -13%16% 47% -31%7% 67% -59%
12% 27% -15%12% 31% -19%26% 26% 0%9% 26% -17%
67% 4% +63%50% 17% +33%30% 5% +25%21% 53% -32%20% 40% -20%53% 20% +33%45% 36% +9%40% 10% +30%
53
And what did you read, see, or hear about Kathleen Wynne and the Ontario Liberal Party? [OPEN END][asked of those who have read, seen or heard about Kathleen Wynne and the Ontario Liberal Party; n=572]
RSH about Wynne: General RSH very negative; healthcare, transit funding and budget positives, but not breaking through
Note: “None” (1%) and “Refused” (2%) not shown. Impact only shown for responses with unweighted N size of at least 10
Impact by RSH
6%
6%
6%
6%
5%
5%
5%
5%
4%
4%
4%
4%
4%
3%
3%
2%
2%
2%
19%
2%
Spending promises/throwing money around to buy votes
Attacking Ford/Making comparison with Trump
Not truthful/corrupt (ie lying about deficit)
Platform/Promises (general)
Hydro issues
Negative comments (general)
Ads (general)
Attacking other parties/NDP
Childcare
Poll performance
Positive comments (general)
Healthcare (general)
Election/campaigning (general)
Liberal record/Time for a change
Defending her record/fighting back
Transit funding
Budget/deficit
TV/Radio appearances
Other
Don't Know
Q
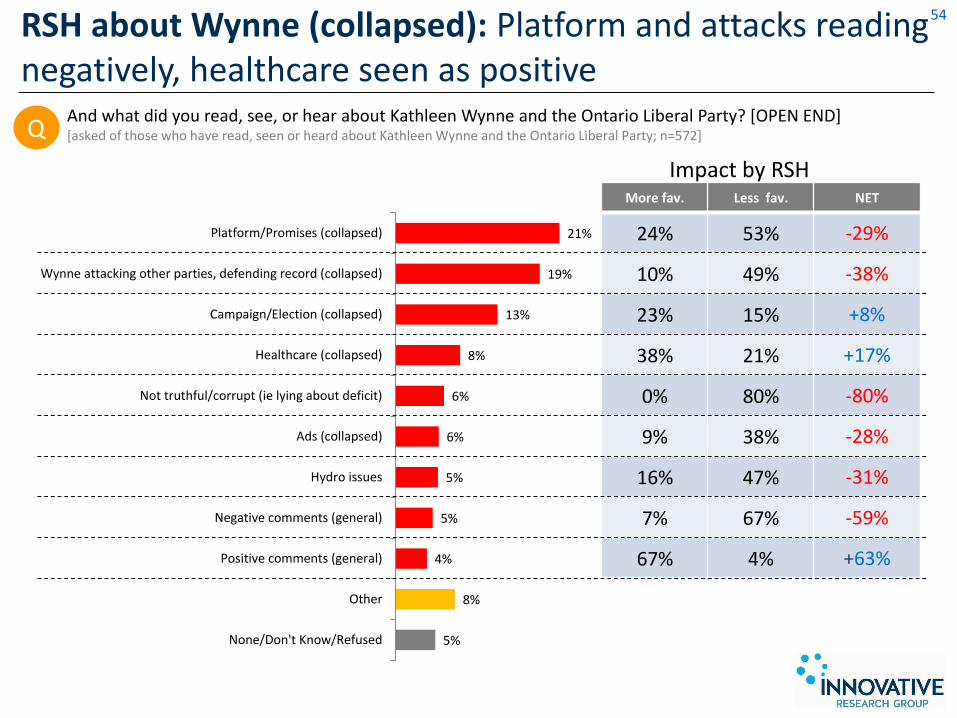
54
And what did you read, see, or hear about Kathleen Wynne and the Ontario Liberal Party? [OPEN END][asked of those who have read, seen or heard about Kathleen Wynne and the Ontario Liberal Party; n=572]
RSH about Wynne (collapsed): Platform and attacks reading negatively, healthcare seen as positive
Impact by RSH
21%
19%
13%
8%
6%
6%
5%
5%
4%
8%
5%
Platform/Promises (collapsed)
Wynne attacking other parties, defending record (collapsed)
Campaign/Election (collapsed)
Healthcare (collapsed)
Not truthful/corrupt (ie lying about deficit)
Ads (collapsed)
Hydro issues
Negative comments (general)
Positive comments (general)
Other
None/Don't Know/Refused
More fav. Less fav. NET
24% 53% -29%
10% 49% -38%
23% 15% +8%
38% 21% +17%
0% 80% -80%
9% 38% -28%
16% 47% -31%
7% 67% -59%
67% 4% +63%
Q
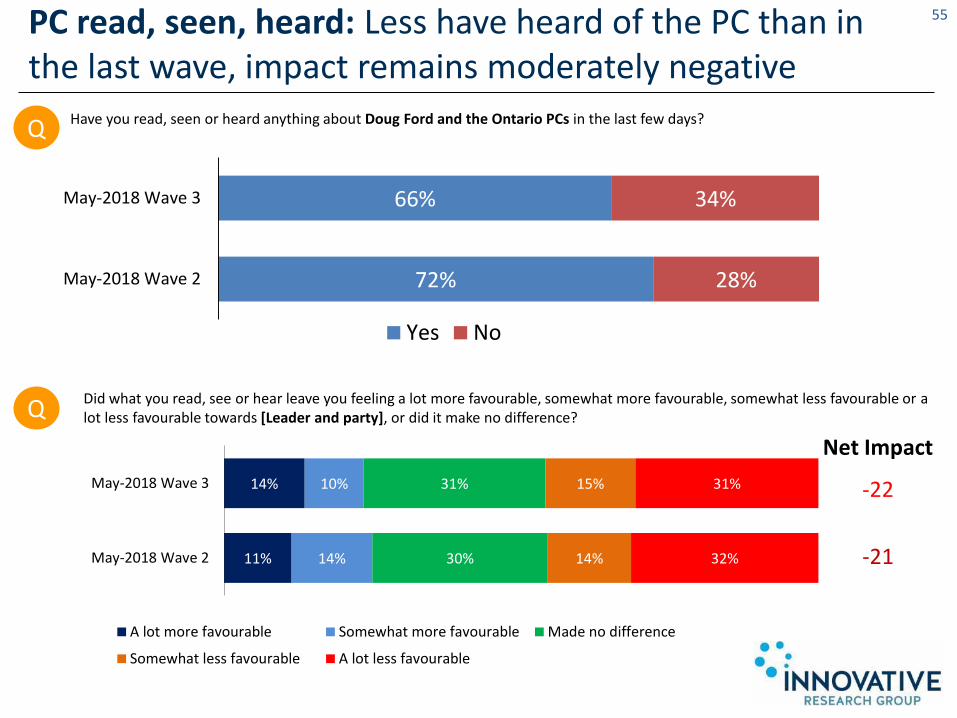
Net Impact
-22
-21
PC read, seen, heard: Less have heard of the PC than in the last wave, impact remains moderately negative
55
Have you read, seen or heard anything about Doug Ford and the Ontario PCs in the last few days?
72%
66%
28%
34%
May-2018 Wave 2
May-2018 Wave 3
Yes No
Did what you read, see or hear leave you feeling a lot more favourable, somewhat more favourable, somewhat less favourable or a lot less favourable towards [Leader and party], or did it make no difference?
14%
11%
10%
14%
31%
30%
15%
14%
31%
32%
May-2018 Wave 3
May-2018 Wave 2
A lot more favourable Somewhat more favourable Made no difference
Somewhat less favourable A lot less favourable
Q
Q

56
And what did you read, see, or hear about Doug Ford and the Ontario PCs? [OPEN END][asked of those who have read, seen or heard about Doug Ford and the Ontario PCs; n=688]
RSH about Ford: General RSH very negative; data theft scandal tops mention with strong negatives
Note: “None” (1%) and “Refused” (2%) not shown. Impact only shown for responses with unweighted N size of at least 10
Impact by RSH
11%
9%
8%
8%
7%
6%
6%
5%
4%
3%
2%
2%
2%
2%
2%
2%
2%
2%
1%
12%
2%
Data theft scandal with candidate
Lower gas prices/gas tax
Negative comments (general)
Candidate controversies
Tax Cuts/carbon tax cut
Platform/Promises (general)
Fundraising controversy
Wants to expand retail sales of beer/alcohol
Hydro issues/Firing Hydro One CEO/Board
Media coverage
Positive comments (general)
Scandals/corruption
Flip flopping on greenbelt issue
Attacks on Ford/PCs (general)
Ads (general)
Healthcare (general)
Balancing budget/Will make cuts
Comparison to Donald Trump
Photo ops/Campaign appearances
Other
Don't Know
More fav. Less fav. NET
0% 76% -76%53% 22% +31%4% 67% -63%
7% 67% -59%39% 35% +4%25% 43% -18%5% 58% -53%
35% 41% -6%46% 14% +32%17% 39% -22%94% 0% +94%
6% 53% -47%6% 75% -69%
13% 40% -27%7% 36% -29%
62% 15% +46%38% 38% 0%17% 83% -67%20% 30% -10%
Q

57
Impact by RSH
15%
15%
11%
9%
8%
7%
6%
5%
5%
4%
12%
4%
Platform/Promises (collapsed)
Negative comments (collapsed)
Data theft scandal with candidate
Lower gas prices/gas tax
Candidate controversies
Tax Cuts/carbon tax cut
Fundraising controversy
Wants to expand retail sales of beer/alcohol
Campaign/Election (collapsed)
Hydro issues/Firing Hydro One CEO/Board
Other
None/Don't know/Refused
More fav. Less fav. NET
30% 46% -16%
7% 61% -54%
0% 76% -76%
53% 22% +31%
7% 67% -59%
39% 35% +4%
5% 58% -53%
35% 41% -6%
27% 33% -7%
46% 14% +32%
And what did you read, see, or hear about Doug Ford and the Ontario PCs? [OPEN END][asked of those who have read, seen or heard about Doug Ford and the Ontario PCs; n=688]
RSH about Ford (collapsed): General RSH very negative; platform/promises (collapsed) have moderately negative effect
Q

NDP read, seen, heard: Recall up for Horwath, impact still positive, although less so than in early May
58
Have you read, seen or heard anything Andrea Horwath and the Ontario NDP in the last few days?
46%
52%
54%
48%
May-2018 Wave 2
May-2018 Wave 3
Yes No
Did what you read, see or hear leave you feeling a lot more favourable, somewhat more favourable, somewhat less favourable or a lot less favourable towards Andrea Horwath and the Ontario NDP, or did it make no difference?
12%
16%
27%
35%
35%
37%
13%
6%
13%
6%
May-2018 Wave 3
May-2018 Wave 2
A lot more favourable Somewhat more favourable Made no difference
Somewhat less favourable A lot less favourable
Net Impact
+13
+39
Q
Q

More fav. Less fav. NET
11% 64% -53%
46% 9% +37%
46% 12% +34%
59% 16% +44%
46% 14% +32%
70% 22% +48%
0% 70% -70%
70% 0% +70%
17% 28% -11%
32% 26% +5%
41% 0% +41%
33% 47% -13%
69% 13% +56%
6% 69% -63%
67% 0% +67%
64% 0% +64%
30% 0% +30%
67% 11% +56%
89% 11% +78%
59
And what did you read, see, or hear about Andrea Horwath and the Ontario NDP? [OPEN END][asked of those who have read, seen or heard about Andrea Horwath and the Ontario NDP; n=543]
RSH about Horwath: Budget accounting error is top mention and strongly negative, positive impact on polls and platform
Note: “None” (2%) and “Refused” (2%) not shown. Impact only shown for responses with unweighted N size of at least 10
Impact by RSH
10%
9%
8%
6%
5%
4%
4%
4%
3%
3%
3%
3%
3%
3%
2%
2%
2%
2%
2%
18%
2%
Budget accounting error
Poll performance
Platform/Promises (general)
Healthcare - Dental/Drug coverage
Daycare plan
Healthcare (general)
Excessive spending plans
Positive comments (general)
Transit/LRT plan
Attack on Ford/Wynne
Photo ops/Campaign appearances
Tax plans/increase taxes on wealthy
Ads on TV
Coalition with the Liberals
Alternative to Liberal vs PC/strong campaign
Ads (general)
Media coverage
Hydro issues
Leaders debates
Other
Don't Know
Q

60
And what did you read, see, or hear about Andrea Horwath and the Ontario NDP? [OPEN END][asked of those who have read, seen or heard about Andrea Horwath and the Ontario NDP; n=692]
RSH about Horwath: Healthcare (collapsed, daycare included) has a very positive impact
Impact by RSH
21%
17%
15%
10%
9%
5%
4%
4%
10%
6%
Platform/Promises (collapsed)
Campaign/Election (collapsed)
Healthcare (collapsed)
Budget accounting error
Poll performance
Ads (collapsed)
Excessive spending plans
Positive comments (general)
Other
None/Don't know/Refused
More fav. Less fav. NET
38% 29% +9%
41% 25% +16%
59% 16% +43%
11% 64% -53%
46% 9% +37%
64% 7% +57%
0% 70% -70%
70% 0% +70%
Q

Campaign impact: NDP show the most positive news impact among Unaligned
61
Did what you read, see or hear leave you feeling a lot more favourable, somewhat more favourable, somewhat less favourable or a lot less favourable towards [Leader and party], or did it make no difference? [BY PARTY ID]
8%
15%
0%
14%
0%
8%
14%
3%
34%
1%
12%
8%
12%
13%
3%
38%
12%
5%
13%
25%
3%
18%
7%
5%
10%
5%
20%
2%
9%
8%
27%
32%
17%
32%
20%
33%
39%
45%
26%
39%
45%
47%
31%
28%
30%
26%
30%
40%
35%
37%
34%
23%
45%
39%
11%
7%
12%
8%
14%
15%
15%
18%
8%
20%
21%
16%
13%
10%
20%
6%
10%
14%
30%
8%
59%
21%
33%
24%
31%
47%
7%
50%
29%
28%
13%
8%
26%
1%
13%
9%
Kathleen Wynne and the Ontario Liberal Party
ON Liberals
PC
NDP
Green/Other
Unaligned
Doug Ford and the Ontario PCs
ON Liberals
PC
NDP
Green/Other
Unaligned
Andrea Horwath and the Ontario NDP
ON Liberals
PC
NDP
Green/Other
Unaligned
A lot more favourable Somewhat more favourable Made no difference
Somewhat less favourable A lot less favourable
Net impact
-19%
+26%
-68%
+3%
-40%
-27%
-22%
-57%
+40%
-67%
-28%
-27%
+13%
+28%
-27%
+63%
+9%
+15%
Q

Campaign impact: Those who believe in Canadian dream but are currently struggling have positive reactions to Ford
62
Did what you read, see or hear leave you feeling a lot more favourable, somewhat more favourable, somewhat less favourable or a lot less favourable towards [Leader and party], or did it make no difference? [BY ALIENATION SEGMENTS]
8%11%
8%10%8%
3%9%
14%10%8%
13%32%
11%11%
12%9%
15%11%
15%9%
14%
13%16%
13%16%
6%8%
15%
10%6%12%
15%12%
11%7%
27%26%
25%30%
20%27%
29%
39%45%
46%32%
26%41%
39%
31%20%
32%31%
25%40%
35%
35%37%
35%36%
26%40%
35%
11%9%
8%13%
5%16%
11%
15%22%
14%15%
12%7%
18%
13%16%
14%13%
19%14%7%
30%18%
25%29%
56%32%
26%
31%43%
35%26%
18%31%30%
13%12%10%9%
21%10%
14%
Kathleen Wynne and the Ontario Liberal Party
Canadian Dream Achievers
Canadian Dream Hopefuls
Canadian Dream Moderate Strugglers
Canadian Dream Heavy Strugglers
Ambivalent
Alienated
Doug Ford and the Ontario PCs
Canadian Dream Achievers
Canadian Dream Hopefuls
Canadian Dream Moderate Strugglers
Canadian Dream Heavy Strugglers
Ambivalent
Alienated
Andrea Horwath and the Ontario NDP
Canadian Dream Achievers
Canadian Dream Hopefuls
Canadian Dream Moderate Strugglers
Canadian Dream Heavy Strugglers
Ambivalent
Alienated
A lot more favourable Somewhat more favourable Made no difference
Somewhat less favourable A lot less favourable
Net impact
-19%
-0%
-12%
-15%
-46%
-37%
-13%
-22%
-48%
-28%
-13%
+14%
-16%
-29%
+13%
+6%
+17%
+19%
-5%
+13%
+23%
Q

Liberal Battleground impact: strong positive impact among base for Wynne recall, battleground reaction is mixed
63
Did what you read, see or hear leave you feeling a lot more favourable, somewhat more favourable, somewhat less favourable or a lot less favourable towards Ontario’s Premier Kathleen Wynne and the provincial government, or did it make no difference? [BY BATTLEGROUND]
8%
22%
13%
2%
13%
31%
16%
5%
39%
42%
49%
33%
11%
4%
12%
12%
30%
2%
10%
47%
Overall
Liberal base
Liberal battleground
Liberal opposition
A lot more favourable Somewhat more favourable Made no difference
Somewhat less favourable A lot less favourable
Net impact
-20%
+47%
+7%
-52%
Q

PC Battleground impact: PC battleground reacts negatively to what they are RSHing about Ford
64
Did what you read, see or hear leave you feeling a lot more favourable, somewhat more favourable, somewhat less favourable or a lot less favourable towards Doug Ford and the Ontario PCs, or did it make no difference? [BY BATTLEGROUND]
14%
41%
8%
1%
10%
18%
17%
2%
31%
32%
35%
28%
15%
7%
19%
18%
31%
2%
21%
51%
Overall
PC base
PC battleground
PC opposition
A lot more favourable Somewhat more favourable Made no difference
Somewhat less favourable A lot less favourable
Net impact
-23%
+50%
-13%
-66%
Q

NDP Battleground impact: NDP battleground response strongly positive to what they are RSHing about Horwath
65
Did what you read, see or hear leave you feeling a lot more favourable, somewhat more favourable, somewhat less favourable or a lot less favourable towards Andrea Horwath and the Ontario NDP, or did it make no difference? [BY BATTLEGROUND]
12%
32%
12%
3%
27%
37%
39%
14%
35%
24%
34%
41%
13%
7%
9%
18%
13%
1%
5%
23%
Overall
NDP base
NDP battleground
NDP opposition
A lot more favourable Somewhat more favourable Made no difference
Somewhat less favourable A lot less favourable
Net impact
+13%
+60%
+37%
-23%
Q

Building Understanding.Personalized research to connect you and your audiences.
For more information, please contact:
Greg [email protected]
Innovative Research Group Inc.56 The Esplanade, Suite 310Toronto ON | M5E 1A7www.innovativeresearch.ca
© Copyright 2018 Innovative Research Group Inc.