public infrastructure spending - kpmg infrastructure spending: show me the money the june 2016...
TRANSCRIPT
KPMG Economics
—January 2017
Public infrastructure spending:Show me the money

The June 2016 National Accounts reveals government expenditure on infrastructure, as measured by nominal Gross Fixed Capital Formation, has experienced only a minor increase in FY16 as compared to FY15. This is despite the fact that politicians have been ‘talking up’ infrastructure spending as a key government platform to help deepen and grow the Australian economy.
From a jurisdictional perspective, it would seem that New South Wales and Victoria are increasing their relative spend on public sector capital compared to every other jurisdiction, with most notably Queensland spending less in FY16 than it did in FY15. However, this overly simplistic analysis fails to take into consideration several important factors, including expenditure per capita and expenditure relative to the underlying asset base.
It is more appropriate to consider capital expenditure in the context of the assets ‘owned’ by each jurisdiction, as those States and Territories with ‘greater’ assets in public ownership will necessarily need to spend more on capex to maintain, replace and enhance their infrastructure base than those States and Territories that have privatised some public assets.
Public sector capital stock is ‘consumed’ at a rate of about 2.5 percent per annum. Ignoring inflation, public sector investment expenditure equivalent to 2.5 percent of the asset base is required each year just to ‘stand still’. This means we need to spend in real terms about $40 billion on public sector assets each year just to maintain the operational functionality of Australia’s $1.7 trillion public sector asset base.
However, capital spend just equivalent to depreciation does not maintain the ‘status quo’ if there is growth in the population. Moreover, it does nothing to help grow the economy and enable improvements in productivity through the provision of infrastructure and other public goods. In equilibrium, the public sector net capital stock should be growing at a rate equivalent to the target rate of economic growth across the whole economy.
KPMG recommend the minimum level of efficient public sector capital expenditure should average between 5.5 percent and 6.0 percent of the value of non- financial public sector assets per annum over the longer term, which represents a 2.5 percent depreciation component and a 3.0 percent to 3.5 percent real growth factor.
If this investment target was achieved for FY16 then gross capital expenditure by the public sector in Australia would have amounted to between $95 billion and $105 billion, based on the current value of non-financial public sector assets.
However, given gross fixed capital formation amounted to only about $75 billion in FY16, current investment by governments in Australia is insufficient and should be raised by between 25 percent and 40 percent to ensure economically enhancing public good assets and other enabling infrastructure are being delivered in a timely manner.
© 2017 KPMG, an Australian partnership and a member firm of the KPMG network of independent member firms affiliated with KPMGInternational Cooperative (“KPMG International”), a Swiss entity. All rights reserved. The KPMG name and logo are registered trademarks or trademarks of KPMG International. Liability limited by a scheme approved under Professional Standards Legislation.
Document Classification: KPMG Confidential
3
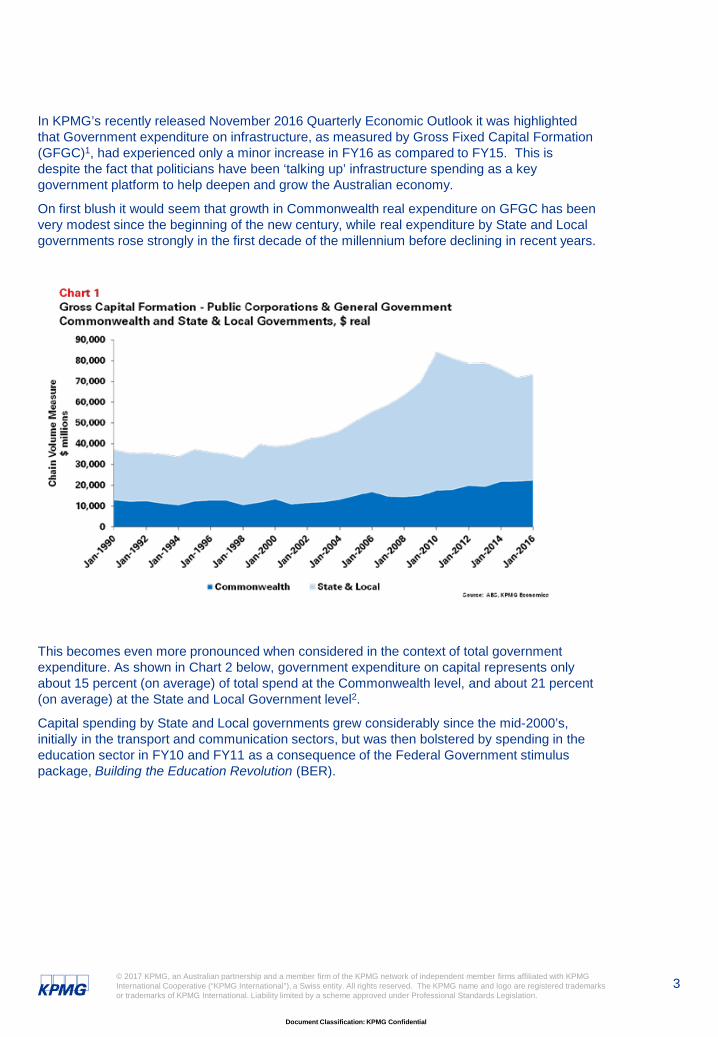
In KPMG’s recently released November 2016 Quarterly Economic Outlook it was highlighted that Government expenditure on infrastructure, as measured by Gross Fixed Capital Formation (GFGC)1, had experienced only a minor increase in FY16 as compared to FY15. This is despite the fact that politicians have been ‘talking up’ infrastructure spending as a key government platform to help deepen and grow the Australian economy.
On first blush it would seem that growth in Commonwealth real expenditure on GFGC has been very modest since the beginning of the new century, while real expenditure by State and Local governments rose strongly in the first decade of the millennium before declining in recent years.
This becomes even more pronounced when considered in the context of total government expenditure. As shown in Chart 2 below, government expenditure on capital represents only about 15 percent (on average) of total spend at the Commonwealth level, and about 21 percent (on average) at the State and Local Government level2.
Capital spending by State and Local governments grew considerably since the mid-2000’s, initially in the transport and communication sectors, but was then bolstered by spending in the education sector in FY10 and FY11 as a consequence of the Federal Government stimulus package, Building the Education Revolution (BER).

© 2016 KPMG, an Australian partnership and a member firm of the KPMG network of independent member firms affiliated with KPMGInternational Cooperative (“KPMG International”), a Swiss entity. All rights reserved. The KPMG name and logo are registered trademarks or trademarks of KPMG International. Liability limited by a scheme approved under Professional Standards Legislation.
Document Classification: KPMG Public
4

© 2016 KPMG, an Australian partnership and a member firm of the KPMG network of independent member firms affiliated with KPMGInternational Cooperative (“KPMG International”), a Swiss entity. All rights reserved. The KPMG name and logo are registered trademarks or trademarks of KPMG International. Liability limited by a scheme approved under Professional Standards Legislation.
Document Classification: KPMG Public
5
From a jurisdictional perspective, it would seem that New South Wales and Victoria are increasing their relative spend on capital compared to every other jurisdiction, with most notably Queensland spending less in FY16 than it did in FY15. However, this overly simplistic analysis fails to take into consideration several important factors, including the per capita expenditure and expenditure relative to the underlying asset base.

© 2016 KPMG, an Australian partnership and a member firm of the KPMG network of independent member firms affiliated with KPMGInternational Cooperative (“KPMG International”), a Swiss entity. All rights reserved. The KPMG name and logo are registered trademarks or trademarks of KPMG International. Liability limited by a scheme approved under Professional Standards Legislation.
Document Classification: KPMG Public
6
However, even this analysis fails to properly explain the situation, as different jurisdictions own different assets, and therefore have different capital expenditure patterns. For example, the Victorian government privatised their electricity sector assets, including generation, transmission, distribution and retail elements, in the mid- to late-1990’s, and therefore no longer incurs major public capital expenditure within this sector. However, New South Wales, which privatised its generation assets in 2013 and partially privatised some of its network businesses in 2015 and 2016, still incurs capital expenditure within this sector.
It is therefore more appropriate to consider capital expenditure in the context of the assets ‘owned’ by each jurisdiction, and those States and Territories with ‘greater’ assets in public ownership will necessarily need to spend more on capex to maintain, replace and enhance their infrastructure base that those States and Territories that have privatised public assets.
In simple terms, the public sector net capital stock grows when annual capital expenditure is greater than the amount of capital that is ‘consumed’ each year through depreciation.
On a per capita basis it appears that the smaller jurisdictions are spending relatively more than the more populous States3.
© 2017 KPMG, an Australian partnership and a member firm of the KPMG network of independent member firms affiliated with KPMGInternational Cooperative (“KPMG International”), a Swiss entity. All rights reserved. The KPMG name and logo are registered trademarks or trademarks of KPMG International. Liability limited by a scheme approved under Professional Standards Legislation.
Document Classification: KPMG Public
7
© 2017 KPMG, an Australian partnership and a member firm of the KPMG network of independent member firms affiliated with KPMGInternational Cooperative (“KPMG International”), a Swiss entity. All rights reserved. The KPMG name and logo are registered trademarks or trademarks of KPMG International. Liability limited by a scheme approved under Professional Standards Legislation.
Document Classification: KPMG Public
8
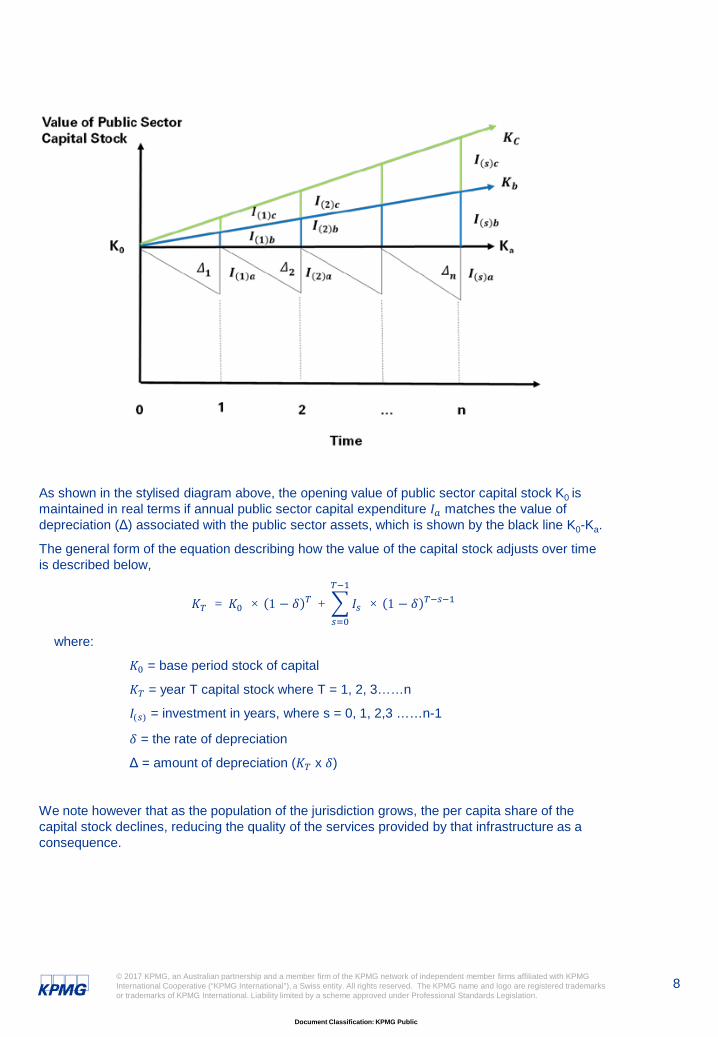
As shown in the stylised diagram above, the opening value of public sector capital stock K0 is maintained in real terms if annual public sector capital expenditure 𝐼𝐼𝑎𝑎 matches the value of depreciation (Δ) associated with the public sector assets, which is shown by the black line K0-Ka.
The general form of the equation describing how the value of the capital stock adjusts over time is described below,
𝐾𝐾𝑇𝑇 = 𝐾𝐾0 × 1 − 𝛿𝛿 𝑇𝑇 + �𝑠𝑠=0
𝑇𝑇−1
𝐼𝐼𝑠𝑠 × 1 − 𝛿𝛿 𝑇𝑇−𝑠𝑠−1
where:
𝐾𝐾0 = base period stock of capital
𝐾𝐾𝑇𝑇 = year T capital stock where T = 1, 2, 3……n
𝐼𝐼(𝑠𝑠) = investment in years, where s = 0, 1, 2,3 ……n-1
𝛿𝛿 = the rate of depreciation
Δ = amount of depreciation (𝐾𝐾𝑇𝑇 x 𝛿𝛿)
We note however that as the population of the jurisdiction grows, the per capita share of the capital stock declines, reducing the quality of the services provided by that infrastructure as a consequence.

© 2017 KPMG, an Australian partnership and a member firm of the KPMG network of independent member firms affiliated with KPMGInternational Cooperative (“KPMG International”), a Swiss entity. All rights reserved. The KPMG name and logo are registered trademarks or trademarks of KPMG International. Liability limited by a scheme approved under Professional Standards Legislation.
Document Classification: KPMG Public
9
So if the government wants to maintain the same service standard each year for its growing population it must invest not only an amount equivalent to the annual depreciation value of the base period capital stock (as shown as 𝛥𝛥1 = 𝐼𝐼 1 𝑎𝑎 in the diagram), but also an amount equivalent to the per capita capital stock for the incremental increase in the population base (𝐼𝐼 1 𝑏𝑏).
But if the goal of the government is to grow the economy at a faster rate than its population growth, then efficient expenditure on public sector capital needs to be in excess of the annual depreciation charge and incremental capex associated with population growth. That is, total public sector capital expenditure needs to be:
𝐼𝐼(𝑠𝑠) = 𝐼𝐼 𝑠𝑠 𝑎𝑎 + 𝐼𝐼 𝑠𝑠 𝑏𝑏 + 𝐼𝐼 𝑠𝑠 𝑐𝑐
Further, although it is not shown specifically within the stylised diagram, once the public sector capital stock is increased above the base stock of capital – either through additional spend to account for increased population and/or additional spend to promote economic growth – then the depreciation component of the investment equation increases in subsequent years.

© 2017 KPMG, an Australian partnership and a member firm of the KPMG network of independent member firms affiliated with KPMGInternational Cooperative (“KPMG International”), a Swiss entity. All rights reserved. The KPMG name and logo are registered trademarks or trademarks of KPMG International. Liability limited by a scheme approved under Professional Standards Legislation.
Document Classification: KPMG Public
10
By comparing annual public sector expenditure (sourced from ABS National Accounts: State Accounts data, cat. 5220.0) against the value of non-financial assets for each state and territory (sourced from ABS Government Finance Statistics, cat. 5512.0) it is possible to calculate a proxy Investment/Capital ratio for the government sector in Australia4.
Annual depreciation is presented for each jurisdiction within their respective Operating Statement’s, with most States and Territories incurring a depreciation charge over the past decade equivalent to between 2.0 percent and 2.5 percent, although the Northern Territory and the Commonwealth Government incurred higher average depreciation at 3.1 percent and 5.7 percent respectively. These higher rates possibly reflect a greater rate of asset consumption, the cause of which will vary. For example, the higher depreciation charge in the Northern Territory is most likely due to harsh environmental factors that consume assets at a faster rate than is the case in more moderate climates, while for the Commonwealth the higher depreciation charge probably reflects the atypical type of assets purchased and consumed (or destroyed), such as those acquired for defence purposes.

© 2017 KPMG, an Australian partnership and a member firm of the KPMG network of independent member firms affiliated with KPMGInternational Cooperative (“KPMG International”), a Swiss entity. All rights reserved. The KPMG name and logo are registered trademarks or trademarks of KPMG International. Liability limited by a scheme approved under Professional Standards Legislation.
Document Classification: KPMG Public
11
Chart 5 above shows public sector capital stock is ‘consumed’ at a rate of about 2.5 percent per annum, and so public sector investment expenditure equivalent to 2.5 percent of the asset base is required each year just to ‘stand still’. This means we need to spend about $40 billion on public sector assets each year just to maintain the operational functionality of Australia’s $1.7 trillion public sector asset base.
While a capital spend equivalent to depreciation maintains the ‘status quo’, it does nothing to help grow the economy and enable improvements in productivity through the provision of infrastructure and other public goods. In equilibrium, the public sector net capital stock should be growing at a rate equivalent to the target rate of economic growth across the whole economy.
That is, if the government is wanting to support real growth in the Australian economy of around 3 percent per annum, then the public sector capital stock should also be growing at a similar rate, otherwise the ‘normal’ degradation of the public sector asset base will act as a drag on the economy.
© 2017 KPMG, an Australian partnership and a member firm of the KPMG network of independent member firms affiliated with KPMGInternational Cooperative (“KPMG International”), a Swiss entity. All rights reserved. The KPMG name and logo are registered trademarks or trademarks of KPMG International. Liability limited by a scheme approved under Professional Standards Legislation.
Document Classification: KPMG Public
12
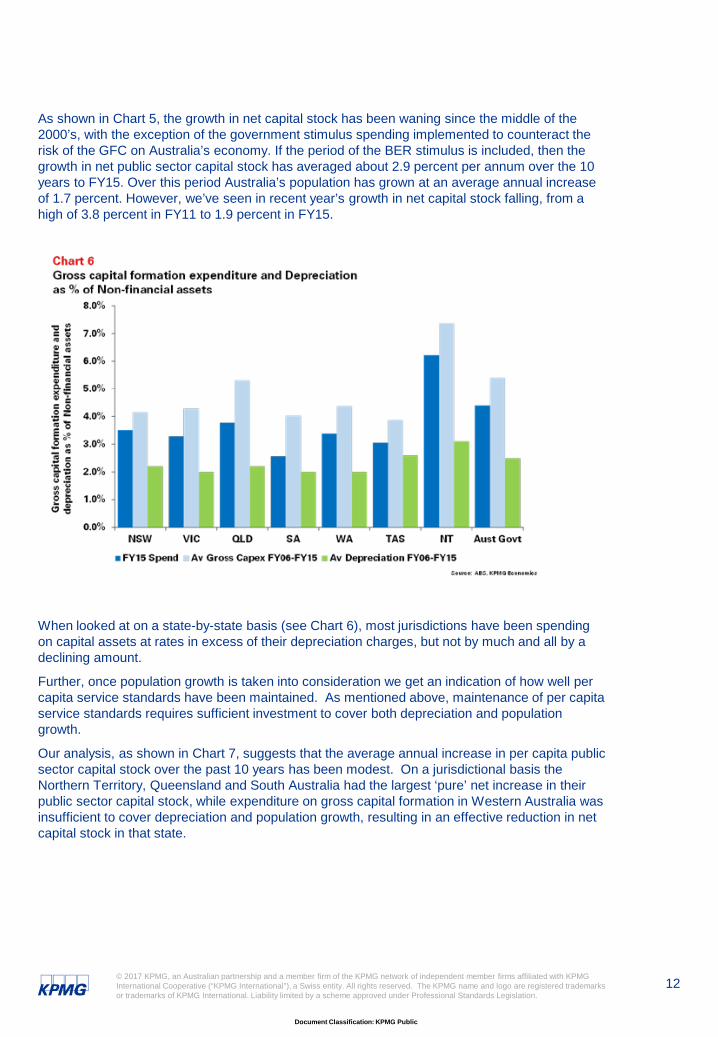
As shown in Chart 5, the growth in net capital stock has been waning since the middle of the 2000’s, with the exception of the government stimulus spending implemented to counteract the risk of the GFC on Australia’s economy. If the period of the BER stimulus is included, then the growth in net public sector capital stock has averaged about 2.9 percent per annum over the 10 years to FY15. Over this period Australia’s population has grown at an average annual increase of 1.7 percent. However, we’ve seen in recent year’s growth in net capital stock falling, from a high of 3.8 percent in FY11 to 1.9 percent in FY15.
When looked at on a state-by-state basis (see Chart 6), most jurisdictions have been spending on capital assets at rates in excess of their depreciation charges, but not by much and all by a declining amount.
Further, once population growth is taken into consideration we get an indication of how well per capita service standards have been maintained. As mentioned above, maintenance of per capita service standards requires sufficient investment to cover both depreciation and population growth.
Our analysis, as shown in Chart 7, suggests that the average annual increase in per capita public sector capital stock over the past 10 years has been modest. On a jurisdictional basis the Northern Territory, Queensland and South Australia had the largest ‘pure’ net increase in their public sector capital stock, while expenditure on gross capital formation in Western Australia was insufficient to cover depreciation and population growth, resulting in an effective reduction in net capital stock in that state.

© 2017 KPMG, an Australian partnership and a member firm of the KPMG network of independent member firms affiliated with KPMGInternational Cooperative (“KPMG International”), a Swiss entity. All rights reserved. The KPMG name and logo are registered trademarks or trademarks of KPMG International. Liability limited by a scheme approved under Professional Standards Legislation.
Document Classification: KPMG Public
13
While earlier in this report we highlighted New South Wales and Victoria as spending proportionally more on gross capital formation relative to other States and Territories, most of this expenditure was necessary just to cover depreciation and population growth, resulting in only a minor increase in each jurisdictions net capital stock per capita over the past decade.
So based on this analysis it would appear that the proposition that Australia needs more infrastructure is correct. With the exception of the Northern Territory, no jurisdiction individually or Australia in aggregate, grew their public sector net capital stock on a per capita basis, after accounting for depreciation, at an average annual rate either equal to, or more than, the long run economic growth rate of the nation. Simply put, governments have not invested in sufficient infrastructure over the past decade to support an economic growth rate much above population growth, let alone that recorded by Australia in history.
To remedy this KPMG recommend the minimum level of efficient public sector capital expenditure should be between 5.5 percent and 6.0 percent of the value of non-financial public sector assets on average over the longer term.
If this investment target was achieved for FY16 then gross capital expenditure by the public sector in Australia would have amounted to between $95 billion and $105 billion, based on the current $1.7 trillion value of non-financial public sector assets. However, given gross fixed capital formation amounted to only about $75 billion in FY16, current investment by governments in Australia is insufficient and should be raised by between 25 percent and 40 percent to ensure economically enhancing public good assets and other enabling infrastructure are being delivered in a timely manner.
© 2017 KPMG, an Australian partnership and a member firm of the KPMG network of independent member firms affiliated with KPMGInternational Cooperative (“KPMG International”), a Swiss entity. All rights reserved. The KPMG name and logo are registered trademarks or trademarks of KPMG International. Liability limited by a scheme approved under Professional Standards Legislation.
Document Classification: KPMG Public
14
Endnotes
1. See ABS cat no. 5220.0, Australian National Accounts: State Accounts, Table 10
2. See ABS cat no. 5220.0, Australian National Accounts: State Accounts, Tables 2 – 9
3. Uses Estimated Resident Population data, ABS cat no. 3101.0, Australian Demographic Statistics, Table 4
4. See ABS cat no. 5512.0, Government Finance Statistics, Australia, Tables 190, 592 – 597, 999
Document Classification: KPMG Confidential
kpmg.com.au
© 2017 KPMG, an Australian partnership and a member firm of the KPMG network of independent member firms affiliated with KPMG International Cooperative (“KPMG International”), a Swiss entity. All rights reserved.
The KPMG name and logo are registered trademarks or trademarks of KPMG International.
Liability limited by a scheme approved under Professional Standards Legislation.
The information contained in this document is of a general nature and is not intended to address the objectives, financial situation or needs of any particular individual or entity. It is provided for information purposes only and does not constitute, nor should it be regarded in any manner whatsoever, as advice and is not intended to influence a person in making a decision, including, if applicable, in relation to any financial product or an interest in a financial product. Although we endeavour to provide accurate and timely information, there can be no guarantee that such information is accurate as of the date it is received or that it will continue to be accurate in the future. No one should act on such information without appropriate professional advice after a thorough examination of the particular situation.
To the extent permissible by law, KPMG and its associated entities shall not be liable for any errors, omissions, defects or misrepresentations in the information or for any loss or damage suffered by persons who use or rely on such information (including for reasons of negligence, negligent misstatement or otherwise).
Contact UsBrendan RynnePartner, Chief EconomistKPMG Australia
T: 03 9288 5780E: [email protected]