public hearing to consider advanced clean cars program · public hearing to consider advanced clean...
TRANSCRIPT
Los Angeles, CaliforniaJanuary 26th, 2012
Public Hearing to Consider Advanced Clean Cars
Program
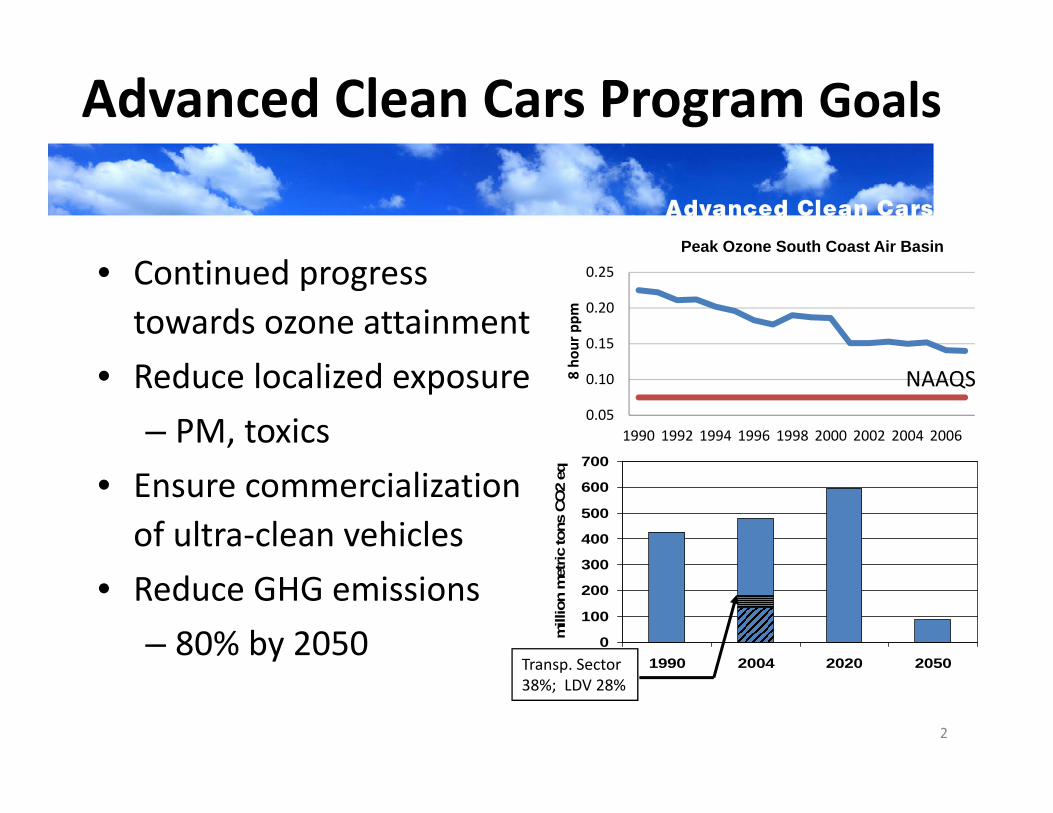
Advanced Clean Cars Program Goals
• Continued progress towards ozone attainment
• Reduce localized exposure– PM, toxics
• Ensure commercialization of ultra‐clean vehicles
• Reduce GHG emissions– 80% by 2050
2
0
100
200
300
400
500
600
700
1990 2004 2020 2050
mill
ion
met
ric to
ns C
O2
eq
Transp. Sector 38%; LDV 28%
0.05
0.10
0.15
0.20
0.25
1990 1992 1994 1996 1998 2000 2002 2004 2006
8 ho
ur ppm
Peak Ozone South Coast Air Basin
NAAQS
Advanced Clean Cars
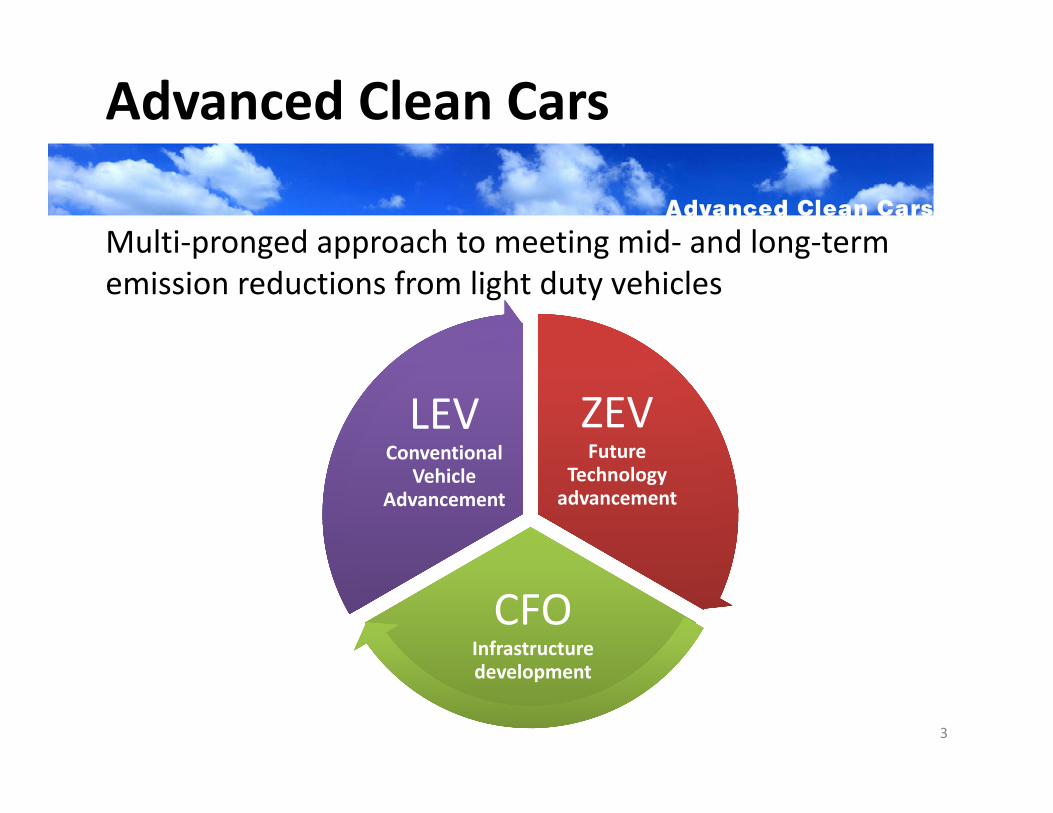
Multi‐pronged approach to meeting mid‐ and long‐term emission reductions from light duty vehicles
3
ZEVFuture
Technology advancement
ZEVFuture
Technology advancement
CFOInfrastructure development
CFOInfrastructure development
LEVConventional
VehicleAdvancement
LEVConventional
VehicleAdvancement
Advanced Clean Cars Program – CEQA
• Staff prepared a programmatic integrated environmental analysis in accordance with ARB’s certified regulatory program under the California Environmental Quality Act
• Environmental analysis included in ISORs as Appendix B • Analyzed proposed regulations’ effects on the
environment– Based on regulated community compliance responses – Beneficial air quality impacts – Potential adverse impacts to aesthetics, biology, cultural, hazards,
hydrology, noise, transportation/traffic related to construction activities
• Feasible mitigation identified • Alternatives analyzed
4
Outreach
• 10 public workshops beginning in early 2010
• Multiple meetings with stakeholders
• 3 Community Meetings in July 2011– A panel of experts provided a local perspective and expert information on air pollution, climate change, and transportation
5
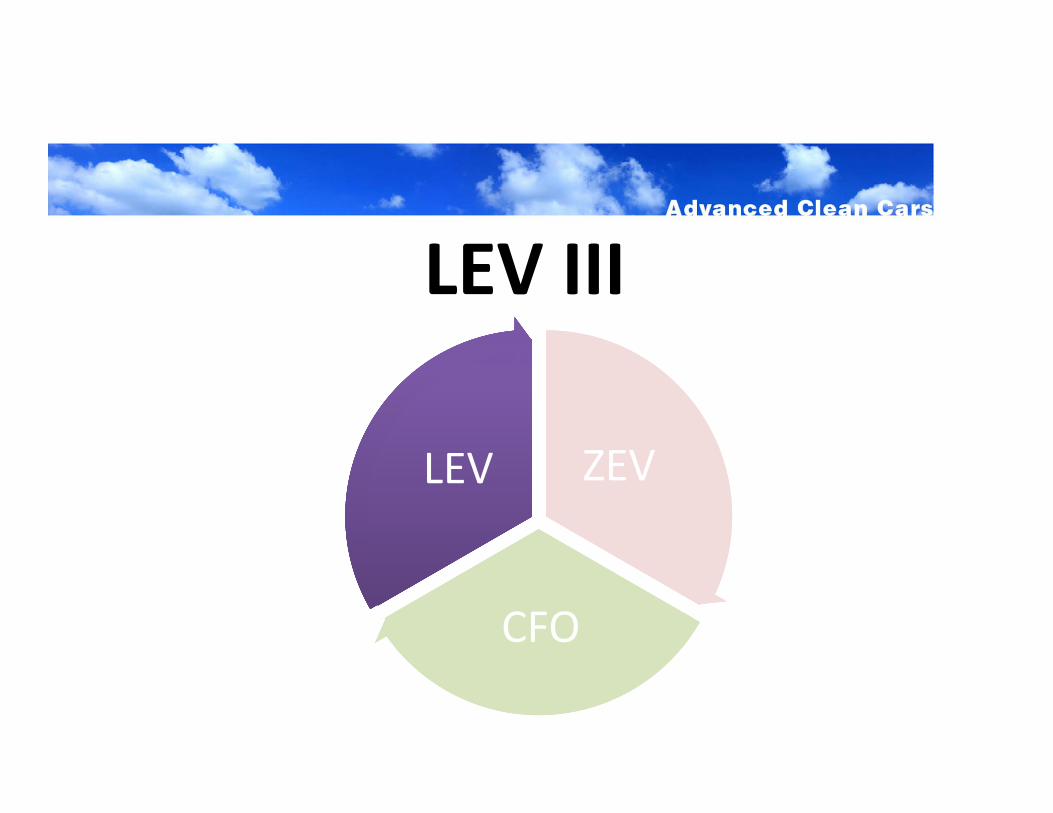
LEV III
ZEVZEV
CFOCFO
LEVLEV
LEV III: Meeting Air Quality Standards
• LEV III regulations continue emission reductions for all new vehicles– More stringent standards – by 70% – for smog and soot
pollutants
0.00
0.05
0.10
0.15
0.20
0.25
0.30
0.35
0.40
0.45
1994 1999 2004 2010
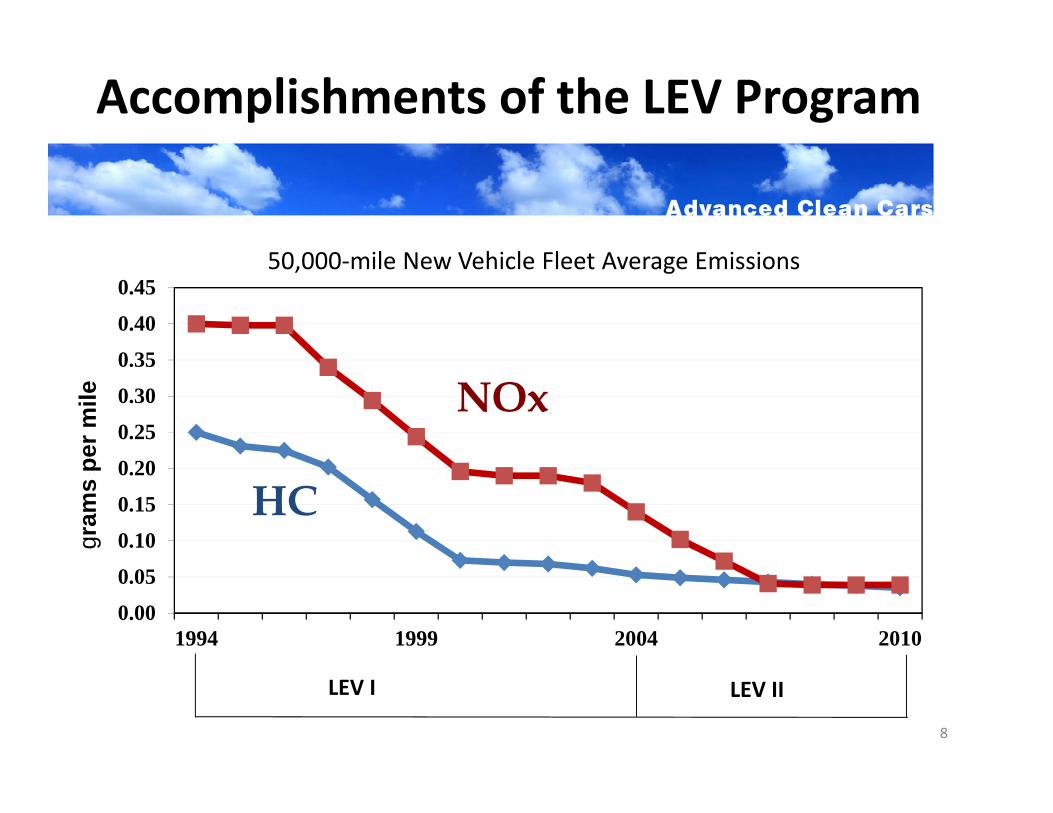
50,000‐mile New Vehicle Fleet Average Emissions
Accomplishments of the LEV Program
HC
NOx
gram
s pe
r mile
LEV I LEV II
8
Proposed Revisions to LEV Program
• Phase‐in 2015‐2025• Combined, increasingly stringent NMOG and NOx standards
• Increase durability requirement to 150,000 miles
• Emissions pooling
9
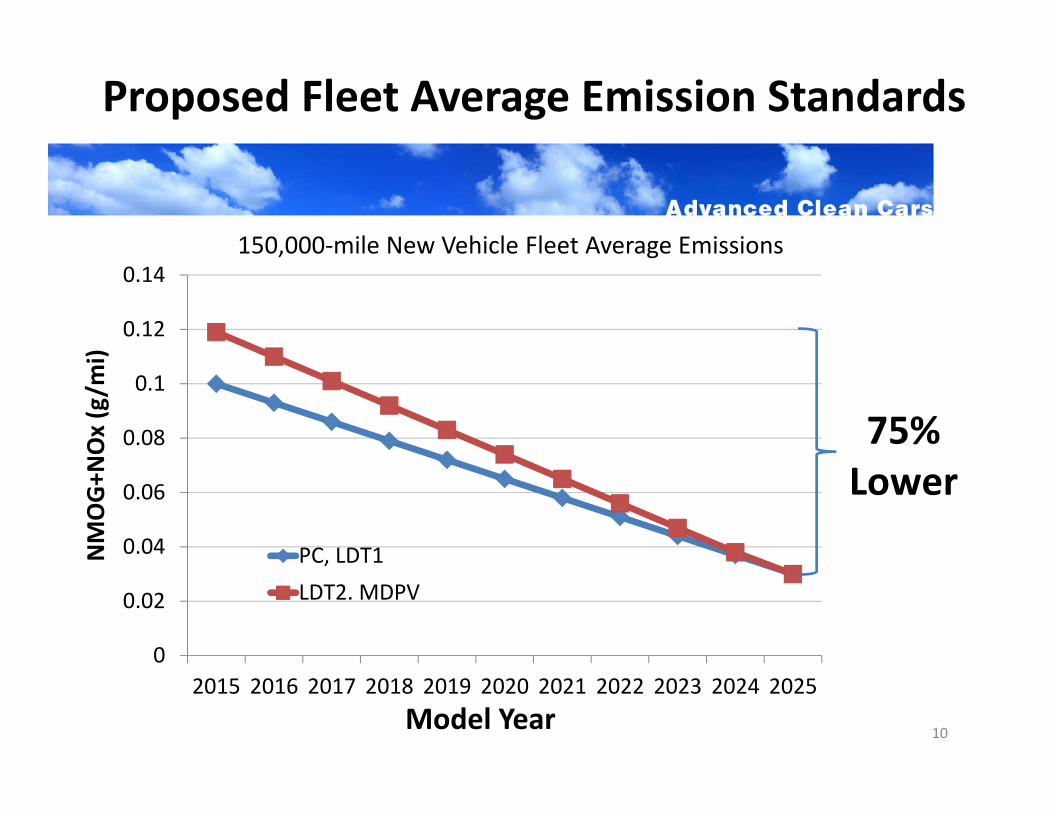
Proposed Fleet Average Emission Standards
0
0.02
0.04
0.06
0.08
0.1
0.12
0.14
2015 2016 2017 2018 2019 2020 2021 2022 2023 2024 2025
PC, LDT1LDT2. MDPV
75%Lower
10Model Year
NMOG+N
Ox(g/m
i)
150,000‐mile New Vehicle Fleet Average Emissions
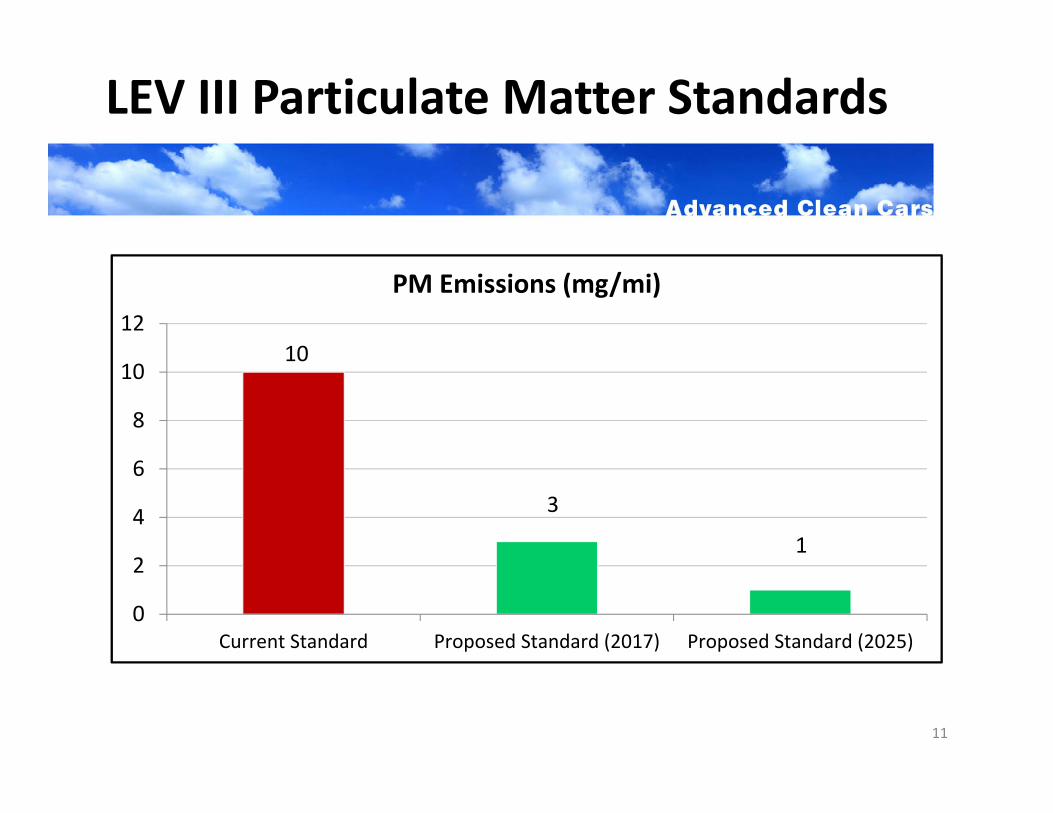
LEV III Particulate Matter Standards
11
10
3
1
0
2
4
6
8
10
12
Current Standard Proposed Standard (2017) Proposed Standard (2025)
PM Emissions (mg/mi)
Supplemental Federal Test Procedure
• Increase stringency of standards for ULEVs and SULEVs
• Extend SFTP applicability to MDVs (8,501 lbs. – 14,000 lbs. GVWR)
• Require a SULEV‐equivalent fleet average by 2025
• Increase durability requirement 150,000 miles
• New PM emission standards
12
Evaporative Emissions
• Extend zero‐evaporative emission requirements currently in place for PZEVs to the entire light‐duty vehicle fleet by MY 2022
• Added flexibility with two compliance options
• Extend Onboard Refueling Vapor Recovery (ORVR) requirements to all complete vehicles less than 14,000 pounds GVWR
13
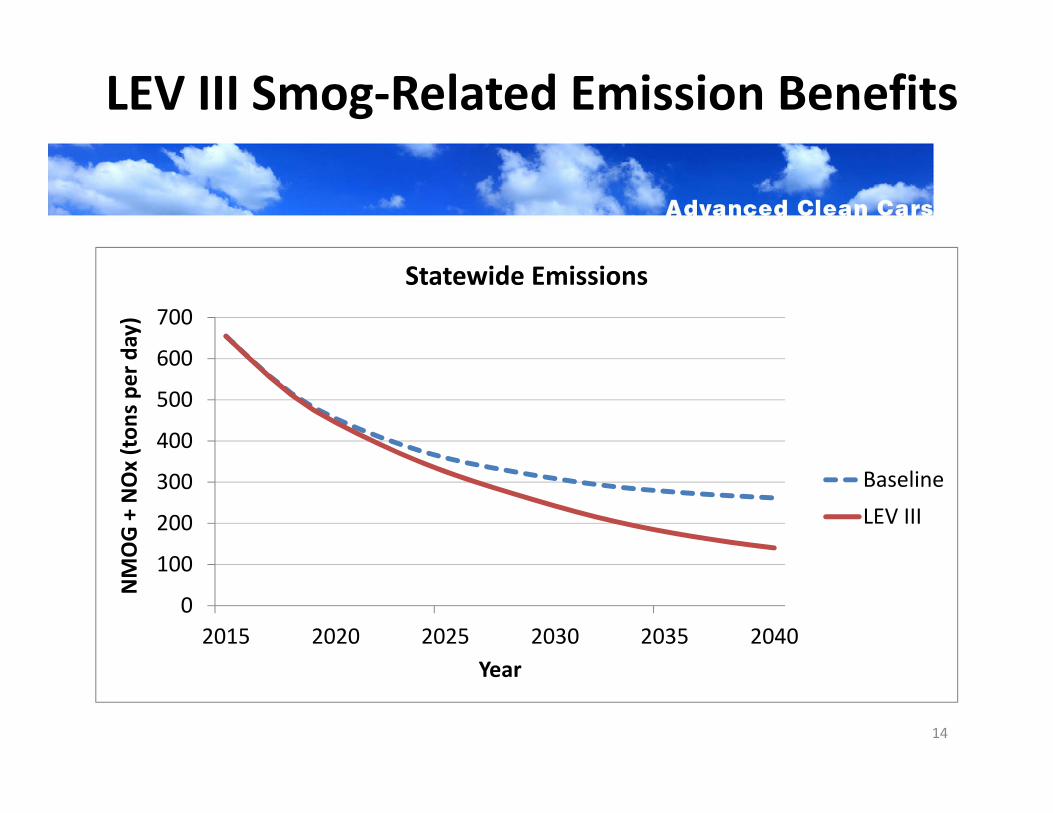
LEV III Smog‐Related Emission Benefits
0
100
200
300
400
500
600
700
2015 2020 2025 2030 2035 2040
NMOG + NOx(ton
s pe
r day)
Year
Statewide Emissions
BaselineLEV III
14
Other LEV III Amendments
• Minor amendments to the On‐Board Diagnostics regulations for the 2013 Model Year
• Changes to the specifications for certification gasoline to reflect current commercial gasoline.
15
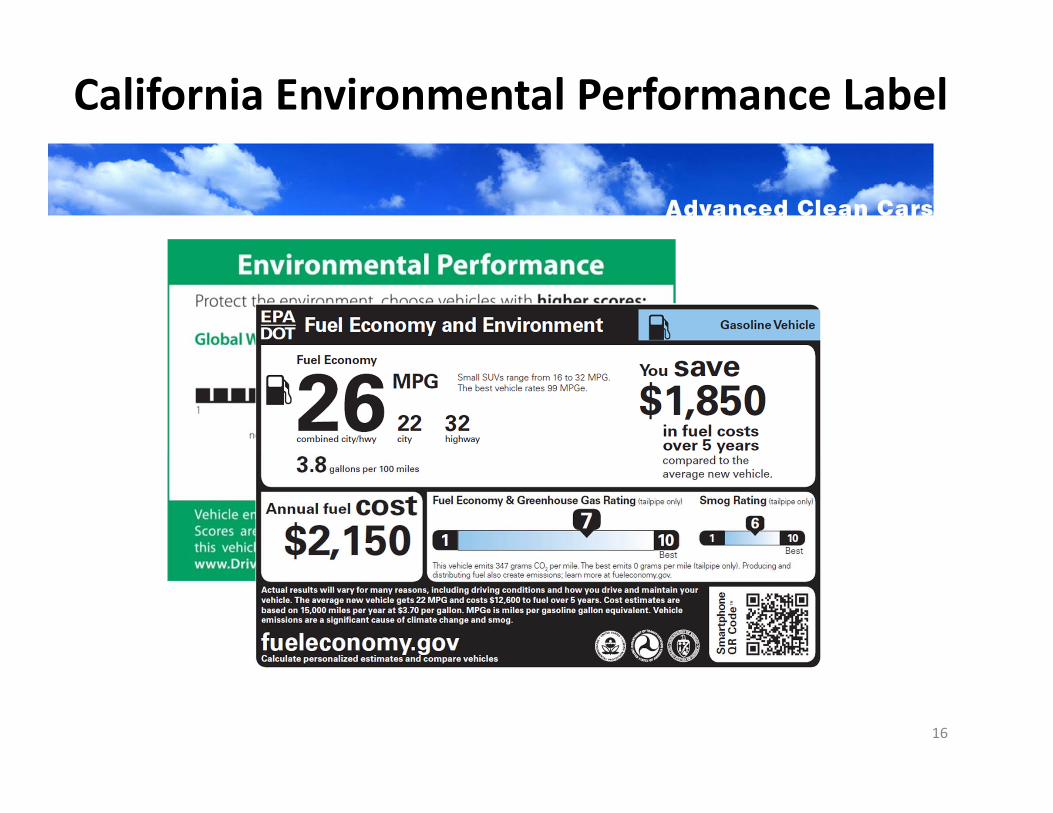
California Environmental Performance Label
16
LEV III: Reducing Greenhouse Gas Emissions
• LEV III regulations continue emission reductions for all new vehicles ‐ Greenhouse gas (GHG) standards reduce climate
emissions by 34%
18
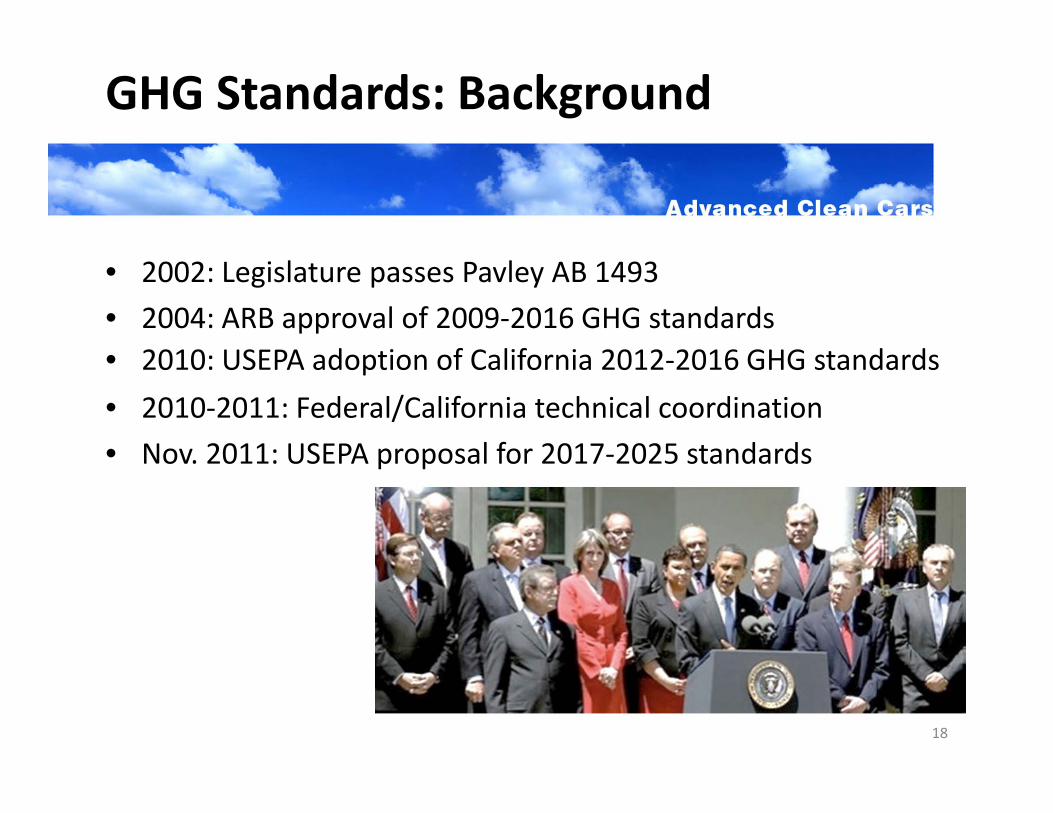
GHG Standards: Background
• 2002: Legislature passes Pavley AB 1493• 2004: ARB approval of 2009‐2016 GHG standards• 2010: USEPA adoption of California 2012‐2016 GHG standards• 2010‐2011: Federal/California technical coordination• Nov. 2011: USEPA proposal for 2017‐2025 standards
19
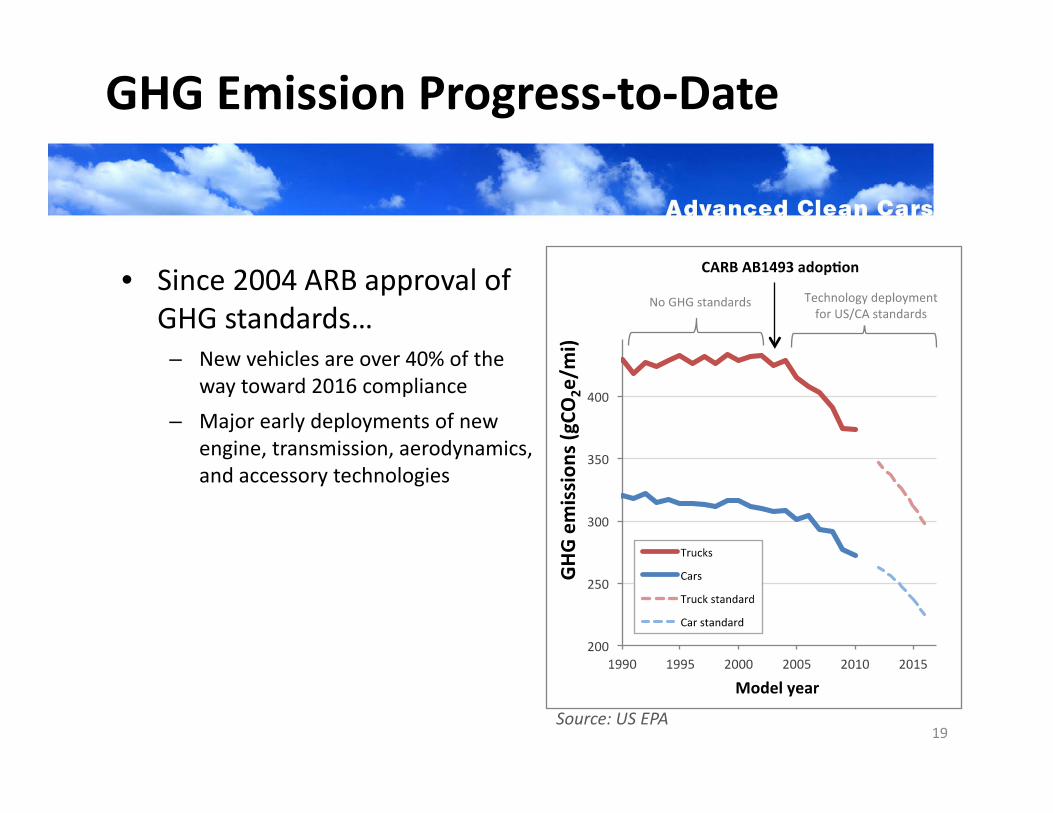
GHG Emission Progress‐to‐Date
• Since 2004 ARB approval of GHG standards…– New vehicles are over 40% of the
way toward 2016 compliance– Major early deployments of new
engine, transmission, aerodynamics, and accessory technologies
Source: US EPA
100
150
200
250
300
350
2010 2015 2020 2025
GHG emission
s (gCO
2e/m
i)
Model year
Truck Combined light duty Car
Previous rule Proposed rulemaking
20
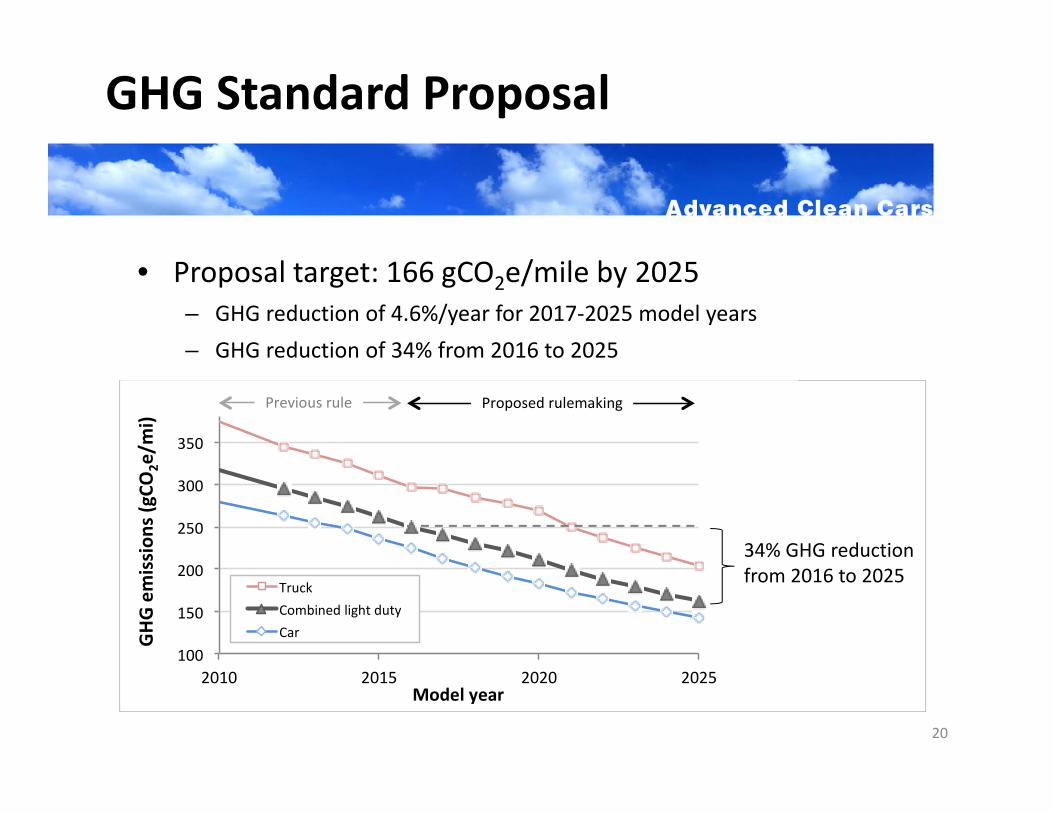
GHG Standard Proposal
• Proposal target: 166 gCO2e/mile by 2025– GHG reduction of 4.6%/year for 2017‐2025 model years– GHG reduction of 34% from 2016 to 2025
34% GHG reduction from 2016 to 2025
100
150
200
250
300
350
35 40 45 50 55 60
GHG emission
(gCO
2e/m
i)
Vehicle footprint ( 2)
21
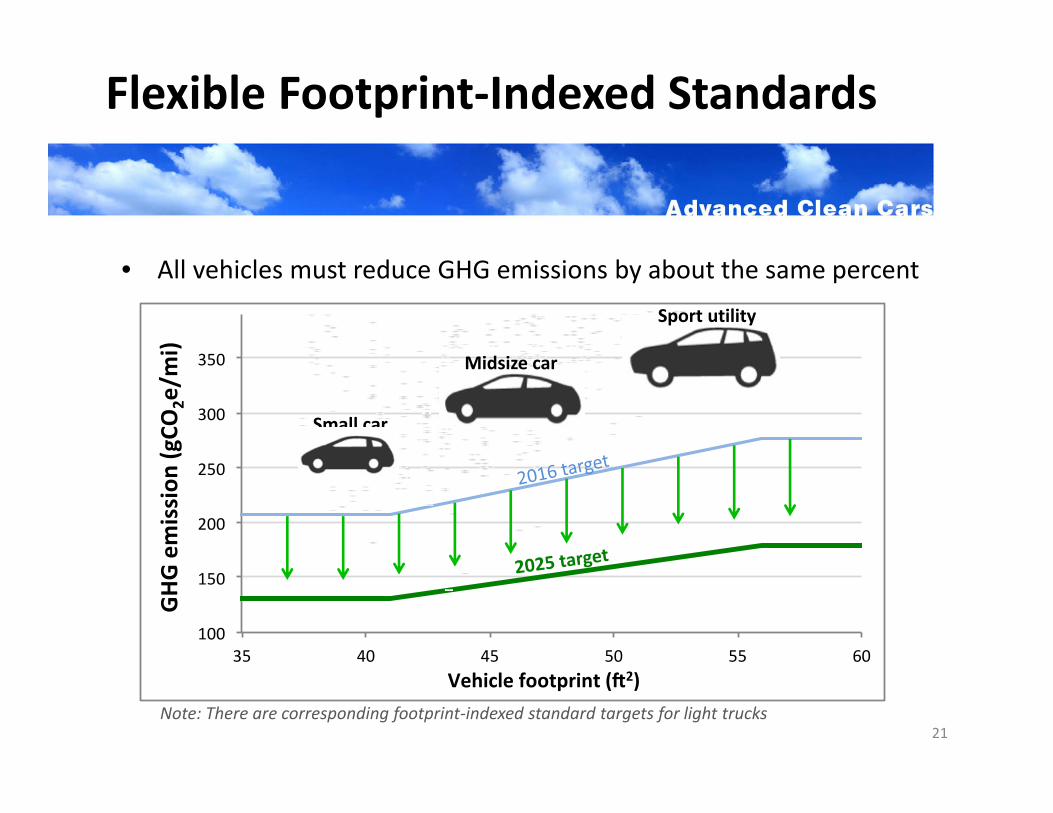
Flexible Footprint‐Indexed Standards
• All vehicles must reduce GHG emissions by about the same percent
Note: There are corresponding footprint‐indexed standard targets for light trucks
Small car
Midsize car
Sport utility
22
Flexibility Preserves Vehicle Choice
• Company sales‐weighted averaging• Footprint‐indexed targets• Separate car and truck standards• Credit banking (5‐year carryforward, 3‐year carryback)• Technology‐specific credit opportunities
0%
20%
40%
60%
80%
100%
2010 2015 2020 2025
New
veh
icles of each techno
logy ty
pe
Model year
Conven onal
Advanced Low‐GHG
Conven onal Vehicles
ZEV
23
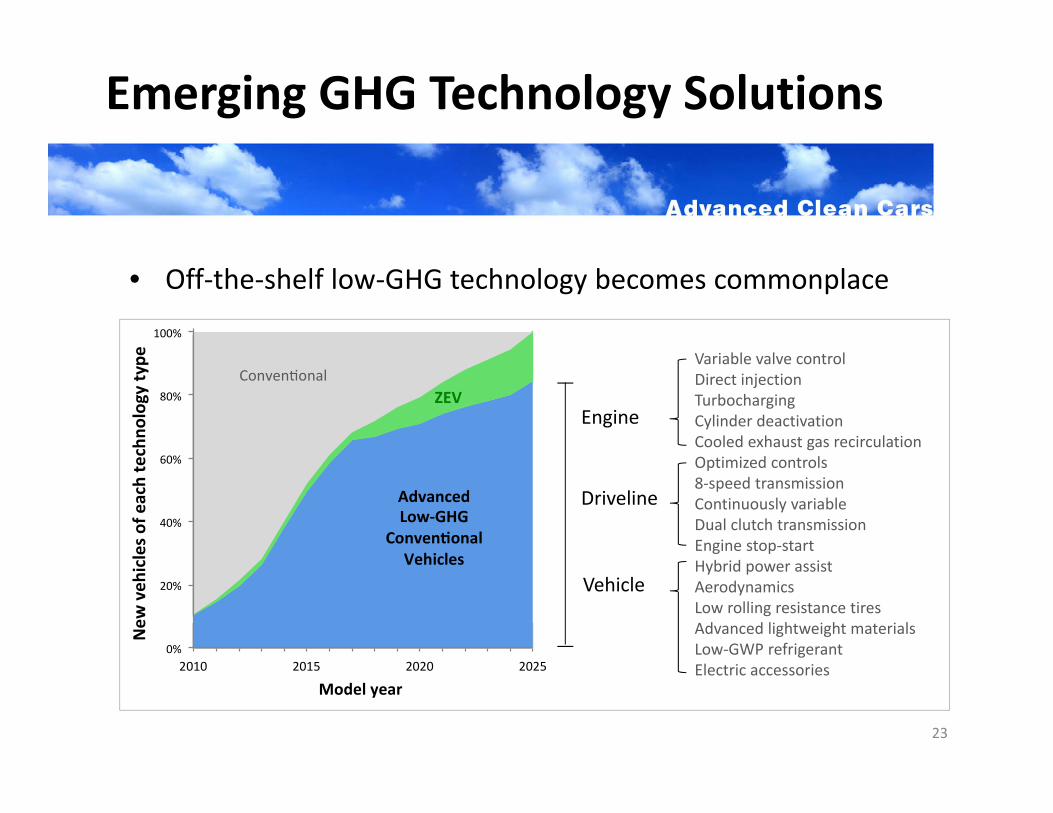
Emerging GHG Technology Solutions
• Off‐the‐shelf low‐GHG technology becomes commonplace
Variable valve controlDirect injectionTurbochargingCylinder deactivationCooled exhaust gas recirculationOptimized controls8‐speed transmissionContinuously variableDual clutch transmissionEngine stop‐startHybrid power assistAerodynamicsLow rolling resistance tiresAdvanced lightweight materialsLow‐GWP refrigerantElectric accessories
Engine
Driveline
Vehicle
24
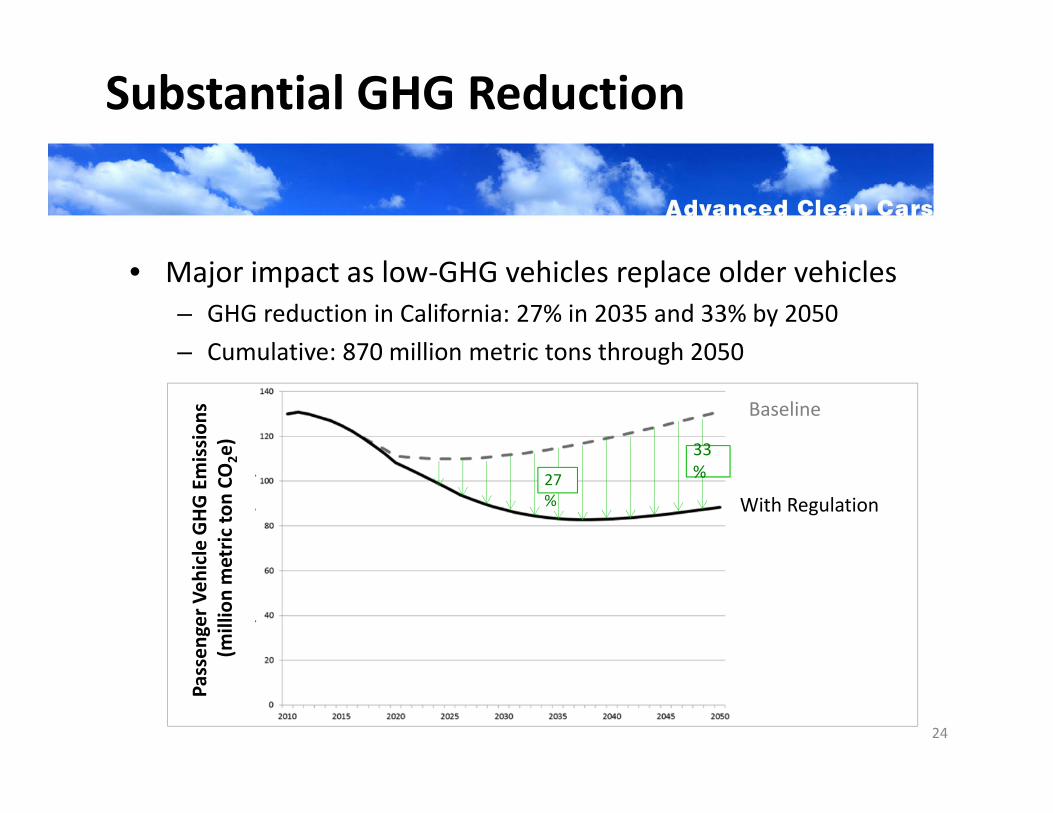
Substantial GHG Reduction
• Major impact as low‐GHG vehicles replace older vehicles– GHG reduction in California: 27% in 2035 and 33% by 2050– Cumulative: 870 million metric tons through 2050
Baseline
With Regulation
Passen
ger V
ehicle GHG Emission
s (m
illion metric
ton CO
2e)
27%
33%
25
Federal Coordination
• ARB rulemaking has paralleled federal regulation timing• “Deemed to comply” provision
– ARB intends to deem compliance with US EPA GHG regulation as sufficient for ARB GHG regulation compliance, provided the final federal standards are substantially similar
• Mid‐Term Review– ARB intends to participate in the federal agencies’ “Mid‐
Term Review” to review standards for model years 2022‐2025 (that is to be completed by April 2018).
26
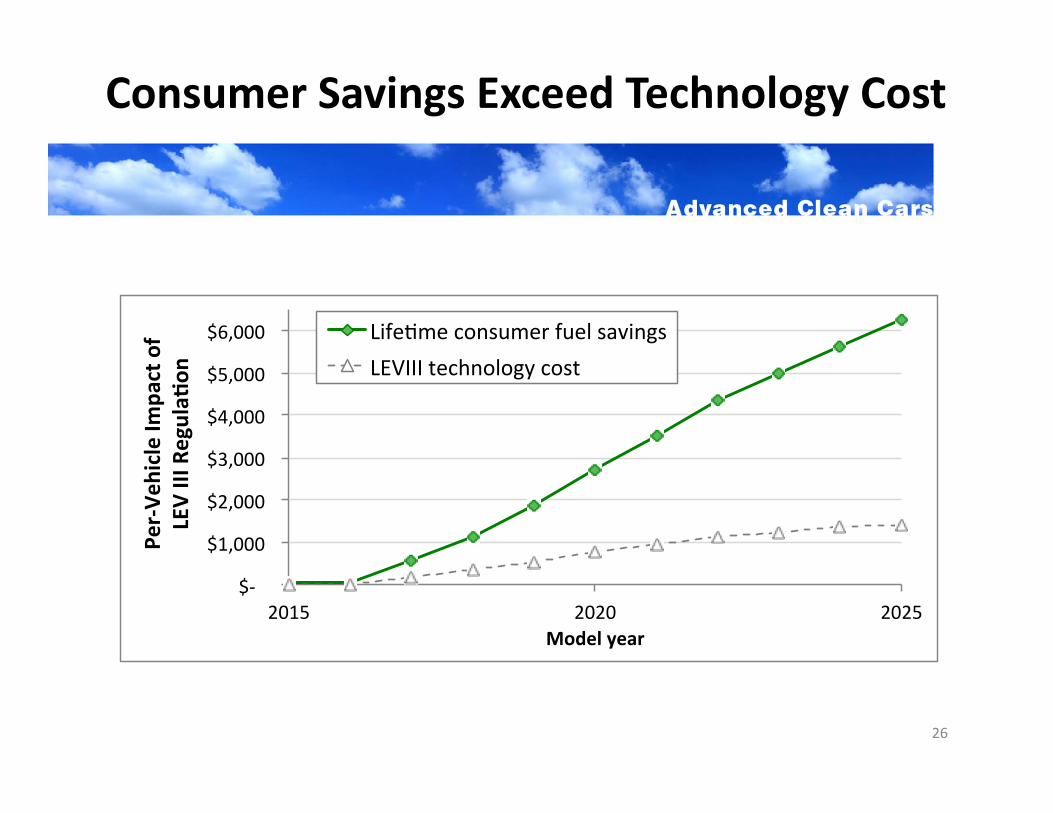
Consumer Savings Exceed Technology Cost
$‐
$1,000
$2,000
$3,000
$4,000
$5,000
$6,000
2015 2020 2025
Per‐Ve
hicle Im
pact of
LEV III Regula
on
Model year
Life me consumer fuel savings LEVIII technology cost
LEV III Regulation Summary
• Achieves maximum feasible and cost‐effective emission reductions
• Accelerates transition to a cleaner fleet of California vehicles• Provides manufacturers with lead time and flexibility• Staff recommends Board adopt LEV III regulation as proposed
27
ZEV
28
ZEVZEV
CFOCFO
LEVLEV
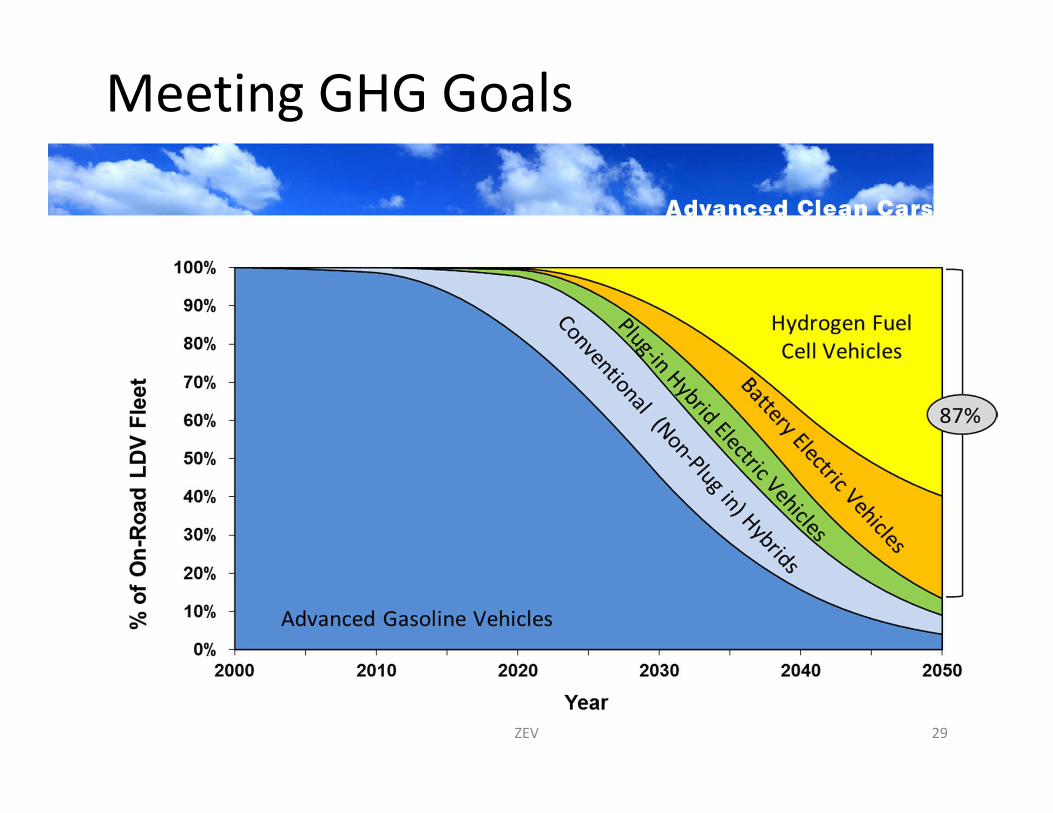
Meeting GHG Goals
ZEV 29
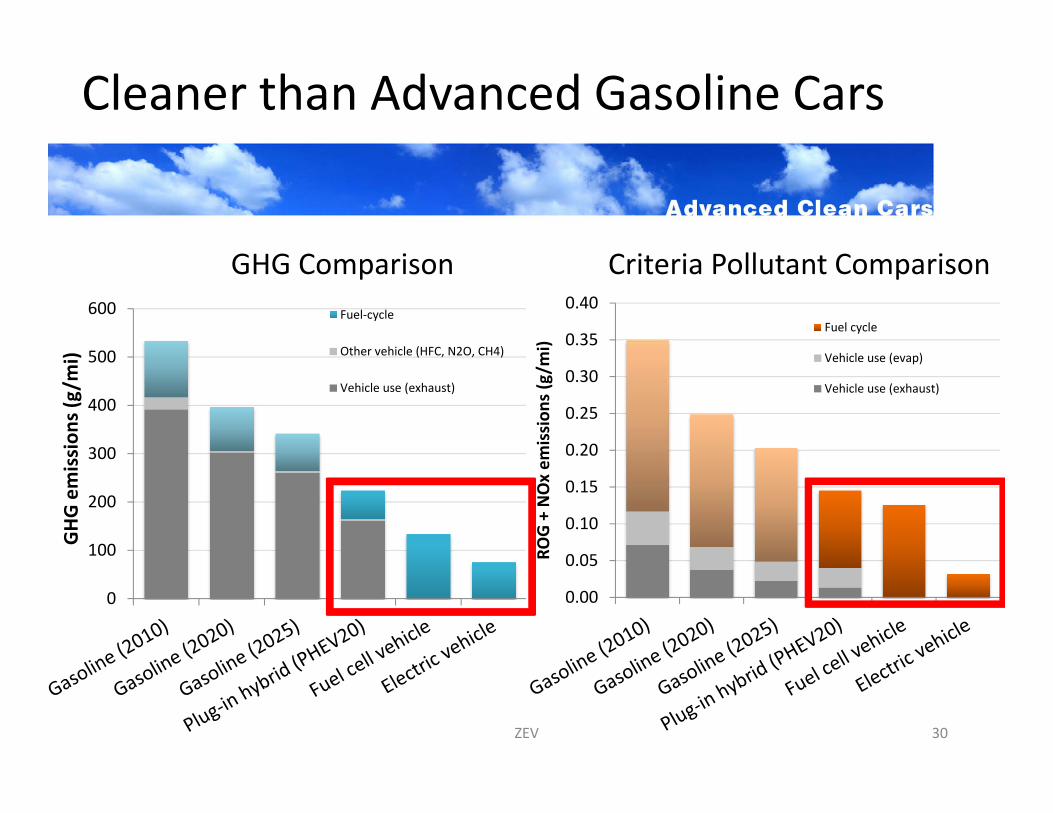
0
100
200
300
400
500
600
GHG emission
s (g/mi)
Fuel‐cycle
Other vehicle (HFC, N2O, CH4)
Vehicle use (exhaust)
Cleaner than Advanced Gasoline Cars
GHG Comparison Criteria Pollutant Comparison
ZEV
0.00
0.05
0.10
0.15
0.20
0.25
0.30
0.35
0.40
ROG + NOx em
ission
s (g/m
i)
Fuel cycle
Vehicle use (evap)
Vehicle use (exhaust)
30
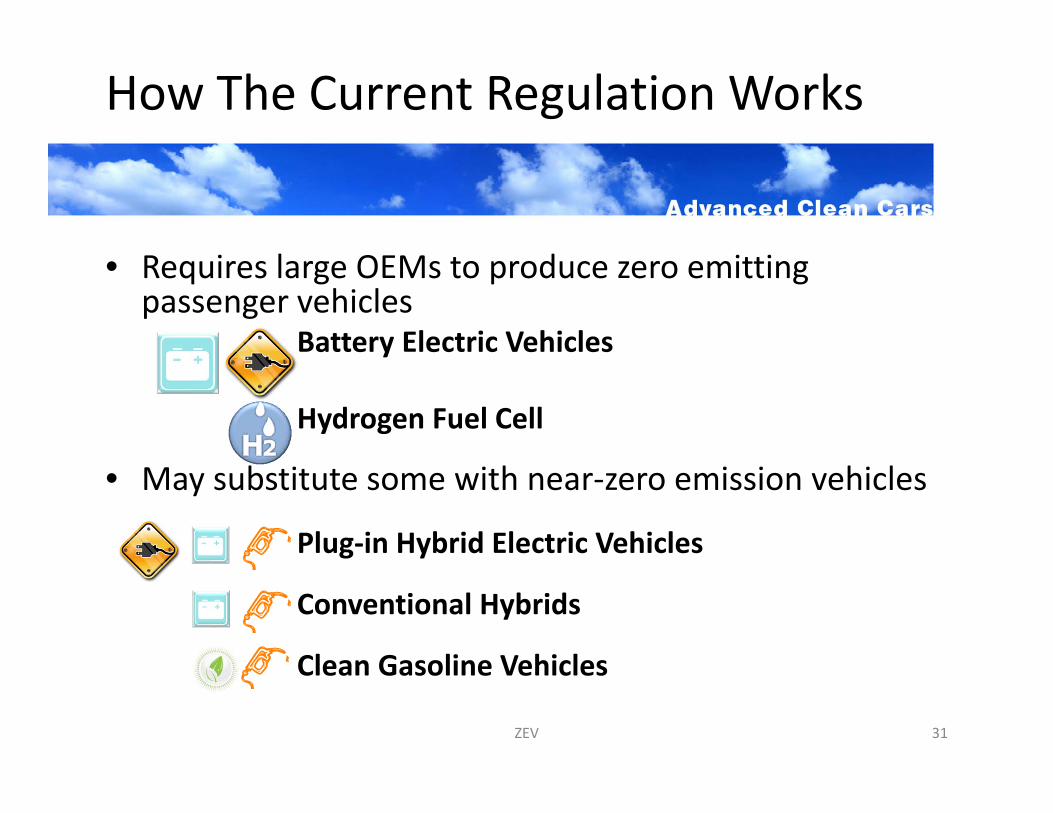
How The Current Regulation Works
• Requires large OEMs to produce zero emitting passenger vehicles
Battery Electric Vehicles
Hydrogen Fuel Cell
• May substitute some with near‐zero emission vehicles
Plug‐in Hybrid Electric Vehicles
Conventional Hybrids
Clean Gasoline Vehicles
ZEV 31
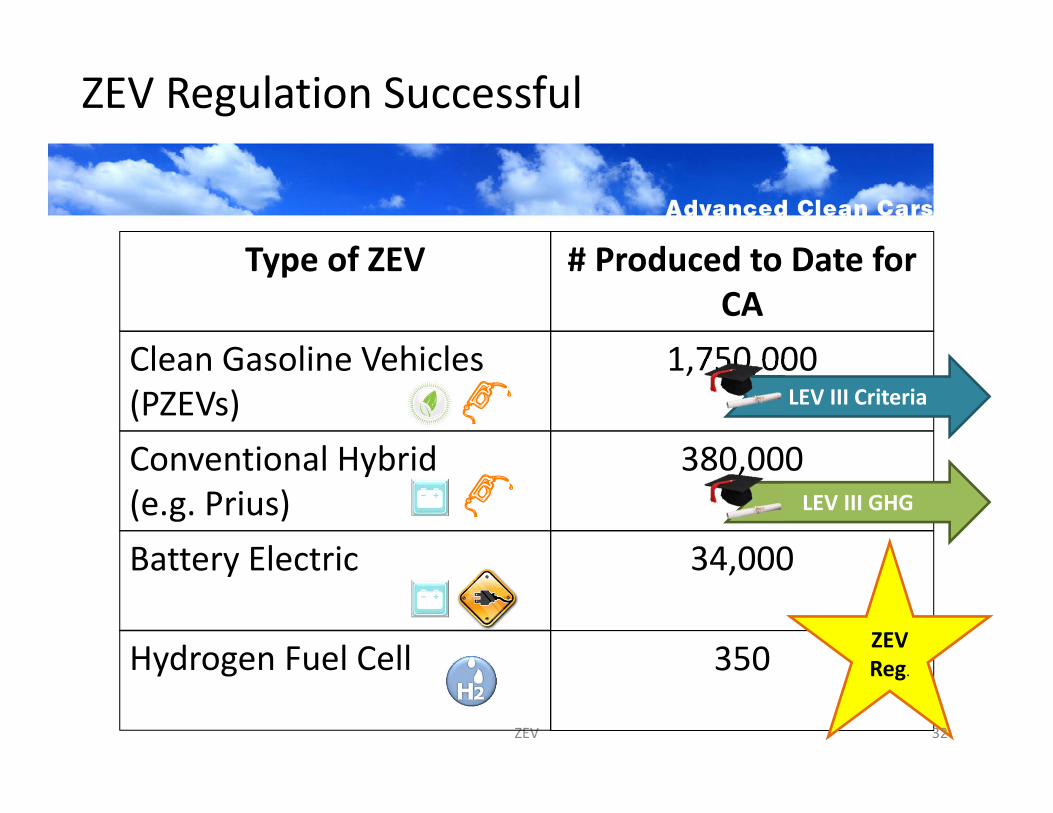
ZEV Regulation Successful
ZEV
Battery Electric
Hydrogen Fuel Cell
Conventional Hybrid (e.g. Prius)
Clean Gasoline Vehicles (PZEVs)
Type of ZEV # Produced to Date for CA
1,750,000
380,000
34,000
350
LEV III Criteria
ZEV Reg.
LEV III GHG
32
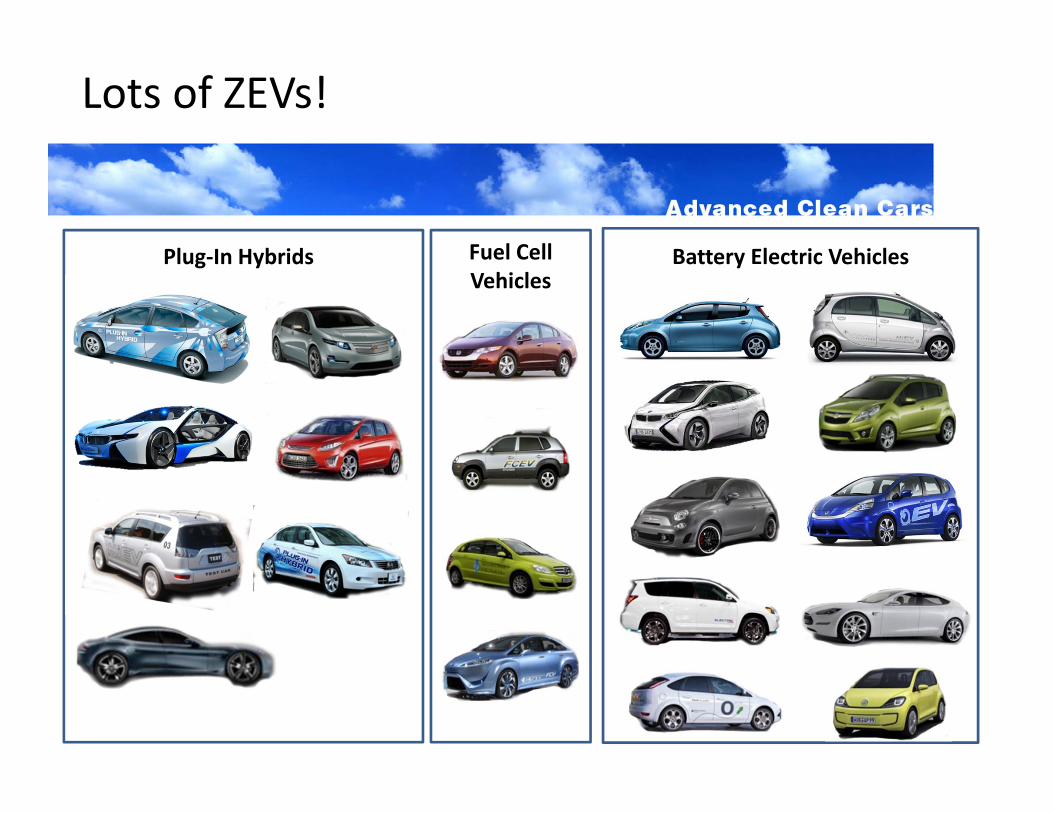
Fuel Cell Vehicles
Battery Electric VehiclesPlug‐In Hybrids
Lots of ZEVs!
Summary of Staff’s Proposal
• Increase ZEV requirement• Include more manufacturers• Amend ZEV Credits• Amend PHEV Credits• Added Flexibility
34
‐
50,000
100,000
150,000
200,000
250,000
2015 2016 2017 2018 2019 2020 2021 2022 2023 2024 2025
Annu
al ZEV
s
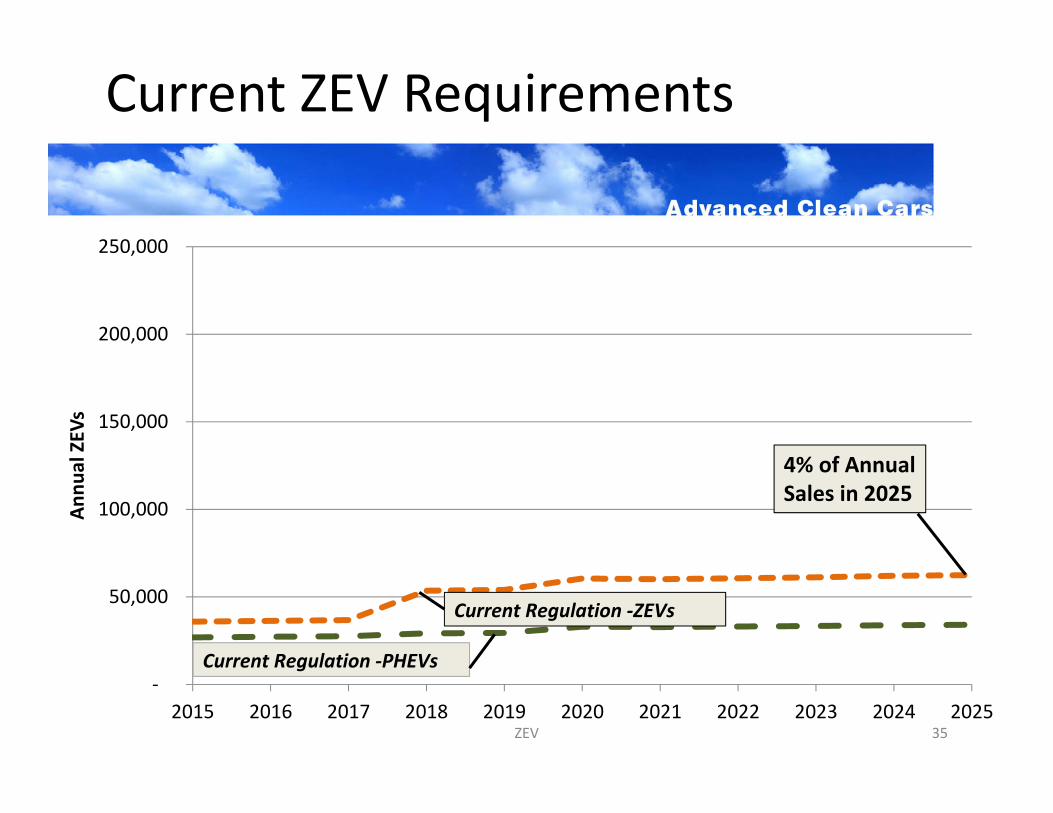
Current Regulation ‐ZEVs
Current Regulation ‐PHEVs
Current ZEV Requirements
ZEV
4% of Annual Sales in 2025
35
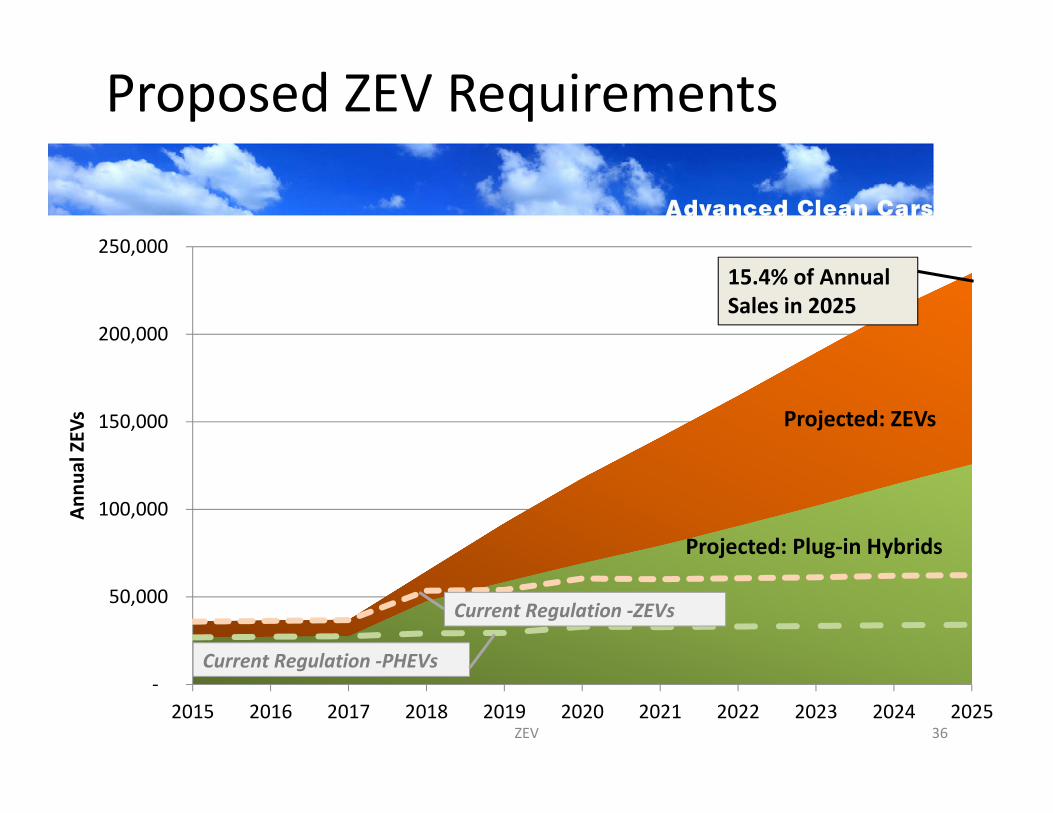
Proposed ZEV Requirements
ZEV
‐
50,000
100,000
150,000
200,000
250,000
2015 2016 2017 2018 2019 2020 2021 2022 2023 2024 2025
Annu
al ZEV
s
Current Regulation ‐ZEVs
Current Regulation ‐PHEVs
Projected: Plug‐in Hybrids
Projected: ZEVs
15.4% of Annual Sales in 2025
36
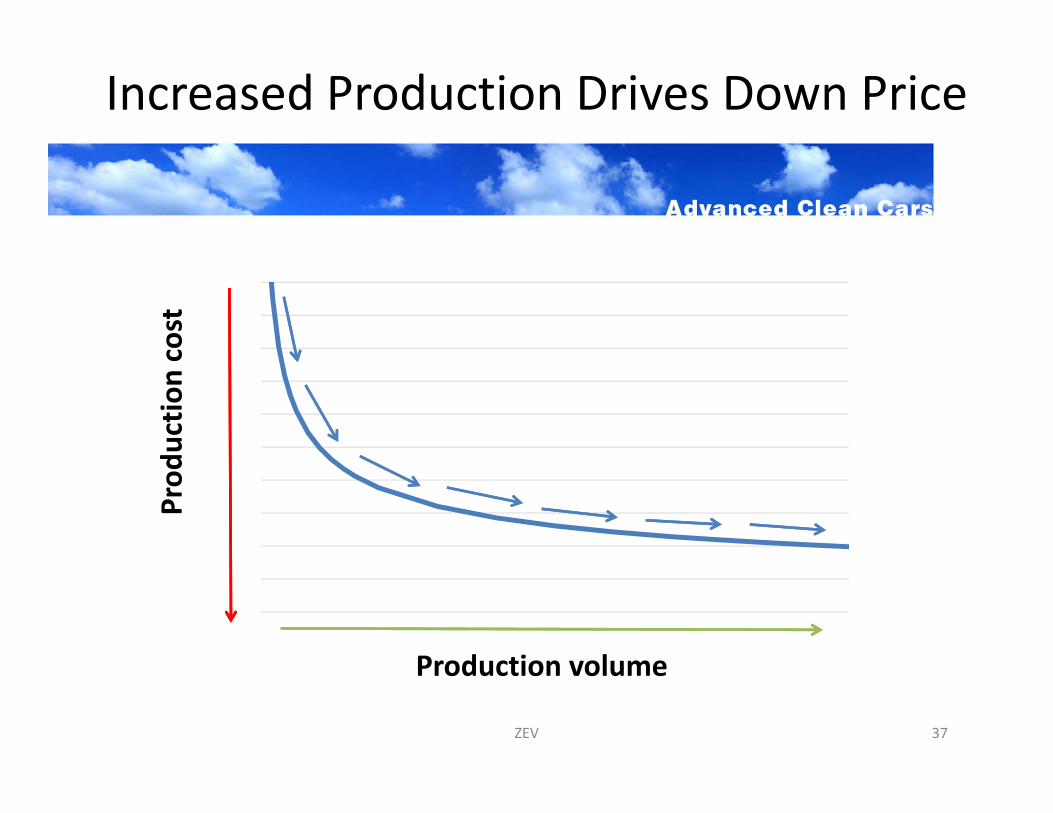
Increased Production Drives Down Price
ZEV 37
Prod
uctio
n cost
Production volume

38
CEO of Nissan at Detroit Auto Show
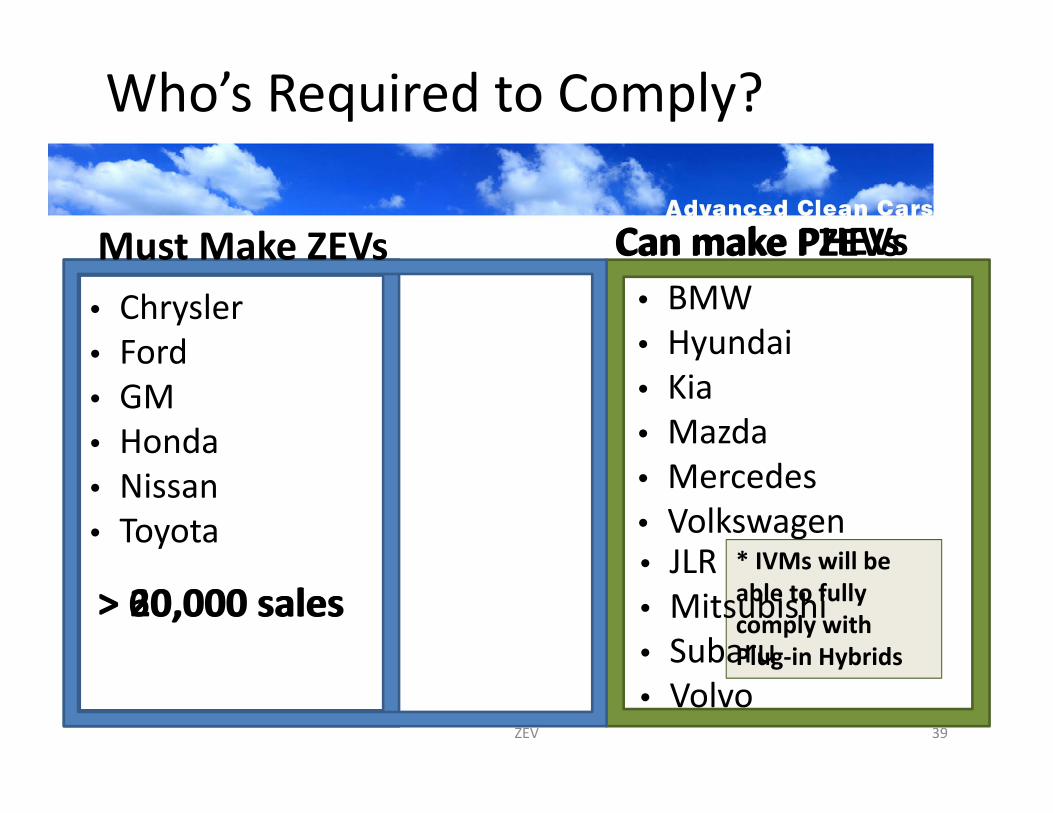
Who’s Required to Comply?
• Chrysler• Ford• GM• Honda• Nissan• Toyota
* IVMs will be able to fully comply with Plug‐in Hybrids
ZEV
• BMW• Hyundai• Kia• Mazda• Mercedes• Volkswagen• JLR• Mitsubishi• Subaru• Volvo
Must Make ZEVs Can make PZEVs
> 60,000 sales> 20,000 sales
39
Can make PHEVs
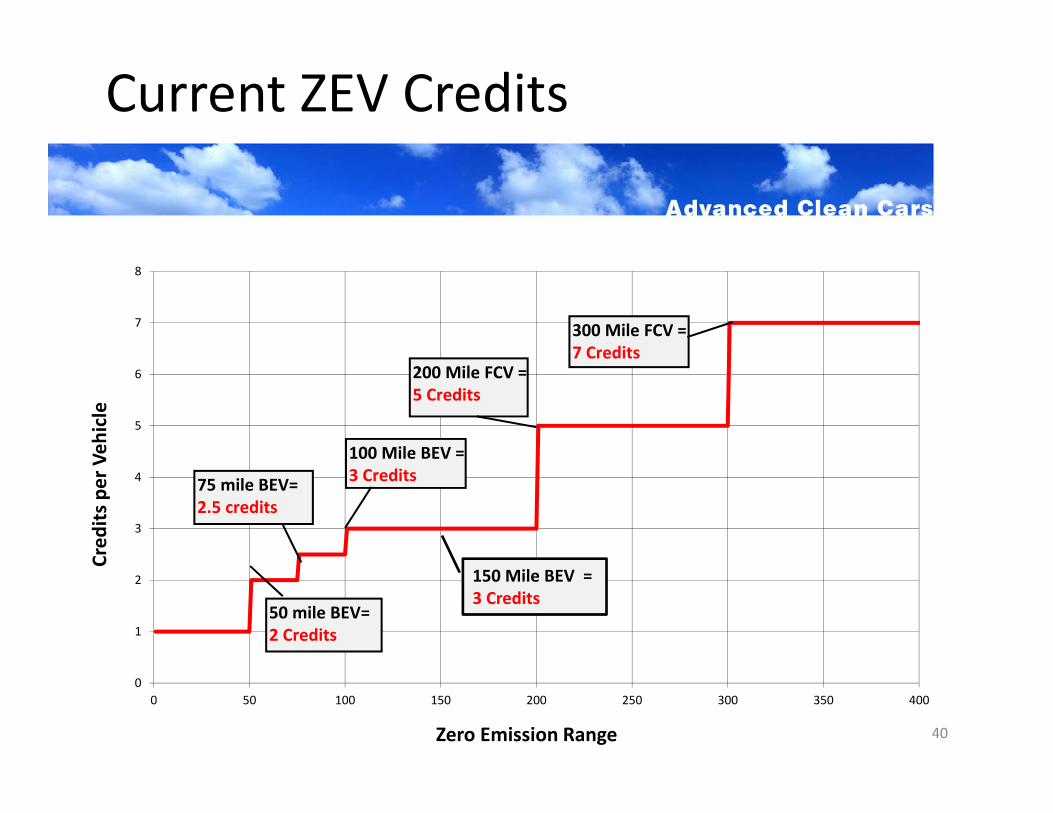
Current ZEV Credits
40
0
1
2
3
4
5
6
7
8
0 50 100 150 200 250 300 350 400
Cred
its per Veh
icle
Zero Emission Range
50 mile BEV= 2 Credits
100 Mile BEV = 3 Credits
200 Mile FCV = 5 Credits
75 mile BEV= 2.5 credits
300 Mile FCV = 7 Credits
150 Mile BEV = 3 Credits
0
1
2
3
4
5
0 50 100 150 200 250 300 350 400
Cre
dits
per
veh
icle
Zero Emission Range
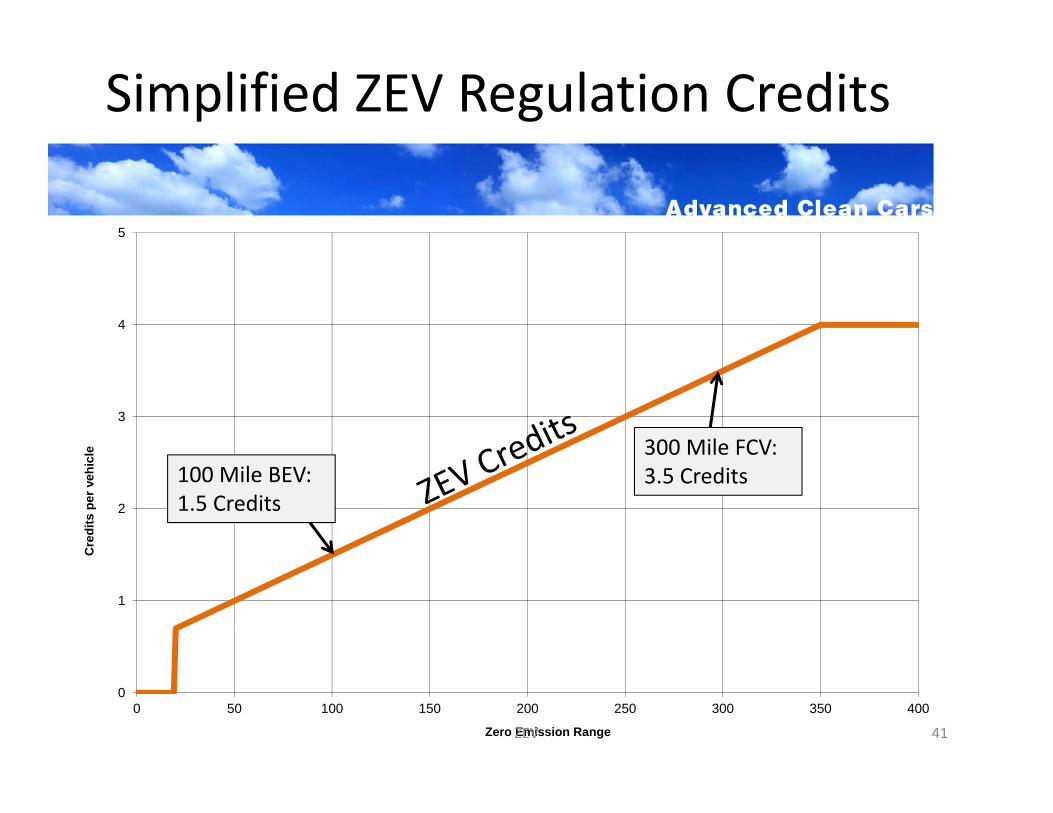
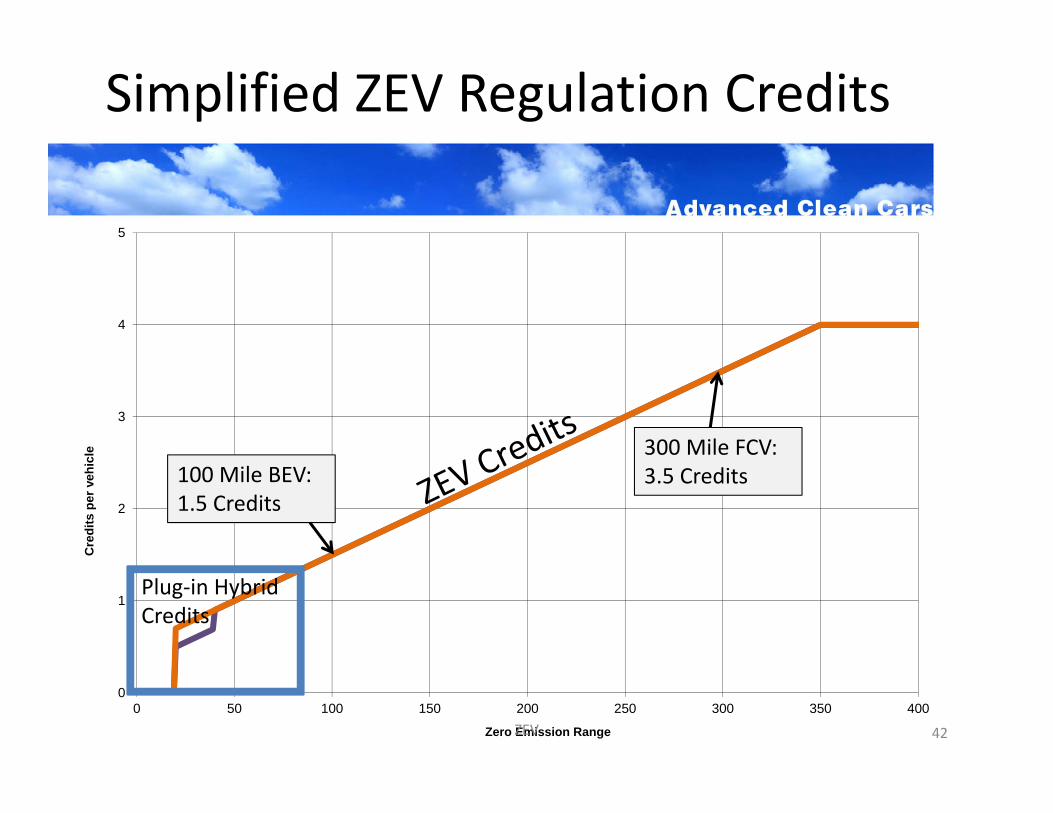
Simplified ZEV Regulation Credits
100 Mile BEV: 1.5 Credits
300 Mile FCV: 3.5 Credits
ZEV 41
0
1
2
3
4
5
0 50 100 150 200 250 300 350 400
Cre
dits
per
veh
icle
Zero Emission Range
Simplified ZEV Regulation Credits
Plug‐in Hybrid Credits
100 Mile BEV: 1.5 Credits
300 Mile FCV: 3.5 Credits
ZEV 42
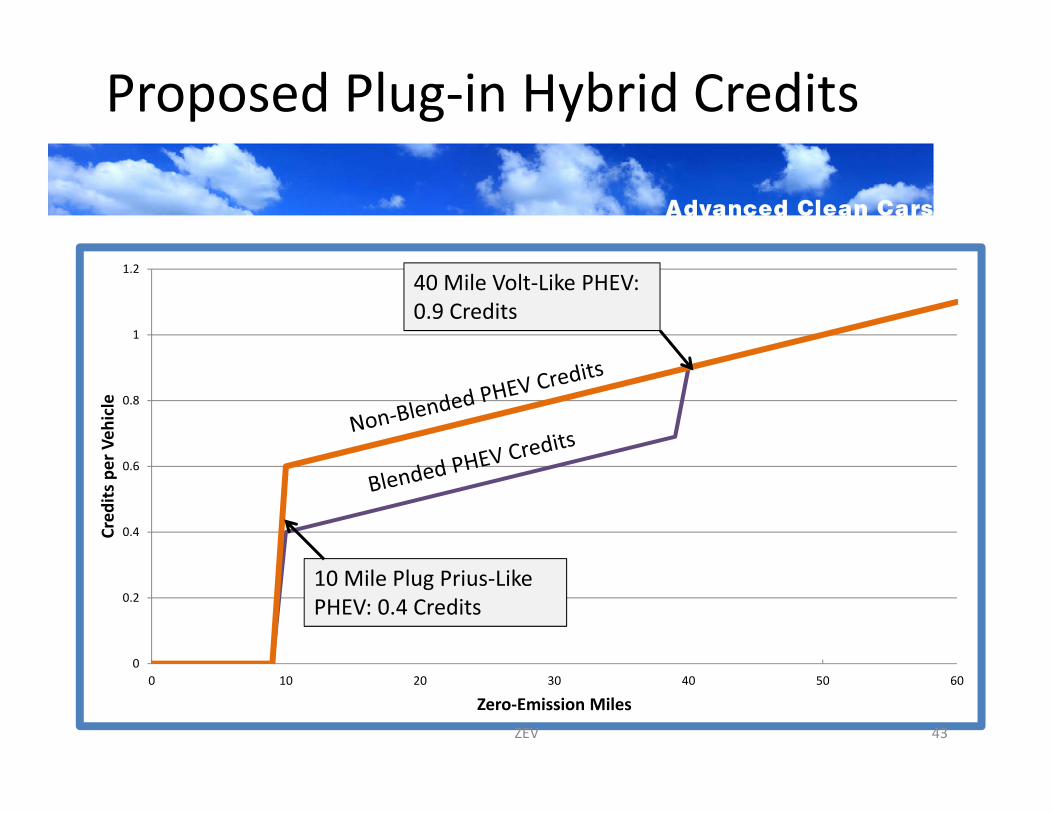
Proposed Plug‐in Hybrid Credits
0
0.2
0.4
0.6
0.8
1
1.2
0 10 20 30 40 50 60
Cred
its per Veh
icle
Zero‐Emission Miles
10 Mile Plug Prius‐Like PHEV: 0.4 Credits
40 Mile Volt‐Like PHEV: 0.9 Credits
ZEV 43
Additional Flexibility
• NEW Category: Range Extended Battery Electric Vehicles
• GHG‐ZEV Over‐Compliance• Travel Provision• Unlimited life for all credits• Allowed use of banked PZEV and AT PZEV credits
• No more “placed in service” requirement
44
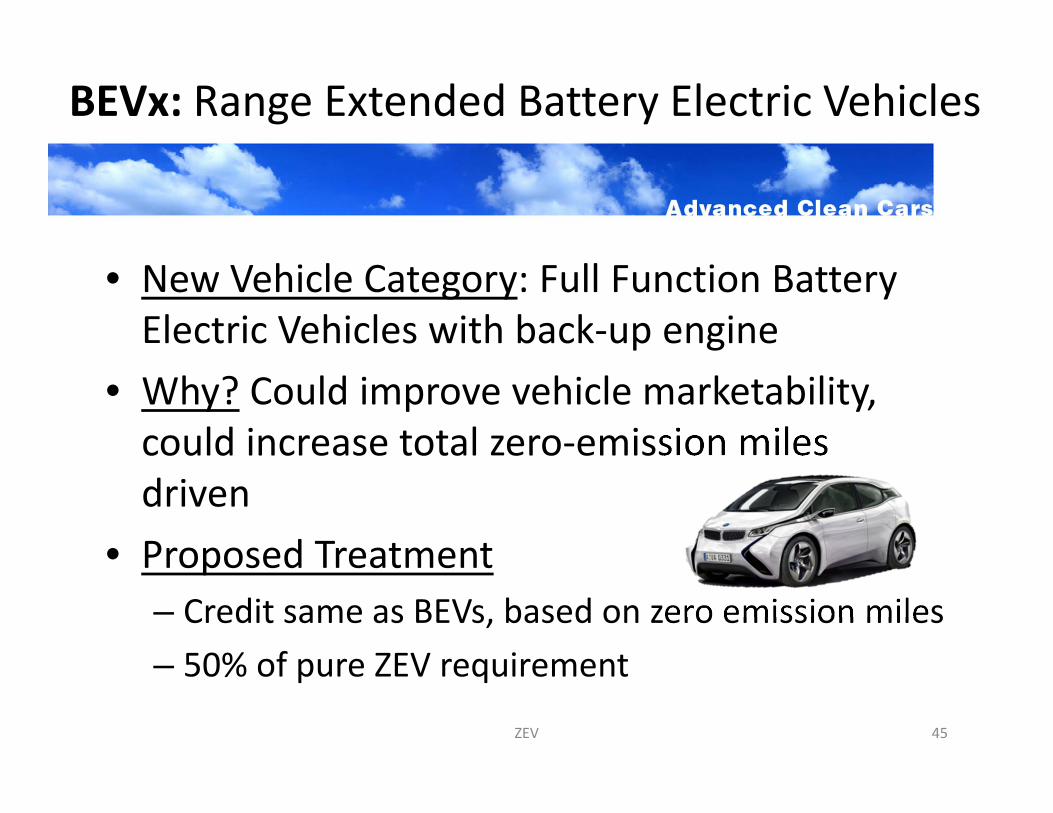
BEVx: Range Extended Battery Electric Vehicles
• New Vehicle Category: Full Function Battery Electric Vehicles with back‐up engine
• Why? Could improve vehicle marketability, could increase total zero‐emission miles driven
• Proposed Treatment– Credit same as BEVs, based on zero emission miles– 50% of pure ZEV requirement
ZEV 45
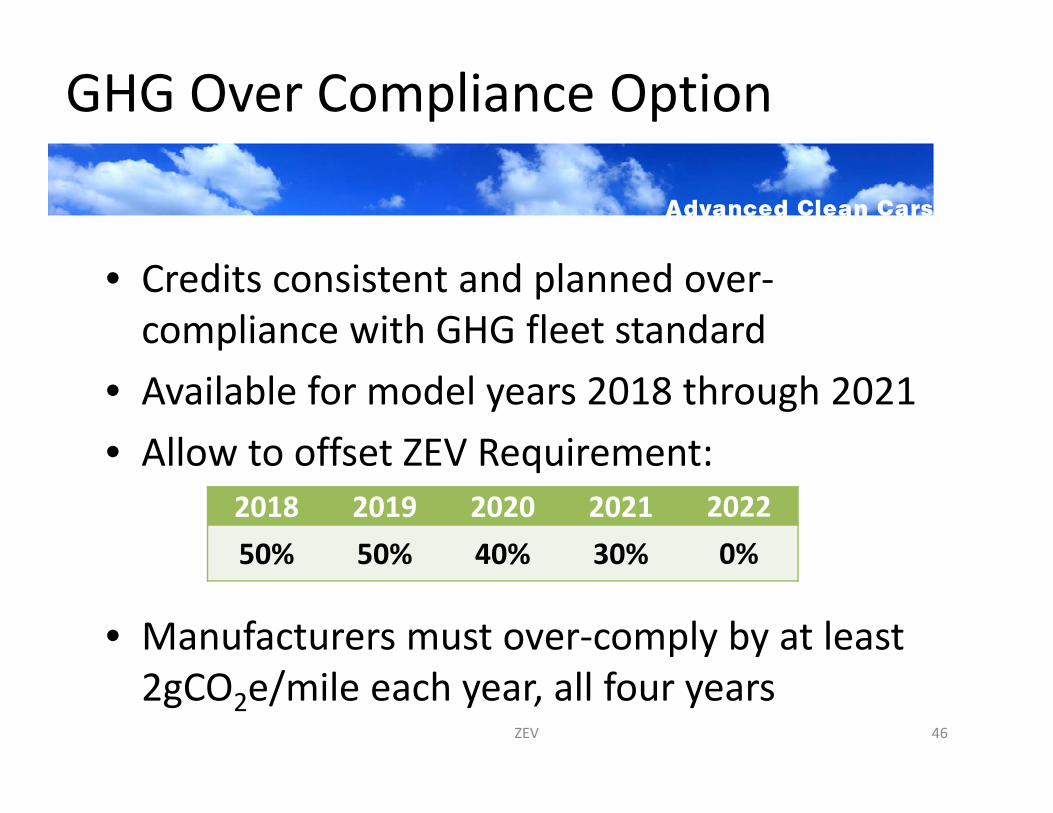
GHG Over Compliance Option
• Credits consistent and planned over‐compliance with GHG fleet standard
• Available for model years 2018 through 2021• Allow to offset ZEV Requirement:
• Manufacturers must over‐comply by at least 2gCO2e/mile each year, all four years
2018 2019 2020 2021 202250% 50% 40% 30% 0%
ZEV 46
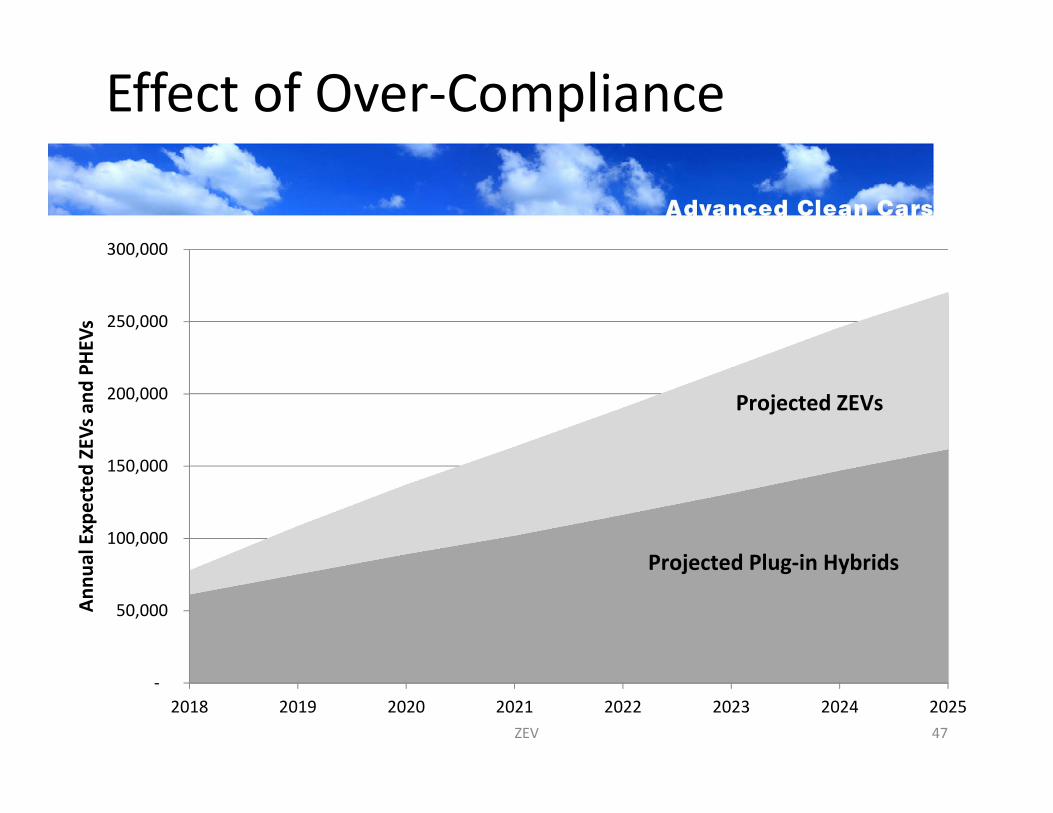
Effect of Over‐Compliance
ZEV
‐
50,000
100,000
150,000
200,000
250,000
300,000
2018 2019 2020 2021 2022 2023 2024 2025
Annu
al Expected ZEVs and
PHEV
s
Projected ZEVs
Projected Plug‐in Hybrids
47
‐
50,000
100,000
150,000
200,000
250,000
300,000
2018 2019 2020 2021 2022 2023 2024 2025
Annu
al Expected ZEVs and
PHEV
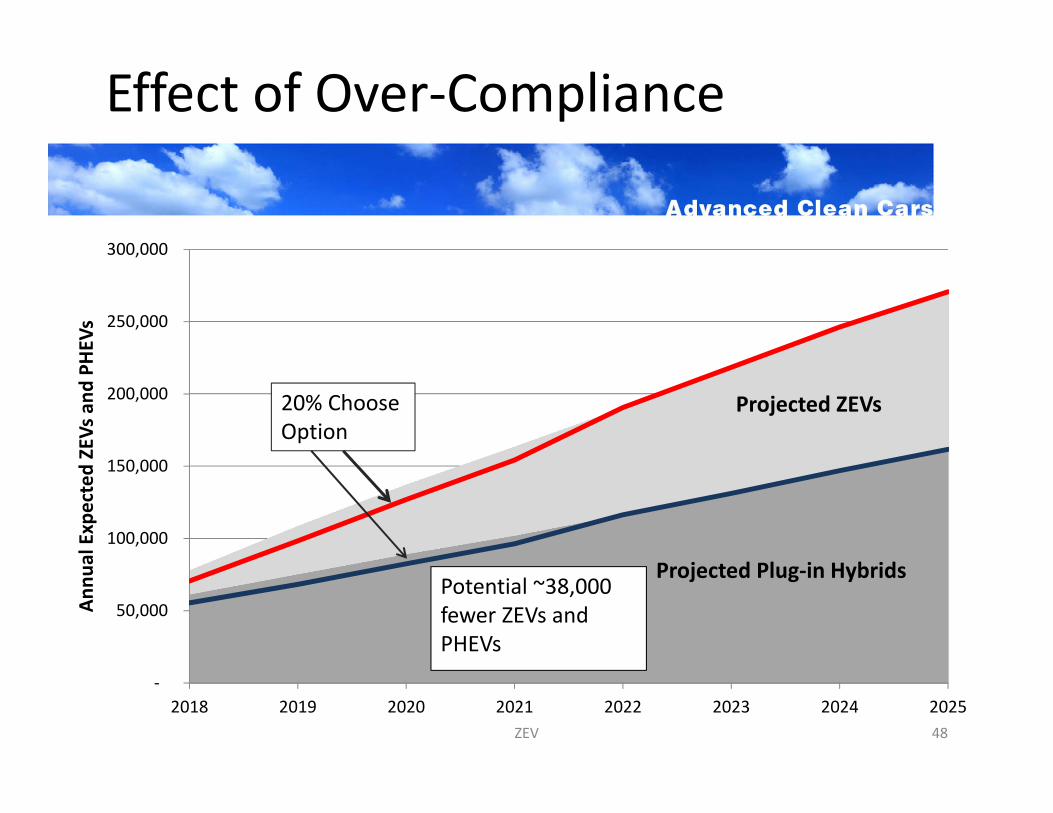
sEffect of Over‐Compliance
ZEV
Potential ~38,000 fewer ZEVs and PHEVs
20% Choose Option
Projected ZEVs
Projected Plug‐in Hybrids
48
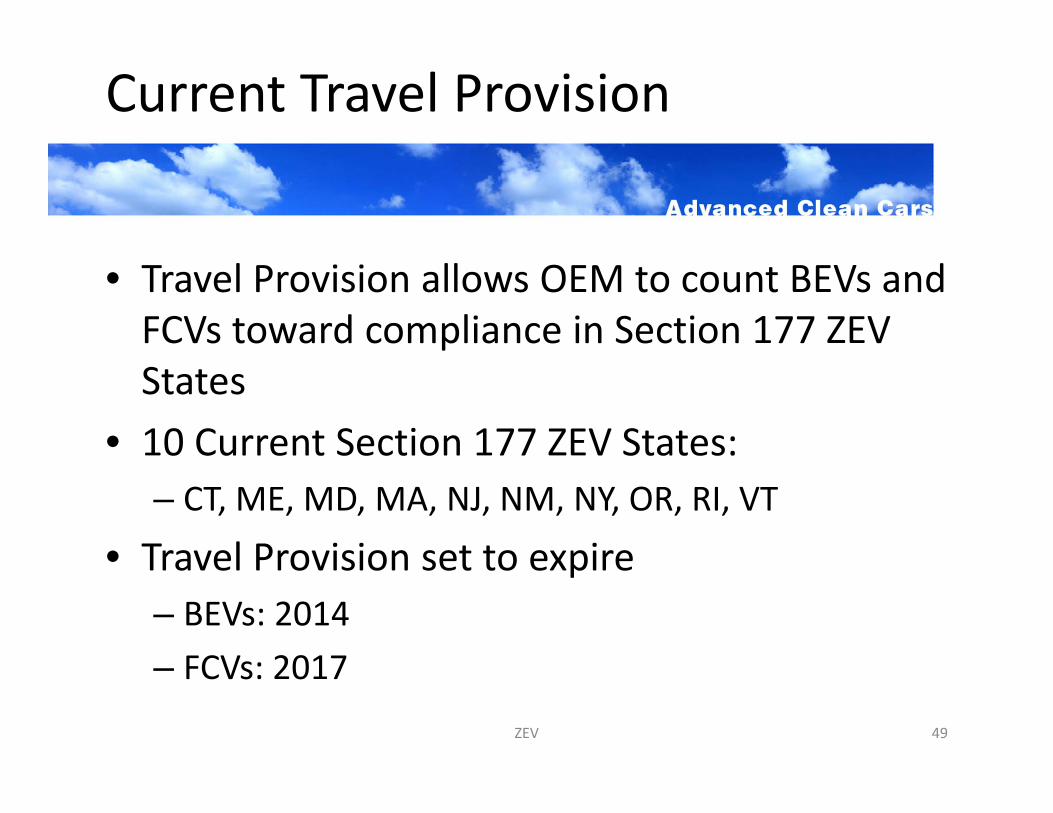
Current Travel Provision
• Travel Provision allows OEM to count BEVs and FCVs toward compliance in Section 177 ZEV States
• 10 Current Section 177 ZEV States:– CT, ME, MD, MA, NJ, NM, NY, OR, RI, VT
• Travel Provision set to expire– BEVs: 2014– FCVs: 2017
ZEV 49
Proposed Travel Option
• Travel sunsets for BEVs in 2017• Travel continues for FCVs beyond 2018• New optional compliance path in S177 States
– More BEVs pre‐2018, for reduced requirement post‐2018
– Phase‐in PHEVs in 2015 through 2018– Allow “pooling” of PHEVs and BEVs amongst East and West Regions
50
Summary
• Focus the regulation on low‐carbon technologies
• Increase requirements to drive down costs and achieve commercialization
• Simplify and streamline regulatory requirements
51
CFO
52
ZEVZEV
CFOCFO
LEVLEV
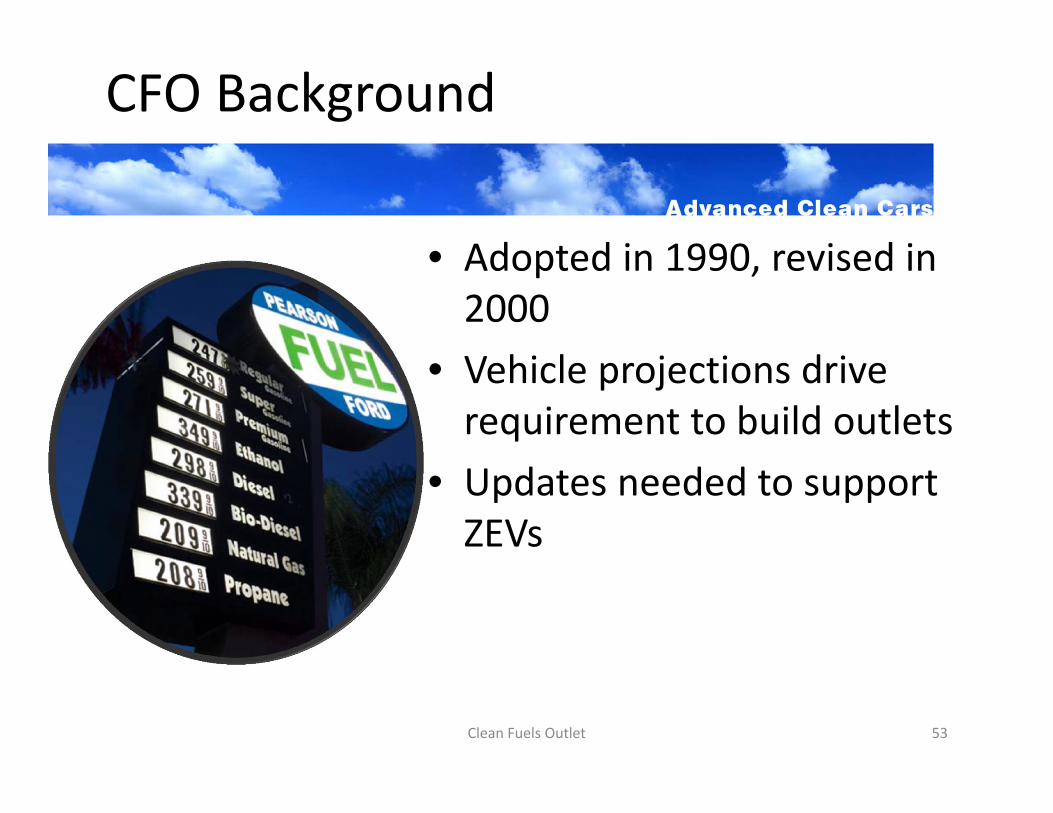
CFO Background
• Adopted in 1990, revised in 2000
• Vehicle projections drive requirement to build outlets
• Updates needed to support ZEVs
Clean Fuels Outlet 53
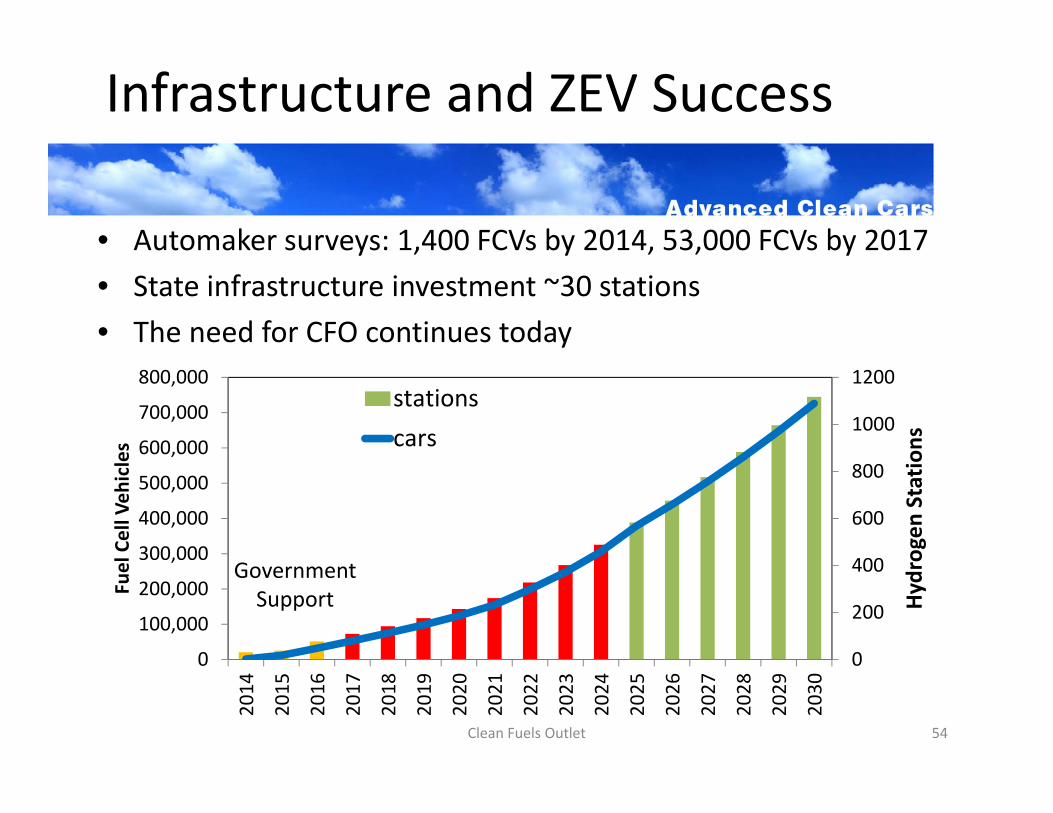
Infrastructure and ZEV Success
• Automaker surveys: 1,400 FCVs by 2014, 53,000 FCVs by 2017• State infrastructure investment ~30 stations• The need for CFO continues today
Clean Fuels Outlet 54
GovernmentSupport
0
200
400
600
800
1000
1200
0
100,000
200,000
300,000
400,000
500,000
600,000
700,000
800,000
2014
2015
2016
2017
2018
2019
2020
2021
2022
2023
2024
2025
2026
2027
2028
2029
2030
Hydrogen Stations
Fuel Cell Veh
icles
stationscars
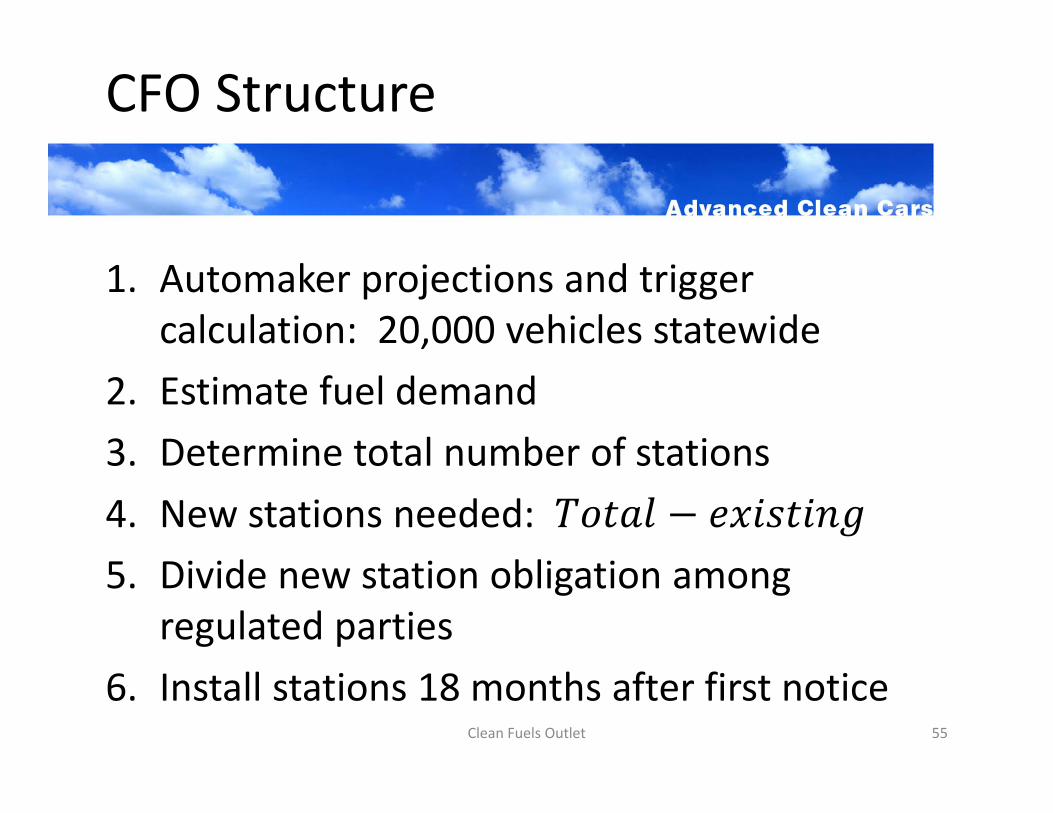
CFO Structure
1. Automaker projections and trigger calculation: 20,000 vehicles statewide
2. Estimate fuel demand3. Determine total number of stations4. New stations needed: 5. Divide new station obligation among
regulated parties6. Install stations 18 months after first notice
Clean Fuels Outlet 55
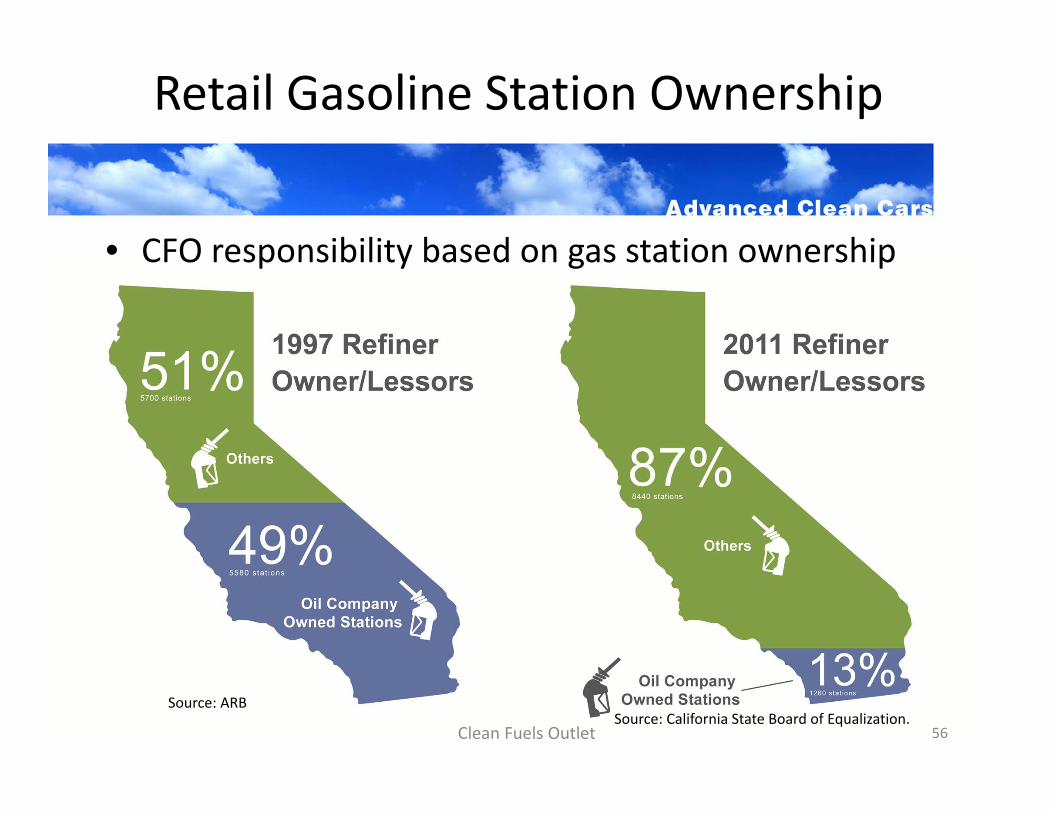
Retail Gasoline Station Ownership
• CFO responsibility based on gas station ownership
Clean Fuels Outlet 56
Source: ARBSource: California State Board of Equalization.
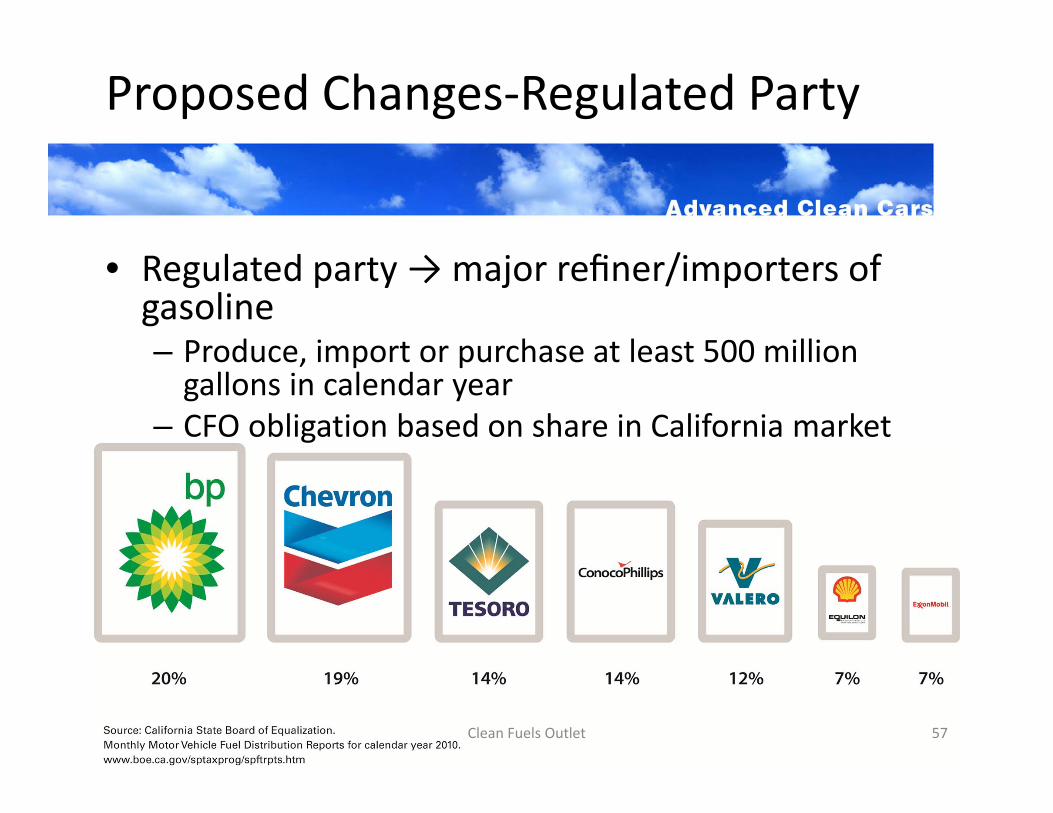
Proposed Changes‐Regulated Party
• Regulated party → major refiner/importers of gasoline– Produce, import or purchase at least 500 million gallons in calendar year
– CFO obligation based on share in California market
Clean Fuels Outlet 57
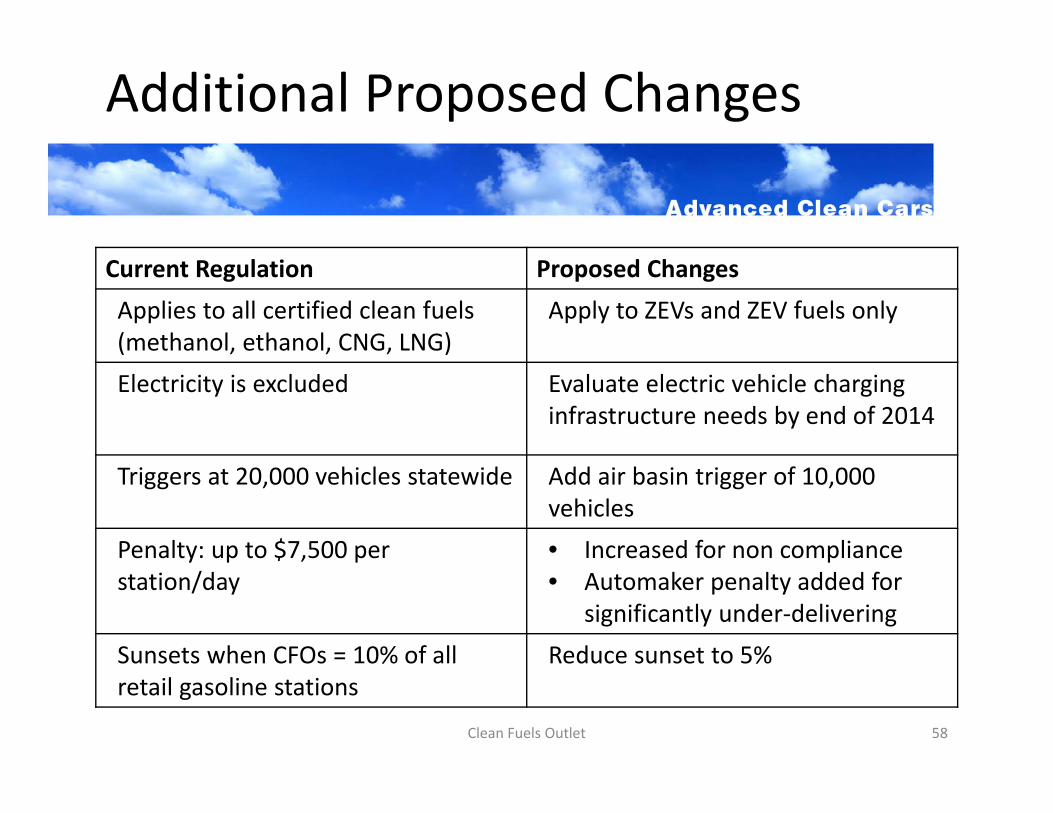
Additional Proposed Changes
Current Regulation Proposed ChangesApplies to all certified clean fuels (methanol, ethanol, CNG, LNG)
Apply to ZEVs and ZEV fuels only
Electricity is excluded Evaluate electric vehicle charging infrastructure needs by end of 2014
Triggers at 20,000 vehicles statewide Add air basin trigger of 10,000 vehicles
Penalty: up to $7,500 per station/day
• Increased for non compliance• Automaker penalty added for
significantly under‐deliveringSunsets when CFOs = 10% of all retail gasoline stations
Reduce sunset to 5%
Clean Fuels Outlet 58
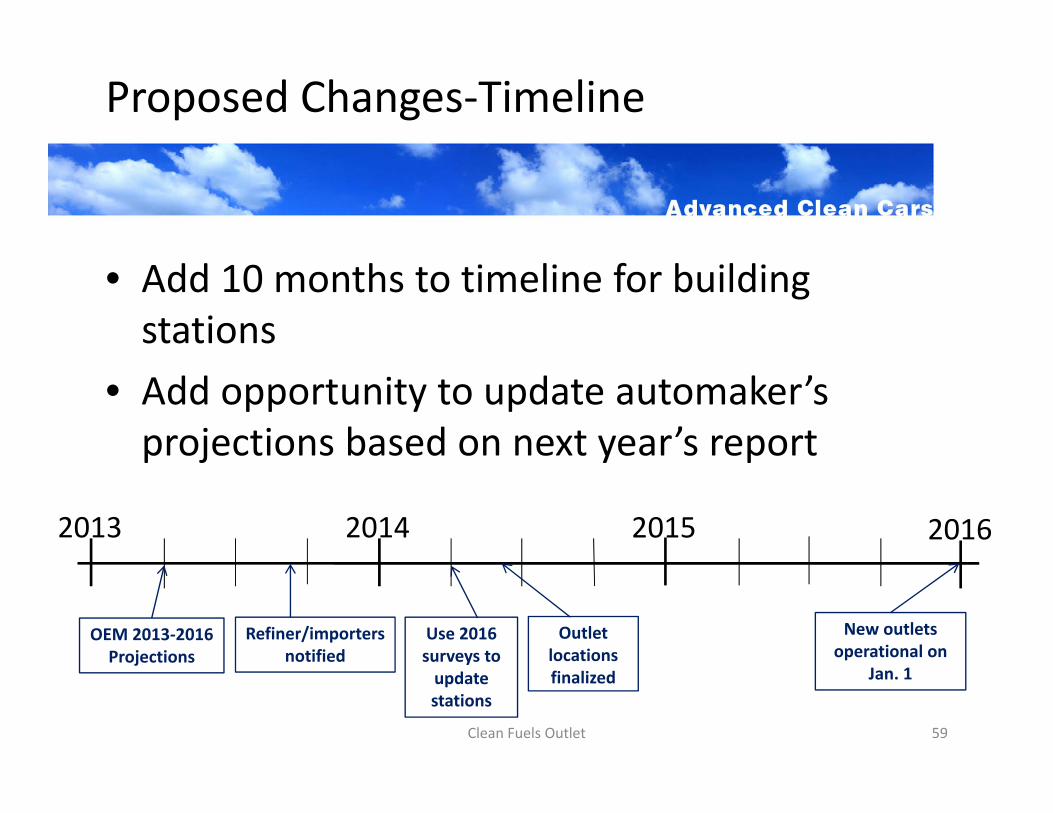
Proposed Changes‐Timeline
Clean Fuels Outlet 59
• Add 10 months to timeline for building stations
• Add opportunity to update automaker’s projections based on next year’s report
2013 2014 2015 2016
OEM 2013‐2016 Projections
Refiner/importers notified
Use 2016 surveys to update stations
Outlet locations finalized
New outlets operational on
Jan. 1
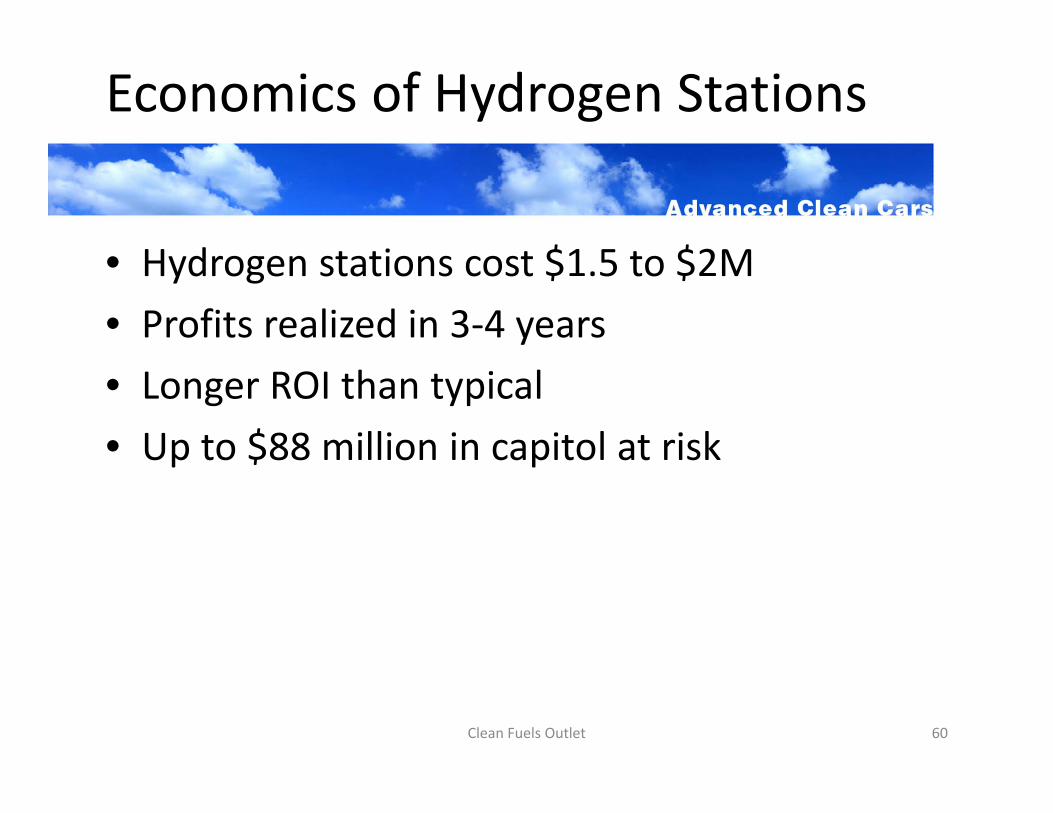
Economics of Hydrogen Stations
• Hydrogen stations cost $1.5 to $2M• Profits realized in 3‐4 years• Longer ROI than typical• Up to $88 million in capitol at risk
Clean Fuels Outlet 60
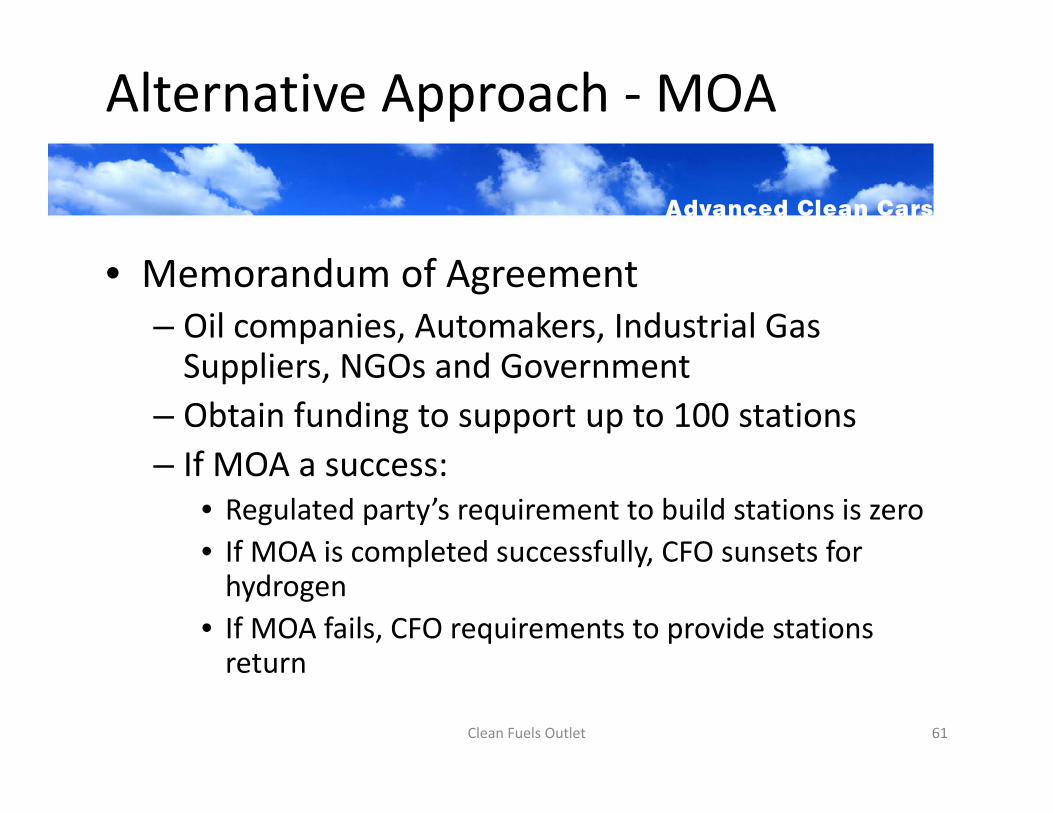
Alternative Approach ‐MOA
• Memorandum of Agreement – Oil companies, Automakers, Industrial Gas Suppliers, NGOs and Government
– Obtain funding to support up to 100 stations– If MOA a success:
• Regulated party’s requirement to build stations is zero• If MOA is completed successfully, CFO sunsets for hydrogen
• If MOA fails, CFO requirements to provide stations return
Clean Fuels Outlet 61
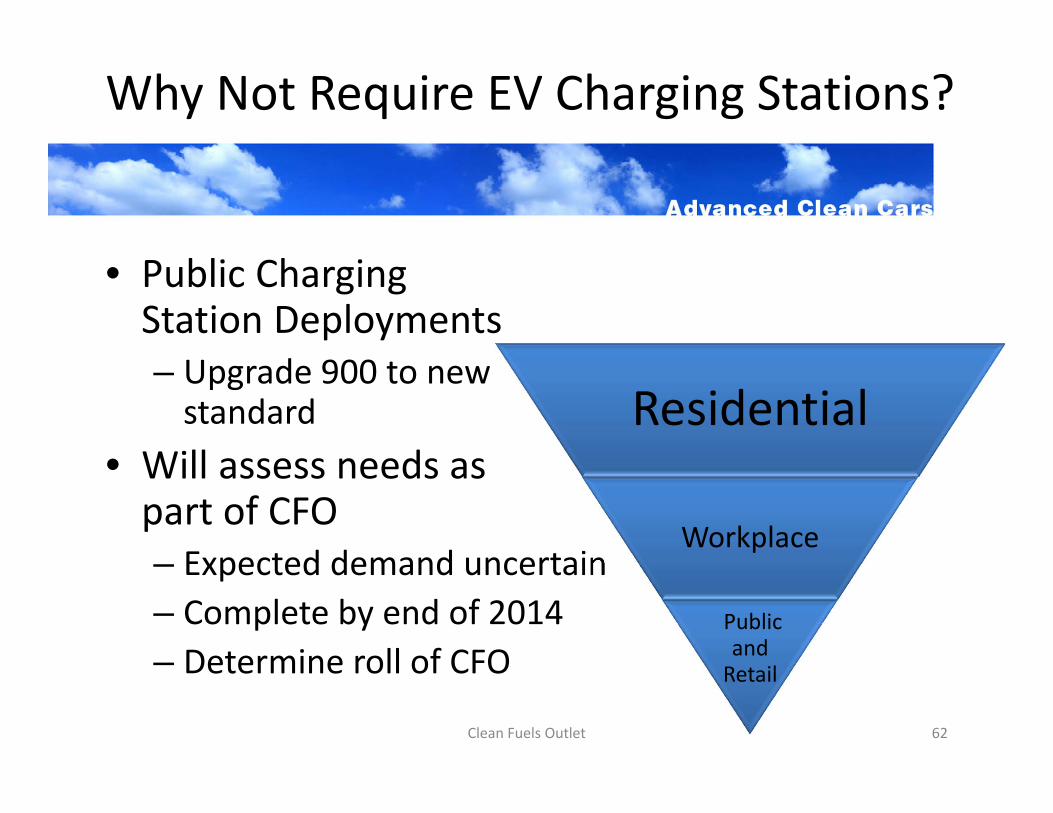
Why Not Require EV Charging Stations?
• Public Charging Station Deployments– Upgrade 900 to new standard
• Will assess needs as part of CFO– Expected demand uncertain– Complete by end of 2014– Determine roll of CFO
Clean Fuels Outlet 62
Residential
Workplace
PublicandRetail
Summary
• Hydrogen fueling stations are needed to commercialize ZEVs
• CFO amendments necessary to bridge gap between funded and self‐sustaining
• MOA may provide a collaborative approach to ensuring hydrogen stations
Clean Fuels Outlet 63
Overall Economic Impacts of ACC Program
Clean Fuels Outlet 64
65
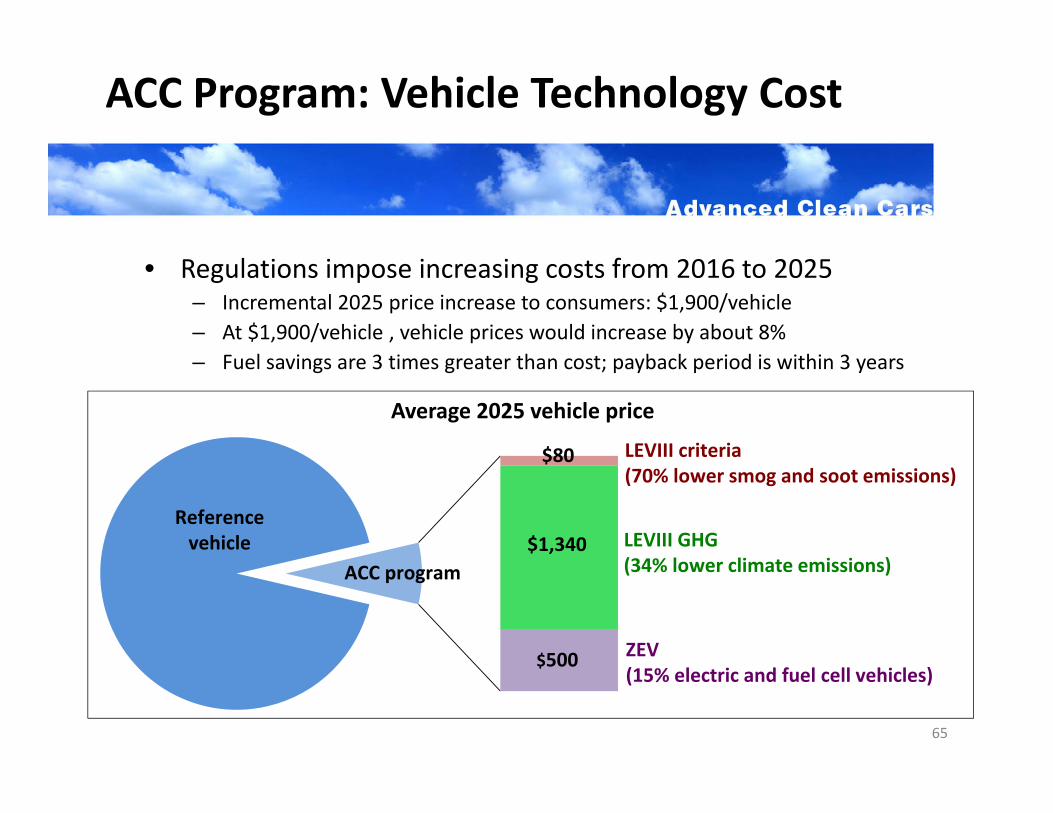
ACC Program: Vehicle Technology Cost
• Regulations impose increasing costs from 2016 to 2025– Incremental 2025 price increase to consumers: $1,900/vehicle– At $1,900/vehicle , vehicle prices would increase by about 8%– Fuel savings are 3 times greater than cost; payback period is within 3 years
ACC program
LEVIII criteria(70% lower smog and soot emissions)
$80
$1,340
$500
LEVIII GHG(34% lower climate emissions)
ZEV(15% electric and fuel cell vehicles)
Referencevehicle
Average 2025 vehicle price
66
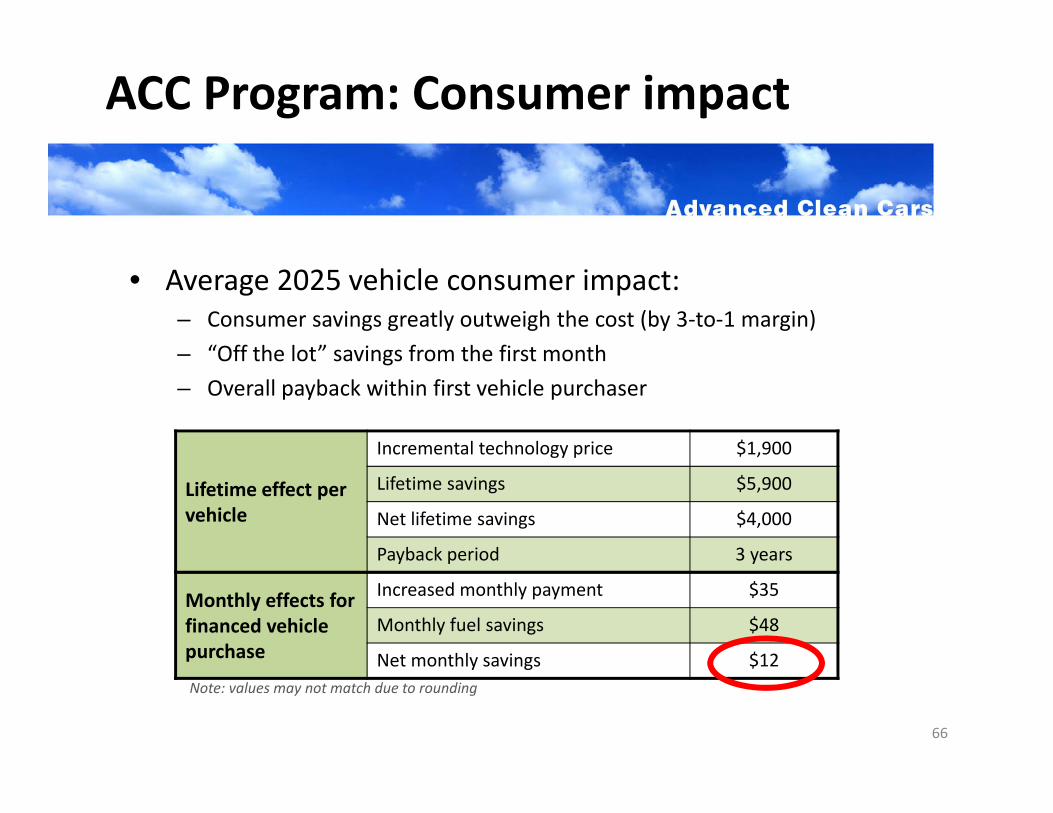
ACC Program: Consumer impact
• Average 2025 vehicle consumer impact:– Consumer savings greatly outweigh the cost (by 3‐to‐1 margin)– “Off the lot” savings from the first month– Overall payback within first vehicle purchaser
Lifetime effect per vehicle
Incremental technology price $1,900
Lifetime savings $5,900
Net lifetime savings $4,000
Payback period 3 years
Monthly effects for financed vehicle purchase
Increased monthly payment $35
Monthly fuel savings $48
Net monthly savings $12Note: values may not match due to rounding
67
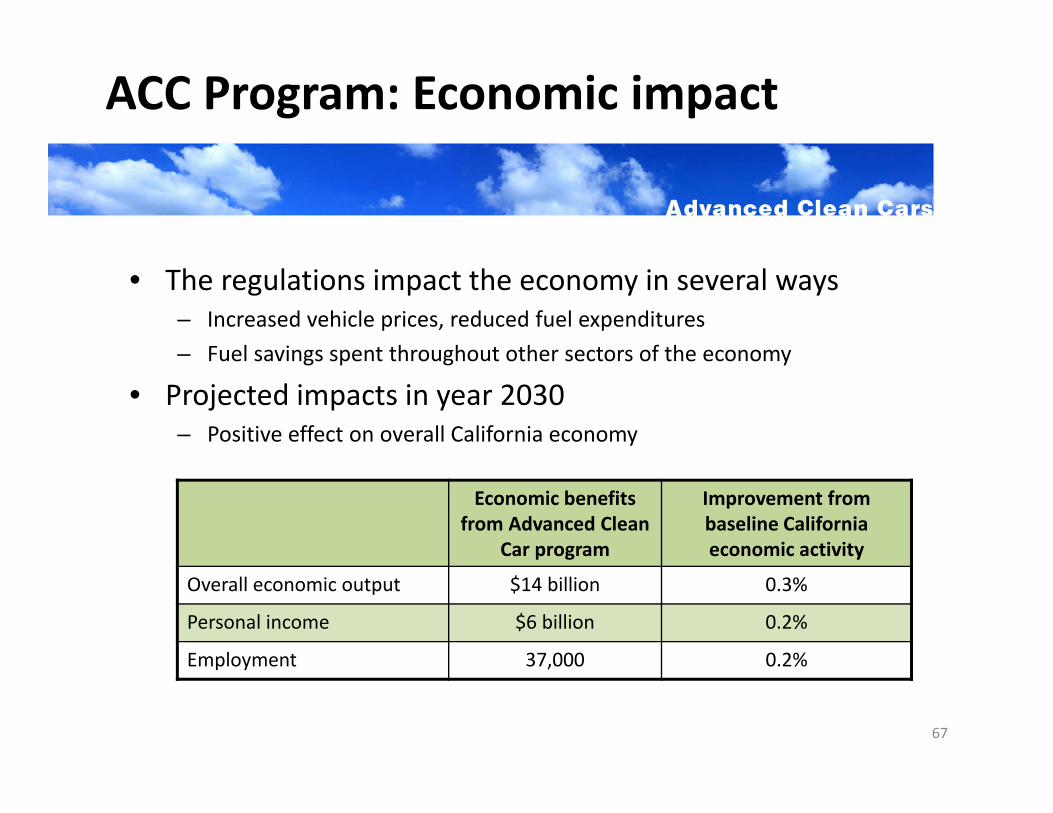
ACC Program: Economic impact
• The regulations impact the economy in several ways– Increased vehicle prices, reduced fuel expenditures– Fuel savings spent throughout other sectors of the economy
• Projected impacts in year 2030– Positive effect on overall California economy
Economic benefits from Advanced Clean
Car program
Improvement from baseline California economic activity
Overall economic output $14 billion 0.3%
Personal income $6 billion 0.2%
Employment 37,000 0.2%