public health facilities and exclusive breastfeeding in...
TRANSCRIPT

Seminar Presentation, TNP2K.
Jakarta, 8.04.2014
Public Health Facilities and Exclusive breastfeeding in Eastern Indonesia:
Results from the IFLS-East 2012
Maria C. Lo Bue [email protected]

Outline
First paper: “Availability and quality of public health facilities in Eastern Indonesia. Results from IFLS-East 2012”.
Second paper: “The role of demand and supply level factors in shaping optimal exclusive breastfeeding practices. Results from IFLS-East 2012”.
Availability and quality of public health facilities in Eastern Indonesia.
Results from IFLS-East 2012.

“Availability and quality of public health facilities in Eastern Indonesia. Results from IFLS-East 2012”.
I. Introduction
• Over the last decades, Indonesia has achieved significant improvements in the delivery of health care services: • Inpres program • Bidan Di Desa program • Decentralization
• Uneven progress • Substantial rise in the demand for health care services Under-supply of health services • Mixed performance in health outcomes (child and maternal health,
double burden of malnutrition) • Price of medical care

“Availability and quality of public health facilities in Eastern Indonesia. Results from IFLS-East 2012”.
I. Introduction
• Eastern Indonesian provinces rank relatively low compared to other provinces in several health and non-health dimensions
• Data: IFLS-East 2012
• 7 Provinces: Nusa Tenggara Timur, Kalimantan Timur, Sulawesi Tenggara, Maluku, Maluku Utara, Papua Barat, and Papua
• 98 villages • 97 Puskesmas • 95 Posyandus • 76 Traditional Midwives

“Availability and quality of public health facilities in Eastern Indonesia. Results from IFLS-East 2012”.
II. Health care supply and utilization in Eastern Indonesia: an overview
• Public Hospitals • Sub-district level: community
health centers (puskesmas) • Village level:
• mobile health clinics (pustu), • midwife clinics, • integrated health posts
(posyandu)
• Midwives (bidan) • Village midwives (bidan desa)
• Traditional providers (healers, midwives)
• Modern providers:
• private physicians , • privately-run clinics and
hospitals • polyclinics

“Availability and quality of public health facilities in Eastern Indonesia. Results from IFLS-East 2012”.
Inpatient and Outpatient treatment in Indonesia (Source: Susenas March 2013)
PANEL A: Outpatient treatment given being sick and having treatment
Indicator in % Java and Bali Sumatra Kalimantan Sulawesi Maluku NTT, NTB
and Lombok
Papua
State hospital 5 6 8 6 9 4 19
Private hospital 5 5 4 2 2 2 3
Doctor/Polyclinic treatment 36 23 22 22 18 21 23
Health clinic (puskesmas/pustu) 28 29 40 50 55 56 60
Medical worker practice 33 41 31 23 17 19 4
Traditional treatment 3 3 2 2 2 2 1
Maternity healer 1 1 1 0 1 0 1
Other facilities and treatments 3 3 3 3 6 4 2
PANEL B: Inpatient treatment given being sick and having treatment
Indicator in % Java and Bali Sumatra Kalimantan Sulawesi Maluku NTT, NTB
and Lombok
Papua
State hospital 40 46 58 63 64 40 77
Private hospital 39 35 29 17 13 14 14
Health clinic (puskesmas/pustu) 16 6 7 19 10 44 10
Medical worker practice 8 13 5 4 13 2 3
Traditional treatment 1 1 0 0 0 0 1
Other facilities and treatments 2 2 4 1 1 2 2
“Availability and quality of public health facilities in Eastern Indonesia. Results from IFLS-East 2012”.
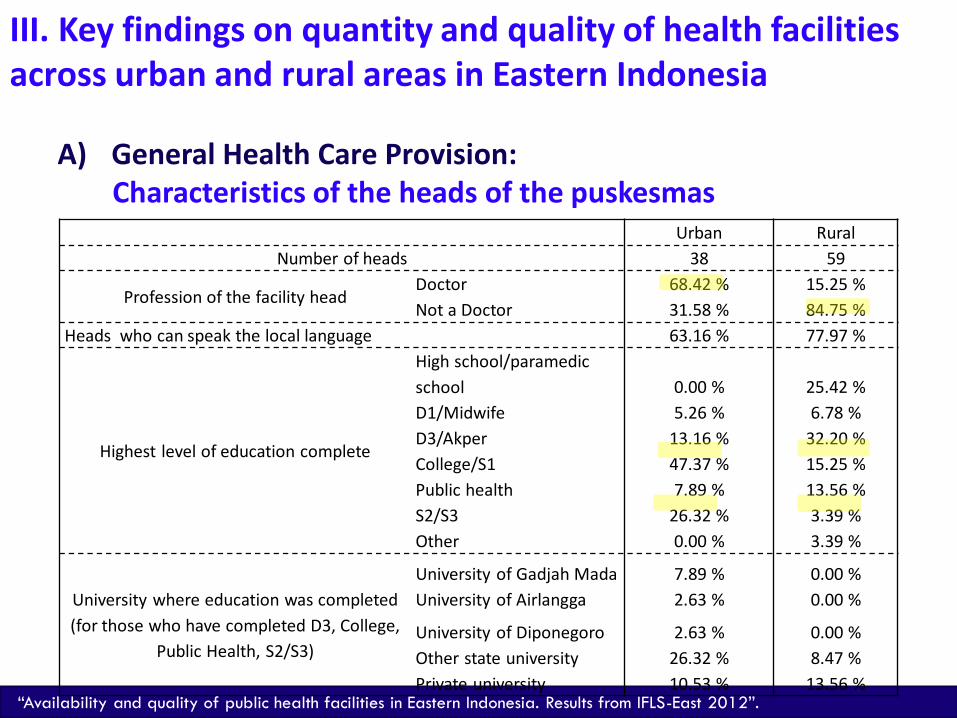
III. Key findings on quantity and quality of health facilities across urban and rural areas in Eastern Indonesia
A) General Health Care Provision: Characteristics of the heads of the puskesmas
Urban Rural
Number of heads 38 59
Profession of the facility head Doctor 68.42 % 15.25 %
Not a Doctor 31.58 % 84.75 %
Heads who can speak the local language 63.16 % 77.97 %
Highest level of education complete
High school/paramedic
school 0.00 % 25.42 %
D1/Midwife 5.26 % 6.78 %
D3/Akper 13.16 % 32.20 %
College/S1 47.37 % 15.25 %
Public health 7.89 % 13.56 %
S2/S3 26.32 % 3.39 %
Other 0.00 % 3.39 %
University where education was completed
(for those who have completed D3, College,
Public Health, S2/S3)
University of Gadjah Mada 7.89 % 0.00 %
University of Airlangga 2.63 % 0.00 %
University of Diponegoro 2.63 % 0.00 %
Other state university 26.32 % 8.47 %
Private university 10.53 % 13.56 %

“Availability and quality of public health facilities in Eastern Indonesia. Results from IFLS-East 2012”.
Total
number of
doctors
Years of
Experience
% providing
prenatal care
% providing
curative care
for children
% providing
curative care
for adults
% providing
curative care
for elderly
Urban Rural Urban Rural Urban Rural Urban Rural Urban Rural Urban Rural
General
Pract. 101 54 3.93 1.93 36.63 61.11 87.13 98.15 93.07 100.00 86.14 96.30
Dentists 41 22 5.09 2.5 0.00 0.00 82.93 90.91 85.37 90.91 80.49 86.36
Nurses 509 415 8.7 5.01 12.18 19.28 81.34 83.37 93.32 90.12 85.27 75.42
Midwives 244 198 7.99 5.14 91.80 94.95 72.54 63.13 50.41 67.68 33.20 64.14
Village
Midwives 40 102 9.06 3.81 100.00 100.00 80.00 95.10 72.50 74.51 70.00 50.98
Paramedics 43 38 7.76 7.07 9.30 26.32 62.79 65.79 44.19 57.89 41.86 50.00
Specialist 2 0 2 50.00 0.00 50.00 0.00 100.00 0.00 100.00 0.00
Care provision in puskesmas

“Availability and quality of public health facilities in Eastern Indonesia. Results from IFLS-East 2012”.
Possible interpretation:
• Rural puskesmas being relatively less available or understaffed
• Urban puskesmas having a larger pool of
medical staff which can specialize on certain services each medical professional is responsible for a narrower set of services

“Availability and quality of public health facilities in Eastern Indonesia. Results from IFLS-East 2012”.
Practitioners‘ characteristics and working hours in puskesmas
Total number of
practitioners
Average
number of
hours per
week worked
Average number
of hours per
week
provide service
% of medical
staff absent
over the last
week
Urban Rural Urban Rural Urban Rural Urban Rural
General
Pract. 101 54 31.06 32.2 23.23 23.51 14.61 42.86
Dentists 41 22 30.86 32.68 20.66 23.26 10.00 23.81
Nurses 509 415 32.21 32.17 24.13 21.83 10.14 22.76
Midwives 244 198 31.62 32.51 24.36 21.8 7.56 18.48
Village
Midwives 40 102 33.58 28.38 24.57 21.65 11.43 28.57
Paramedics 43 38 34.34 31.31 19.81 17.69 7.89 19.44
Specialist 2 0 36.00 24.00
“Availability and quality of public health facilities in Eastern Indonesia. Results from IFLS-East 2012”.
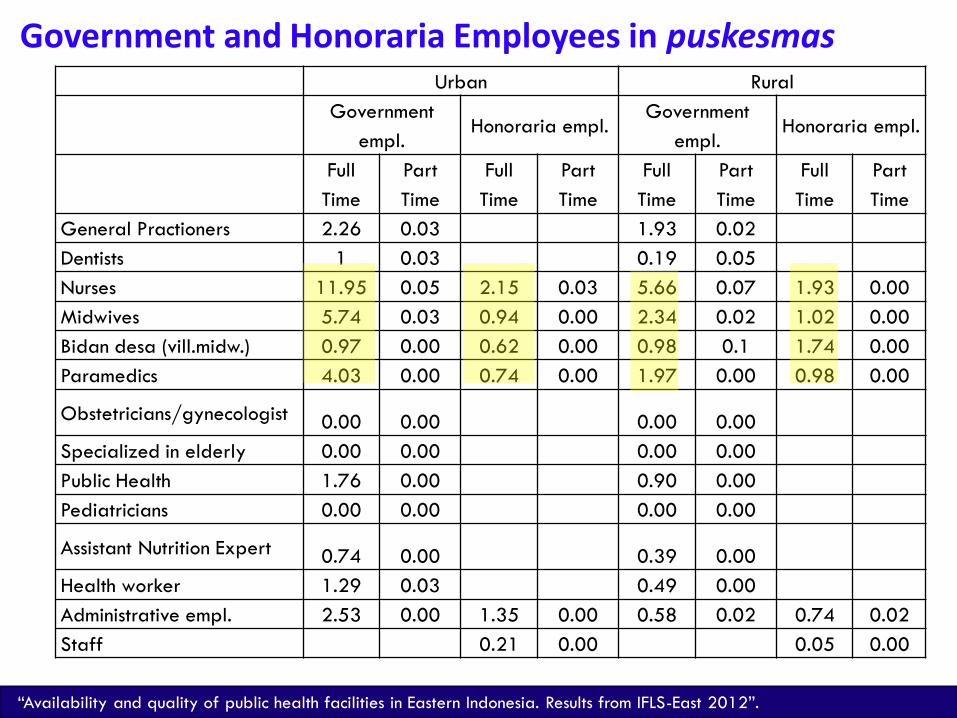
Government and Honoraria Employees in puskesmas Urban Rural
Government
empl. Honoraria empl.
Government
empl. Honoraria empl.
Full
Time
Part
Time
Full
Time
Part
Time
Full
Time
Part
Time
Full
Time
Part
Time
General Practioners 2.26 0.03 1.93 0.02
Dentists 1 0.03 0.19 0.05
Nurses 11.95 0.05 2.15 0.03 5.66 0.07 1.93 0.00
Midwives 5.74 0.03 0.94 0.00 2.34 0.02 1.02 0.00
Bidan desa (vill.midw.) 0.97 0.00 0.62 0.00 0.98 0.1 1.74 0.00
Paramedics 4.03 0.00 0.74 0.00 1.97 0.00 0.98 0.00
Obstetricians/gynecologist 0.00 0.00 0.00 0.00
Specialized in elderly 0.00 0.00 0.00 0.00
Public Health 1.76 0.00 0.90 0.00
Pediatricians 0.00 0.00 0.00 0.00
Assistant Nutrition Expert 0.74 0.00 0.39 0.00
Health worker 1.29 0.03 0.49 0.00
Administrative empl. 2.53 0.00 1.35 0.00 0.58 0.02 0.74 0.02
Staff 0.21 0.00 0.05 0.00
“Availability and quality of public health facilities in Eastern Indonesia. Results from IFLS-East 2012”.
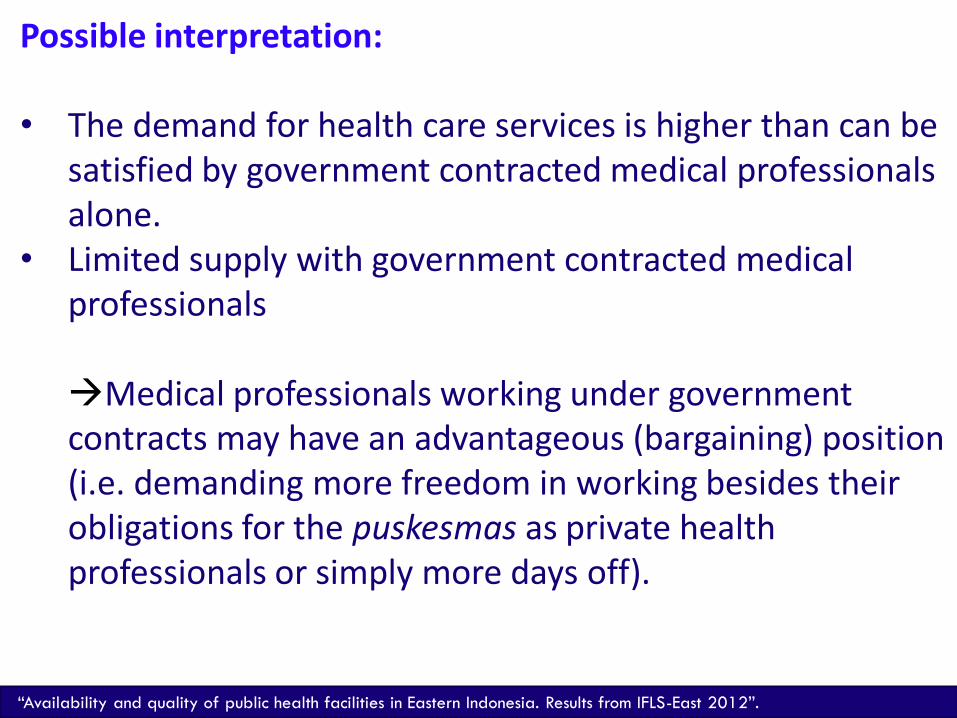
Possible interpretation: • The demand for health care services is higher than can be
satisfied by government contracted medical professionals alone.
• Limited supply with government contracted medical professionals
Medical professionals working under government contracts may have an advantageous (bargaining) position (i.e. demanding more freedom in working besides their obligations for the puskesmas as private health professionals or simply more days off).

“Availability and quality of public health facilities in Eastern Indonesia. Results from IFLS-East 2012”.
Urban Rural
Number of puskesmas 38 59
Registration/
Waiting Room
Patient
Registration
Cards 100 % 64.41 %
Registration
Books 100 % 89.83 %
Drawer to
store files 97.37 % 79.66 %
Dirty Floor 14.29 % 18.18 %
Dirty Walls 10.81 % 15.22 %
Dirty Ceiling 10.81 % 15.22 %
Experiencing
leaks/splash/f
lood during
the rainy
season 15.79 % 32.20 %
Examination
Room
Dirty Floor 2.63 % 15.25 %
Dirty Walls 2.63 % 15.25 %
Dirty Ceiling 5.26 % 20.34 %
Urban Rural
Health
Instruments:
average
number
% in
good
repair
average
number
% in
good
repair
Stethoscope 6.08 76.64 3.39 76.11
Thermometer 3.18 92.77 2.66 87.97
Beds 3.76 98.67 2.46 97.97
Inpatient beds 2.61 85.82 2.14 86.92
Delivery Kit 1.89 85.19 1.51 90.07
Ultrasounds 2.95 98.98 1.42
100.0
0
Electrocardiog
arm 0.39 46.15 0.10 80.00
Syringes 3.08 93.18 2.69 88.10
Quality of physical equipment in puskesmas
Room conditions Disposal of health instruments

“Availability and quality of public health facilities in Eastern Indonesia. Results from IFLS-East 2012”.
B) Maternal and Child Health Care Provision
Posyandus: services offered PANEL A: General Services
Urban Rural
Number of posyandus 38 56
Service offered:
Weighing of babies/children 100 % 100 %
Provision of supplementary food 84.21 % 76.79 %
Provision of Oralit 39.47 % 62.50 %
Immunization Service 86.84 % 94.64 %
Pregnancy Examination 47.37 % 75.00 %
Provision of iron vitamin 47.37 % 75.00 %
Provision of vitamin A 100 % 98.21 %
Treatment of patients 18.42 % 50.00 %
Child development (TKA) 31.58 % 37.50 %
Mother and child health (KIA) 34.21 % 62.5 %
PANEL B: Family Planning Services
Service offered:
Oral Contraceptive 50.00 % 42.86 %
Condom (per unit) 36.84 % 55.36 %
Injectable contraceptive 15.79 % 16.07 %
Overcoming side effects (per action) 42.11 % 60.71 %
Family Planning counselling 7.89 % 10.71 %

“Availability and quality of public health facilities in Eastern Indonesia. Results from IFLS-East 2012”.
Posyandus: disposal of health instruments
Urban Rural
Number of posyandus 38 56
Health Instruments:
Baby scales 89.47 % 96.43 %
Height measuring devices 47.37 % 55.36 %
Oral contraceptive Pills 10.53 % 19.64 %
Oralit 18.42 % 25.00 %
Iron Tablets 5.26 % 19.64 %
Vitamin A 15.79 % 26.79 %
Paracetamol 5.26 % 21.43 %
Adult Scale 63.16 % 60.71 %
Stethoscope 2.63 % 17.86 %
Thermometer 2.63 % 12.50 %

“Availability and quality of public health facilities in Eastern Indonesia. Results from IFLS-East 2012”.
Urban Rural
Number of
posyandus
21 28
Lower
Level
Capacity
28.57 % 42.86 %
Middle
Level
Capacity
28.57 % 17.86 %
Higher
Level
Capacity
28.57 % 7.14 %
Self
sufficient
Capacity
14.29 % 32.14 %
Urban Rural
Number of posyandus 38 59
General problems:
Lack of fund 44.74 % 59.32 %
Lack of medical supply 10.52 % 28.81 %
Lack of equipment 34.21 % 47.46 %
Lack of active cadres 18.42 % 18.64 %
Lack of support from puskesmas 7.89 % 8.47 %
Lack of support from village 2.63 % 11.86 %
No permanent place 18.42 % 16.95 %
Lack of interest/participation 26.32 % 11.86 %
No problem 21.05 % 6.78 %
Problems in maternal and child health :
Lack of fund 18.42 % 40.68 %
Lack of medical supply 5.26 % 18.64 %
Lack of equipment 18.42 % 28.81 %
Lack of support from puskesmas 5.26 % 8.47 %
Lack of support from village 5.26 % 5.08 %
No permanent place 15.79 % 11.86 %
Lack of interest/participation 18.42 % 15.25 %
Lack of Kia training for the cadres 5.26 % 28.81 %
No problem 36.84 % 20.34 %
Posyandus: capacity and problems faced
Much more fluctuation
in quality for rural
posyandus

“Availability and quality of public health facilities in Eastern Indonesia. Results from IFLS-East 2012”.
B) Maternal and Child Health Care Provision
Traditional midwives: services offered Urban Rural
Number of midwives 20 55
Service offered
Delivery
Percentage of midwives who ask for delivery charge 30 20
Fee for delivery charge (rupiah) 206250 118333.3
Postnatal care for
mothers
Percentage of midwives providing post natal care for
mothers
90 87.27
Percentage of midwives who ask for charge for mother
care after delivery
16.67 6.25
Fee for mother care after delivery (rupiah) 121426.6 7894.737
Average number of days proving mother care 14.17 12.17
Postnatal care for
babies
Percentage of midwives providing post natal care for
babies
90 85.45
Percentage of midwives who ask for charge 5.56 4.26
Fee for babies care after delivery (rupiah) 121428.6 7894.737
Average number of days providing babies' care 16.11 12.96
“Availability and quality of public health facilities in Eastern Indonesia. Results from IFLS-East 2012”.
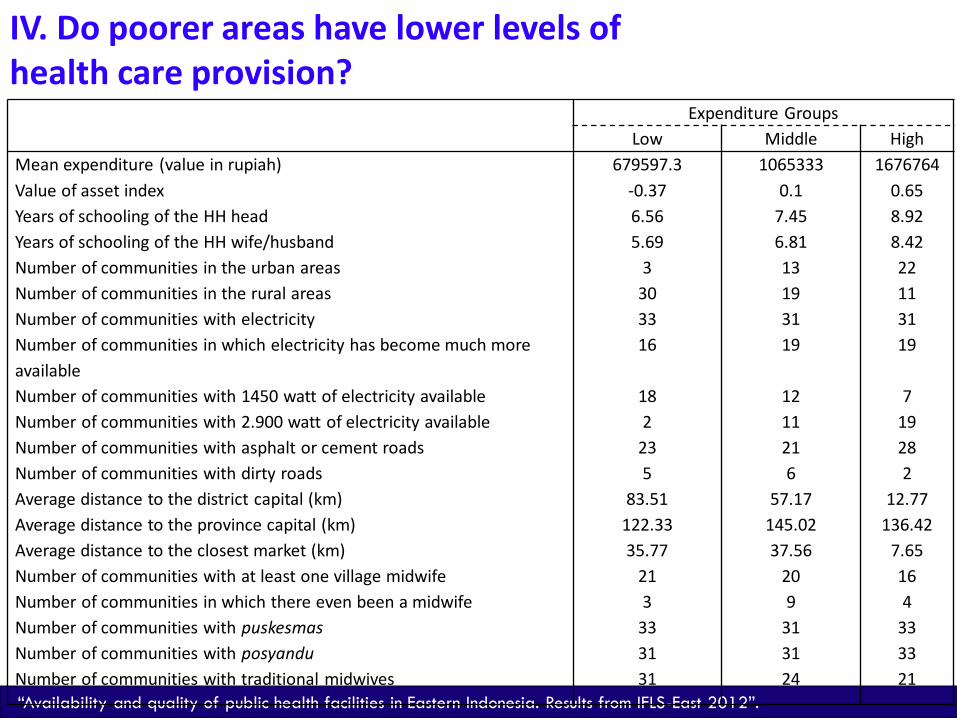
IV. Do poorer areas have lower levels of health care provision?
Expenditure Groups
Low Middle High
Mean expenditure (value in rupiah) 679597.3 1065333 1676764
Value of asset index -0.37 0.1 0.65
Years of schooling of the HH head 6.56 7.45 8.92
Years of schooling of the HH wife/husband 5.69 6.81 8.42
Number of communities in the urban areas 3 13 22
Number of communities in the rural areas 30 19 11
Number of communities with electricity 33 31 31
Number of communities in which electricity has become much more
available
16 19 19
Number of communities with 1450 watt of electricity available 18 12 7
Number of communities with 2.900 watt of electricity available 2 11 19
Number of communities with asphalt or cement roads 23 21 28
Number of communities with dirty roads 5 6 2
Average distance to the district capital (km) 83.51 57.17 12.77
Average distance to the province capital (km) 122.33 145.02 136.42
Average distance to the closest market (km) 35.77 37.56 7.65
Number of communities with at least one village midwife 21 20 16
Number of communities in which there even been a midwife 3 9 4
Number of communities with puskesmas 33 31 33
Number of communities with posyandu 31 31 33
Number of communities with traditional midwives 31 24 21

“Availability and quality of public health facilities in Eastern Indonesia. Results from IFLS-East 2012”.
• Significant constraints in terms of the availability (understaffing, absenteeism) and quality (education degrees, medical training) of medical staff.
• Likewise, poor physical infrastructure and
limited supply with medical equipment and medication.
Concluding Remarks:
“Availability and quality of public health facilities in Eastern Indonesia. Results from IFLS-East 2012”.
• Strong differences between urban and rural public health care provision:
• Rural puskesmas : small number of medical
staff, higher absenteeism rates, more limitations in terms of infrastructure, medical equipment and medication and less financial endowment.
• Rural posyandus better supplied with medical
equipment/medication

“Availability and quality of public health facilities in Eastern Indonesia. Results from IFLS-East 2012”.
• In line with the urban-rural comparison: similar differences along the village wealth gradient with poor villages showing relative worse outcomes with respect to the puskesmas and relatively better outcomes with respect to the posyandu.
Given the strong dependence/reliance of people in Eastern Indonesia to access public health care facilities, there exist significant scope to further improve public health care services
The role of demand and supply level factors in shaping optimal exclusive
breastfeeding practices. Results from IFLS-East 2012

“The role of demand and supply level factors in shaping optimal exclusive breastfeeding practices. Results from IFLS-East 2012”
I. Introduction
• Importance of breastfeeding for maternal and child health • Reduce risk of breast cancer • Reduce risk of maternal mortality • Reduce risk of infant mortality • Reduce risk of diseases (meningitis, diarrhea, respiratory infections, obesity) • Influence positively cognitive development
Breastfeeding as a cost free intervention to improve health conditions in developing countries
• WHO Recommendations: • Timely initiation (within 1 hour) • Exclusive breastfeeding for six months • Continued breastfeeding though 24 months

“The role of demand and supply level factors in shaping optimal exclusive breastfeeding practices. Results from IFLS-East 2012”
I. Introduction
• Long standing literature on the effects of breastfeeding but
relatively less research on the determinants of breastfeeding • Modernization hypothesis
• Virtually no research focused on the determinants of optimal infant feeding practices
• Our contribution:
• Focus on exclusive breastfeeding for six months • Considering the role of the interplay between demand and
supply side variables • Accruing current knowledge on Eastern Indonesian region
“The role of demand and supply level factors in shaping optimal exclusive breastfeeding practices. Results from IFLS-East 2012”
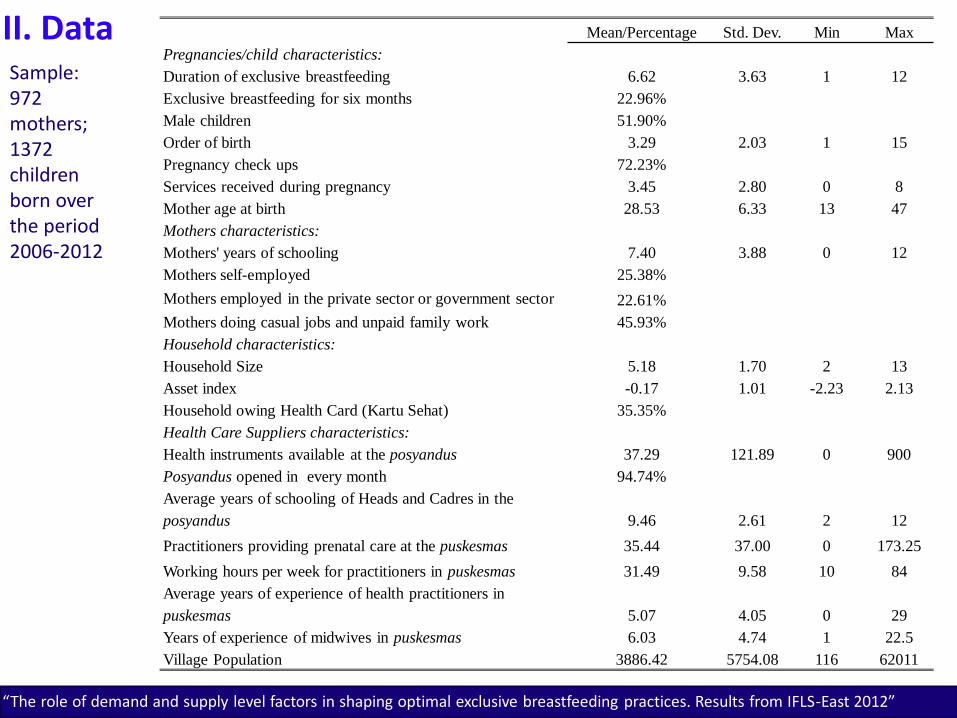
II. Data Mean/Percentage Std. Dev. Min Max
Pregnancies/child characteristics:
Duration of exclusive breastfeeding 6.62 3.63 1 12
Exclusive breastfeeding for six months 22.96%
Male children 51.90%
Order of birth 3.29 2.03 1 15
Pregnancy check ups 72.23%
Services received during pregnancy 3.45 2.80 0 8
Mother age at birth 28.53 6.33 13 47
Mothers characteristics:
Mothers' years of schooling 7.40 3.88 0 12
Mothers self-employed 25.38%
Mothers employed in the private sector or government sector 22.61%
Mothers doing casual jobs and unpaid family work 45.93%
Household characteristics:
Household Size 5.18 1.70 2 13
Asset index -0.17 1.01 -2.23 2.13
Household owing Health Card (Kartu Sehat) 35.35%
Health Care Suppliers characteristics:
Health instruments available at the posyandus 37.29 121.89 0 900
Posyandus opened in every month 94.74%
Average years of schooling of Heads and Cadres in the
posyandus 9.46 2.61 2 12
Practitioners providing prenatal care at the puskesmas 35.44 37.00 0 173.25
Working hours per week for practitioners in puskesmas 31.49 9.58 10 84
Average years of experience of health practitioners in
puskesmas 5.07 4.05 0 29
Years of experience of midwives in puskesmas 6.03 4.74 1 22.5
Village Population 3886.42 5754.08 116 62011
Sample: 972 mothers; 1372 children born over the period 2006-2012
“The role of demand and supply level factors in shaping optimal exclusive breastfeeding practices. Results from IFLS-East 2012”
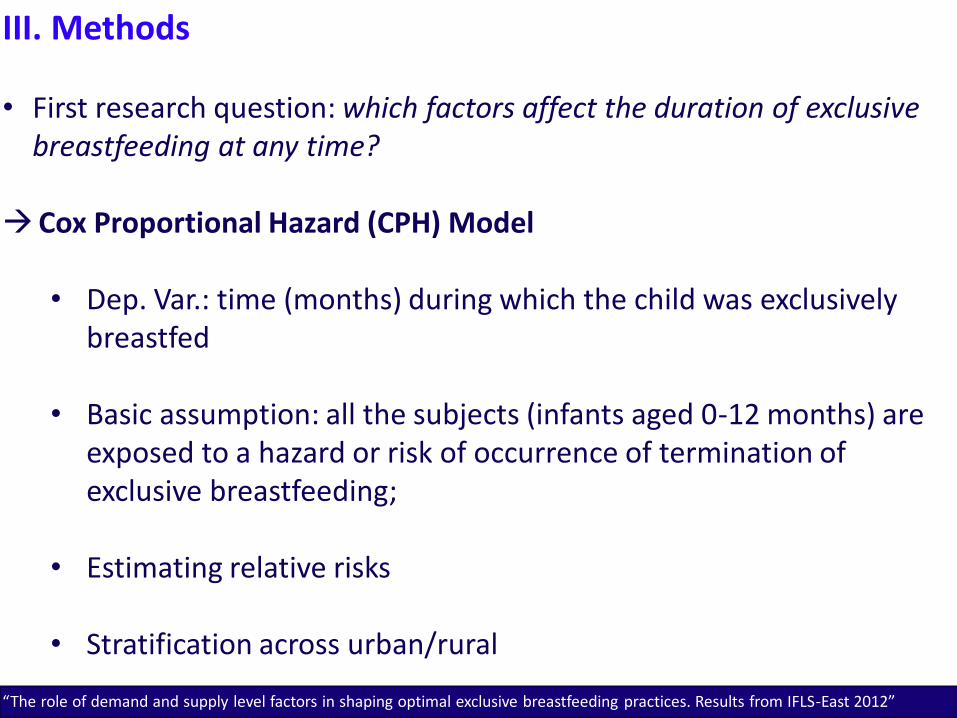
III. Methods
• First research question: which factors affect the duration of exclusive breastfeeding at any time?
Cox Proportional Hazard (CPH) Model
• Dep. Var.: time (months) during which the child was exclusively breastfed
• Basic assumption: all the subjects (infants aged 0-12 months) are
exposed to a hazard or risk of occurrence of termination of exclusive breastfeeding;
• Estimating relative risks • Stratification across urban/rural
“The role of demand and supply level factors in shaping optimal exclusive breastfeeding practices. Results from IFLS-East 2012”
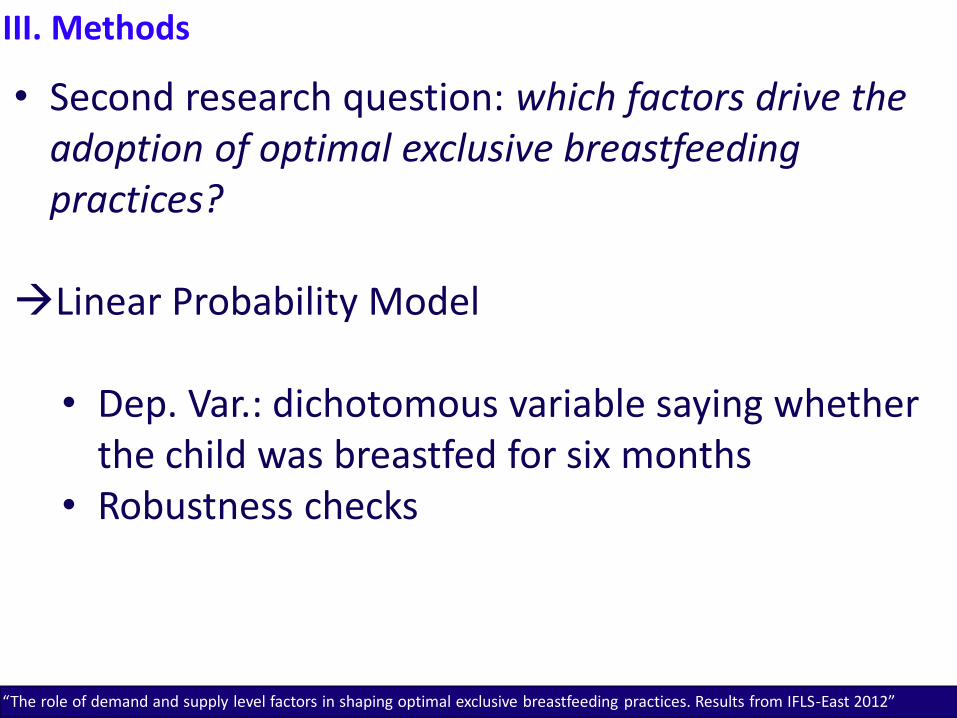
III. Methods
• Second research question: which factors drive the adoption of optimal exclusive breastfeeding practices?
Linear Probability Model
• Dep. Var.: dichotomous variable saying whether the child was breastfed for six months
• Robustness checks

“The role of demand and supply level factors in shaping optimal exclusive breastfeeding practices. Results from IFLS-East 2012”
Results: (a) Determinants of duration of
exclusive breastfeeding

(c1) (c2) (c3) (c4) (c5) (c6) (c7) (c8) (c9) (c10) (c11) (c12) (c13) (c14) (c15)
Boy 0.0219 0.0214 -0.00496 -0.0110 0.0160 -0.00611 0.000108 0.00175 0.0141 -0.00802 0.0135 -0.00803 -0.00539 -0.0260 -0.0315
(0.0579) (0.0579) (0.0580) (0.0580) (0.0600) (0.0583) (0.0585) (0.0585) (0.0614) (0.0586) (0.0614) (0.0586) (0.0585) (0.0668) (0.0697)
Birth order 0.0212 0.0208 0.0214 0.0189 0.00955 0.0219 0.0210 0.0214 0.0148 0.0209 0.0162 0.0206 0.0183 0.00486 -0.00369
(0.0217) (0.0218) (0.0219) (0.0223) (0.0230) (0.0221) (0.0220) (0.0220) (0.0231) (0.0221) (0.0230) (0.0221) (0.0222) (0.0249) (0.0262)
Mother age at birth 0.00567 0.00571 -0.00159 -0.000308 0.000230 -0.00295 -0.00241 -0.00234 -0.000689 -0.00213 -0.00125 -0.00211 -0.00136 -0.00111 0.000398
(0.00583) (0.00584) (0.00590) (0.00582) (0.00614) (0.00597) (0.00593) (0.00593) (0.00613) (0.00596) (0.00613) (0.00596) (0.00599) (0.00678) (0.00708)
Household size -0.0338 -0.0339 -0.00776 -0.000913 -0.00392 -0.00697 -0.00893 -0.00968 -0.00453 -0.0102 -0.00513 -0.00993 -0.00914 -0.0243 -0.0218
(0.0214) (0.0215) (0.0211) (0.0211) (0.0218) (0.0212) (0.0212) (0.0212) (0.0220) (0.0213) (0.0220) (0.0214) (0.0213) (0.0244) (0.0249)
Mothers years of schooling 0.00394 0.00366 -0.0202* -0.0257** -0.0214* -0.0221** -0.0210* -0.0213** -0.0237** -0.0226** -0.0230** -0.0225** -0.0232** -0.0258** -0.0233*
(0.0102) (0.0103) (0.0106) (0.0105) (0.0110) (0.0107) (0.0107) (0.0107) (0.0111) (0.0107) (0.0111) (0.0107) (0.0107) (0.0123) (0.0129)
Asset index 0.00980 0.0104 -0.0275 -0.0294 -0.0175 -0.0274 -0.0215 -0.0240 -0.0188 -0.0190 -0.0216 -0.0191 -0.0109 -0.00632 -0.0468
(0.0443) (0.0444) (0.0448) (0.0447) (0.0463) (0.0453) (0.0451) (0.0453) (0.0471) (0.0458) (0.0471) (0.0458) (0.0456) (0.0525) (0.0561)
Mother self employied -0.104 -0.104 -0.107 -0.102 -0.138* -0.108 -0.104 -0.102 -0.123 -0.114 -0.118 -0.114 -0.111 -0.205** -0.152*
(0.0747) (0.0747) (0.0746) (0.0742) (0.0783) (0.0748) (0.0748) (0.0748) (0.0791) (0.0750) (0.0792) (0.0752) (0.0751) (0.0873) (0.0907)
Mother employed in gov/priv 0.0798 0.0812 0.0124 0.0181 -0.00298 0.0114 0.0117 0.0172 -0.00803 0.000379 -0.0159 -0.00187 0.00377 -0.0814 -0.107
(0.0932) (0.0935) (0.0934) (0.0920) (0.0951) (0.0938) (0.0934) (0.0937) (0.0962) (0.0942) (0.0966) (0.0948) (0.0943) (0.105) (0.108)
Health Card 0.0111 -0.0618 -0.0973 -0.0539 -0.0571 -0.0584 -0.0605 -0.0657 -0.0676 -0.0630 -0.0673 -0.0587 -0.0782 -0.0454
(0.0630) (0.0634) (0.0633) (0.0657) (0.0638) (0.0637) (0.0638) (0.0669) (0.0637) (0.0669) (0.0638) (0.0641) (0.0738) (0.0779)
Pregnancy Services 0.133*** 0.137*** 0.134*** 0.135*** 0.141*** 0.137*** 0.134*** 0.0859** 0.131*** 0.135*** 0.132*** -0.0141
(0.0117) (0.0121) (0.0117) (0.0117) (0.0152) (0.0124) (0.0118) (0.0400) (0.0171) (0.0119) (0.0134) (0.0217)
Pregnancy checkup 1.104*** 1.309***
(0.0757) (0.140)
Pos.opened every months -0.163 -0.452***
(0.137) (0.174)
Village Population 4.86e-06 1.53e-05*
(6.95e-06) (8.28e-06)
Pos. health instruments 0.000129 -6.39e-05
(0.000231) (0.000244)
Pus. Practitioners prenatal care -0.00101 -0.000243 -0.00161*
(0.000824) (0.00135) (0.000964)
Pregnancy services *Pus. Practitioners prenatal care -0.000194
(0.000272)
Pos.Years of schooling of heads 0.0205 0.000924 0.0318**
(0.0136) (0.0199) (0.0161)
Pus. Practitioners years of experience 0.00418 0.00259 -0.0271
(0.00796) (0.0109) (0.0219)
Pregnancy services*Pos.Years of schooling of heads 0.00557
(0.00412)
Pregnancy services*Pus.Practitioners Years of experience 0.000557
(0.00257)
Pus. Practitionners working hours -0.00430 3.71e-05
(0.00321) (0.00363)
Years of experience of midwives -0.00426 0.00252
(0.00763) (0.0126)
h0(0) rural 0.91 0.91 0.92 0.95 0.92 0.92 0.92 0.92 0.94 0.93 0.93 0.92 0.91 0.91 0.94
h0(0) urban 0.91 0.91 0.93 0.95 0.92 0.93 0.93 0.93 0.95 0.93 0.94 0.93 0.92 0.91 0.94
Observations 1,203 1,203 1,203 1,203 1,127 1,188 1,188 1,188 1,081 1,179 1,081 1,179 1,179 916 857

“The role of demand and supply level factors in shaping optimal exclusive breastfeeding practices. Results from IFLS-East 2012”
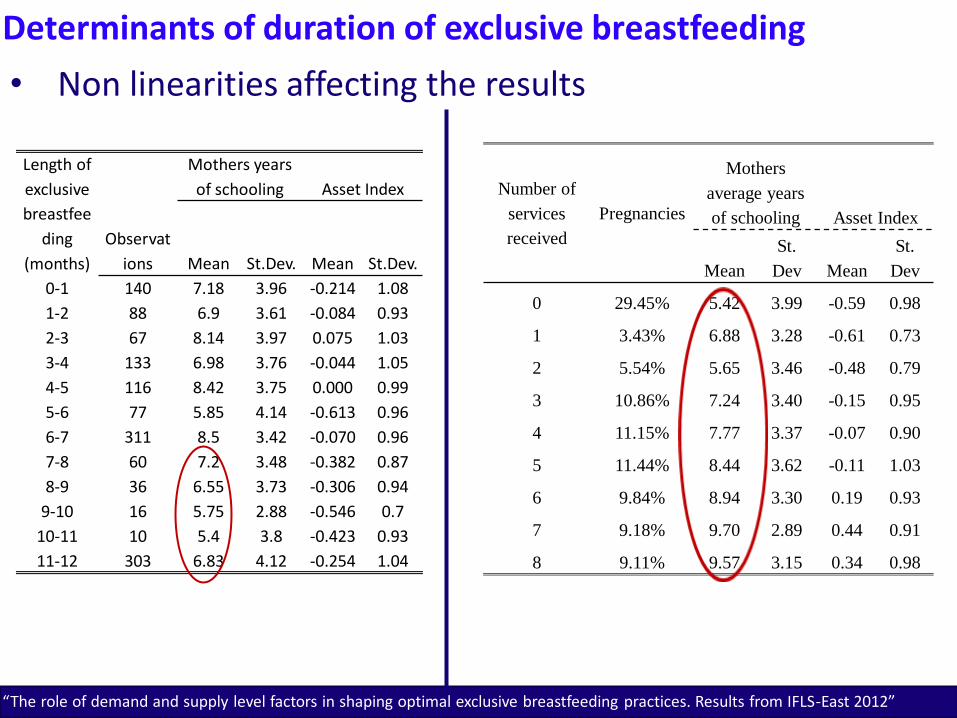
Determinants of duration of exclusive breastfeeding
• Maternal education associated negatively and significantly with the risk of termination of exc. bf.
• Pregnancy Checkup and Number of pregnancy
services associated positively and significantly with the risk of termination of exc. bf.
• No significant role played by the supply
variables
“The role of demand and supply level factors in shaping optimal exclusive breastfeeding practices. Results from IFLS-East 2012”
Determinants of duration of exclusive breastfeeding
• Non linearities affecting the results
Length of
exclusive
breastfee
ding
(months)
Mothers years
of schooling Asset Index
Observat
ions Mean St.Dev. Mean St.Dev.
0-1 140 7.18 3.96 -0.214 1.08
1-2 88 6.9 3.61 -0.084 0.93
2-3 67 8.14 3.97 0.075 1.03
3-4 133 6.98 3.76 -0.044 1.05
4-5 116 8.42 3.75 0.000 0.99
5-6 77 5.85 4.14 -0.613 0.96
6-7 311 8.5 3.42 -0.070 0.96
7-8 60 7.2 3.48 -0.382 0.87
8-9 36 6.55 3.73 -0.306 0.94
9-10 16 5.75 2.88 -0.546 0.7
10-11 10 5.4 3.8 -0.423 0.93
11-12 303 6.83 4.12 -0.254 1.04
Number of
services
received
Pregnancies
Mothers
average years
of schooling Asset Index
Mean
St.
Dev Mean
St.
Dev
0 29.45% 5.42 3.99 -0.59 0.98
1 3.43% 6.88 3.28 -0.61 0.73
2 5.54% 5.65 3.46 -0.48 0.79
3 10.86% 7.24 3.40 -0.15 0.95
4 11.15% 7.77 3.37 -0.07 0.90
5 11.44% 8.44 3.62 -0.11 1.03
6 9.84% 8.94 3.30 0.19 0.93
7 9.18% 9.70 2.89 0.44 0.91
8 9.11% 9.57 3.15 0.34 0.98

“The role of demand and supply level factors in shaping optimal exclusive breastfeeding practices. Results from IFLS-East 2012”
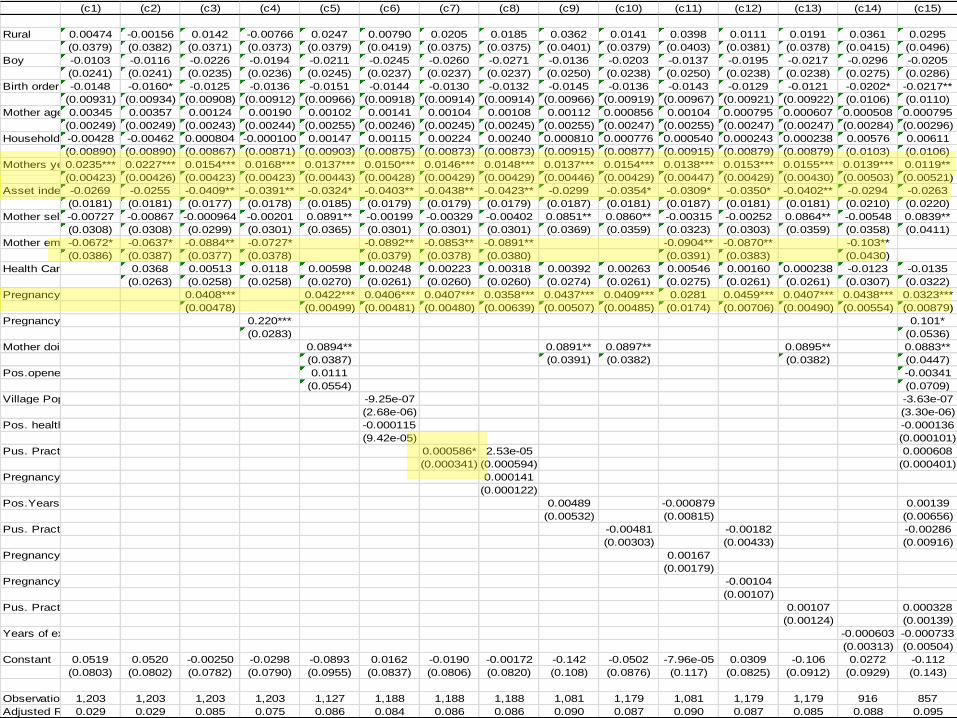
Results: (b) Determinants of optimal
exclusive breastfeeding practices
(c1) (c2) (c3) (c4) (c5) (c6) (c7) (c8) (c9) (c10) (c11) (c12) (c13) (c14) (c15)
Rural 0.00474 -0.00156 0.0142 -0.00766 0.0247 0.00790 0.0205 0.0185 0.0362 0.0141 0.0398 0.0111 0.0191 0.0361 0.0295
(0.0379) (0.0382) (0.0371) (0.0373) (0.0379) (0.0419) (0.0375) (0.0375) (0.0401) (0.0379) (0.0403) (0.0381) (0.0378) (0.0415) (0.0496)
Boy -0.0103 -0.0116 -0.0226 -0.0194 -0.0211 -0.0245 -0.0260 -0.0271 -0.0136 -0.0203 -0.0137 -0.0195 -0.0217 -0.0296 -0.0205
(0.0241) (0.0241) (0.0235) (0.0236) (0.0245) (0.0237) (0.0237) (0.0237) (0.0250) (0.0238) (0.0250) (0.0238) (0.0238) (0.0275) (0.0286)
Birth order -0.0148 -0.0160* -0.0125 -0.0136 -0.0151 -0.0144 -0.0130 -0.0132 -0.0145 -0.0136 -0.0143 -0.0129 -0.0121 -0.0202* -0.0217**
(0.00931) (0.00934) (0.00908) (0.00912) (0.00966) (0.00918) (0.00914) (0.00914) (0.00966) (0.00919) (0.00967) (0.00921) (0.00922) (0.0106) (0.0110)
Mother age at birth0.00345 0.00357 0.00124 0.00190 0.00102 0.00141 0.00104 0.00108 0.00112 0.000856 0.00104 0.000795 0.000607 0.000508 0.000795
(0.00249) (0.00249) (0.00243) (0.00244) (0.00255) (0.00246) (0.00245) (0.00245) (0.00255) (0.00247) (0.00255) (0.00247) (0.00247) (0.00284) (0.00296)
Household size-0.00428 -0.00462 0.000804 -0.000100 0.00147 0.00115 0.00224 0.00240 0.000810 0.000776 0.000540 0.000243 0.000238 0.00576 0.00611
(0.00890) (0.00890) (0.00867) (0.00871) (0.00903) (0.00875) (0.00873) (0.00873) (0.00915) (0.00877) (0.00915) (0.00879) (0.00879) (0.0103) (0.0106)
Mothers years of schooling0.0235*** 0.0227*** 0.0154*** 0.0168*** 0.0137*** 0.0150*** 0.0146*** 0.0148*** 0.0137*** 0.0154*** 0.0138*** 0.0153*** 0.0155*** 0.0139*** 0.0119**
(0.00423) (0.00426) (0.00423) (0.00423) (0.00443) (0.00428) (0.00429) (0.00429) (0.00446) (0.00429) (0.00447) (0.00429) (0.00430) (0.00503) (0.00521)
Asset index -0.0269 -0.0255 -0.0409** -0.0391** -0.0324* -0.0403** -0.0438** -0.0423** -0.0299 -0.0354* -0.0309* -0.0350* -0.0402** -0.0294 -0.0263
(0.0181) (0.0181) (0.0177) (0.0178) (0.0185) (0.0179) (0.0179) (0.0179) (0.0187) (0.0181) (0.0187) (0.0181) (0.0181) (0.0210) (0.0220)
Mother self employied-0.00727 -0.00867 -0.000964 -0.00201 0.0891** -0.00199 -0.00329 -0.00402 0.0851** 0.0860** -0.00315 -0.00252 0.0864** -0.00548 0.0839**
(0.0308) (0.0308) (0.0299) (0.0301) (0.0365) (0.0301) (0.0301) (0.0301) (0.0369) (0.0359) (0.0323) (0.0303) (0.0359) (0.0358) (0.0411)
Mother employed in gov/priv-0.0672* -0.0637* -0.0884** -0.0727* -0.0892** -0.0853** -0.0891** -0.0904** -0.0870** -0.103**
(0.0386) (0.0387) (0.0377) (0.0378) (0.0379) (0.0378) (0.0380) (0.0391) (0.0383) (0.0430)
Health Card 0.0368 0.00513 0.0118 0.00598 0.00248 0.00223 0.00318 0.00392 0.00263 0.00546 0.00160 0.000238 -0.0123 -0.0135
(0.0263) (0.0258) (0.0258) (0.0270) (0.0261) (0.0260) (0.0260) (0.0274) (0.0261) (0.0275) (0.0261) (0.0261) (0.0307) (0.0322)
Pregnancy Services 0.0408*** 0.0422*** 0.0406*** 0.0407*** 0.0358*** 0.0437*** 0.0409*** 0.0281 0.0459*** 0.0407*** 0.0438*** 0.0323***
(0.00478) (0.00499) (0.00481) (0.00480) (0.00639) (0.00507) (0.00485) (0.0174) (0.00706) (0.00490) (0.00554) (0.00879)
Pregnancy checkup 0.220*** 0.101*
(0.0283) (0.0536)
Mother doing casual/unpaid work 0.0894** 0.0891** 0.0897** 0.0895** 0.0883**
(0.0387) (0.0391) (0.0382) (0.0382) (0.0447)
Pos.opened every months 0.0111 -0.00341
(0.0554) (0.0709)
Village Population -9.25e-07 -3.63e-07
(2.68e-06) (3.30e-06)
Pos. health instruments -0.000115 -0.000136
(9.42e-05) (0.000101)
Pus. Practitioners prenatal care 0.000586* 2.53e-05 0.000608
(0.000341) (0.000594) (0.000401)
Pregnancy services *Pus. Practitioners prenatal care 0.000141
(0.000122)
Pos.Years of schooling of heads 0.00489 -0.000879 0.00139
(0.00532) (0.00815) (0.00656)
Pus. Practitioners years of experience -0.00481 -0.00182 -0.00286
(0.00303) (0.00433) (0.00916)
Pregnancy services*Pos.Years of schooling of heads 0.00167
(0.00179)
Pregnancy services*Pus.Practitioners Years of experience -0.00104
(0.00107)
Pus. Practitionners working hours 0.00107 0.000328
(0.00124) (0.00139)
Years of experience of midwives -0.000603 -0.000733
(0.00313) (0.00504)
Constant 0.0519 0.0520 -0.00250 -0.0298 -0.0893 0.0162 -0.0190 -0.00172 -0.142 -0.0502 -7.96e-05 0.0309 -0.106 0.0272 -0.112
(0.0803) (0.0802) (0.0782) (0.0790) (0.0955) (0.0837) (0.0806) (0.0820) (0.108) (0.0876) (0.117) (0.0825) (0.0912) (0.0929) (0.143)
Observations 1,203 1,203 1,203 1,203 1,127 1,188 1,188 1,188 1,081 1,179 1,081 1,179 1,179 916 857
Adjusted R-squared0.029 0.029 0.085 0.075 0.086 0.084 0.086 0.086 0.090 0.087 0.090 0.087 0.085 0.088 0.095

“The role of demand and supply level factors in shaping optimal exclusive breastfeeding practices. Results from IFLS-East 2012”
Determinants of optimal exclusive breastfeeding practices
• Male and high order-children are negatively associated with exclusive breastfeeding. • Gender bias in parental preferences (see Ralston, 1997) • Rise in the opportunity cost of time
• Mother’s age at birth is positively associated with the probability of exclusive breastfeeding: • “Experience” effect
“The role of demand and supply level factors in shaping optimal exclusive breastfeeding practices. Results from IFLS-East 2012”
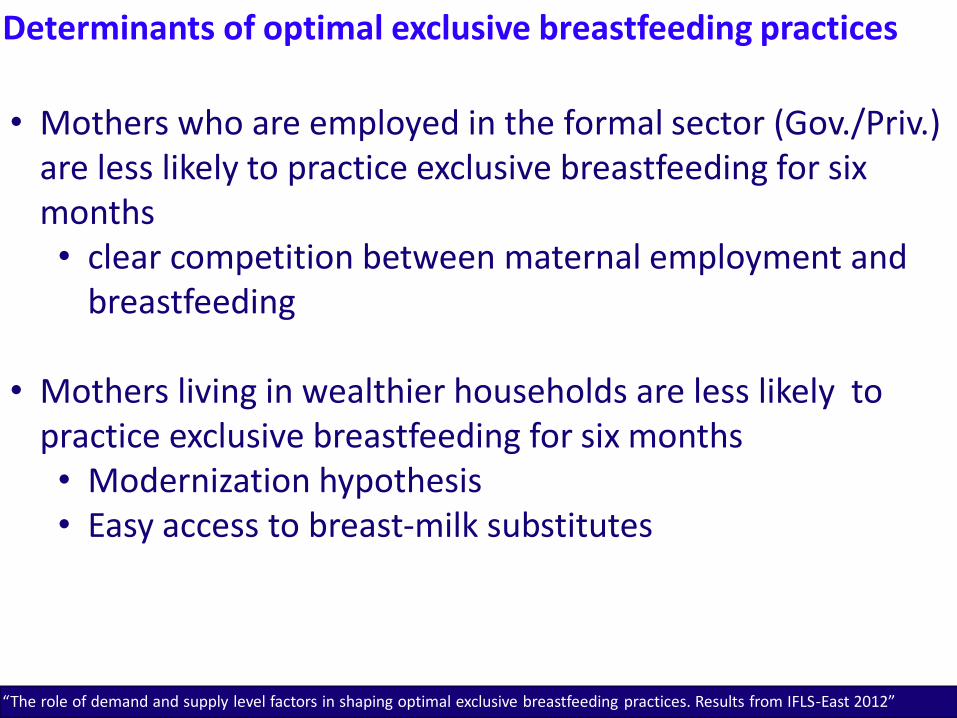
Determinants of optimal exclusive breastfeeding practices
• Mothers who are employed in the formal sector (Gov./Priv.) are less likely to practice exclusive breastfeeding for six months • clear competition between maternal employment and
breastfeeding
• Mothers living in wealthier households are less likely to practice exclusive breastfeeding for six months • Modernization hypothesis • Easy access to breast-milk substitutes

“The role of demand and supply level factors in shaping optimal exclusive breastfeeding practices. Results from IFLS-East 2012”
Determinants of optimal exclusive breastfeeding practices
• More educated mothers are more likely to adopt optimal infant feeding practices.
• Part of the positive effect of maternal education is channeled by mothers’ demand for prenatal health services.
• Positive and significant effect of pregnancy services • More interaction with health practitioners affecting
mothers knowledge

“The role of demand and supply level factors in shaping optimal exclusive breastfeeding practices. Results from IFLS-East 2012”
Conclusion
• Major contribution is on our focus on optimal breastfeeding.
• Low cost intervention for reducing rates of morbidity/mortality for infants and mothers.
Main Findings and Policy implications: • Education policies: mothers with more education tend to
adopt optimal breastfeeding practices (confirming the findings from Akin et al. 1981). • Education campaign, for all women, irrespective of
education (i.e. mass media promotion or advertising material exposed at health posts), may help to positively influence women’s attitudes towards breastfeeding.

“The role of demand and supply level factors in shaping optimal exclusive breastfeeding practices. Results from IFLS-East 2012”
Conclusion
• Supply and quality of health infrastructure seem to be not important in affecting exclusive breastfeeding practices but the advice from health professional received during pregnancy can influence breastfeeding decision strongly. • Moreover, part of the effect of maternal education is channeled by mothers demand for health care services. • A policy recommendation therefore would be to increase access to pregnancy services.

Terima Kasih!
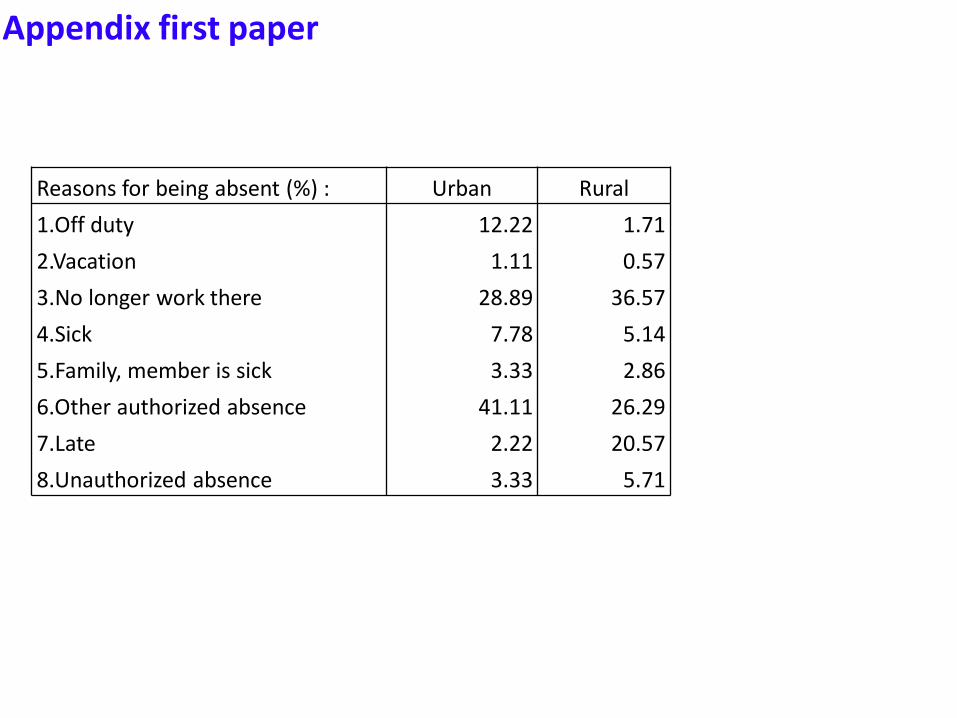
Appendix first paper
Reasons for being absent (%) : Urban Rural
1.Off duty 12.22 1.71
2.Vacation 1.11 0.57
3.No longer work there 28.89 36.57
4.Sick 7.78 5.14
5.Family, member is sick 3.33 2.86
6.Other authorized absence 41.11 26.29
7.Late 2.22 20.57
8.Unauthorized absence 3.33 5.71

Appendix first paper
Urban Rural
% of puskesmas/pustu which received Health Operational Assistance (BOK) program 97.37 81.35
Amount of the budget derived from the BOK for the last year's budget (rupiah) 180,000,000 112,000,000
Amount of the budget derived from the BOK for the current year's budget (rupiah) 183,000,000 132,000,000
% of puskesmas/pustu which recently have finished Budget Year 2011 97.37 89.83
% of puskesmas/pustu which recently have finished Budget Year 2011/2012 2.63 10.17
% of puskemas which did not send budget proposal Local Gov. (Dinas Kesehatan) for the
past budget year 68.42 67.80
% of puskemas which sent specific budget proposal to Local Gov. (Dinas Kesehatan) for the
past budget year 31.58 32.20
Budget proposed by puskesmas to Local Gov./Dinas for the past budget year (rupiah) 445,000,000 206,000,000
Budget of the puskesmas for the last budget year (rupiah) 410,000,000 232,000,000
% of the budget comprised from:
Assistance from regional government 44.39 22.28
Assistance from central government 21.05 43.97
Claim from Jamkesmas/Jamkesda 19.68 35.47
Patients 4.85 1.89
Askes 7.32 3.05
Other Assistance 0.31 0.17
% of puskesmas that did not receive any revenue/patient target from Dinas Kesehatan for
past budget year 80.56 71.79
% of puskesmas that received revenue/patient target from Dinas Kesehatan for past budget
year 19.44 28.21
Target of revenue from patients set by Local Gov./Dinas (rupiah) 23,100,000 15,100,000

Appendix second paper
Full Breastfeeding
Exclusive
breastfeeding 5-7
months
Probit
Baseline Extended Baseline Extended Baseline Extended
Mother
Education 0.0145*** 0.0103* 0.0140*** 0.0197*** 0.0568*** 0.0397**
Pregnancy
Services 0.0416*** 0.0304*** 0.0588*** 0.0321*** 0.144*** 0.0948***