public funds to protected areas -...
TRANSCRIPT

Public Funds to Protected Areas Written by Stephanie Mansourian and Nigel Dudley
27 February 2008
Swiss National Park © PJ Stephenson

2
Published by WWF International Written by Stephanie Mansourian and Nigel Dudley Protected Areas for a Living Planet — delivering on CBD commitments. Developed with the support of MAVA Fondation pour la Protection de la Nature, WWF’s Protected Areas for a Living Planet programme is working in key ecoregions to help governments meet bold targets for biodiversity conservation. Launched in January 2007, the programme brings together partners and stakeholders to support and monitor implementation of the Convention on Biological Diversity’s Programme of Work on Protected Areas (PoWPA) — an historic commitment by 190 governments to create a global network of comprehensive, well-managed, and representative terrestrial and marine protected areas. Protected Areas for a Living Planet is WWF’s contribution to helping governments achieve the 2010 Target to reduce the current rate of biodiversity loss by 2010. Meeting this target is not only essential to safeguard our world’s unique species and habitats, but also essential to improving the food security, health, and income of poor communities worldwide and therefore to achieving the Millennium Development Goals. For more information, visit www.panda.org/pa4lp or contact Rolf Hogan, CBD Manager at WWF International, [email protected],Tel: +41 22 364 9391

3
Acknowledgements We would like to thank WWF, and in particular Rolf Hogan and Gordon Shepherd, for asking us to prepare this report. The report could not have been completed without input from numerous people including: Marc Hockings (Australia), Elshad Askerov (Azerbaijan), Catherine Debruyne (Belgium), Sergio Eguino (Bolivia), Luis Pabon (Bolivia), Moemi Batshabang (Botswana), Nik Lopoukhine (Canada), Stella Satalic (Croatia), Pedro Rosabal Gonzales (Cuba), Jana Vavrinova (Czech Republic), Michael Baltzer (Danube-Carpathian region), Hildegard Meyer (Danube-Carpathian region), Tove Maria Ryding (Denmark), Jose Galindo (Ecuador), Tarsicio Granizo (Ecuador), Mervi Heinonen (Finland), Harri Karjalainen (Finland), Jukka Mustonen (Finland), Didier Babin (France), Brigitte Carr (Gabon), Alfred Oteng-Yeboah (Ghana), Sigurdur Thrainsson (Iceland), Roland Eve (Lao PDR), Boris Saraber (Lao PDR), Nanie Ratsifandrihamanana (Madagascar), Erik Reed (Madagascar), Vanessa Perez-Cirera (Mexico), Amanda Fine (Mongolia), Tilman Jaeger (Mongolia), Tony Whitten (Mongolia), Giovanna Dore (Mongolia), Santosh Nepal (Nepal), Devendra Rana (Nepal) Aldo Soto (Peru), Fred Prins (Peru), Anabelle Plantilla (The Philippines), Natalia Danilina (Russian Federation), Vladimir Krever (Russian Federation), Olivier Biber (Switzerland), Robert Lamb (Switzerland), Sedat Kalem (Turkey), Vasyl Prydatko (Ukraine), David Harmon (US), Chris Dickinson (Vietnam) and Eric Coull (Vietnam). We are very grateful to the following for their contributions to the national examples in the annexe: Andreas Baumueller, Mervi Heinonen, Erik Reed and Surin Suksuwan. In addition, the following provided helpful comments on the overall document: Andreas Baumueller, Alexander Belokurov, Aaron Bruner, Lucy Emerton, Pablo Gutman, Matthew Hatchwell, Rolf Hogan, Sally Nicholson, Gordon Shepherd, Gerald Steindlegger and Sue Stolton. Disclaimer: The material and geographical designations in this report do not imply the expression of any opinion whatsoever on the part of WWF concerning the legal status of any country, territory or area, or concerning the delimitation of its frontiers or boundaries. The authors are responsible for the content of this report. Their opinions do not necessarily represent the views of WWF.

4
Table of Contents Executive summary List of tables Section 1 – Introduction Section 2 – The Role of the Public Sector in Protected Areas Section 3 – Data on Public Funding to Protected Areas Section 4 – Public Funds to Protected Areas: Relative Values and Trends Section 5 – Conclusions and Recommendations References
Annexes
Annexe 1 – Complete data from analysis of biodiversity importance
Annexe 2 – National examples
5
List of Tables
Table 1: Comparison of EU subsidies and EU biodiversity spending under LIFE+
Table 2: Public funding to protected areas in USD
Table 3: Public funds spent per hectare of protected area
Table 4: Data on government funding to their own protected areas as % of GDP in decreasing order
Table 5: ODA to protected areas
Table 6: Proportion of in-country, ODA and GEF (biodiversity) funding to GDP
Table 7: Environment aid 2003-2004 versus total aid
Table 8: Real estimates of funding needs for protected areas versus GDP
Table 9: Countries split as high, medium, low biodiversity
Table 10: Countries ranked as high, medium, low biodiversity based on above proxy analysis
Table 11: Recipients of largest number of OECD countries’ environment ODA compared with their biodiversity value using a range of selection criteria
Table 12: Proportion of funding from various sources for Finland’s protected areas (2006)
Table 13: Breakdown of person-years allocated to different tasks in Finland’s protected areas
Table 14: Expansion of Madagascar’s PA network
Table 15: Financing for ANGAP (USD)/y. during the period 2004-2009 (under the PE III)
Table 16: Operational budget fiscal gap of protected areas in Malaysia
Table 17: Ukraine public sources of environment funding (January-June 2005)
6
Executive Summary “Protected areas deserve significant financial support owing to the tremendous benefits they provide” (Recommendation 7 of the Vth World Parks’ Congress at Durban, IUCN, 2004) Protected areas remain the cornerstone of conservation strategies and a key tool in sustainable development. Yet in most countries protected areas are vastly under-resourced. Estimates of global shortfalls reach USD 45 billion per year (Balmford et al, 2002). While many alternative funding options are being developed for conservation, protected areas will continue to require a core of public funding in the foreseeable future. Governments in developing countries generally provide a certain proportion of funds to their own protected areas and make up the shortfall from alternative sources: conservation organisations, foundations, multilateral agencies or others. Nonetheless, there remains a core of government support, albeit sometimes relying on money raised by the government from visitors and other fees. In developed countries, governments usually cover a much larger proportion of protected area budgets. While increasingly creative sources of funding are being tapped for protected areas, including debt for nature swaps, trust funds and payments for environmental services, ultimately as a public good protected areas are likely to continue being supported to a certain extent by public funds. Maintaining this core of funding at an acceptable level is essential to ensure that governments can meet their commitments under the CBD Programme of Work on Protected Areas. This report analyses public funding to protected areas for 50 countries. It shows that:
funding for protected areas is generally on the decrease despite commitments made by donor countries under the CBD Programme of Work on Protected Areas,
funding is an insignificant proportion of countries’ GDP, out of proportion with the biodiversity,
environmental services and cultural values of protected areas and
funding strategies do not pay sufficient attention to either the relative value of biodiversity or to particular country needs for protection.
In order to meet their CBD commitments, many countries will need to increase their funding to protected areas by a considerable degree. The report identifies the following recommendations: Recommendation 1: Countries should make more effort to determine the explicit socio-economic benefits of protected areas and their role in contributing to the Millennium Development Goals (MDGs). This will help to raise awareness of the importance of protected areas and will also indirectly help to raise funds for management activities in protected areas. Recommendation 2: Countries should be encouraged to pursue diversified funding strategies for their protected areas and to promote sustainable funding, but public funding should in most cases continue to provide an essential core of support. Recommendation 3: More accurate information on public funding to protected areas would allow a better comparison between countries. This could be done by promoting:
- accurate record-keeping; - the use of simple and internationally-accepted budgeting categories (possibly developed by IUCN and promoted by the CBD and also available through some management effectiveness assessment systems).
Recommendation 4: OECD countries should be coherent in their allotment of aid, and environment aid should at least rise in accordance with overall aid. Within environment aid, protected areas should continue to play a significant role. Recommendation 5: As OECD countries are being encouraged under the Paris Declaration on Aid Effectiveness to harmonise their allocation of aid funding, it is all the more important for recipient countries to ensure that protected areas and biodiversity are sufficiently represented in their package for aid assistance.

7
Recommendation 6: Based on our analysis, most countries should be increasing their investment in protected areas (their own or those of other countries) by at least 50 percent to represent at a minimum, between 0.02% and 0.04% of their GDP1. Recommendation 7: When investing their overseas funds dedicated to the environment and to protected areas more specifically, OECD countries should take into account the relative biodiversity values of different countries.
Calculating the figures in this report was often difficult because of diversified funding sources and the inclusion of other operations (e.g. environmental management) within a single budget. Although we have tried to clarify figures, this may have led in some cases to under-estimates or, more likely, over-estimates. We would be very interested to receive comments, criticisms and other estimates of funding.
1 However, more precise data are needed to give a better indication of the level of GDP that should support protected areas. If the recommendations about data collection and analysis made in this report are followed, more precise estimates of necessary funding will be available to calculate necessary inputs from governments.
8
Section 1 – Introduction “In the face of increasing human pressure on the planet’s resources, an effective global protected area system is the best hope for conserving viable, representative areas of natural ecosystems and their habitats and species.” (Chape et al, 2005) To date, protected areas (PAs) are the best tool we have found to conserve biodiversity and for this reason must be an essential part of any strategy that aims to conserve our biological heritage. For this to happen, protected areas have to be incorporated into our long term planning and funding strategies. At present, while Parties to the CBD have expressed commitment to improving their protected area networks, these often remain seriously under-resourced. Without sufficient funding, protected areas cannot meet their objectives of conserving biodiversity and providing public goods like water purification. Protected areas can be seen as our “nest eggs” harbouring a variety of species, many of which have unique characteristics to sustain life (providing food, other resources or genetic material); many others have intrinsic value, including spiritual value to many communities. Yet others have values we still do not even understand or recognise. Given humanity’s growing impact on the planet, the benefits provided by protected areas are all the more essential. With increasing threats linked to climate change, protected areas are critical in helping species to adapt to changing conditions. Protected areas are fundamental not only to biodiversity conservation but also to sustainable development efforts. Relatively intact ecosystems and biodiversity, as found in protected areas, offer numerous species of value to people, for medicine, food and housing, as raw materials for subsistence use or sale. They also offer environmental services such as the recycling of nutrients, soil stabilisation, filtering water, absorbing carbon dioxide etc. As global attention is focused on climate change, it is noteworthy that forested protected areas which account for over 40% of the global protected area estate (Chape et al, 2003) hold a tremendous source of carbon. Thus, in the context of climate change, improving management in these protected areas and creating new forest protected areas are subjects that are increasingly capturing global interest. As stores of valuable environmental goods and services, protected areas offer many alternatives to poor people, sometimes helping to bring them out of poverty. This is especially true if we understand poverty and wellbeing as more than a minimum income figure. A multidimensional interpretation of poverty and wellbeing is more realistic and offers scope for a wider role for nature and protected areas. For example, in Ecuador about 80 percent of Quito’s 1.5 million population have drinking water from two protected areas (Antisana and Cayambe-Coca Ecological Reserve) (Pagiola et al, 2002). In addition to direct goods and services, protected areas create jobs, offer new opportunities for schooling or healthcare (as they expand the infrastructure network in their area) and offer opportunities for training. Sometimes, part of the direct revenue from the protected areas goes to local communities, such as in the case of the Serengeti National Park in Tanzania where 7.5% of entrance fees, contributes to local communities’ income. Even in richer countries, the protection of nature can create jobs. It has been estimated that around 125,000 jobs were supported in the European Union through nature protection related activities in 1999 (ECOTEC, 2001). Areas that have undergone massive environmental degradation are often places of great human misery; where people face a range of problems including arid and unproductive lands, water shortages (or poor water quality) and vulnerability to major disasters, such as floods or droughts. Protected areas have been highlighted as indicators of success within the globally agreed Millennium Development Goals (MDGs) (Chape et al, 2005). Put in monetary terms, the value of ecosystem services that could be preserved via an effective network of protected areas has been estimated at USD 38 trillion per year (Quintela, et al 2004). The rate of growth of protected areas, at least terrestrial ones, has stepped up in the last decade, with 11.63% of land cover having been set aside as protected areas (but only slightly over 0.6% of our oceans are currently protected) (Mulongoy and Chape, 2004). However, percentage cover is not sufficient. For protected areas to fulfil their conservation objectives, effective management is necessary and this requires resources. In many instances, protection stops with designation. If protected areas do not have sufficient resources, they are not well managed and remain protected only on paper while in practice they continue to be seriously threatened. At the same time, there remains a lot of variability in the types of areas that are protected and therefore, the sort of biodiversity they can effectively protect. For example, mangrove ecosystems remain greatly under-represented in global protected area networks.
Kinabatangan, Malaysia, © S.Mansourian

9
Thus representation, location, management and resources are all fundamental to ensure that protected areas truly meet these biodiversity conservation objectives. But protected areas are often seriously under-resourced and in many cases, their budgets are following an alarming downward trend. Funding remains one basic and important measure of management effectiveness. Indeed, research suggests that there is often a direct correlation between budget and management effectiveness (Dudley et al, 2004). Availability of sufficient and steady funding directly affects the numbers of staff engaged, the quality of staff, the tools available for them to manage the protected areas effectively, etc. Without sufficient and regular funding, protected areas are likely to fail and with them much of our biological heritage may disappear, with all that it entails. Recommendation 1: Countries should make more effort to determine the explicit socio-economic benefits of protected areas and their role in contributing to the MDGs. This will help to raise awareness of the importance of protected areas and will also indirectly help to raise funds for management activities in protected areas. Assessing costs of protection Estimating the funding necessary for an effective protected area network is not easy. Several attempts have been made, with huge variations in results. López Ornat and Jiménez-Caballero (2006) note that three major determinants affect the cost of protection: 1. the IUCN protection category since stricter protection requires more funds, 2. whether they are marine or terrestrial, with marine sites costing much more, and 3. size, with larger protected areas costing relatively less to protect because of economies of scale. An assessment by Bruner et al (2004) refers to an annual deficit of USD 1-1.7 billion for managing current protected areas in developing countries and an additional annual amount of USD 4 billion for the creation of new protected areas over the next decade. Another estimate places this figure at a much higher USD 23.5 billion (Quintela et al, 2004). Balmford et al (2002) estimated an amount of USD 45 billion per year to have an effective global protected area system. More recently, Balmford et al (2004) also undertook a study to estimate the amount of funding necessary for a global network of marine protected areas (MPAs) covering 20-30% of the seas and came up with the figure of USD 5-19 billion per year. At the European level alone, in its July 2004 Communication (COM (2004) 431) the European Commission estimated financing costs of Natura 2000 at EUR 6.1 billion per year. This figure was based largely on individual questionnaire responses from Member States. A new estimate based on individual questionnaires should be available soon which will include also the estimate of costs of the recently joined Member States of Romania and Bulgaria. While a number of strategies are being pursued to diversify funding to protected areas, governments are likely to remain an important source of regular funding (for e.g., Emerton et al, 2005 and Balmford and Whitten, 2003), particularly as protected areas provide a public good and a number of public services. In addition, protected areas bring in additional resources through for example, entry fees and through the creation of jobs. Balmford et al (2004) note for instance that the cost of creating a global network of MPAs is still substantially lower than the current expenditure on harmful (and unsustainable) global fisheries subsidies, which amount to an estimated USD 15-30 billion annually (estimate from the year 2000). At the EU level alone biodiversity spending under LIFE+ (the financial instrument for the environment) as shown in table 1 below, compares very modestly to subsidies in the agriculture and fisheries sectors. Although biodiversity spending has been integrated into many other EU funding lines (such as rural development) the figures show that direct funds dedicated solely to biodiversity remain small (see EU example in Annexe 2). Table 1: Comparison of EU subsidies and EU biodiversity spending under LIFE+ EU Agriculture subsidies EUR 58.2 billion/year EU Fisheries subsidies EUR 1.4 billion/year EU Nature and Biodiversity spending under LIFE+ (indicative)
EUR 120 million/year (on average)
Sources: Brunner and Huyton, 2007 (for agriculture subsidies); http://www.ppionline.org/ppi_ci.cfm?knlgAreaID=108&subsecID=900003&contentID=252352 (for fisheries) And WWF EPO (for biodiversity figure.)

10
Framing the study In 1999 James et al undertook a global assessment (using 1993-95 data) of both staffing and national funding to protected areas. This report yielded interesting data on for instance, the disparities between different countries, even within a region. It also identified the great difficulty in obtaining sufficient and comparable data on these management aspects of protected areas. Since then, other than a few small scale regional attempts, as far as we are aware, there has been no comprehensive attempt at collating data on the amount of public funds that are invested in national protected area systems. In an attempt to identify more recent public sector funding trends, this report has collected information for 50 countries from Asia, Africa, Oceania, Europe, North and Latin America, essentially from 2004. We have attempted to place these data in context in order to derive meaningful conclusions about public funds to protected areas. As background, the next section looks at the role of governments in protected areas more broadly and then, with the aim of focusing down on the financial aspect, identifies the different sources of funding. While we inevitably touch upon non-public sources of funding, these are not our primary target. Sections 3 and 4 summarise our data findings for 50 countries with different tables putting the data in context. We also look in more detail at overseas aid from OECD countries for protected areas and for the environment more broadly. The important questions we asked ourselves in this research are: 1. what are governments spending on their protected areas? 2. what are governments spending on overseas protected areas? 3. what can countries afford to spend on protected areas (theirs and others)? 4. how does public funding compare with the relative value of ecosystems being protected? Therefore, in our research we have focused on three aspects: 1. the trend in public funding to the environment (and protected areas) from rich (OECD) countries, 2. the proportion of public funds spent on protected areas versus GDP and 3. a proposed way of approaching aid budgets for protected areas that takes into account relative biodiversity values.

11
Section 2 – The Role of the Public Sector in Protected Areas “Protected area “financial sustainability” refers to the ability of a country to meet all costs associated with the management of a protected area system. This implies a funding “supply” issue of generating more revenue, but just as importantly, a “demand” side challenge of managing PA financing needs (at sites and at the system level). PA financial sustainability needs to be addressed from both sides of the financial equation.” (Bovarnick, 2007) In a renewed effort to protect biodiversity, the CBD Parties adopted in 2002, the “2010 biodiversity target” which commits them to “achieve by 2010 a significant reduction of the current rate of biodiversity loss at the global, regional and national level as a contribution to poverty alleviation and to the benefit of all life on Earth”. Later in 2004, the CBD adopted a Programme of Work on Protected Areas (decision VII/28) reflecting the renewed emphasis given to the contribution that protected areas make to the Convention’s objectives. A working group was established within the Programme of Work, with one of its priority topics being to ensure sustainable financing of protected areas. Also in 2004, at the fifth Ministerial Conference “Environment for Europe”, Environment Ministers and heads of delegation from 51 countries falling under the UN Economic Commission for Europe, adopted the Kiev Resolution on Biodiversity which states that “By 2008, there will be substantially increased public and private financial investments in integrated biodiversity activities in Europe, via partnerships with the finance and business sectors, that have resulted in new investment opportunities and facilities as outlined by the European Biodiversity Resourcing Initiative, taking into account the special needs of the countries of Central and Eastern Europe, Caucasus and Central Asia.” Although protected areas can sometimes generate a proportion of their funding needs (from tourism, payment for ecosystem services etc) this is seldom sufficient to run an entire protected areas system. In the context of a sustainable and sustained network of representative protected areas, the role of governments is likely to continue being important well into the future. Despite many pressing priorities and pressures for scarce resources, investment in protected areas can be regarded as an important element of a government’s funding portfolio given the public goods and services they provide. 2.1. Government’s role The influence that governments have as guardians of natural resources is varied but usually central. They play an important role in creating protected areas, in funding and maintaining them and also in reducing negative impacts on them, for example by reducing or removing pressures. They are also responsible for policies that may or may not support protected areas. For example, when opening up new areas for housing development, governments may need to consider the impact on a protected area nearby. We look briefly here at the role of governments in the creation, maintenance and financing of protected areas, as well as in establishing a supportive policy environment. a) Governments’ role in the creation of protected areas Biodiversity is a global public good and governments have an important responsibility as guardians and stewards of this good on behalf of their people. Governments have a critical role to play in the creation of protected areas. While some protected areas are private or set up by communities, globally, most remain public (although this will differ depending on the region) and most exist on state-owned land. Given the importance of the goods and services provided by protected areas, it makes sense for governments to be the ones primarily responsible for their establishment. For instance Madagascar’s ambition to triple its protected areas is a government-led effort (see Madagascar example in annexe 2). All too often however, to meet targets, areas that are not necessarily very valuable from a biodiversity point of view are set aside as protected areas because it is easier to do this than to create protected areas on land that is likely to have high value and attract other interests. Nonetheless, increasingly efforts are being made, notably under the CBD, to reach truly representative networks of protected areas rather than simply to continue setting up protected areas that are of limited biological value but that may help achieve quantitative targets for area protected. The EU for example has designated sites based on endangered species and habitats of European interest (see annexes of the Birds and Fauna Flora Habitats Directive) and the site designation process was
Park warden in Bialowieza National Park, © S. Mansourian

12
driven by scientific information. Therefore it can be seen as a more truly representative network. However, the process to designate the sites has taken years and after 15 years is still not finalized, causing some uncertainties for landowners and land managers. b) Governments’ role in the maintenance of protected areas The maintenance of protected areas on public lands rests naturally with governments. While many different arrangements exist and there is often a mix of actors engaged in managing and owning protected areas, ultimately the responsibility for effectively managing public lands rests with the government. Maintenance will require suitable resources (linked to point d below) but also to capacity. Governments need to ensure that those given the responsibility to manage protected areas are empowered to do so. This will also signify ensuring that the relevant policies are not only in place, but are also enforced. c) Governments’ role in creating a suitable policy environment Many different national policies will influence existing and new protected areas. Policies that support protected areas are essential or else the areas risk becoming “paper parks”, the term used to describe protected areas that are designated but never properly implemented. A good understanding by governments of the required policies and the inter-linkages between protected areas and other sectors is therefore critical. Conflicting sectoral policies can have an impact on the effectiveness of protected areas or can reverse past gains in protected areas (WWF, 2006). For example, when a country might decide to open up its timber industry to increase foreign revenue, logging roads may also open up access to previously well protected areas. It is far from unknown for one government department to sell logging concessions in an area that has been protected by another department. Ultimately government policies will also affect the effective allocation of resources to protected areas (see Malaysia example in Annexe 2). Unfortunately all too often perverse subsidies continue to be cited as a major cause of environmental decline, and these are often funds that could be more effectively used in protected area conservation. d) Governments’ role in the financing of protected areas Governments are a major source of funding for protected areas. According to a study by López Ornat and Jiménez-Caballero (2006) governments typically contribute 35-40% of national protected areas’ budgets. Not only are they a significant source in total figures, but equally importantly, government funds tend to represent a secure, long term source of funding. Two fundamental concerns with funding protected areas are a) the total amount and b) the durability of the funding. In this last respect, government funding can be a “security blanket” for protected areas. The rest of this report focuses essentially on this last point. 2.2. Sources of funding for protected areas Protected areas have to cover many different costs. Bruner et al (2004) identify three areas for which funding is needed in protected areas: (1) recurrent management costs for existing areas, (2) system-wide expenses needed to support a network of protected areas, and (3) costs of bringing new areas into the system. In addition, we may note here the opportunity cost of establishing protected areas, which is rarely taken into account. A nationwide system of protected areas is costly, and will benefit from a variety of different funding options and sources. Some may be in the form of grants, others in the form of entry fees, others still as user fees (e.g.: for water), and yet others as loans. While traditionally governments have had to foot the bill for protection, increasingly, there are a myriad of creative options being proposed to support the creation and maintenance of protected areas. Some of these are briefly outlined below, split by sector. a) Public sector In most countries, governments remain the single largest funder of protected areas (López Ornat and Jiménez-Caballero, 2006). Funding for protected areas may come from the country’s own government, through budget allocations. Various ministries may contribute different amounts to a protected areas network (e.g.: see the example for Ukraine in Annexe 2). Funding may also come from foreign governments via bilateral aid (or overseas development aid), or via specific environmental funds like the Global Environment Facility (GEF). For instance, only recently in July 2007, the GEF recognising the importance of protected areas, decided to allocate 50% of its funding to protected areas work in developing countries. The World Bank in 2002 invested USD 550 million in biodiversity projects2 (Emerton et al, 2005). The pie charts below show the split in funding sources for protected areas in two very different countries, Finland and Madagascar. In the case of Finland, over 80% of funding is from the government, while for Madagascar the
2 USD 300 million through its regular portfolio and USD 250 million through the International Development Association (for the poorest countries).

13
national government only provides 6% with over 70% coming from overseas development assistance (ODA) (both from NGOs and public sector) (see both Finland and Madagascar examples in Annexe 2).
Funding Sources for Madagascar's Protected Areas
Government6%
Entrance fees4%
ODA71%
PA Trust Fund19%
Source: World Bank, 2005
Funding of Metsähallitus Natural Heritage Service in Finland - 2006
EU3%
Ministry of Environment
66%Ministry of Agriculture and
Forestry11%
Ministry of the Interior
1%
Income11%
Other funding1%
Ministry of Labour7%
Source: Metsahallitus (pers. comm.) Numerous smaller, often national, funds exist: in the last 15 years over 100 environmental funds have been created (Southey, in Quintela et al, 2004). Intergovernmental agencies also provide significant support to protected areas, for instance, the World Bank group contributed USD 183.86 million in 2003 to protected area projects (World Bank, 2003). In addition, debt-for-nature swaps are another slightly more indirect way that governments may provide funding to protected areas. The national lottery is another source of funding, which in the case of the Netherlands, for instance, has been a significant contributor to biodiversity protection across the world. Despite the importance of this funding source, it would appear that overall, during the period 2000-2003, overseas development aid (ODA) allocated to biodiversity and protected areas has been on the decline (Secretariat of the Convention on Biological Diversity, 2006). b) Private sector The private sector may provide funding via donations or grants. It is increasingly also looking at more sustainable options such as payments for environmental services (PES) schemes where companies that obtain a good or service, for instance clean water, thanks to a protected area pay those that manage this area for the service provided. For example, in Guatemala’s Sierra de las Minas, a pioneer PES scheme has been set up whereby industrial users of water downstream compensate upland farmers for protecting the watershed3. c) Non governmental organisations (NGOs) Non governmental organisations provide grants to support various protected areas. Some, such as The Nature Conservancy (TNC), specialise in buying land to manage as protected areas and hence managing them with their own resources. With limited funding, conservation organisations undertake various forms of prioritisation exercises (some 3 Fundación Defensores de la Naturaleza website: http://www.defensores.org.gt (accessed on 4 April 2007)

14
can be found in section 4 below) in order to use their funds most effectively. NGOs are often constrained by their own donors’ funding cycles (often no more than three years) and their donors’ priorities and preferences. d) Self financing Park entry fees are a steady and sustainable source of funding for the most popular protected areas: for example Serengeti National Park generates around USD10 million per year from entry fees (Serengeti management team, pers comm.). However, only a minority of parks attract sufficient visitors for this source of funds to be a secure and sufficient amount. In addition, in many countries a large part of this revenue is not reinvested in the protected area. Instead, the revenue generated by the protected area often goes back in full or in part to the central Treasury. Tourism is also a sector that is highly sensitive to economic downturns and transport prices. Particular problems can arise if government funding is linked too closely to revenue generated by the protected area itself – i.e. if protected areas are reliant on raising their own revenue, usually through gate fees. For example, the riots following a disputed election in Kenya in January 2008 led to a temporary collapse in tourism and consequently a 90 percent loss of revenue, leaving protected area managers facing a financial crisis (David Sheppard, pers comm.). In the medium term, declining oil supplies may seriously disrupt international tourism, with huge implications for protected areas. The above are just a sample of the different ways protected areas can be financed, Spergel (2001) outlined 25 different funding mechanisms, while Koteen (2004) building on Spergel’s work, identified about 30 such mechanisms. Increasingly creative means of raising revenue for conservation, and particularly protected areas, are being found. Clearly no single source of funding is sufficient, nor is it safe to rely on any single source, and a combination of funding sources is generally the best option for a national system of protected areas. For the foreseeable future, however, government funding continues to represent the most significant, stable and long term funding source for protected areas (see for e.g. Balmford and Whitten, 2003). Recommendation 2: Countries should be encouraged to pursue diversified funding strategies for their protected areas and promote sustainable funding, but public funding should in most cases continue to provide an essential core of support.

15
Section 3 – Data on Public Funding to Protected Areas The core of our research has been to obtain figures for public funding to protected areas. In this section we present information that has been collected from 50 countries in Asia, Africa, Europe, Oceania, Latin and North America. This information has essentially been gathered from government sources. However, caution needs to be taken when comparing these figures as there is no standard reporting format (as yet) allowing governments to report this data in a directly comparable form (although the CBD and others are working towards this). Nonetheless, we feel there is sufficient data to identify some trends and to allow us to make some recommendations. Table 2 below presents data on government expenditure to their own protected area networks. Most of the data is for 2004, however, when another year was used this has been noted in column 2. Table 2: Public funding to protected areas in USD Public funds for Protected Areas Year USD Source
Comments/detail
Australia 2006 558'486'550
Commonwealth of Australia: Standing Committee on Environment, Communications, Information Technology and the Arts, Conserving Australia. Australia’s national parks, conservation reserves and marine protected areas - April 2007
1. Funding includes overall Commonwealth funding + funding by individual States. 2. Covers both terrestrial and marine. 3. Note that some funding is for 2004-2005 and some for 2005-2006 4. Detail: Common wealth terrestrial: AUD 56,980,000 Commonwealth marine: AUD 3,582,000 Marine WA Dpt: AUD 9115000 Marine S. Aus AUD 222000 Great Barrier Reef: AUD 22,716,000 NSW: AUD 210,000,000+35,000,000 W.Aus: AUD 105,100,000+12,130,000 Queensland: AUD 142,500,000 S. Austr: AUD 70,000,000 N. Terri: AUD 20,600,000 ACT: AUD 19,000,000
China 2004 3'600'000
Summary Report to CCICED of the Protected Area Task Force. Using Protected Areas to Extend Economic Benefits to Rural China - Evaluation of the Protected area system of China and Policy Recommendations for rationalising the System
From central govt. for national nature reserves - NOTE that provinces also allocate funds
Indonesia 2000 716'790
Ministry of Environment Indonesia: Public Sector Support and Management of Protected Areas in Indonesia, Effendy A Sumardja, Paper presented at the 5th World Parks Congress, 2003
- Sum of "national budgeting development + national budgeting routine" - Note: exchange rate used is for 2001
Lao PDR 2002 1'284'224
ADB, GEF, UNEP, in collaboration with IGES and NIES: National Performance Assessment and Subregional Strategic Environment Framework in the Greater Mekong Subregion: LAO PDR, National Environmental Performance Assessment Report Science Technology and Environmental Agency and Project Secretariat UNEP Regional resource Center for Asia and the Pacific, March 2006
PA funding data for 2003/04 for STEA and for 2001/02 for MAF GDP data from World Bank
Mongolia 2004 356'861 Ministry of Environment: Mongolia Protected areas department
Public sector PA funding in 2005: MNT 437 mil; in 2006: MNT 425 mil and in 2007 (est): MNT 806.06 mil
Nepal 2004 1'500'035 Department of National Parks and Wildlife Conservation
Public sector PA funding in 2005: NPR 102,687,422 and in 2006: NPR 103,399,000

16
Public funds for Protected Areas Year USD Source
Comments/detail
Palau 2004 200'000 Workshop Financing Options Palau’s Protected Area Network
Philippines 2004 1'434'538
World Bank: Philippines Environment Monitor 2004 - Assessing Progress, 2004.
Budget for protected areas and wildlife bureau 2007 data for PA spending: PHP 202,271,000 or USD 4,854,504
Thailand 2004 60'570'000 World Bank: Thailand Environment Monitor 2004
"Direct government budget for PA management is 2.019 billion baht or 26% of MoNRE's budget"
Vietnam 2004 3'500'000
IUCN: Sustainable Financing of Protected Areas:A global review of challenges and options. Emerton, et al, 2005.
Allocation to PAs as a percent of national budget is in fact quite high
Botswana 2007 4'779'200 Government of Botswana: Budget speech 2007
Development of the Department of Wildlife and National Parks
Gabon 2005 597'300 pers.comm.
Ghana 2004 4'416'666
Hanks and Attwell, Financing Africa’s Protected Areas, paper presented at the 5th World Parks Congress in 2003
"USD 26.5 million over 6 years"
Madagascar 2004 288'000
World Bank: Madagascar Public Expenditure Review: The Challenge of Poverty Reduction, 2005.
Annual funding for ANGAP under PEIII from 2004-2009, includes: expansion of PAs, biodiversity management, ecotourism infrastructure, public awareness and current expenses (staff etc.)
Namibia 2002 5'066'000
Hanks and Attwell, Financing Africa’s Protected Areas, paper presented at the 5th World Parks Congress in 2003
Represents 75% of funds granted for operational budget (USD 5.5 mil) + 100% of funds (USD 941,000) granted for capital costs
Mozambique 2001 82'705
Hanks and Attwell, Financing Africa’s Protected Areas, paper presented at the 5th World Parks Congress in 2003
S. Africa 2006 19'621'173 SAN Parks: Annual Report
Public funding to PAs from Dept. of environmental affairs & tourism (ZAR 75,515,000+10,526,000 in 2006 and 88,158,000+10,526,000 in 2007), dept. of water affairs and forestry (ZAR 15,205,000 in 2006 and 20,889,000 in 2007) and a land acquisition grant from dept. of environmental affairs and tourism (ZAR 35,965,000 in 2006 and 21,080,000 in 2007)
Azerbaijan 2004 294'068 The State Statistical Committee of the Republic of Azerbaijan
Expenditures for maintenance of reserves, + Expenditures for maintenance of national parks Public sector PA spending in 2005: AZN 537.3 mil
Belarus 2004 4'000'000 UNECE: Environmental Performance Review, 2005
1. Expenditure on reserves and national parks as reported in Environmental Performance Review (UNECE)2. "the public sector is the major financier for biodiversity protection; Belarus is an
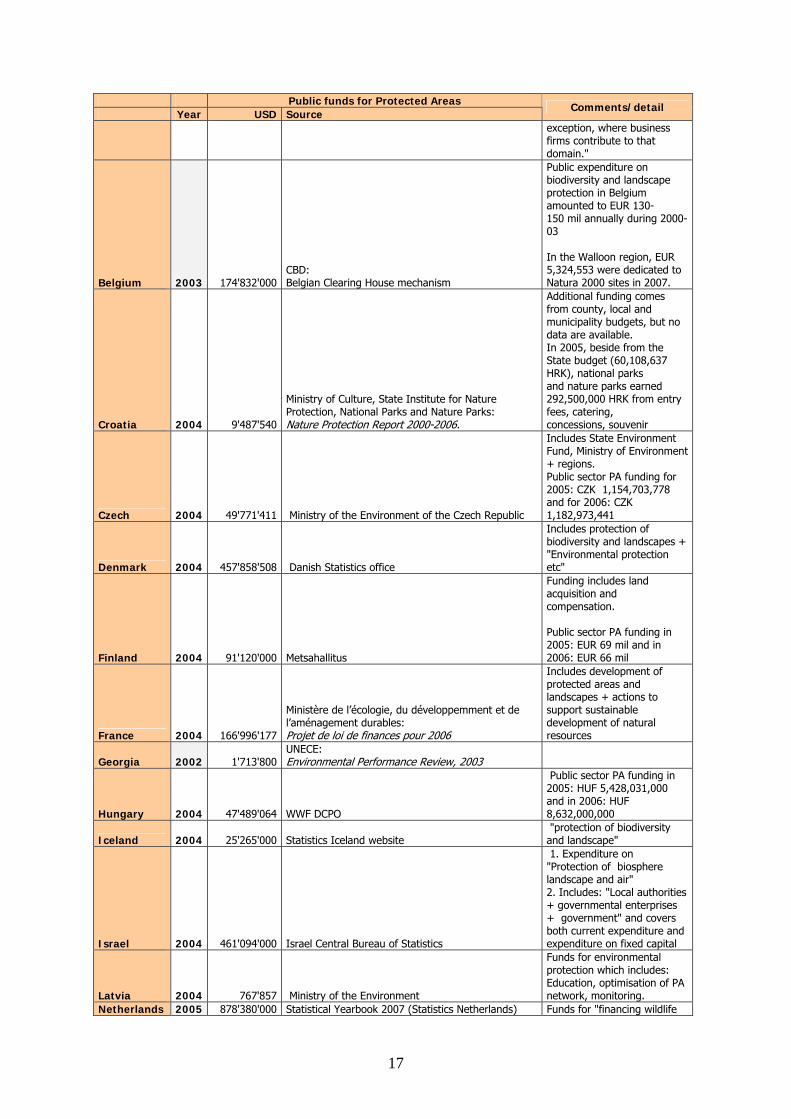
17
Public funds for Protected Areas Year USD Source
Comments/detail
exception, where business firms contribute to that domain."
Belgium 2003 174'832'000 CBD: Belgian Clearing House mechanism
Public expenditure on biodiversity and landscape protection in Belgium amounted to EUR 130-150 mil annually during 2000-03 In the Walloon region, EUR 5,324,553 were dedicated to Natura 2000 sites in 2007.
Croatia 2004 9'487'540
Ministry of Culture, State Institute for Nature Protection, National Parks and Nature Parks: Nature Protection Report 2000-2006.
Additional funding comes from county, local and municipality budgets, but no data are available. In 2005, beside from the State budget (60,108,637 HRK), national parks and nature parks earned 292,500,000 HRK from entry fees, catering, concessions, souvenir
Czech 2004 49'771'411 Ministry of the Environment of the Czech Republic
Includes State Environment Fund, Ministry of Environment + regions. Public sector PA funding for 2005: CZK 1,154,703,778 and for 2006: CZK 1,182,973,441
Denmark 2004 457'858'508 Danish Statistics office
Includes protection of biodiversity and landscapes + "Environmental protection etc"
Finland 2004 91'120'000 Metsahallitus
Funding includes land acquisition and compensation. Public sector PA funding in 2005: EUR 69 mil and in 2006: EUR 66 mil
France 2004 166'996'177
Ministère de l’écologie, du développemment et de l’aménagement durables: Projet de loi de finances pour 2006
Includes development of protected areas and landscapes + actions to support sustainable development of natural resources
Georgia 2002 1'713'800 UNECE: Environmental Performance Review, 2003
Hungary 2004 47'489'064 WWF DCPO
Public sector PA funding in 2005: HUF 5,428,031,000 and in 2006: HUF 8,632,000,000
Iceland 2004 25'265'000 Statistics Iceland website "protection of biodiversity and landscape"
Israel 2004 461'094'000 Israel Central Bureau of Statistics
1. Expenditure on "Protection of biosphere landscape and air" 2. Includes: "Local authorities + governmental enterprises + government" and covers both current expenditure and expenditure on fixed capital
Latvia 2004 767'857 Ministry of the Environment
Funds for environmental protection which includes: Education, optimisation of PA network, monitoring.
Netherlands 2005 878'380'000 Statistical Yearbook 2007 (Statistics Netherlands) Funds for "financing wildlife

18
Public funds for Protected Areas Year USD Source
Comments/detail
and nature areas"
Norway 2004 210'468'300 Statistics Norway Covers "environment protection" broadly
Russian Federation 2004 28'300'000
CBD: Meeting of donor agencies and other relevant organizations to discuss options for mobilizing new and additional funding for the implementation of the programme of work on protected areas, Montecatini, Italy, 20-21 June 2005 NOTE: Funds for federal PAs.
Slovakia 2004 5'831'345 Reports about the state of environment in Slovakia for 2004, 2005 and 2006 (via WWF DCPO)
Information on funding of PAs are from the budget sheets for 2004, 2005 and 2006 of the State Nature Conservancy of SR, Accounting Department Public sector PA funding in 2005: SKK 173,490,000 and in 2006: SKK 172,000,000
Sweden 2004 108'461'360 Statistics Sweden
Protection of biodiversity and landscape - exclusively from Central government (none from municipalities)
Switzerland 2004 314'802'600 Département federal des finances Noted in national accounts as "environment protection"
Turkey 2004 9'462'036
The General Directorate of Nature Conservation and National Parks (GDNCNP): (via WWF Turkey)
The figures cover all the expenses (staff costs, travels, surveys, preparation of management plans, construction, etc) related to the following items. They cover both central (Ankara) and local units (nation wide) of the GDNCNPs (and exclude "Specially Protected Areas" and the PAs and protection expenses of the Forest Service eg Protective Forests, Gene Reserves, etc): * National Parks, Nature Reserves, Nature Parks, Nature Monuments * Forest Recreational sites * Protection of species eg sea turtles * Management and monitoring of Wetlands * Creation of database, eg CITES database
Ukraine 2004 33'420'000
UNECE: Environmental Performance Reviews: Ukraine, 2nd review, 2007.
Figure includes: - Conservation of protected areas - research on protection - other activities related to protection; Figures from state budget
Bolivia 2004 60'000 FUNDESNAP Funds to the Servicio Nacional de Areas Protegidas
Colombia 2004 11'700'000
CBD: Meeting of donor agencies and other relevant organizations to discuss options for mobilizing new and additional funding for the implementation of the programme of work on protected areas, Montecatini, Italy, 20-21 June 2005
"Estimated total expenditure for implementing the programme of work amounted to some USD22.5 million for 2005, whereas national sources accounted for about USD11.7 million"
Chile 2004 994'782 CONAF (Corporación Nacional Forestal)
Includes only central govt. funding to CONAF (the agency managing forests and

19
Public funds for Protected Areas Year USD Source
Comments/detail
parks)
Cuba 2005 3'371'496 Oficina Nacional de Estadisticas
Includes expenditure for biodiversity and landscape protection + "other environment protection activities"
Ecuador 2004 4'500'000
CBD: Meeting of donor agencies and other relevant organizations to discuss options for mobilizing new and additional funding for the implementation of the programme of work on protected areas, Montecatini, Italy, 20-21 June 2005
Current spending of USD 12.5 million, of which 36% was provided by the national budget In 2003, the state budget for the PA system was USD 8.639 million, (1.78 for continental PAs + 6.85 for Galapagos National Park) minus revenues generated worth 5.2 mil, leaving total state funding of USD 3.4 mil.
Guatemala 2003 4'480'000
Consejo Nacional De Areas Protegidas Presidencia De La Republica: Informe Nacional de Áreas Protegidas de Guatemala, 2003
Honduras 2004 172'117 Secretaria de Recursos Naturales y Ambiente (SERNA)
Budget 2003 includes: Meso American biological corridor, unit for management of territory, +biodiversity programme
Mexico 2006 50'266'580 SEMARNAT: La Gestion Ambiental en Mexico, 2006
Peru 2004 741'666 WWF Peru
PA funding in 2005: USD 1,138,121 PA funding in 2006: USD 1,330,369
Canada 2004 148'680'000 Canadian Department of Finance: Budget 2005
In budget overview, note that "almost 900 mil C$ are going to protecting the environment - over 5 years". NOTE that when looking at the budget detail this amount seems inflated..
Grenada 2004 603'704
TNC: Sustainable Finance Plan for Grenada’s Protected Areas System, Agathe Sector, 2006
USA 2004 2'657'815'000 Compiled by George Wright Society
- National Parks Service: USD 2,560,315,000 - US Bureau of Land Management, National Landscape Conservation System: USD52,500,000 - US National Oceanic and Atmospheric Administration, National Marine Sanctuaries Program: USD45,000,000 Missing US National Forests.
Notes on the dataset In collecting this data we faced an array of presentation formats in government accounts. While comparisons are made across different countries, a number of caveats in this research suggest that we need to look at these comparisons with some caution. We note here some of the factors that we have identified as affecting what is covered by the budget figures in different countries. While some countries may include salaries, which constitute a significant proportion of budget, others may not. Some report protected areas together with other environmental protection activities, (e.g.: pollution control, water and waste treatment, clean up etc) while others report protected area budgets separately. In many countries the distinction between funding to protected areas and funding to the environment or to biodiversity more generally is not always clearly made. Funding may also only be considered for national parks in some cases, while in

20
others it can cover all categories of protected areas. In other cases funding may come from different ministries and therefore, it was not always easy to obtain a comprehensive national figure (this was also found by López Ornat and Jiménez-Caballero, 2006). Protected land and water may be controlled by different parts of government, which report budgets separately; in some countries there may even be internal confusion about what exactly constitutes a “protected area”. Some countries do not explicitly separate domestic funding from international funding in their budget for protected areas. Within the same country, protected areas may receive support from different ministries, such as that of environment, forests, fisheries, interior and even defence (see Ukraine example in Annexe 2). In addition, many countries provide a significant amount of funding to protected areas in developing countries via either the GEF or a number of other initiatives (e.g.: the UK via the Darwin initiative). In decentralised countries such as Switzerland or Vietnam it is also not always easy to tally up central and regional funding for protected areas. For instance, in Vietnam a study (Emerton et al, 2004) showed that in addition to central funding to protected areas of VND 45-52 billion a year, an additional VND 67 billion was available at regional level (for the 28 provinces for which data is available). Finally, some contributions may be considered “in kind” through staff time for instance, and may not necessarily appear in any account of funding to protected areas. It should also not be forgotten that because of the vast ranges in costs of living and costs of labour in different countries covered here, it is also very risky to make comparisons in relative figures. Research suggests that management effectiveness is often related to levels of funding (e.g. Dudley et al 2007) but this is not invariably the case and management needs may vary between countries. Although we have tried to clarify these figures, this may have led in some cases to under-estimates or, more likely, over-estimates. Recommendation 3: More accurate information on public funding to protected areas would allow a better comparison between countries. This could be done by promoting:
- accurate record-keeping; - the use of simple and internationally-accepted budgeting categories (possibly developed by IUCN and promoted by the CBD and also available through some management effectiveness assessment systems)
Absolute versus relative values Absolute values of required funding for protected areas are extremely difficult if not impossible to determine. Frequently a measure of acceptable levels of funding is determined by using an amount per hectare or per km2. Thus, for example, James et al (1999) found a global mean budget per km2 of protected areas to be USD 893 in 1996 dollar values. This figure hides a range spanning USD 12,308 per km2 in East Asia and USD 24 per km2 in Western and Central Africa. For illustrative purposes, Table 3 below lists countries in our sample according to the overall amount of public funds they spend per hectare. Table 3: Public funds spent per hectare of protected area Year Public funds
for Protected Areas (USD)
PA size (ha) (2003)
% protected (in 2003)
Public funds spent per ha. (USD/ha)
Belgium 2003 174'832'000 105'000 3.40% 1665.066667 Israel 2004 461'094'000 397'000 19.10% 1161.445844 Netherlands 2005 878'380'000 950'000 26.20% 924.610526 Grenada 2004 603'704 1'000 1.90% 603.703737 Denmark 2004 457'858'508 1'094'000 25.60% 418.517832 Switzerland 2004 314'802'600 1'185'000 28.70% 265.656203 Norway 2004 210'468'300 1'973'000 6.20% 106.674252 France 2004 166'996'177 1'624'000 3% 102.830158 Hungary 2004 47'489'064 830'000 8.90% 57.215740 Iceland 2004 25'265'000 476'000 4.70% 53.077731 Czech 2004 49'771'411 1'254'000 16.00% 39.690120 Sweden 2004 108'461'360 3'189'000 7.20% 34.011088 Finland 2004 91'120'000 2965000 8.80% 30.731872 Croatia 2004 9'487'540 361'000 6.90% 26.281274 Cuba 2005 3'371'496 177'000 1.60% 19.048000 USA 2004 2'657'815'000 149'008'600 15.80% 17.836655 Ukraine 2004 33'420'000 1'939'300 3.30% 17.233022

21
Year Public funds for Protected Areas (USD)
PA size (ha) (2003)
% protected (in 2003)
Public funds spent per ha. (USD/ha)
Thailand 2004 60'570'000 8'030'500 15.60% 7.542494 Australia 2006 558'486'550 74'531'200 9.70% 7.493326 Georgia 2002 1'713'800 300'300 4.30% 5.706960 Mexico 2006 50'266'580 9'901'700 5% 5.076561 Slovakia 2004 5'831'345 1219283 22.50% 4.782602 Turkey 2004 9'462'036 2'754'000 2.60% 3.435743 Belarus 2004 4'000'000 1'315'300 6.40% 3.041131 S. Africa 2006 19'621'173 7'398'800 6.10% 2.651940 Palau 2004 200'000 76'800 0.4% 2.604167 Vietnam 2004 3'500'000 1'361'000 4.20% 2.571639 Canada 2004 148'680'000 62'874'800 6.30% 2.364699 Guatemala 2003 4'480'000 2'775'000 29.89% 1.614414 Ghana 2004 4'416'666 3'687'000 15.40% 1.197902 Namibia 2002 5'066'000 4'599'500 5.60% 1.101424 Latvia 2004 767'857 969'700 15.10% 0.791850 Gabon 2005 597'300 882'000 3.40% 0.677211 Ecuador 2004 4'500'000 6'724'300 27% 0.669215 Azerbaijan 2004 294'068 478'000 5.00% 0.615205 Philippines 2004 1'434'538 2'430'400 8.20% 0.590248 Nepal 2004 1'500'035 2'663'300 18.10% 0.563224 Chile 2004 994'782 2'689'400 3.60% 0.369890 Lao PDR 2002 1'284'224 4'345'000 16.20% 0.295564 Botswana 2007 4'779'200 17'491'500 30.20% 0.273230 Russian Federation 2004 28'300'000 128'699'100 7.60% 0.219893 Madagascar 2004 288'000 1'829'000 3.10% 0.157463 Colombia 2004 11'700'000 82'527'800 31.40% 0.141770 Honduras 2004 172'117 2'345'000 20.80% 0.073398 Peru 2004 741'666 21'609'000 16.70% 0.034322 China 2004 3'600'000 110'067'000 11.80% 0.032707 Indonesia 2000 716'790 25'991'600 13.60% 0.027578 Mozambique 2001 82'705 4'530'000 5.70% 0.018257 Mongolia 2004 356'861 21'791'200 14% 0.016376 Bolivia 2004 60'000 21'102'000 19.40% 0.002843
Notes: 1. Data for protected area extent and percent cover for 2003 obtained from Earthtrends (except for Colombia and Palau which come from the UN Statistics Division); 2. All figures for 2004 unless indicated. As identified by James et al already in 1999, we can see a huge range of expenditure per hectare, from USD 0.0028 of national public funds spent per hectare in Bolivia to USD 1665 in Belgium. This partly reflects the range in cost of living. Thus, except for Grenada, the top 13 countries in our sample are European or western countries. In our sample, we see, unsurprisingly, that wealthier countries, like Denmark and Switzerland spend more per hectare than poorer countries (although it should be noted that these are both small countries with relatively small protected areas). Nonetheless, we also find poorer countries (as per the Human Development Index – HDI developed by the UNDP) like Ukraine and Thailand with relatively high figures per hectare, while wealthier countries like Canada and Chile appear to spend less per hectare. A dollar figure per hectare allows us to compare funding provided by different countries, regardless of size of the overall protected area network. What it hides though, is the fact that in some countries maintaining protected areas will necessarily be cheaper because of a lower cost of living or conversely because a higher standard of living may reduce some of the pressures on protected areas. In addition, it hides the fact that a hectare of a degraded but highly valuable protected area may cost much more to maintain than a hectare of a pristine, unthreatened protected area. Equally, depending on the protected area category and biome (see for e.g.: López Ornat and Jiménez-Caballero, 2006), different amounts of funding per hectare may be required. Thus, in terms of extrapolating to determine future needs, such a measure of costs may not always be the most useful. We therefore turn to relative values of protected area funding. Relative figures are grounded in an existing real amount and serve to provide a reasonable benchmark. Public funding to protected areas could be determined for instance as

22
a proportion of overall government budget, or of GDP or even of defence spending for instance? Balmford and Whitten (2003) note that “a globally effective conservation programme could be funded for less than President Bush’s recent increases in annual US military expenditure alone”. Funding may also be gauged against what are perceived as environmentally negative government expenses such as perverse subsidies in the fisheries or agriculture sectors. Considering funding for protected areas relative to what a country is worth or what it can afford, helps to overcome the relative differences in wealth and in costs of living. We consider GDP in our analysis as it seems a suitable measure of how much a country can reasonably afford for protected areas (both its own and others’). Thus, for instance, in our sample, a country like Lao PDR is rated in the bottom half for funding per hectare (see Table 3 above) but much higher when it comes to the proportion of public funds to GDP (see Table 4 below). GDP measures the wealth of a country. A wealthier country can presumably allocate a larger absolute amount to protected areas (both its own and those of other countries through aid). By the same token, in a wealthier country it is likely to be more expensive to maintain protected areas because of a higher cost of living. For this reason, it would seem reasonable to assume that a similar proportion of countries’ GDP could be allocated to protected areas. We first look at the proportion of GDP spent by governments on their own protected areas. Table 4 below ranks countries according to the percent of GDP that is spent on their own protected areas. Table 4: Data on government funding to their own protected areas as % of GDP in decreasing order Year Public funds for
Protected Areas (USD) GDP (USD)
Public funds spent on PAs as % of GDP
Israel 2004 461'094'000 116.9 billion 0.394435 Iceland 2004 25'265'000 12.2 billion 0.207090 Denmark 2004 457'858'508 241.4 billion 0.189668 Namibia 2002 5'066'000 3.12 billion 0.162372 Grenada 2004 603'704 0.4 billion 0.150926 Palau 2004 200'000 133'560'000 0.149745 Netherlands 2005 878'380'000 624.2 billion 0.140721 Switzerland 2004 314'802'600 357.5 billion 0.088057 Norway 2004 210'468'300 250.1 billion 0.084154 Australia 2006 558'486'550 768.2 billion 0.072701 Lao PDR 2002 1'284'224 1.8 billion 0.071346 Belgium 2003 174'832'000 309.9 billion 0.056416 Ukraine 2004 33'420'000 64.8 billion 0.051574 Georgia 2002 1'713'800 3.4 billion 0.050406 Ghana 2004 4'416'666 8.9 billion 0.049625 Hungary 2004 47'489'064 100.7 billion 0.047159 Czech 2004 49'771'411 107 billion 0.046515 Botswana 2007 4'779'200 10.46 billion 0.045690 Finland 2004 91'120'000 209.4 billion 0.043515 Thailand 2004 60'570'000 161.7 billion 0.037458 Sweden 2004 108'461'360 346.4 billion 0.031311 Croatia 2004 9'487'540 34.3 billion 0.027660 USA 2004 2'657'815'000 11711.8 billion 0.022693 Nepal 2004 1'500'035 6.7 billion 0.022389 Mongolia 2004 356'861 1.6 billion 0.022304 Guatemala 2003 4'480'000 24.88 billion 0.018006 Belarus 2004 4'000'000 22.9 billion 0.017467 Canada 2004 148'680'000 978 billion 0.015202 Ecuador 2004 4'500'000 30.3 billion 0.014851 Slovakia 2004 5'831'345 41.1 billion 0.014188 Colombia 2004 11'700'000 97.7 billion 0.011975 France 2004 166'996'177 2046.6 billion 0.008160 Vietnam 2004 3'500'000 45.2 billion 0.007743 S. Africa 2006 19'621'173 254.99 billion 0.007695 Cuba 2005 3'371'496 46.084 billion 0.007316 Gabon 2005 597'300 8.67 billion 0.006889 Madagascar 2004 288'000 4.4 billion 0.006545 Mexico 2006 50'266'580 839.2 billion 0.005990

23
Year Public funds for Protected Areas (USD) GDP (USD)
Public funds spent on PAs as % of GDP
Latvia 2004 767'857 13.6 billion 0.005646 Russian Federation 2004 28'300'000 581.4 billion 0.004868 Azerbaijan 2004 294'068 8.5 billion 0.003460 Turkey 2004 9'462'036 302.8 billion 0.003125 Honduras 2004 172'117 7.4 billion 0.002326 Mozambique 2001 82'705 3.6 billion 0.002297 Philippines 2004 1'434'538 84.6 billion 0.001696 Peru 2004 741'666 68.6 billion 0.001081 Chile 2004 994'782 94.1 billion 0.001057 Bolivia 2004 60'000 8.8 billion 0.000682 Indonesia 2000 716'790 153.3 billion 0.000468 China 2004 3'600'000 1,931.7 billion 0.000186
From the figures we have found in this research and the necessary caveats surrounding them, we can see that as a percent of GDP, public funds to protected areas vary from a low of 0.000186% of GDP (China4) to a high of 0.3944% of GDP (Israel). Given the relative biodiversity importance of China versus Israel (measured by variety of species, levels of endemism etc – as shown in the next section) the relative difference in figures raises serious concerns, particularly about the focus of attention to meet the CBD 2010 target. In our sample of 50 countries, 18 (i.e.: 36%) spend more than 0.04% of their GDP on protected areas, with seven (i.e.: 14%) spending more than 0.1% of their GDP on protected areas. Surprisingly of these seven countries, three are developing countries, i.e.: Namibia, Grenada and Palau. Equally, 20 countries do not even spend 0.01% of their GDP on their protected areas. To put this further in context, of these 20 countries that we have ranked (relative to the rest of our sample) as “low” public spenders on protected areas, eight (Mexico, Madagascar, Cuba, Peru, Honduras, Indonesia, the Philippines and China) appear in the list of 16 countries rated as containing the highest number of AZE (Alliance for Zero Extinction) sites5. These sites have been identified by the Alliance of 52 biodiversity conservation organisations as being critical areas to protect if we are to prevent further extinctions (we come back to this in section 4). Clearly, many of these countries will be highly reliant on overseas aid to complement their own funding. Figures 1-5 show regional breakdowns of protected areas budgets as percent of GDP.
4 It should be noted here though that the data we have collected for China only represent central government funding. 5 see AZE report online at: http://www.zeroextinction.org/
Fig. 2: Latin America - PA budgets (public funds) as percent of GDP
0
0.005
0.01
0.015
0.02
Bolivia
Colombia
ChileCuba
Ecuado
r
Guatemala
Hondura
s
Mexico Peru
Countries
%
Fig. 1: Europe/Central Asia - PA budgets (public funds) as percent of GDP
0
0.1
0.2
0.3
0.4
0.5
Azerba
ijan
Belarus
Belgium
CroatiaCze
ch
Denmark
Finlan
d
France
Georgia
Hungary
Iceland
Israe
l
Latvi
a
Netherl
ands
Norway
Russia
n Fede
ration
Slovakia
Sweden
Switzerl
and
Turkey
Ukraine
Countries
%

24
Fig. 5: North America and Caribbean- PA budgets (public funds) as % of GDP
0
0.02
0.04
0.06
0.08
0.1
0.12
0.14
0.16
0.18
0.2
Canada Grenada USA
Countries
%
While we have initially explored public funding to a country’s own protected areas, the next step in our study was to include overseas aid. Clearly for many OECD countries, contributions to protected areas in other countries through overseas aid budgets (ODA) are an important component of their funding to protected areas. Tables 5 and 6 below include therefore, this data for a number of OECD countries. Table 5: ODA to protected areas
Country USD million (annual average 1998-2000)
GEF annual funding under 3rd replenishment (2001-2005) TOTAL
Australia 21'300'000 4'330'000 25'630'000 Austria 2'000'000 2'440'000 4'440'000 Belgium 19'500'000 4'200'000 23'700'000 Canada 15'300'000 10'730'000 26'030'000 Denmark 29'800'000 4'030'000 33'830'000 Finland 24'900'000 3'000'000 27'900'000 France6 44'700'000 65'600'000 110'300'000 Germany 275'600'000 39'370'000 314'970'000 Ireland 2'200'000 570'000 2'770'000 Japan 144'100'000 36'570'000 180'670'000
6 France has its own “GEF”, the FFEM, which is not included here, but also mobilises significant resources.
Fig. 3: Africa - PA budgets as percent of GDP (public funds)
0
0.05
0.1
0.15
Botswan
a
Gabon
Ghana
Madag
asca
r
Namibi
a
Mozam
bique
S. Afric
a
Countries
%
Fig. 4: Asia/Oceania - PA budgets as percent of GDP (public funds)
0
0.02
0.04
0.06
0.08
0.1
0.12
0.14
0.16
Austra
liaChin
a
Indon
esia
Lao P
DR
Mongo
lia
Nepal
Palau
Philipp
ines
Thail
and
Vietna
m
Countries
%

25
Country USD million (annual average 1998-2000)
GEF annual funding under 3rd replenishment (2001-2005) TOTAL
Netherlands 146'900'000 9'280'000 156'180'000 New Zealand 800'000 710'000 1'510'000 Norway 91'200'000 2'900'000 94'100'000 Spain 14'500'000 2'170'000 16'670'000 Sweden 38'300'000 8'140'000 46'440'000 Switzerland 15'900'000 6'440'000 22'340'000 United Kingdom 23'900'000 17'710'000 41'610'000 United States 84'200'000 35'830'000 120'030'000 Total 995'100'000 254'020'000 1'249'120'000
Sources: CBD, 2004; GEF/R.4/5, 2005 In addition to bilateral ODA, the Global Environment Facility (GEF) mobilises significant environmental funds, both from OECD countries and others. In order to make figures comparable, here we have taken funding for the third GEF replenishment, which covered the period 2001-2005. The amounts were divided by four to obtain an annual figure, then further divided by three since biodiversity funding represented about a third of GEF funding during this period. If we incorporate data for ODA and GEF funding (for biodiversity), as well as own protected area investment for those countries for which we have this information, we can then obtain a more accurate picture of these countries’ total funding for protected areas (both own and overseas). Table 6 below demonstrates this proportion in decreasing order for OECD countries (for which data was available). Table 6: Proportion of in-country, ODA and GEF (biodiversity) funding to GDP
Country ODA for PAs, USD (annual average
1998-2000)
GEF annual funding under 3rd replenishment (2001-
2005)
Investment in own PAs
TOTAL funding to PAs (both
nationally and overseas)
Total funding as % of GDP
excl. ODA incl. ODA
Denmark 29'800'000 4'030'000 457'858'508 491'688'508 0.18967 0.20368
Netherlands 146'900'000 9'280'000 878'380'000 1'034'560'000 0.14072 0.16574
Norway 91'200'000 2'900'000 210'468'300 304'568'300 0.08415 0.12178
Switzerland 15'900'000 6'440'000 314'802'600 337'142'600 0.08806 0.09431
Australia 21'300'000 4'330'000 558'486'550 584'116'550 0.07270 0.07604
Belgium 19'500'000 4'200'000 174'832'000 198'532'000 0.05642 0.06406
Sweden 38'300'000 8'140'000 108'461'360 154'901'360 0.03131 0.04472
US 84'200'000 35'830'000 2'657'815'000 2'777'845'000 0.02269 0.02372
Canada 15'300'000 10'730'000 148'760'331 174'790'331 0.01521 0.01787
France 44'700'000 65'600'000 166'996'177 277'296'177 0.00816 0.01355 If we include ODA, for most countries in our sample, there is only a relatively small increase in percentage contribution to protected areas. Indeed, according to one estimate, in 2003, external development assistance for public protected areas in developing countries had decreased dramatically to USD350-420 million from a peak of USD 700-770 million a year in the early 1990s (UNEP/CBD, 2006). We can therefore, note that funding to protected areas represents a tiny proportion of GDP for the 50 countries in our sample, varying from 0.000186% to 0.3944% and that, for a selection of OECD countries, including funding to overseas protected areas does not increase this proportion significantly, if at all.

26
Section 4 – Public Funds to Protected Areas: Relative Values and Trends The fundamental questions we sought to answer in this report are how much money is enough for protected areas and how much of this should be covered by the public sector? Clearly, there is no straightforward answer to this. Nonetheless if governments are to meet their obligations under the CBD and the Programme of Work on Protected Areas, funding to protected areas will need to be stepped up. Given the relative biological wealth of developing countries, combined with their relative lower financial resources, one can presume that much of this public funding will need to flow from developed to developing countries. We look here in more detail at the trends in funding for a number of countries. a) ODA Trends Global coverage of protected areas is growing, yet the trend in OECD environment funding is alarmingly on the decline. We have gathered data on a number of countries for which the OECD has analysed their environment ODA spending7. For some countries analysis has been done for 100% of their ODA spending, while for others only a certain proportion was analysed (as reflected in column 2 of Table 7 below). For countries with less than 100% in column 2 it signifies that part of their ODA funding cannot be easily broken down and therefore, may include some environment funding. The data cover both programmes where the environment was the primary focus and where it was a secondary objective. As governments are encouraged to mainstream the environment it is increasingly difficult to pull out precise figures for environment funding. Table 7 below compares the percent change of the environment focus of aid with the percent change of overall aid for 15 OECD countries and the EC. Table 7: Environment aid 2003-2004 versus total aid
% of aid coverage analysed 2003 2004
% change between 2003-2004
100% Environment focused aid (% of total aid8) 13% 4% -9.00% Australia
Total aid (USD million) 886 960 8.35%
94% Environment focused aid (% of total aid) 24% 24% -0.94% Austria
Total aid (USD million) 191 202 5.76%
47% Environment focused aid (% of total aid) 15% 10% -4.23% Belgium
Total aid (USD million) 542 714 31.73%
89% Environment focused aid (% of total aid) 16% 25% 8.90% Canada
Total aid (USD million) 1198 1406 17.36%
98% Environment focused aid (% of total aid) 43% 43% 0.00% Denmark
Total aid (USD million) 586 1196 104.10%
95% Environment focused aid (% of total aid) 14% 15% 0.95%
European Commission Total aid (USD million) 5324 6544 22.92%
97% Environment focused aid (% of total aid) 44% 32% -11.64% Finland
Total aid (USD million) 275 289 5.09%
60% Environment focused aid (% of total aid) 33% 31% -1.80% Germany
Total aid (USD million) 3670 4'220 14.99%
99% Environment focused aid (% of total aid) 7% 7% 0.00%
Greece Total aid (USD million) 191 222
16.23%
100% Environment focused aid (% of total aid) 48% 39% -9.00% Japan
Total aid (USD million) 7210 8191 13.61%
100% Environment focused aid (% of total aid) 19% 21% 2% Netherlands
Total aid (USD million) 1335 2054 53.86%
100% Environment focused aid (% of total aid) 28% 25% -3% New Zealand
Total aid (USD million) 84 104 23.81% Norway
100% Environment focused aid 15% 16% 1% 7 See “Environment and development: aid to environment at a glance” on www.oecd.org 8 These percentages have been adjusted according to the amount of ODA that has been analysed, i.e: the figure in column 2.

27
% of aid coverage analysed 2003 2004
% change between 2003-2004
(% of total aid) Total aid (USD million) 969 938 -3.20%
100% Environment focused aid (% of total aid) 1% 2% 1% Portugal
Total aid (USD million) 166 174 4.82%
100% Environment focused aid (% of total aid) 64% 59% -5% Sweden
Total aid (USD million) 1071 1033 -3.55%
89% Environment focused aid (% of total aid) 16% 11% -5% UK
Total aid (USD million) 2570 3001 16.77%
The trends are not encouraging. We find that nine of the above 16 donors (i.e.: 56%) have reduced their funding to the environment over the period 2003-2004 while another two countries have not changed their amount of environment aid between 2003 and 2004. This compares against only two (or 12.5%) that have reduced their overall overseas aid. When we compare this rate of change in overall aid versus the rate of change in environment aid, none of them match, with the biggest disparity found for Denmark that has more than doubled its overall aid but not changed its environment aid at all, followed by the Netherlands that has increased its overall aid by 54% but its environment aid by only 2%. We find the closest coherence in Sweden’s environment aid that has dropped by 5%, alongside its overall aid that has dropped by 3.55% and Portugal’s environment aid that has increased by 1%, alongside its overall aid that has increased by 4.82%. Canada has shown the greatest increase in environment aid, up 8.9% between 2003 and 2004. Nonetheless, its overall aid increased more significantly, up 17.36% Recommendation 4: OECD countries should be coherent in their allotment of aid, and environment aid should at least rise in accordance with overall aid. Within environment aid, protected areas should continue to play a significant role.
Paradoxically, largely as a result of the Millennium Ecosystem Assessment (2005) and within the framework of the MDGs, there is increasing consensus that human wellbeing is fundamentally dependent on the environment. As a consequence much development aid would benefit from related environment aid (see EU example in Annexe 2). The challenge now facing the CBD and its members is to translate this heightened awareness into increased funding streams for protected area conservation and management. This is equally important for recipient countries which may need to make the development-conservation linkages more explicit in their relevant strategies and funding requests.
Recommendation 5: As OECD countries are being encouraged under the Paris Declaration on Aid Effectiveness to harmonise their allocation of aid funding, it is all the more important for recipient countries to ensure that protected areas and biodiversity are sufficiently represented in their package for aid assistance. b) Absolute versus relative values In trying to find a relative figure for government spending on protected, we have compared protected areas spending to GDP. The question remains: what proportion of GDP should be allocated to protected areas? The median figure for our sample of 50 countries (see Table 4) is: 0.018%, while the mean is: 0.048% In addition, if we consider a handful of countries that have estimated the amount that they would actually require to effectively implement a network of protected areas, we find the following correlations with GDP9: Table 8: Real estimates of funding needs for protected areas versus GDP Country estimated amount needed
(USD) GDP (USD 2004) % of required PA
spending vs. GDP Bolivia 35'769'396 8'800'000'000 0.41
Ghana 26'500'000 8'900'000'000 0.30
Ecuador 55'500'000 30'300'000'000 0.18
Peru 48'000'000 68'600'000'000 0.07
Colombia 22'500'000 97'700'000'000 0.02
9 Note that this is total funding required, regardless of source. Nonetheless it provides a useful estimate.

28
These figures, albeit for a small sample, indicate a much higher proportion of GDP. Thus using the data we have collected for our sample of 50 and combining it with the above table that is based on actual estimates of required funding, it would seem plausible to determine a minimal relative value for protected area spending with respect to GDP. Recommendation 6: Based on our analysis, most countries should be increasing their investment in protected areas (their own or those of other countries) by at least 50 percent to represent at a minimum, between 0.02% and 0.04% of their GDP10. c) Rating public spending on protected areas versus biodiversity importance The difficulty with comparing public funding to GDP is that it does not consider the ultimate recipients of the funds, i.e.: protected areas: some countries simply do not have many protected areas, or even have relatively few areas needing protection. Other countries may be so biologically important (e.g.: “hotspots”) that even 0.04% may simply not be enough. While countries with small GDPs will by default have less to dedicate to their protected areas, if they have a particularly rich biodiversity that warrants more protection, then they will require much more funding which will have to come from external sources. In the previous sub-section we attempted to determine an alternative means of assessing sufficient funding for protected areas as a percentage of GDP. To further ground this figure in reality, we suggest that it should be weighted according to a country’s biological importance. To obtain this measure of biodiversity value we use a proxy indicator, developed by summing scores from six global prioritisation exercises:
WWF Global 200 ecoregions Conservation International biodiversity hotspots WWF / IUCN Centres for Plant Diversity Birdlife Endemic Bird Areas Alliance for Zero Extinction Priority Areas CBD National Biodiversity Index
To facilitate comparison, scores derived from each of these were standardised into a three point score and total given, allowing ranking of countries according to high, medium or low biodiversity as outlined in the table below (see Annexe 1 for details). Table 9: Countries split as high, medium, low biodiversity Country WWF
Global 200
CI hotspots
Centres of plant diversity
Birdlife Endemic Bird Areas
Alliance for Zero Extinction
CBD NBI
TOTAL
High biodiversity China 3 3 3 2 3 3 17Indonesia 3 2 3 3 3 3 17Mexico 3 2 3 3 3 3 17Colombia 3 2 3 2 3 3 16Peru 2 2 3 3 3 3 16Australia 3 2 3 2 3 3 14Ecuador 2 2 2 2 3 3 14USA 3 1 3 1 3 2 13Philippines 1 1 3 2 3 2 12Chile 2 2 3 1 2 2 11Cuba 2 1 2 1 3 2 11Madagascar 2 1 1 1 3 3 11South Africa 2 3 2 1 1 2 11Vietnam 2 1 3 1 2 2 11Bolivia 2 1 2 1 2 2 10Turkey 3 1 3 1 2 2 10
10 However, more precise data are needed to give a better indication of the level of GDP that should support protected areas. If the recommendations about data collection and analysis made in this report are followed, more precise estimates of necessary funding will be available to calculate necessary inputs from governments.

29
Country WWF Global 200
CI hotspots
Centres of plant diversity
Birdlife Endemic Bird Areas
Alliance for Zero Extinction
CBD NBI
TOTAL
Medium biodiversity Mozambique 2 2 1 1 1 2 9Russian Fed 3 0 2 2 1 1 9Canada 3 0 3 0 1 1 8Guatemala 1 1 1 1 2 2 8Honduras 1 1 1 1 2 2 8Thailand 2 1 3 0 0 2 8Georgia 1 2 1 1 0 2 7Azerbaijan 2 2 1 1 0 2 7Gabon 2 0 2 1 0 2 7Laos 2 1 1 1 0 2 7Ghana 1 1 1 0 1 2 6Namibia 1 1 1 1 0 2 6Nepal 2 1 0 1 0 2 6France 1 1 2 0 0 1 5Israel 1 0 1 0 1 2 5Croatia 1 1 0 0 0 2 4Grenada 1 1 0 1 1 n/a 4Low biodiversity Mongolia 2 0 0 0 0 1 3Palau 1 1 0 1 0 n/a 3Slovakia 1 0 0 0 0 2 3Sweden 1 0 1 0 0 1 3Switzerland 1 0 1 0 0 1 3Ukraine 1 0 1 0 0 1 3Botswana 1 0 0 0 0 1 2Finland 0 0 0 1 0 1 2Hungary 0 0 1 0 0 1 2Netherlands 1 0 0 0 0 1 2Belarus 0 0 1 0 0 1 2Belgium 0 0 0 0 0 1 1Czech Rep. 0 0 0 0 0 1 1Denmark 0 0 0 0 0 1 1Latvia 0 0 0 0 0 1 1Norway 1 0 0 0 0 0 1Iceland 0 0 0 0 0 0 0 Table 10: Countries ranked as high, medium, low biodiversity based on above proxy analysis HIGH MEDIUM LOW China Mozambique Mongolia Indonesia Russian Fed Palau Mexico Canada Slovakia Colombia Guatemala Sweden Peru Honduras Switzerland Australia Thailand Ukraine Ecuador Georgia Botswana USA Azerbaijan Finland Philippines Gabon Hungary Chile Laos Netherlands Cuba Ghana Belarus Madagascar Namibia Belgium South Africa Nepal Czech Rep. Vietnam France Denmark Bolivia Israel Latvia Turkey Croatia Norway Grenada Iceland

30
For 15 donor countries and the EC, the OECD has analysed the top 10 recipients of environment aid. Using this data, we extracted those countries that appear in the “top 10” of at least four donor countries, to obtain a list of 16 top recipients (in terms of number of donors, not in terms of absolute funding). Interestingly two of the top 16 appear to have relatively low biodiversity value, as per our analysis. Half, (8 out of 16) appear to be of medium biodiversity importance. This indicates that in the top 16 recipient countries, only 37.5% (i.e.: 6 out of 16) are actually high in biodiversity value.
Sixteen Top Recipients of OECD Environment Aid Ranked According to a Biodiversity Proxy Measure
37.50%
50%
12.50%
High biodiversityMedium biodiversityLow biodiversity
Table 11: Recipients of largest number of OECD countries’ environment ODA compared with their biodiversity value using a range of selection criteria
Country ODA
11
WWF Global
200 CI
hotspots
Centres of plant
diversity
Birdlife Endemic
Bird Areas
Alliance for Zero
Extinction
CBD Nation, Biodiv. Index
Total score
Biodiv ranking
Vietnam 9 3 2 1 1 5 2 3 1 6 2 0.68 2 10 High
China 8 9 3 3 3 8 312 2 23 3 0.84 3 17 High
Ethiopia 8 4 2 2 2 1 1 3 1 4 1 0.59 2 9 Med Serbia & Montenegro 6 2 1 1 1 0 0 0 0 0 0 0.51 2 4 Med
Egypt 6 1 1 1 1 0 0 0 0 0 0 0.33 1 3 Low
India 5 9 3 2 2 4 2 7 2 16 3 0.73 2 14 High
Nicaragua 5 2 1 1 1 0 0 3 1 0 0 0.64 2 5 Med
Albania 4 1 1 1 1 0 0 0 0 0 0 0.53 2 4 Med
Bangladesh 4 1 1 0 0 0 0 0 0 0 0 0.54 2 3 Low
Indonesia 4 17 3 2 2 18 323 3 29 3 1 3 17 High
Iraq 4 1 1 0 0 1 1 1 1 0 0 0.43 1 4 Med
Kenya 4 4 2 3 3 3 2 4 1 4 1 0.64 2 11 High
Morocco 4 3 2 1 1 1 1 0 0 16 3 0.46 1 8 Med
Mozambique 4 3 2 2 2 1 1 4 1 2 1 0.52 2 9 Med
Tanzania 4 8 3 2 2 3 2 0 0 7 2 0.67 2 11 High
Uganda 4 3 2 1 1 1 1 2 1 1 1 0.66 2 8 Med Two figures are listed under each main column: the total number of sites identified within the particular prioritisation method (or the relevant number in the National Biodiversity Index) and on the right the “score” assigned in the analysis carried out for this report; these are summed in the column “total score” – see Annexe 1 for more details) Recommendation 7: When investing their overseas funds dedicated to the environment and to protected areas more specifically, OECD countries should take into account the relative biodiversity values of different countries.
11 Number of donor countries ranking these recipient countries as high for environment ODA, according to OECD data.

31
Section 5 – Conclusions and Recommendations Conclusions: Protected areas provide public goods and a public service; as such governments have an important role to play in ensuring that these areas are indeed well protected. Recognising this role, 190 governments agreed to the Programme of Work on Protected Areas under the CBD in 2004. The Programme was predicated on increased support from rich countries for protected areas. However, this has not happened and without sufficient resources, such commitments are doomed to remain unfulfilled. And the longer we wait, the less there will be to protect and the more likely that the damage to our planet’s biodiversity and ecosystem services will be irreversible. It is therefore crucial for the world’s governments to step up efforts, greatly increase resources and better target them if we are to protect our natural wealth. From our analysis we can draw a number of conclusions concerning government funding to protected areas: - There are vast disparities between countries and much opaqueness concerning reporting on protected areas
expenditure. - Public funding to protected areas is sorely insufficient and trends, at least for OECD countries, are not set to
remedy this situation. - While private sector funding may increase, public funding (both internal and external) will and should always be
an important base for protected areas. A diversified funding strategy remains essential for protected areas. - Countries with significant natural resources are not always able to invest sufficient amounts on these resources
(as they are often the poorest on the planet) and will need to count on more significant funding from richer countries, that often have less natural resources to protect, but more money to allocate.
- To meet CBD obligations, countries will need to reverse their current spending trend on the environment and
greatly step up funding to protected areas. - In order to allow accurate reporting on spending, countries should be encouraged to follow a similar format
when reporting protected areas expenditures. Overview of Recommendations: Throughout this report we have made a number of significant recommendations that support the above conclusions. These are summarised below:
Recommendation 1: Countries should make more effort to determine the explicit socio-economic benefits of protected areas and their role in contributing to the Millennium Development Goals (MDGs). This will help to raise awareness of the importance of protected areas and will also indirectly help to raise funds for management activities in protected areas. Recommendation 2: Countries should be encouraged to pursue diversified funding strategies for their protected areas and promote sustainable funding, but public funding should in most cases continue to provide an essential core of support. Recommendation 3: More accurate information on public funding to protected areas would allow a better comparison between countries. This could be done by promoting:
- accurate record-keeping; - the use of simple and internationally-accepted budgeting categories (possibly developed by IUCN and promoted by the CBD and also available through some management effectiveness assessment systems).
Recommendation 4: OECD countries should be coherent in their allotment of aid, and environment aid should at least rise in accordance with overall aid. Within environment aid, protected areas should continue to play a significant role. Recommendation 5: As OECD countries are being encouraged under the Paris Declaration on Aid Effectiveness to harmonise their allocation of aid funding, it is all the more important for recipient

32
countries to ensure that protected areas and biodiversity are sufficiently represented in their package for aid assistance. Recommendation 6: Based on our analysis, most countries should be increasing their investment in protected areas (their own or those of other countries) by at least 50 percent to represent at a minimum, between 0.02% and 0.04% of their GDP12. Recommendation 7: When investing their overseas funds dedicated to the environment and to protected areas more specifically, OECD countries should take into account the relative biodiversity values of different countries.
This is a work in progress. We are keenly aware of the problems of isolating the protected areas component from national budget statistics and the limitations of a survey that only looks at a small proportion of the countries. It is hoped to continue and expand this research, and we would be delighted to receive any comments, corrections and additional information.
12 However, more precise data are needed to give a better indication of the level of GDP that should support protected areas. If the recommendations about data collection and analysis made in this report are followed, more precise estimates of necessary funding will be available to calculate necessary inputs from governments.

33
References Alliance for Zero Extinctions, (2005); Zero Extinction, American Bird Conservancy, Virginia, US. Balmford, A., Bruner, A.., Cooper, P., Costanza, R., Farber, S., Green, R.E., Jenkins, M., Jefferiss, P., Jessamy, V., Madden, J., Munro, K., Myers, N., Naeem, S., Paavola, J., Rayment, M., Rosendo, S., Roughgarden, J., Trumper, K., Turner, R.K. (2002); Economic Reasons for Conserving Biodiversity., Science 292. Balmford, A., Gravestock, P., Hockley, N., McClean, C.J. and Roberts, C.M. (2004); “The worldwide costs of marine protected areas”, PNAS 101(26): 9694–9697. Balmford, A. and Whitten, T. (2003); “Paying for tropical conservation”; Oryx, 37(2):238-250. Bovarnick, A. (2007); Financial Sustainability Scorecard for National Systems of Protected Areas, UNDP, New York, US. Bruner, A.G., Gullison, R.E. and Balmford, A. (2004); “Financial Costs and Shortfalls of Managing and Expanding Protected-Area Systems in Developing Countries”, BioScience 54(12):1119-1126 Brunner, A. and Huyton, H. (2007); The Environmental Impact of EU Agricultural Subsidies in the WTO Green Box, ICTSD Programme on Agricultural Trade and Sustainable Development, Geneva, Switzerland. Chape, S., Harrison, J., Spalding, M. and Lysenko, I. (2005); “Measuring the extent and effectiveness of protected areas as an indicator for meeting global biodiversity targets”, Phil. Trans. R. Soc. B, 360:443–455. Chape, S., S. Blyth, L. Fish, P. Fox and M. Spalding (compilers) (2003); 2003 United Nations List of Protected Areas. IUCN, Gland, Switzerland and Cambridge, UK and UNEP-WCMC, Cambridge, UK. CBD, (2004); Options For Mobilizing Financial Resources For The Implementation Of The Programme Of Work By Developing Countries And Countries With Economies In Transition, Montecatini Meeting, CBD Secretariat, Montreal, Canada. Dudley, N., Belokurov, A., Borodin, O., Higgins-Zogib, L., Hockings, M., Lacerda, L. and Stolton, S. (2004); How Effective are Protected Areas ?, WWF International, Gland, Switzerland. Dudley, N., Belokurov, A., Higgins-Zogib, L., Hockings, M., Stolton, S. and Burgess, N. (2007); Tracking Progress in Managing Protected Areas around the World, WWF International, Gland, Switzerland. ECOTEC, (2001); Analysis of the EU Eco-Industries, their Employment and Export Potential: A report to DG ENV of the European Commission, DG ENV. Emerton, L., Rao, K., Nguyen, N., Tu, N. and T. Bao (2004); Covering the Costs of Viet Nam’s Protected Areas, IUCN – The World Conservation Union and Government of Vietnam Forest Protection Division, Hanoi, Vietnam. Emerton, L., Bishop, J., and Thomas, L. (2005); Sustainable Financing of Protected Areas: A global review of challenges and options, IUCN, Gland, Switzerland and Cambridge, UK. GEF, (2005); GEF/R.4/5, Meeting for the Fourth Replenishment of the GEF Trust Fund. Washington, DC, US. Gilligan, B., Dudley, N., Fernandez de Tejada, A., and Toivonen, H. (2005); Management Effectiveness Evaluation of Finland's Protected Areas, Nature Protection Publications of Metsähallitus. Series A 147, Helsinki, Finland. James, A.N., Green, M.J.B. and Paine, J.R. (1999); A Global Review of Protected Area Budgets and Staff, WCMC Biodiversity Series No.10, WCMC – World Conservation Press, Cambridge, UK. Koteen, S. (2004); Financing Species Conservation : A Menu of Options, WWF Center for Conservation Finance, Washington, US. López Ornat, A. and Jiménez-Caballero, S. (2006); Fuentes de Financiación Sostenible para Areas Protegidas en la Región Mediterránea, IUCN, Gland, Switzlernad and Cambridge, UK in collaboration with Fundación Biodiversidad y Agencia Española de Cooperación Internacional del Ministerio de Asuntos Exteriores y de Cooperación. Millennium Ecosystem Assessment, (2005); Ecosystems And Human Well-Being: Biodiversity Synthesis, Island Press, Washington DC, USA.

34
Mulongoy, K.J. and Chape, S.P. (Eds) (2004); Protected Areas and Biodiversity: An overview of key issues. CBD Secretariat, Montreal, Canada and UNEP-WCMC, Cambridge, UK.
Pagiola, S., Bishop, J. and Landell-Mills, N. (eds.) (2002); Selling Forest Environmental Services: Market-based mechanisms for conservation and development, Earthscan, London, UK. Quintela, C.E., Thomas, L. and Robin, S. (2004); Proceedings of the Workshop Stream ‘Building a Secure Financial Future: Finance & Resources’, Vth IUCN World Parks Congress, IUCN, Gland, Switzerland and Cambridge, UK. Secretariat of the Convention on Biological Diversity (2006); Global Biodiversity Outlook 2, Montreal, Canada. Spergel, B. (2001); Raising Revenues for Protected Areas: A Menu of Options, WWF Center for Conservation Finance, Washington, US. World Bank, (2003); Cornerstones for Conservation World Bank Assistance for Protected Areas, 2002, The International Bank for Reconstruction and Development / The World Bank, Washington, DC, US. World Bank (2005); Madagascar Public Expenditure Review: The Challenge of Poverty Reduction, World Bank, Washington, DC, US. WWF, (2006); Conflicting EU funds – Pitting conservation against an unsustainable development, WWF Global Species Programme. Vienna. Austria. Websites consulted: www.oecd.org www.worldbank.org www.unstats.org https://www.cia.gov/library/publications/the-world-factbook/index.html www.earthtrends.org www.undp.org www.cbd.int

35
Annexe 1: Complete data from analysis of biodiversity importance Country WWF
Global 200 CI hotspots
Centres of plant diversity
Birdlife Endemic Bird Areas
Alliance for Zero Extinction
CBD Nation Biodiver-sity Index
TOTAL SCORE
Australia 13 3 2 2 13 3 8 2 18 3 0.853 3 14Azerbaijan 1 1 2 2 1 1 1 1 0 0 0.534 2 7
Belarus 0 0 0 0 1 1 0 0 0 0 0.368 1 2Belgium 0 0 0 0 0 0 0 0 0 0 0.445 1 1
Bolivia 4 2 1 1 4 2 5 1 7 2 0.724 2 10Botswana 2 1 0 0 0 0 0 0 0 0 0.461 1 2
Brazil 15 3 2 2 14 3 15 2 39 3 0.877 3 16Canada 7 3 0 0 14 3 0 0 2 1 0.299 1 8
CAR 2 1 0 0 0 0 0 0 0 0 0.509 2 3Chile 5 2 2 2 6 2 5 1 7 2 0.570 2 11
China 9 3 3 3 40 3 12 2 23 3 0.839 3 17Colombia 6 3 2 2 10 3 14 2 48 3 0.935 3 16
Croatia 2 1 1 1 3 0 0 0 0 0 0.538 2 4Cuba 3 2 1 1 3 2 1 1 18 3 0.703 2 11
Czech Rep. 0 0 0 0 1 1 0 0 0 0 0.498 1 2Denmark 0 0 0 0 0 0 0 0 0 0 0.403 1 1Ecuador 4 2 2 2 7 2 9 2 19 3 0.873 3 14Finland 0 0 0 0 0 0 1 1 0 0 0.290 1 2France 2 1 1 1 3 2 0 0 0 0 0.423 1 5Gabon 3 2 0 0 4 2 1 1 0 0 0.641 2 7
Georgia 1 1 2 2 1 1 1 1 0 0 0.553 2 7 Ghana 1 1 1 1 1 1 0 0 1 1 0.646 2 6
Grenada 1 1 1 1 0 0 1 1 1 1 n/a 0 4Guatemala 1 1 1 1 2 1 3 1 9 2 0.744 2 8Honduras 1 1 1 1 1 1 3 1 14 2 0.653 2 8
Hungary 0 0 0 0 1 1 0 0 0 0 0.441 1 2Iceland 0 0 0 0 0 0 0 0 0 0 0.113 0 0
Indonesia 17 3 2 2 37 3 23 3 29 3 1.000 3 17Israel 1 1 0 0 1 1 0 0 1 1 0.601 2 5Laos 4 2 1 1 1 1 1 1 0 0 0.615 2 7
Latvia 0 0 0 0 0 0 0 0 0 0 0.420 1 1Madagascar 4 2 1 1 1 1 5 1 16 3 0.813 3 11
Mexico 8 3 2 2 13 3 18 3 63 3 0.928 3 17Mongolia 3 2 0 0 0 0 0 0 0 0 0.358 1 3
Mozambique 3 2 2 2 2 1 4 1 2 1 0.522 2 9Namibia 1 1 1 1 2 1 1 1 0 0 0.553 2 6
Nepal 4 2 1 1 1 1 4 1 0 0 0.642 2 7Netherlands 1 1 0 0 0 0 0 0 0 0 0.412 1 2
Norway 1 1 0 0 0 0 0 0 0 0 0.297 0 1Palau 1 1 1 1 0 0 1 1 0 0 n/a 0 3Peru 3 2 2 2 8 3 16 3 31 3 0.843 3 16
Philippines 2 1 1 1 12 3 7 2 11 3 0.786 2 12Russian Fed 13 3 0 0 6 2 8 2 2 1 0.477 1 9
Slovakia 1 1 0 0 0 0 0 0 0 0 0.589 2 3South Africa 4 2 4 3 6 2 5 1 4 1 0.714 2 11
Sweden 1 1 0 0 1 1 0 0 0 0 0.304 1 3Switzerland 1 1 0 0 1 1 0 0 0 0 0.497 1 3
Tanzania 8 3 2 2 12 3 0 0 7 2 0.674 2 12Thailand 4 2 1 1 9 3 0 0 0 0 0.670 2 8
Turkey 3 2 1 1 8 3 1 1 2 1 0.572 2 10Ukraine 1 1 0 0 2 1 0 0 0 0 0.415 1 3
USA 15 3 1 1 36 3 5 1 18 3 0.677 2 13Vietnam 3 2 1 1 7 3 3 1 6 2 0.682 2 11

36
Two figures are listed under each main column: the total number of sites identified within the particular prioritisation method (or the relevant number in the National Biodiversity Index) and on the right the “score” assigned in the analysis carried out for this report. For comparison, figures from each of the prioritisation programmes were rounded up into a 0-3 score, depending on the total number of sites in each assessment. It should be noted that this is an approximate process and could be further refined; we considered it indicative enough for the analysis here. Explanation of rounding scores WWF Global 200 1-2 = 1; 3-6 = 2; 7 or more = 3 CI hotspots 1 = 1; 2 = 2; 3 or more = 3 Centres of Plant Diversity 1-2 = 1; 3-10 = 2; 11 or more = 3 Endemic Bird Areas 1-5 = 1; 6-15 = 2; 16 or more = 3 Alliance for Zero Extinction 1-5 = 1; 6-10 = 2; 11 or more = 3 CBD NBI < 0.25 = 0; 0.25-0.5 = 1; 0.5-0.75 = 2; greater than 0.75 = 3

37
Annexe 2 – National examples In this section we review a few national examples of public funding to protected areas. Each example highlights a particular issue in this respect. The example from Ukraine demonstrates the vast diversity of in-country public funding sources; for instance the Madagascar example highlights that while local public funds are limited in this least-developed country, other funding sources are significant. The first example, from Finland, shows what is possible with strong government support for protected areas. Finland – Strong government support for protected areas Finland has one of the best supported protected area systems in the world and a strong commitment to government funding, with an emphasis on supporting recreational use and providing educational material. People do not pay to enter large protected areas such as national parks and many facilities, including camp sites, overnight huts and accompanying fuelwood, are provided free of charge. There are also a large number of well equipped and well-staffed information centres. Almost two million visits are made to protected areas each year, 80 percent from within the country, which has a total population of only just over five million. Typical uses include hiking, cross-country skiing in the winter and other nature-based activities. The majority of visits are one-day, although people often stay outside and re-visit the same area; there are also trails, camp-sites and huts to encourage people to stay longer. Natural Heritage Services (NHS) is the main agency dealing with protected areas. NHS is one half of the Metsähallitus organisation, which also deals with state forest management. Additional responsibility for some protected areas is in the hands of regional environment centres. The Finnish Forest Research Institute used to manage some protected areas but these were transferred to NHS in 2002. Overall funding for protected areas was around Euro 70 million in 2005, up from Euro 63 million in 2000. Budget has increased steeply over the last twenty years. In 2005, total expenditure by NHS was Euro 53.3 million Euros; this was a considerable growth on 2004 figures (when it was Euro 36.5 million) in part because NHS assumed several new responsibilities including land acquisition for new protected areas, administration of hunting and fishing and maintenance of seed banks. (This means that not all the increase was used entirely for maintenance of the protected area system.) The government provides around 85 percent of NHS funding, although budget comes from a variety of ministries, as outlined in Table 12 below. Table 12: Proportion of funding from various sources for Finland’s protected areas (2006) Funding source Amount
(mil. EUR) Percentage
Ministry of Environment 35.24 66Ministry of Agriculture and Forestry 7.15 11Ministry of the Interior 1.25 1Ministry of Labour 3.08 7European Union 1.88 3Income 5.04 11Other sources 0.42 1 Finland is still actively expanding its protected area network, now in line with the European Union Natura 2000 network commitments, and for example set aside Euro 11.5 million for land acquisition in 2005. The largest single allocation of funding in terms of person-years is directed to recreational issues although nature conservation is also important: a breakdown of person-years on different tasks is given in Table 13. Table 13: Breakdown of person-years allocated to different tasks in Finland’s protected areas Task Person-years Nature recreation 279 Nature conservation 130 Land use 30 Hunting and fishing 32 Other 108 Sources: Heinonen, M. (ed.), (2007); State of the Parks in Finland: Finnish Protected Areas and Their Management from 2000 to 2005, Nature Protection Publications of Metsähallitus: Series A 160. Gilligan, B., Dudley, N., Fernandez de Tejada, A. and Toivonen, H. (2005); Management Effectiveness Evaluation of Finland’s Protected Area, Nature Protection Publications of Metsähallitus: Series A 147.
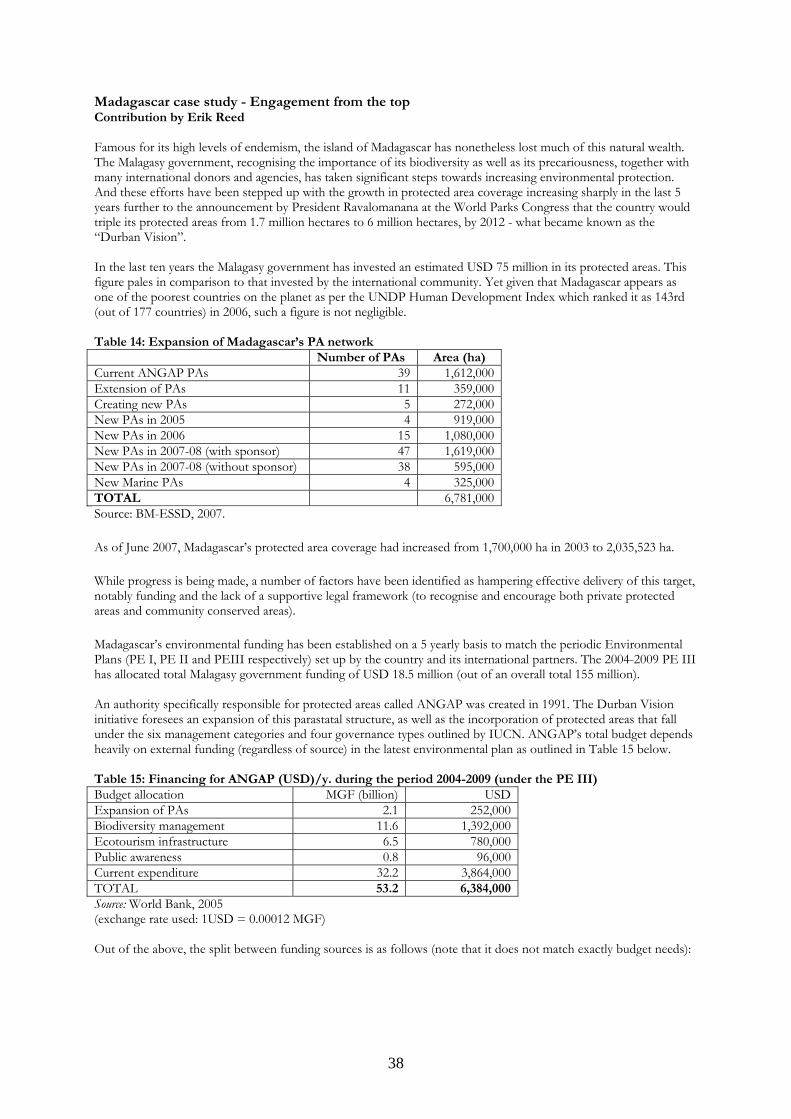
38
Madagascar case study - Engagement from the top Contribution by Erik Reed Famous for its high levels of endemism, the island of Madagascar has nonetheless lost much of this natural wealth. The Malagasy government, recognising the importance of its biodiversity as well as its precariousness, together with many international donors and agencies, has taken significant steps towards increasing environmental protection. And these efforts have been stepped up with the growth in protected area coverage increasing sharply in the last 5 years further to the announcement by President Ravalomanana at the World Parks Congress that the country would triple its protected areas from 1.7 million hectares to 6 million hectares, by 2012 - what became known as the “Durban Vision”. In the last ten years the Malagasy government has invested an estimated USD 75 million in its protected areas. This figure pales in comparison to that invested by the international community. Yet given that Madagascar appears as one of the poorest countries on the planet as per the UNDP Human Development Index which ranked it as 143rd (out of 177 countries) in 2006, such a figure is not negligible. Table 14: Expansion of Madagascar’s PA network Number of PAs Area (ha) Current ANGAP PAs 39 1,612,000Extension of PAs 11 359,000Creating new PAs 5 272,000New PAs in 2005 4 919,000New PAs in 2006 15 1,080,000New PAs in 2007-08 (with sponsor) 47 1,619,000New PAs in 2007-08 (without sponsor) 38 595,000New Marine PAs 4 325,000TOTAL 6,781,000Source: BM-ESSD, 2007.
As of June 2007, Madagascar’s protected area coverage had increased from 1,700,000 ha in 2003 to 2,035,523 ha.
While progress is being made, a number of factors have been identified as hampering effective delivery of this target, notably funding and the lack of a supportive legal framework (to recognise and encourage both private protected areas and community conserved areas).
Madagascar’s environmental funding has been established on a 5 yearly basis to match the periodic Environmental Plans (PE I, PE II and PEIII respectively) set up by the country and its international partners. The 2004-2009 PE III has allocated total Malagasy government funding of USD 18.5 million (out of an overall total 155 million). An authority specifically responsible for protected areas called ANGAP was created in 1991. The Durban Vision initiative foresees an expansion of this parastatal structure, as well as the incorporation of protected areas that fall under the six management categories and four governance types outlined by IUCN. ANGAP’s total budget depends heavily on external funding (regardless of source) in the latest environmental plan as outlined in Table 15 below. Table 15: Financing for ANGAP (USD)/y. during the period 2004-2009 (under the PE III) Budget allocation MGF (billion) USDExpansion of PAs 2.1 252,000Biodiversity management 11.6 1,392,000Ecotourism infrastructure 6.5 780,000Public awareness 0.8 96,000Current expenditure 32.2 3,864,000TOTAL 53.2 6,384,000Source: World Bank, 2005 (exchange rate used: 1USD = 0.00012 MGF) Out of the above, the split between funding sources is as follows (note that it does not match exactly budget needs):

39
Source USD Government 288,000 Entrance fees 204,000 ODA 3,600,000 PA trust fund 936,000 TOTAL (USD) 5,028,000 Under the initiative to expand the network of protected areas in Madagascar the continued need for ODA and funding assistance outside of the government retains a level of high importance for meeting the goals. While the numbers are not comprehensive, deficits for funding and maintaining the initiative have been estimated to be around USD 3-4 million for the management of ANGAP at the end of PE III in 2009 and USD 7-10 million a year by 2012 to manage the entire SAPM (Système des Aires Protégées de Madagascar) the broad network of PAs; another estimate places the deficit at USD 20 million for the period 2007-2011. The estimates illustrate the tremendous gaps for funding for PAs in Madagascar, a need that can seemingly only be met in the interim, by ODA. Sources: BM ESSD, (2007); SAPM et Sauvegardes: Coûts de Création et Gaps de Financement. Note explicative des estimations (draft, January 2007) Carret, JC and Loyer D, (2003); Comment financer durablement le réseau d’aires protégées terrestres à Madagascar ? Apport de l’analyse économique, Workshop “Building comprehensive protected areas systems’. World Parks Congress, Durban, South Africa. MIARO Partners, (2007); Sustainable Financing in Madagascar –A Synopsis of an Action Plan for Commitment 7 on the Environment of the “Madagascar Action Plan - 2007-2012” and Beyond Norris, S.(2006); “Madagascar Defiant”, BioScience 56 (12): 960-965. World Bank, (2005); Madagascar Public Expenditure Review: The Challenge of Poverty Reduction, World Bank, Washington DC, US.

40
Malaysia – Addressing the funding gap Contribution by Surin Suksuwan Malaysia still has relatively good forest cover, estimated at about 59 percent of the country’s total land area, but much of the remaining forest can be found outside of protected areas. This situation is unique in contrast with most other countries in the region where the percentage of forest cover is lower and much of what remains is already within protected areas. The management of protected areas in Malaysia is also unusually complex with many management authorities and different types of protected areas. Politically, Malaysia can be divided into three distinct regions, namely Peninsular Malaysia, and the two Bornean States of Sabah and Sarawak. Under the Federal Constitution, the management of natural resources is under the jurisdiction of the individual State governments (11 states in Peninsular Malaysia in addition to the two on Borneo island). The oldest and largest protected area, Taman Negara National Park (434,351ha), is managed by the Federal Department of Wildlife and National Park which also manages another national park and a number of wildlife reserves. Sabah and Sarawak both have long had their own system of protected areas managed by State agencies. In recent years, the States in Peninsular Malaysia have also begun establishing State Parks. As a result, there is now an increasing number of protected area management authorities that are generally operating independently of one another. Acting on the recommendations of a management effectiveness assessment of national and state parks carried out in 2005 by WWF-Malaysia, the Ministry of Natural Resources and the Environment is now taking the lead role to provide greater coordination of protected area planning and management. Except for a few internationally renowned protected areas such as Taman Negara National Park, Kinabalu Park and the Gunung Mulu National Park – the latter two of which are World Heritage Sites – most of the protected areas in Malaysia have yet to realise their potential in term of tourism revenue. Malaysian protected areas, therefore, are heavily dependent on government funding. In addition, some protected areas have also benefited from international funding, mostly from government aid agencies through integrated conservation and development projects (e.g. DANIDA and JICA), and UNDP-GEF. At the Danum Valley Conservation Area in Sabah, long-term financial and technical assistance is provided by the UK Royal Society to the management authority of the protected area, the Sabah Foundation. In general, protected area funding in Malaysia can be divided into two – development funds and operational funds. For the federal-run protected areas, development and operational funds are channelled through the Department of Wildlife and National Parks while protected areas managed by State agencies receive funds for their operations mainly from their respective State governments. Government development funds are usually for tourism infrastructure and are sourced from the Federal Ministry of Tourism. Protected areas under State governments are also eligible for development funds from the Ministry of Tourism. In all cases, government funds are the major source of funding for protected area operations except for Kinabalu Park whose main source of operational funds is park user fees. Considering that Malaysia is a middle-income country with a Human Development Index ranking of 63, public expenditure on protected areas is surprisingly low. Based on a 2005 study on conservation financing conducted by the Economic Planning Unit of the Prime Minister’s Department in cooperation with DANIDA, the total operational budget for 7 protected areas in Peninsular Malaysia was estimated at only MYR905,516 (1USD = MYR3.29) while for 13 protected areas in Sabah it was MYR8,867,919 (see table 16). The study estimated the operational budget needs for 39 protected areas in Malaysia to be RM36,618, 435. For Peninsular Malaysia alone, the fiscal gap is calculated to be MYR8,867,919 which translates to a shocking 90.7% shortfall in funding.
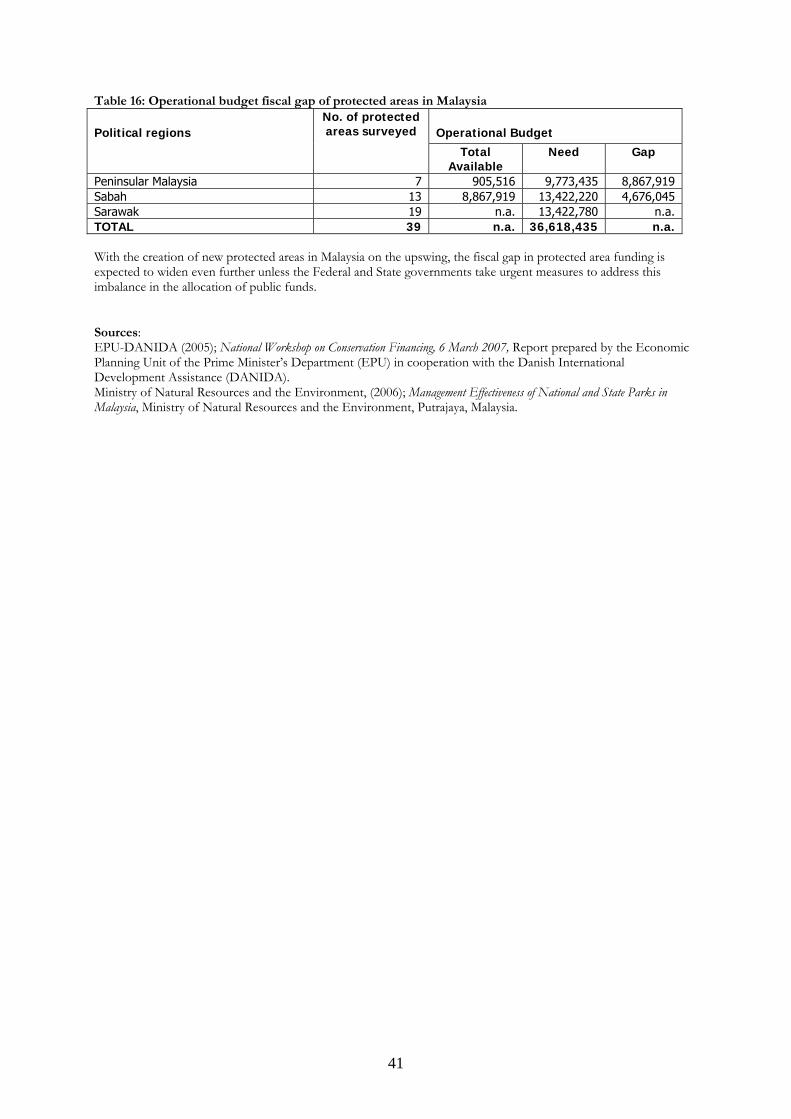
41
Table 16: Operational budget fiscal gap of protected areas in Malaysia
Operational Budget Political regions No. of protected areas surveyed
Total Available
Need Gap
Peninsular Malaysia 7 905,516 9,773,435 8,867,919 Sabah 13 8,867,919 13,422,220 4,676,045 Sarawak 19 n.a. 13,422,780 n.a. TOTAL 39 n.a. 36,618,435 n.a. With the creation of new protected areas in Malaysia on the upswing, the fiscal gap in protected area funding is expected to widen even further unless the Federal and State governments take urgent measures to address this imbalance in the allocation of public funds. Sources: EPU-DANIDA (2005); National Workshop on Conservation Financing, 6 March 2007, Report prepared by the Economic Planning Unit of the Prime Minister’s Department (EPU) in cooperation with the Danish International Development Assistance (DANIDA). Ministry of Natural Resources and the Environment, (2006); Management Effectiveness of National and State Parks in Malaysia, Ministry of Natural Resources and the Environment, Putrajaya, Malaysia.

42
Ukraine – a multitude of public funding sources for protected areas Ukraine is expanding its protected areas network but is struggling with multiple sources of funding, insufficient money and some confusion in legislation. As of January 2006, Ukraine had a reported total of 7,243 “protected sites” accounting for 4.6 percent of the territory, but this includes both protected areas and various other land with some planning controls including mines, airports etc. The World Database on Protected Areas instead lists 5199 sites, including 8 national parks one of which is proposed. Many sites are small. The World Resources Institute’s Earthtrends database lists Ukraine as having 3.3 percent of its land area in protected areas, which is considerably below European or global average. Some sites within protected areas have been privatised and there is confusion about how the new owners might receive compensation. The protected area network has expanded rapidly since 1990. While there is a professed expression of interest in the environment, and Ukraine has released a report on progress towards addressing the CBD Programme of Work on Protected Areas, economic development has tended to overshadow environmental efforts in the country. In an April 2006 resolution, the Board of the Ministry of Environmental Protection noted “preserving biodiversity and landscape diversity “ and “improving the management of nature reserves” as top priorities alongside waste treatment, water management, the UNFCCC and state ownership of natural resources. Everyone agrees that funding is insufficient and that the national system has expanded more quickly then the accompanying support, so that many properties are in poor condition. Ukraine has a multitude of environmental funds which operate at three levels: national, regional and local. These funds are financed essentially by pollution charges and provide about a third of funding for the environment. There is one overall state fund, 27 regional ones and thousands of local ones. Most of the environmental funds are used to address water pollution, which is of major concern in Ukraine. The main single source of financial support of the environmental activities in Ukraine is The State Environmental Protection Fund established according to the Law of Ukraine "On Environmental Protection" (25.06.1991, № 1264-XII). Overall environment spending in Ukraine from both public and private sources amounted to USD 1.1 billion in 2004, which is nearly double the USD 650 million in 2002, with the share of public funds being about one third. The “Main Directions of the National Policy of Ukraine for Environmental Protection, Natural Resource Use and Environmental Safety” of 1998 is the framework guiding public environmental expenditure. The fact that 17 state bodies fund the environment in Ukraine demonstrates the difficulty in aggregating such data at a national level (see Table 17). Table 17: Ukraine public sources of environment funding (January-June 2005) State body USD million Percent of total Ministry of Fuel and Energy 62.99 31.37 Ministry of Environmental Protection 53.15 26.47 Ministry of Emergencies 28.91 14.40 National Academy of Sciences 10.96 5.46 Ministry of Defence 10.19 5.07 State Committee for Water Management 8.50 4.23 National Space Agency 7.92 3.94 State Forestry Committee 5.42 2.70 Ministry of Industrial Policy 4.65 2.32 State Committee on Natural Resources 3.17 1.58 Ukrainian Academy of Agrarian Sciences 1.17 0.58 State Management Office 1.06 0.53 Ministry of Agricultural Policy 0.99 0.49 State Committee on Land Resources 0.99 0.49 Kherson Oblаst State Administration (floods) 0.44 0.22 State Nuclear Regulatory Committee 0.26 0.13 State Committee on Housing and Communal Service 0.03 0.02 Total 200.82 100 Source: Ministry of Finance, quoted in UNECE, 2007 Sources: EarthTrends (2003); Biodiversity and protected areas: Ukraine, World Resources Institute, Washington DC. UNDP, Government Of Ukraine, Ukrainian Scientific And Research Institute Of Water Management And Ecological Problems, (2006); UNDP/GEF Project “National Capacity Self-Assessment For Global Environment Management In Ukraine” Basic Report On The Implementation Of The Convention On Biological Diversity In Ukraine (1992-2006), Project leader: A. Yatsyk, Project manager: V. Tolkachov. UNECE, (2007); Environmental Performance Reviews: Ukraine, Second Review, UN, New York and Geneva.

43
European Union – Financing Natura 2000 Contribution by Andreas Baumueller Europe is home to an extraordinary set of habitats and species, from snow covered alpine peaks, romantic Mediterranean seabeds and beaches, to the mystical forests of the Carpathians. To conserve threatened species and habitats of Community interest the European Union has created a network of sites called Natura 2000. By now, significant progress has been made in the establishment of the Natura 2000 network through the designation by EU Member States of more than 18,000 sites which cover already about 18 % of the EU territory. A great variety of activities have been defined for the effective management of these sites such as developing management plans, habitat restoration and active management activities (such as mowing or species monitoring). Integration of Financing of Natura 2000 in all relevant EU funding lines With the start of the new financial period (2007 – 2013) the European Union has chosen to integrate the financing of Natura 2000 in all relevant EU funding lines, including Structural Funds and Rural Development Fund. The following reasons are presented for this option:
it will ensure that the management of Natura 2000 sites is part of the wider land management policies of the EU. Thus, farming inside Natura 2000 sites will be part of the Common Agricultural Policy financial support and, structural interventions, being part of rural and regional development policies. This complementary approach will enable the network of Natura 2000 sites to play its role in protecting Europe’s biodiversity better than if Natura 2000 sites are seen to be isolated or different from the wider policy context.
it will allow Member States to set priorities and to develop policies and measures which reflect their
national and regional specificities.
it will avoid duplication and overlap of different Community funding instruments and the administrative complication and transaction costs which would be associated with such duplication.
This funding policy guarantees that the financing of protected areas moves from a discussion of conservationists to the discussion of all relevant stakeholders who can influence the funding of Natura 2000 more substantially. Indeed, only with a broader financial support can the funding of protected areas be sufficient in the European Union. Because of the integration of financing Natura 2000 in all relevant EU funding lines, the funding has become more complex. However, the European Commission is providing a set of tools which provides support on how to obtain funds for the Natura 2000 sites (see: Handbook and IT tool of Financing Natura 20001). The Financial Instrument for the Environment, LIFE+ The integration of environment funding in the EU is a positive development. In addition to this integration, there remains a relatively small but dedicated funding line for the environment which is called LIFE+. It not only gives priority to the financing of Natura 2000, but also includes these sites in the distribution of the total LIFE+ money between EU Member States. Fifty-five percent of the proportional distribution is based on population and a substantial 45% of the proportional distribution is based on the Natura 2000 network2. Thus, Member States that have a larger surface area of Natura 2000 sites, can obtain more money from Life+. While this is a big achievement, it does not signify that protected area funding in the EU is sufficient. The amount in question, as in most countries of the world, remains small: in effect only 0.2 % of the total EU budget is dedicated to LIFE+. Sources: 1. http://ec.europa.eu/environment/nature/natura2000/financing/index_en.htm 2. LIFE+ Regulation (Article 6 – Programming and project selection): http://eur-lex.europa.eu/LexUriServ/LexUriServ.do?uri=OJ:L:2007:149:0001:0016:EN:PDF