public financial report for the 1st quarter 2017 bank m2m ... · the ank’s mission is to render a...
TRANSCRIPT
Public financial report
for the 1st quarter 2017
Bank M2M Europe AS
Riga, May 30, 2017
Bank M2M Europe AS Public Financial Report
for the 1st quarter 2017
Information in this report is prepared according to the FCMC’s Regulations No145 'Regulations for the Preparation of Public Quarterly Reports for Credit Institutions'.
[2]
TABLE OF CONTENTS
I GENERAL INFORMATION ................................................................................................................................ 3
1. SHAREHOLDERS OF THE BANK ........................................................................................................................................................ 3
2. COUNCIL OF THE BANK ................................................................................................................................................................. 3
3. MANAGEMENT BOARD OF THE BANK .............................................................................................................................................. 3
4. STRATEGY AND VISION OF THE BANK ............................................................................................................................................... 4
5. CONSOLIDATION GROUP............................................................................................................................................................... 4
6. THE ORGANISATIONAL STRUCTURE OF THE GROUP ............................................................................................................................ 5
II THE BANK’S FINANCIAL POSITION AND PERFORMANCE ................................................................................. 6
1. STATEMENT OF FINANCIAL POSITION AS AT 31 MARCH, 2017 AND 31 DECEMBER, 2016 ........................................................................ 6
2. INCOME STATEMENT FOR THE 3 MONTH PERIOD, ENDED ON MARCH 31, 2017 AND 2016 ..................................................................... 7
3. PERFORMANCE INDICATORS .......................................................................................................................................................... 7
4. ANALYSIS OF CONCENTRATION OF THE GROUP’S SECURITIES PORTFOLIO ................................................................................................ 8
III RISK AND CAPITAL MANAGEMENT ............................................................................................................... 8
1. RISK MANAGEMENT .................................................................................................................................................................... 8
2. CAPITAL ADEQUACY ..................................................................................................................................................................... 9
Bank M2M Europe AS Public Financial Report
for the 1st quarter 2017
Information in this report is prepared according to the FCMC’s Regulations No145 'Regulations for the Preparation of Public Quarterly Reports for Credit Institutions'.
[3]
I GENERAL INFORMATION
1.Shareholders of the Bank 31.03.2017
Shareholder Country Total, EUR % of total share capital
Andrey Vdovin and family members Russia 18 042 010 56.09%
Other shareholders (not Substantial participation)
- 14 128 730 43.91%
Paid up share capital of the Bank as of March 31, 2017 was EUR 32 170 740 and it consisted of 459 582 name
shares with voting rights. The nominal value of each share is EUR 70. All shares are dematerialized registered
shares.
2.Council of the Bank
Name, Surname Position
Andrey Vdovin Member of the Council/ Chairman of the Council
Peter Charles Percival Hambro Member of the Council/ Deputy Chairman of the Council
Thomas Roland Evert Neckmar Member of the Council
There were no changes in the Council of the Bank during the reporting period.
3.Management Board of the Bank
Name, Surname Position
Robert Idelson Chairman of the Board
Tatyana Drobina Member of the Board
Sergey Zaitsev Member of the Board
There were no changes in the Management Board of the Bank during the reporting period.

Bank M2M Europe AS Public Financial Report
for the 1st quarter 2017
Information in this report is prepared according to the FCMC’s Regulations No145 'Regulations for the Preparation of Public Quarterly Reports for Credit Institutions'.
[4]
4.Strategy and Vision of the Bank In accordance with the strategy approved by the Bank’s Council, Bank M2M Europe main segments of business are
private banking and business banking.
The Bank’s mission is to render a full range of wealth management services to high net worth clients, as well as
to service their private and business daily banking operations.
The goals of the Bank are:
(a) to become one of the leading banks in the private banking segment in the Baltics;
(b) to develop and expand the range of top quality products and services for high net worth clients from Russia
and other CIS, Latvia and other European countries;
(c) to develop the loyal client base and grow business volumes, in order to achieve the goals and results,
defined in the Bank’s strategy.
5.Consolidation Group
The Consolidation Group of Bank M2M Europe includes its subsidiary:
Name of company, Registration number
Registration location code and address
Type of activities
% of total paid-in share capital
% of total voting rights
„M2M Asset Management” IPAS
40103362872
LV, Antonijas Street 3-1, Riga, Latvia, LV-1010
Asset management company
100 100
Bank M2M Europe AS Public Financial Report
for the 1st quarter 2017
Information in this report is prepared according to the FCMC’s Regulations No145 'Regulations for the Preparation of Public Quarterly Reports for Credit Institutions'.
[5]
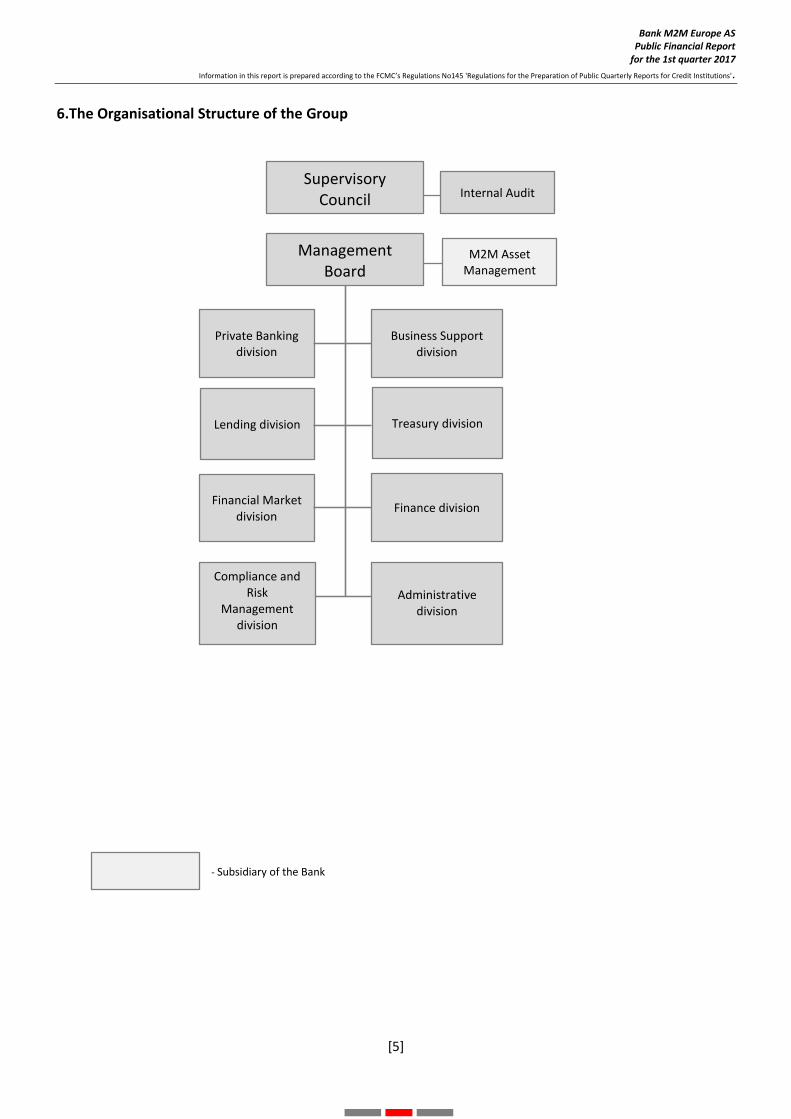
6.The Organisational Structure of the Group
Private Banking division
Finance division
Administrative
division
Financial Market division
Business Support division
Compliance and Risk
Management division
Lending division
Internal Audit
M2M Asset Management
Supervisory Council
Management Board
Treasury division
- Subsidiary of the Bank

Bank M2M Europe AS Public Financial Report
for the 1st quarter 2017
Information in this report is prepared according to the FCMC’s Regulations No145 'Regulations for the Preparation of Public Quarterly Reports for Credit Institutions'.
[6]
II THE BANK’S FINANCIAL POSITION AND PERFORMANCE 1.Statement of Financial Position as at 31 March, 2017 and 31 December, 2016
(EUR 000’s)
Title of entry 31.03.2017.
Group (Unaudited)
31.03.2017. Bank
(Unaudited)
31.12.2016 Group
(Audited)*
31.12.2016 Bank
(Audited)*
Assets
Cash and demand deposits with central banks 2 522 2 522 18 195 18 195
Demand deposits with credit institutions 33 357 33 226 28 552 28 383
Financial assets held for trading 1 074 1 074 526 526
Financial assets at fair value through profit or loss 2 304 2 304 2 361 2 361
Available-for-sale financial assets 28 856 28 856 24 197 24 197
Loans and receivables: 68 118 68 118 75 340 75 340
Short term deposits with credit institutions 16 588 16 588 13 938 13 938
Other deposits with financial institutions 1 921 1 921 1 857 1 857
Loans to companies and private individuals 49 609 49 609 59 545 59 545
Held to maturity investments 14 425 14 425 18 843 18 843
Change of fair value of hedge portfolio hedged against interest rate risk
- - - -
Prepaid expense and accrued income 324 322 298 266
Property and equipment 2 146 2 142 2 167 2 164
Investment properties - - - -
Goodwill and other intangible assets 1 106 318 1 135 346
Investments in share capital of related and associated companies
- 1 874 - 1 874
Tax assets 2 375 2 288 2 397 2 310
Other assets 760 741 1 509 1 486
Non-current assets and disposal groups classified as held for sale
544 544 544 544
Total assets 157 911 158 754 176 064 176 835
Liabilities
Liabilities due to central banks - - 12 500 12 500
Demand liabilities from credit institutions 59 59 37 37
Financial liabilities held for trading - - - -
Financial liabilities designated at fair value through profit or loss
695 695 1 522 1 522
Financial liabilities at the amortized cost 121 836 123 110 140 680 141 878
Financial liabilities arising from financial asset transfer of financial assets
- - - -
Change in the fair value of the portfolio hedged against interest rate risk
- - - -
Deferred income and accrued expense 1 211 1 183 1 104 1 079
Provisions - - - -
Tax liabilities 7 6 23 22
Other liabilities 14 513 14 512 763 763
Total liabilities 138 321 139 565 156 629 157 801
Total shareholders’ equity 19 590 19 189 19 435 19 034
Total liabilities and shareholders’ equity 157 911 158 754 176 064 176 835
Assets under management 159 729 100 414 161 090 101 273
Memorandum items 7 792 7 792 9 804 9 804
Contingent liabilities 2 806 2 806 2 846 2 846
Financial commitments 4 986 4 986 6 958 6 958
Custody assets 153 330 153 330 164 792 164 792
* Auditor: KPMG Baltics SIA

Bank M2M Europe AS Public Financial Report
for the 1st quarter 2017
Information in this report is prepared according to the FCMC’s Regulations No145 'Regulations for the Preparation of Public Quarterly Reports for Credit Institutions'.
[7]
2.Income statement for the 3 Month Period, Ended on March 31, 2017 and 2016
(EUR 000’s)
Title of entry 31.03.2017.
Group (Unaudited)
31.03.2017. Bank
(Unaudited)
31.03.2016. Group
(Unaudited)
31.03.2016. Bank
(Unaudited)
Interest income 1 379 1 379 1 777 1 776
Interest expense (425) (428) ( 877) ( 881)
Dividends received 1 1 16 16
Commission and fee income 715 659 804 751
Commission and fee expense (58) (58) ( 162) ( 162)
Net realised gain/ (loss) from financial assets and financial liabilities measured at amortised cost
- - - -
Net realised gain/(loss) from available-for-sale financial assets
20 20 ( 125) ( 125)
Net realised gain/(loss) from financial assets and financial liabilities held for trading
(40) (41) 414 414
Net realised gain/(loss) from financial assets and financial liabilities at fair value through profit or loss
(10) (9) ( 65) ( 65)
Changes in fair value hedge accounting - - - -
Net result from foreign exchange trading and revaluation
38 40 402 411
Gain/loss from sale of tangible and intangible fixed assets
- - - -
Other income 27 27 58 58
Other expense (99) (96) ( 67) ( 66)
Administrative expense (1 333) (1 279) (1 387) (1 331)
Depreciation (116) (116) ( 118) ( 117)
Impairment allowance 11 11 6 6
Impairment on financial assets 9 9 ( 183) ( 183)
Profit/(loss) before corporate income tax (+/-) 119 119 493 502
Corporate income tax (14) (14) (18) (18)
Net profit/(loss) for the period (+/-) 105 105 475 484
3.Performance Indicators
Title of entry 31.03.2017.
Group (Unaudited)
31.03.2017. Bank
(Unaudited)
31.03.2016. Group
(Unaudited)
31.03.2016. Bank
(Unaudited)
Return on equity (ROE) 6.47% 6.56% 15.87% 15.29%
Return on assets (ROA) 0.55% 0.53% 1.21% 1.12%
Bank M2M Europe AS Public Financial Report
for the 1st quarter 2017
Information in this report is prepared according to the FCMC’s Regulations No145 'Regulations for the Preparation of Public Quarterly Reports for Credit Institutions'.
[8]
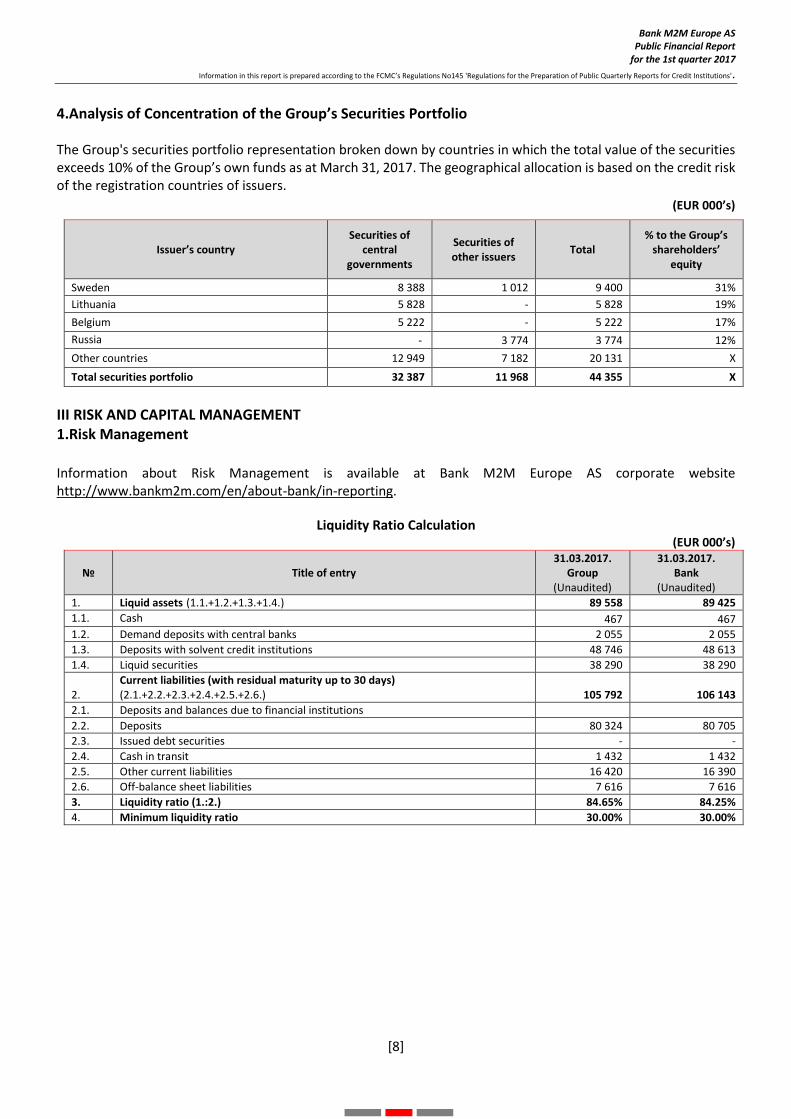
4.Analysis of Concentration of the Group’s Securities Portfolio The Group's securities portfolio representation broken down by countries in which the total value of the securities exceeds 10% of the Group’s own funds as at March 31, 2017. The geographical allocation is based on the credit risk of the registration countries of issuers.
(EUR 000’s)
Issuer’s country Securities of
central governments
Securities of other issuers
Total % to the Group’s
shareholders’ equity
Sweden 8 388 1 012 9 400 31%
Lithuania 5 828 - 5 828 19%
Belgium 5 222 - 5 222 17%
Russia - 3 774 3 774 12%
Other countries 12 949 7 182 20 131 X
Total securities portfolio 32 387 11 968 44 355 X
III RISK AND CAPITAL MANAGEMENT 1.Risk Management
Information about Risk Management is available at Bank M2M Europe AS corporate website http://www.bankm2m.com/en/about-bank/in-reporting.
Liquidity Ratio Calculation (EUR 000’s)
№ Title of entry 31.03.2017.
Group (Unaudited)
31.03.2017. Bank
(Unaudited)
1. Liquid assets (1.1.+1.2.+1.3.+1.4.) 89 558 89 425
1.1. Cash 467 467
1.2. Demand deposits with central banks 2 055 2 055
1.3. Deposits with solvent credit institutions 48 746 48 613
1.4. Liquid securities 38 290 38 290
2.
Current liabilities (with residual maturity up to 30 days) (2.1.+2.2.+2.3.+2.4.+2.5.+2.6.) 105 792 106 143
2.1. Deposits and balances due to financial institutions
2.2. Deposits 80 324 80 705
2.3. Issued debt securities - -
2.4. Cash in transit 1 432 1 432
2.5. Other current liabilities 16 420 16 390
2.6. Off-balance sheet liabilities 7 616 7 616
3. Liquidity ratio (1.:2.) 84.65% 84.25%
4. Minimum liquidity ratio 30.00% 30.00%

Bank M2M Europe AS Public Financial Report
for the 1st quarter 2017
Information in this report is prepared according to the FCMC’s Regulations No145 'Regulations for the Preparation of Public Quarterly Reports for Credit Institutions'.
[9]
2.Capital Adequacy
Information about Capital Management is available at Bank M2M Europe AS corporate website http://www.bankm2m.com/en/about-bank/in-reporting. The Bank’s equity is higher than the total amount of capital, required for covering all the significant risks, inherent to the Bank’s activity.
Own funds and capital adequacy ratios summary (EUR 000’s)
№ Title of entry 31.03.2017.
Group (Unaudited)
31.03.2017. Bank
(Unaudited)
1. Own funds (1.1.+1.2.)* 30 270 30 782
1.1. Tier 1 capital (1.1.1.+1.1.2.) 16 580 17 092
1.1.1. Common Equity Tier (CET) 1 capital 16 580 17 092
1.1.2. Additional Tier 1 capital - -
1.2. Tier 2 capital 13 690 13 690
2. Total Risk exposure value (2.1.+2.2.+2.3.+2.4.+2.5.+2.6.+2.7.) 117 341 118 316
2.1.
Risk weighted exposure value for credit, counterparty credit and dilution risk and free deliveries
98 693 100 482
2.2. Total risk exposure value for settlements/delivery - -
2.3. Total risk exposure value for position risk, foreign exchange and commodity risks 4 792 4 651
2.4. Total risk exposure value for operational risk 13 632 12 959
2.5. Total risk exposure value for credit valuation adjustment 224 224
2.6. Total risk exposure risk value related to large exposures in trading book - -
2.7. Other risk exposure values - -
3. Capital ratios and capital levels
3.1. CET 1 capital ratio (1.1.1./2.*100) 14.13% 14.45%
3.2. Surplus (+) / deficit (–) of CET 1 capital (1.1.1.-2.*4.5%) 11 300 11 768
3.3. Tier 1 capital ratio (1.1./2.*100) 14.13% 14.45%
3.4. Surplus (+) / deficit (–) of Tier 1 capital (1.1.-2.*6%) 9 540 9 993
3.5. Total capital ratio (1./2.*100) 25.80% 26.02%
3.6. Surplus (+) / deficit (–) of total capital (1.-2.*8%) 20 883 21 317
4. Combined buffer requirement (4.1.+4.2.+4.3.+4.4.+4.5.) 2.50% 2.50%
4.1. Capital conservation buffer (%) 2.50% 2.50%
4.2. Institution-specific countercyclical capital buffer (%) 0.00% 0.00%
4.3. Systemic risk buffer (%) - -
4.4. Systemically important institution buffer (%) - -
4.5. Other systemically important institution buffer (%) - -
5. Capital adequacy ratios including adjustments
5.1.
Adjustment for provisions or assets, applying special policy for the purpose of the own funds calculation
- -
5.2. Common equity tier 1 capital ratio, including adjustments in row 5.1. 14.13% 14.45%
5.3. Tier 1 capital ratio, including adjustments in row 5.1. 14.13% 14.45%
5.4. Total capital ratio, including adjustments in row 5.1. 25.80% 26.02%
*Equity includes a correction in the amount of excess of the estimated expected losses over the provisions calculated and made according to the accounting
standards.
Bank M2M Europe AS Public Financial Report
for the 1st quarter 2017
Information in this report is prepared according to the FCMC’s Regulations No145 'Regulations for the Preparation of Public Quarterly Reports for Credit Institutions'.
[10]
Bank M2M Europe AS 3, Antonijas street, Riga, LV-1010 Latvia Phone: +371 67 080 000 Fax: +371 67 080 001 [email protected] www.bankm2m.com