public education finances: 2012...public education finances: 2012 2012 census of governments...
TRANSCRIPT

U.S. Department of Commerce Economics and Statistics Administration U.S. CENSUS BUREAU
census.gov
Issued May 2014G12-CG-ASPEF
2012 Census of Governments
Public Education Finances: 2012
by Mark Dixon

Acknowledgments
Lisa Blumerman, former Chief, Governments Division, directed the preparation of this report.
Jill Renee O’Brien, former Assistant Division Chief for Special Statistics, Governments Division, provided general supervision for the preparation of this report.
This report was prepared in the Governments Division by the Educational Finance and Special Statistics Branch, headed by Terri M. Kennerly. Mark A. Dixon supervised the data collection and editing activities, assisted by Osei L. Ampadu, Kenneth Beatty, Marquita Hutchins, Jeremy Phillips, Freda M. Spence, and Stephen Wheeler. Stephen Wheeler coordinated publication preparation activities and prepared data tabulations.
Musbaw Alawiye and Faye Brock of the Census Bureau’s Center for New Media and Promotions provided publication management, graphics design and composition, and editorial review for electronic media.
The U.S. Census Bureau offers special thanks for the cooperation of the numerous state and local government officials in providing information for this report.
For information regarding data in this report, contact the Educational Finance and Special Statistics Branch, Governments Division, U.S. Census Bureau, Washington, DC 20233. Telephone: 800-622-6193; E-mail: <[email protected]>.
Public Education Finances: 2012
2012 Census of Governments G12-CG-ASPEF
Issued May 2014
U.S. Department of Commerce Penny Pritzker,
SecretaryPatrick Gallagher,
Performing the Duties of Deputy Secretary
Economics and Statistics Administration Mark Doms,
Under Secretary for Economic Affairs
U.S. CENSUS BUREAUJohn H. Thompson,
Director
ECONOMICS
AND STATISTICS
ADMINISTRATION
SUGGESTED CITATION
U.S. Census Bureau, Public Education Finances: 2012,
G12-CG-ASPEFU.S. Government Printing Office,
Washington, DC, 2014.
Economics and Statistics Administration
Mark Doms, Under Secretary for Economic Affairs
U.S. CENSUS BUREAU
John H. Thompson, Director
Nancy A. Potok, Deputy Director and Chief Operating Officer
William G. Bostic, Jr., Associate Director for Economic Programs
Shirin A. Ahmed, Assistant Director for Economic Programs
Shirin A. Ahmed, Acting Chief, Governments Division
Public Education Finances: 2012 iii U.S. Census Bureau
CONTENTS
Introduction . . . . . . . . . . . . . . . . . . . . . . . . . . . . . . . . . . . . . . . . . . . . . . . . . . . . . . . . . . . . v
Figures
1. Public Elementary-Secondary School System Revenue by Source and State: Fiscal Year 2012 . . . . . . . . . . . . . . . . . . . . . . . . . . . . . . . . . . . . . . . . . . . . . . . . . . . . xi
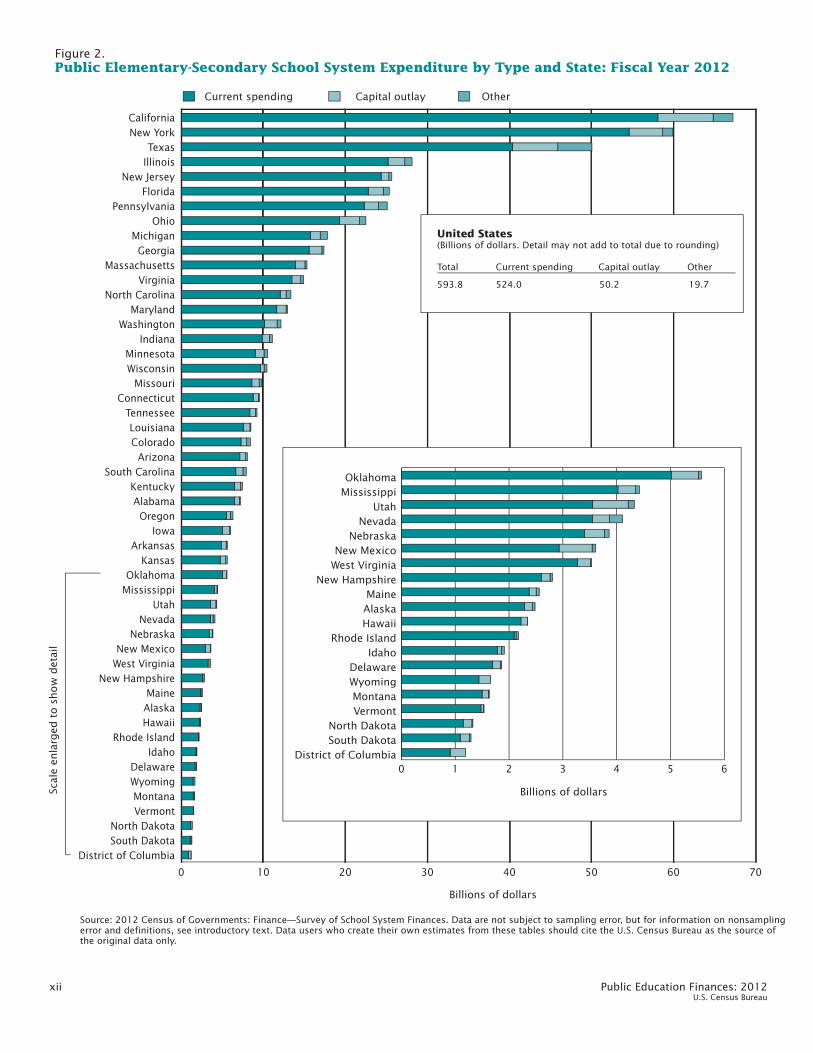
2. Public Elementary-Secondary School System Expenditure by Type and State: Fiscal Year 2012 . . . . . . . . . . . . . . . . . . . . . . . . . . . . . . . . . . . . . . . . . . . . . . . . . . . . xii
3. Public Elementary-Secondary School System Current Spending by Major Function and State: Fiscal Year 2012 . . . . . . . . . . . . . . . . . . . . . . . . . . . . . . . . . . . .xiii
4. Public Elementary-Secondary School System Per Pupil Current Spending by State: Fiscal Year 2012 . . . . . . . . . . . . . . . . . . . . . . . . . . . . . . . . . . . . . . . . . . . . . . .xiv
5. Public Elementary-Secondary School System Current Spending Per $1,000 of Personal Income by State: Fiscal Year 2012 . . . . . . . . . . . . . . . . . . . . . . . . . . . . . . . xv
6. Current Spending Per Pupil for Public Elementary-Secondary School Systems: Fiscal Years 1992–2012 . . . . . . . . . . . . . . . . . . . . . . . . . . . . . . . . . . . . . . . . . . . . . .xvi
Tables
Public Elementary-Secondary Education Finances by State
1. Summary of Public Elementary-Secondary School System Finances by State: Fiscal Year 2012 . . . . . . . . . . . . . . . . . . . . . . . . . . . . . . . . . . . . . . . . . . . . . . . . 1
2. Revenue From Federal Sources for Public Elementary-Secondary School Systems by State: Fiscal Year 2012 . . . . . . . . . . . . . . . . . . . . . . . . . . . . . . . . . . . . . . . . . . . . . 2
3. Revenue From State Sources for Public Elementary-Secondary School Systems by State: Fiscal Year 2012 . . . . . . . . . . . . . . . . . . . . . . . . . . . . . . . . . . . . . . . . . . . . . . . . 3
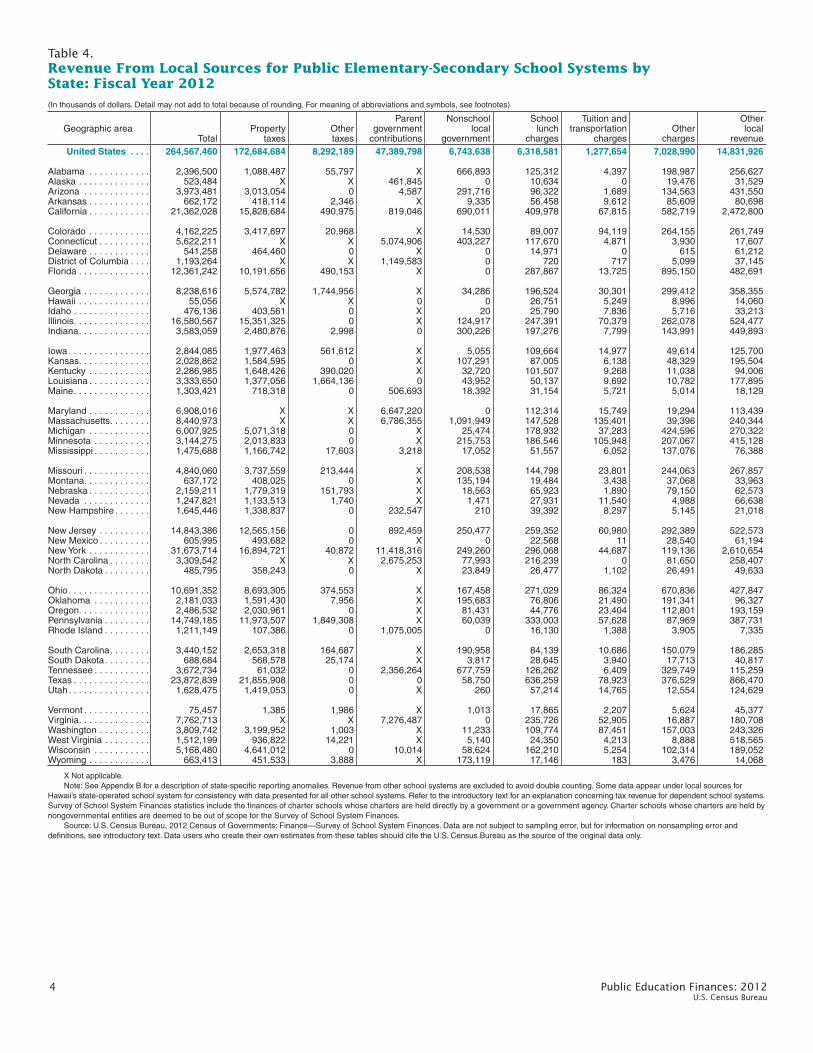
4. Revenue From Local Sources for Public Elementary-Secondary School Systems by State: Fiscal Year 2012 . . . . . . . . . . . . . . . . . . . . . . . . . . . . . . . . . . . . . . . . . . . . . . . . 4
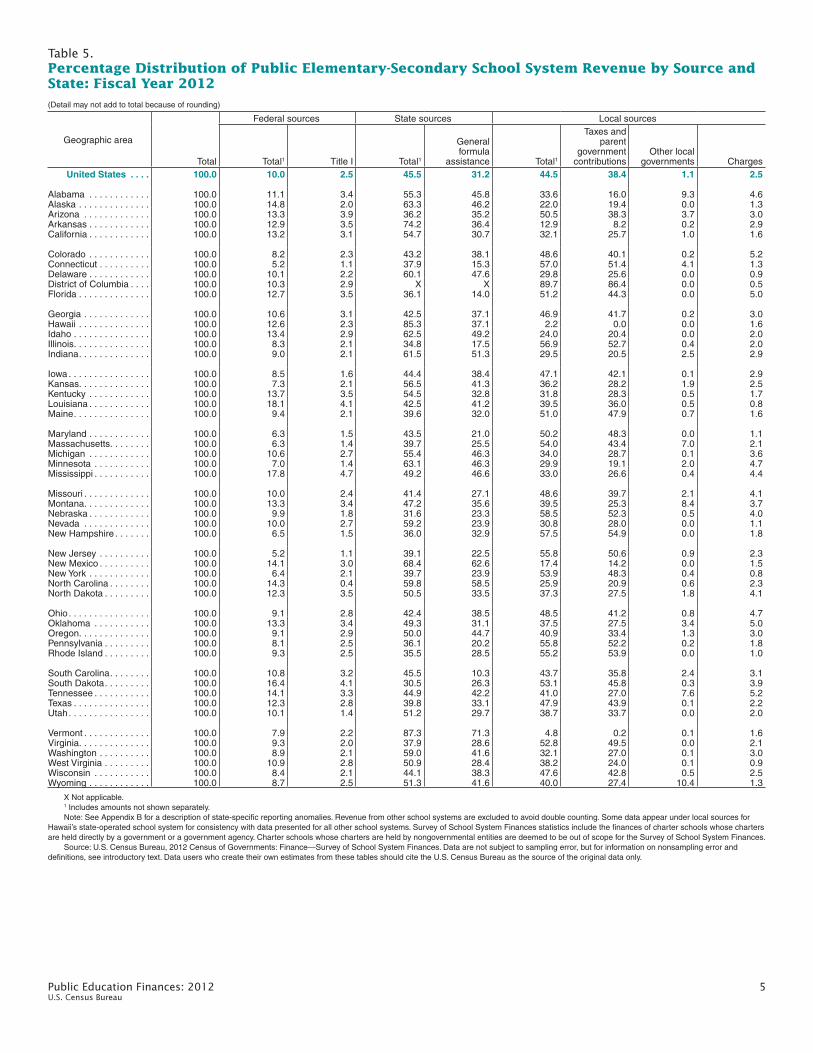
5. Percentage Distribution of Public Elementary-Secondary School System Revenue by Source and State: Fiscal Year 2012 . . . . . . . . . . . . . . . . . . . . . . . . . . . . . . . . . . . . 5
6. Current Spending of Public Elementary-Secondary School Systems by State: Fiscal Year 2012 . . . . . . . . . . . . . . . . . . . . . . . . . . . . . . . . . . . . . . . . . . . . . . . . 6
7. Support Services Expenditure for Public Elementary-Secondary School Systems by Function and State: Fiscal Year 2012 . . . . . . . . . . . . . . . . . . . . . . . . . . . . . . . . . . . 7
8. Per Pupil Amounts for Current Spending of Public Elementary-Secondary School Systems by State: Fiscal Year 2012 . . . . . . . . . . . . . . . . . . . . . . . . . . . . . . . . . . . . . . . 8
9. Capital Outlay and Other Expenditure of Public Elementary-Secondary School Systems by State: Fiscal Year 2012 . . . . . . . . . . . . . . . . . . . . . . . . . . . . . . . . . . . . . . . 9
10. Indebtedness and Debt Transactions of Public Elementary-Secondary School Systems by State: Fiscal Year 2012 . . . . . . . . . . . . . . . . . . . . . . . . . . . . . . . . . . . . . . 10

iv Public Education Finances: 2012 U.S. Census Bureau
Tables—Con. Relational Statistics and Rankings
11. States Ranked According to Per Pupil Public Elementary-Secondary School System Finance Amounts: Fiscal Year 2012 . . . . . . . . . . . . . . . . . . . . . . . . . . . . . . . 11
12. States Ranked According to Relation of Public Elementary-Secondary School System Finance Amounts to $1,000 Personal Income: Fiscal Year 2012 . . . . . . . . . . 12
Public Elementary-Secondary Education Finances by Size Group
13. Public Elementary-Secondary School System Finances by Enrollment-Size Groups: Fiscal Year 2012 . . . . . . . . . . . . . . . . . . . . . . . . . . . . . . . . . . . . . . . . . . . . . 13
14. Per Pupil Amounts of Public Elementary-Secondary School System Finances by Enrollment-Size Groups: Fiscal Year 2012 . . . . . . . . . . . . . . . . . . . . . . . . . . . . . . 14
Individual Public Elementary-Secondary School Systems
15. Revenue of the 100 Largest Public Elementary-Secondary School Systems in the United States by Enrollment: Fiscal Year 2012 . . . . . . . . . . . . . . . . . . . . . . . . . . . . . 15
16. Expenditure of the 100 Largest Public Elementary-Secondary School Systems in the United States by Enrollment: Fiscal Year 2012 . . . . . . . . . . . . . . . . . . . . . . . . 19
17. Percentage Distribution of Revenue of the 100 Largest Public Elementary- Secondary School Systems in the United States by Enrollment: Fiscal Year 2012 . . . . 23
18. Per Pupil Amounts for Current Spending of the 100 Largest Public Elementary- Secondary School Systems in the United States by Enrollment: Fiscal Year 2012 . . . . 25
Population, Enrollment, and Personal Income
19. Population, Enrollment, and Personal Income by State: Fiscal Years 2011 and 2012 . . 27
Per Pupil Expenditure Amounts and Percentage Changes by State
20. Per Pupil Current Spending (PPCS) Amounts and 1-Year Percentage Changes for PPCS of Public Elementary-Secondary School Systems by State: Fiscal Years 2007–2012 . . . 28
Appendixes
A. Definitions of Selected Terms . . . . . . . . . . . . . . . . . . . . . . . . . . . . . . . . . . . . . . . . . . A-1
B. Notes Relating to Education Finance Data . . . . . . . . . . . . . . . . . . . . . . . . . . . . . . . . B-1
C. Two-Letter State Abbreviations . . . . . . . . . . . . . . . . . . . . . . . . . . . . . . . . . . . . . . . . C-1
D. F-33 Survey Form . . . . . . . . . . . . . . . . . . . . . . . . . . . . . . . . . . . . . . . . . . . . . . . . . . D-1
Public Education Finances: 2012 v U.S. Census Bureau
INTRODUCTION
The U.S. Census Bureau conducts the Census of Governments and the Annual Surveys of State and Local Government Finances as authorized by law under Title 13, U.S. Code, Sections 161 and 182. The Census of Governments has been conducted every 5 years since 1957, while the annual survey has been conducted annually since 1977 in years when the Census of Governments is not conducted. The 2012 Census of Governments, similar to previous annual surveys and censuses of governments, covers the entire range of government finance activities—revenue, expenditure, debt, and assets (cash and security holdings).
This report contains financial statistics relating to public elementary-secondary prekindergarten through twelfth grade education. It includes national and state financial aggregates and displays data for the 100 largest school systems by enrollment in the United States.
ORGANIZATION OF THIS REPORT
This introductory text describes the scope, general concepts, survey methodology, and limitations of the data. It also identifies other Census Bureau products that contain public education data.
The tabular section contains 20 tables. Summaries, as well as state-level detail, are presented in Tables 1 through 10. Table 1 contains data for all major financial categories for public school systems. Revenue summaries and supporting detail are shown in Tables 2 through 5, expenditure in Tables 6 through 9, and indebtedness in Table 10.
State rankings based on revenue and expenditure per pupil appear in Table 11. State rankings based on the relation of revenue and expenditure to state personal income (as reported in the Bureau of Economic Analysis’ 2011 Survey of Current Business) are shown in Table 12. National summaries and enrollment size-group data for elementary-secondary education systems appear in Tables 13 and 14.
Finance data for the 100 largest school systems by enrollment in the United States are displayed in Tables 15 through 18. Data are presented in thousands of dollars in Tables 15 and 16 for revenue and expenditure items. Table 17 displays percentage distributions of federal, state, and local revenue for these same school systems. Per pupil expenditure data appear in Table 18. Supplementary data on state-level populations, enrollments, and personal income are shown in Table 19. Per pupil current spending amounts and percentage change for fiscal years 2007–2012 are shown in Table 20.
SCOPE
This 2012 report presents data on the financial activity of public elementary and secondary school systems. Related data on public school system employment are available in the Census Bureau’s Annual Survey of Public Employment and Payroll—School Systems. Information for higher and other education systems can be found in separate annual reports and Census of Governments reports that focus on the finances of states, counties, cities and towns, and government finances in general. The universe consists of 15,171 public school systems (as counted for the 2011–2012 survey cycle in a May 2013 listing of school systems).
GENERAL CONCEPTS
Refer to Appendix A, Definitions of Selected Terms, for descriptions of the items appearing in this report and on the data collection instrument.
Public School Systems
The term “public school systems,” as used for this report, includes two types of government entities with responsibility for providing education services: (1) school districts that are administratively and fiscally independent of any other government and are counted as separate governments; and (2) public school systems that lack sufficient autonomy to be counted as separate governments and are classified as a dependent agency of some other government—a county, municipal, township, or state government.
Most public school systems included in this report operate to provide regular, special, and/or vocational programs for children in prekindergarten through twelfth grade. Some systems, known as “nonoperating” districts, only exist to collect tax revenue, which they then transfer to other school systems that actually provide the education services. This report also includes “educational service agencies.” These agencies typically provide regional special education services, vocational education programs, or financial services for member districts. They are classified as joint educational service agencies of the participating districts and are not counted as separate governments.
Charter Schools
In recent years, many states have passed legislation authorizing the formation of “charter” schools. While each state’s charter school provisions are unique, there are some common characteristics. In general, a “charter” constitutes a contract between a governmental body (the
vi Public Education Finances: 2012 U.S. Census Bureau
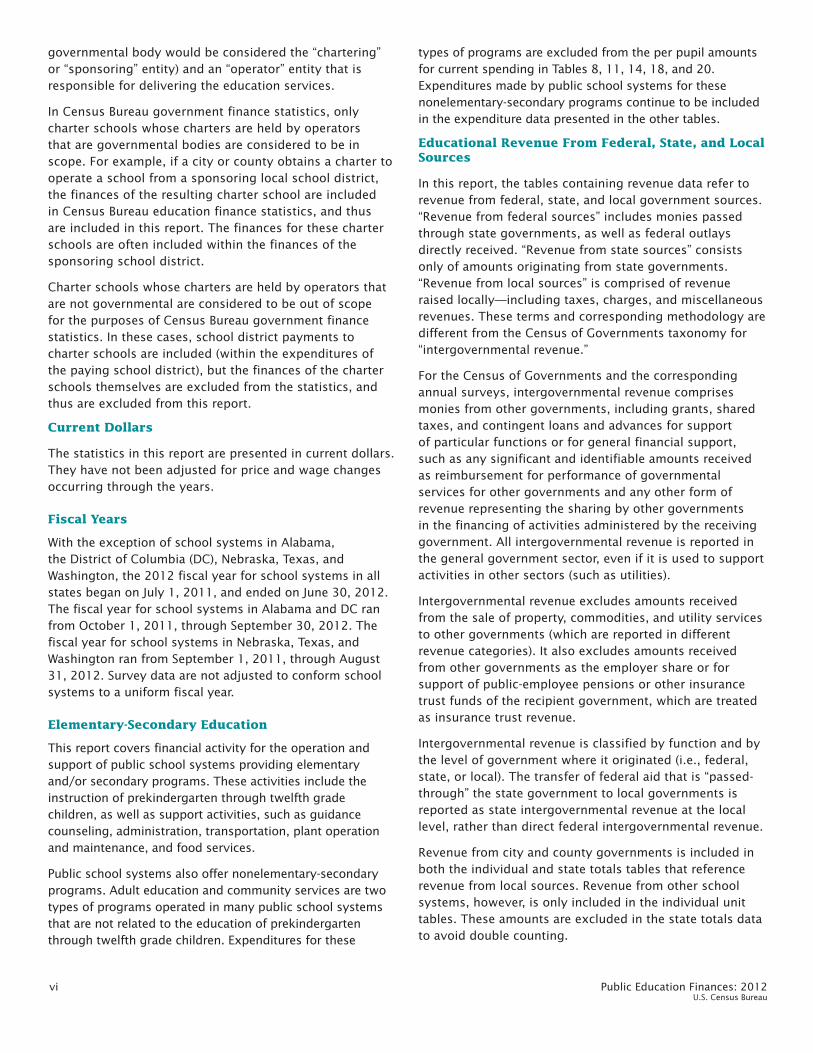
governmental body would be considered the “chartering” or “sponsoring” entity) and an “operator” entity that is responsible for delivering the education services.
In Census Bureau government finance statistics, only charter schools whose charters are held by operators that are governmental bodies are considered to be in scope. For example, if a city or county obtains a charter to operate a school from a sponsoring local school district, the finances of the resulting charter school are included in Census Bureau education finance statistics, and thus are included in this report. The finances for these charter schools are often included within the finances of the sponsoring school district.
Charter schools whose charters are held by operators that are not governmental are considered to be out of scope for the purposes of Census Bureau government finance statistics. In these cases, school district payments to charter schools are included (within the expenditures of the paying school district), but the finances of the charter schools themselves are excluded from the statistics, and thus are excluded from this report.
Current Dollars
The statistics in this report are presented in current dollars. They have not been adjusted for price and wage changes occurring through the years.
Fiscal Years
With the exception of school systems in Alabama, the District of Columbia (DC), Nebraska, Texas, and Washington, the 2012 fiscal year for school systems in all states began on July 1, 2011, and ended on June 30, 2012. The fiscal year for school systems in Alabama and DC ran from October 1, 2011, through September 30, 2012. The fiscal year for school systems in Nebraska, Texas, and Washington ran from September 1, 2011, through August 31, 2012. Survey data are not adjusted to conform school systems to a uniform fiscal year.
Elementary-Secondary Education
This report covers financial activity for the operation and support of public school systems providing elementary and/or secondary programs. These activities include the instruction of prekindergarten through twelfth grade children, as well as support activities, such as guidance counseling, administration, transportation, plant operation and maintenance, and food services.
Public school systems also offer nonelementary-secondary programs. Adult education and community services are two types of programs operated in many public school systems that are not related to the education of prekindergarten through twelfth grade children. Expenditures for these
types of programs are excluded from the per pupil amounts for current spending in Tables 8, 11, 14, 18, and 20. Expenditures made by public school systems for these nonelementary-secondary programs continue to be included in the expenditure data presented in the other tables.
Educational Revenue From Federal, State, and Local Sources
In this report, the tables containing revenue data refer to revenue from federal, state, and local government sources. “Revenue from federal sources” includes monies passed through state governments, as well as federal outlays directly received. “Revenue from state sources” consists only of amounts originating from state governments. “Revenue from local sources” is comprised of revenue raised locally—including taxes, charges, and miscellaneous revenues. These terms and corresponding methodology are different from the Census of Governments taxonomy for “intergovernmental revenue.”
For the Census of Governments and the corresponding annual surveys, intergovernmental revenue comprises monies from other governments, including grants, shared taxes, and contingent loans and advances for support of particular functions or for general financial support, such as any significant and identifiable amounts received as reimbursement for performance of governmental services for other governments and any other form of revenue representing the sharing by other governments in the financing of activities administered by the receiving government. All intergovernmental revenue is reported in the general government sector, even if it is used to support activities in other sectors (such as utilities).
Intergovernmental revenue excludes amounts received from the sale of property, commodities, and utility services to other governments (which are reported in different revenue categories). It also excludes amounts received from other governments as the employer share or for support of public-employee pensions or other insurance trust funds of the recipient government, which are treated as insurance trust revenue.
Intergovernmental revenue is classified by function and by the level of government where it originated (i.e., federal, state, or local). The transfer of federal aid that is “passed-through” the state government to local governments is reported as state intergovernmental revenue at the local level, rather than direct federal intergovernmental revenue.
Revenue from city and county governments is included in both the individual and state totals tables that reference revenue from local sources. Revenue from other school systems, however, is only included in the individual unit tables. These amounts are excluded in the state totals data to avoid double counting.
Public Education Finances: 2012 vii U.S. Census Bureau
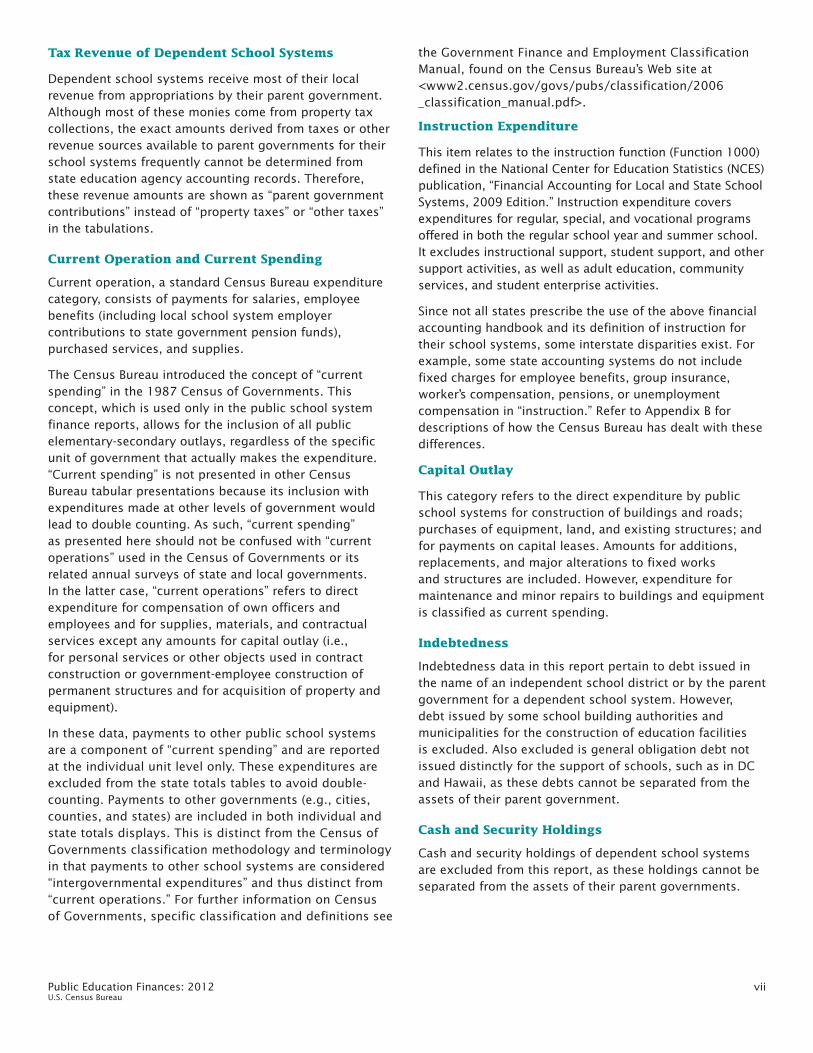
Tax Revenue of Dependent School Systems
Dependent school systems receive most of their local revenue from appropriations by their parent government. Although most of these monies come from property tax collections, the exact amounts derived from taxes or other revenue sources available to parent governments for their school systems frequently cannot be determined from state education agency accounting records. Therefore, these revenue amounts are shown as “parent government contributions” instead of “property taxes” or “other taxes” in the tabulations.
Current Operation and Current Spending
Current operation, a standard Census Bureau expenditure category, consists of payments for salaries, employee benefits (including local school system employer contributions to state government pension funds), purchased services, and supplies.
The Census Bureau introduced the concept of “current spending” in the 1987 Census of Governments. This concept, which is used only in the public school system finance reports, allows for the inclusion of all public elementary-secondary outlays, regardless of the specific unit of government that actually makes the expenditure. “Current spending” is not presented in other Census Bureau tabular presentations because its inclusion with expenditures made at other levels of government would lead to double counting. As such, “current spending” as presented here should not be confused with “current operations” used in the Census of Governments or its related annual surveys of state and local governments. In the latter case, “current operations” refers to direct expenditure for compensation of own officers and employees and for supplies, materials, and contractual services except any amounts for capital outlay (i.e., for personal services or other objects used in contract construction or government-employee construction of permanent structures and for acquisition of property and equipment).
In these data, payments to other public school systems are a component of “current spending” and are reported at the individual unit level only. These expenditures are excluded from the state totals tables to avoid double-counting. Payments to other governments (e.g., cities, counties, and states) are included in both individual and state totals displays. This is distinct from the Census of Governments classification methodology and terminology in that payments to other school systems are considered “intergovernmental expenditures” and thus distinct from “current operations.” For further information on Census of Governments, specific classification and definitions see
the Government Finance and Employment Classification Manual, found on the Census Bureau’s Web site at <www2.census.gov/govs/pubs/classification/2006 _classification_manual.pdf>.
Instruction Expenditure
This item relates to the instruction function (Function 1000) defined in the National Center for Education Statistics (NCES) publication, “Financial Accounting for Local and State School Systems, 2009 Edition.” Instruction expenditure covers expenditures for regular, special, and vocational programs offered in both the regular school year and summer school. It excludes instructional support, student support, and other support activities, as well as adult education, community services, and student enterprise activities.
Since not all states prescribe the use of the above financial accounting handbook and its definition of instruction for their school systems, some interstate disparities exist. For example, some state accounting systems do not include fixed charges for employee benefits, group insurance, worker’s compensation, pensions, or unemployment compensation in “instruction.” Refer to Appendix B for descriptions of how the Census Bureau has dealt with these differences.
Capital Outlay
This category refers to the direct expenditure by public school systems for construction of buildings and roads; purchases of equipment, land, and existing structures; and for payments on capital leases. Amounts for additions, replacements, and major alterations to fixed works and structures are included. However, expenditure for maintenance and minor repairs to buildings and equipment is classified as current spending.
Indebtedness
Indebtedness data in this report pertain to debt issued in the name of an independent school district or by the parent government for a dependent school system. However, debt issued by some school building authorities and municipalities for the construction of education facilities is excluded. Also excluded is general obligation debt not issued distinctly for the support of schools, such as in DC and Hawaii, as these debts cannot be separated from the assets of their parent government.
Cash and Security Holdings
Cash and security holdings of dependent school systems are excluded from this report, as these holdings cannot be separated from the assets of their parent governments.

viii Public Education Finances: 2012 U.S. Census Bureau
American Recovery and Reinvestment Act of 2009 (ARRA)
ARRA funds are included in revenue from federal sources, current spending, and capital outlay expenditures in this report. ARRA funds are not shown separately as exhibit items in this report and therefore cannot be subtracted from the revenue and expenditure totals.
Data Collection Methodology
The Census Bureau has made arrangements with state government departments of education to use data from existing finance information collection systems where the data are compatible with this survey’s categories. Every state department of education obtains information annually on a wide variety of financial data from elementary-secondary school systems by requiring reports or conducting surveys. The Census Bureau is able to gain access to this information through cooperative agreements with each state as summarized below:
• Data compiled or reformatted by Census Bureau staff from state education agency electronic data files (22 states).
• Data reformatted by state education agency staff into survey categories before electronically transmitting data to the Census Bureau (28 states and DC).
A single office or database in the state departments of education did not always have all of the information needed for this survey. In these instances, other sources—most often different state offices—supplied information to supplement the basic data. The most common types of data needing supplementation were school lunch finances, indebtedness, cash and security holdings, and capital fund transactions.
Enrollment, Population, and Personal Income Data
Unless otherwise noted in Appendix B, the enrollments used to calculate the per pupil amounts in Tables 8, 11, 14, 18, and 20 represent fall 2011 memberships collected by the NCES in its nonfiscal Common Core of Data (CCD) Local Education Agency (School District) Universe Survey: School Year 2011–12, Provisional File 1a. Enrollments for state educational facilities, federal school systems, and charter schools whose charters are held by a nongovernmental entity have been excluded. Enrollments from the CCD agency universe file were subject to adjustment by Census Bureau survey staff if the enrollments were inconsistent with the finances reported.
The population data contained in Table 19 were obtained from the Census Bureau’s Population Estimates Program. The personal income data in Table 19, which were used to
calculate the data for Table 12, were taken from the Bureau of Economic Analysis’ 2011 Survey of Current Business.
Notable Survey Cycle Dates
January 2013 Initial mailout
February 2013 Follow-up mailout
March 2013 Begin data processing
April 2014 Data editing complete
May 2014 Data released to Census Bureau Internet
SURVEY METHODOLOGY
The data collected in this survey encompass all public elementary and secondary school systems in the United States and are centrally collected from each state. The survey cycle begins in January when states begin submitting data for the previous fiscal year. The data collection process is typically completed by April of the following year. The information included is intended to provide a complete picture of a government’s financial activity. All revenue (by source), expenditure (by function and object), indebtedness, and cash and security holdings are requested. The inclusion of all financial transactions, except for interfund transfers and some fiduciary activities, allows for effective review and editing. It enables respondents and Census Bureau staff to take a global view of government finance and to perform basic cash flow logic checks.
The Census Bureau attempts to identify all central sources for public elementary-secondary finance data. Most of these sources exist at the state government level. Many state agencies, especially state education agencies, collect financial data from the local agencies within their domains.
The collection arrangements have a number of distinct advantages. First, because the Census Bureau is able to use data from state government data systems, the respondent burden on local school system administrators is lessened. Second, the close relationship between local school systems and state departments of education minimizes nonresponse.
The extensive use of central collection of elementary-secondary finance data requires the maintenance of state-specific crosswalks that define the state data items which comprise each of the items reported by the Census Bureau. In an effort to eliminate keying and response errors, several edit checks are made. These checks identify cash and debt flow problems, significant current year/prior year differences, illogical salary and current spending relationships, out-of-scope per pupil expenditure, and other peculiarities. Census Bureau staff resolve edit checks and other problems by rechecking data sources for entry errors, reviewing state and other reports that contain the same type of information, and making follow-up calls and e-mails to state and local officials.
Public Education Finances: 2012 ix U.S. Census Bureau
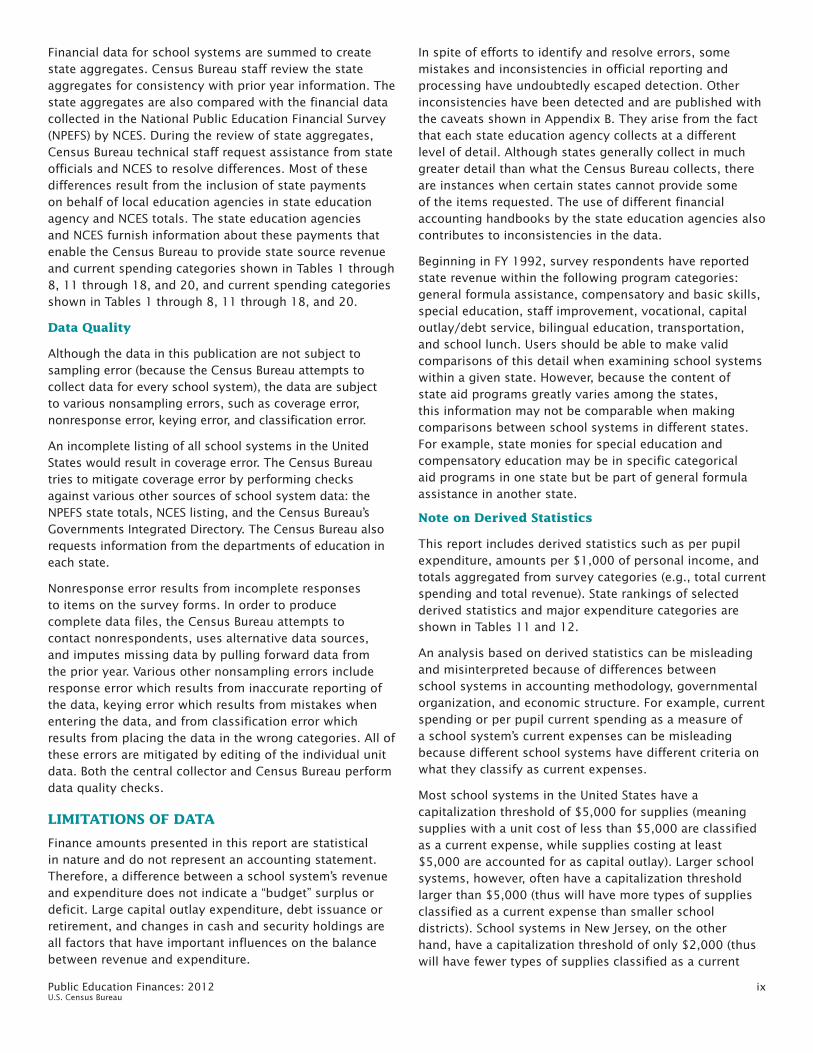
Financial data for school systems are summed to create state aggregates. Census Bureau staff review the state aggregates for consistency with prior year information. The state aggregates are also compared with the financial data collected in the National Public Education Financial Survey (NPEFS) by NCES. During the review of state aggregates, Census Bureau technical staff request assistance from state officials and NCES to resolve differences. Most of these differences result from the inclusion of state payments on behalf of local education agencies in state education agency and NCES totals. The state education agencies and NCES furnish information about these payments that enable the Census Bureau to provide state source revenue and current spending categories shown in Tables 1 through 8, 11 through 18, and 20, and current spending categories shown in Tables 1 through 8, 11 through 18, and 20.
Data Quality
Although the data in this publication are not subject to sampling error (because the Census Bureau attempts to collect data for every school system), the data are subject to various nonsampling errors, such as coverage error, nonresponse error, keying error, and classification error.
An incomplete listing of all school systems in the United States would result in coverage error. The Census Bureau tries to mitigate coverage error by performing checks against various other sources of school system data: the NPEFS state totals, NCES listing, and the Census Bureau’s Governments Integrated Directory. The Census Bureau also requests information from the departments of education in each state.
Nonresponse error results from incomplete responses to items on the survey forms. In order to produce complete data files, the Census Bureau attempts to contact nonrespondents, uses alternative data sources, and imputes missing data by pulling forward data from the prior year. Various other nonsampling errors include response error which results from inaccurate reporting of the data, keying error which results from mistakes when entering the data, and from classification error which results from placing the data in the wrong categories. All of these errors are mitigated by editing of the individual unit data. Both the central collector and Census Bureau perform data quality checks.
LIMITATIONS OF DATA
Finance amounts presented in this report are statistical in nature and do not represent an accounting statement. Therefore, a difference between a school system’s revenue and expenditure does not indicate a “budget” surplus or deficit. Large capital outlay expenditure, debt issuance or retirement, and changes in cash and security holdings are all factors that have important influences on the balance between revenue and expenditure.
In spite of efforts to identify and resolve errors, some mistakes and inconsistencies in official reporting and processing have undoubtedly escaped detection. Other inconsistencies have been detected and are published with the caveats shown in Appendix B. They arise from the fact that each state education agency collects at a different level of detail. Although states generally collect in much greater detail than what the Census Bureau collects, there are instances when certain states cannot provide some of the items requested. The use of different financial accounting handbooks by the state education agencies also contributes to inconsistencies in the data.
Beginning in FY 1992, survey respondents have reported state revenue within the following program categories: general formula assistance, compensatory and basic skills, special education, staff improvement, vocational, capital outlay/debt service, bilingual education, transportation, and school lunch. Users should be able to make valid comparisons of this detail when examining school systems within a given state. However, because the content of state aid programs greatly varies among the states, this information may not be comparable when making comparisons between school systems in different states. For example, state monies for special education and compensatory education may be in specific categorical aid programs in one state but be part of general formula assistance in another state.
Note on Derived Statistics
This report includes derived statistics such as per pupil expenditure, amounts per $1,000 of personal income, and totals aggregated from survey categories (e.g., total current spending and total revenue). State rankings of selected derived statistics and major expenditure categories are shown in Tables 11 and 12.
An analysis based on derived statistics can be misleading and misinterpreted because of differences between school systems in accounting methodology, governmental organization, and economic structure. For example, current spending or per pupil current spending as a measure of a school system’s current expenses can be misleading because different school systems have different criteria on what they classify as current expenses.
Most school systems in the United States have a capitalization threshold of $5,000 for supplies (meaning supplies with a unit cost of less than $5,000 are classified as a current expense, while supplies costing at least $5,000 are accounted for as capital outlay). Larger school systems, however, often have a capitalization threshold larger than $5,000 (thus will have more types of supplies classified as a current expense than smaller school districts). School systems in New Jersey, on the other hand, have a capitalization threshold of only $2,000 (thus will have fewer types of supplies classified as a current

x Public Education Finances: 2012 U.S. Census Bureau
expense than most school districts). Any analysis involving current spending or per pupil current spending should note that school system and state disparities exist based on what is classified as a current expense.
Revenue comparisons can also be misleading since programs funded by a local government in one state may be funded by the state or federal government in another. For example, transportation programs are primarily funded by the state government in some states, but are primarily funded by local governments in others. State differences in school system funding between various levels of government can often be attributed to the fiscal and structural relationships between local, state, and federal government in the state; thus, states that provide less transportation funding to school systems than other states are not necessarily less fiscally committed to school system transportation. A strict ranking or per pupil analysis that does not take into account varying fiscal and structural relationships between the local, state, and federal government in each state can lead to an invalid analysis and incorrect conclusions. Finance amounts in this report also do not take into account demographic, socioeconomic, or geographic differences between state and local governments.
ACKNOWLEDGMENTS
The generous cooperation of state education agency personnel is gratefully acknowledged. The time and effort extended by these individuals makes it possible to produce this report while imposing a minimum burden on local school officials. The Census Bureau also appreciates the dedication of local school officials in providing accurate fiscal data to their state education agencies.
MEANING OF ABBREVIATIONS AND SYMBOLS
The abbreviations and symbols in the tables have the following meanings:
N Not available. X Not applicable. Z Represents zero or rounds to zero. LEA Local Education Agency.

Public Education Finances: 2012 xi U.S. Census Bureau
Federal revenue State revenue Local revenue
0 10 20 30 40 50 60 70
South DakotaNorth Dakota
District of ColumbiaVermontMontanaWyomingDelaware
IdahoRhode Island
AlaskaHawaiiMaine
New HampshireNew Mexico
NebraskaWest Virginia
NevadaUtah
MississippiArkansas
KansasOklahoma
IowaOregon
AlabamaKentucky
ArizonaSouth Carolina
LouisianaColorado
TennesseeConnecticut
MissouriMinnesotaWisconsin
WashingtonIndiana
North CarolinaMaryland
VirginiaMassachusetts
GeorgiaMichigan
OhioFlorida
PennsylvaniaNew Jersey
IllinoisTexas
New YorkCalifornia
Source: 2012 Census of Governments: Finance—Survey of School System Finances. Data are not subject to sampling error, but for information on nonsampling error and definitions, see introductory text. Data users who create their own estimates from these tables should cite the U.S. Census Bureau as the source of the original data only.
Billions of dollars
Scal
e en
larg
ed t
o s
how
det
ail
Figure 1.Public Elementary-Secondary School System Revenue by Source and State: Fiscal Year 2012
Billions of dollars
0 1 2 3 4 5 6
South DakotaNorth Dakota
District of ColumbiaVermontMontanaWyomingDelaware
IdahoRhode Island
AlaskaHawaiiMaine
New HampshireNew Mexico
NebraskaWest Virginia
NevadaUtah
MississippiArkansas
United States(Billions of dollars. Detail may not add to total due to rounding)
Total Federal State Local
594.5 59.5 270.4 264.6
xii Public Education Finances: 2012 U.S. Census Bureau
Current spending Capital outlay Other
0 10 20 30 40 50 60 70
District of ColumbiaSouth DakotaNorth Dakota
VermontMontanaWyomingDelaware
IdahoRhode Island
HawaiiAlaskaMaine
New HampshireWest VirginiaNew Mexico
NebraskaNevada
UtahMississippiOklahoma
KansasArkansas
IowaOregon
AlabamaKentucky
South CarolinaArizona
ColoradoLouisiana
TennesseeConnecticut
MissouriWisconsinMinnesota
IndianaWashington
MarylandNorth Carolina
VirginiaMassachusetts
GeorgiaMichigan
OhioPennsylvania
FloridaNew Jersey
IllinoisTexas
New YorkCalifornia
Source: 2012 Census of Governments: Finance—Survey of School System Finances. Data are not subject to sampling error, but for information on nonsampling error and definitions, see introductory text. Data users who create their own estimates from these tables should cite the U.S. Census Bureau as the source of the original data only.
Billions of dollars
Figure 2.Public Elementary-Secondary School System Expenditure by Type and State: Fiscal Year 2012
Billions of dollars
0 1 2 3 4 5 6District of Columbia
South DakotaNorth Dakota
VermontMontanaWyomingDelaware
IdahoRhode Island
HawaiiAlaskaMaine
New HampshireWest VirginiaNew Mexico
NebraskaNevada
UtahMississippiOklahoma
United States(Billions of dollars. Detail may not add to total due to rounding)
Total Current spending Capital outlay Other
593.8 524.0 50.2 19.7
Scal
e en
larg
ed t
o s
how
det
ail

Public Education Finances: 2012 xiii U.S. Census Bureau
Instruction Support services Other
0 10 20 30 40 50 60 70
District of ColumbiaSouth DakotaNorth Dakota
WyomingVermontMontanaDelaware
IdahoRhode Island
HawaiiAlaskaMaine
New HampshireNew Mexico
West VirginiaNebraska
NevadaUtah
MississippiKansas
ArkansasIowa
OklahomaOregon
KentuckyAlabama
South CarolinaArizona
ColoradoLouisiana
TennesseeMissouri
ConnecticutMinnesotaWisconsin
IndianaWashington
MarylandNorth Carolina
VirginiaMassachusetts
GeorgiaMichigan
OhioPennsylvania
FloridaNew Jersey
IllinoisTexas
New YorkCalifornia
Source: 2012 Census of Governments: Finance—Survey of School System Finances. Data are not subject to sampling error, but for information on nonsampling error and definitions, see introductory text. Data users who create their own estimates from these tables should cite the U.S. Census Bureau as the source of the original data only.
Billions of dollars
Figure 3.Public Elementary-Secondary School System Current Spending by Major Function and State: Fiscal Year 2012
Billions of dollars
0 1 2 3 4 5District of Columbia
South DakotaNorth Dakota
WyomingVermontMontanaDelaware
IdahoRhode Island
HawaiiAlaskaMaine
New HampshireNew Mexico
West VirginiaNebraska
NevadaUtah
MississippiKansas
United States(Billions of dollars. Detail may not add to total due to rounding)
Total Instruction Support services Other
524.0 316.6 179.8 27.5
Scal
e en
larg
ed t
o s
how
det
ail

xiv
Public Ed
ucatio
n Fin
ances: 2
01
U
.S. Cen
sus Bu
rea 2 u
MT
AK
NM
OR MN
KS
SD
ND
MO
WA
FL
IL IN
WI NY
PA
MI
OH
IA
ME
MA
CT
AZ
HI
NV
TX
COCA
WY
UT
ID
NE
OK
GA
AR
AL
NC
MS
LA
TN
KY
VA
SC
WV
RI
DE
MD
DC
NJ
Figure 4.Public Elementary-Secondary School System Per Pupil Current Spending by State: Fiscal Year 2012
VT NH
Less than $8,000
$8,000 to $9,999
$10,000 to $11,999
$12,000 to $13,999
$14,000 to $15,999
$16,000 or more
Source: 2012 Census of Governments: Finance—Survey of School System Finances. Data are not subject to sampling error, but for information on nonsamplingerror and definitions, see introductory text. Data users who create their own estimates from these tables should cite the U.S. Census Bureau as the source of the original data only. Enrollments used to calculate per pupil amounts represent fall 2011 memberships collected by National Center for Education Statistics on the CCD agency universe file—"Local Education Agency (School District) Universe Survey: School Year 2011-12, Provisional Version 1a." Enrollments for state educational facilities, federal school systems, and charter schools whose charters are held by a nongovernmental entity have been excluded. Enrollments from the CCD agency universe file were subject to adjustment if the enrollments were inconsistent with the finances reported. Survey of School System Finances statistics include the finances of charter schools whose charters are held directly by a government or a government agency. Charter schools whose charters are held by nongovernmental entities are deemed to be out of scope for the Survey of School System Finances.

Public Ed
ucatio
n Fin
ances: 2
01
2
xv
U.S. C
ensu
s Bureau
MT
AK
NM
OR MN
KS
SD
ND
MO
WA
FL
IL IN
WI NY
PA
MI
OH
IA
ME
MA
CT
AZ
HI
NV
TX
COCA
WY
UT
ID
NE
OK
GA
AR
AL
NC
MS
LA
TN
KYVA
SC
WV
RI
DE
MD
DC
NJ
Figure 5.Public Elementary-Secondary School System Current Spending Per $1,000 of Personal Income by State: Fiscal Year 2012
VT NH
Less than $35.00
$35.00 to $39.99
$40.00 to $44.99
$45.00 to $49.99
$50.00 to $54.99
$55.00 or more
Source: 2012 Census of Governments: Finance—Survey of School System Finances. Data are not subject to sampling error, but for information on nonsampling error and definitions, see introductory text. Data users who create their own estimates from these tables should cite the U.S. Census Bureau as the source of the original data only. Data used to calculate rankings is from the U.S. Department of Commerce, Bureau of Economic Analysis; Internet release date (for revised state personal income estimates): March 25, 2014 (2011 data). Survey of School System Finances statistics include the finances of charter schools whose charters are held directly by a government or a government agency. Charter schools whose charters are held by nongovernmental entities are deemed to be out of scope for the Survey of School System Finances.
xvi Public Education Finances: 2012 U.S. Census Bureau
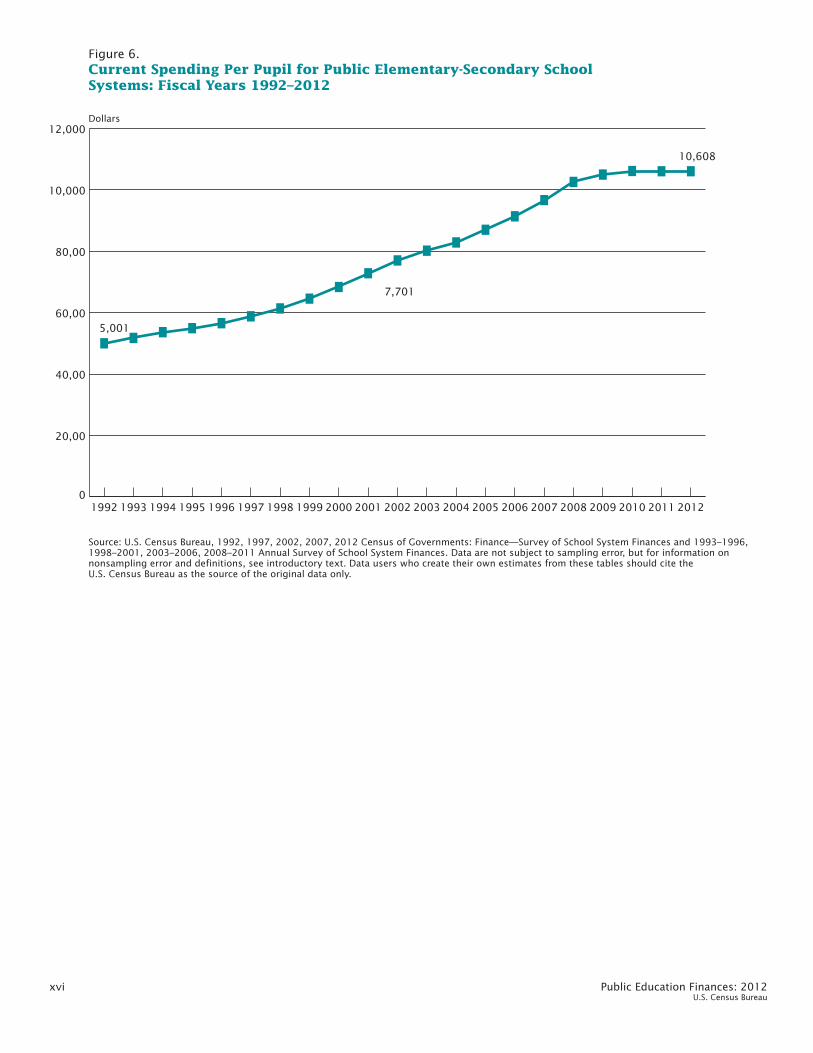
Figure 6.Current Spending Per Pupil for Public Elementary-Secondary School Systems: Fiscal Years 1992–2012
Source: U.S. Census Bureau, 1992, 1997, 2002, 2007, 2012 Census of Governments: Finance—Survey of School System Finances and 1993–1996,1998–2001, 2003–2006, 2008–2011 Annual Survey of School System Finances. Data are not subject to sampling error, but for information on nonsampling error and definitions, see introductory text. Data users who create their own estimates from these tables should cite the U.S. Census Bureau as the source of the original data only.
Dollars
5,001
7,701
10,608
0
20,00
40,00
60,00
80,00
10,000
12,000
201220112010200920082007200620052004200320022001200019991998199719961995199419931992
Public Education Finances: 2012 1 U.S. Census Bureau
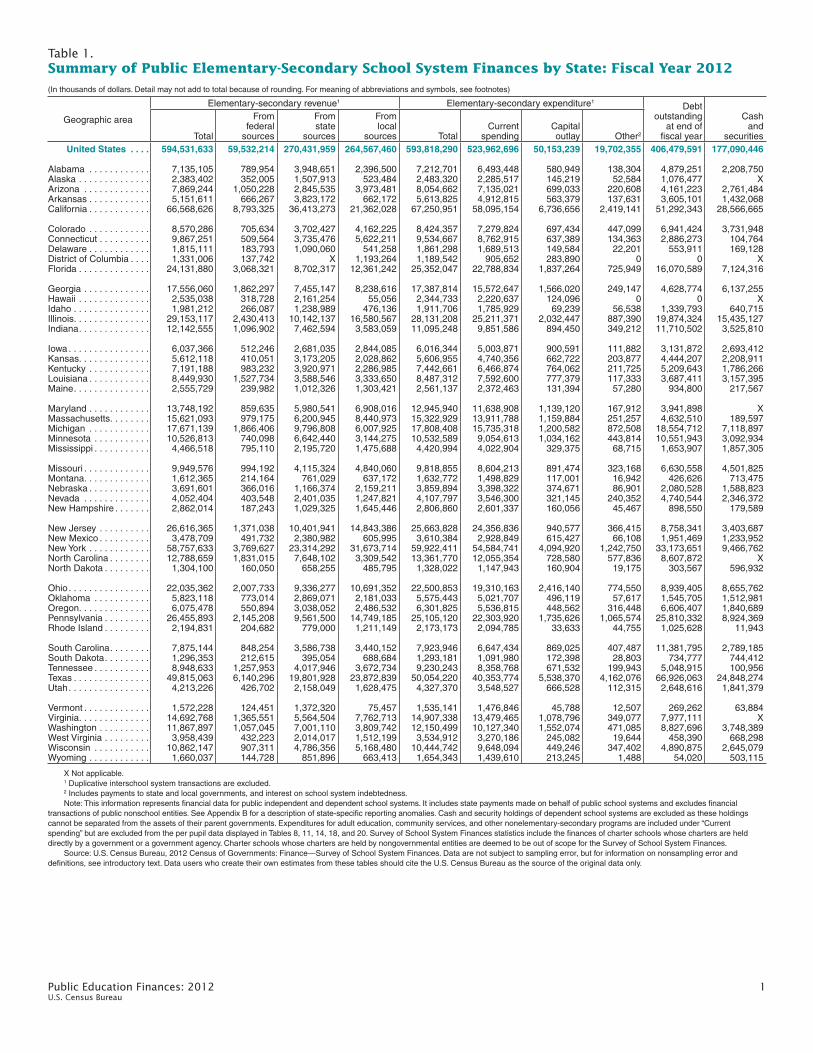
Table 1.Summary of Public Elementary-Secondary School System Finances by State: Fiscal Year 2012(In thousands of dollars. Detail may not add to total because of rounding. For meaning of abbreviations and symbols, see footnotes)
Geographic area
Elementary-secondary revenue1 Elementary-secondary expenditure1Debt
outstandingat end of
fiscal year
Cash and
securitiesTotal
From federal
sources
From state
sources
From local
sources TotalCurrent
spendingCapitaloutlay Other2
United States . . . . 594,531,633 59,532,214 270,431,959 264,567,460 593,818,290 523,962,696 50,153,239 19,702,355 406,479,591 177,090,446
Alabama . . . . . . . . . . . . 7,135,105 789,954 3,948,651 2,396,500 7,212,701 6,493,448 580,949 138,304 4,879,251 2,208,750Alaska . . . . . . . . . . . . . . 2,383,402 352,005 1,507,913 523,484 2,483,320 2,285,517 145,219 52,584 1,076,477 XArizona . . . . . . . . . . . . . 7,869,244 1,050,228 2,845,535 3,973,481 8,054,662 7,135,021 699,033 220,608 4,161,223 2,761,484Arkansas . . . . . . . . . . . . 5,151,611 666,267 3,823,172 662,172 5,613,825 4,912,815 563,379 137,631 3,605,101 1,432,068California . . . . . . . . . . . . 66,568,626 8,793,325 36,413,273 21,362,028 67,250,951 58,095,154 6,736,656 2,419,141 51,292,343 28,566,665
Colorado . . . . . . . . . . . . 8,570,286 705,634 3,702,427 4,162,225 8,424,357 7,279,824 697,434 447,099 6,941,424 3,731,948Connecticut . . . . . . . . . . 9,867,251 509,564 3,735,476 5,622,211 9,534,667 8,762,915 637,389 134,363 2,886,273 104,764Delaware . . . . . . . . . . . . 1,815,111 183,793 1,090,060 541,258 1,861,298 1,689,513 149,584 22,201 553,911 169,128District of Columbia . . . . 1,331,006 137,742 X 1,193,264 1,189,542 905,652 283,890 0 0 XFlorida . . . . . . . . . . . . . . 24,131,880 3,068,321 8,702,317 12,361,242 25,352,047 22,788,834 1,837,264 725,949 16,070,589 7,124,316
Georgia . . . . . . . . . . . . . 17,556,060 1,862,297 7,455,147 8,238,616 17,387,814 15,572,647 1,566,020 249,147 4,628,774 6,137,255Hawaii . . . . . . . . . . . . . . 2,535,038 318,728 2,161,254 55,056 2,344,733 2,220,637 124,096 0 0 XIdaho . . . . . . . . . . . . . . . 1,981,212 266,087 1,238,989 476,136 1,911,706 1,785,929 69,239 56,538 1,339,793 640,715Illinois . . . . . . . . . . . . . . . 29,153,117 2,430,413 10,142,137 16,580,567 28,131,208 25,211,371 2,032,447 887,390 19,874,324 15,435,127Indiana . . . . . . . . . . . . . . 12,142,555 1,096,902 7,462,594 3,583,059 11,095,248 9,851,586 894,450 349,212 11,710,502 3,525,810
Iowa . . . . . . . . . . . . . . . . 6,037,366 512,246 2,681,035 2,844,085 6,016,344 5,003,871 900,591 111,882 3,131,872 2,693,412Kansas . . . . . . . . . . . . . . 5,612,118 410,051 3,173,205 2,028,862 5,606,955 4,740,356 662,722 203,877 4,444,207 2,208,911Kentucky . . . . . . . . . . . . 7,191,188 983,232 3,920,971 2,286,985 7,442,661 6,466,874 764,062 211,725 5,209,643 1,786,266Louisiana . . . . . . . . . . . . 8,449,930 1,527,734 3,588,546 3,333,650 8,487,312 7,592,600 777,379 117,333 3,687,411 3,157,395Maine . . . . . . . . . . . . . . . 2,555,729 239,982 1,012,326 1,303,421 2,561,137 2,372,463 131,394 57,280 934,800 217,567
Maryland . . . . . . . . . . . . 13,748,192 859,635 5,980,541 6,908,016 12,945,940 11,638,908 1,139,120 167,912 3,941,898 XMassachusetts . . . . . . . . 15,621,093 979,175 6,200,945 8,440,973 15,322,929 13,911,788 1,159,884 251,257 4,632,510 189,597Michigan . . . . . . . . . . . . 17,671,139 1,866,406 9,796,808 6,007,925 17,808,408 15,735,318 1,200,582 872,508 18,554,712 7,118,897Minnesota . . . . . . . . . . . 10,526,813 740,098 6,642,440 3,144,275 10,532,589 9,054,613 1,034,162 443,814 10,551,943 3,092,934Mississippi . . . . . . . . . . . 4,466,518 795,110 2,195,720 1,475,688 4,420,994 4,022,904 329,375 68,715 1,653,907 1,857,305
Missouri . . . . . . . . . . . . . 9,949,576 994,192 4,115,324 4,840,060 9,818,855 8,604,213 891,474 323,168 6,630,558 4,501,825Montana . . . . . . . . . . . . . 1,612,365 214,164 761,029 637,172 1,632,772 1,498,829 117,001 16,942 426,626 713,475Nebraska . . . . . . . . . . . . 3,691,601 366,016 1,166,374 2,159,211 3,859,894 3,398,322 374,671 86,901 2,080,528 1,588,823Nevada . . . . . . . . . . . . . 4,052,404 403,548 2,401,035 1,247,821 4,107,797 3,546,300 321,145 240,352 4,740,544 2,346,372New Hampshire . . . . . . . 2,862,014 187,243 1,029,325 1,645,446 2,806,860 2,601,337 160,056 45,467 898,550 179,589
New Jersey . . . . . . . . . . 26,616,365 1,371,038 10,401,941 14,843,386 25,663,828 24,356,836 940,577 366,415 8,758,341 3,403,687New Mexico . . . . . . . . . . 3,478,709 491,732 2,380,982 605,995 3,610,384 2,928,849 615,427 66,108 1,951,469 1,233,952New York . . . . . . . . . . . . 58,757,633 3,769,627 23,314,292 31,673,714 59,922,411 54,584,741 4,094,920 1,242,750 33,173,651 9,466,762North Carolina . . . . . . . . 12,788,659 1,831,015 7,648,102 3,309,542 13,361,770 12,055,354 728,580 577,836 8,607,872 XNorth Dakota . . . . . . . . . 1,304,100 160,050 658,255 485,795 1,328,022 1,147,943 160,904 19,175 303,567 596,932
Ohio . . . . . . . . . . . . . . . . 22,035,362 2,007,733 9,336,277 10,691,352 22,500,853 19,310,163 2,416,140 774,550 8,939,405 8,655,762Oklahoma . . . . . . . . . . . 5,823,118 773,014 2,869,071 2,181,033 5,575,443 5,021,707 496,119 57,617 1,545,705 1,512,981Oregon . . . . . . . . . . . . . . 6,075,478 550,894 3,038,052 2,486,532 6,301,825 5,536,815 448,562 316,448 6,606,407 1,840,689Pennsylvania . . . . . . . . . 26,455,893 2,145,208 9,561,500 14,749,185 25,105,120 22,303,920 1,735,626 1,065,574 25,810,332 8,924,369Rhode Island . . . . . . . . . 2,194,831 204,682 779,000 1,211,149 2,173,173 2,094,785 33,633 44,755 1,025,628 11,943
South Carolina . . . . . . . . 7,875,144 848,254 3,586,738 3,440,152 7,923,946 6,647,434 869,025 407,487 11,381,795 2,789,185South Dakota . . . . . . . . . 1,296,353 212,615 395,054 688,684 1,293,181 1,091,980 172,398 28,803 734,777 744,412Tennessee . . . . . . . . . . . 8,948,633 1,257,953 4,017,946 3,672,734 9,230,243 8,358,768 671,532 199,943 5,048,915 100,956Texas . . . . . . . . . . . . . . . 49,815,063 6,140,296 19,801,928 23,872,839 50,054,220 40,353,774 5,538,370 4,162,076 66,926,063 24,848,274Utah . . . . . . . . . . . . . . . . 4,213,226 426,702 2,158,049 1,628,475 4,327,370 3,548,527 666,528 112,315 2,648,616 1,841,379
Vermont . . . . . . . . . . . . . 1,572,228 124,451 1,372,320 75,457 1,535,141 1,476,846 45,788 12,507 269,262 63,884Virginia . . . . . . . . . . . . . . 14,692,768 1,365,551 5,564,504 7,762,713 14,907,338 13,479,465 1,078,796 349,077 7,977,111 XWashington . . . . . . . . . . 11,867,897 1,057,045 7,001,110 3,809,742 12,150,499 10,127,340 1,552,074 471,085 8,827,696 3,748,389West Virginia . . . . . . . . . 3,958,439 432,223 2,014,017 1,512,199 3,534,912 3,270,186 245,082 19,644 458,390 668,298Wisconsin . . . . . . . . . . . 10,862,147 907,311 4,786,356 5,168,480 10,444,742 9,648,094 449,246 347,402 4,890,875 2,645,079Wyoming . . . . . . . . . . . . 1,660,037 144,728 851,896 663,413 1,654,343 1,439,610 213,245 1,488 54,020 503,115
X Not applicable.1 Duplicative interschool system transactions are excluded.2 Includes payments to state and local governments, and interest on school system indebtedness.Note: This information represents financial data for public independent and dependent school systems. It includes state payments made on behalf of public school systems and excludes financial
transactions of public nonschool entities. See Appendix B for a description of state-specific reporting anomalies. Cash and security holdings of dependent school systems are excluded as these holdings cannot be separated from the assets of their parent governments. Expenditures for adult education, community services, and other nonelementary-secondary programs are included under “Current spending” but are excluded from the per pupil data displayed in Tables 8, 11, 14, 18, and 20. Survey of School System Finances statistics include the finances of charter schools whose charters are held directly by a government or a government agency. Charter schools whose charters are held by nongovernmental entities are deemed to be out of scope for the Survey of School System Finances.
Source: U.S. Census Bureau, 2012 Census of Governments: Finance—Survey of School System Finances. Data are not subject to sampling error, but for information on nonsampling error and definitions, see introductory text. Data users who create their own estimates from these tables should cite the U.S. Census Bureau as the source of the original data only.
2 Public Education Finances: 2012 U.S. Census Bureau
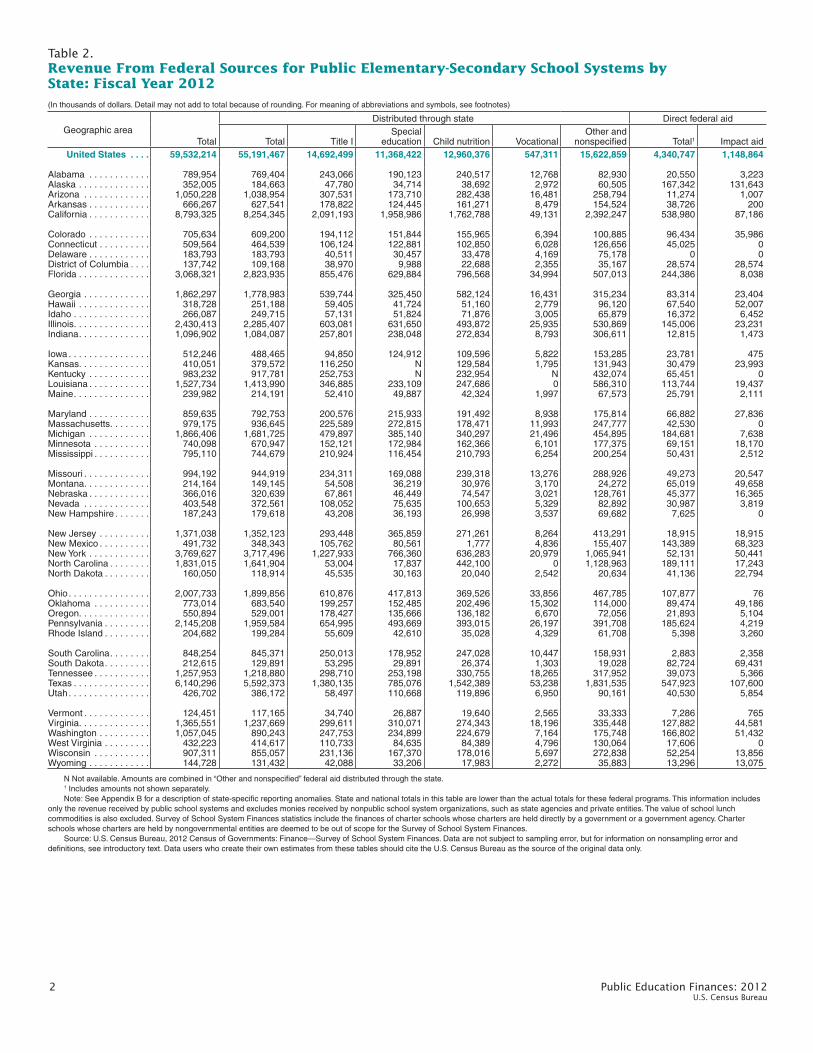
Table 2.Revenue From Federal Sources for Public Elementary-Secondary School Systems by State: Fiscal Year 2012(In thousands of dollars. Detail may not add to total because of rounding. For meaning of abbreviations and symbols, see footnotes)
Geographic areaTotal
Distributed through state Direct federal aid
Total Title ISpecial
education Child nutrition VocationalOther and
nonspecified Total1 Impact aid United States . . . . 59,532,214 55,191,467 14,692,499 11,368,422 12,960,376 547,311 15,622,859 4,340,747 1,148,864
Alabama . . . . . . . . . . . . 789,954 769,404 243,066 190,123 240,517 12,768 82,930 20,550 3,223Alaska . . . . . . . . . . . . . . 352,005 184,663 47,780 34,714 38,692 2,972 60,505 167,342 131,643Arizona . . . . . . . . . . . . . 1,050,228 1,038,954 307,531 173,710 282,438 16,481 258,794 11,274 1,007Arkansas . . . . . . . . . . . . 666,267 627,541 178,822 124,445 161,271 8,479 154,524 38,726 200California . . . . . . . . . . . . 8,793,325 8,254,345 2,091,193 1,958,986 1,762,788 49,131 2,392,247 538,980 87,186
Colorado . . . . . . . . . . . . 705,634 609,200 194,112 151,844 155,965 6,394 100,885 96,434 35,986Connecticut . . . . . . . . . . 509,564 464,539 106,124 122,881 102,850 6,028 126,656 45,025 0Delaware . . . . . . . . . . . . 183,793 183,793 40,511 30,457 33,478 4,169 75,178 0 0District of Columbia . . . . 137,742 109,168 38,970 9,988 22,688 2,355 35,167 28,574 28,574Florida . . . . . . . . . . . . . . 3,068,321 2,823,935 855,476 629,884 796,568 34,994 507,013 244,386 8,038
Georgia . . . . . . . . . . . . . 1,862,297 1,778,983 539,744 325,450 582,124 16,431 315,234 83,314 23,404Hawaii . . . . . . . . . . . . . . 318,728 251,188 59,405 41,724 51,160 2,779 96,120 67,540 52,007Idaho . . . . . . . . . . . . . . . 266,087 249,715 57,131 51,824 71,876 3,005 65,879 16,372 6,452Illinois . . . . . . . . . . . . . . . 2,430,413 2,285,407 603,081 631,650 493,872 25,935 530,869 145,006 23,231Indiana . . . . . . . . . . . . . . 1,096,902 1,084,087 257,801 238,048 272,834 8,793 306,611 12,815 1,473
Iowa . . . . . . . . . . . . . . . . 512,246 488,465 94,850 124,912 109,596 5,822 153,285 23,781 475Kansas . . . . . . . . . . . . . . 410,051 379,572 116,250 N 129,584 1,795 131,943 30,479 23,993Kentucky . . . . . . . . . . . . 983,232 917,781 252,753 N 232,954 N 432,074 65,451 0Louisiana . . . . . . . . . . . . 1,527,734 1,413,990 346,885 233,109 247,686 0 586,310 113,744 19,437Maine . . . . . . . . . . . . . . . 239,982 214,191 52,410 49,887 42,324 1,997 67,573 25,791 2,111
Maryland . . . . . . . . . . . . 859,635 792,753 200,576 215,933 191,492 8,938 175,814 66,882 27,836Massachusetts . . . . . . . . 979,175 936,645 225,589 272,815 178,471 11,993 247,777 42,530 0Michigan . . . . . . . . . . . . 1,866,406 1,681,725 479,897 385,140 340,297 21,496 454,895 184,681 7,638Minnesota . . . . . . . . . . . 740,098 670,947 152,121 172,984 162,366 6,101 177,375 69,151 18,170Mississippi . . . . . . . . . . . 795,110 744,679 210,924 116,454 210,793 6,254 200,254 50,431 2,512
Missouri . . . . . . . . . . . . . 994,192 944,919 234,311 169,088 239,318 13,276 288,926 49,273 20,547Montana . . . . . . . . . . . . . 214,164 149,145 54,508 36,219 30,976 3,170 24,272 65,019 49,658Nebraska . . . . . . . . . . . . 366,016 320,639 67,861 46,449 74,547 3,021 128,761 45,377 16,365Nevada . . . . . . . . . . . . . 403,548 372,561 108,052 75,635 100,653 5,329 82,892 30,987 3,819New Hampshire . . . . . . . 187,243 179,618 43,208 36,193 26,998 3,537 69,682 7,625 0
New Jersey . . . . . . . . . . 1,371,038 1,352,123 293,448 365,859 271,261 8,264 413,291 18,915 18,915New Mexico . . . . . . . . . . 491,732 348,343 105,762 80,561 1,777 4,836 155,407 143,389 68,323New York . . . . . . . . . . . . 3,769,627 3,717,496 1,227,933 766,360 636,283 20,979 1,065,941 52,131 50,441North Carolina . . . . . . . . 1,831,015 1,641,904 53,004 17,837 442,100 0 1,128,963 189,111 17,243North Dakota . . . . . . . . . 160,050 118,914 45,535 30,163 20,040 2,542 20,634 41,136 22,794
Ohio . . . . . . . . . . . . . . . . 2,007,733 1,899,856 610,876 417,813 369,526 33,856 467,785 107,877 76Oklahoma . . . . . . . . . . . 773,014 683,540 199,257 152,485 202,496 15,302 114,000 89,474 49,186Oregon . . . . . . . . . . . . . . 550,894 529,001 178,427 135,666 136,182 6,670 72,056 21,893 5,104Pennsylvania . . . . . . . . . 2,145,208 1,959,584 654,995 493,669 393,015 26,197 391,708 185,624 4,219Rhode Island . . . . . . . . . 204,682 199,284 55,609 42,610 35,028 4,329 61,708 5,398 3,260
South Carolina . . . . . . . . 848,254 845,371 250,013 178,952 247,028 10,447 158,931 2,883 2,358South Dakota . . . . . . . . . 212,615 129,891 53,295 29,891 26,374 1,303 19,028 82,724 69,431Tennessee . . . . . . . . . . . 1,257,953 1,218,880 298,710 253,198 330,755 18,265 317,952 39,073 5,366Texas . . . . . . . . . . . . . . . 6,140,296 5,592,373 1,380,135 785,076 1,542,389 53,238 1,831,535 547,923 107,600Utah . . . . . . . . . . . . . . . . 426,702 386,172 58,497 110,668 119,896 6,950 90,161 40,530 5,854
Vermont . . . . . . . . . . . . . 124,451 117,165 34,740 26,887 19,640 2,565 33,333 7,286 765Virginia . . . . . . . . . . . . . . 1,365,551 1,237,669 299,611 310,071 274,343 18,196 335,448 127,882 44,581Washington . . . . . . . . . . 1,057,045 890,243 247,753 234,899 224,679 7,164 175,748 166,802 51,432West Virginia . . . . . . . . . 432,223 414,617 110,733 84,635 84,389 4,796 130,064 17,606 0Wisconsin . . . . . . . . . . . 907,311 855,057 231,136 167,370 178,016 5,697 272,838 52,254 13,856Wyoming . . . . . . . . . . . . 144,728 131,432 42,088 33,206 17,983 2,272 35,883 13,296 13,075
N Not available. Amounts are combined in “Other and nonspecified” federal aid distributed through the state.1 Includes amounts not shown separately.Note: See Appendix B for a description of state-specific reporting anomalies. State and national totals in this table are lower than the actual totals for these federal programs. This information includes
only the revenue received by public school systems and excludes monies received by nonpublic school system organizations, such as state agencies and private entities. The value of school lunch commodities is also excluded. Survey of School System Finances statistics include the finances of charter schools whose charters are held directly by a government or a government agency. Charter schools whose charters are held by nongovernmental entities are deemed to be out of scope for the Survey of School System Finances.
Source: U.S. Census Bureau, 2012 Census of Governments: Finance—Survey of School System Finances. Data are not subject to sampling error, but for information on nonsampling error and definitions, see introductory text. Data users who create their own estimates from these tables should cite the U.S. Census Bureau as the source of the original data only.
Public Education Finances: 2012 3 U.S. Census Bureau
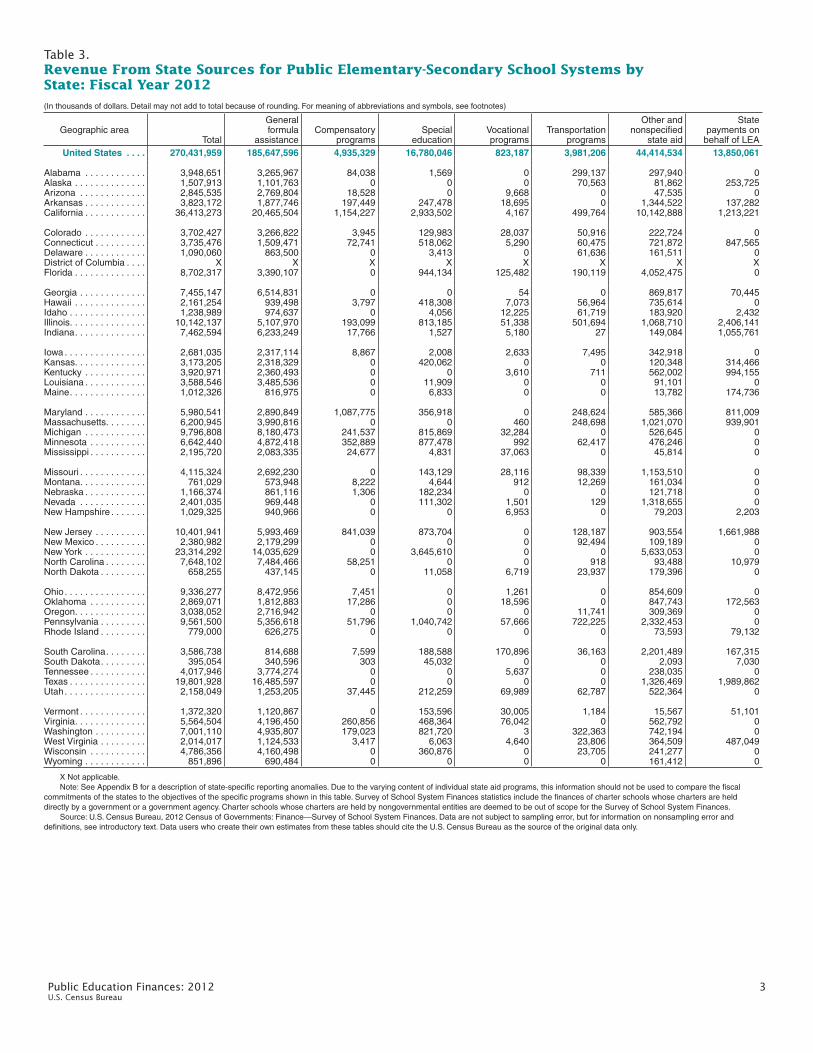
Table 3.Revenue From State Sources for Public Elementary-Secondary School Systems by State: Fiscal Year 2012 (In thousands of dollars. Detail may not add to total because of rounding. For meaning of abbreviations and symbols, see footnotes)
Geographic areaTotal
General formula
assistanceCompensatory
programsSpecial
educationVocationalprograms
Transportationprograms
Other andnonspecified
state aid
State payments on
behalf of LEA United States . . . . 270,431,959 185,647,596 4,935,329 16,780,046 823,187 3,981,206 44,414,534 13,850,061
Alabama . . . . . . . . . . . . 3,948,651 3,265,967 84,038 1,569 0 299,137 297,940 0Alaska . . . . . . . . . . . . . . 1,507,913 1,101,763 0 0 0 70,563 81,862 253,725Arizona . . . . . . . . . . . . . 2,845,535 2,769,804 18,528 0 9,668 0 47,535 0Arkansas . . . . . . . . . . . . 3,823,172 1,877,746 197,449 247,478 18,695 0 1,344,522 137,282California . . . . . . . . . . . . 36,413,273 20,465,504 1,154,227 2,933,502 4,167 499,764 10,142,888 1,213,221
Colorado . . . . . . . . . . . . 3,702,427 3,266,822 3,945 129,983 28,037 50,916 222,724 0Connecticut . . . . . . . . . . 3,735,476 1,509,471 72,741 518,062 5,290 60,475 721,872 847,565Delaware . . . . . . . . . . . . 1,090,060 863,500 0 3,413 0 61,636 161,511 0District of Columbia . . . . X X X X X X X XFlorida . . . . . . . . . . . . . . 8,702,317 3,390,107 0 944,134 125,482 190,119 4,052,475 0
Georgia . . . . . . . . . . . . . 7,455,147 6,514,831 0 0 54 0 869,817 70,445Hawaii . . . . . . . . . . . . . . 2,161,254 939,498 3,797 418,308 7,073 56,964 735,614 0Idaho . . . . . . . . . . . . . . . 1,238,989 974,637 0 4,056 12,225 61,719 183,920 2,432Illinois . . . . . . . . . . . . . . . 10,142,137 5,107,970 193,099 813,185 51,338 501,694 1,068,710 2,406,141Indiana . . . . . . . . . . . . . . 7,462,594 6,233,249 17,766 1,527 5,180 27 149,084 1,055,761
Iowa . . . . . . . . . . . . . . . . 2,681,035 2,317,114 8,867 2,008 2,633 7,495 342,918 0Kansas . . . . . . . . . . . . . . 3,173,205 2,318,329 0 420,062 0 0 120,348 314,466Kentucky . . . . . . . . . . . . 3,920,971 2,360,493 0 0 3,610 711 562,002 994,155Louisiana . . . . . . . . . . . . 3,588,546 3,485,536 0 11,909 0 0 91,101 0Maine . . . . . . . . . . . . . . . 1,012,326 816,975 0 6,833 0 0 13,782 174,736
Maryland . . . . . . . . . . . . 5,980,541 2,890,849 1,087,775 356,918 0 248,624 585,366 811,009Massachusetts . . . . . . . . 6,200,945 3,990,816 0 0 460 248,698 1,021,070 939,901Michigan . . . . . . . . . . . . 9,796,808 8,180,473 241,537 815,869 32,284 0 526,645 0Minnesota . . . . . . . . . . . 6,642,440 4,872,418 352,889 877,478 992 62,417 476,246 0Mississippi . . . . . . . . . . . 2,195,720 2,083,335 24,677 4,831 37,063 0 45,814 0
Missouri . . . . . . . . . . . . . 4,115,324 2,692,230 0 143,129 28,116 98,339 1,153,510 0Montana . . . . . . . . . . . . . 761,029 573,948 8,222 4,644 912 12,269 161,034 0Nebraska . . . . . . . . . . . . 1,166,374 861,116 1,306 182,234 0 0 121,718 0Nevada . . . . . . . . . . . . . 2,401,035 969,448 0 111,302 1,501 129 1,318,655 0New Hampshire . . . . . . . 1,029,325 940,966 0 0 6,953 0 79,203 2,203
New Jersey . . . . . . . . . . 10,401,941 5,993,469 841,039 873,704 0 128,187 903,554 1,661,988New Mexico . . . . . . . . . . 2,380,982 2,179,299 0 0 0 92,494 109,189 0New York . . . . . . . . . . . . 23,314,292 14,035,629 0 3,645,610 0 0 5,633,053 0North Carolina . . . . . . . . 7,648,102 7,484,466 58,251 0 0 918 93,488 10,979North Dakota . . . . . . . . . 658,255 437,145 0 11,058 6,719 23,937 179,396 0
Ohio . . . . . . . . . . . . . . . . 9,336,277 8,472,956 7,451 0 1,261 0 854,609 0Oklahoma . . . . . . . . . . . 2,869,071 1,812,883 17,286 0 18,596 0 847,743 172,563Oregon . . . . . . . . . . . . . . 3,038,052 2,716,942 0 0 0 11,741 309,369 0Pennsylvania . . . . . . . . . 9,561,500 5,356,618 51,796 1,040,742 57,666 722,225 2,332,453 0Rhode Island . . . . . . . . . 779,000 626,275 0 0 0 0 73,593 79,132
South Carolina . . . . . . . . 3,586,738 814,688 7,599 188,588 170,896 36,163 2,201,489 167,315South Dakota . . . . . . . . . 395,054 340,596 303 45,032 0 0 2,093 7,030Tennessee . . . . . . . . . . . 4,017,946 3,774,274 0 0 5,637 0 238,035 0Texas . . . . . . . . . . . . . . . 19,801,928 16,485,597 0 0 0 0 1,326,469 1,989,862Utah . . . . . . . . . . . . . . . . 2,158,049 1,253,205 37,445 212,259 69,989 62,787 522,364 0
Vermont . . . . . . . . . . . . . 1,372,320 1,120,867 0 153,596 30,005 1,184 15,567 51,101Virginia . . . . . . . . . . . . . . 5,564,504 4,196,450 260,856 468,364 76,042 0 562,792 0Washington . . . . . . . . . . 7,001,110 4,935,807 179,023 821,720 3 322,363 742,194 0West Virginia . . . . . . . . . 2,014,017 1,124,533 3,417 6,063 4,640 23,806 364,509 487,049Wisconsin . . . . . . . . . . . 4,786,356 4,160,498 0 360,876 0 23,705 241,277 0Wyoming . . . . . . . . . . . . 851,896 690,484 0 0 0 0 161,412 0
X Not applicable.Note: See Appendix B for a description of state-specific reporting anomalies. Due to the varying content of individual state aid programs, this information should not be used to compare the fiscal
commitments of the states to the objectives of the specific programs shown in this table. Survey of School System Finances statistics include the finances of charter schools whose charters are held directly by a government or a government agency. Charter schools whose charters are held by nongovernmental entities are deemed to be out of scope for the Survey of School System Finances.
Source: U.S. Census Bureau, 2012 Census of Governments: Finance—Survey of School System Finances. Data are not subject to sampling error, but for information on nonsampling error and definitions, see introductory text. Data users who create their own estimates from these tables should cite the U.S. Census Bureau as the source of the original data only.
4 Public Education Finances: 2012 U.S. Census Bureau
Table 4.Revenue From Local Sources for Public Elementary-Secondary School Systems by State: Fiscal Year 2012(In thousands of dollars. Detail may not add to total because of rounding. For meaning of abbreviations and symbols, see footnotes)
Geographic areaTotal
Propertytaxes
Othertaxes
Parentgovernment
contributions
Nonschoollocal
government
School lunch
charges
Tuition andtransportation
chargesOther
charges
Other local
revenue United States . . . . 264,567,460 172,684,684 8,292,189 47,389,798 6,743,638 6,318,581 1,277,654 7,028,990 14,831,926
Alabama . . . . . . . . . . . . 2,396,500 1,088,487 55,797 X 666,893 125,312 4,397 198,987 256,627Alaska . . . . . . . . . . . . . . 523,484 X X 461,845 0 10,634 0 19,476 31,529Arizona . . . . . . . . . . . . . 3,973,481 3,013,054 0 4,587 291,716 96,322 1,689 134,563 431,550Arkansas . . . . . . . . . . . . 662,172 418,114 2,346 X 9,335 56,458 9,612 85,609 80,698California . . . . . . . . . . . . 21,362,028 15,828,684 490,975 819,046 690,011 409,978 67,815 582,719 2,472,800
Colorado . . . . . . . . . . . . 4,162,225 3,417,697 20,968 X 14,530 89,007 94,119 264,155 261,749Connecticut . . . . . . . . . . 5,622,211 X X 5,074,906 403,227 117,670 4,871 3,930 17,607Delaware . . . . . . . . . . . . 541,258 464,460 0 X 0 14,971 0 615 61,212District of Columbia . . . . 1,193,264 X X 1,149,583 0 720 717 5,099 37,145Florida . . . . . . . . . . . . . . 12,361,242 10,191,656 490,153 X 0 287,867 13,725 895,150 482,691
Georgia . . . . . . . . . . . . . 8,238,616 5,574,782 1,744,956 X 34,286 196,524 30,301 299,412 358,355Hawaii . . . . . . . . . . . . . . 55,056 X X 0 0 26,751 5,249 8,996 14,060Idaho . . . . . . . . . . . . . . . 476,136 403,561 0 X 20 25,790 7,836 5,716 33,213Illinois . . . . . . . . . . . . . . . 16,580,567 15,351,325 0 X 124,917 247,391 70,379 262,078 524,477Indiana . . . . . . . . . . . . . . 3,583,059 2,480,876 2,998 0 300,226 197,276 7,799 143,991 449,893
Iowa . . . . . . . . . . . . . . . . 2,844,085 1,977,463 561,612 X 5,055 109,664 14,977 49,614 125,700Kansas . . . . . . . . . . . . . . 2,028,862 1,584,595 0 X 107,291 87,005 6,138 48,329 195,504Kentucky . . . . . . . . . . . . 2,286,985 1,648,426 390,020 X 32,720 101,507 9,268 11,038 94,006Louisiana . . . . . . . . . . . . 3,333,650 1,377,056 1,664,136 0 43,952 50,137 9,692 10,782 177,895Maine . . . . . . . . . . . . . . . 1,303,421 718,318 0 506,693 18,392 31,154 5,721 5,014 18,129
Maryland . . . . . . . . . . . . 6,908,016 X X 6,647,220 0 112,314 15,749 19,294 113,439Massachusetts . . . . . . . . 8,440,973 X X 6,786,355 1,091,949 147,528 135,401 39,396 240,344Michigan . . . . . . . . . . . . 6,007,925 5,071,318 0 X 25,474 178,932 37,283 424,596 270,322Minnesota . . . . . . . . . . . 3,144,275 2,013,833 0 X 215,753 186,546 105,948 207,067 415,128Mississippi . . . . . . . . . . . 1,475,688 1,166,742 17,603 3,218 17,052 51,557 6,052 137,076 76,388
Missouri . . . . . . . . . . . . . 4,840,060 3,737,559 213,444 X 208,538 144,798 23,801 244,063 267,857Montana . . . . . . . . . . . . . 637,172 408,025 0 X 135,194 19,484 3,438 37,068 33,963Nebraska . . . . . . . . . . . . 2,159,211 1,779,319 151,793 X 18,563 65,923 1,890 79,150 62,573Nevada . . . . . . . . . . . . . 1,247,821 1,133,513 1,740 X 1,471 27,931 11,540 4,988 66,638New Hampshire . . . . . . . 1,645,446 1,338,837 0 232,547 210 39,392 8,297 5,145 21,018
New Jersey . . . . . . . . . . 14,843,386 12,565,156 0 892,459 250,477 259,352 60,980 292,389 522,573New Mexico . . . . . . . . . . 605,995 493,682 0 X 0 22,568 11 28,540 61,194New York . . . . . . . . . . . . 31,673,714 16,894,721 40,872 11,418,316 249,260 296,068 44,687 119,136 2,610,654North Carolina . . . . . . . . 3,309,542 X X 2,675,253 77,993 216,239 0 81,650 258,407North Dakota . . . . . . . . . 485,795 358,243 0 X 23,849 26,477 1,102 26,491 49,633
Ohio . . . . . . . . . . . . . . . . 10,691,352 8,693,305 374,553 X 167,458 271,029 86,324 670,836 427,847Oklahoma . . . . . . . . . . . 2,181,033 1,591,430 7,956 X 195,683 76,806 21,490 191,341 96,327Oregon . . . . . . . . . . . . . . 2,486,532 2,030,961 0 X 81,431 44,776 23,404 112,801 193,159Pennsylvania . . . . . . . . . 14,749,185 11,973,507 1,849,308 X 60,039 333,003 57,628 87,969 387,731Rhode Island . . . . . . . . . 1,211,149 107,386 0 1,075,005 0 16,130 1,388 3,905 7,335
South Carolina . . . . . . . . 3,440,152 2,653,318 164,687 X 190,958 84,139 10,686 150,079 186,285South Dakota . . . . . . . . . 688,684 568,578 25,174 X 3,817 28,645 3,940 17,713 40,817Tennessee . . . . . . . . . . . 3,672,734 61,032 0 2,356,264 677,759 126,262 6,409 329,749 115,259Texas . . . . . . . . . . . . . . . 23,872,839 21,855,908 0 0 58,750 636,259 78,923 376,529 866,470Utah . . . . . . . . . . . . . . . . 1,628,475 1,419,053 0 X 260 57,214 14,765 12,554 124,629
Vermont . . . . . . . . . . . . . 75,457 1,385 1,986 X 1,013 17,865 2,207 5,624 45,377Virginia . . . . . . . . . . . . . . 7,762,713 X X 7,276,487 0 235,726 52,905 16,887 180,708Washington . . . . . . . . . . 3,809,742 3,199,952 1,003 X 11,233 109,774 87,451 157,003 243,326West Virginia . . . . . . . . . 1,512,199 936,822 14,221 X 5,140 24,350 4,213 8,888 518,565Wisconsin . . . . . . . . . . . 5,168,480 4,641,012 0 10,014 58,624 162,210 5,254 102,314 189,052Wyoming . . . . . . . . . . . . 663,413 451,533 3,888 X 173,119 17,146 183 3,476 14,068
X Not applicable.Note: See Appendix B for a description of state-specific reporting anomalies. Revenue from other school systems are excluded to avoid double counting. Some data appear under local sources for
Hawaii’s state-operated school system for consistency with data presented for all other school systems. Refer to the introductory text for an explanation concerning tax revenue for dependent school systems.Survey of School System Finances statistics include the finances of charter schools whose charters are held directly by a government or a government agency. Charter schools whose charters are held by nongovernmental entities are deemed to be out of scope for the Survey of School System Finances.
Source: U.S. Census Bureau, 2012 Census of Governments: Finance—Survey of School System Finances. Data are not subject to sampling error, but for information on nonsampling error and definitions, see introductory text. Data users who create their own estimates from these tables should cite the U.S. Census Bureau as the source of the original data only.
Public Education Finances: 2012 5 U.S. Census Bureau
Table 5. Percentage Distribution of Public Elementary-Secondary School System Revenue by Source and State: Fiscal Year 2012(Detail may not add to total because of rounding)
Geographic area
Total
Federal sources State sources Local sources
Total1 Title I Total1
General formula
assistance Total1
Taxes and parent
governmentcontributions
Other localgovernments Charges
United States . . . . 100 .0 10 .0 2 .5 45 .5 31 .2 44 .5 38 .4 1 .1 2 .5
Alabama . . . . . . . . . . . . 100.0 11.1 3.4 55.3 45.8 33.6 16.0 9.3 4.6Alaska . . . . . . . . . . . . . . 100.0 14.8 2.0 63.3 46.2 22.0 19.4 0.0 1.3Arizona . . . . . . . . . . . . . 100.0 13.3 3.9 36.2 35.2 50.5 38.3 3.7 3.0Arkansas . . . . . . . . . . . . 100.0 12.9 3.5 74.2 36.4 12.9 8.2 0.2 2.9California . . . . . . . . . . . . 100.0 13.2 3.1 54.7 30.7 32.1 25.7 1.0 1.6
Colorado . . . . . . . . . . . . 100.0 8.2 2.3 43.2 38.1 48.6 40.1 0.2 5.2Connecticut . . . . . . . . . . 100.0 5.2 1.1 37.9 15.3 57.0 51.4 4.1 1.3Delaware . . . . . . . . . . . . 100.0 10.1 2.2 60.1 47.6 29.8 25.6 0.0 0.9District of Columbia . . . . 100.0 10.3 2.9 X X 89.7 86.4 0.0 0.5Florida . . . . . . . . . . . . . . 100.0 12.7 3.5 36.1 14.0 51.2 44.3 0.0 5.0
Georgia . . . . . . . . . . . . . 100.0 10.6 3.1 42.5 37.1 46.9 41.7 0.2 3.0Hawaii . . . . . . . . . . . . . . 100.0 12.6 2.3 85.3 37.1 2.2 0.0 0.0 1.6Idaho . . . . . . . . . . . . . . . 100.0 13.4 2.9 62.5 49.2 24.0 20.4 0.0 2.0Illinois . . . . . . . . . . . . . . . 100.0 8.3 2.1 34.8 17.5 56.9 52.7 0.4 2.0Indiana . . . . . . . . . . . . . . 100.0 9.0 2.1 61.5 51.3 29.5 20.5 2.5 2.9
Iowa . . . . . . . . . . . . . . . . 100.0 8.5 1.6 44.4 38.4 47.1 42.1 0.1 2.9Kansas . . . . . . . . . . . . . . 100.0 7.3 2.1 56.5 41.3 36.2 28.2 1.9 2.5Kentucky . . . . . . . . . . . . 100.0 13.7 3.5 54.5 32.8 31.8 28.3 0.5 1.7Louisiana . . . . . . . . . . . . 100.0 18.1 4.1 42.5 41.2 39.5 36.0 0.5 0.8Maine . . . . . . . . . . . . . . . 100.0 9.4 2.1 39.6 32.0 51.0 47.9 0.7 1.6
Maryland . . . . . . . . . . . . 100.0 6.3 1.5 43.5 21.0 50.2 48.3 0.0 1.1Massachusetts . . . . . . . . 100.0 6.3 1.4 39.7 25.5 54.0 43.4 7.0 2.1Michigan . . . . . . . . . . . . 100.0 10.6 2.7 55.4 46.3 34.0 28.7 0.1 3.6Minnesota . . . . . . . . . . . 100.0 7.0 1.4 63.1 46.3 29.9 19.1 2.0 4.7Mississippi . . . . . . . . . . . 100.0 17.8 4.7 49.2 46.6 33.0 26.6 0.4 4.4
Missouri . . . . . . . . . . . . . 100.0 10.0 2.4 41.4 27.1 48.6 39.7 2.1 4.1Montana . . . . . . . . . . . . . 100.0 13.3 3.4 47.2 35.6 39.5 25.3 8.4 3.7Nebraska . . . . . . . . . . . . 100.0 9.9 1.8 31.6 23.3 58.5 52.3 0.5 4.0Nevada . . . . . . . . . . . . . 100.0 10.0 2.7 59.2 23.9 30.8 28.0 0.0 1.1New Hampshire . . . . . . . 100.0 6.5 1.5 36.0 32.9 57.5 54.9 0.0 1.8
New Jersey . . . . . . . . . . 100.0 5.2 1.1 39.1 22.5 55.8 50.6 0.9 2.3New Mexico . . . . . . . . . . 100.0 14.1 3.0 68.4 62.6 17.4 14.2 0.0 1.5New York . . . . . . . . . . . . 100.0 6.4 2.1 39.7 23.9 53.9 48.3 0.4 0.8North Carolina . . . . . . . . 100.0 14.3 0.4 59.8 58.5 25.9 20.9 0.6 2.3North Dakota . . . . . . . . . 100.0 12.3 3.5 50.5 33.5 37.3 27.5 1.8 4.1
Ohio . . . . . . . . . . . . . . . . 100.0 9.1 2.8 42.4 38.5 48.5 41.2 0.8 4.7Oklahoma . . . . . . . . . . . 100.0 13.3 3.4 49.3 31.1 37.5 27.5 3.4 5.0Oregon . . . . . . . . . . . . . . 100.0 9.1 2.9 50.0 44.7 40.9 33.4 1.3 3.0Pennsylvania . . . . . . . . . 100.0 8.1 2.5 36.1 20.2 55.8 52.2 0.2 1.8Rhode Island . . . . . . . . . 100.0 9.3 2.5 35.5 28.5 55.2 53.9 0.0 1.0
South Carolina . . . . . . . . 100.0 10.8 3.2 45.5 10.3 43.7 35.8 2.4 3.1South Dakota . . . . . . . . . 100.0 16.4 4.1 30.5 26.3 53.1 45.8 0.3 3.9Tennessee . . . . . . . . . . . 100.0 14.1 3.3 44.9 42.2 41.0 27.0 7.6 5.2Texas . . . . . . . . . . . . . . . 100.0 12.3 2.8 39.8 33.1 47.9 43.9 0.1 2.2Utah . . . . . . . . . . . . . . . . 100.0 10.1 1.4 51.2 29.7 38.7 33.7 0.0 2.0
Vermont . . . . . . . . . . . . . 100.0 7.9 2.2 87.3 71.3 4.8 0.2 0.1 1.6Virginia . . . . . . . . . . . . . . 100.0 9.3 2.0 37.9 28.6 52.8 49.5 0.0 2.1Washington . . . . . . . . . . 100.0 8.9 2.1 59.0 41.6 32.1 27.0 0.1 3.0West Virginia . . . . . . . . . 100.0 10.9 2.8 50.9 28.4 38.2 24.0 0.1 0.9Wisconsin . . . . . . . . . . . 100.0 8.4 2.1 44.1 38.3 47.6 42.8 0.5 2.5Wyoming . . . . . . . . . . . . 100.0 8.7 2.5 51.3 41.6 40.0 27.4 10.4 1.3
X Not applicable.1 Includes amounts not shown separately.Note: See Appendix B for a description of state-specific reporting anomalies. Revenue from other school systems are excluded to avoid double counting. Some data appear under local sources for
Hawaii’s state-operated school system for consistency with data presented for all other school systems. Survey of School System Finances statistics include the finances of charter schools whose charters are held directly by a government or a government agency. Charter schools whose charters are held by nongovernmental entities are deemed to be out of scope for the Survey of School System Finances.
Source: U.S. Census Bureau, 2012 Census of Governments: Finance—Survey of School System Finances. Data are not subject to sampling error, but for information on nonsampling error and definitions, see introductory text. Data users who create their own estimates from these tables should cite the U.S. Census Bureau as the source of the original data only.

6 Public Education Finances: 2012 U.S. Census Bureau
Table 6.Current Spending of Public Elementary-Secondary School Systems by State: Fiscal Year 2012(In thousands of dollars. Detail may not add to total because of rounding)
Geographic areaTotal
All functions Instruction Support services All other
functionsSalaries
and wagesEmployee
benefits Total1 Salaries
and wagesEmployee
benefits Total1 Salaries
and wagesEmployee
benefits United States . . . . 523,962,696 305,537,352 113,936,694 316,590,722 206,693,906 75,855,525 179,847,953 89,362,146 34,289,655 27,524,021
Alabama . . . . . . . . . . . . 6,493,448 3,719,862 1,399,800 3,695,221 2,441,817 872,555 2,239,569 1,101,198 435,965 558,658Alaska . . . . . . . . . . . . . . 2,285,517 1,060,067 958,576 1,255,757 671,618 459,317 947,153 364,309 249,153 82,607Arizona . . . . . . . . . . . . . 7,135,021 4,682,472 1,096,043 3,917,564 2,933,869 653,108 2,856,528 1,637,612 370,622 360,929Arkansas . . . . . . . . . . . . 4,912,815 2,676,463 740,069 2,548,056 1,728,956 475,272 1,683,928 854,245 236,268 680,831California . . . . . . . . . . . . 58,095,154 34,544,849 12,962,073 34,213,049 22,611,601 7,983,600 20,393,761 10,524,003 4,388,641 3,488,344
Colorado . . . . . . . . . . . . 7,279,824 4,596,516 1,187,883 4,174,705 2,964,450 756,647 2,751,179 1,484,024 390,087 353,940Connecticut . . . . . . . . . . 8,762,915 4,878,204 2,218,671 5,485,615 3,434,071 1,544,122 2,932,123 1,299,050 616,781 345,177Delaware . . . . . . . . . . . . 1,689,513 903,901 426,742 1,053,066 638,699 317,627 531,313 230,343 101,401 105,134District of Columbia . . . . 905,652 514,958 61,473 594,156 386,496 39,645 266,716 127,827 21,685 44,780Florida . . . . . . . . . . . . . . 22,788,834 13,161,006 3,711,196 13,558,844 8,424,880 2,277,281 7,607,362 4,191,287 1,238,646 1,622,628
Georgia . . . . . . . . . . . . . 15,572,647 9,707,204 3,074,711 9,611,118 6,592,882 2,222,702 5,043,644 2,812,036 768,637 917,885Hawaii . . . . . . . . . . . . . . 2,220,637 1,184,582 426,745 1,262,938 814,926 284,553 814,511 318,052 124,927 143,188Idaho . . . . . . . . . . . . . . . 1,785,929 1,090,552 378,870 1,073,312 749,704 254,848 609,786 308,377 109,887 102,831Illinois . . . . . . . . . . . . . . . 25,211,371 14,043,266 6,247,135 14,896,596 9,558,425 4,080,603 9,358,604 4,203,610 2,038,264 956,171Indiana . . . . . . . . . . . . . . 9,851,586 5,405,437 2,936,856 5,659,432 3,608,099 1,881,963 3,670,372 1,586,887 996,783 521,782
Iowa . . . . . . . . . . . . . . . . 5,003,871 3,149,837 1,044,314 3,072,424 2,137,007 701,149 1,688,512 917,099 312,388 242,935Kansas . . . . . . . . . . . . . . 4,740,356 2,758,849 885,887 2,935,226 1,850,238 586,160 1,569,972 820,011 268,022 235,158Kentucky . . . . . . . . . . . . 6,466,874 4,011,360 1,462,056 3,697,663 2,607,816 892,496 2,320,305 1,234,458 498,098 448,906Louisiana . . . . . . . . . . . . 7,592,600 4,272,533 1,958,650 4,365,583 2,776,928 1,256,629 2,793,437 1,339,334 619,950 433,580Maine . . . . . . . . . . . . . . . 2,372,463 1,363,141 525,782 1,376,755 904,486 354,304 887,587 410,786 156,796 108,121
Maryland . . . . . . . . . . . . 11,638,908 6,897,613 3,095,327 7,140,620 4,632,078 2,092,178 4,161,605 2,157,129 948,223 336,683Massachusetts . . . . . . . . 13,911,788 7,874,956 3,017,042 8,801,567 5,458,849 2,156,959 4,642,633 2,197,539 803,692 467,588Michigan . . . . . . . . . . . . 15,735,318 8,228,414 4,397,028 9,070,480 5,507,668 2,923,436 5,802,009 2,589,771 1,406,517 862,829Minnesota . . . . . . . . . . . 9,054,613 5,457,970 1,758,331 5,672,620 3,888,842 1,250,192 2,555,775 1,167,246 391,190 826,218Mississippi . . . . . . . . . . . 4,022,904 2,403,947 743,391 2,291,333 1,595,283 473,458 1,449,935 702,718 225,010 281,636
Missouri . . . . . . . . . . . . . 8,604,213 5,314,539 1,562,624 5,056,789 3,538,473 1,028,558 2,994,397 1,558,278 467,904 553,027Montana . . . . . . . . . . . . . 1,498,829 867,538 261,760 888,206 590,046 173,266 536,815 257,970 81,013 73,808Nebraska . . . . . . . . . . . . 3,398,322 2,004,744 648,651 2,247,992 1,449,605 477,816 984,922 496,470 154,472 165,408Nevada . . . . . . . . . . . . . 3,546,300 2,127,158 844,698 2,049,362 1,364,891 531,562 1,336,995 725,291 298,438 159,943New Hampshire . . . . . . . 2,601,337 1,424,692 620,110 1,654,634 1,035,560 447,503 868,513 360,977 163,713 78,190
New Jersey . . . . . . . . . . 24,356,836 13,593,117 5,620,873 14,491,817 8,918,420 3,465,558 8,921,990 4,405,663 1,904,372 943,029New Mexico . . . . . . . . . . 2,928,849 1,778,995 541,686 1,688,871 1,181,363 352,925 1,097,238 557,643 173,110 142,740New York . . . . . . . . . . . . 54,584,741 29,002,686 14,270,875 38,431,932 21,963,650 11,183,430 14,662,331 6,344,248 2,997,524 1,490,478North Carolina . . . . . . . . 12,055,354 7,597,182 2,399,064 7,521,325 5,219,176 1,628,735 3,817,233 2,102,025 671,844 716,796North Dakota . . . . . . . . . 1,147,943 693,778 214,992 685,786 475,308 151,253 368,323 189,417 57,158 93,834
Ohio . . . . . . . . . . . . . . . . 19,310,163 11,162,658 4,224,051 10,861,218 7,106,178 2,481,104 7,524,489 3,729,796 1,590,719 924,456Oklahoma . . . . . . . . . . . 5,021,707 2,910,197 946,287 2,736,786 1,892,115 621,280 1,898,922 901,357 285,550 385,999Oregon . . . . . . . . . . . . . . 5,536,815 2,832,145 1,581,063 3,250,376 1,836,482 996,084 2,057,965 931,769 544,642 228,474Pennsylvania . . . . . . . . . 22,303,920 12,441,651 5,122,251 13,450,420 8,724,614 3,523,099 7,682,906 3,405,906 1,476,799 1,170,594Rhode Island . . . . . . . . . 2,094,785 1,149,736 508,404 1,272,285 800,910 345,457 727,287 346,615 162,058 95,213
South Carolina . . . . . . . . 6,647,434 3,926,041 1,279,363 3,749,691 2,574,531 815,420 2,489,094 1,232,736 409,394 408,649South Dakota . . . . . . . . . 1,091,980 650,261 184,972 649,023 442,830 123,138 379,791 185,677 54,915 63,166Tennessee . . . . . . . . . . . 8,358,768 5,003,581 1,635,668 5,151,260 3,436,263 1,140,046 2,693,334 1,360,509 429,952 514,174Texas . . . . . . . . . . . . . . . 40,353,774 27,112,587 4,694,029 23,902,458 18,366,513 3,068,435 13,954,303 7,918,952 1,397,112 2,497,013Utah . . . . . . . . . . . . . . . . 3,548,527 1,960,606 887,452 2,161,779 1,327,853 606,203 1,052,249 568,633 252,981 334,499
Vermont . . . . . . . . . . . . . 1,476,846 831,121 306,011 904,254 562,320 208,873 518,561 249,874 91,050 54,031Virginia . . . . . . . . . . . . . . 13,479,465 8,524,810 2,931,524 8,123,166 5,651,521 1,903,354 4,744,530 2,625,296 935,418 611,769Washington . . . . . . . . . . 10,127,340 6,177,530 2,125,878 5,866,729 3,967,555 1,326,300 3,735,795 2,079,936 736,058 524,816West Virginia . . . . . . . . . 3,270,186 1,751,534 946,317 1,893,954 1,117,781 603,707 1,155,259 537,474 306,650 220,973Wisconsin . . . . . . . . . . . 9,648,094 5,257,916 2,511,405 5,631,108 3,679,425 1,638,525 3,525,882 1,425,782 808,694 491,104Wyoming . . . . . . . . . . . . 1,439,610 852,590 352,035 845,801 550,835 223,090 540,510 284,901 120,482 53,299
1 Includes amounts not shown separately.Note: See Appendix B for a description of state-specific reporting anomalies. Payments to other school systems are excluded from this table. Expenditures for adult education, community services,
and other nonelementary-secondary programs are included under “Total” current spending and “All other functions,” but are excluded in the per pupil data displayed in Tables 8, 11, 14, 18, and 20. Survey of School System Finances statistics include the finances of charter schools whose charters are held directly by a government or a government agency. Charter schools whose charters are held by nongovernmental entities are deemed to be out of scope for the Survey of School System Finances.
Source: U.S. Census Bureau, 2012 Census of Governments: Finance—Survey of School System Finances. Data are not subject to sampling error, but for information on nonsampling error and definitions, see introductory text. Data users who create their own estimates from these tables should cite the U.S. Census Bureau as the source of the original data only.

Public Education Finances: 2012 7 U.S. Census Bureau
Table 7. Support Services Expenditure for Public Elementary-Secondary School Systems by Function and State: Fiscal Year 2012(In thousands of dollars. Detail may not add to total because of rounding)
Geographic area
Total
Pupilsupport
services
Instructional staff
support services
Generaladministration
Schooladministration
Operation andmaintenance
of plantPupil
transportation
Other andnonspecified
supportservices
United States . . . . 179,847,953 29,150,652 23,691,363 9,738,230 27,831,370 48,229,390 23,125,285 18,081,663
Alabama . . . . . . . . . . . . 2,239,569 368,257 288,636 144,767 393,786 580,977 323,109 140,037Alaska . . . . . . . . . . . . . . 947,153 187,177 150,271 33,280 138,276 281,963 69,545 86,641Arizona . . . . . . . . . . . . . 2,856,528 1,015,146 178,754 79,966 297,438 759,553 308,166 217,505Arkansas . . . . . . . . . . . . 1,683,928 230,325 377,140 106,685 225,951 437,981 178,523 127,323California . . . . . . . . . . . . 20,393,761 2,980,324 3,247,956 546,242 3,753,288 5,489,314 1,452,141 2,924,496
Colorado . . . . . . . . . . . . 2,751,179 351,311 400,584 120,304 489,602 696,914 219,348 473,116Connecticut . . . . . . . . . . 2,932,123 554,864 257,630 178,349 501,822 791,287 445,381 202,790Delaware . . . . . . . . . . . . 531,313 68,908 29,535 20,778 88,543 164,388 85,970 73,191District of Columbia . . . . 266,716 14,052 37,552 40,316 86,844 72,449 11,125 4,378Florida . . . . . . . . . . . . . . 7,607,362 966,418 1,413,224 196,260 1,234,450 2,314,303 922,916 559,791
Georgia . . . . . . . . . . . . . 5,043,644 717,096 802,273 204,359 932,906 1,155,670 702,712 528,628Hawaii . . . . . . . . . . . . . . 814,511 205,928 78,573 10,648 134,487 251,934 75,894 57,047Idaho . . . . . . . . . . . . . . . 609,786 100,136 72,607 37,713 102,142 165,029 90,750 41,409Illinois . . . . . . . . . . . . . . . 9,358,604 1,666,342 999,959 1,036,931 1,282,180 2,173,319 1,184,171 1,015,702Indiana . . . . . . . . . . . . . . 3,670,372 457,991 369,437 190,385 556,094 1,083,857 597,066 415,542
Iowa . . . . . . . . . . . . . . . . 1,688,512 278,436 238,884 126,426 286,574 423,604 188,791 145,797Kansas . . . . . . . . . . . . . . 1,569,972 227,675 185,622 122,140 275,510 460,628 185,458 112,939Kentucky . . . . . . . . . . . . 2,320,305 291,747 361,971 144,909 363,617 578,464 414,572 165,025Louisiana . . . . . . . . . . . . 2,793,437 481,289 423,103 178,849 428,465 651,433 426,191 204,107Maine . . . . . . . . . . . . . . . 887,587 151,998 112,335 95,710 127,323 252,698 118,013 29,510
Maryland . . . . . . . . . . . . 4,161,605 532,704 637,942 168,358 850,854 1,008,194 635,117 328,436Massachusetts . . . . . . . . 4,642,633 983,639 787,073 179,953 576,422 1,203,269 585,752 326,525Michigan . . . . . . . . . . . . 5,802,009 1,221,896 763,415 249,366 818,129 1,317,776 690,253 741,174Minnesota . . . . . . . . . . . 2,555,775 233,330 378,837 256,613 341,119 618,169 485,775 241,932Mississippi . . . . . . . . . . . 1,449,935 190,736 205,227 124,009 230,360 413,124 196,054 90,425
Missouri . . . . . . . . . . . . . 2,994,397 397,711 368,702 266,587 488,010 841,385 437,222 194,780Montana . . . . . . . . . . . . . 536,815 91,468 56,938 45,119 82,102 150,827 74,151 36,210Nebraska . . . . . . . . . . . . 984,922 140,882 102,655 96,541 164,385 289,850 105,873 84,736Nevada . . . . . . . . . . . . . 1,336,995 190,486 181,135 52,608 256,270 376,943 152,152 127,401New Hampshire . . . . . . . 868,513 196,957 79,850 88,634 144,574 217,506 113,238 27,754
New Jersey . . . . . . . . . . 8,921,990 2,370,498 708,738 471,695 1,141,896 2,446,947 1,215,611 566,605New Mexico . . . . . . . . . . 1,097,238 293,272 79,438 61,791 171,852 308,263 100,640 81,982New York . . . . . . . . . . . . 14,662,331 1,574,403 1,253,614 866,294 1,895,741 4,443,546 3,155,980 1,472,753North Carolina . . . . . . . . 3,817,233 626,125 398,095 129,579 744,233 1,008,175 548,736 362,290North Dakota . . . . . . . . . 368,323 47,137 39,385 49,427 55,407 99,356 47,748 29,863
Ohio . . . . . . . . . . . . . . . . 7,524,489 1,208,934 1,263,820 494,418 984,063 1,661,127 906,198 1,005,929Oklahoma . . . . . . . . . . . 1,898,922 350,173 199,197 165,614 275,854 570,032 178,897 159,155Oregon . . . . . . . . . . . . . . 2,057,965 383,091 200,726 72,090 342,439 444,845 257,813 356,961Pennsylvania . . . . . . . . . 7,682,906 1,193,359 758,861 637,221 918,061 2,065,666 1,334,908 774,830Rhode Island . . . . . . . . . 727,287 209,471 69,952 25,373 95,698 157,322 101,229 68,242
South Carolina . . . . . . . . 2,489,094 515,765 395,223 68,225 392,271 628,838 269,909 218,863South Dakota . . . . . . . . . 379,791 59,362 43,639 36,167 53,205 110,982 40,941 35,495Tennessee . . . . . . . . . . . 2,693,334 376,861 519,969 175,170 469,667 698,960 311,914 140,793Texas . . . . . . . . . . . . . . . 13,954,303 1,987,018 2,017,318 592,787 2,245,674 4,383,066 1,144,548 1,583,892Utah . . . . . . . . . . . . . . . . 1,052,249 124,934 144,505 35,080 212,504 321,241 122,009 91,976
Vermont . . . . . . . . . . . . . 518,561 117,481 64,101 30,910 99,984 123,483 46,031 36,571Virginia . . . . . . . . . . . . . . 4,744,530 652,509 888,936 207,326 775,484 1,282,361 726,330 211,584Washington . . . . . . . . . . 3,735,795 870,081 379,071 114,333 582,824 903,782 413,262 472,442West Virginia . . . . . . . . . 1,155,259 154,780 135,819 63,817 171,463 331,237 241,751 56,392Wisconsin . . . . . . . . . . . 3,525,882 456,470 455,534 268,371 474,364 879,557 416,307 575,279Wyoming . . . . . . . . . . . . 540,510 83,699 87,602 29,737 77,163 137,796 69,094 55,419
Note: See Appendix B for a description of state-specific reporting anomalies. Payments to other school systems are excluded from this table. Expenditures for adult education, community services, and other nonelementary-secondary programs are also excluded. Survey of School System Finances statistics include the finances of charter schools whose charters are held directly by a government or a government agency. Charter schools whose charters are held by nongovernmental entities are deemed to be out of scope for the Survey of School System Finances.
Source: U.S. Census Bureau, 2012 Census of Governments: Finance—Survey of School System Finances. Data are not subject to sampling error, but for information on nonsampling error and definitions, see introductory text. Data users who create their own estimates from these tables should cite the U.S. Census Bureau as the source of the original data only.

8 Public Education Finances: 2012 U.S. Census Bureau
Table 8. Per Pupil Amounts for Current Spending of Public Elementary-Secondary School Systems by State: Fiscal Year 2012(In dollars)
Geographic area
Total1
Salaries and
wagesEmployee
benefits
Instruction Support services
Total1
Salaries and
wagesEmployee
benefits Total1Pupil
support
Instructional staff
support
Generaladminis-
tration
Schooladminis-
tration United States . . . . 10,608 6,337 2,363 6,430 4,287 1,573 3,730 605 491 202 577
Alabama . . . . . . . . . . . . 8,562 4,996 1,880 4,959 3,279 1,172 3,008 495 388 194 529Alaska . . . . . . . . . . . . . . 17,390 8,106 7,330 9,603 5,136 3,512 7,243 1,431 1,149 254 1,057Arizona . . . . . . . . . . . . . 7,559 4,967 1,163 4,156 3,112 693 3,030 1,077 190 85 316Arkansas . . . . . . . . . . . . 9,411 5,627 1,556 5,350 3,635 999 3,540 484 793 224 475California . . . . . . . . . . . . 9,183 5,569 2,090 5,515 3,645 1,287 3,288 480 524 88 605
Colorado . . . . . . . . . . . . 8,548 5,452 1,409 4,944 3,516 897 3,263 417 475 143 581Connecticut . . . . . . . . . . 16,274 9,337 4,247 10,078 6,573 2,956 5,612 1,062 493 341 961Delaware . . . . . . . . . . . . 13,865 7,620 3,597 8,832 5,384 2,678 4,479 581 249 175 746District of Columbia . . . . 17,468 11,541 1,378 10,635 8,662 889 5,978 315 842 904 1,946Florida . . . . . . . . . . . . . . 8,372 4,950 1,396 5,100 3,169 857 2,861 364 532 74 464
Georgia . . . . . . . . . . . . . 9,247 5,816 1,842 5,693 3,950 1,332 3,022 430 481 122 559Hawaii . . . . . . . . . . . . . . 12,054 6,484 2,336 6,912 4,460 1,557 4,458 1,127 430 58 736Idaho . . . . . . . . . . . . . . . 6,659 4,076 1,416 4,012 2,802 953 2,279 374 271 141 382Illinois . . . . . . . . . . . . . . . 12,015 6,779 3,016 7,106 4,614 1,970 4,518 804 483 501 619Indiana . . . . . . . . . . . . . . 9,719 5,370 2,918 5,618 3,584 1,870 3,646 455 367 189 552
Iowa . . . . . . . . . . . . . . . . 10,038 6,352 2,106 6,196 4,310 1,414 3,405 562 482 255 578Kansas . . . . . . . . . . . . . . 9,748 5,681 1,824 6,040 3,810 1,207 3,233 469 382 252 567Kentucky . . . . . . . . . . . . 9,391 5,883 2,144 5,423 3,825 1,309 3,403 428 531 213 533Louisiana . . . . . . . . . . . . 11,379 6,420 2,943 6,560 4,173 1,888 4,198 723 636 269 644Maine . . . . . . . . . . . . . . . 12,189 7,280 2,808 7,020 4,830 1,892 4,740 812 600 511 680
Maryland . . . . . . . . . . . . 13,609 8,079 3,625 8,364 5,425 2,450 4,874 624 747 197 997Massachusetts . . . . . . . . 14,142 8,535 3,270 8,665 5,916 2,338 5,032 1,066 853 195 625Michigan . . . . . . . . . . . . 10,855 5,789 3,094 6,382 3,875 2,057 4,082 860 537 175 576Minnesota . . . . . . . . . . . 10,796 6,825 2,199 7,093 4,863 1,563 3,196 292 474 321 427Mississippi . . . . . . . . . . . 8,164 4,900 1,515 4,670 3,252 965 2,955 389 418 253 470
Missouri . . . . . . . . . . . . . 9,436 5,950 1,749 5,661 3,961 1,152 3,352 445 413 298 546Montana . . . . . . . . . . . . . 10,464 6,099 1,840 6,245 4,148 1,218 3,774 643 400 317 577Nebraska . . . . . . . . . . . . 11,275 6,662 2,155 7,470 4,817 1,588 3,273 468 341 321 546Nevada . . . . . . . . . . . . . 8,223 4,964 1,971 4,782 3,185 1,240 3,120 445 423 123 598New Hampshire . . . . . . . 13,593 7,468 3,250 8,664 5,428 2,346 4,552 1,032 419 465 758
New Jersey . . . . . . . . . . 17,266 10,218 4,225 9,964 6,704 2,605 6,707 1,782 533 355 858New Mexico . . . . . . . . . . 8,899 5,412 1,648 5,138 3,594 1,074 3,338 892 242 188 523New York . . . . . . . . . . . . 19,552 10,977 5,401 13,582 8,313 4,233 5,549 596 474 328 717North Carolina . . . . . . . . 8,200 5,196 1,641 5,144 3,569 1,114 2,611 428 272 89 509North Dakota . . . . . . . . . 11,679 7,112 2,204 7,030 4,872 1,550 3,776 483 404 507 568
Ohio . . . . . . . . . . . . . . . . 11,204 6,845 2,590 6,183 4,357 1,521 4,614 741 775 303 603Oklahoma . . . . . . . . . . . 7,466 4,382 1,425 4,065 2,849 935 2,859 527 300 249 415Oregon . . . . . . . . . . . . . . 9,490 4,999 2,791 5,500 3,242 1,758 3,633 676 354 127 604Pennsylvania . . . . . . . . . 13,340 7,564 3,114 8,135 5,304 2,142 4,671 726 461 387 558Rhode Island . . . . . . . . . 14,005 8,368 3,700 8,322 5,829 2,514 5,293 1,525 509 185 696
South Carolina . . . . . . . . 9,147 5,485 1,787 5,153 3,597 1,139 3,478 721 552 95 548South Dakota . . . . . . . . . 8,446 5,091 1,448 5,027 3,467 964 2,973 465 342 283 417Tennessee . . . . . . . . . . . 8,294 5,010 1,638 5,158 3,441 1,142 2,697 377 521 175 470Texas . . . . . . . . . . . . . . . 8,261 5,596 969 4,934 3,791 633 2,880 410 416 122 464Utah . . . . . . . . . . . . . . . . 6,206 3,540 1,602 3,903 2,397 1,094 1,900 226 261 63 384
Vermont . . . . . . . . . . . . . 16,040 9,448 3,479 9,668 6,392 2,374 5,895 1,335 729 351 1,137Virginia . . . . . . . . . . . . . . 10,656 6,780 2,332 6,456 4,495 1,514 3,773 519 707 165 617Washington . . . . . . . . . . 9,637 5,912 2,035 5,615 3,797 1,269 3,575 833 363 109 558West Virginia . . . . . . . . . 11,445 6,209 3,355 6,714 3,963 2,140 4,095 549 481 226 608Wisconsin . . . . . . . . . . . 11,042 6,090 2,909 6,523 4,262 1,898 4,084 529 528 311 549Wyoming . . . . . . . . . . . . 15,897 9,474 3,912 9,398 6,121 2,479 6,006 930 973 330 857
1 Includes amounts not shown separately.Note: See Appendix B for a description of state-specific reporting anomalies. Payments to other school systems are excluded from this table. Expenditures for adult education, community services, and
other nonelementary-secondary programs are also excluded. Enrollments used to calculate per pupil amounts represent fall 2011 memberships collected by the National Center for Education Statistics on the Common Core of Data (CCD) agency universe file—“Local Education Agency (School District) Universe Survey: 2011–12, Provisional Version 1a.” Enrollments for state educational facilities, federal school systems, and charter schools whose charters are held by a nongovernmental entity have been excluded. Enrollments from the CCD agency universe file were subject to adjustment if the enrollments were inconsistent with the finances reported. Survey of School System Finances statistics include the finances of charter schools whose charters are held directly by a government or a government agency. Charter schools whose charters are held by nongovernmental entities are deemed to be out of scope for the Survey of School System Finances.
Source: U.S. Census Bureau, 2012 Census of Governments: Finance—Survey of School System Finances. Data are not subject to sampling error, but for information on nonsampling error and definitions, see introductory text. Data users who create their own estimates from these tables should cite the U.S. Census Bureau as the source of the original data only.

Public Education Finances: 2012 9 U.S. Census Bureau
Table 9.Capital Outlay and Other Expenditure of Public Elementary–Secondary School Systems by State: Fiscal Year 2012(In thousands of dollars. Detail may not add to total because of rounding. For meaning of abbreviations and symbols, see footnotes)
Geographic area
Capital outlayInterest
on debt
Payments to other
governmentsTotal Construction
Land and existing
structures
Equipment
Instructional Other United States . . . . 50,153,239 39,285,923 2,853,458 2,021,247 5,992,611 17,951,538 1,750,817
Alabama . . . . . . . . . . . . 580,949 509,536 15,085 5,936 50,392 138,304 0Alaska . . . . . . . . . . . . . . 145,219 95,125 33,003 5,026 12,065 52,584 0Arizona . . . . . . . . . . . . . 699,033 487,805 33,850 43,180 134,198 220,608 0Arkansas . . . . . . . . . . . . 563,379 353,864 119,059 24,216 66,240 130,499 7,132California . . . . . . . . . . . . 6,736,656 6,169,731 350,292 23,987 192,646 2,415,465 3,676
Colorado . . . . . . . . . . . . 697,434 461,949 52,409 47,737 135,339 429,551 17,548Connecticut . . . . . . . . . . 637,389 553,674 N 35,331 48,384 134,363 0Delaware . . . . . . . . . . . . 149,584 135,309 N 2,748 11,527 22,201 0District of Columbia . . . . 283,890 274,101 N 5,983 3,806 0 0Florida . . . . . . . . . . . . . . 1,837,264 1,315,021 69,567 0 452,676 725,949 0
Georgia . . . . . . . . . . . . . 1,566,020 1,338,505 51,123 25,330 151,062 249,147 0Hawaii . . . . . . . . . . . . . . 124,096 108,849 0 9,452 5,795 0 0Idaho . . . . . . . . . . . . . . . 69,239 33,231 N 9,236 26,772 56,538 0Illinois . . . . . . . . . . . . . . . 2,032,447 1,692,131 N 132,787 207,529 887,390 0Indiana . . . . . . . . . . . . . . 894,450 333,811 171,786 35,976 352,877 349,212 0
Iowa . . . . . . . . . . . . . . . . 900,591 712,442 15,701 60,557 111,891 111,882 0Kansas . . . . . . . . . . . . . . 662,722 435,403 33,776 116,920 76,623 200,976 2,901Kentucky . . . . . . . . . . . . 764,062 606,956 18,272 46,383 92,451 211,725 0Louisiana . . . . . . . . . . . . 777,379 659,656 71,097 5,829 40,797 117,333 0Maine . . . . . . . . . . . . . . . 131,394 101,329 3,815 5,565 20,685 56,660 620
Maryland . . . . . . . . . . . . 1,139,120 965,396 20,875 22,165 130,684 167,912 0Massachusetts . . . . . . . . 1,159,884 593,396 446,751 76,591 43,146 251,257 0Michigan . . . . . . . . . . . . 1,200,582 830,415 76,375 35,576 258,216 872,508 0Minnesota . . . . . . . . . . . 1,034,162 772,596 N 68,259 193,307 389,459 54,355Mississippi . . . . . . . . . . . 329,375 179,082 N 53,048 97,245 68,715 0
Missouri . . . . . . . . . . . . . 891,474 627,372 76,833 50,131 137,138 323,168 0Montana . . . . . . . . . . . . . 117,001 89,953 5,427 3,419 18,202 16,942 0Nebraska . . . . . . . . . . . . 374,671 224,605 20,546 23,151 106,369 86,101 800Nevada . . . . . . . . . . . . . 321,145 273,721 27,391 3,329 16,704 240,352 0New Hampshire . . . . . . . 160,056 94,113 31,613 17,630 16,700 45,467 0
New Jersey . . . . . . . . . . 940,577 722,690 59,607 38,549 119,731 326,161 40,254New Mexico . . . . . . . . . . 615,427 401,829 47,667 1,521 164,410 66,108 0New York . . . . . . . . . . . . 4,094,920 3,573,940 103,029 127,036 290,915 1,225,007 17,743North Carolina . . . . . . . . 728,580 580,918 18,389 48,802 80,471 577,836 0North Dakota . . . . . . . . . 160,904 112,523 6,261 12,159 29,961 13,707 5,468
Ohio . . . . . . . . . . . . . . . . 2,416,140 1,982,444 4,216 135,562 293,918 516,042 258,508Oklahoma . . . . . . . . . . . 496,119 304,167 96,770 18,993 76,189 57,617 0Oregon . . . . . . . . . . . . . . 448,562 398,923 8,201 3,492 37,946 316,097 351Pennsylvania . . . . . . . . . 1,735,626 1,515,767 8,782 82,058 129,019 981,636 83,938Rhode Island . . . . . . . . . 33,633 12,867 380 13,981 6,405 44,262 493
South Carolina . . . . . . . . 869,025 653,157 19,301 25,538 171,029 397,188 10,299South Dakota . . . . . . . . . 172,398 142,955 N 13,612 15,831 28,803 0Tennessee . . . . . . . . . . . 671,532 418,302 18,115 83,879 151,236 199,943 0Texas . . . . . . . . . . . . . . . 5,538,370 4,570,624 185,067 207,070 575,609 3,063,362 1,098,714Utah . . . . . . . . . . . . . . . . 666,528 373,632 175,568 33,495 83,833 112,315 0
Vermont . . . . . . . . . . . . . 45,788 18,779 1,308 9,802 15,899 12,507 0Virginia . . . . . . . . . . . . . . 1,078,796 676,104 166,638 79,361 156,693 349,077 0Washington . . . . . . . . . . 1,552,074 1,257,240 102,735 9,762 182,337 471,085 0West Virginia . . . . . . . . . 245,082 190,278 15,506 6,791 32,507 19,418 226Wisconsin . . . . . . . . . . . 449,246 208,756 50,370 62,112 128,008 199,611 147,791Wyoming . . . . . . . . . . . . 213,245 140,951 20,902 12,194 39,198 1,488 0
N Not available. Amounts are included in construction.Note: See Appendix B for a description of state-specific reporting anomalies. Payments to other school systems are excluded from this table. Survey of School System Finances statistics include the
finances of charter schools whose charters are held directly by a government or a government agency. Charter schools whose charters are held by nongovernmental entities are deemed to be out of scope for the Survey of School System Finances.
Source: U.S. Census Bureau, 2012 Census of Governments: Finance—Survey of School System Finances. Data are not subject to sampling error, but for information on nonsampling error and definitions, see introductory text. Data users who create their own estimates from these tables should cite the U.S. Census Bureau as the source of the original data only.
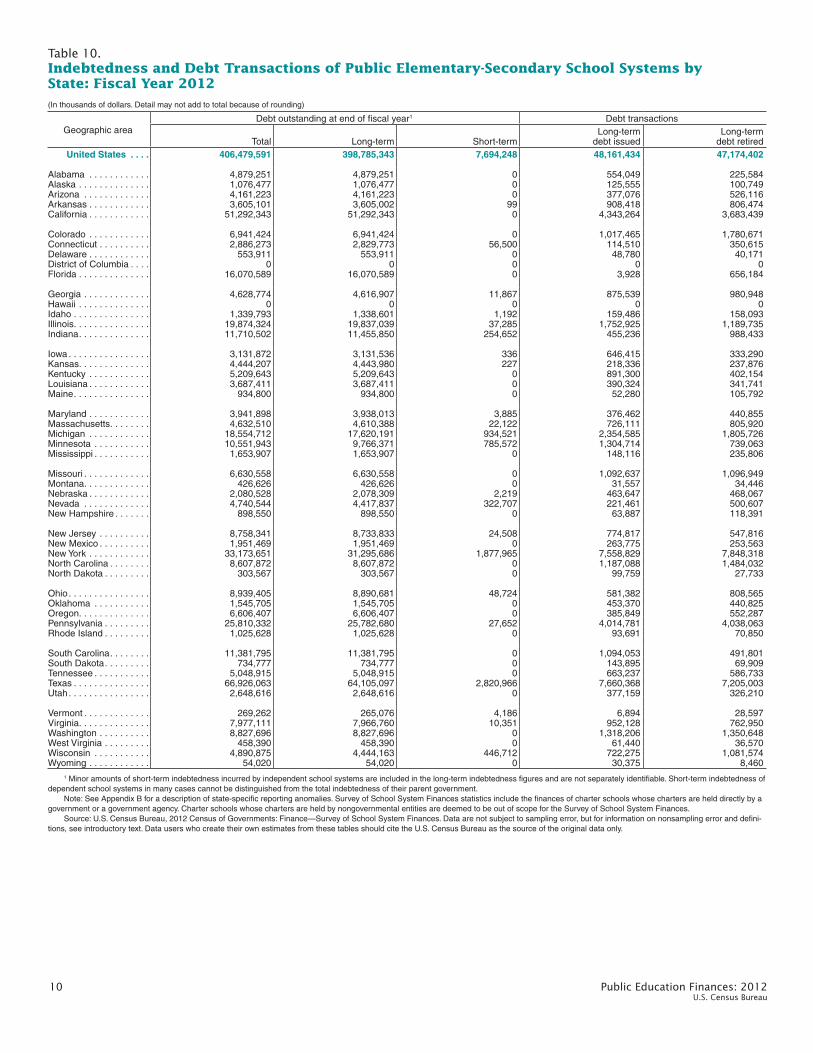
10 Public Education Finances: 2012 U.S. Census Bureau
Table 10.Indebtedness and Debt Transactions of Public Elementary-Secondary School Systems by State: Fiscal Year 2012(In thousands of dollars. Detail may not add to total because of rounding)
Geographic areaDebt outstanding at end of fiscal year1 Debt transactions
Total Long-term Short-termLong-term
debt issuedLong-term
debt retired United States . . . . 406,479,591 398,785,343 7,694,248 48,161,434 47,174,402
Alabama . . . . . . . . . . . . 4,879,251 4,879,251 0 554,049 225,584Alaska . . . . . . . . . . . . . . 1,076,477 1,076,477 0 125,555 100,749Arizona . . . . . . . . . . . . . 4,161,223 4,161,223 0 377,076 526,116Arkansas . . . . . . . . . . . . 3,605,101 3,605,002 99 908,418 806,474California . . . . . . . . . . . . 51,292,343 51,292,343 0 4,343,264 3,683,439
Colorado . . . . . . . . . . . . 6,941,424 6,941,424 0 1,017,465 1,780,671Connecticut . . . . . . . . . . 2,886,273 2,829,773 56,500 114,510 350,615Delaware . . . . . . . . . . . . 553,911 553,911 0 48,780 40,171District of Columbia . . . . 0 0 0 0 0Florida . . . . . . . . . . . . . . 16,070,589 16,070,589 0 3,928 656,184
Georgia . . . . . . . . . . . . . 4,628,774 4,616,907 11,867 875,539 980,948Hawaii . . . . . . . . . . . . . . 0 0 0 0 0Idaho . . . . . . . . . . . . . . . 1,339,793 1,338,601 1,192 159,486 158,093Illinois . . . . . . . . . . . . . . . 19,874,324 19,837,039 37,285 1,752,925 1,189,735Indiana . . . . . . . . . . . . . . 11,710,502 11,455,850 254,652 455,236 988,433
Iowa . . . . . . . . . . . . . . . . 3,131,872 3,131,536 336 646,415 333,290Kansas . . . . . . . . . . . . . . 4,444,207 4,443,980 227 218,336 237,876Kentucky . . . . . . . . . . . . 5,209,643 5,209,643 0 891,300 402,154Louisiana . . . . . . . . . . . . 3,687,411 3,687,411 0 390,324 341,741Maine . . . . . . . . . . . . . . . 934,800 934,800 0 52,280 105,792
Maryland . . . . . . . . . . . . 3,941,898 3,938,013 3,885 376,462 440,855Massachusetts . . . . . . . . 4,632,510 4,610,388 22,122 726,111 805,920Michigan . . . . . . . . . . . . 18,554,712 17,620,191 934,521 2,354,585 1,805,726Minnesota . . . . . . . . . . . 10,551,943 9,766,371 785,572 1,304,714 739,063Mississippi . . . . . . . . . . . 1,653,907 1,653,907 0 148,116 235,806
Missouri . . . . . . . . . . . . . 6,630,558 6,630,558 0 1,092,637 1,096,949Montana . . . . . . . . . . . . . 426,626 426,626 0 31,557 34,446Nebraska . . . . . . . . . . . . 2,080,528 2,078,309 2,219 463,647 468,067Nevada . . . . . . . . . . . . . 4,740,544 4,417,837 322,707 221,461 500,607New Hampshire . . . . . . . 898,550 898,550 0 63,887 118,391
New Jersey . . . . . . . . . . 8,758,341 8,733,833 24,508 774,817 547,816New Mexico . . . . . . . . . . 1,951,469 1,951,469 0 263,775 253,563New York . . . . . . . . . . . . 33,173,651 31,295,686 1,877,965 7,558,829 7,848,318North Carolina . . . . . . . . 8,607,872 8,607,872 0 1,187,088 1,484,032North Dakota . . . . . . . . . 303,567 303,567 0 99,759 27,733
Ohio . . . . . . . . . . . . . . . . 8,939,405 8,890,681 48,724 581,382 808,565Oklahoma . . . . . . . . . . . 1,545,705 1,545,705 0 453,370 440,825Oregon . . . . . . . . . . . . . . 6,606,407 6,606,407 0 385,849 552,287Pennsylvania . . . . . . . . . 25,810,332 25,782,680 27,652 4,014,781 4,038,063Rhode Island . . . . . . . . . 1,025,628 1,025,628 0 93,691 70,850
South Carolina . . . . . . . . 11,381,795 11,381,795 0 1,094,053 491,801South Dakota . . . . . . . . . 734,777 734,777 0 143,895 69,909Tennessee . . . . . . . . . . . 5,048,915 5,048,915 0 663,237 586,733Texas . . . . . . . . . . . . . . . 66,926,063 64,105,097 2,820,966 7,660,368 7,205,003Utah . . . . . . . . . . . . . . . . 2,648,616 2,648,616 0 377,159 326,210
Vermont . . . . . . . . . . . . . 269,262 265,076 4,186 6,894 28,597Virginia . . . . . . . . . . . . . . 7,977,111 7,966,760 10,351 952,128 762,950Washington . . . . . . . . . . 8,827,696 8,827,696 0 1,318,206 1,350,648West Virginia . . . . . . . . . 458,390 458,390 0 61,440 36,570Wisconsin . . . . . . . . . . . 4,890,875 4,444,163 446,712 722,275 1,081,574Wyoming . . . . . . . . . . . . 54,020 54,020 0 30,375 8,460
1 Minor amounts of short-term indebtedness incurred by independent school systems are included in the long-term indebtedness figures and are not separately identifiable. Short-term indebtedness of dependent school systems in many cases cannot be distinguished from the total indebtedness of their parent government.
Note: See Appendix B for a description of state-specific reporting anomalies. Survey of School System Finances statistics include the finances of charter schools whose charters are held directly by a government or a government agency. Charter schools whose charters are held by nongovernmental entities are deemed to be out of scope for the Survey of School System Finances.
Source: U.S. Census Bureau, 2012 Census of Governments: Finance—Survey of School System Finances. Data are not subject to sampling error, but for information on nonsampling error and defini-tions, see introductory text. Data users who create their own estimates from these tables should cite the U.S. Census Bureau as the source of the original data only.

Public Ed
ucatio
n Fin
ances: 2
01
2
11
U
.S. Cen
sus Bu
reau
Table 11. States Ranked According to Per Pupil Public Elementary-Secondary School System Finance Amounts: Fiscal Year 2012(In dollars. Detail may not add to total because of rounding. For meaning of abbreviations and symbols, see footnotes)
Rank
Elementary-secondary revenue Current spending
State Total State
From federal
sources State
From state
sources State
From local
sources State Total1
Instruction
State
Generaladminis-
tration State
Schooladminis-
trationState Total1 State Salaries StateEmployee
benefitsUS 12,331 US 1,235 US 5,609 US 5,488 US 10,608 US 6,430 US 4,287 US 1,573 US 202 US 577
1. . . . . . . . . DC 29,831 DC 3,087 VT 15,600 DC 26,744 NY 19,552 NY 13,582 DC 8,662 NY 4,233 DC 904 DC 1,9462. . . . . . . . . NY 22,238 AK 2,692 HI 11,829 NY 11,988 DC 17,468 DC 10,635 NY 8,313 AK 3,512 ME 511 VT 1,1373. . . . . . . . . NJ 20,008 LA 2,296 AK 11,531 NJ 11,158 AK 17,390 CT 10,078 NJ 6,704 CT 2,956 ND 507 AK 1,0574. . . . . . . . . CT 18,886 HI 1,744 WY 9,466 CT 10,761 NJ 17,266 NJ 9,964 CT 6,573 DE 2,678 IL 501 MD 9975. . . . . . . . . WY 18,446 SD 1,665 DE 9,189 MA 9,148 CT 16,274 VT 9,668 VT 6,392 NJ 2,605 NH 465 CT 961
6. . . . . . . . . AK 18,226 ND 1,641 NY 8,824 PA 8,967 VT 16,040 AK 9,603 WY 6,121 RI 2,514 PA 387 NJ 8587. . . . . . . . . VT 17,873 MS 1,621 MN 8,306 RI 8,815 WY 15,897 WY 9,398 MA 5,916 WY 2,479 NJ 355 WY 8578. . . . . . . . . MA 16,930 WY 1,608 AR 8,037 NH 8,625 MA 14,142 DE 8,832 RI 5,829 MD 2,450 VT 351 NH 7589. . . . . . . . . MD 16,103 DE 1,549 NJ 7,819 MD 8,091 RI 14,005 MA 8,665 NH 5,428 VT 2,374 CT 341 DE 74610. . . . . . . . PA 16,085 WV 1,532 IN 7,413 IL 8,004 DE 13,865 NH 8,664 MD 5,425 NH 2,346 WY 330 HI 736
11. . . . . . . . RI 15,974 MT 1,506 NM 7,244 WY 7,372 MD 13,609 MD 8,364 DE 5,384 MA 2,338 NY 328 NY 71712. . . . . . . . DE 15,301 NM 1,496 CT 7,150 NE 7,175 NH 13,593 RI 8,322 PA 5,304 PA 2,142 MN 321 RI 69613. . . . . . . . NH 15,002 RI 1,490 WV 7,140 ME 6,961 PA 13,340 PA 8,135 AK 5,136 WV 2,140 NE 321 ME 68014. . . . . . . . IL 14,074 KY 1,442 MD 7,005 OH 6,556 ME 12,189 NE 7,470 ND 4,872 MI 2,057 MT 317 LA 64415. . . . . . . . WV 14,033 NY 1,427 MI 6,893 VA 6,174 HI 12,054 IL 7,106 MN 4,863 IL 1,970 WI 311 MA 625
16. . . . . . . . HI 13,875 CA 1,418 ND 6,748 WI 5,987 IL 12,015 MN 7,093 ME 4,830 WI 1,898 OH 303 IL 61917. . . . . . . . ME 13,649 VT 1,415 MA 6,721 IA 5,736 ND 11,679 ND 7,030 NE 4,817 ME 1,892 MO 298 VA 61718. . . . . . . . OH 13,511 AR 1,401 WA 6,701 MO 5,419 WV 11,445 ME 7,020 IL 4,614 LA 1,888 SD 283 WV 60819. . . . . . . . ND 13,368 MI 1,313 KS 6,535 SD 5,392 LA 11,379 HI 6,912 VA 4,495 IN 1,870 LA 269 CA 60520. . . . . . . . MN 13,163 PA 1,304 CA 5,870 WV 5,361 NE 11,275 WV 6,714 HI 4,460 OR 1,758 IA 255 OR 604
21. . . . . . . . LA 12,698 ME 1,282 PA 5,813 LA 5,009 OH 11,204 LA 6,560 OH 4,357 NE 1,588 AK 254 OH 60322. . . . . . . . WI 12,582 TX 1,267 KY 5,751 ND 4,980 WI 11,042 WI 6,523 IA 4,310 MN 1,563 MS 253 NV 59823. . . . . . . . MI 12,433 TN 1,260 OH 5,725 CO 4,937 MI 10,855 VA 6,456 WI 4,262 HI 1,557 KS 252 CO 58124. . . . . . . . NE 12,267 NC 1,252 RI 5,670 GA 4,936 MN 10,796 MI 6,382 LA 4,173 ND 1,550 OK 249 IA 57825. . . . . . . . IA 12,175 OH 1,231 NV 5,603 TX 4,928 VA 10,656 MT 6,245 MT 4,148 OH 1,521 WV 226 MT 577
26. . . . . . . . IN 12,063 NE 1,216 WI 5,544 SC 4,806 MT 10,464 IA 6,196 WV 3,963 VA 1,514 AR 224 MI 57627. . . . . . . . VA 11,686 SC 1,185 IA 5,407 FL 4,650 IA 10,038 OH 6,183 MO 3,961 IA 1,414 KY 213 ND 56828. . . . . . . . KS 11,557 IL 1,173 ME 5,406 DE 4,563 KS 9,748 KS 6,040 GA 3,950 GA 1,332 MD 197 KS 56729. . . . . . . . WA 11,358 OK 1,164 NH 5,395 MT 4,480 IN 9,719 GA 5,693 MI 3,875 KY 1,309 MA 195 GA 55930. . . . . . . . MT 11,336 FL 1,154 LA 5,392 OR 4,389 WA 9,637 MO 5,661 KY 3,825 CA 1,287 AL 194 PA 558
31. . . . . . . . MO 11,139 GA 1,116 OR 5,363 MI 4,227 OR 9,490 IN 5,618 KS 3,810 WA 1,269 IN 189 WA 55832. . . . . . . . SC 11,003 AZ 1,114 MT 5,350 AZ 4,215 MO 9,436 WA 5,615 WA 3,797 NV 1,240 NM 188 IN 55233. . . . . . . . AR 10,830 MO 1,113 AL 5,303 KS 4,178 AR 9,411 CA 5,515 TX 3,791 MT 1,218 RI 185 WI 54934. . . . . . . . CA 10,732 IN 1,090 NC 5,231 AK 4,003 KY 9,391 OR 5,500 CA 3,645 KS 1,207 MI 175 SC 54835. . . . . . . . OR 10,724 VA 1,086 SC 5,011 MN 3,932 GA 9,247 KY 5,423 AR 3,635 AL 1,172 TN 175 MO 546
36. . . . . . . . NM 10,584 MA 1,061 IL 4,896 TN 3,678 CA 9,183 AR 5,350 SC 3,597 MO 1,152 DE 175 NE 54637. . . . . . . . KY 10,547 AL 1,061 ID 4,631 WA 3,646 SC 9,147 TN 5,158 NM 3,594 TN 1,142 VA 165 KY 53338. . . . . . . . GA 10,518 WI 1,051 MO 4,607 IN 3,559 NM 8,899 SC 5,153 IN 3,584 SC 1,139 CO 143 AL 52939. . . . . . . . TX 10,282 IA 1,033 MS 4,475 CA 3,444 AL 8,562 NC 5,144 NC 3,569 NC 1,114 ID 141 NM 52340. . . . . . . . CO 10,165 NJ 1,031 GA 4,466 KY 3,354 CO 8,548 NM 5,138 CO 3,516 UT 1,094 OR 127 NC 509
41. . . . . . . . SD 10,149 WA 1,012 VA 4,426 OK 3,284 SD 8,446 FL 5,100 SD 3,467 NM 1,074 NV 123 AR 47542. . . . . . . . AL 9,582 MD 1,007 CO 4,391 AL 3,218 FL 8,372 SD 5,027 TN 3,441 AR 999 GA 122 TN 47043. . . . . . . . NV 9,457 ID 995 OK 4,320 MS 3,008 TN 8,294 AL 4,959 AL 3,279 MS 965 TX 122 MS 47044. . . . . . . . MS 9,104 NH 981 TX 4,087 UT 2,940 TX 8,261 CO 4,944 MS 3,252 SD 964 WA 109 FL 46445. . . . . . . . FL 9,077 CT 975 TN 4,023 NV 2,912 NV 8,223 TX 4,934 OR 3,242 ID 953 SC 95 TX 464
46. . . . . . . . TN 8,961 OR 972 UT 3,896 NC 2,263 NC 8,200 NV 4,782 NV 3,185 OK 935 NC 89 MN 42747. . . . . . . . OK 8,767 NV 942 NE 3,876 NM 1,844 MS 8,164 MS 4,670 FL 3,169 CO 897 CA 88 SD 41748. . . . . . . . NC 8,746 MN 925 FL 3,273 ID 1,780 AZ 7,559 AZ 4,156 AZ 3,112 DC 889 AZ 85 OK 41549. . . . . . . . AZ 8,347 KS 844 SD 3,093 AR 1,392 OK 7,466 OK 4,065 OK 2,849 FL 857 FL 74 UT 38450. . . . . . . . UT 7,607 CO 837 AZ 3,018 VT 858 ID 6,659 ID 4,012 ID 2,802 AZ 693 UT 63 ID 38251. . . . . . . . ID 7,405 UT 770 DC X HI 301 UT 6,206 UT 3,903 UT 2,397 TX 633 HI 58 AZ 316
X Not applicable.1 Includes amounts not shown separately.Note: See Appendix B for a description of state-specific reporting anomalies. Revenue from and payments to other school systems are excluded to avoid double counting. Expenditures for adult education, community services, and other nonelementary-
secondary programs are also excluded. Some data appear under local sources for Hawaii’s state-operated school system for consistency with data presented for all other school systems. Enrollments used to calculate per pupil amounts represent fall 2011 memberships collected by the National Center for Education Statistics on the Common Core of Data (CCD) agency universe file—“Local Education Agency (School District) Universe Survey: 2011–12, Provisional Version 1a.” Enrollments for state educational facilities, federal school systems, and charter schools whose charters are held by a nongovernmental entity have been excluded. Enrollments from the CCD agency universe file were subject to adjustment if the enrollments were inconsistent with the finances reported. Survey of School System Finances statistics include the finances of charter schools whose charters are held directly by a government or a government agency. Charter schools whose charters are held by nongovernmental entities are deemed to be out of scope for the Survey of School System Finances.
Source: U.S. Census Bureau, 2012 Census of Governments: Finance—Survey of School System Finances. Data are not subject to sampling error, but for information on nonsampling error and definitions, see introductory text. Data users who create their own estimates from these tables should cite the U.S. Census Bureau as the source of the original data only.

12
Pu
blic Ed
ucatio
n Fin
ances: 2
01
2
U
.S. Cen
sus Bu
reau
Table 12. States Ranked According to Relation of Public Elementary-Secondary School System Finance Amounts to $1,000 Personal Income: Fiscal Year 2012(In dollars. Detail may not add to total because of rounding. For meaning of abbreviations and symbols, see footnotes)
Rank
Elementary-secondary revenue Current spending
State Total State
From federal
sources State
From state
sources State
From local
sources State Total1
Instruction
State
Generaladminis-
tration State
Schooladminis-
trationState Total1 State Salaries StateEmployee
benefitsUS 45 .11 US 4 .52 US 20 .52 US 20 .07 US 39 .30 US 24 .02 US 15 .68 US 5 .76 US 0 .74 US 2 .11
1. . . . . . . . . . . . AK 68.44 AK 10.11 VT 51.04 NJ 31.50 AK 65.30 NY 37.96 NY 21.69 AK 13.19 ME 1.85 AK 3.972. . . . . . . . . . . . WV 63.10 LA 8.65 AK 43.30 NY 31.29 VT 54.48 AK 36.06 VT 20.91 NY 11.05 IL 1.83 VT 3.723. . . . . . . . . . . . WY 59.46 MS 8.30 AR 38.23 IL 29.23 NY 53.54 VT 33.63 WY 19.73 WV 9.62 ND 1.53 MD 2.784. . . . . . . . . . . . VT 58.47 WV 6.89 HI 35.96 CT 27.14 WV 51.46 NJ 30.76 AK 19.28 DE 8.17 NH 1.41 WY 2.765. . . . . . . . . . . . NY 58.04 NM 6.80 NM 32.93 NE 26.85 NJ 51.37 WY 30.29 NJ 18.93 MI 7.99 MS 1.29 WV 2.73
6. . . . . . . . . . . . NJ 56.49 AR 6.66 WV 32.10 PA 26.42 WY 51.24 WV 30.19 GA 18.48 WY 7.99 MT 1.23 GA 2.617. . . . . . . . . . . . AR 51.51 KY 6.52 IN 31.51 NH 26.26 ME 45.39 NE 27.95 NE 18.03 IN 7.95 NE 1.20 NV 2.528. . . . . . . . . . . . IL 51.40 MT 5.85 WY 30.51 DC 25.88 AR 44.79 RI 27.14 WV 17.82 VT 7.77 MO 1.17 ME 2.469. . . . . . . . . . . . IN 51.27 TX 5.83 DE 28.04 RI 25.83 IL 44.19 DE 27.09 ME 17.51 CT 7.45 WI 1.16 SC 2.4610. . . . . . . . . . . ME 49.48 SD 5.76 MN 27.52 ME 25.23 RI 43.80 GA 26.93 TX 17.43 RI 7.37 VT 1.15 LA 2.42
11. . . . . . . . . . . OH 49.39 SC 5.31 MI 26.79 WV 24.10 GA 43.56 ME 26.65 AR 17.29 NJ 7.35 PA 1.14 NJ 2.4212. . . . . . . . . . . SC 49.30 HI 5.30 KS 26.27 OH 23.96 LA 42.86 CT 26.48 KY 17.29 IL 7.19 OK 1.12 CT 2.4213. . . . . . . . . . . GA 49.20 TN 5.29 KY 25.99 WY 23.76 OH 42.70 NH 26.41 RI 17.08 NH 7.14 OH 1.11 KY 2.4114. . . . . . . . . . . MI 48.31 OK 5.24 NV 23.61 MA 23.56 KY 42.45 IL 26.26 IL 16.85 LA 7.11 AR 1.07 MS 2.4015. . . . . . . . . . . NM 48.11 CA 5.22 AL 23.53 GA 23.09 DE 42.45 AR 25.48 MS 16.64 WI 7.06 WY 1.07 NM 2.38
16. . . . . . . . . . . LA 47.82 GA 5.22 ID 23.40 TX 22.66 NE 42.19 MI 24.80 CT 16.58 ME 6.86 MN 1.06 IN 2.3517. . . . . . . . . . . KY 47.67 NC 5.20 WA 23.10 MD 22.58 MI 42.18 LA 24.71 NH 16.53 MD 6.84 WV 1.02 AL 2.3518. . . . . . . . . . . CT 47.63 WY 5.18 NY 23.03 WI 22.27 CT 42.10 MA 24.57 DE 16.43 OR 6.82 LA 1.01 OR 2.3519. . . . . . . . . . . PA 47.38 MI 5.10 MS 22.91 IA 21.86 MS 41.79 KY 24.51 IA 16.42 PA 6.31 KS 1.01 NH 2.3120. . . . . . . . . . . TX 47.28 ID 5.02 SC 22.45 SC 21.54 NH 41.42 OH 24.35 NM 16.34 UT 6.30 NJ 1.00 KS 2.28
21. . . . . . . . . . . RI 46.82 ND 4.95 UT 22.44 MO 21.20 SC 41.37 KS 24.30 SC 16.12 GA 6.23 SD 0.98 DE 2.2822. . . . . . . . . . . WI 46.80 DE 4.73 NJ 22.08 VA 20.32 IN 41.33 WI 24.26 MN 16.11 MA 6.02 IA 0.97 IL 2.2623. . . . . . . . . . . DE 46.69 AL 4.71 NC 21.70 LA 18.87 WI 41.07 MT 24.25 MT 16.11 NE 5.94 KY 0.96 AR 2.2624. . . . . . . . . . . MS 46.60 ME 4.65 CA 21.63 SD 18.65 MT 40.63 PA 24.09 OH 15.93 KY 5.92 AK 0.96 MT 2.2425. . . . . . . . . . . KS 46.46 IN 4.63 OH 20.93 CO 18.41 NM 40.46 MS 23.90 WI 15.85 OH 5.56 DC 0.87 HI 2.24
26. . . . . . . . . . . IA 46.39 VT 4.63 GA 20.89 MT 17.39 PA 39.42 IN 23.90 LA 15.72 IA 5.39 AL 0.86 MI 2.2427. . . . . . . . . . . NE 45.90 AZ 4.58 OR 20.81 AZ 17.33 KS 39.21 IA 23.61 PA 15.63 NV 5.23 CT 0.86 CA 2.2328. . . . . . . . . . . NH 45.68 NE 4.55 MT 20.78 OR 17.03 MA 38.68 MN 23.50 MO 15.50 AL 5.20 NY 0.86 UT 2.2129. . . . . . . . . . . MD 44.93 OH 4.50 WI 20.62 UT 16.93 IA 38.25 SC 23.47 KS 15.32 MN 5.18 NM 0.85 OH 2.2130. . . . . . . . . . . MT 44.02 UT 4.44 IA 20.60 KS 16.80 AL 38.01 NM 23.36 MA 15.24 SC 5.10 IN 0.80 IA 2.20
31. . . . . . . . . . . UT 43.81 RI 4.37 ND 20.36 MI 16.43 TX 37.99 MD 23.34 IN 15.24 VA 4.98 TN 0.74 CO 2.1732. . . . . . . . . . . MN 43.62 MO 4.36 LA 20.31 FL 16.24 MD 37.97 TX 22.69 MD 15.14 MS 4.94 ID 0.71 MO 2.1433. . . . . . . . . . . MA 43.61 IL 4.28 ME 19.60 TN 15.46 OR 37.75 UT 22.48 MI 15.06 NM 4.88 MI 0.68 TX 2.1334. . . . . . . . . . . MO 43.59 FL 4.03 MD 19.54 MS 15.40 MO 36.92 OR 22.26 NC 14.81 KS 4.85 GA 0.57 NC 2.1135. . . . . . . . . . . AL 42.52 NV 3.97 OK 19.46 KY 15.16 HI 36.65 MO 22.15 VA 14.80 ID 4.81 TX 0.56 NE 2.04
36. . . . . . . . . . . HI 42.18 IA 3.94 TX 18.80 IN 15.13 MN 35.77 AL 22.02 ND 14.70 TN 4.80 MD 0.55 WI 2.0437. . . . . . . . . . . OR 41.61 WI 3.91 CT 18.03 AK 15.03 UT 35.74 TN 21.68 AL 14.55 AR 4.75 VA 0.54 RI 2.0438. . . . . . . . . . . ND 40.33 PA 3.84 MO 18.03 ND 15.03 ND 35.24 NC 21.34 TN 14.46 CA 4.74 RI 0.54 VA 2.0339. . . . . . . . . . . NV 39.84 OR 3.77 IL 17.88 OK 14.79 VA 35.09 VA 21.27 ID 14.16 HI 4.74 DE 0.53 TN 1.9840. . . . . . . . . . . CA 39.55 NY 3.72 MA 17.31 AL 14.28 TN 34.86 ND 21.21 UT 13.81 MT 4.73 CO 0.53 ID 1.93
41. . . . . . . . . . . OK 39.50 VA 3.58 PA 17.12 DE 13.92 NV 34.64 HI 21.02 HI 13.56 ND 4.68 NV 0.52 WA 1.9242. . . . . . . . . . . WA 39.16 WA 3.49 TN 16.91 MN 13.03 NC 34.02 CA 20.33 CA 13.43 NC 4.62 MA 0.50 DC 1.8843. . . . . . . . . . . VA 38.47 KS 3.39 RI 16.62 CA 12.69 OK 33.89 ID 20.27 NV 13.42 MO 4.51 OR 0.49 NY 1.8744. . . . . . . . . . . CO 37.92 CO 3.12 NH 16.43 WA 12.57 CA 33.84 NV 20.15 CO 13.12 WA 4.38 SC 0.43 OK 1.8745. . . . . . . . . . . TN 37.66 MN 3.07 CO 16.38 NV 12.27 ID 33.64 WA 19.36 WA 13.09 OK 4.21 WA 0.38 ND 1.71
46. . . . . . . . . . . ID 37.41 NH 2.99 VA 14.57 NC 9.39 WA 33.22 OK 18.56 OK 12.83 CO 3.35 NC 0.37 PA 1.6447. . . . . . . . . . . NC 36.28 DC 2.99 NE 14.50 ID 8.99 CO 31.91 CO 18.47 AZ 12.80 SD 3.33 UT 0.36 FL 1.6248. . . . . . . . . . . SD 35.10 NJ 2.91 AZ 12.41 NM 8.38 AZ 31.09 FL 17.81 OR 12.58 FL 2.99 AZ 0.35 MA 1.6149. . . . . . . . . . . AZ 34.33 MD 2.81 FL 11.43 AR 6.62 SD 29.40 SD 17.57 SD 11.99 TX 2.91 CA 0.32 SD 1.4450. . . . . . . . . . . FL 31.70 MA 2.73 SD 10.70 VT 2.81 FL 29.24 AZ 17.09 FL 11.07 AZ 2.85 FL 0.26 MN 1.4151. . . . . . . . . . . DC 28.87 CT 2.46 DC X HI 0.92 DC 19.50 DC 12.89 DC 8.38 DC 0.86 HI 0.18 AZ 1.30
X Not applicable.1 Includes amounts not shown separately.Note: See Appendix B for a description of state-specific reporting anomalies. Revenue from and payments to other school systems are excluded to avoid double counting. Expenditures for adult education, community services, and other nonelementary-
secondary programs are also excluded. Some data appear under local sources for Hawaii’s state-operated school system for consistency with data presented for all other school systems. Data used to calculate rankings is from the U.S. Department of Commerce, Bureau of Economic Analysis; Internet release date (for revised state personal income estimates): March 25, 2014 (2011 data). Survey of School System Finances statistics include the finances of charter schools whose charters are held directly by a government or a government agency. Charter schools whose charters are held by nongovernmental entities are deemed to be out of scope for the Survey of School System Finances.
Source: U.S. Census Bureau, 2012 Census of Governments: Finance—Survey of School System Finances. Data are not subject to sampling error, but for information on nonsampling error and definitions, see introductory text. Data users who create their own estimates from these tables should cite the U.S. Census Bureau as the source of the original data only.

Public Education Finances: 2012 13 U.S. Census Bureau
Table 13. Public Elementary-Secondary School System Finances by Enrollment-Size Groups: Fiscal Year 2012(In thousands of dollars. Detail may not add to total because of rounding)
ItemAll
schoolsystems
School systems with enrollment of: 50,000 or
more25,000 to
49,99915,000 to
24,9997,500 to14,999
5,000 to 7,499
3,000 to4,999
Under 3,000
Fall Enrollment, 2011 . . . . . . . . . . 48,212,483 10,350,850 6,613,508 4,910,986 7,126,775 4,289,319 5,448,895 9,472,150
Elementary-secondary revenue . . . . . . . . . . . 594,531,633 126,664,607 71,951,729 53,382,212 83,775,643 54,698,316 70,675,500 133,383,626 From federal sources . . . . . . . . . . . . . . . . . . 59,532,214 14,679,461 8,046,244 5,510,520 7,860,601 4,540,065 5,651,194 13,244,129 Through state . . . . . . . . . . . . . . . . . . . . . . . 55,191,467 13,759,003 7,575,306 5,228,715 7,179,984 4,256,796 5,318,113 11,873,550 Child nutrition programs . . . . . . . . . . . . . . 12,960,376 3,139,384 1,888,420 1,370,210 1,820,529 1,046,726 1,298,372 2,396,735 Other and nonspecified . . . . . . . . . . . . . . 42,231,091 10,619,619 5,686,886 3,858,505 5,359,455 3,210,070 4,019,741 9,476,815 Direct . . . . . . . . . . . . . . . . . . . . . . . . . . . . . 4,340,747 920,458 470,938 281,805 680,617 283,269 333,081 1,370,579
From state sources . . . . . . . . . . . . . . . . . . . 270,431,959 53,393,137 34,867,271 27,443,697 40,223,195 23,214,556 30,067,340 61,222,763 General formula assistance . . . . . . . . . . . . 185,647,596 34,127,561 25,131,432 19,617,211 28,586,646 16,161,851 20,346,629 41,676,266 Compensatory programs . . . . . . . . . . . . . . 4,935,329 1,190,683 806,105 647,068 800,784 333,089 411,187 746,413 Special education . . . . . . . . . . . . . . . . . . . . 16,780,046 4,018,379 1,734,673 1,318,387 1,950,035 1,422,736 2,083,755 4,252,081 Staff improvement programs . . . . . . . . . . . 3,243,235 516,425 331,858 368,358 516,016 327,196 435,461 747,921 Vocational programs. . . . . . . . . . . . . . . . . . 823,187 170,768 103,204 75,269 91,805 52,391 75,644 254,106 Capital outlay and debt service programs . 6,600,733 1,205,650 813,633 617,029 1,030,235 539,019 799,110 1,596,057 Transportation . . . . . . . . . . . . . . . . . . . . . . 3,981,206 597,184 415,695 334,283 553,823 350,995 530,220 1,199,006 Other . . . . . . . . . . . . . . . . . . . . . . . . . . . . . 32,935,726 9,420,698 3,866,973 3,147,618 4,312,653 2,390,334 3,224,611 6,572,839 Payments on behalf of LEA . . . . . . . . . . . . 13,850,061 1,792,661 1,532,137 1,213,460 2,233,738 1,484,977 1,983,429 3,609,659 Nonspecified . . . . . . . . . . . . . . . . . . . . . . . 1,634,840 353,128 131,561 105,014 147,460 151,968 177,294 568,415
From local sources. . . . . . . . . . . . . . . . . . . . 264,567,460 58,592,009 29,038,214 20,427,995 35,691,847 26,943,695 34,956,966 58,916,734 Taxes1 . . . . . . . . . . . . . . . . . . . . . . . . . . . . . 180,976,873 29,683,873 20,276,989 14,866,899 26,062,316 20,437,890 26,042,473 43,606,433 Property taxes . . . . . . . . . . . . . . . . . . . . . 172,684,684 28,252,705 18,712,602 14,096,254 24,758,341 19,733,403 25,045,798 42,085,581 Contributions from parent government . . . 47,389,798 22,002,798 4,663,737 2,552,772 4,663,773 3,439,873 4,733,501 5,333,344 From other local governments . . . . . . . . . . 6,743,638 658,186 875,036 533,667 849,839 563,280 870,704 2,392,926 Current charges1 . . . . . . . . . . . . . . . . . . . . 14,625,225 2,412,076 1,688,101 1,273,889 2,024,223 1,323,076 1,769,545 4,134,315 Tuition and transportation . . . . . . . . . . . . . 1,277,654 170,192 136,671 143,504 150,345 120,631 146,411 409,900 School lunch . . . . . . . . . . . . . . . . . . . . . . . 6,318,581 932,493 730,118 594,286 987,303 668,332 852,013 1,554,036 Other . . . . . . . . . . . . . . . . . . . . . . . . . . . . . 14,831,926 3,835,076 1,534,351 1,200,768 2,091,696 1,179,576 1,540,743 3,449,716
Elementary-secondary expenditure . . . . . . . . 593,818,290 128,878,480 72,204,465 54,143,533 82,936,892 53,975,685 69,190,085 132,489,150 Current spending . . . . . . . . . . . . . . . . . . . . . 523,962,696 112,411,828 62,973,604 46,957,143 73,513,216 48,083,824 61,848,668 118,174,413
By function: Instruction. . . . . . . . . . . . . . . . . . . . . . . . . 316,590,722 71,141,188 38,074,974 28,089,460 44,301,969 29,243,372 37,359,786 68,379,973 Support services . . . . . . . . . . . . . . . . . . . 179,847,953 35,399,206 21,460,791 16,220,942 25,214,158 16,508,284 21,437,396 43,607,176 Pupil support services . . . . . . . . . . . . . . 29,150,652 4,708,423 3,638,401 2,825,146 4,471,307 2,843,835 3,597,200 7,066,340 Instructional staff support . . . . . . . . . . . . 23,691,363 5,134,446 3,141,329 2,201,038 3,214,013 1,987,669 2,679,261 5,333,607 General administration . . . . . . . . . . . . . . 9,738,230 1,086,132 727,476 518,270 1,037,011 895,027 1,309,120 4,165,194 School administration . . . . . . . . . . . . . . . 27,831,370 5,857,625 3,658,885 2,701,162 4,051,380 2,507,369 3,186,211 5,868,738 Operation and maintenance of plant . . . 48,229,390 10,318,836 5,802,433 4,408,080 6,808,480 4,478,532 5,708,146 10,704,883 Pupil transportation . . . . . . . . . . . . . . . . 23,125,285 4,569,697 2,455,817 1,846,961 3,168,311 2,232,474 2,957,836 5,894,189 Other and nonspecified . . . . . . . . . . . . . 18,081,663 3,724,047 2,036,450 1,720,285 2,463,656 1,563,378 1,999,622 4,574,225 Other current spending . . . . . . . . . . . . . . 27,524,021 5,871,434 3,437,839 2,646,741 3,997,089 2,332,168 3,051,486 6,187,264
By selected objects: Total salaries and wages1 . . . . . . . . . . . . . 305,537,352 64,347,640 38,091,709 28,249,236 43,618,407 28,312,108 36,170,096 66,748,156 Instructional salaries . . . . . . . . . . . . . . . 206,693,906 44,263,755 25,431,588 18,897,954 29,512,916 19,378,307 24,743,516 44,465,870 Support services salaries . . . . . . . . . . . . 89,362,146 17,920,027 11,410,022 8,437,099 12,702,175 8,131,357 10,438,467 20,322,999 Total employee benefits1 . . . . . . . . . . . . . . 113,936,694 23,881,044 12,988,159 10,181,709 16,336,696 10,887,795 13,894,140 25,767,151 Instructional benefits . . . . . . . . . . . . . . . 75,855,525 16,762,250 8,395,682 6,592,670 10,723,410 7,291,744 9,293,816 16,795,953 Support services benefits . . . . . . . . . . . . 34,289,655 6,406,311 4,020,642 3,189,961 5,018,040 3,280,523 4,219,529 8,154,649
Capital outlay . . . . . . . . . . . . . . . . . . . . . . . . 50,153,239 11,646,587 6,616,120 5,228,635 6,670,208 4,120,261 5,282,908 10,588,520 Construction . . . . . . . . . . . . . . . . . . . . . . . . 39,285,923 9,963,433 5,188,298 4,252,536 5,101,757 3,173,705 3,942,430 7,663,764 Equipment . . . . . . . . . . . . . . . . . . . . . . . . . 8,013,858 1,288,735 991,721 712,954 1,121,414 714,435 958,506 2,226,093 Instructional equipment only . . . . . . . . . . 2,021,247 270,933 243,115 165,444 266,717 194,477 260,619 619,942 Land and existing structures . . . . . . . . . . . 2,853,458 394,419 436,101 263,145 447,037 232,121 381,972 698,663
Interest on debt . . . . . . . . . . . . . . . . . . . . . . 17,951,538 4,547,930 2,551,911 1,902,049 2,546,576 1,559,827 1,886,675 2,956,570
Payments to other governments . . . . . . . . . 1,750,817 272,135 62,830 55,706 206,892 211,773 171,834 769,647
Debt outstanding . . . . . . . . . . . . . . . . . . . . . . 406,479,591 99,910,342 54,727,382 42,029,675 56,827,420 36,274,339 44,844,353 71,866,080 Long-term . . . . . . . . . . . . . . . . . . . . . . . . . . 398,785,343 98,366,915 53,822,337 41,676,026 55,843,976 35,480,664 43,911,218 69,684,207 Short-term . . . . . . . . . . . . . . . . . . . . . . . . . . 7,694,248 1,543,427 905,045 353,649 983,444 793,675 933,135 2,181,873
Long-term debt issued . . . . . . . . . . . . . . . . . . 48,161,434 8,984,776 6,541,248 4,600,730 6,503,865 4,297,923 6,353,021 10,879,871
Long-term debt retired . . . . . . . . . . . . . . . . . . 47,174,402 8,186,439 6,522,937 4,337,253 6,623,383 4,496,678 6,166,216 10,841,4961 Includes amounts not shown separately.Note: See Appendix B for a description of state-specific reporting anomalies. This information represents financial data for public independent and dependent school systems. It includes state
payments made on behalf of public school systems and excludes financial transactions of public nonschool entities. Expenditures for adult education, community services, and other nonelementary- secondary programs are included under “Current spending” and “Other current spending,” but are excluded from these categories in the per pupil data displayed in Table 14. Enrollments represent fall 2011 memberships collected by the National Center for Education Statistics on the Common Core of Data (CCD) agency universe file—“Local Education Agency (School District) Universe Survey: 2011–12, Provisional Version 1a.” Enrollments for state educational facilities, federal school systems, and charter schools whose charters are held by a nongovernmental entity have been excluded. Enrollments from the CCD agency file were subject to adjustment if the enrollments were inconsistent with the finances reported. Survey of School System Finances statistics include the finances of charter schools whose charters are held directly by a government or a government agency. Charter schools whose charters are held by nongovernmental entities are deemed to be out of scope for the Survey of School System Finances.
Source: U.S. Census Bureau, 2012 Census of Governments: Finance—Survey of School System Finances. Data are not subject to sampling error, but for information on nonsampling error and definitions, see introductory text. Data users who create their own estimates from these tables should cite the U.S. Census Bureau as the source of the original data only.
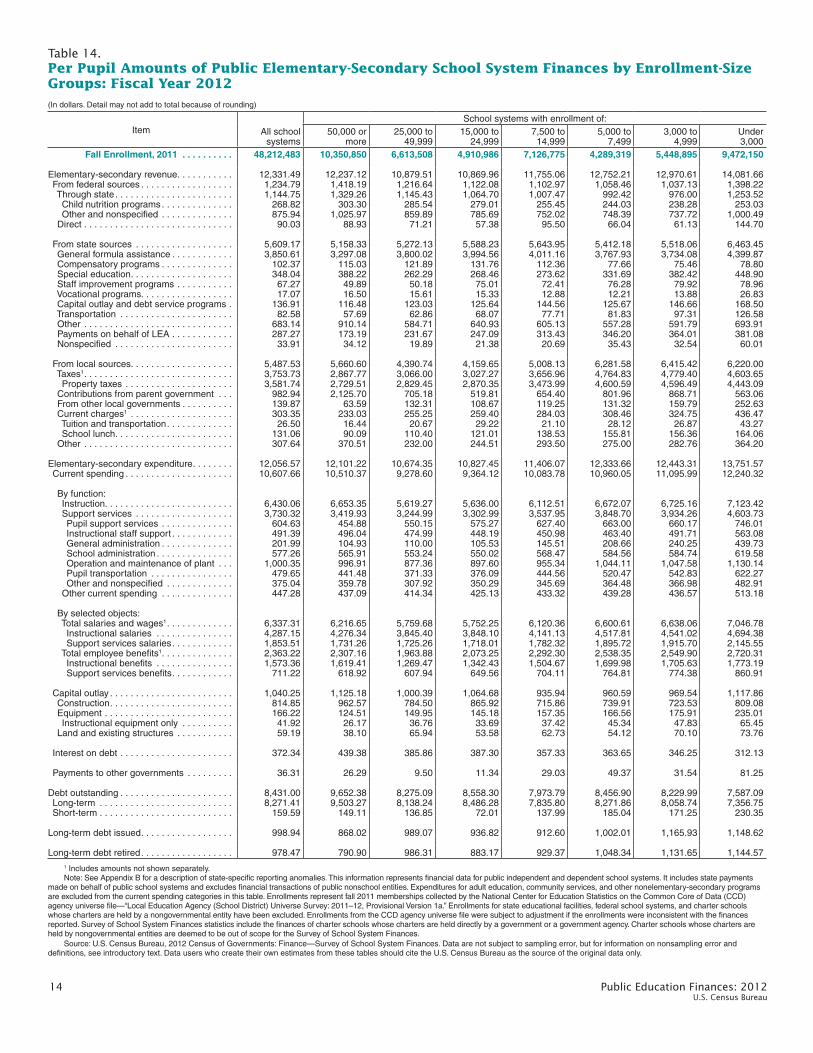
14 Public Education Finances: 2012 U.S. Census Bureau
Table 14. Per Pupil Amounts of Public Elementary-Secondary School System Finances by Enrollment-Size Groups: Fiscal Year 2012(In dollars. Detail may not add to total because of rounding)
Item All schoolsystems
School systems with enrollment of: 50,000 or
more25,000 to
49,99915,000 to
24,9997,500 to14,999
5,000 to 7,499
3,000 to4,999
Under 3,000
Fall Enrollment, 2011 . . . . . . . . . . 48,212,483 10,350,850 6,613,508 4,910,986 7,126,775 4,289,319 5,448,895 9,472,150
Elementary-secondary revenue . . . . . . . . . . . 12,331.49 12,237.12 10,879.51 10,869.96 11,755.06 12,752.21 12,970.61 14,081.66 From federal sources . . . . . . . . . . . . . . . . . . 1,234.79 1,418.19 1,216.64 1,122.08 1,102.97 1,058.46 1,037.13 1,398.22 Through state . . . . . . . . . . . . . . . . . . . . . . . 1,144.75 1,329.26 1,145.43 1,064.70 1,007.47 992.42 976.00 1,253.52 Child nutrition programs . . . . . . . . . . . . . . 268.82 303.30 285.54 279.01 255.45 244.03 238.28 253.03 Other and nonspecified . . . . . . . . . . . . . . 875.94 1,025.97 859.89 785.69 752.02 748.39 737.72 1,000.49 Direct . . . . . . . . . . . . . . . . . . . . . . . . . . . . . 90.03 88.93 71.21 57.38 95.50 66.04 61.13 144.70
From state sources . . . . . . . . . . . . . . . . . . . 5,609.17 5,158.33 5,272.13 5,588.23 5,643.95 5,412.18 5,518.06 6,463.45 General formula assistance . . . . . . . . . . . . 3,850.61 3,297.08 3,800.02 3,994.56 4,011.16 3,767.93 3,734.08 4,399.87 Compensatory programs . . . . . . . . . . . . . . 102.37 115.03 121.89 131.76 112.36 77.66 75.46 78.80 Special education . . . . . . . . . . . . . . . . . . . . 348.04 388.22 262.29 268.46 273.62 331.69 382.42 448.90 Staff improvement programs . . . . . . . . . . . 67.27 49.89 50.18 75.01 72.41 76.28 79.92 78.96 Vocational programs. . . . . . . . . . . . . . . . . . 17.07 16.50 15.61 15.33 12.88 12.21 13.88 26.83 Capital outlay and debt service programs . 136.91 116.48 123.03 125.64 144.56 125.67 146.66 168.50 Transportation . . . . . . . . . . . . . . . . . . . . . . 82.58 57.69 62.86 68.07 77.71 81.83 97.31 126.58 Other . . . . . . . . . . . . . . . . . . . . . . . . . . . . . 683.14 910.14 584.71 640.93 605.13 557.28 591.79 693.91 Payments on behalf of LEA . . . . . . . . . . . . 287.27 173.19 231.67 247.09 313.43 346.20 364.01 381.08 Nonspecified . . . . . . . . . . . . . . . . . . . . . . . 33.91 34.12 19.89 21.38 20.69 35.43 32.54 60.01
From local sources. . . . . . . . . . . . . . . . . . . . 5,487.53 5,660.60 4,390.74 4,159.65 5,008.13 6,281.58 6,415.42 6,220.00 Taxes1 . . . . . . . . . . . . . . . . . . . . . . . . . . . . . 3,753.73 2,867.77 3,066.00 3,027.27 3,656.96 4,764.83 4,779.40 4,603.65 Property taxes . . . . . . . . . . . . . . . . . . . . . 3,581.74 2,729.51 2,829.45 2,870.35 3,473.99 4,600.59 4,596.49 4,443.09 Contributions from parent government . . . 982.94 2,125.70 705.18 519.81 654.40 801.96 868.71 563.06 From other local governments . . . . . . . . . . 139.87 63.59 132.31 108.67 119.25 131.32 159.79 252.63 Current charges1 . . . . . . . . . . . . . . . . . . . . 303.35 233.03 255.25 259.40 284.03 308.46 324.75 436.47 Tuition and transportation . . . . . . . . . . . . . 26.50 16.44 20.67 29.22 21.10 28.12 26.87 43.27 School lunch . . . . . . . . . . . . . . . . . . . . . . . 131.06 90.09 110.40 121.01 138.53 155.81 156.36 164.06 Other . . . . . . . . . . . . . . . . . . . . . . . . . . . . . 307.64 370.51 232.00 244.51 293.50 275.00 282.76 364.20
Elementary-secondary expenditure . . . . . . . . 12,056.57 12,101.22 10,674.35 10,827.45 11,406.07 12,333.66 12,443.31 13,751.57 Current spending . . . . . . . . . . . . . . . . . . . . .
By function:
10,607.66
10,510.37 9,278.60 9,364.12 10,083.78 10,960.05 11,095.99 12,240.32
Instruction. . . . . . . . . . . . . . . . . . . . . . . . . 6,430.06 6,653.35 5,619.27 5,636.00 6,112.51 6,672.07 6,725.16 7,123.42 Support services . . . . . . . . . . . . . . . . . . . 3,730.32 3,419.93 3,244.99 3,302.99 3,537.95 3,848.70 3,934.26 4,603.73 Pupil support services . . . . . . . . . . . . . . 604.63 454.88 550.15 575.27 627.40 663.00 660.17 746.01 Instructional staff support . . . . . . . . . . . . 491.39 496.04 474.99 448.19 450.98 463.40 491.71 563.08 General administration . . . . . . . . . . . . . . 201.99 104.93 110.00 105.53 145.51 208.66 240.25 439.73 School administration . . . . . . . . . . . . . . . 577.26 565.91 553.24 550.02 568.47 584.56 584.74 619.58 Operation and maintenance of plant . . . 1,000.35 996.91 877.36 897.60 955.34 1,044.11 1,047.58 1,130.14 Pupil transportation . . . . . . . . . . . . . . . . 479.65 441.48 371.33 376.09 444.56 520.47 542.83 622.27 Other and nonspecified . . . . . . . . . . . . . 375.04 359.78 307.92 350.29 345.69 364.48 366.98 482.91 Other current spending . . . . . . . . . . . . . .
By selected objects:
447.28
437.09 414.34 425.13 433.32 439.28 436.57 513.18
Total salaries and wages1 . . . . . . . . . . . . . 6,337.31 6,216.65 5,759.68 5,752.25 6,120.36 6,600.61 6,638.06 7,046.78 Instructional salaries . . . . . . . . . . . . . . . 4,287.15 4,276.34 3,845.40 3,848.10 4,141.13 4,517.81 4,541.02 4,694.38 Support services salaries . . . . . . . . . . . . 1,853.51 1,731.26 1,725.26 1,718.01 1,782.32 1,895.72 1,915.70 2,145.55 Total employee benefits1 . . . . . . . . . . . . . . 2,363.22 2,307.16 1,963.88 2,073.25 2,292.30 2,538.35 2,549.90 2,720.31 Instructional benefits . . . . . . . . . . . . . . . 1,573.36 1,619.41 1,269.47 1,342.43 1,504.67 1,699.98 1,705.63 1,773.19 Support services benefits . . . . . . . . . . . . 711.22 618.92 607.94 649.56 704.11 764.81 774.38 860.91
Capital outlay . . . . . . . . . . . . . . . . . . . . . . . . 1,040.25 1,125.18 1,000.39 1,064.68 935.94 960.59 969.54 1,117.86 Construction . . . . . . . . . . . . . . . . . . . . . . . . 814.85 962.57 784.50 865.92 715.86 739.91 723.53 809.08 Equipment . . . . . . . . . . . . . . . . . . . . . . . . . 166.22 124.51 149.95 145.18 157.35 166.56 175.91 235.01 Instructional equipment only . . . . . . . . . . 41.92 26.17 36.76 33.69 37.42 45.34 47.83 65.45 Land and existing structures . . . . . . . . . . . 59.19 38.10 65.94 53.58 62.73 54.12 70.10 73.76
Interest on debt . . . . . . . . . . . . . . . . . . . . . . 372.34 439.38 385.86 387.30 357.33 363.65 346.25 312.13
Payments to other governments . . . . . . . . . 36.31 26.29 9.50 11.34 29.03 49.37 31.54 81.25
Debt outstanding . . . . . . . . . . . . . . . . . . . . . . 8,431.00 9,652.38 8,275.09 8,558.30 7,973.79 8,456.90 8,229.99 7,587.09 Long-term . . . . . . . . . . . . . . . . . . . . . . . . . . 8,271.41 9,503.27 8,138.24 8,486.28 7,835.80 8,271.86 8,058.74 7,356.75 Short-term . . . . . . . . . . . . . . . . . . . . . . . . . . 159.59 149.11 136.85 72.01 137.99 185.04 171.25 230.35
Long-term debt issued . . . . . . . . . . . . . . . . . . 998.94 868.02 989.07 936.82 912.60 1,002.01 1,165.93 1,148.62
Long-term debt retired . . . . . . . . . . . . . . . . . . 978.47 790.90 986.31 883.17 929.37 1,048.34 1,131.65 1,144.571 Includes amounts not shown separately.Note: See Appendix B for a description of state-specific reporting anomalies. This information represents financial data for public independent and dependent school systems. It includes state payments
made on behalf of public school systems and excludes financial transactions of public nonschool entities. Expenditures for adult education, community services, and other nonelementary-secondary programs are excluded from the current spending categories in this table. Enrollments represent fall 2011 memberships collected by the National Center for Education Statistics on the Common Core of Data (CCD) agency universe file—“Local Education Agency (School District) Universe Survey: 2011–12, Provisional Version 1a.” Enrollments for state educational facilities, federal school systems, and charter schools whose charters are held by a nongovernmental entity have been excluded. Enrollments from the CCD agency universe file were subject to adjustment if the enrollments were inconsistent with the finances reported. Survey of School System Finances statistics include the finances of charter schools whose charters are held directly by a government or a government agency. Charter schools whose charters are held by nongovernmental entities are deemed to be out of scope for the Survey of School System Finances.
Source: U.S. Census Bureau, 2012 Census of Governments: Finance—Survey of School System Finances. Data are not subject to sampling error, but for information on nonsampling error and definitions, see introductory text. Data users who create their own estimates from these tables should cite the U.S. Census Bureau as the source of the original data only.

Public Ed
ucatio
n Fin
ances: 2
01
2
U.S. C
ensu
s Bureau
15
Table 15. Revenue of the 100 Largest Public Elementary-Secondary School Systems in the United States by Enrollment: Fiscal Year 2012
(In thousands of dollars. Detail may not add to total because of rounding. For meaning of abbreviations and symbols, see footnotes)
Rank School system State
Enrollment1
Elementary-secondary revenue
Total
Federal sources State sources
Total Title ISpecial
educationChild
nutritionOther and
nonspecified Total
Generalformula
assistanceSpecial
education1 New York City . . . . . . . . . . . . . . . . . . . . New York 990,145 23,517,452 2,237,047 858,833 322,786 361,201 694,227 8,648,188 5,731,175 1,417,3152 Los Angeles Unified . . . . . . . . . . . . . . . California 659,639 8,314,608 1,251,529 443,698 157,315 240,598 409,918 5,002,708 2,495,922 372,5103 Chicago . . . . . . . . . . . . . . . . . . . . . . . . Illinois 403,004 5,760,419 892,899 325,057 93,229 182,835 291,778 2,245,498 1,835,557 04 Miami-Dade County . . . . . . . . . . . . . . . Florida 350,239 3,188,967 457,537 144,610 78,012 112,963 121,952 1,011,288 319,461 62,7145 Clark County . . . . . . . . . . . . . . . . . . . . Nevada 313,398 2,863,675 282,471 82,280 50,748 80,232 69,211 1,687,290 646,338 73,338
6 Broward County . . . . . . . . . . . . . . . . . . Florida 258,478 2,221,054 269,571 79,066 52,895 67,987 69,623 835,872 332,154 85,6577 Houston . . . . . . . . . . . . . . . . . . . . . . . . Texas 203,066 2,046,214 248,401 111,886 40,373 1,975 94,167 509,806 373,120 08 Hillsborough County . . . . . . . . . . . . . . Florida 197,041 1,803,776 291,908 66,290 48,526 64,738 112,354 847,219 353,039 107,4209 Hawaii Public Schools . . . . . . . . . . . . . Hawaii 182,706 2,535,038 318,728 59,405 41,724 51,160 166,439 2,161,254 939,498 418,30810 Orange County . . . . . . . . . . . . . . . . . . Florida 180,000 1,827,011 202,082 60,532 38,815 58,569 44,166 612,677 233,349 58,183
11 Fairfax County . . . . . . . . . . . . . . . . . . . Virginia 177,606 2,398,065 128,140 22,202 34,627 28,828 42,483 488,170 392,620 34,88712 Palm Beach County . . . . . . . . . . . . . . . Florida 176,901 1,710,762 180,910 61,111 38,208 47,956 33,635 324,304 59,640 17,49813 Gwinnett County . . . . . . . . . . . . . . . . . Georgia 162,370 1,574,463 138,288 30,741 26,735 54,861 25,951 686,817 660,855 014 Dallas . . . . . . . . . . . . . . . . . . . . . . . . . . Texas 157,575 1,677,871 251,377 88,086 27,235 72,697 63,359 466,566 368,791 015 Philadelphia . . . . . . . . . . . . . . . . . . . . . Pennsylvania 154,262 2,681,763 452,562 264,375 0 71,760 116,427 1,292,598 968,149 127,611
16 Wake County . . . . . . . . . . . . . . . . . . . . North Carolina 148,154 1,202,796 135,729 2,203 1,112 29,599 102,815 709,165 704,629 017 Montgomery County . . . . . . . . . . . . . . Maryland 146,459 2,854,888 109,485 20,301 31,700 27,269 30,215 759,591 322,005 45,76118 Charlotte/Mecklenburg . . . . . . . . . . . . North Carolina 141,728 1,209,892 156,055 3,797 576 42,805 108,877 670,885 656,901 019 San Diego Unified . . . . . . . . . . . . . . . . California 131,044 1,408,787 162,054 46,663 27,442 44,182 43,767 508,108 159,789 67,77020 Duval County . . . . . . . . . . . . . . . . . . . . Florida 125,429 1,084,243 156,609 45,153 39,764 36,093 35,599 457,677 211,841 55,997
21 Prince Georges County . . . . . . . . . . . . Maryland 123,833 2,065,364 145,794 37,217 29,999 41,036 37,542 1,017,616 493,467 54,84022 Memphis . . . . . . . . . . . . . . . . . . . . . . . Tennessee 110,952 1,194,046 247,241 82,926 27,715 49,512 87,088 463,916 438,727 023 Cypress-Fairbanks . . . . . . . . . . . . . . . . Texas 107,960 930,535 72,251 10,660 12,449 28,663 20,479 366,723 308,450 024 Cobb County . . . . . . . . . . . . . . . . . . . . Georgia 107,291 1,102,087 83,131 17,176 22,663 26,053 17,239 423,821 372,586 025 Baltimore County . . . . . . . . . . . . . . . . . Maryland 105,153 1,589,273 90,954 17,502 25,855 23,587 24,010 676,250 332,873 45,423
26 Pinellas County . . . . . . . . . . . . . . . . . . Florida 103,776 922,370 117,146 35,943 32,071 25,867 23,265 270,159 92,495 25,77227 Jefferson County . . . . . . . . . . . . . . . . . Kentucky 99,191 1,218,406 188,192 49,423 N 34,716 104,053 479,204 264,746 028 Northside . . . . . . . . . . . . . . . . . . . . . . . Texas 98,110 931,113 95,055 17,302 11,772 27,723 38,258 349,773 291,816 029 DeKalb County . . . . . . . . . . . . . . . . . . Georgia 98,088 1,041,282 113,519 35,292 12,737 38,534 26,956 373,258 343,788 030 Polk County . . . . . . . . . . . . . . . . . . . . . Florida 96,070 891,269 116,482 33,903 19,990 31,469 31,120 431,022 204,373 47,657
31 Albuquerque . . . . . . . . . . . . . . . . . . . . New Mexico 94,318 963,715 97,699 30,623 18,564 4 48,508 688,092 647,374 032 Fulton County . . . . . . . . . . . . . . . . . . . Georgia 92,604 1,134,739 73,056 21,441 16,592 21,644 13,379 327,708 279,242 033 Austin . . . . . . . . . . . . . . . . . . . . . . . . . . Texas 86,528 1,070,061 130,188 34,178 11,699 27,785 56,526 169,928 129,038 034 Jefferson County . . . . . . . . . . . . . . . . . Colorado 85,793 823,580 55,926 11,541 15,653 12,485 16,247 338,935 315,211 11,86835 Baltimore . . . . . . . . . . . . . . . . . . . . . . . Maryland 84,212 1,459,517 203,999 74,748 30,089 34,816 64,346 983,161 386,062 73,084
36 Lee County . . . . . . . . . . . . . . . . . . . . . Florida 83,895 765,065 91,712 22,710 18,737 27,616 22,649 199,089 54,581 16,12637 Long Beach Unified . . . . . . . . . . . . . . . California 83,691 837,323 144,082 40,111 15,721 27,661 60,589 540,531 356,357 42,37938 Fort Worth . . . . . . . . . . . . . . . . . . . . . . Texas 83,109 826,247 145,549 46,234 14,993 33,348 50,974 318,191 262,763 039 Prince William County . . . . . . . . . . . . . Virginia 81,937 960,967 64,039 9,467 24,113 18,676 11,783 394,638 298,796 35,79140 Denver . . . . . . . . . . . . . . . . . . . . . . . . . Colorado 80,890 967,307 140,975 54,942 17,656 26,459 41,918 270,703 236,043 13,485
41 Nashville-Davidson County . . . . . . . . . Tennessee 80,393 852,377 124,758 39,012 25,791 29,942 30,013 237,139 226,141 042 Milwaukee . . . . . . . . . . . . . . . . . . . . . . Wisconsin 79,130 1,189,747 221,083 106,849 26,957 35,133 52,144 633,933 531,926 54,06443 Anne Arundel County . . . . . . . . . . . . . Maryland 76,303 1,088,736 55,614 10,544 20,385 11,165 13,520 402,917 195,781 23,41244 Fresno Unified . . . . . . . . . . . . . . . . . . . California 74,235 759,074 139,111 66,664 15,516 33,321 23,610 511,214 312,669 36,48845 Guilford County . . . . . . . . . . . . . . . . . . North Carolina 74,086 769,588 90,219 5,346 338 23,368 61,167 382,738 377,661 0
46 Greenville County . . . . . . . . . . . . . . . . South Carolina 72,153 685,904 67,024 23,288 15,705 18,819 9,212 335,785 87,854 21,37047 Brevard County . . . . . . . . . . . . . . . . . . Florida 71,792 587,566 61,891 15,743 16,279 16,712 13,157 277,166 118,023 38,14148 Virginia Beach . . . . . . . . . . . . . . . . . . . Virginia 70,978 754,661 83,828 13,960 22,094 12,465 35,309 316,409 245,123 28,53549 Alpine . . . . . . . . . . . . . . . . . . . . . . . . . . Utah 69,639 473,421 46,224 6,758 15,436 11,455 12,575 273,197 169,651 22,03950 Fort Bend . . . . . . . . . . . . . . . . . . . . . . . Texas 69,449 619,643 54,351 7,871 9,233 11,513 25,734 219,685 181,281 0
See notes at end of table.

16
Pu
blic Ed
ucatio
n Fin
ances: 2
01
2
U
.S. Cen
sus Bu
reau
Table 15. Revenue of the 100 Largest Public Elementary-Secondary School Systems in the United States by Enrollment: Fiscal Year 2012—Con.
(In thousands of dollars. Detail may not add to total because of rounding. For meaning of abbreviations and symbols, see footnotes)
Rank School system State
Elementary-secondary revenue—Con.State sources—Con. Local sources
Transpor- tation
Other andnonspecified Total Total taxes
Propertytaxes
Parentgovernment
contributions
From cities andcounties
From other school
systems Charges Other1 New York City . . . . . . . . . . . . . . . . . . . . New York 0 1,499,698 12,632,217 X X 11,013,542 0 0 57,582 1,561,0932 Los Angeles Unified . . . . . . . . . . . . . . . California 77,752 2,056,524 2,060,371 1,633,191 1,633,191 X 39,005 48,560 91,020 248,5953 Chicago . . . . . . . . . . . . . . . . . . . . . . . . Illinois 0 409,941 2,622,022 2,352,137 2,352,137 X 0 12 8,370 261,5034 Miami-Dade County . . . . . . . . . . . . . . . Florida 8,900 620,213 1,720,142 1,529,248 1,497,192 X 0 422 148,425 42,0475 Clark County . . . . . . . . . . . . . . . . . . . . Nevada 0 967,614 893,914 826,802 826,106 X 1,214 185 31,498 34,215
6 Broward County . . . . . . . . . . . . . . . . . . Florida 13,019 405,042 1,115,611 961,868 961,868 X 0 524 119,010 34,2097 Houston . . . . . . . . . . . . . . . . . . . . . . . . Texas 0 136,686 1,288,007 1,182,256 1,182,256 X 0 0 13,984 91,7678 Hillsborough County . . . . . . . . . . . . . . Florida 21,484 365,276 664,649 538,405 514,766 X 0 0 60,415 65,8299 Hawaii Public Schools . . . . . . . . . . . . . Hawaii 56,964 746,484 55,056 X X 0 0 0 40,996 14,06010 Orange County . . . . . . . . . . . . . . . . . . Florida 11,409 309,736 1,012,252 881,534 710,708 X 0 0 67,225 63,493
11 Fairfax County . . . . . . . . . . . . . . . . . . . Virginia 0 60,663 1,781,755 X X 1,636,767 0 40,740 59,621 44,62712 Palm Beach County . . . . . . . . . . . . . . . Florida 3,076 244,090 1,205,548 1,047,333 1,047,289 X 0 3,081 121,266 33,86813 Gwinnett County . . . . . . . . . . . . . . . . . Georgia 0 25,962 749,358 661,149 515,720 X 56 701 50,086 37,36614 Dallas . . . . . . . . . . . . . . . . . . . . . . . . . . Texas 0 97,775 959,928 923,584 923,584 X 0 0 8,433 27,91115 Philadelphia . . . . . . . . . . . . . . . . . . . . . Pennsylvania 56,335 140,503 936,603 840,899 649,394 X 19,850 128 2,722 73,004
16 Wake County . . . . . . . . . . . . . . . . . . . . North Carolina 0 4,536 357,902 X X 314,412 0 0 31,549 11,94117 Montgomery County . . . . . . . . . . . . . . Maryland 35,211 356,614 1,985,812 X X 1,945,509 0 0 29,575 10,72818 Charlotte/Mecklenburg . . . . . . . . . . . . North Carolina 0 13,984 382,952 X X 330,999 0 0 32,838 19,11519 San Diego Unified . . . . . . . . . . . . . . . . California 9,578 270,971 738,625 620,610 620,610 X 32,383 17,017 16,123 52,49220 Duval County . . . . . . . . . . . . . . . . . . . . Florida 9,070 180,769 469,957 395,164 393,085 X 0 0 54,261 20,532
21 Prince Georges County . . . . . . . . . . . . Maryland 37,045 432,264 901,954 X X 843,172 0 0 27,904 30,87822 Memphis . . . . . . . . . . . . . . . . . . . . . . . Tennessee 0 25,189 482,889 X X 839 415,940 188 37,408 28,51423 Cypress-Fairbanks . . . . . . . . . . . . . . . . Texas 0 58,273 491,561 446,622 446,622 X 7 1,171 36,385 7,37624 Cobb County . . . . . . . . . . . . . . . . . . . . Georgia 0 51,235 595,135 527,616 396,845 X 1,509 0 57,698 8,31225 Baltimore County . . . . . . . . . . . . . . . . . Maryland 27,122 270,832 822,069 X X 800,850 0 3,139 14,987 3,093
26 Pinellas County . . . . . . . . . . . . . . . . . . Florida 4,024 147,868 535,065 490,038 490,011 X 0 396 31,124 13,50727 Jefferson County . . . . . . . . . . . . . . . . . Kentucky 21 214,437 551,010 520,753 400,301 X 410 404 15,488 13,95528 Northside . . . . . . . . . . . . . . . . . . . . . . . Texas 0 57,957 486,285 441,747 441,747 X 5,528 105 30,861 8,04429 DeKalb County . . . . . . . . . . . . . . . . . . Georgia 0 29,470 554,505 499,148 386,348 X 4,707 13 15,272 35,36530 Polk County . . . . . . . . . . . . . . . . . . . . . Florida 14,309 164,683 343,765 229,894 197,553 X 0 0 96,979 16,892
31 Albuquerque . . . . . . . . . . . . . . . . . . . . New Mexico 17,733 22,985 177,924 153,848 153,848 X 0 0 11,696 12,38032 Fulton County . . . . . . . . . . . . . . . . . . . Georgia 0 48,466 733,975 684,102 507,874 X 1,854 0 21,922 26,09733 Austin . . . . . . . . . . . . . . . . . . . . . . . . . . Texas 0 40,890 769,945 743,806 743,806 X 122 0 10,803 15,21434 Jefferson County . . . . . . . . . . . . . . . . . Colorado 4,779 7,077 428,719 360,296 360,296 X 186 1,262 58,501 8,47435 Baltimore . . . . . . . . . . . . . . . . . . . . . . . Maryland 19,106 504,909 272,357 X X 254,983 0 0 3,848 13,526
36 Lee County . . . . . . . . . . . . . . . . . . . . . Florida 4,451 123,931 474,264 428,147 428,147 X 0 15 35,292 10,81037 Long Beach Unified . . . . . . . . . . . . . . . California 5,443 136,352 152,710 112,725 112,725 X 4,346 523 7,421 27,69538 Fort Worth . . . . . . . . . . . . . . . . . . . . . . Texas 0 55,428 362,507 337,626 337,626 X 0 0 11,124 13,75739 Prince William County . . . . . . . . . . . . . Virginia 0 60,051 502,290 X X 439,687 0 34,298 21,553 6,75240 Denver . . . . . . . . . . . . . . . . . . . . . . . . . Colorado 4,303 16,872 555,629 451,648 451,644 X 2,081 985 47,415 53,500
41 Nashville-Davidson County . . . . . . . . . Tennessee 0 10,998 490,480 X X 463,274 0 430 18,537 8,23942 Milwaukee . . . . . . . . . . . . . . . . . . . . . . Wisconsin 2,360 45,583 334,731 297,840 297,840 X 11,695 2,844 9,572 12,78043 Anne Arundel County . . . . . . . . . . . . . Maryland 21,002 162,722 630,205 X X 614,916 0 387 12,353 2,54944 Fresno Unified . . . . . . . . . . . . . . . . . . . California 4,171 157,886 108,749 86,307 86,307 X 597 4,188 2,185 15,47245 Guilford County . . . . . . . . . . . . . . . . . . North Carolina 0 5,077 296,631 X X 270,752 0 0 15,744 10,135
46 Greenville County . . . . . . . . . . . . . . . . South Carolina 2,817 223,744 283,095 204,665 204,665 X 20,215 360 32,609 25,24647 Brevard County . . . . . . . . . . . . . . . . . . Florida 6,083 114,919 248,509 218,308 218,308 X 0 105 26,273 3,82348 Virginia Beach . . . . . . . . . . . . . . . . . . . Virginia 0 42,751 354,424 X X 312,582 0 18,457 14,169 9,21649 Alpine . . . . . . . . . . . . . . . . . . . . . . . . . . Utah 7,043 74,464 154,000 136,177 136,177 X 0 154 10,458 7,21150 Fort Bend . . . . . . . . . . . . . . . . . . . . . . . Texas 0 38,404 345,607 313,255 313,255 X 0 60 24,331 7,961
See notes at end of table.

Public Ed
ucatio
n Fin
ances: 2
01
2
17
U
.S. Cen
sus Bu
reau
Table 15.
Revenue of the 100 Largest Public Elementary-Secondary School Systems in the United States by Enrollment: Fiscal Year 2012—Con.(In thousands of dollars. Detail may not add to total because of rounding. For meaning of abbreviations and symbols, see footnotes)
Rank School system State
Enrollment1
Elementary-secondary revenue—Con.
Total
Federal sources—Con. State sources—Con.
Total Title ISpecial
educationChild
nutritionOther and
nonspecified Total
Generalformula
assistanceSpecial
education51 Davis County . . . . . . . . . . . . . . . . . . . . Utah 69,285 488,488 42,301 3,126 10,465 11,474 17,236 278,010 170,098 22,72352 Granite . . . . . . . . . . . . . . . . . . . . . . . . . Utah 69,252 487,404 64,405 13,275 18,167 17,886 15,077 258,193 158,720 25,69153 North East . . . . . . . . . . . . . . . . . . . . . . Texas 67,439 682,125 62,851 10,602 10,870 15,782 25,597 212,338 168,919 054 Detroit . . . . . . . . . . . . . . . . . . . . . . . . . Michigan 67,064 1,035,068 271,358 157,079 0 37,238 77,041 499,995 400,803 36,92055 Pasco County . . . . . . . . . . . . . . . . . . . Florida 66,659 582,449 61,671 15,727 12,169 19,945 13,830 286,001 128,856 46,114
56 Loudoun County . . . . . . . . . . . . . . . . . Virginia 65,585 969,001 37,030 1,184 13,469 5,832 16,545 222,755 181,899 14,83457 Washoe County . . . . . . . . . . . . . . . . . . Nevada 64,740 606,096 66,385 17,510 11,530 14,445 22,900 367,101 155,967 22,99458 Mesa Unified . . . . . . . . . . . . . . . . . . . . Arizona 64,728 565,143 67,494 20,745 10,365 21,468 14,916 214,838 210,175 059 Arlington . . . . . . . . . . . . . . . . . . . . . . . Texas 64,703 566,407 63,788 15,321 11,812 20,899 15,756 242,020 207,255 060 Seminole County . . . . . . . . . . . . . . . . . Florida 64,344 513,064 52,192 11,653 16,035 14,794 9,710 232,046 104,217 24,030
61 Aldine . . . . . . . . . . . . . . . . . . . . . . . . . . Texas 64,300 610,147 97,303 22,805 9,454 34,869 30,175 324,058 282,691 062 El Paso . . . . . . . . . . . . . . . . . . . . . . . . Texas 64,214 618,764 108,474 39,363 6,919 22,998 39,194 312,306 258,063 063 Douglas County . . . . . . . . . . . . . . . . . . Colorado 63,114 584,330 13,899 1,058 6,446 2,713 3,682 260,462 246,297 7,93764 Katy . . . . . . . . . . . . . . . . . . . . . . . . . . . Texas 62,414 590,635 41,823 4,348 6,000 9,939 21,536 205,720 173,733 065 Elk Grove Unified . . . . . . . . . . . . . . . . . California 62,126 541,376 63,320 15,072 11,706 14,861 21,681 368,394 258,658 32,073
66 Volusia County . . . . . . . . . . . . . . . . . . . Florida 61,524 547,213 63,123 19,446 14,008 17,299 12,370 211,407 87,467 28,02467 Mobile County . . . . . . . . . . . . . . . . . . . Alabama 61,462 585,069 83,326 31,104 21,981 22,773 7,468 323,217 264,607 1,27768 Chesterfield County . . . . . . . . . . . . . . . Virginia 59,200 626,131 42,011 5,992 12,926 7,284 15,809 267,399 212,803 19,35169 Knox County . . . . . . . . . . . . . . . . . . . . Tennessee 58,639 517,620 66,212 14,046 15,183 15,771 21,212 166,759 159,156 070 Garland . . . . . . . . . . . . . . . . . . . . . . . . Texas 58,151 515,646 59,297 13,903 10,612 16,613 18,169 273,440 233,715 0
71 Santa Ana Unified . . . . . . . . . . . . . . . . California 57,250 615,303 103,610 34,710 11,778 27,250 29,872 392,106 201,521 27,73372 San Francisco Unified . . . . . . . . . . . . . California 56,310 746,702 92,837 31,359 0 13,062 48,416 195,653 32,414 073 Plano . . . . . . . . . . . . . . . . . . . . . . . . . . Texas 55,659 630,492 27,978 5,138 7,758 7,407 7,675 102,983 69,948 074 Boston . . . . . . . . . . . . . . . . . . . . . . . . . Massachusetts 55,027 1,262,395 131,642 45,498 23,358 17,515 45,271 319,499 205,541 075 Osceola County . . . . . . . . . . . . . . . . . . Florida 54,783 468,040 57,912 13,600 11,765 19,735 12,812 229,871 100,012 25,485
76 San Antonio . . . . . . . . . . . . . . . . . . . . . Texas 54,394 561,919 131,088 34,760 13,802 31,753 50,773 268,440 214,414 077 San Bernardino Unified . . . . . . . . . . . . California 54,379 614,746 101,866 46,520 12,828 23,318 19,200 461,395 240,466 25,73878 Corona-Norco Unified . . . . . . . . . . . . . California 53,467 481,844 35,106 6,941 9,123 10,643 8,399 315,947 205,388 25,37979 Winston-Salem/Forsyth . . . . . . . . . . . . North Carolina 53,340 462,134 70,974 3,596 222 15,597 51,559 263,463 260,421 080 Capistrano Unified . . . . . . . . . . . . . . . . California 53,170 437,617 34,955 4,912 11,136 4,445 14,462 134,896 46,929 25,399
81 Cumberland County. . . . . . . . . . . . . . . North Carolina 53,053 446,774 83,302 2,190 290 17,663 63,159 263,276 260,773 082 Pasadena . . . . . . . . . . . . . . . . . . . . . . Texas 52,942 499,925 74,268 19,600 8,792 23,446 22,430 282,576 238,310 083 Conroe . . . . . . . . . . . . . . . . . . . . . . . . . Texas 52,664 454,374 27,519 7,020 7,452 7,912 5,135 141,663 110,178 084 Cherry Creek . . . . . . . . . . . . . . . . . . . . Colorado 52,655 528,040 27,338 6,577 9,180 7,151 4,430 216,417 200,290 8,75785 Lewisville . . . . . . . . . . . . . . . . . . . . . . . Texas 51,920 532,667 33,972 3,479 8,198 8,497 13,798 139,514 109,864 0
86 Tucson Unified . . . . . . . . . . . . . . . . . . . Arizona 51,720 501,632 77,010 28,287 10,044 16,392 22,287 153,134 150,162 087 Howard County . . . . . . . . . . . . . . . . . . Maryland 51,555 889,422 23,875 2,140 10,672 4,493 6,570 282,270 158,803 12,07288 Clayton County . . . . . . . . . . . . . . . . . . Georgia 51,018 487,526 70,677 20,610 10,674 24,559 14,834 226,538 212,006 089 Jordan . . . . . . . . . . . . . . . . . . . . . . . . . Utah 50,961 350,709 20,903 0 7,510 7,733 5,660 191,136 119,142 18,83290 Columbus . . . . . . . . . . . . . . . . . . . . . . Ohio 50,488 949,275 141,562 70,484 17,225 24,128 29,725 339,022 310,179 0
91 Omaha . . . . . . . . . . . . . . . . . . . . . . . . . Nebraska 50,340 611,657 102,834 23,718 4,244 20,460 54,412 205,033 163,604 31,57392 Atlanta . . . . . . . . . . . . . . . . . . . . . . . . . Georgia 50,009 800,352 95,495 38,039 10,100 21,487 25,869 143,264 133,366 093 Brownsville . . . . . . . . . . . . . . . . . . . . . Texas 49,655 501,603 112,894 27,591 8,993 33,098 43,212 328,109 287,697 094 Henrico County . . . . . . . . . . . . . . . . . . Virginia 49,654 519,170 44,871 9,261 8,609 9,725 17,276 214,524 169,290 16,14995 Wichita Unified . . . . . . . . . . . . . . . . . . . Kansas 49,389 578,456 70,782 24,596 N 18,052 28,134 345,915 261,685 41,082
96 Seattle . . . . . . . . . . . . . . . . . . . . . . . . . Washington 49,269 684,501 56,340 14,675 11,825 9,462 20,378 307,249 225,617 40,57697 Anchorage . . . . . . . . . . . . . . . . . . . . . . Alaska 48,765 746,315 94,110 15,445 13,486 14,510 50,669 438,433 318,151 098 Garden Grove Unified . . . . . . . . . . . . . California 47,999 433,419 53,814 16,043 9,150 17,346 11,275 282,484 177,098 24,08299 Sacramento Unified . . . . . . . . . . . . . . . California 47,940 498,462 80,477 24,796 10,435 17,400 27,846 307,271 172,813 22,384100 San Juan Unified . . . . . . . . . . . . . . . . . California 47,245 446,540 56,544 15,064 11,050 9,559 20,871 268,832 162,896 25,732
See notes at end of table.
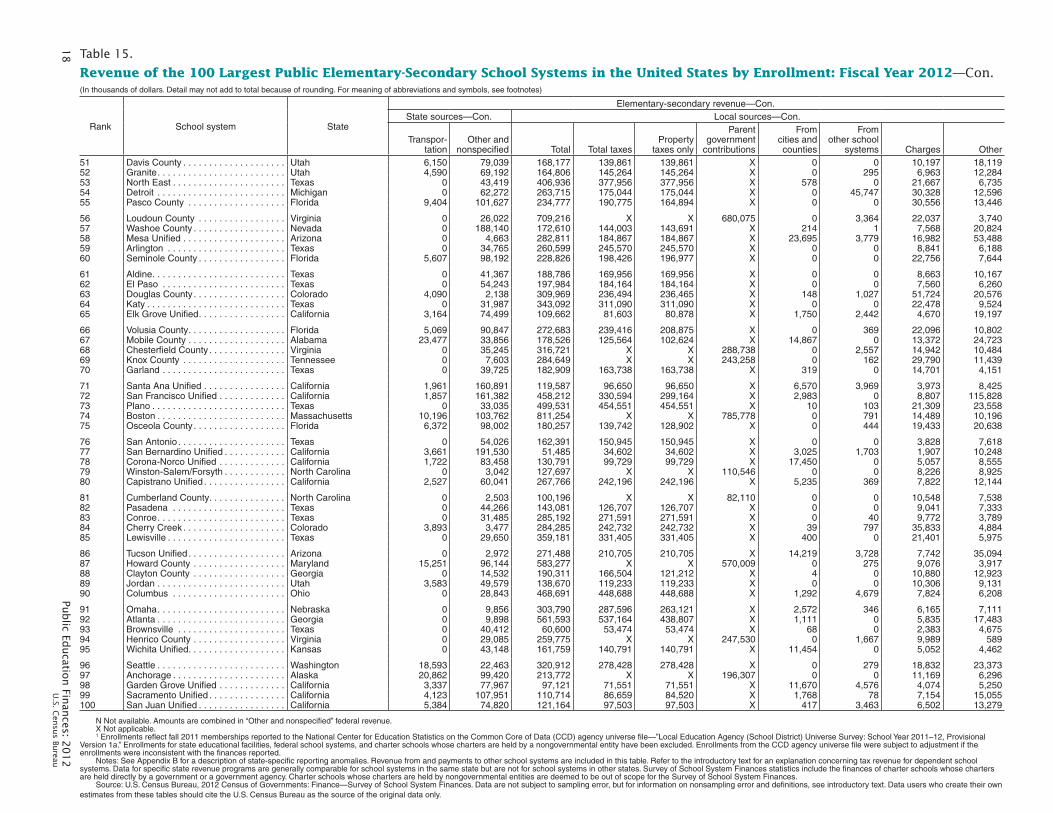
18
Pu
blic Ed
ucatio
n Fin
ances: 2
01
2
U
.S. Cen
sus Bu
reau
Table 15.
Revenue of the 100 Largest Public Elementary-Secondary School Systems in the United States by Enrollment: Fiscal Year 2012—Con.(In thousands of dollars. Detail may not add to total because of rounding. For meaning of abbreviations and symbols, see footnotes)
Rank School system State
Elementary-secondary revenue—Con.State sources—Con. Local sources—Con.
Transpor- tation
Other andnonspecified Total Total taxes
Propertytaxes only
Parentgovernment
contributions
From cities andcounties
From other school
systems Charges Other51 Davis County . . . . . . . . . . . . . . . . . . . . Utah 6,150 79,039 168,177 139,861 139,861 X 0 0 10,197 18,11952 Granite . . . . . . . . . . . . . . . . . . . . . . . . . Utah 4,590 69,192 164,806 145,264 145,264 X 0 295 6,963 12,28453 North East . . . . . . . . . . . . . . . . . . . . . . Texas 0 43,419 406,936 377,956 377,956 X 578 0 21,667 6,73554 Detroit . . . . . . . . . . . . . . . . . . . . . . . . . Michigan 0 62,272 263,715 175,044 175,044 X 0 45,747 30,328 12,59655 Pasco County . . . . . . . . . . . . . . . . . . . Florida 9,404 101,627 234,777 190,775 164,894 X 0 0 30,556 13,446
56 Loudoun County . . . . . . . . . . . . . . . . . Virginia 0 26,022 709,216 X X 680,075 0 3,364 22,037 3,74057 Washoe County . . . . . . . . . . . . . . . . . . Nevada 0 188,140 172,610 144,003 143,691 X 214 1 7,568 20,82458 Mesa Unified . . . . . . . . . . . . . . . . . . . . Arizona 0 4,663 282,811 184,867 184,867 X 23,695 3,779 16,982 53,48859 Arlington . . . . . . . . . . . . . . . . . . . . . . . Texas 0 34,765 260,599 245,570 245,570 X 0 0 8,841 6,18860 Seminole County . . . . . . . . . . . . . . . . . Florida 5,607 98,192 228,826 198,426 196,977 X 0 0 22,756 7,644
61 Aldine . . . . . . . . . . . . . . . . . . . . . . . . . . Texas 0 41,367 188,786 169,956 169,956 X 0 0 8,663 10,16762 El Paso . . . . . . . . . . . . . . . . . . . . . . . . Texas 0 54,243 197,984 184,164 184,164 X 0 0 7,560 6,26063 Douglas County . . . . . . . . . . . . . . . . . . Colorado 4,090 2,138 309,969 236,494 236,465 X 148 1,027 51,724 20,57664 Katy . . . . . . . . . . . . . . . . . . . . . . . . . . . Texas 0 31,987 343,092 311,090 311,090 X 0 0 22,478 9,52465 Elk Grove Unified . . . . . . . . . . . . . . . . . California 3,164 74,499 109,662 81,603 80,878 X 1,750 2,442 4,670 19,197
66 Volusia County . . . . . . . . . . . . . . . . . . . Florida 5,069 90,847 272,683 239,416 208,875 X 0 369 22,096 10,80267 Mobile County . . . . . . . . . . . . . . . . . . . Alabama 23,477 33,856 178,526 125,564 102,624 X 14,867 0 13,372 24,72368 Chesterfield County . . . . . . . . . . . . . . . Virginia 0 35,245 316,721 X X 288,738 0 2,557 14,942 10,48469 Knox County . . . . . . . . . . . . . . . . . . . . Tennessee 0 7,603 284,649 X X 243,258 0 162 29,790 11,43970 Garland . . . . . . . . . . . . . . . . . . . . . . . . Texas 0 39,725 182,909 163,738 163,738 X 319 0 14,701 4,151
71 Santa Ana Unified . . . . . . . . . . . . . . . . California 1,961 160,891 119,587 96,650 96,650 X 6,570 3,969 3,973 8,42572 San Francisco Unified . . . . . . . . . . . . . California 1,857 161,382 458,212 330,594 299,164 X 2,983 0 8,807 115,82873 Plano . . . . . . . . . . . . . . . . . . . . . . . . . . Texas 0 33,035 499,531 454,551 454,551 X 10 103 21,309 23,55874 Boston . . . . . . . . . . . . . . . . . . . . . . . . . Massachusetts 10,196 103,762 811,254 X X 785,778 0 791 14,489 10,19675 Osceola County . . . . . . . . . . . . . . . . . . Florida 6,372 98,002 180,257 139,742 128,902 X 0 444 19,433 20,638
76 San Antonio . . . . . . . . . . . . . . . . . . . . . Texas 0 54,026 162,391 150,945 150,945 X 0 0 3,828 7,61877 San Bernardino Unified . . . . . . . . . . . . California 3,661 191,530 51,485 34,602 34,602 X 3,025 1,703 1,907 10,24878 Corona-Norco Unified . . . . . . . . . . . . . California 1,722 83,458 130,791 99,729 99,729 X 17,450 0 5,057 8,55579 Winston-Salem/Forsyth . . . . . . . . . . . . North Carolina 0 3,042 127,697 X X 110,546 0 0 8,226 8,92580 Capistrano Unified . . . . . . . . . . . . . . . . California 2,527 60,041 267,766 242,196 242,196 X 5,235 369 7,822 12,144
81 Cumberland County. . . . . . . . . . . . . . . North Carolina 0 2,503 100,196 X X 82,110 0 0 10,548 7,53882 Pasadena . . . . . . . . . . . . . . . . . . . . . . Texas 0 44,266 143,081 126,707 126,707 X 0 0 9,041 7,33383 Conroe . . . . . . . . . . . . . . . . . . . . . . . . . Texas 0 31,485 285,192 271,591 271,591 X 0 40 9,772 3,78984 Cherry Creek . . . . . . . . . . . . . . . . . . . . Colorado 3,893 3,477 284,285 242,732 242,732 X 39 797 35,833 4,88485 Lewisville . . . . . . . . . . . . . . . . . . . . . . . Texas 0 29,650 359,181 331,405 331,405 X 400 0 21,401 5,975
86 Tucson Unified . . . . . . . . . . . . . . . . . . . Arizona 0 2,972 271,488 210,705 210,705 X 14,219 3,728 7,742 35,09487 Howard County . . . . . . . . . . . . . . . . . . Maryland 15,251 96,144 583,277 X X 570,009 0 275 9,076 3,91788 Clayton County . . . . . . . . . . . . . . . . . . Georgia 0 14,532 190,311 166,504 121,212 X 4 0 10,880 12,92389 Jordan . . . . . . . . . . . . . . . . . . . . . . . . . Utah 3,583 49,579 138,670 119,233 119,233 X 0 0 10,306 9,13190 Columbus . . . . . . . . . . . . . . . . . . . . . . Ohio 0 28,843 468,691 448,688 448,688 X 1,292 4,679 7,824 6,208
91 Omaha . . . . . . . . . . . . . . . . . . . . . . . . . Nebraska 0 9,856 303,790 287,596 263,121 X 2,572 346 6,165 7,11192 Atlanta . . . . . . . . . . . . . . . . . . . . . . . . . Georgia 0 9,898 561,593 537,164 438,807 X 1,111 0 5,835 17,48393 Brownsville . . . . . . . . . . . . . . . . . . . . . Texas 0 40,412 60,600 53,474 53,474 X 68 0 2,383 4,67594 Henrico County . . . . . . . . . . . . . . . . . . Virginia 0 29,085 259,775 X X 247,530 0 1,667 9,989 58995 Wichita Unified . . . . . . . . . . . . . . . . . . . Kansas 0 43,148 161,759 140,791 140,791 X 11,454 0 5,052 4,462
96 Seattle . . . . . . . . . . . . . . . . . . . . . . . . . Washington 18,593 22,463 320,912 278,428 278,428 X 0 279 18,832 23,37397 Anchorage . . . . . . . . . . . . . . . . . . . . . . Alaska 20,862 99,420 213,772 X X 196,307 0 0 11,169 6,29698 Garden Grove Unified . . . . . . . . . . . . . California 3,337 77,967 97,121 71,551 71,551 X 11,670 4,576 4,074 5,25099 Sacramento Unified . . . . . . . . . . . . . . . California 4,123 107,951 110,714 86,659 84,520 X 1,768 78 7,154 15,055100 San Juan Unified . . . . . . . . . . . . . . . . . California 5,384 74,820 121,164 97,503 97,503 X 417 3,463 6,502 13,279
N Not available. Amounts are combined in “Other and nonspecified” federal revenue.X Not applicable.1 Enrollments reflect fall 2011 memberships reported to the National Center for Education Statistics on the Common Core of Data (CCD) agency universe file—”Local Education Agency (School District) Universe Survey: School Year 2011–12, Provisional
Version 1a.” Enrollments for state educational facilities, federal school systems, and charter schools whose charters are held by a nongovernmental entity have been excluded. Enrollments from the CCD agency universe file were subject to adjustment if the enrollments were inconsistent with the finances reported.
Notes: See Appendix B for a description of state-specific reporting anomalies. Revenue from and payments to other school systems are included in this table. Refer to the introductory text for an explanation concerning tax revenue for dependent school systems. Data for specific state revenue programs are generally comparable for school systems in the same state but are not for school systems in other states. Survey of School System Finances statistics include the finances of charter schools whose charters are held directly by a government or a government agency. Charter schools whose charters are held by nongovernmental entities are deemed to be out of scope for the Survey of School System Finances.
Source: U.S. Census Bureau, 2012 Census of Governments: Finance—Survey of School System Finances. Data are not subject to sampling error, but for information on nonsampling error and definitions, see introductory text. Data users who create their own estimates from these tables should cite the U.S. Census Bureau as the source of the original data only.

Public Ed
ucatio
n Fin
ances: 2
01
2
19
U
.S. Cen
sus Bu
reau
Table 16. Expenditure of the 100 Largest Public Elementary-Secondary School Systems in the United States by Enrollment: Fiscal Year 2012
(In thousands of dollars. Detail may not add to total because of rounding)
Rank School system State
Enrollment1
Elementary-secondary expenditure
Total
Current spending
Total
For selected objectsFor selected functions
Instruction
Salaries and
wagesEmployee
benefits Total2
Salaries and
wagesEmployee
benefits1 New York City . . . . . . . . . . . . . New York 990,145 24,814,225 22,182,180 10,205,288 5,842,294 17,125,980 8,440,953 5,051,5502 Los Angeles Unified . . . . . . . . California 659,639 8,898,332 7,154,924 4,084,878 1,737,927 4,250,633 2,651,327 1,099,2943 Chicago . . . . . . . . . . . . . . . . . Illinois 403,004 5,741,225 4,885,315 2,524,539 1,002,295 3,040,082 1,705,906 706,5064 Miami-Dade County . . . . . . . . Florida 350,239 3,407,559 3,136,435 1,781,737 560,226 1,947,976 1,143,518 345,8135 Clark County . . . . . . . . . . . . . Nevada 313,398 2,859,780 2,476,769 1,500,208 592,399 1,454,066 965,045 373,368
6 Broward County . . . . . . . . . . . Florida 258,478 2,317,961 2,143,668 1,216,567 325,045 1,277,974 759,586 194,5287 Houston . . . . . . . . . . . . . . . . . Texas 203,066 2,355,857 1,885,870 1,073,277 198,920 1,000,287 719,938 128,7898 Hillsborough County . . . . . . . Florida 197,041 1,916,730 1,747,029 1,056,390 264,408 990,247 688,864 162,0539 Hawaii Public Schools . . . . . . Hawaii 182,706 2,344,733 2,220,637 1,184,582 426,745 1,262,938 814,926 284,55310 Orange County . . . . . . . . . . . Florida 180,000 1,768,303 1,470,759 843,181 251,670 859,216 521,667 147,707
11 Fairfax County . . . . . . . . . . . . Virginia 177,606 2,574,460 2,314,155 1,494,485 560,553 1,418,386 982,980 362,62712 Palm Beach County . . . . . . . . Florida 176,901 1,777,058 1,621,700 923,559 282,778 989,179 594,709 176,15813 Gwinnett County . . . . . . . . . . Georgia 162,370 1,590,201 1,464,055 910,231 287,431 890,294 616,320 220,79414 Dallas . . . . . . . . . . . . . . . . . . . Texas 157,575 1,900,501 1,359,912 937,496 136,015 792,087 635,490 91,50615 Philadelphia . . . . . . . . . . . . . . Pennsylvania 154,262 2,813,912 1,779,242 903,543 426,913 993,871 613,700 271,427
16 Wake County . . . . . . . . . . . . . North Carolina 148,154 1,353,430 1,137,114 747,922 234,334 735,593 534,078 163,83217 Montgomery County . . . . . . . Maryland 146,459 2,646,912 2,180,396 1,375,863 648,602 1,387,437 909,779 438,95318 Charlotte/Mecklenburg . . . . . North Carolina 141,728 1,241,903 1,117,551 712,173 219,874 702,565 487,505 151,02219 San Diego Unified . . . . . . . . . California 131,044 1,428,904 1,211,863 732,575 317,891 724,011 474,169 194,76120 Duval County . . . . . . . . . . . . . Florida 125,429 1,131,916 1,036,278 554,385 155,464 619,856 386,481 108,538
21 Prince Georges County . . . . . Maryland 123,833 1,845,509 1,678,126 980,525 444,497 973,389 627,105 280,14622 Memphis . . . . . . . . . . . . . . . . Tennessee 110,952 1,190,720 1,099,411 657,283 208,782 649,243 426,775 143,78123 Cypress-Fairbanks . . . . . . . . . Texas 107,960 894,600 742,312 545,625 85,648 483,511 390,350 60,17324 Cobb County . . . . . . . . . . . . . Georgia 107,291 1,181,875 982,931 638,267 195,709 656,789 449,764 150,60525 Baltimore County . . . . . . . . . . Maryland 105,153 1,560,907 1,361,050 826,259 377,502 837,765 541,991 261,488
26 Pinellas County . . . . . . . . . . . Florida 103,776 998,382 906,864 555,750 167,350 545,199 365,481 104,66327 Jefferson County . . . . . . . . . . Kentucky 99,191 1,258,019 1,140,711 748,675 246,656 588,596 431,800 133,22828 Northside . . . . . . . . . . . . . . . . Texas 98,110 955,210 738,162 526,586 94,089 463,442 363,251 61,92529 DeKalb County . . . . . . . . . . . Georgia 98,088 1,054,536 990,224 633,423 179,957 613,704 408,132 130,78130 Polk County . . . . . . . . . . . . . . Florida 96,070 924,557 846,362 426,383 120,113 550,360 281,288 74,529
31 Albuquerque . . . . . . . . . . . . . New Mexico 94,318 983,498 802,804 510,050 152,338 482,085 347,067 101,86532 Fulton County . . . . . . . . . . . . Georgia 92,604 1,002,318 890,691 557,446 171,758 563,004 383,671 114,19533 Austin . . . . . . . . . . . . . . . . . . . Texas 86,528 1,002,664 783,447 516,541 131,538 445,203 327,214 81,77034 Jefferson County . . . . . . . . . . Colorado 85,793 790,472 724,170 488,204 123,903 416,885 306,326 77,21735 Baltimore . . . . . . . . . . . . . . . . Maryland 84,212 1,478,108 1,287,344 692,511 319,350 751,045 456,512 184,718
36 Lee County . . . . . . . . . . . . . . Florida 83,895 852,347 726,285 386,435 108,328 422,929 240,602 66,07437 Long Beach Unified . . . . . . . . California 83,691 876,917 769,435 468,511 192,991 464,208 300,165 117,77338 Fort Worth . . . . . . . . . . . . . . . Texas 83,109 864,878 746,929 532,255 80,366 430,484 337,588 51,54839 Prince William County . . . . . . Virginia 81,937 975,843 828,451 550,317 159,497 469,058 343,426 98,12340 Denver . . . . . . . . . . . . . . . . . . Colorado 80,890 1,052,787 854,627 553,037 94,911 430,808 329,957 55,657
41 Nashville-Davidson County . . Tennessee 80,393 874,304 788,325 454,563 180,915 450,044 289,641 120,69742 Milwaukee . . . . . . . . . . . . . . . Wisconsin 79,130 1,187,745 1,053,596 503,444 314,028 584,266 326,196 203,53643 Anne Arundel County . . . . . . Maryland 76,303 1,128,315 973,849 570,905 251,624 613,482 392,464 178,31744 Fresno Unified . . . . . . . . . . . . California 74,235 775,662 668,724 395,149 167,120 392,514 258,815 103,37445 Guilford County . . . . . . . . . . . North Carolina 74,086 778,610 652,693 419,410 128,811 404,251 285,689 86,482
46 Greenville County . . . . . . . . . South Carolina 72,153 674,602 565,160 342,940 114,285 322,530 221,355 70,62247 Brevard County . . . . . . . . . . . Florida 71,792 602,642 562,445 352,136 87,156 347,040 232,751 54,75948 Virginia Beach . . . . . . . . . . . . Virginia 70,978 854,836 749,254 476,079 142,139 434,432 314,007 88,23349 Alpine . . . . . . . . . . . . . . . . . . . Utah 69,639 436,267 383,335 203,152 110,122 252,901 147,004 77,87450 Fort Bend . . . . . . . . . . . . . . . . Texas 69,449 597,592 519,861 352,848 77,364 320,568 239,893 53,103
See notes at end of table.
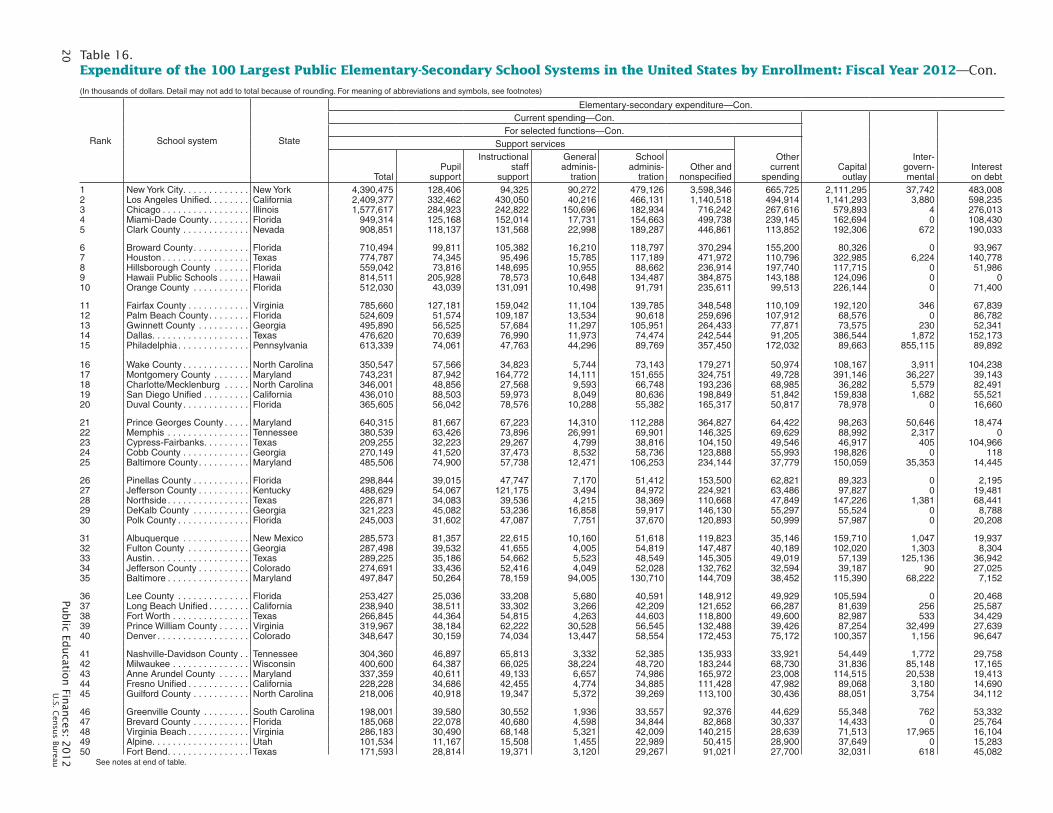
20
Pu
blic Ed
ucatio
n Fin
ances: 2
01
2
U
.S. Cen
sus Bu
reau
Table 16. Expenditure of the 100 Largest Public Elementary-Secondary School Systems in the United States by Enrollment: Fiscal Year 2012—Con.
(In thousands of dollars. Detail may not add to total because of rounding. For meaning of abbreviations and symbols, see footnotes)
Rank School system State
Elementary-secondary expenditure—Con.Current spending—Con.
Capitaloutlay
Inter-govern- mental
Intereston debt
For selected functions—Con.Support services
Othercurrent
spendingTotalPupil
support
Instructionalstaff
support
Generaladminis-
tration
Schooladminis-
trationOther and
nonspecified1 New York City . . . . . . . . . . . . . New York 4,390,475 128,406 94,325 90,272 479,126 3,598,346 665,725 2,111,295 37,742 483,0082 Los Angeles Unified . . . . . . . . California 2,409,377 332,462 430,050 40,216 466,131 1,140,518 494,914 1,141,293 3,880 598,2353 Chicago . . . . . . . . . . . . . . . . . Illinois 1,577,617 284,923 242,822 150,696 182,934 716,242 267,616 579,893 4 276,0134 Miami-Dade County . . . . . . . . Florida 949,314 125,168 152,014 17,731 154,663 499,738 239,145 162,694 0 108,4305 Clark County . . . . . . . . . . . . . Nevada 908,851 118,137 131,568 22,998 189,287 446,861 113,852 192,306 672 190,033
6 Broward County . . . . . . . . . . . Florida 710,494 99,811 105,382 16,210 118,797 370,294 155,200 80,326 0 93,9677 Houston . . . . . . . . . . . . . . . . . Texas 774,787 74,345 95,496 15,785 117,189 471,972 110,796 322,985 6,224 140,7788 Hillsborough County . . . . . . . Florida 559,042 73,816 148,695 10,955 88,662 236,914 197,740 117,715 0 51,9869 Hawaii Public Schools . . . . . . Hawaii 814,511 205,928 78,573 10,648 134,487 384,875 143,188 124,096 0 010 Orange County . . . . . . . . . . . Florida 512,030 43,039 131,091 10,498 91,791 235,611 99,513 226,144 0 71,400
11 Fairfax County . . . . . . . . . . . . Virginia 785,660 127,181 159,042 11,104 139,785 348,548 110,109 192,120 346 67,83912 Palm Beach County . . . . . . . . Florida 524,609 51,574 109,187 13,534 90,618 259,696 107,912 68,576 0 86,78213 Gwinnett County . . . . . . . . . . Georgia 495,890 56,525 57,684 11,297 105,951 264,433 77,871 73,575 230 52,34114 Dallas . . . . . . . . . . . . . . . . . . . Texas 476,620 70,639 76,990 11,973 74,474 242,544 91,205 386,544 1,872 152,17315 Philadelphia . . . . . . . . . . . . . . Pennsylvania 613,339 74,061 47,763 44,296 89,769 357,450 172,032 89,663 855,115 89,892
16 Wake County . . . . . . . . . . . . . North Carolina 350,547 57,566 34,823 5,744 73,143 179,271 50,974 108,167 3,911 104,23817 Montgomery County . . . . . . . Maryland 743,231 87,942 164,772 14,111 151,655 324,751 49,728 391,146 36,227 39,14318 Charlotte/Mecklenburg . . . . . North Carolina 346,001 48,856 27,568 9,593 66,748 193,236 68,985 36,282 5,579 82,49119 San Diego Unified . . . . . . . . . California 436,010 88,503 59,973 8,049 80,636 198,849 51,842 159,838 1,682 55,52120 Duval County . . . . . . . . . . . . . Florida 365,605 56,042 78,576 10,288 55,382 165,317 50,817 78,978 0 16,660
21 Prince Georges County . . . . . Maryland 640,315 81,667 67,223 14,310 112,288 364,827 64,422 98,263 50,646 18,47422 Memphis . . . . . . . . . . . . . . . . Tennessee 380,539 63,426 73,896 26,991 69,901 146,325 69,629 88,992 2,317 023 Cypress-Fairbanks . . . . . . . . . Texas 209,255 32,223 29,267 4,799 38,816 104,150 49,546 46,917 405 104,96624 Cobb County . . . . . . . . . . . . . Georgia 270,149 41,520 37,473 8,532 58,736 123,888 55,993 198,826 0 11825 Baltimore County . . . . . . . . . . Maryland 485,506 74,900 57,738 12,471 106,253 234,144 37,779 150,059 35,353 14,445
26 Pinellas County . . . . . . . . . . . Florida 298,844 39,015 47,747 7,170 51,412 153,500 62,821 89,323 0 2,19527 Jefferson County . . . . . . . . . . Kentucky 488,629 54,067 121,175 3,494 84,972 224,921 63,486 97,827 0 19,48128 Northside . . . . . . . . . . . . . . . . Texas 226,871 34,083 39,536 4,215 38,369 110,668 47,849 147,226 1,381 68,44129 DeKalb County . . . . . . . . . . . Georgia 321,223 45,082 53,236 16,858 59,917 146,130 55,297 55,524 0 8,78830 Polk County . . . . . . . . . . . . . . Florida 245,003 31,602 47,087 7,751 37,670 120,893 50,999 57,987 0 20,208
31 Albuquerque . . . . . . . . . . . . . New Mexico 285,573 81,357 22,615 10,160 51,618 119,823 35,146 159,710 1,047 19,93732 Fulton County . . . . . . . . . . . . Georgia 287,498 39,532 41,655 4,005 54,819 147,487 40,189 102,020 1,303 8,30433 Austin . . . . . . . . . . . . . . . . . . . Texas 289,225 35,186 54,662 5,523 48,549 145,305 49,019 57,139 125,136 36,94234 Jefferson County . . . . . . . . . . Colorado 274,691 33,436 52,416 4,049 52,028 132,762 32,594 39,187 90 27,02535 Baltimore . . . . . . . . . . . . . . . . Maryland 497,847 50,264 78,159 94,005 130,710 144,709 38,452 115,390 68,222 7,152
36 Lee County . . . . . . . . . . . . . . Florida 253,427 25,036 33,208 5,680 40,591 148,912 49,929 105,594 0 20,46837 Long Beach Unified . . . . . . . . California 238,940 38,511 33,302 3,266 42,209 121,652 66,287 81,639 256 25,58738 Fort Worth . . . . . . . . . . . . . . . Texas 266,845 44,364 54,815 4,263 44,603 118,800 49,600 82,987 533 34,42939 Prince William County . . . . . . Virginia 319,967 38,184 62,222 30,528 56,545 132,488 39,426 87,254 32,499 27,63940 Denver . . . . . . . . . . . . . . . . . . Colorado 348,647 30,159 74,034 13,447 58,554 172,453 75,172 100,357 1,156 96,647
41 Nashville-Davidson County . . Tennessee 304,360 46,897 65,813 3,332 52,385 135,933 33,921 54,449 1,772 29,75842 Milwaukee . . . . . . . . . . . . . . . Wisconsin 400,600 64,387 66,025 38,224 48,720 183,244 68,730 31,836 85,148 17,16543 Anne Arundel County . . . . . . Maryland 337,359 40,611 49,133 6,657 74,986 165,972 23,008 114,515 20,538 19,41344 Fresno Unified . . . . . . . . . . . . California 228,228 34,686 42,455 4,774 34,885 111,428 47,982 89,068 3,180 14,69045 Guilford County . . . . . . . . . . . North Carolina 218,006 40,918 19,347 5,372 39,269 113,100 30,436 88,051 3,754 34,112
46 Greenville County . . . . . . . . . South Carolina 198,001 39,580 30,552 1,936 33,557 92,376 44,629 55,348 762 53,33247 Brevard County . . . . . . . . . . . Florida 185,068 22,078 40,680 4,598 34,844 82,868 30,337 14,433 0 25,76448 Virginia Beach . . . . . . . . . . . . Virginia 286,183 30,490 68,148 5,321 42,009 140,215 28,639 71,513 17,965 16,10449 Alpine . . . . . . . . . . . . . . . . . . . Utah 101,534 11,167 15,508 1,455 22,989 50,415 28,900 37,649 0 15,28350 Fort Bend . . . . . . . . . . . . . . . . Texas 171,593 28,814 19,371 3,120 29,267 91,021 27,700 32,031 618 45,082
See notes at end of table.

Public Ed
ucatio
n Fin
ances: 2
01
2
21
U
.S. Cen
sus Bu
reau
Table 16.
Expenditure of the 100 Largest Public Elementary-Secondary School Systems in the United States by Enrollment: Fiscal Year 2012—Con.(In thousands of dollars. Detail may not add to total because of rounding. For meaning of abbreviations and symbols, see footnotes)
Rank School system State
Enrollment1
Elementary-secondary expenditure–Con.
Total
Current spending–Con.
Total
For selected objects–Con. For selected functions–Con.
Salaries and
wagesEmployee
benefits
Instruction–Con.
Total2
Salaries and
wagesEmployee
benefits51 Davis County . . . . . . . . . . . . . Utah 69,285 499,424 416,532 232,712 105,081 256,380 160,010 71,46152 Granite . . . . . . . . . . . . . . . . . . Utah 69,252 588,361 439,651 250,807 115,994 272,950 171,851 79,76453 North East . . . . . . . . . . . . . . . Texas 67,439 667,846 541,139 376,150 69,926 337,383 259,967 45,70054 Detroit . . . . . . . . . . . . . . . . . . Michigan 67,064 1,231,375 901,527 452,047 195,642 515,473 310,687 135,38955 Pasco County . . . . . . . . . . . . Florida 66,659 593,276 536,725 319,845 96,277 310,347 198,668 57,308
56 Loudoun County . . . . . . . . . . Virginia 65,585 919,047 791,580 493,562 204,217 504,858 337,921 133,18257 Washoe County . . . . . . . . . . . Nevada 64,740 636,000 557,150 334,661 127,650 306,839 209,006 80,07458 Mesa Unified . . . . . . . . . . . . . Arizona 64,728 517,772 492,377 343,863 76,905 291,827 228,294 49,48859 Arlington . . . . . . . . . . . . . . . . Texas 64,703 531,090 464,512 345,081 43,603 297,929 246,425 30,89460 Seminole County . . . . . . . . . . Florida 64,344 518,329 489,292 307,902 83,477 308,409 216,905 54,924
61 Aldine . . . . . . . . . . . . . . . . . . . Texas 64,300 553,073 498,574 351,556 58,759 309,275 243,303 43,20362 El Paso . . . . . . . . . . . . . . . . . Texas 64,214 581,392 529,942 380,175 63,412 325,863 253,924 40,42863 Douglas County . . . . . . . . . . . Colorado 63,114 532,576 469,515 287,870 86,659 276,423 194,632 54,85864 Katy . . . . . . . . . . . . . . . . . . . . Texas 62,414 717,715 465,160 333,748 52,930 293,139 235,096 36,99465 Elk Grove Unified . . . . . . . . . . California 62,126 518,944 494,867 296,562 129,307 321,255 210,594 84,858
66 Volusia County . . . . . . . . . . . . Florida 61,524 562,932 505,077 306,769 91,848 300,711 195,383 54,82367 Mobile County . . . . . . . . . . . . Alabama 61,462 573,397 527,580 294,106 114,566 286,383 186,355 68,44168 Chesterfield County . . . . . . . . Virginia 59,200 555,196 504,135 311,161 116,182 308,423 211,871 81,68169 Knox County . . . . . . . . . . . . . Tennessee 58,639 501,983 458,870 285,821 76,490 280,341 195,376 53,88770 Garland . . . . . . . . . . . . . . . . . Texas 58,151 481,473 433,784 316,107 47,093 267,515 213,057 30,859
71 Santa Ana Unified . . . . . . . . . California 57,250 643,235 524,819 316,178 118,831 330,547 218,472 79,27472 San Francisco Unified . . . . . . California 56,310 772,453 554,190 326,939 137,084 277,945 195,152 74,21873 Plano . . . . . . . . . . . . . . . . . . . Texas 55,659 595,680 448,065 317,450 47,467 290,380 236,244 34,81974 Boston . . . . . . . . . . . . . . . . . . Massachusetts 55,027 1,252,519 1,190,943 628,065 250,343 716,062 415,309 175,38075 Osceola County . . . . . . . . . . . Florida 54,783 502,154 439,856 245,878 70,079 260,122 152,915 41,956
76 San Antonio . . . . . . . . . . . . . . Texas 54,394 574,466 497,845 320,347 86,125 296,038 208,037 52,87477 San Bernardino Unified . . . . . California 54,379 619,086 509,202 301,131 102,810 279,644 186,080 56,31678 Corona-Norco Unified . . . . . . California 53,467 471,474 403,928 269,482 73,639 259,862 194,508 45,87379 Winston-Salem/Forsyth . . . . . North Carolina 53,340 528,982 448,499 292,153 90,814 292,732 205,808 63,97380 Capistrano Unified . . . . . . . . . California 53,170 411,168 393,348 258,656 90,830 262,769 188,694 62,337
81 Cumberland County. . . . . . . . North Carolina 53,053 475,034 432,216 287,239 87,842 270,505 195,574 58,50282 Pasadena . . . . . . . . . . . . . . . Texas 52,942 495,172 448,868 308,433 55,805 273,099 210,670 39,03283 Conroe . . . . . . . . . . . . . . . . . . Texas 52,664 495,365 359,250 262,258 42,549 227,046 184,360 28,68084 Cherry Creek . . . . . . . . . . . . . Colorado 52,655 521,506 471,885 323,329 79,960 318,987 237,226 57,49985 Lewisville . . . . . . . . . . . . . . . . Texas 51,920 517,474 420,642 290,995 47,249 269,805 215,757 34,727
86 Tucson Unified . . . . . . . . . . . . Arizona 51,720 494,649 439,446 305,968 71,006 206,838 167,364 32,19987 Howard County . . . . . . . . . . . Maryland 51,555 858,194 767,149 464,975 180,642 504,862 342,877 135,75688 Clayton County . . . . . . . . . . . Georgia 51,018 493,833 432,169 275,895 75,810 272,062 189,731 56,48489 Jordan . . . . . . . . . . . . . . . . . . Utah 50,961 348,394 289,287 167,325 69,655 177,631 110,715 49,20590 Columbus . . . . . . . . . . . . . . . Ohio 50,488 936,473 814,297 444,020 175,603 459,657 255,819 90,116
91 Omaha . . . . . . . . . . . . . . . . . . Nebraska 50,340 613,168 563,137 316,615 115,990 373,110 232,387 85,66192 Atlanta . . . . . . . . . . . . . . . . . . Georgia 50,009 753,355 701,368 376,216 154,262 327,349 227,510 58,11893 Brownsville . . . . . . . . . . . . . . Texas 49,655 486,144 450,540 305,561 60,534 264,062 203,307 37,72694 Henrico County . . . . . . . . . . . Virginia 49,654 523,534 443,323 286,940 97,043 268,856 189,796 62,88595 Wichita Unified . . . . . . . . . . . . Kansas 49,389 638,760 506,211 300,205 124,210 289,116 189,369 79,469
96 Seattle . . . . . . . . . . . . . . . . . . Washington 49,269 624,241 549,245 344,925 111,196 325,689 227,210 71,87497 Anchorage . . . . . . . . . . . . . . . Alaska 48,765 777,227 733,093 371,321 348,189 419,466 231,503 162,29198 Garden Grove Unified . . . . . . California 47,999 427,642 412,844 258,613 108,042 264,388 176,399 69,95899 Sacramento Unified . . . . . . . . California 47,940 516,542 471,596 253,658 134,401 285,612 160,013 85,834100 San Juan Unified . . . . . . . . . . California 47,245 450,680 413,112 256,276 93,523 247,791 166,690 58,014
See notes at end of table.

22
Pu
blic Ed
ucatio
n Fin
ances: 2
01
2
U
.S. Cen
sus Bu
reau
Table 16.
Expenditure of the 100 Largest Public Elementary-Secondary School Systems in the United States by Enrollment: Fiscal Year 2012—Con.(In thousands of dollars. Detail may not add to total because of rounding. For meaning of abbreviations and symbols, see footnotes)
Rank School system State
Elementary-secondary expenditure—Con.Current spending—Con.
Capitaloutlay
Inter-govern- mental
Intereston debt
For selected functions—Con.Support services–Con.
Othercurrent
spendingTotalPupil
support
Instructionalstaff
support
Generaladminis-
tration
Schooladminis-
trationOther and
nonspecified51 Davis County . . . . . . . . . . . . . Utah 116,900 14,137 15,760 2,545 24,861 59,597 43,252 64,456 39 18,39752 Granite . . . . . . . . . . . . . . . . . . Utah 126,507 18,221 15,082 2,853 26,391 63,960 40,194 141,743 0 6,96753 North East . . . . . . . . . . . . . . . Texas 175,281 29,120 30,170 3,513 29,270 83,208 28,475 66,352 325 60,03054 Detroit . . . . . . . . . . . . . . . . . . Michigan 346,078 62,941 70,341 8,257 38,763 165,776 39,976 213,384 0 116,46455 Pasco County . . . . . . . . . . . . Florida 192,937 24,952 36,106 1,713 33,210 96,956 33,441 38,696 0 17,855
56 Loudoun County . . . . . . . . . . Virginia 263,462 42,303 37,848 5,711 46,195 131,405 23,260 86,689 2,253 38,52557 Washoe County . . . . . . . . . . . Nevada 225,972 41,928 29,960 18,244 33,645 102,195 24,339 42,888 621 35,34158 Mesa Unified . . . . . . . . . . . . . Arizona 174,472 58,422 11,065 1,266 22,371 81,348 26,078 15,126 0 10,26959 Arlington . . . . . . . . . . . . . . . . Texas 139,523 25,965 20,416 3,095 23,190 66,857 27,060 45,456 995 20,12760 Seminole County . . . . . . . . . . Florida 152,421 21,801 19,797 4,116 27,984 78,723 28,462 18,139 0 10,898
61 Aldine . . . . . . . . . . . . . . . . . . . Texas 154,232 25,787 15,268 3,092 27,990 82,095 35,067 32,541 209 21,74962 El Paso . . . . . . . . . . . . . . . . . Texas 177,423 31,146 33,067 4,508 31,730 76,972 26,656 28,872 92 22,48663 Douglas County . . . . . . . . . . . Colorado 169,497 19,087 17,949 4,000 33,945 94,516 23,595 30,079 988 31,99464 Katy . . . . . . . . . . . . . . . . . . . . Texas 149,208 22,369 17,130 4,233 26,183 79,293 22,813 202,321 71 50,16365 Elk Grove Unified . . . . . . . . . . California 151,090 21,380 19,140 2,325 29,311 78,934 22,522 10,091 5,513 8,473
66 Volusia County . . . . . . . . . . . . Florida 176,433 21,419 32,206 3,661 34,439 84,708 27,933 35,555 0 22,30067 Mobile County . . . . . . . . . . . . Alabama 201,092 30,540 26,015 5,929 28,098 110,510 40,105 34,307 909 10,60168 Chesterfield County . . . . . . . . Virginia 176,027 22,060 24,363 4,312 31,354 93,938 19,685 31,518 3,757 15,78669 Knox County . . . . . . . . . . . . . Tennessee 154,789 16,603 36,983 7,726 26,927 66,550 23,740 34,206 25 8,88270 Garland . . . . . . . . . . . . . . . . . Texas 140,243 22,800 22,974 2,682 26,234 65,553 26,026 31,860 820 15,009
71 Santa Ana Unified . . . . . . . . . California 168,244 22,891 30,638 1,638 34,630 78,447 26,028 101,033 3,207 14,17672 San Francisco Unified . . . . . . California 254,727 32,306 91,181 7,676 37,802 85,762 21,518 124,165 65,834 28,26473 Plano . . . . . . . . . . . . . . . . . . . Texas 135,063 22,533 19,046 4,115 22,111 67,258 22,622 59,836 40,087 47,69274 Boston . . . . . . . . . . . . . . . . . . Massachusetts 422,915 66,654 122,003 16,979 40,676 176,603 51,966 44,087 5,496 11,99375 Osceola County . . . . . . . . . . . Florida 148,159 21,601 29,417 4,475 21,549 71,117 31,575 46,777 0 15,521
76 San Antonio . . . . . . . . . . . . . . Texas 159,620 29,018 25,907 2,739 29,935 72,021 42,187 43,252 1,444 31,92577 San Bernardino Unified . . . . . California 189,890 31,521 25,898 3,113 42,470 86,888 39,668 101,676 18 8,19078 Corona-Norco Unified . . . . . . California 127,108 20,821 13,244 1,672 28,165 63,206 16,958 53,823 338 13,38579 Winston-Salem/Forsyth . . . . . North Carolina 133,206 23,747 14,169 2,352 30,312 62,626 22,561 46,934 1,621 31,92880 Capistrano Unified . . . . . . . . . California 117,713 20,232 12,765 1,637 26,633 56,446 12,866 2,713 12,515 2,592
81 Cumberland County. . . . . . . . North Carolina 133,040 21,570 19,602 1,811 30,384 59,673 28,671 33,136 1,942 7,74082 Pasadena . . . . . . . . . . . . . . . Texas 146,652 22,834 17,309 2,658 29,165 74,686 29,117 28,794 400 17,11083 Conroe . . . . . . . . . . . . . . . . . . Texas 118,843 17,679 9,895 2,880 21,494 66,895 13,361 90,736 661 44,71884 Cherry Creek . . . . . . . . . . . . . Colorado 136,560 24,847 15,519 4,527 22,207 69,460 16,338 27,798 68 21,75585 Lewisville . . . . . . . . . . . . . . . . Texas 128,533 21,710 17,434 3,902 24,253 61,234 22,304 48,832 521 47,479
86 Tucson Unified . . . . . . . . . . . . Arizona 213,695 87,908 13,535 2,604 19,673 89,975 18,913 40,204 0 14,99987 Howard County . . . . . . . . . . . Maryland 247,386 35,731 39,010 4,260 53,601 114,784 14,901 71,887 3,792 15,36688 Clayton County . . . . . . . . . . . Georgia 129,789 21,816 20,562 3,348 21,401 62,662 30,318 61,664 0 089 Jordan . . . . . . . . . . . . . . . . . . Utah 87,500 8,801 11,778 1,668 17,697 47,556 24,156 54,975 19 4,11390 Columbus . . . . . . . . . . . . . . . Ohio 319,222 59,064 70,115 9,753 39,534 140,756 35,418 75,767 23,778 22,631
91 Omaha . . . . . . . . . . . . . . . . . . Nebraska 163,764 12,127 12,061 8,355 28,384 102,837 26,263 40,293 1,388 8,35092 Atlanta . . . . . . . . . . . . . . . . . . Georgia 350,054 31,865 46,826 17,885 30,759 222,719 23,965 49,176 3 2,80893 Brownsville . . . . . . . . . . . . . . Texas 149,442 22,263 26,965 1,969 22,468 75,777 37,036 24,504 436 10,66494 Henrico County . . . . . . . . . . . Virginia 155,044 19,518 26,834 5,162 25,545 77,985 19,423 62,430 2,725 15,05695 Wichita Unified . . . . . . . . . . . . Kansas 196,599 41,456 26,193 6,275 33,069 89,606 20,496 110,054 0 22,495
96 Seattle . . . . . . . . . . . . . . . . . . Washington 205,888 45,854 17,219 6,601 34,209 102,005 17,668 65,040 0 9,95697 Anchorage . . . . . . . . . . . . . . . Alaska 292,587 85,977 36,617 5,410 41,482 123,101 21,040 18,495 0 25,63998 Garden Grove Unified . . . . . . California 127,834 20,525 15,052 1,506 26,141 64,610 20,622 5,048 2,319 7,43199 Sacramento Unified . . . . . . . . California 159,830 25,390 28,159 3,780 31,554 70,947 26,154 27,283 23 17,640100 San Juan Unified . . . . . . . . . . California 147,338 15,317 29,387 3,196 33,821 65,617 17,983 21,947 701 14,920
1 Enrollments reflect fall 2011 memberships reported to the National Center for Education Statistics on the Common Core of Data (CCD) agency universe file—”Local Education Agency (School District) Universe Survey: School Year 2011–12, Provisional Version 1a.” Enrollments for state educational facilities, federal school systems, and charter schools whose charters are held by a nongovernmental entity have been excluded. Enrollments from the CCD agency universe file were subject to adjustment if the enrollments were inconsistent with the finances reported.
2 Includes amounts not shown separately.Notes: See Appendix B for a description of state-specific reporting anomalies. Payments to other school systems are included in this table. Expenditures for adult education, community services, and other nonelementary-secondary programs are included under total elementary-
secondary expenditure, total current spending, and other current spending, but are excluded in the per pupil data displayed in Table 18. Survey of School System Finances statistics include the finances of charter schools whose charters are held directly by a government or a government agency. Charter schools whose charters are held by nongovernmental entities are deemed to be out of scope for the Survey of School System Finances.
Source: U.S. Census Bureau, 2012 Census of Governments: Finance—Survey of School System Finances. Data are not subject to sampling error, but for information on nonsampling error and definitions, see introductory text. Data users who create their own estimates from these tables should cite the U.S. Census Bureau as the source of the original data only.

Public Education Finances: 2012 23 U.S. Census Bureau
Table 17. Percentage Distribution of Revenue of the 100 Largest Public Elementary-Secondary School Systems in the United States by Enrollment: Fiscal Year 2012—Con.(Detail may not add to total because of rounding. For meaning of abbreviations and symbols, see footnotes)
Rank School system State
Enroll-ment1 Total
Federal sources State sources Local sources
Total2 Title I Total2
Generalformula
assistance Total2
Taxes andparent
govern-ment
contribu-tions
Otherlocal
govern-ments Charges
1 New York City . . . . . . . . . . . . . . New York 990,145 100.0 9.5 3.7 36.8 24.4 53.7 46.8 Z 0.22 Los Angeles Unified . . . . . . . . . California 659,639 100.0 15.1 5.3 60.2 30.0 24.8 19.6 1.1 1.13 Chicago . . . . . . . . . . . . . . . . . . Illinois 403,004 100.0 15.5 5.6 39.0 31.9 45.5 40.8 Z 0.14 Miami-Dade County . . . . . . . . . Florida 350,239 100.0 14.3 4.5 31.7 10.0 53.9 48.0 Z 4.75 Clark County . . . . . . . . . . . . . . Nevada 313,398 100.0 9.9 2.9 58.9 22.6 31.2 28.9 Z 1.1
6 Broward County . . . . . . . . . . . . Florida 258,478 100.0 12.1 3.6 37.6 15.0 50.2 43.3 Z 5.47 Houston . . . . . . . . . . . . . . . . . . Texas 203,066 100.0 12.1 5.5 24.9 18.2 62.9 57.8 Z 0.78 Hillsborough County . . . . . . . . Florida 197,041 100.0 16.2 3.7 47.0 19.6 36.8 29.8 Z 3.39 Hawaii Public Schools . . . . . . . Hawaii 182,706 100.0 12.6 2.3 85.3 37.1 2.2 Z Z 1.610 Orange County . . . . . . . . . . . . Florida 180,000 100.0 11.1 3.3 33.5 12.8 55.4 48.3 Z 3.7
11 Fairfax County . . . . . . . . . . . . . Virginia 177,606 100.0 5.3 0.9 20.4 16.4 74.3 68.3 1.7 2.512 Palm Beach County . . . . . . . . . Florida 176,901 100.0 10.6 3.6 19.0 3.5 70.5 61.2 0.2 7.113 Gwinnett County . . . . . . . . . . . Georgia 162,370 100.0 8.8 2.0 43.6 42.0 47.6 42.0 Z 3.214 Dallas . . . . . . . . . . . . . . . . . . . . Texas 157,575 100.0 15.0 5.2 27.8 22.0 57.2 55.0 Z 0.515 Philadelphia . . . . . . . . . . . . . . . Pennsylvania 154,262 100.0 16.9 9.9 48.2 36.1 34.9 31.4 0.7 0.1
16 Wake County . . . . . . . . . . . . . . North Carolina 148,154 100.0 11.3 0.2 59.0 58.6 29.8 26.1 Z 2.617 Montgomery County . . . . . . . . Maryland 146,459 100.0 3.8 0.7 26.6 11.3 69.6 68.1 Z 1.018 Charlotte/Mecklenburg . . . . . . North Carolina 141,728 100.0 12.9 0.3 55.4 54.3 31.7 27.4 Z 2.719 San Diego Unified . . . . . . . . . . California 131,044 100.0 11.5 3.3 36.1 11.3 52.4 44.1 3.5 1.120 Duval County . . . . . . . . . . . . . . Florida 125,429 100.0 14.4 4.2 42.2 19.5 43.3 36.4 Z 5.0
21 Prince Georges County . . . . . . Maryland 123,833 100.0 7.1 1.8 49.3 23.9 43.7 40.8 Z 1.422 Memphis . . . . . . . . . . . . . . . . . Tennessee 110,952 100.0 20.7 6.9 38.9 36.7 40.4 0.1 34.9 3.123 Cypress-Fairbanks . . . . . . . . . . Texas 107,960 100.0 7.8 1.1 39.4 33.1 52.8 48.0 0.1 3.924 Cobb County . . . . . . . . . . . . . . Georgia 107,291 100.0 7.5 1.6 38.5 33.8 54.0 47.9 0.1 5.225 Baltimore County . . . . . . . . . . . Maryland 105,153 100.0 5.7 1.1 42.6 20.9 51.7 50.4 0.2 0.9
26 Pinellas County . . . . . . . . . . . . Florida 103,776 100.0 12.7 3.9 29.3 10.0 58.0 53.1 Z 3.427 Jefferson County . . . . . . . . . . . Kentucky 99,191 100.0 15.4 4.1 39.3 21.7 45.2 42.7 0.1 1.328 Northside . . . . . . . . . . . . . . . . . Texas 98,110 100.0 10.2 1.9 37.6 31.3 52.2 47.4 0.6 3.329 DeKalb County . . . . . . . . . . . . Georgia 98,088 100.0 10.9 3.4 35.8 33.0 53.3 47.9 0.5 1.530 Polk County . . . . . . . . . . . . . . . Florida 96,070 100.0 13.1 3.8 48.4 22.9 38.6 25.8 Z 10.9
31 Albuquerque . . . . . . . . . . . . . . New Mexico 94,318 100.0 10.1 3.2 71.4 67.2 18.5 16.0 Z 1.232 Fulton County . . . . . . . . . . . . . Georgia 92,604 100.0 6.4 1.9 28.9 24.6 64.7 60.3 0.2 1.933 Austin . . . . . . . . . . . . . . . . . . . . Texas 86,528 100.0 12.2 3.2 15.9 12.1 72.0 69.5 Z 1.034 Jefferson County . . . . . . . . . . . Colorado 85,793 100.0 6.8 1.4 41.2 38.3 52.1 43.7 0.2 7.135 Baltimore . . . . . . . . . . . . . . . . . Maryland 84,212 100.0 14.0 5.1 67.4 26.5 18.7 17.5 Z 0.3
36 Lee County . . . . . . . . . . . . . . . Florida 83,895 100.0 12.0 3.0 26.0 7.1 62.0 56.0 Z 4.637 Long Beach Unified . . . . . . . . . California 83,691 100.0 17.2 4.8 64.6 42.6 18.2 13.5 0.6 0.938 Fort Worth . . . . . . . . . . . . . . . . Texas 83,109 100.0 17.6 5.6 38.5 31.8 43.9 40.9 Z 1.339 Prince William County . . . . . . . Virginia 81,937 100.0 6.7 1.0 41.1 31.1 52.3 45.8 3.6 2.240 Denver . . . . . . . . . . . . . . . . . . . Colorado 80,890 100.0 14.6 5.7 28.0 24.4 57.4 46.7 0.3 4.9
41 Nashville-Davidson County . . . Tennessee 80,393 100.0 14.6 4.6 27.8 26.5 57.5 54.4 0.1 2.242 Milwaukee . . . . . . . . . . . . . . . . Wisconsin 79,130 100.0 18.6 9.0 53.3 44.7 28.1 25.0 1.2 0.843 Anne Arundel County . . . . . . . Maryland 76,303 100.0 5.1 1.0 37.0 18.0 57.9 56.5 Z 1.144 Fresno Unified . . . . . . . . . . . . . California 74,235 100.0 18.3 8.8 67.3 41.2 14.3 11.4 0.6 0.345 Guilford County . . . . . . . . . . . . North Carolina 74,086 100.0 11.7 0.7 49.7 49.1 38.5 35.2 Z 2.0
46 Greenville County . . . . . . . . . . South Carolina 72,153 100.0 9.8 3.4 49.0 12.8 41.3 29.8 3.0 4.847 Brevard County . . . . . . . . . . . . Florida 71,792 100.0 10.5 2.7 47.2 20.1 42.3 37.2 Z 4.548 Virginia Beach . . . . . . . . . . . . . Virginia 70,978 100.0 11.1 1.8 41.9 32.5 47.0 41.4 2.4 1.949 Alpine . . . . . . . . . . . . . . . . . . . . Utah 69,639 100.0 9.8 1.4 57.7 35.8 32.5 28.8 Z 2.250 Fort Bend . . . . . . . . . . . . . . . . . Texas 69,449 100.0 8.8 1.3 35.5 29.3 55.8 50.6 Z 3.9
51 Davis County . . . . . . . . . . . . . . Utah 69,285 100.0 8.7 0.6 56.9 34.8 34.4 28.6 Z 2.152 Granite . . . . . . . . . . . . . . . . . . . Utah 69,252 100.0 13.2 2.7 53.0 32.6 33.8 29.8 0.1 1.453 North East . . . . . . . . . . . . . . . . Texas 67,439 100.0 9.2 1.6 31.1 24.8 59.7 55.4 0.1 3.254 Detroit . . . . . . . . . . . . . . . . . . . Michigan 67,064 100.0 26.2 15.2 48.3 38.7 25.5 16.9 4.4 2.955 Pasco County . . . . . . . . . . . . . Florida 66,659 100.0 10.6 2.7 49.1 22.1 40.3 32.8 Z 5.2
56 Loudoun County . . . . . . . . . . . Virginia 65,585 100.0 3.8 0.1 23.0 18.8 73.2 70.2 0.3 2.357 Washoe County . . . . . . . . . . . . Nevada 64,740 100.0 11.0 2.9 60.6 25.7 28.5 23.8 Z 1.258 Mesa Unified . . . . . . . . . . . . . . Arizona 64,728 100.0 11.9 3.7 38.0 37.2 50.0 32.7 4.9 3.059 Arlington . . . . . . . . . . . . . . . . . Texas 64,703 100.0 11.3 2.7 42.7 36.6 46.0 43.4 Z 1.660 Seminole County . . . . . . . . . . . Florida 64,344 100.0 10.2 2.3 45.2 20.3 44.6 38.7 Z 4.4
See notes at end of table.

24 Public Education Finances: 2012 U.S. Census Bureau
Table 17. Percentage Distribution of Revenue of the 100 Largest Public Elementary-Secondary School Systems in the United States by Enrollment: Fiscal Year 2012—Con.(Detail may not add to total because of rounding. For meaning of abbreviations and symbols, see footnotes)
Rank School system State
Enroll-ment1 Total
Federal sources State sources Local sources
Total2 Title I Total2
Generalformula
assistance Total2
Taxes andparent
govern-ment
contribu-tions
Otherlocal
govern-ments Charges
61 Aldine . . . . . . . . . . . . . . . . . . . . Texas 64,300 100.0 15.9 3.7 53.1 46.3 30.9 27.9 Z 1.462 El Paso . . . . . . . . . . . . . . . . . . Texas 64,214 100.0 17.5 6.4 50.5 41.7 32.0 29.8 Z 1.263 Douglas County . . . . . . . . . . . . Colorado 63,114 100.0 2.4 0.2 44.6 42.2 53.0 40.5 0.2 8.964 Katy . . . . . . . . . . . . . . . . . . . . . Texas 62,414 100.0 7.1 0.7 34.8 29.4 58.1 52.7 Z 3.865 Elk Grove Unified . . . . . . . . . . . California 62,126 100.0 11.7 2.8 68.0 47.8 20.3 15.1 0.8 0.9
66 Volusia County . . . . . . . . . . . . . Florida 61,524 100.0 11.5 3.6 38.6 16.0 49.8 43.8 0.1 4.067 Mobile County . . . . . . . . . . . . . Alabama 61,462 100.0 14.2 5.3 55.2 45.2 30.5 21.5 2.5 2.368 Chesterfield County . . . . . . . . . Virginia 59,200 100.0 6.7 1.0 42.7 34.0 50.6 46.1 0.4 2.469 Knox County . . . . . . . . . . . . . . Tennessee 58,639 100.0 12.8 2.7 32.2 30.7 55.0 47.0 Z 5.870 Garland . . . . . . . . . . . . . . . . . . Texas 58,151 100.0 11.5 2.7 53.0 45.3 35.5 31.8 0.1 2.9
71 Santa Ana Unified . . . . . . . . . . California 57,250 100.0 16.8 5.6 63.7 32.8 19.4 15.7 1.7 0.672 San Francisco Unified . . . . . . . California 56,310 100.0 12.4 4.2 26.2 4.3 61.4 44.3 0.4 1.273 Plano . . . . . . . . . . . . . . . . . . . . Texas 55,659 100.0 4.4 0.8 16.3 11.1 79.2 72.1 Z 3.474 Boston . . . . . . . . . . . . . . . . . . . Massachusetts 55,027 100.0 10.4 3.6 25.3 16.3 64.3 62.2 0.1 1.175 Osceola County . . . . . . . . . . . . Florida 54,783 100.0 12.4 2.9 49.1 21.4 38.5 29.9 0.1 4.2
76 San Antonio . . . . . . . . . . . . . . . Texas 54,394 100.0 23.3 6.2 47.8 38.2 28.9 26.9 Z 0.777 San Bernardino Unified . . . . . . California 54,379 100.0 16.6 7.6 75.1 39.1 8.4 5.6 0.8 0.378 Corona-Norco Unified . . . . . . . California 53,467 100.0 7.3 1.4 65.6 42.6 27.1 20.7 3.6 1.079 Winston-Salem/Forsyth . . . . . . North Carolina 53,340 100.0 15.4 0.8 57.0 56.4 27.6 23.9 Z 1.880 Capistrano Unified . . . . . . . . . . California 53,170 100.0 8.0 1.1 30.8 10.7 61.2 55.3 1.3 1.8
81 Cumberland County. . . . . . . . . North Carolina 53,053 100.0 18.6 0.5 58.9 58.4 22.4 18.4 Z 2.482 Pasadena . . . . . . . . . . . . . . . . Texas 52,942 100.0 14.9 3.9 56.5 47.7 28.6 25.3 Z 1.883 Conroe . . . . . . . . . . . . . . . . . . . Texas 52,664 100.0 6.1 1.5 31.2 24.2 62.8 59.8 Z 2.284 Cherry Creek . . . . . . . . . . . . . . Colorado 52,655 100.0 5.2 1.2 41.0 37.9 53.8 46.0 0.2 6.885 Lewisville . . . . . . . . . . . . . . . . . Texas 51,920 100.0 6.4 0.7 26.2 20.6 67.4 62.2 0.1 4.0
86 Tucson Unified . . . . . . . . . . . . . Arizona 51,720 100.0 15.4 5.6 30.5 29.9 54.1 42.0 3.6 1.587 Howard County . . . . . . . . . . . . Maryland 51,555 100.0 2.7 0.2 31.7 17.9 65.6 64.1 Z 1.088 Clayton County . . . . . . . . . . . . Georgia 51,018 100.0 14.5 4.2 46.5 43.5 39.0 34.2 Z 2.289 Jordan . . . . . . . . . . . . . . . . . . . Utah 50,961 100.0 6.0 Z 54.5 34.0 39.5 34.0 Z 2.990 Columbus . . . . . . . . . . . . . . . . Ohio 50,488 100.0 14.9 7.4 35.7 32.7 49.4 47.3 0.6 0.8
91 Omaha . . . . . . . . . . . . . . . . . . . Nebraska 50,340 100.0 16.8 3.9 33.5 26.7 49.7 47.0 0.5 1.092 Atlanta . . . . . . . . . . . . . . . . . . . Georgia 50,009 100.0 11.9 4.8 17.9 16.7 70.2 67.1 0.1 0.793 Brownsville . . . . . . . . . . . . . . . Texas 49,655 100.0 22.5 5.5 65.4 57.4 12.1 10.7 Z 0.594 Henrico County . . . . . . . . . . . . Virginia 49,654 100.0 8.6 1.8 41.3 32.6 50.0 47.7 0.3 1.995 Wichita Unified . . . . . . . . . . . . . Kansas 49,389 100.0 12.2 4.3 59.8 45.2 28.0 24.3 2.0 0.9
96 Seattle . . . . . . . . . . . . . . . . . . . Washington 49,269 100.0 8.2 2.1 44.9 33.0 46.9 40.7 Z 2.897 Anchorage . . . . . . . . . . . . . . . . Alaska 48,765 100.0 12.6 2.1 58.7 42.6 28.6 26.3 Z 1.598 Garden Grove Unified . . . . . . . California 47,999 100.0 12.4 3.7 65.2 40.9 22.4 16.5 3.7 0.999 Sacramento Unified . . . . . . . . . California 47,940 100.0 16.1 5.0 61.6 34.7 22.2 17.4 0.4 1.4100 San Juan Unified . . . . . . . . . . . California 47,245 100.0 12.7 3.4 60.2 36.5 27.1 21.8 0.9 1.5
Z Represents zero or rounds to zero.1 Enrollments reflect fall 2011 memberships reported to the National Center for Education Statistics on the Common Core of Data (CCD) agency universe file—”Local Education Agency (School
District) Universe Survey: School Year 2011–12, Provisional Version 1a.” Enrollments for state educational facilities, federal school systems, and charter schools whose charters are held by a nongovernmental entity have been excluded. Enrollments from the CCD agency universe file were subject to adjustment if the enrollments were inconsistent with the finances reported.
2 Includes amounts not shown separately.Notes: See Appendix B for a description of state-specific reporting anomalies. Where state accounting practices permit, revenue from other school systems are included under “Other local
governments.” Some data appear under local sources for Hawaii’s state-operated school system for consistency with data presented for all other school systems. Survey of School System Finances statistics include the finances of charter schools whose charters are held directly by a government or a government agency. Charter schools whose charters are held by nongovernmental entities are deemed to be out of scope for the Survey of School System Finances.
Source: U.S. Census Bureau, 2012 Census of Governments: Finance—Survey of School System Finances. Data are not subject to sampling error, but for information on nonsampling error and definitions, see introductory text. Data users who create their own estimates from these tables should cite the US Census Bureau as the source of the original data only.

Public Ed
ucatio
n Fin
ances: 2
01
2
25
U
.S. Cen
sus Bu
reau
Table 18. Per Pupil Amounts for Current Spending of the 100 Largest Public Elementary-Secondary School Systems in the United States by Enrollment: Fiscal Year 2012—Con.(In dollars. Detail may not add to total because of rounding)
Rank School system State
Enroll-ment1
Current spending
Total2
For selected objects For selected functions
Salaries and
wagesEmployee
benefits
Instruction Support services
Total2
Salaries and
wagesEmployee
benefits Total2Pupil
support
Instruc-tional staff
support
Generaladminis-
tration
Schooladminis-
tration1 New York City . . . . . . . . . . . . . . . . . . . . New York 990,145 20,226 10,307 5,900 15,310 8,525 5,102 4,434 130 95 91 4842 Los Angeles Unified . . . . . . . . . . . . . . . California 659,639 10,602 6,193 2,635 6,444 4,019 1,667 3,653 504 652 61 7073 Chicago . . . . . . . . . . . . . . . . . . . . . . . . Illinois 403,004 11,976 6,264 2,487 7,544 4,233 1,753 3,915 707 603 374 4544 Miami-Dade County . . . . . . . . . . . . . . . Florida 350,239 8,690 5,087 1,600 5,562 3,265 987 2,710 357 434 51 4425 Clark County . . . . . . . . . . . . . . . . . . . . Nevada 313,398 7,857 4,787 1,890 4,640 3,079 1,191 2,900 377 420 73 604
6 Broward County . . . . . . . . . . . . . . . . . . Florida 258,478 8,021 4,707 1,258 4,944 2,939 753 2,749 386 408 63 4607 Houston . . . . . . . . . . . . . . . . . . . . . . . . Texas 203,066 9,232 5,285 980 4,926 3,545 634 3,815 366 470 78 5778 Hillsborough County . . . . . . . . . . . . . . Florida 197,041 8,318 5,361 1,342 5,026 3,496 822 2,837 375 755 56 4509 Hawaii Public Schools . . . . . . . . . . . . . Hawaii 182,706 12,054 6,484 2,336 6,912 4,460 1,557 4,458 1,127 430 58 73610 Orange County . . . . . . . . . . . . . . . . . . Florida 180,000 8,022 4,684 1,398 4,773 2,898 821 2,845 239 728 58 510
11 Fairfax County . . . . . . . . . . . . . . . . . . . Virginia 177,606 12,924 8,415 3,156 7,986 5,535 2,042 4,424 716 895 63 78712 Palm Beach County . . . . . . . . . . . . . . . Florida 176,901 8,935 5,221 1,599 5,592 3,362 996 2,966 292 617 77 51213 Gwinnett County . . . . . . . . . . . . . . . . . Georgia 162,370 8,975 5,606 1,770 5,441 3,796 1,360 3,054 348 355 70 65314 Dallas . . . . . . . . . . . . . . . . . . . . . . . . . . Texas 157,575 8,566 5,950 863 5,027 4,033 581 3,025 448 489 76 47315 Philadelphia . . . . . . . . . . . . . . . . . . . . . Pennsylvania 154,262 10,915 5,857 2,767 6,443 3,978 1,760 3,976 480 310 287 582
16 Wake County . . . . . . . . . . . . . . . . . . . . North Carolina 148,154 7,616 5,048 1,582 4,965 3,605 1,106 2,366 389 235 39 49417 Montgomery County . . . . . . . . . . . . . . Maryland 146,459 14,873 9,394 4,429 9,473 6,212 2,997 5,075 600 1,125 96 1,03518 Charlotte/Mecklenburg . . . . . . . . . . . . North Carolina 141,728 7,796 5,025 1,551 4,957 3,440 1,066 2,441 345 195 68 47119 San Diego Unified . . . . . . . . . . . . . . . . California 131,044 9,239 5,590 2,426 5,525 3,618 1,486 3,327 675 458 61 61520 Duval County . . . . . . . . . . . . . . . . . . . . Florida 125,429 8,239 4,420 1,239 4,942 3,081 865 2,915 447 626 82 442
21 Prince Georges County . . . . . . . . . . . . Maryland 123,833 13,535 7,918 3,589 7,860 5,064 2,262 5,171 659 543 116 90722 Memphis . . . . . . . . . . . . . . . . . . . . . . . Tennessee 110,952 9,782 5,924 1,882 5,852 3,846 1,296 3,430 572 666 243 63023 Cypress-Fairbanks . . . . . . . . . . . . . . . . Texas 107,960 6,828 5,054 793 4,479 3,616 557 1,938 298 271 44 36024 Cobb County . . . . . . . . . . . . . . . . . . . . Georgia 107,291 8,995 5,949 1,824 6,001 4,192 1,404 2,518 387 349 80 54725 Baltimore County . . . . . . . . . . . . . . . . . Maryland 105,153 12,940 7,858 3,590 7,967 5,154 2,487 4,617 712 549 119 1,010
26 Pinellas County . . . . . . . . . . . . . . . . . . Florida 103,776 8,529 5,355 1,613 5,254 3,522 1,009 2,880 376 460 69 49527 Jefferson County . . . . . . . . . . . . . . . . . Kentucky 99,191 11,406 7,548 2,487 5,934 4,353 1,343 4,926 545 1,222 35 85728 Northside . . . . . . . . . . . . . . . . . . . . . . . Texas 98,110 7,443 5,367 959 4,724 3,702 631 2,312 347 403 43 39129 DeKalb County . . . . . . . . . . . . . . . . . . Georgia 98,088 10,094 6,458 1,835 6,255 4,161 1,333 3,275 460 543 172 61130 Polk County . . . . . . . . . . . . . . . . . . . . . Florida 96,070 8,702 4,438 1,250 5,729 2,928 776 2,550 329 490 81 392
31 Albuquerque . . . . . . . . . . . . . . . . . . . . New Mexico 94,318 8,510 5,408 1,615 5,111 3,680 1,080 3,028 863 240 108 54732 Fulton County . . . . . . . . . . . . . . . . . . . Georgia 92,604 9,305 6,020 1,855 5,767 4,143 1,233 3,105 427 450 43 59233 Austin . . . . . . . . . . . . . . . . . . . . . . . . . . Texas 86,528 8,880 5,970 1,520 5,145 3,782 945 3,343 407 632 64 56134 Jefferson County . . . . . . . . . . . . . . . . . Colorado 85,793 8,439 5,690 1,444 4,859 3,571 900 3,202 390 611 47 60635 Baltimore . . . . . . . . . . . . . . . . . . . . . . . Maryland 84,212 15,287 8,223 3,792 8,919 5,421 2,193 5,912 597 928 1,116 1,552
36 Lee County . . . . . . . . . . . . . . . . . . . . . Florida 83,895 8,433 4,606 1,291 5,041 2,868 788 3,021 298 396 68 48437 Long Beach Unified . . . . . . . . . . . . . . . California 83,691 8,767 5,598 2,306 5,547 3,587 1,407 2,855 460 398 39 50438 Fort Worth . . . . . . . . . . . . . . . . . . . . . . Texas 83,109 8,840 6,404 967 5,180 4,062 620 3,211 534 660 51 53739 Prince William County . . . . . . . . . . . . . Virginia 81,937 10,090 6,716 1,947 5,722 4,191 1,198 3,905 466 759 373 69040 Denver . . . . . . . . . . . . . . . . . . . . . . . . . Colorado 80,890 10,075 6,837 1,173 5,326 4,079 688 4,310 373 915 166 724
41 Nashville-Davidson County . . . . . . . . . Tennessee 80,393 9,793 5,654 2,250 5,598 3,603 1,501 3,786 583 819 41 65242 Milwaukee . . . . . . . . . . . . . . . . . . . . . . Wisconsin 79,130 12,998 6,362 3,969 7,384 4,122 2,572 5,063 814 834 483 61643 Anne Arundel County . . . . . . . . . . . . . Maryland 76,303 12,762 7,482 3,298 8,040 5,143 2,337 4,421 532 644 87 98344 Fresno Unified . . . . . . . . . . . . . . . . . . . California 74,235 8,895 5,323 2,251 5,287 3,486 1,393 3,074 467 572 64 47045 Guilford County . . . . . . . . . . . . . . . . . . North Carolina 74,086 8,810 5,661 1,739 5,457 3,856 1,167 2,943 552 261 73 530
46 Greenville County . . . . . . . . . . . . . . . . South Carolina 72,153 7,597 4,753 1,584 4,259 3,068 979 2,744 549 423 27 46547 Brevard County . . . . . . . . . . . . . . . . . . Florida 71,792 7,801 4,905 1,214 4,834 3,242 763 2,578 308 567 64 48548 Virginia Beach . . . . . . . . . . . . . . . . . . . Virginia 70,978 10,525 6,707 2,003 6,121 4,424 1,243 4,032 430 960 75 59249 Alpine . . . . . . . . . . . . . . . . . . . . . . . . . . Utah 69,639 5,412 2,917 1,581 3,632 2,111 1,118 1,458 160 223 21 33050
See notFort Bend . . . . . . . . . . . . . . . . . . . . . . .
es at end of table.Texas 69,449 7,382 5,081 1,114 4,616 3,454 765 2,471 415 279 45 421

26
Pu
blic Ed
ucatio
n Fin
ances: 2
01
2
U
.S. Cen
sus Bu
reau
Table 18. Per Pupil Amounts for Current Spending of the 100 Largest Public Elementary-Secondary School Systems in the United States by Enrollment: Fiscal Year 2012—Con.(In dollars. Detail may not add to total because of rounding)
Rank School system State
Enroll-ment1
Current spending
Total2
For selected objects For selected functions
Salaries and
wagesEmployee
benefits
Instruction Support services
Total2
Salaries and
wagesEmployee
benefits Total2Pupil
support
Instruc-tional staff
support
Generaladminis-
tration
Schooladminis-
tration51 Davis County . . . . . . . . . . . . . . . . . . . . Utah 69,285 5,827 3,359 1,517 3,700 2,309 1,031 1,687 204 227 37 35952 Granite . . . . . . . . . . . . . . . . . . . . . . . . . Utah 69,252 6,138 3,622 1,675 3,941 2,482 1,152 1,827 263 218 41 38153 North East . . . . . . . . . . . . . . . . . . . . . . Texas 67,439 8,010 5,578 1,037 5,003 3,855 678 2,599 432 447 52 43454 Detroit . . . . . . . . . . . . . . . . . . . . . . . . . Michigan 67,064 13,330 6,741 2,917 7,686 4,633 2,019 5,160 939 1,049 123 57855 Pasco County . . . . . . . . . . . . . . . . . . . Florida 66,659 8,003 4,798 1,444 4,656 2,980 860 2,894 374 542 26 498
56 Loudoun County . . . . . . . . . . . . . . . . . Virginia 65,585 12,060 7,526 3,114 7,698 5,152 2,031 4,017 645 577 87 70457 Washoe County . . . . . . . . . . . . . . . . . . Nevada 64,740 8,562 5,169 1,972 4,740 3,228 1,237 3,490 648 463 282 52058 Mesa Unified . . . . . . . . . . . . . . . . . . . . Arizona 64,728 7,606 5,312 1,188 4,509 3,527 765 2,695 903 171 20 34659 Arlington . . . . . . . . . . . . . . . . . . . . . . . Texas 64,703 7,124 5,333 674 4,605 3,809 477 2,156 401 316 48 35860 Seminole County . . . . . . . . . . . . . . . . . Florida 64,344 7,571 4,785 1,297 4,793 3,371 854 2,369 339 308 64 435
61 Aldine . . . . . . . . . . . . . . . . . . . . . . . . . . Texas 64,300 7,730 5,467 914 4,810 3,784 672 2,399 401 237 48 43562 El Paso . . . . . . . . . . . . . . . . . . . . . . . . Texas 64,214 8,209 5,920 988 5,075 3,954 630 2,763 485 515 70 49463 Douglas County . . . . . . . . . . . . . . . . . . Colorado 63,114 7,426 4,561 1,373 4,380 3,084 869 2,686 302 284 63 53864 Katy . . . . . . . . . . . . . . . . . . . . . . . . . . . Texas 62,414 7,433 5,347 848 4,697 3,767 593 2,391 358 274 68 42065 Elk Grove Unified . . . . . . . . . . . . . . . . . California 62,126 7,923 4,774 2,081 5,171 3,390 1,366 2,432 344 308 37 472
66 Volusia County . . . . . . . . . . . . . . . . . . . Florida 61,524 8,136 4,986 1,493 4,888 3,176 891 2,868 348 523 60 56067 Mobile County . . . . . . . . . . . . . . . . . . . Alabama 61,462 8,498 4,785 1,864 4,651 3,032 1,114 3,272 497 423 96 45768 Chesterfield County . . . . . . . . . . . . . . . Virginia 59,200 8,497 5,256 1,963 5,210 3,579 1,380 2,973 373 412 73 53069 Knox County . . . . . . . . . . . . . . . . . . . . Tennessee 58,639 7,812 4,874 1,304 4,781 3,332 919 2,640 283 631 132 45970 Garland . . . . . . . . . . . . . . . . . . . . . . . . Texas 58,151 7,423 5,436 810 4,600 3,664 531 2,412 392 395 46 451
71 Santa Ana Unified . . . . . . . . . . . . . . . . California 57,250 9,166 5,523 2,076 5,774 3,816 1,385 2,939 400 535 29 60572 San Francisco Unified . . . . . . . . . . . . . California 56,310 9,842 5,806 2,434 4,936 3,466 1,318 4,524 574 1,619 136 67173 Plano . . . . . . . . . . . . . . . . . . . . . . . . . . Texas 55,659 8,014 5,703 853 5,217 4,244 626 2,427 405 342 74 39774 Boston . . . . . . . . . . . . . . . . . . . . . . . . . Massachusetts 55,027 19,720 11,414 4,549 11,189 7,547 3,187 7,686 1,211 2,217 309 73975 Osceola County . . . . . . . . . . . . . . . . . . Florida 54,783 7,873 4,488 1,279 4,748 2,791 766 2,704 394 537 82 393
76 San Antonio . . . . . . . . . . . . . . . . . . . . . Texas 54,394 9,019 5,889 1,583 5,442 3,825 972 2,935 533 476 50 55077 San Bernardino Unified . . . . . . . . . . . . California 54,379 9,102 5,538 1,891 5,142 3,422 1,036 3,492 580 476 57 78178 Corona-Norco Unified . . . . . . . . . . . . . California 53,467 7,531 5,040 1,377 4,860 3,638 858 2,377 389 248 31 52779 Winston-Salem/Forsyth . . . . . . . . . . . . North Carolina 53,340 8,382 5,477 1,703 5,488 3,858 1,199 2,497 445 266 44 56880 Capistrano Unified . . . . . . . . . . . . . . . . California 53,170 7,370 4,865 1,708 4,942 3,549 1,172 2,214 381 240 31 501
81 Cumberland County. . . . . . . . . . . . . . . North Carolina 53,053 8,062 5,414 1,656 5,099 3,686 1,103 2,508 407 369 34 57382 Pasadena . . . . . . . . . . . . . . . . . . . . . . Texas 52,942 8,429 5,826 1,054 5,158 3,979 737 2,770 431 327 50 55183 Conroe . . . . . . . . . . . . . . . . . . . . . . . . . Texas 52,664 6,817 4,980 808 4,311 3,501 545 2,257 336 188 55 40884 Cherry Creek . . . . . . . . . . . . . . . . . . . . Colorado 52,655 8,941 6,141 1,519 6,058 4,505 1,092 2,593 472 295 86 42285 Lewisville . . . . . . . . . . . . . . . . . . . . . . . Texas 51,920 8,018 5,605 910 5,197 4,156 669 2,476 418 336 75 467
86 Tucson Unified . . . . . . . . . . . . . . . . . . . Arizona 51,720 8,496 5,916 1,373 3,999 3,236 623 4,132 1,700 262 50 38087 Howard County . . . . . . . . . . . . . . . . . . Maryland 51,555 14,747 9,019 3,504 9,793 6,651 2,633 4,798 693 757 83 1,04088 Clayton County . . . . . . . . . . . . . . . . . . Georgia 51,018 8,461 5,408 1,486 5,333 3,719 1,107 2,544 428 403 66 41989 Jordan . . . . . . . . . . . . . . . . . . . . . . . . . Utah 50,961 5,558 3,283 1,367 3,486 2,173 966 1,717 173 231 33 34790 Columbus . . . . . . . . . . . . . . . . . . . . . . Ohio 50,488 14,008 8,795 3,478 7,153 5,067 1,785 6,323 1,170 1,389 193 783
91 Omaha . . . . . . . . . . . . . . . . . . . . . . . . . Nebraska 50,340 11,173 6,290 2,304 7,412 4,616 1,702 3,253 241 240 166 56492 Atlanta . . . . . . . . . . . . . . . . . . . . . . . . . Georgia 50,009 13,146 7,523 3,085 5,685 4,549 1,162 7,000 637 936 358 61593 Brownsville . . . . . . . . . . . . . . . . . . . . . Texas 49,655 8,930 6,154 1,219 5,318 4,094 760 3,010 448 543 40 45294 Henrico County . . . . . . . . . . . . . . . . . . Virginia 49,654 8,892 5,779 1,954 5,415 3,822 1,266 3,122 393 540 104 51495 Wichita Unified . . . . . . . . . . . . . . . . . . . Kansas 49,389 10,249 6,078 2,515 5,854 3,834 1,609 3,981 839 530 127 670
96 Seattle . . . . . . . . . . . . . . . . . . . . . . . . . Washington 49,269 11,124 7,001 2,257 6,610 4,612 1,459 4,179 931 349 134 69497 Anchorage . . . . . . . . . . . . . . . . . . . . . . Alaska 48,765 14,963 7,614 7,140 8,602 4,747 3,328 6,000 1,763 751 111 85198 Garden Grove Unified . . . . . . . . . . . . . California 47,999 8,548 5,388 2,251 5,508 3,675 1,457 2,663 428 314 31 54599 Sacramento Unified . . . . . . . . . . . . . . . California 47,940 9,670 5,291 2,804 5,958 3,338 1,790 3,334 530 587 79 658100 San Juan Unified . . . . . . . . . . . . . . . . . California 47,245 8,649 5,424 1,980 5,245 3,528 1,228 3,119 324 622 68 716
1 Enrollments reflect fall 2011 memberships reported to the National Center for Education Statistics on the Common Core of Data (CCD) agency universe file—”Local Education Agency (School District) Universe Survey: School Year 2011–12, Provisional Version 1a.” Enrollments for state educational facilities, federal school systems, and charter schools whose charters are held by a nongovernmental entity have been excluded. Enrollments from the CCD agency universe file were subject to adjustment if the enrollments were inconsistent with the finances reported.
2 Includes amounts not shown separately.Notes: See Appendix B for a description of state-specific reporting anomalies. Payments to other school systems are excluded in this table. Expenditures for adult education, community services, and other nonelementary-secondary programs are also excluded.
Survey of School System Finances statistics include the finances of charter schools whose charters are held directly by a government or a government agency. Charter schools whose charters are held by nongovernmental entities are deemed to be out of scope for the Survey of School System Finances.
Source: U.S. Census Bureau, 2012 Census of Governments: Finance—Survey of School System Finances. Data are not subject to sampling error, but for information on nonsampling error and definitions, see introductory text. Data users who create their own estimates from these tables should cite the U.S. Census Bureau as the source of the original data only.

Public Education Finances: 2012 27 U.S. Census Bureau
Table 19.Population, Enrollment, and Personal Income by State: Fiscal Years 2011 and 2012(Detail may not add to total because of rounding)
Geographic areaState population (in thousands)1 Elementary-secondary enrollment Personal income
(calendar year, in million dollars)2
2012 2011 20123 20114 2011 2010 United States . . . . 313,914 311,588 48,212,483 48,275,975 13,179,561 12,308,496
Alabama . . . . . . . . . . . . 4,822 4,804 744,621 746,933 167,787 161,314Alaska . . . . . . . . . . . . . . 731 724 130,771 131,704 34,827 31,243Arizona . . . . . . . . . . . . . 6,553 6,467 942,738 946,571 229,238 216,590Arkansas . . . . . . . . . . . . 2,949 2,939 475,671 475,551 100,005 94,581California . . . . . . . . . . . . 38,041 37,684 6,203,034 6,202,604 1,683,204 1,564,209
Colorado . . . . . . . . . . . . 5,188 5,116 843,120 834,832 226,032 212,545Connecticut . . . . . . . . . . 3,590 3,587 522,451 530,132 207,162 198,178Delaware . . . . . . . . . . . . 917 908 118,624 119,878 38,873 35,475District of Columbia . . . . 632 619 44,618 44,199 46,104 43,082Florida . . . . . . . . . . . . . . 19,318 19,082 2,658,559 2,636,404 761,303 722,368
Georgia . . . . . . . . . . . . . 9,920 9,812 1,669,156 1,666,039 356,836 335,371Hawaii . . . . . . . . . . . . . . 1,392 1,378 182,706 179,601 60,095 55,832Idaho . . . . . . . . . . . . . . . 1,596 1,584 267,556 265,713 52,954 49,577Illinois . . . . . . . . . . . . . . . 12,875 12,860 2,071,481 2,072,114 567,197 539,680Indiana . . . . . . . . . . . . . . 6,537 6,516 1,006,627 1,023,220 236,815 220,866
Iowa . . . . . . . . . . . . . . . . 3,074 3,064 495,870 493,493 130,131 115,548Kansas . . . . . . . . . . . . . . 2,886 2,870 485,591 482,692 120,783 110,205Kentucky . . . . . . . . . . . . 4,380 4,367 681,827 672,958 150,850 141,302Louisiana . . . . . . . . . . . . 4,602 4,575 665,478 665,109 176,690 168,704Maine . . . . . . . . . . . . . . . 1,329 1,329 187,247 186,835 51,653 48,620
Maryland . . . . . . . . . . . . 5,885 5,840 853,778 851,971 306,001 281,305Massachusetts . . . . . . . . 6,646 6,607 922,683 924,903 358,218 335,264Michigan . . . . . . . . . . . . 9,883 9,877 1,421,312 1,455,966 365,753 339,044Minnesota . . . . . . . . . . . 5,379 5,347 799,736 798,891 241,352 225,853Mississippi . . . . . . . . . . . 2,985 2,977 490,619 490,526 95,854 91,600
Missouri . . . . . . . . . . . . . 6,022 6,009 893,221 896,702 228,270 218,278Montana . . . . . . . . . . . . . 1,005 998 142,237 141,529 36,630 34,094Nebraska . . . . . . . . . . . . 1,856 1,842 300,941 297,659 80,420 72,190Nevada . . . . . . . . . . . . . 2,759 2,720 428,526 429,610 101,717 96,751New Hampshire . . . . . . . 1,321 1,318 190,778 189,275 62,651 57,898
New Jersey . . . . . . . . . . 8,865 8,835 1,330,300 1,399,409 471,188 443,742New Mexico . . . . . . . . . . 2,086 2,079 328,690 331,373 72,300 68,050New York . . . . . . . . . . . . 19,570 19,502 2,642,163 2,677,412 1,012,406 952,673North Carolina . . . . . . . . 9,752 9,651 1,462,172 1,448,117 352,455 330,826North Dakota . . . . . . . . . 700 685 97,555 96,255 32,332 28,646
Ohio . . . . . . . . . . . . . . . . 11,544 11,541 1,630,865 1,655,534 446,136 414,567Oklahoma . . . . . . . . . . . 3,815 3,784 664,200 658,163 147,430 133,616Oregon . . . . . . . . . . . . . . 3,899 3,868 566,525 559,631 146,001 137,821Pennsylvania . . . . . . . . . 12,764 12,744 1,644,759 1,670,854 558,345 514,352Rhode Island . . . . . . . . . 1,050 1,051 137,400 139,157 46,881 44,207
South Carolina . . . . . . . . 4,724 4,673 715,744 713,511 159,747 149,283South Dakota . . . . . . . . . 833 824 127,726 125,613 36,932 32,303Tennessee . . . . . . . . . . . 6,456 6,400 998,638 986,382 237,618 223,166Texas . . . . . . . . . . . . . . . 26,059 25,632 4,844,744 4,800,196 1,053,552 965,236Utah . . . . . . . . . . . . . . . . 2,855 2,814 553,873 545,395 96,175 89,152
Vermont . . . . . . . . . . . . . 626 627 87,968 86,982 26,888 24,871Virginia . . . . . . . . . . . . . . 8,186 8,104 1,257,332 1,250,852 381,930 354,127Washington . . . . . . . . . . 6,897 6,823 1,044,856 1,042,979 303,088 283,368West Virginia . . . . . . . . . 1,855 1,855 282,088 282,130 62,737 58,980Wisconsin . . . . . . . . . . . 5,726 5,710 863,314 864,251 232,094 216,339Wyoming . . . . . . . . . . . . 576 567 89,994 88,165 27,920 25,604
1 U.S. Department of Commerce, U.S. Census Bureau; Internet release date: December 2012. 2 U.S. Department of Commerce, Bureau of Economic Analysis; Internet release dates (for revised state personal income estimates): March 25, 2014 (2011 data) and March 27, 2013 (2010 data). 3 Enrollments represent fall 2011 memberships collected by the National Center for Education Statistics (NCES) on the Common Core of Data (CCD) agency universe file—“Local Education Agency
(School District) Universe Survey: School Year 2011–12, Provisional Version 1a.” Enrollments for state educational facilities, federal school systems, and charter schools whose charters are held by a nongovernmental entity have been excluded. Enrollments from the CCD agency universe file were subject to adjustment if the enrollments were inconsistent with the finances reported.
4 Enrollments represent fall 2010 memberships collected by NCES on the CCD agency universe file—“Local Education Agency (School District) Universe Survey: School Year 2010–11, Provisional Version 2a.” Enrollments for state educational facilities, federal school systems, and charter schools whose charters are held by a nongovernmental entity have been excluded. Enrollments from the CCD agency universe file were subject to adjustment if the enrollments were inconsistent with the finances reported.
Note: Totals for the United States include all 50 states and the District of Columbia.Source: U.S. Census Bureau, 2012 Census of Governments: Finance—Survey of School System Finances. Data are not subject to sampling error, but for information on nonsampling error and
definitions, see introductory text. Data users who create their own estimates from these tables should cite the U.S. Census Bureau as the source of the original data only.

28 Public Education Finances: 2012 U.S. Census Bureau
Table 20.Per Pupil Current Spending (PPCS) Amounts and 1-Year Percentage Changes for PPCS of Public Elementary-Secondary School Systems by State: Fiscal Years 2007–2012(In dollars. For meaning of abbreviations and symbols, see footnotes)
Geographic area2012 2011 2010 2009 2008 2007
PPCSPercentage
change1 PPCSPercentage
change1 PPCSPercentage
change1 PPCSPercentage
change1 PPCSPercentage
change1 PPCS United States . . . . 10,608 Z 10,608 0 .1 10,600 1 .0 10,499 2 .3 10,259 6 .1 9,666
Alabama . . . . . . . . . . . . 8,562 –2.8 8,813 –0.8 8,881 0.1 8,870 –2.6 9,103 8.5 8,391Alaska . . . . . . . . . . . . . . 17,390 4.3 16,674 5.6 15,783 1.5 15,552 6.3 14,630 18.9 12,300Arizona . . . . . . . . . . . . . 7,559 –1.4 7,666 –2.3 7,848 0.4 7,813 2.7 7,608 5.7 7,196Arkansas . . . . . . . . . . . . 9,411 0.6 9,353 2.3 9,143 5.0 8,712 2.0 8,541 3.1 8,284California . . . . . . . . . . . . 9,183 0.4 9,149 –2.4 9,375 –2.9 9,657 –2.1 9,863 7.8 9,152
Colorado . . . . . . . . . . . . 8,548 –2.0 8,724 –1.5 8,853 1.5 8,718 –4.0 9,079 11.2 8,167Connecticut . . . . . . . . . . 16,274 4.2 15,617 4.8 14,906 2.6 14,531 4.9 13,848 6.7 12,979Delaware . . . . . . . . . . . . 13,865 9.3 12,685 2.4 12,383 1.0 12,257 Z 12,253 3.6 11,829District of Columbia . . . . 17,468 –5.4 18,475 –1.0 18,667 13.8 16,408 12.4 14,594 1.9 14,324Florida . . . . . . . . . . . . . . 8,372 –5.8 8,887 1.7 8,741 –0.2 8,760 –3.0 9,035 6.1 8,514
Georgia . . . . . . . . . . . . . 9,247 –0.1 9,253 –1.5 9,394 –2.7 9,650 –1.4 9,788 7.2 9,127Hawaii . . . . . . . . . . . . . . 12,054 0.4 12,004 2.1 11,754 –5.2 12,399 5.1 11,800 6.7 11,060Idaho . . . . . . . . . . . . . . . 6,659 –2.4 6,824 –4.0 7,106 0.2 7,092 2.3 6,931 4.6 6,625Illinois . . . . . . . . . . . . . . . 12,015 1.5 11,834 1.7 11,634 7.4 10,835 5.7 10,246 7.2 9,555Indiana . . . . . . . . . . . . . . 9,719 3.7 9,372 –2.5 9,611 2.6 9,369 3.7 9,036 1.1 8,938
Iowa . . . . . . . . . . . . . . . . 10,038 2.4 9,807 0.4 9,763 0.6 9,707 4.7 9,267 5.7 8,769Kansas . . . . . . . . . . . . . . 9,748 2.6 9,498 –2.2 9,715 –2.4 9,951 2.9 9,667 7.6 8,988Kentucky . . . . . . . . . . . . 9,391 0.9 9,309 4.0 8,948 2.2 8,756 0.8 8,686 4.5 8,309Louisiana . . . . . . . . . . . . 11,379 6.1 10,723 0.8 10,638 1.0 10,533 5.8 9,954 11.5 8,928Maine . . . . . . . . . . . . . . . 12,189 –3.5 12,630 3.0 12,259 –0.4 12,304 6.3 11,572 1.6 11,387
Maryland . . . . . . . . . . . . 13,609 –1.9 13,871 1.0 13,738 2.1 13,449 3.7 12,966 10.6 11,724Massachusetts . . . . . . . . 14,142 1.4 13,941 2.6 13,590 –3.7 14,118 4.9 13,454 5.6 12,738Michigan . . . . . . . . . . . . 10,855 0.3 10,823 1.7 10,644 1.5 10,483 4.1 10,069 1.6 9,912Minnesota . . . . . . . . . . . 10,796 0.8 10,712 0.3 10,685 –3.7 11,098 9.4 10,140 6.3 9,539Mississippi . . . . . . . . . . . 8,164 3.0 7,928 –2.4 8,119 0.5 8,075 2.2 7,901 5.7 7,473
Missouri . . . . . . . . . . . . . 9,436 0.3 9,410 –2.3 9,634 1.1 9,529 3.4 9,216 8.1 8,529Montana . . . . . . . . . . . . . 10,464 –1.6 10,639 1.4 10,497 4.4 10,059 4.1 9,666 6.5 9,078Nebraska . . . . . . . . . . . . 11,275 4.2 10,825 0.8 10,734 6.9 10,045 4.9 9,577 4.8 9,141Nevada . . . . . . . . . . . . . 8,223 –3.6 8,527 0.5 8,483 0.7 8,422 1.7 8,285 3.7 7,993New Hampshire . . . . . . . 13,593 2.8 13,224 6.8 12,383 3.8 11,932 2.7 11,619 8.4 10,723
New Jersey . . . . . . . . . . 17,266 8.1 15,968 –5.2 16,841 3.5 16,271 –1.3 16,491 5.1 15,691New Mexico . . . . . . . . . . 8,899 –1.9 9,070 –3.3 9,384 –0.6 9,439 4.1 9,068 5.0 8,635New York . . . . . . . . . . . . 19,552 2.5 19,076 2.5 18,618 2.7 18,126 5.5 17,173 7.5 15,981North Carolina . . . . . . . . 8,200 –1.3 8,312 –1.1 8,409 –2.1 8,587 7.4 7,996 1.4 7,883North Dakota . . . . . . . . . 11,679 2.3 11,420 3.9 10,991 8.3 10,151 4.9 9,675 7.2 9,022
Ohio . . . . . . . . . . . . . . . . 11,204 –0.2 11,223 1.7 11,030 4.5 10,560 3.8 10,173 3.8 9,799Oklahoma . . . . . . . . . . . 7,466 –1.6 7,587 –3.9 7,896 0.1 7,885 2.6 7,685 3.6 7,420Oregon . . . . . . . . . . . . . . 9,490 –2.0 9,682 0.6 9,624 –1.9 9,805 2.6 9,558 6.2 9,000Pennsylvania . . . . . . . . . 13,340 –0.9 13,467 3.6 12,995 3.9 12,512 4.0 12,035 8.4 11,098Rhode Island . . . . . . . . . 14,005 1.4 13,815 0.9 13,699 –0.1 13,707 1.2 13,539 7.4 12,612
South Carolina . . . . . . . . 9,147 1.8 8,986 –1.7 9,143 –1.5 9,277 1.2 9,170 7.5 8,533South Dakota . . . . . . . . . 8,446 –4.1 8,805 –0.6 8,858 4.1 8,507 1.7 8,367 5.3 7,944Tennessee . . . . . . . . . . . 8,294 2.6 8,088 0.3 8,065 2.1 7,897 2.0 7,739 8.8 7,113Texas . . . . . . . . . . . . . . . 8,261 –4.7 8,671 –0.9 8,746 2.4 8,540 2.6 8,320 6.4 7,818Utah . . . . . . . . . . . . . . . . 6,206 –0.1 6,212 2.4 6,064 –4.6 6,356 10.3 5,765 1.4 5,683
Vermont . . . . . . . . . . . . . 16,040 0.4 15,980 4.6 15,274 0.6 15,175 6.1 14,300 6.2 13,471Virginia . . . . . . . . . . . . . . 10,656 2.8 10,364 –2.2 10,597 –3.0 10,930 2.5 10,659 4.4 10,210Washington . . . . . . . . . . 9,637 1.6 9,483 0.3 9,452 –1.0 9,550 5.0 9,099 8.6 8,377West Virginia . . . . . . . . . 11,445 –3.4 11,846 2.8 11,527 11.2 10,367 5.2 9,852 2.5 9,611Wisconsin . . . . . . . . . . . 11,042 –6.2 11,774 3.6 11,364 2.6 11,078 3.7 10,680 4.0 10,267Wyoming . . . . . . . . . . . . 15,897 0.3 15,849 4.5 15,169 4.1 14,573 5.3 13,840 4.7 13,217
Z Represents zero or rounds to zero.1 Percentage change column displays percentage change from prior year per pupil current spending amount.Note: See Appendix B for a description of state-specific reporting anomalies. Payments to other school systems are excluded from this table. Expenditures for adult education, community services, and other
nonelementary-secondary programs are also excluded. Enrollments used to calculate per pupil amounts represent fall memberships collected by the National Center for Education Statistics on the Common Core Data (CCD) agency universe file—“Local Education Agency (School District) Universe Survey.” Enrollments for state educational facilities, federal school systems, and charter schools whose charters are held by a nongovernmental entity have been excluded. Enrollments from the CCD agency universe file were subject to adjustment if the enrollments were inconsistent with the finances reported. Survey of School System Finances statistics include the finances of charter schools whose charters are held directly by a government or a government agency. Charter schools whose charters are held by nongovernmental entities are deemed to be out of scope for the Survey of School System Finances.
Source: U.S. Census Bureau, 2007, 2012 Census of Governments: Finance—Survey of School System Finances and 2008–2011 Annual Survey of School System Finances. Data are not subject to sampling error, but for information on nonsampling error and definitions, see introductory text. Data users who create their own estimates from these tables should cite the U.S. Census Bureau as the source of the original data only.

Public Education Finances: 2012 A-1 U.S. Census Bureau
Appendix A. Definitions of Selected TermsMajor categories for the U.S. Census Bureau’s classification of government finances, as applicable to school systems, are defined below.
Capital Outlay. Direct expenditure for construction of buildings, roads, and other improvements undertaken either on a contractual basis by private contractors or through a government’s own staff (i.e., force account); for purchases of equipment, land, and existing structures; and for payments on capital leases. Includes amounts for additions, replacements, and major alterations to fixed works and structures. However, expenditure for maintenance and repairs to such works and structures is classified as current spending.
Cash and Deposits. Cash on hand and on deposit, including any savings and other time deposits, as well as demand deposits.
Cash and Security Holdings. Cash, deposits, and government and private securities (bonds, notes, stocks, mortgages, etc.) except holdings of agency and private trust funds. Does not include interfund loans, receivables, and the value of real property and other fixed assets.
Construction. Production of fixed works and structures and additions, replacements, and major alterations thereto, including planning and design of specific projects, site improvements, and provision of equipment and facilities that are integral parts of a structure. Includes both construction undertaken either on a contractual basis by private contractors or through a government’s own staff (i.e., force account).
Contributions From Parent Government. Tax receipts and other amounts appropriated by a parent government and transferred to its dependent school system. Excludes intergovernmental revenue, current charges, and miscellaneous general revenue.
Current Charges. Amounts received from the public for performance of specific services benefitting the person charged and from sales of commodities and services. Includes school lunch sales (gross), tuition paid by individuals, revenue from the sale and rental of textbooks, transportation fees, and receipts from centrally-administered student activity funds. Excludes amounts received from other governments and interfund transfers.
Current Operation. Direct expenditure for salaries, employee benefits, purchased professional and technical services, purchased property and other services, and supplies. It includes gross school system expenditure for instruction, support services, and noninstructional
functions. It excludes expenditure for debt service, capital outlay, and reimbursement to other governments (including other school systems). Also excluded are payments made on behalf of the school system by other governments including employee retirement payments made by state governments to state retirement funds and to social security. Employer contributions made by those few school systems that have their own retirement systems (such as the Chicago Board of Education and the Denver Public School System) into their own retirement funds are excluded. Current operation expenditure is a standard classification item used in all Census Bureau government finance reports.
Current Spending. Comprises current operation expenditure (as defined above), payments made by the state government on behalf of school systems, and transfers made by school systems into their own retirement funds. This classification is used only in Census Bureau education reports in an effort to provide statistics for users who wish to make interstate comparisons. It is not used in other government finance reports to avoid double counting expenditure between levels of government and funds. While expenditure made by the state government on behalf of the school systems is available on a state aggregate basis, it is frequently not available for each school system in given states. Therefore, these payments are included under current spending in the tables which display state totals and are often estimated for the local school systems to be included in the tables which display individual school units. Appendix B identifies this anomaly on a state-by-state basis.
Debt. Short-and long-term credit obligations of a school system or that portion of a parent government’s credit obligations devoted to a dependent system. Excludes non interest-bearing short-term obligations, interfund obligations, amounts owed in a trust or agency capacity, leases, advances, and contingent loans from other governments, and rights of individuals to benefits from school system employee-retirement funds.
Debt Outstanding at the End of Fiscal Year. All debt obligations remaining unpaid at the end of the fiscal year.
Elementary-Secondary Education. Prekindergarten through twelfth grade regular, special, and vocational education, as well as cocurricular, community service, and adult education programs provided by a public school system. The financial activities of these systems for all instruction, support service, and noninstructional activities are included in this category.
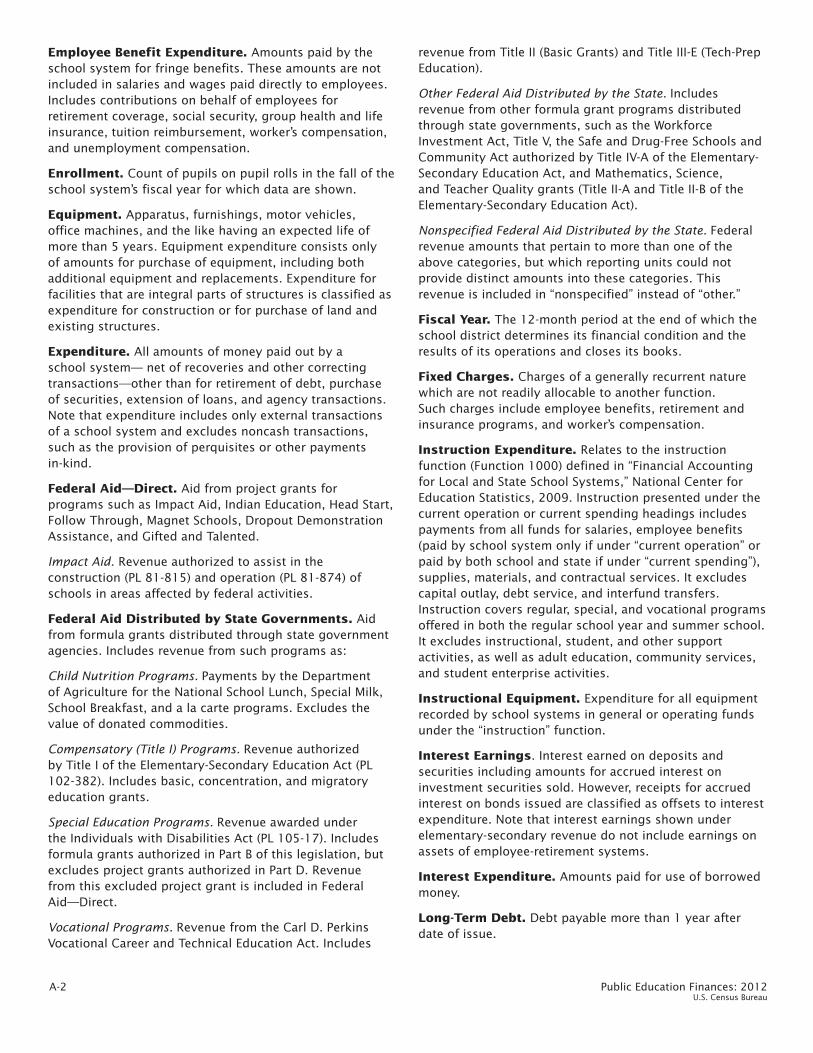
A-2 Public Education Finances: 2012 U.S. Census Bureau
Employee Benefit Expenditure. Amounts paid by the school system for fringe benefits. These amounts are not included in salaries and wages paid directly to employees. Includes contributions on behalf of employees for retirement coverage, social security, group health and life insurance, tuition reimbursement, worker’s compensation, and unemployment compensation.
Enrollment. Count of pupils on pupil rolls in the fall of the school system’s fiscal year for which data are shown.
Equipment. Apparatus, furnishings, motor vehicles, office machines, and the like having an expected life of more than 5 years. Equipment expenditure consists only of amounts for purchase of equipment, including both additional equipment and replacements. Expenditure for facilities that are integral parts of structures is classified as expenditure for construction or for purchase of land and existing structures.
Expenditure. All amounts of money paid out by a school system— net of recoveries and other correcting transactions—other than for retirement of debt, purchase of securities, extension of loans, and agency transactions. Note that expenditure includes only external transactions of a school system and excludes noncash transactions, such as the provision of perquisites or other payments in-kind.
Federal Aid—Direct. Aid from project grants for programs such as Impact Aid, Indian Education, Head Start, Follow Through, Magnet Schools, Dropout Demonstration Assistance, and Gifted and Talented.
Impact Aid. Revenue authorized to assist in the construction (PL 81-815) and operation (PL 81-874) of schools in areas affected by federal activities.
Federal Aid Distributed by State Governments. Aid from formula grants distributed through state government agencies. Includes revenue from such programs as:
Child Nutrition Programs. Payments by the Department of Agriculture for the National School Lunch, Special Milk, School Breakfast, and a la carte programs. Excludes the value of donated commodities.
Compensatory (Title I) Programs. Revenue authorized by Title I of the Elementary-Secondary Education Act (PL 102-382). Includes basic, concentration, and migratory education grants.
Special Education Programs. Revenue awarded under the Individuals with Disabilities Act (PL 105-17). Includes formula grants authorized in Part B of this legislation, but excludes project grants authorized in Part D. Revenue from this excluded project grant is included in Federal Aid—Direct.
Vocational Programs. Revenue from the Carl D. Perkins Vocational Career and Technical Education Act. Includes
revenue from Title II (Basic Grants) and Title III-E (Tech-Prep Education).
Other Federal Aid Distributed by the State. Includes revenue from other formula grant programs distributed through state governments, such as the Workforce Investment Act, Title V, the Safe and Drug-Free Schools and Community Act authorized by Title IV-A of the Elementary-Secondary Education Act, and Mathematics, Science, and Teacher Quality grants (Title II-A and Title II-B of the Elementary-Secondary Education Act).
Nonspecified Federal Aid Distributed by the State. Federal revenue amounts that pertain to more than one of the above categories, but which reporting units could not provide distinct amounts into these categories. This revenue is included in “nonspecified” instead of “other.”
Fiscal Year. The 12-month period at the end of which the school district determines its financial condition and the results of its operations and closes its books.
Fixed Charges. Charges of a generally recurrent nature which are not readily allocable to another function. Such charges include employee benefits, retirement and insurance programs, and worker’s compensation.
Instruction Expenditure. Relates to the instruction function (Function 1000) defined in “Financial Accounting for Local and State School Systems,” National Center for Education Statistics, 2009. Instruction presented under the current operation or current spending headings includes payments from all funds for salaries, employee benefits (paid by school system only if under “current operation” or paid by both school and state if under “current spending”), supplies, materials, and contractual services. It excludes capital outlay, debt service, and interfund transfers. Instruction covers regular, special, and vocational programs offered in both the regular school year and summer school. It excludes instructional, student, and other support activities, as well as adult education, community services, and student enterprise activities.
Instructional Equipment. Expenditure for all equipment recorded by school systems in general or operating funds under the “instruction” function.
Interest Earnings. Interest earned on deposits and securities including amounts for accrued interest on investment securities sold. However, receipts for accrued interest on bonds issued are classified as offsets to interest expenditure. Note that interest earnings shown under elementary-secondary revenue do not include earnings on assets of employee-retirement systems.
Interest Expenditure. Amounts paid for use of borrowed money.
Long-Term Debt. Debt payable more than 1 year after date of issue.
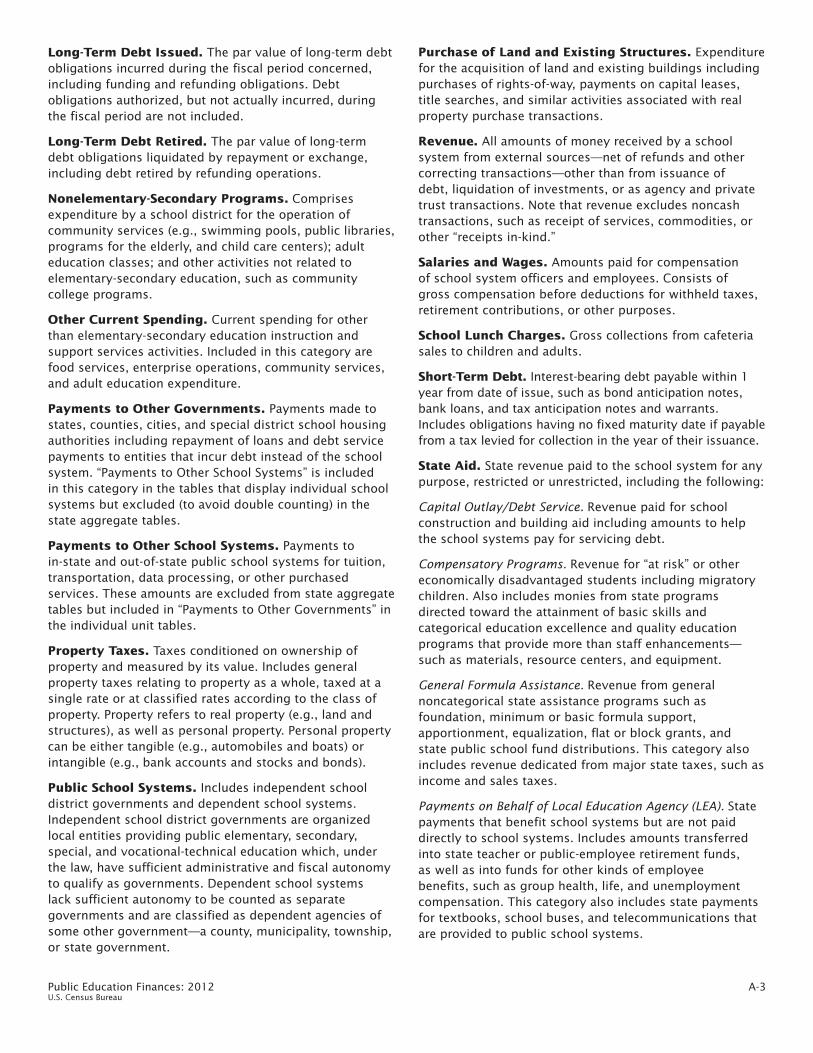
Public Education Finances: 2012 A-3 U.S. Census Bureau
Long-Term Debt Issued. The par value of long-term debt obligations incurred during the fiscal period concerned, including funding and refunding obligations. Debt obligations authorized, but not actually incurred, during the fiscal period are not included.
Long-Term Debt Retired. The par value of long-term debt obligations liquidated by repayment or exchange, including debt retired by refunding operations.
Nonelementary-Secondary Programs. Comprises expenditure by a school district for the operation of community services (e.g., swimming pools, public libraries, programs for the elderly, and child care centers); adult education classes; and other activities not related to elementary-secondary education, such as community college programs.
Other Current Spending. Current spending for other than elementary-secondary education instruction and support services activities. Included in this category are food services, enterprise operations, community services, and adult education expenditure.
Payments to Other Governments. Payments made to states, counties, cities, and special district school housing authorities including repayment of loans and debt service payments to entities that incur debt instead of the school system. “Payments to Other School Systems” is included in this category in the tables that display individual school systems but excluded (to avoid double counting) in the state aggregate tables.
Payments to Other School Systems. Payments to in-state and out-of-state public school systems for tuition, transportation, data processing, or other purchased services. These amounts are excluded from state aggregate tables but included in “Payments to Other Governments” in the individual unit tables.
Property Taxes. Taxes conditioned on ownership of property and measured by its value. Includes general property taxes relating to property as a whole, taxed at a single rate or at classified rates according to the class of property. Property refers to real property (e.g., land and structures), as well as personal property. Personal property can be either tangible (e.g., automobiles and boats) or intangible (e.g., bank accounts and stocks and bonds).
Public School Systems. Includes independent school district governments and dependent school systems. Independent school district governments are organized local entities providing public elementary, secondary, special, and vocational-technical education which, under the law, have sufficient administrative and fiscal autonomy to qualify as governments. Dependent school systems lack sufficient autonomy to be counted as separate governments and are classified as dependent agencies of some other government—a county, municipality, township, or state government.
Purchase of Land and Existing Structures. Expenditure for the acquisition of land and existing buildings including purchases of rights-of-way, payments on capital leases, title searches, and similar activities associated with real property purchase transactions.
Revenue. All amounts of money received by a school system from external sources—net of refunds and other correcting transactions—other than from issuance of debt, liquidation of investments, or as agency and private trust transactions. Note that revenue excludes noncash transactions, such as receipt of services, commodities, or other “receipts in-kind.”
Salaries and Wages. Amounts paid for compensation of school system officers and employees. Consists of gross compensation before deductions for withheld taxes, retirement contributions, or other purposes.
School Lunch Charges. Gross collections from cafeteria sales to children and adults.
Short-Term Debt. Interest-bearing debt payable within 1 year from date of issue, such as bond anticipation notes, bank loans, and tax anticipation notes and warrants. Includes obligations having no fixed maturity date if payable from a tax levied for collection in the year of their issuance.
State Aid. State revenue paid to the school system for any purpose, restricted or unrestricted, including the following:
Capital Outlay/Debt Service. Revenue paid for school construction and building aid including amounts to help the school systems pay for servicing debt.
Compensatory Programs. Revenue for “at risk” or other economically disadvantaged students including migratory children. Also includes monies from state programs directed toward the attainment of basic skills and categorical education excellence and quality education programs that provide more than staff enhancements—such as materials, resource centers, and equipment.
General Formula Assistance. Revenue from general noncategorical state assistance programs such as foundation, minimum or basic formula support, apportionment, equalization, flat or block grants, and state public school fund distributions. This category also includes revenue dedicated from major state taxes, such as income and sales taxes.
Payments on Behalf of Local Education Agency (LEA). State payments that benefit school systems but are not paid directly to school systems. Includes amounts transferred into state teacher or public-employee retirement funds, as well as into funds for other kinds of employee benefits, such as group health, life, and unemployment compensation. This category also includes state payments for textbooks, school buses, and telecommunications that are provided to public school systems.
A-4 Public Education Finances: 2012 U.S. Census Bureau
Special Education Programs. Revenue for the education of physically- and mentally-handicapped students.
Staff Improvement Programs. Revenue for programs designed to improve the quantity and quality of school system staff. Examples include programs for additional teacher units, teacher benefits such as retirement and social security contributions paid directly to the school system, mentor teachers, teacher induction, staff development contracts and stipends, career ladder contracts, in-service training, health insurance, principal leadership, teacher quality contracts, and salaries for specific types of instructional and support staff.
Transportation Programs. Payments for various state transportation aid programs, such as those that compensate the school system for part of its transportation expense and those that provide reimbursement for transportation salaries or school bus purchase.
Vocational Programs. Revenue for state vocational education assistance programs including career education programs.
Other State Aid. All other state revenue that is paid directly to the school systems including funds for bilingual education, gifted and talented programs, food services, debt services, instructional materials, textbooks, computer equipment, library resources, guidance and psychological services, driver education, energy conservation, enrollment increases and losses, health, alcohol and drug abuse, AIDS, child abuse, summer school, prekindergarten and early childhood, adult education (excluding vocational), desegregation, private schools, safety and law enforcement, and community services. In cases where these programs are covered under a state government’s general formula assistance program, revenue will be shown under “general formula assistance” instead of under this category.
Nonspecified State Aid. State revenue amounts that pertain to more than one of the above categories, but which reporting units could not provide distinct amounts into these categories. This revenue is included in “nonspecified” instead of “other.”
Support Services Expenditure. Relates to support services functions (Function 2000) defined in “Financial Accounting for Local and State School Systems,” National Center for Education Statistics, 2009. Support services presented under the current operation or current spending headings include payments from all funds for salaries, employee benefits (paid by school system only if under “current operation” or paid by both school and state if under “current spending”), supplies, materials, and contractual services. It excludes capital outlay, debt service, and interfund transfers. It includes expenditure for the following functions:
General Administration. (Function 2300) Expenditure for board of education and executive administration (office of the superintendent) services.
Instructional Staff Support. (Function 2200) Expenditure for supervision of instruction service improvements, curriculum development, instructional staff training, and media, library, audiovisual, television, and computer-assisted instruction services.
Operation and Maintenance of Plant. (Function 2600) Expenditure for building services (heating, electricity, air conditioning, property insurance), care and upkeep of grounds and equipment, nonstudent transportation vehicle operation and maintenance, and security services.
Pupil Support Services. (Function 2100) Expenditure for attendance record-keeping, social work, student accounting, counseling, student appraisal, record maintenance, and placement services. This category also includes medical, dental, nursing, psychological, and speech services.
Pupil Transportation Services. (Function 2700) Expenditure for the transportation of public school students including vehicle operation, monitoring riders, and vehicle servicing and maintenance.
School Administration. (Function 2400) Expenditure for the office of principal services.
Other Support Services. Expenditure for central/business support (Function 2500) and other support (Function 2900) services. Business support services include payments for fiscal services (budgeting, receiving and disbursing funds, payroll, internal auditing, and accounting), purchasing, warehousing, supply distribution, printing, publishing, and duplicating services. Central support services include planning, research, development, and evaluation services. They also include information services, staff services (recruitment, staff accounting, noninstructional in-service training, staff health services), and data processing services.
Nonspecified Support Services. Expenditure that pertains to more than one of the above categories. In some cases, reporting units could not provide distinct expenditure amounts for each support services category. This expenditure is included in “nonspecified” instead of “other support services.”
Taxes. Compulsory contributions exacted by a school system for public purposes, except employee and employer assessments for retirement and social insurance purposes, which are classified as insurance trust revenue. All tax revenue is classified as general revenue and comprises amounts received (including interest and penalties but excluding protested amounts and refunds) from all taxes imposed by a government. Note that school system tax revenue excludes any amounts from shares of state-imposed-and-collected taxes, which are classified as intergovernmental revenue.

Public Education Finances: 2012 B-1 U.S. Census Bureau
Appendix B. Notes Relating to Education Finance DataThe characteristics of elementary-secondary school finance data are influenced by accounting requirements mandated by each state education agency. The level of financial detail that school systems must maintain varies from state to state. Different state financing methods, such as making payments on behalf of school systems to fund teacher retirement, and the use of different accounting handbooks also cause variation. This variation creates differences in the content of information presented in this report. This appendix describes, on a state-by-state basis, these differences and adjustments made to improve data comparability.
ALASKA
“Payments to other school systems” cannot be isolated in the Alaska school finance reporting system. These amounts are usually minor. They will slightly inflate the current spending and per pupil current spending amounts presented for both state aggregates and individual school systems.
Payments made by the state government into the state retirement system on behalf of Alaska school systems are included in the tables that display state totals of elementary-secondary education finances.
ARIZONA
“Payments to other school systems” cannot be isolated in the Arizona school finance reporting system. These amounts are usually minor. They will slightly inflate the current spending and per pupil current spending amounts presented for both state aggregates and individual school systems.
ARKANSAS
Changes to state and local revenue, effective in FY 1999, reflect consistency with the classification of the 25-mill uniform rate of ad valorem property tax (Amendment 74 of the Arkansas Constitution) as state revenue in the state and local government finance survey.
Payments made by the state government into the state retirement system on behalf of Arkansas school systems, as well as payments for various state-supported programs are included in the tables that display state totals of elementary-secondary education finances. These payments have been estimated for local school systems and appear in the tabular detail for state revenue and expenditure of individual school systems.
CALIFORNIA
Payments made by the state government into the state retirement system on behalf of California school systems
are included in the tables that display state totals of elementary-secondary education finances. These payments have been estimated for local school systems and appear in the tabular detail for state revenue and expenditure of individual school systems.
CONNECTICUT
The state financial reporting system does not isolate capital outlay payments for the purchase of land and existing structures. These amounts are included with amounts shown for “construction.”
Payments made by the state government into the state retirement system on behalf of Connecticut school systems are included in the tables that display state totals of elementary-secondary education finances. These payments have been estimated for local school systems and appear in the tabular detail for state revenue and expenditure of individual school systems.
Debt information for some dependent city and town school districts in Connecticut is not available and thus not reported in the data.
DELAWARE
The state financial reporting system does not isolate capital outlay payments for the purchase of land and existing structures. These amounts are included with amounts shown for “construction.”
DISTRICT OF COLUMBIA
The District of Columbia’s financial reporting system does not isolate capital outlay payments for the purchase of land and existing structures. These payments are included in “construction.”
FLORIDA
“Payments to other school systems” cannot be isolated in the Florida school finance reporting system. These amounts are usually minor. They will slightly inflate the current spending and per pupil current spending amounts presented for both state aggregates and individual school systems.
GEORGIA
Some state grants cannot be isolated in the Georgia accounting structure. These amounts are included in the “Other and nonspecified” state categories within Tables 3 and 15 of this report.
Payments made by the state government into the state retirement system on behalf of Georgia school systems are included in the tables that display state totals of

B-2 Public Education Finances: 2012 U.S. Census Bureau
elementary-secondary education finances. These payments are included in both the state aggregate tables that display elementary-secondary school finance data and the tabular detail for state revenue and expenditure of individual school systems.
IDAHO
The state financial reporting system does not isolate capital outlay payments for the purchase of land and existing structures. These amounts are included with amounts shown for “construction.”
“Payments to other school systems” cannot be isolated in the Idaho school finance reporting system. These amounts are usually minor. They will slightly inflate the current spending and per pupil current spending amounts presented for both state aggregates and individual school systems.
Payments made by the state government for unemployment insurance on behalf of Idaho school systems are included in the tables that display state totals of elementary-secondary education finances. These payments are included in both the state aggregate tables that display elementary-secondary school finance data and the tabular detail for state revenue and expenditure of individual school systems.
ILLINOIS
The state financial reporting system does not isolate capital outlay payments for the purchase of land and existing structures. These amounts are included with amounts shown for “construction.”
Payments made by the state government into the state’s public school retirement systems on behalf of Illinois school districts are included in the tables that display state totals of elementary-secondary education finances. These payments have been estimated for local school systems and appear in the tabular detail for state revenue and expenditure of individual school systems.
Illinois corporate personal property replacement tax revenue is included as a state revenue source rather than local revenue in this report.
INDIANA
Payments made by the state government into the state retirement system on behalf of Indiana school corporations are included in the tables that display state totals of elementary-secondary education finances. These payments have been estimated for local school systems and appear in the tabular detail for state revenue and expenditure of individual school systems.
KANSAS
Special Education federal grants cannot be isolated in the Kansas accounting structure. These amounts are included in “Other and nonspecified” federal revenue in Tables 2 and 15 of this report.
Payments made by the state government into the state retirement system for school employees on behalf of Kansas school systems are included in the tables that display state totals of elementary-secondary education finances. These payments are included in both the state aggregate tables that display elementary-secondary school finance data and the tabular detail for state revenue and expenditure of individual school systems.
KENTUCKY
Special Education and Vocational federal grants cannot be isolated in the Kentucky accounting structure. These amounts are included in “Other and nonspecified” federal revenue in Tables 2 and 15 of this report.
Payments made by the state government into the state teachers’ retirement system and for health and life insurance on behalf of Kentucky school systems are included in the tables that display state totals of elementary-secondary education finances. These payments have been estimated for local school systems and appear in the tabular detail for state revenue and expenditure of individual school systems.
MAINE
Payments made by the state government into the state retirement system on behalf of Maine school systems are included in the tables that display state totals of elementary-secondary education finances. These payments have been estimated for local school systems and appear in the tabular detail for state revenue and expenditure of individual school systems.
MARYLAND
Payments made by the state government into state retirement funds on behalf of Maryland school systems are included in the financial statements sent to the state education agency. These payments are included in both the state aggregate tables that display elementary-secondary school finance data and the tabular detail for state revenue and expenditure of individual school systems.
MASSACHUSETTS
Payments made by the state government into the state retirement system on behalf of Massachusetts school systems are included in the tables that display state totals of elementary-secondary education finances. These payments have been estimated for local school systems and appear in the tabular detail for state revenue and expenditure of individual school systems.
MICHIGAN
As of FY 2009, the data for Michigan exclude data for public school academies (PSAs) that are chartered by state universities and community colleges. PSAs are publicly-financed schools, but do not meet Census Bureau criteria
Public Education Finances: 2012 B-3 U.S. Census Bureau
for inclusion in this report as they have been classified by the Census Bureau as nongovernmental entities.
MINNESOTA
The state financial reporting system does not isolate capital outlay payments for the purchase of land and existing structures. These amounts are included with amounts shown for “construction.”
MISSISSIPPI
The state financial reporting system does not isolate capital outlay payments for the purchase of land and existing structures. These amounts are included with amounts shown for “construction.”
MISSOURI
Missouri’s Proposition C sales tax revenue is included as a state revenue source rather than local revenue in this report.
NEVADA
The Local School Support sales tax is included as a state revenue source rather than as a local sales tax. Revenue from the Governmental Services motor vehicle privilege tax is also included under state source revenue. The public utility franchise tax is classified as a public utility tax of the local school districts.
NEW HAMPSHIRE
Payments made by the state government into the state retirement system for teachers on behalf of New Hampshire school systems are included in the tables that display state totals of elementary-secondary education finances. These payments have been estimated for local school systems and appear in the tabular detail for state revenue and expenditure of individual school systems.
NEW JERSEY
Payments made by the state government for employer contributions to the Teachers’ Pension and Annuity Fund and for social security payments on behalf of New Jersey school systems are included in the tables that display state totals of elementary-secondary education finances. These payments are also included in the tabular detail for state revenue and expenditure of individual school systems.
NEW YORK
Instructional expenditure for the New York City School District includes expenditure for guidance counselors. This will slightly overstate instructional expenditure and slightly understate pupil support services expenditure for the New York City School District.
NORTH CAROLINA
State payments on behalf of North Carolina school systems for textbooks and the purchase of school buses
are included in the financial statements sent to the state education agency. These payments are included in both the state aggregate tables that display elementary-secondary school finance data and the tabular detail for state revenue and expenditure of individual school systems.
OKLAHOMA
Payments made by the state government into the state retirement fund and for student testing on behalf of Oklahoma school systems are included in the tables that display state totals of elementary-secondary education finances. These payments have been estimated for local school systems and appear in the tabular detail for state revenue and expenditure of individual school systems.
RHODE ISLAND
Payments made by the state government into the state retirement fund on behalf of Rhode Island school systems are included in the tables that display state totals of elementary-secondary education finances. These payments have been estimated for local school systems and appear in the tabular detail for state revenue and expenditure of individual school systems.
SOUTH CAROLINA
Payments made by the state government for student testing, transportation, and textbooks on behalf of South Carolina school systems are included in the tables that display state totals of elementary-secondary education finances. These payments have been estimated for local school systems and appear in the tabular detail for state revenue and expenditure of individual school systems.
SOUTH DAKOTA
The state financial reporting system does not isolate capital outlay payments for the purchase of land and existing structures. These amounts are included with amounts shown for “construction.”
Payments made by the state government on behalf of South Dakota school systems for telecommunications are included in the tables that display state totals of elementary-secondary education finances. These payments are also included in the tabular detail for state revenue and expenditure of individual school systems.
TEXAS
Payments made by the state government on behalf of Texas school systems into the state school employees’ retirement fund, and payments for textbooks and transportation are included in the tables that display state totals of elementary-secondary education finances. These payments have been estimated for local school systems and appear in the tabular detail for state revenue and expenditure of individual school systems.

B-4 Public Education Finances: 2012 U.S. Census Bureau
UTAH
Expenditure for adult education in Utah cannot be isolated in the state finance reporting system. These amounts will slightly inflate the “instruction,” “support services,” and per pupil current spending amounts presented at both the state aggregate and individual school system levels.
VERMONT
Payments made by the state government for employee benefits on behalf of Vermont school systems are included in the tables that display state totals of elementary-secondary education finances. These payments have been estimated for the local school systems and appear in the tabular detail for state revenue and expenditure of individual school systems.
WEST VIRGINIA
Payments made by the state government into the state teachers’ and public employees’ retirement funds on behalf of West Virginia school systems are included in the tables that display state totals of elementary-secondary education finances. These payments have been estimated for local school systems and appear in the tabular detail for state revenue and expenditure of individual school systems
WISCONSIN
Expenditure for adult education in Wisconsin cannot be isolated in the state finance reporting system. These amounts will slightly inflate the “instruction,” “support services,” and per pupil current spending amounts presented at both the state aggregate and individual school system levels.
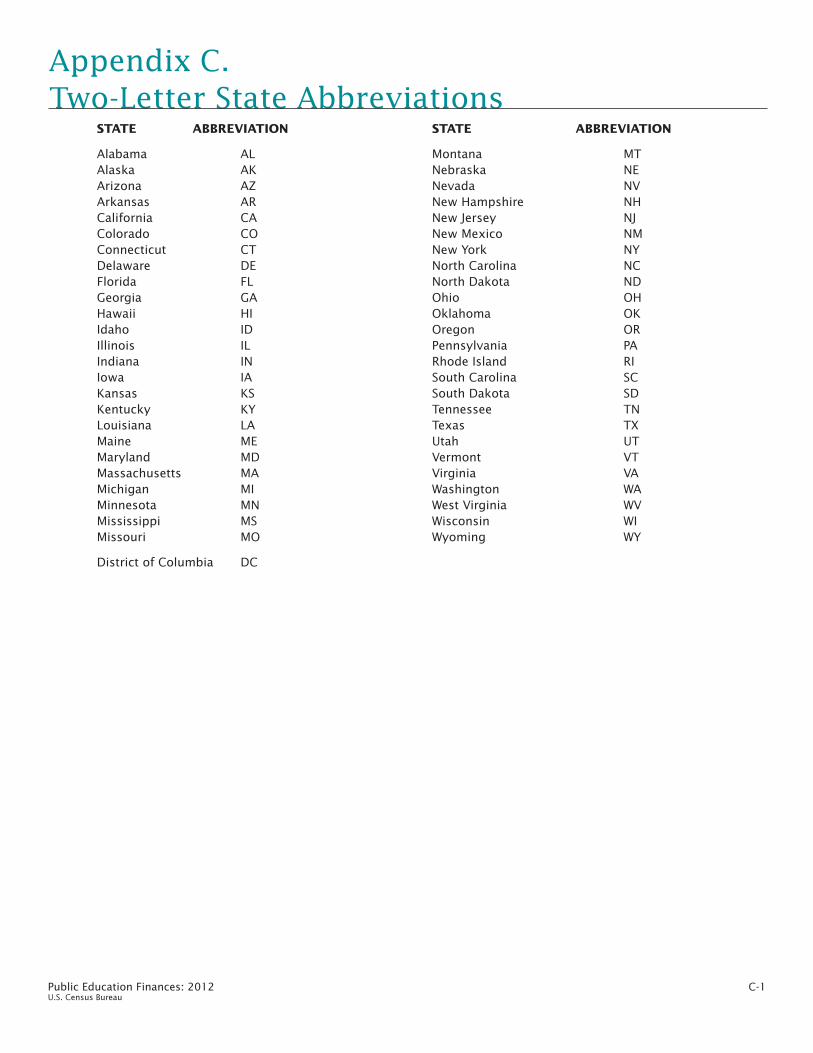
Public Education Finances: 2012 C-1 U.S. Census Bureau
Appendix C. Two-Letter State Abbreviations STATE ABBREVIATION STATE ABBREVIATION
Alabama AL Montana MT Alaska AK Nebraska NE Arizona AZ Nevada NV Arkansas AR New Hampshire NH California CA New Jersey NJ Colorado CO New Mexico NM Connecticut CT New York NY Delaware DE North Carolina NC Florida FL North Dakota ND Georgia GA Ohio OH Hawaii HI Oklahoma OK Idaho ID Oregon OR Illinois IL Pennsylvania PA Indiana IN Rhode Island RI Iowa IA South Carolina SC Kansas KS South Dakota SD Kentucky KY Tennessee TN Louisiana LA Texas TX Maine ME Utah UT Maryland MD Vermont VT Massachusetts MA Virginia VA Michigan MI Washington WA Minnesota MN West Virginia WV Mississippi MS Wisconsin WI Missouri MO Wyoming WY
District of Columbia DC

Public Education Finances: 2012 D-1 U.S. Census Bureau
Appendix D. F-33 Survey Form
Please note that this is a national form that applies to governments with wide differences in the size of their service areas, the amount of populationserved, and the extent and complexity of their financial accounts. This form has been approved by the Office of Management and Budget (OMB)and has been given the number 0607-0700. Please note that we have displayed this number in the upper right hand corner of this form. Display ofthis number confirms that we have approval from OMB to conduct this survey. If this number was not displayed, we could not request yourparticipation in this survey. We estimate public reporting burden for this collection of information to vary from 1.5 to 2.5 hours per response, with anaverage of 2 hours per response, including time for reviewing instructions, searching existing data sources, gathering and maintaining data needed,and completing and reviewing the collection of information. Send comments regarding the burden estimate or any other aspect of this collection ofinformation, including suggestions for reducing this burden, to: Paperwork Project 0607-0700, U.S. Census Bureau, 4600 Silver Hill Road,AMSD-3K138, Washington, DC 20233. You may e-mail comments to [email protected]; use "Paperwork Project 0607-0700" as the subject.
RETURN BYFAX TO
EFSS Branch at 866–394–0138
FORM F-33(1-10-2013)
U.S. DEPARTMENT OF COMMERCEEconomics and Statistics Administration
In correspondence pertaining to this report,please refer to the Census File Number aboveyour address.
(Please correct any error in name, address, and ZIP Code)
Please read the instructions on pages 6 through 8 before completing this form.NOTE
Reference numbers pertain to revenue and expenditure codes contained in Financial Accounting for Local and StateSchool Systems, National Center for Education Statistics, 2009.
AmountOmit cents
Part I REVENUE
Section A – FROM LOCAL SOURCES
4.
1. Property taxes (1110, 1140)
2. General sales or gross receipts tax (1120)
3. Public utility taxes (1190)
Individual and corporate income taxes (1130)
5. All other taxes (1190)
6. Parent government contributions (dependent school systems only – 1200)
7. Revenue from cities and counties (1200, 1320, 1330, 1420, 1430, 1960, 2100, 2200, 2800)
8. Revenue from other school systems (within state – 1321, 1421, 1951;out of state – 1331, 1350, 1431, 1952)
9. Tuition fees from pupils, parents, and other private sources (1310, 1340)
10. Transportation fees from pupils, parents, and other private sources (1410, 1440)
11. Textbook sales and rentals (1940)
12. School lunch revenues (1600)
13. District activity receipts (1700)
OMB No. 0607-0700: Approval Expires 8/31/2015
TØ6
TØ9
T15
T4Ø
T99
TØ2
D23
D11
AØ7
A11
AØ9
A13
F-33 (2012)
U.S. CENSUS BUREAU
➙
AØ8
14. Other sales and service revenues (1800)
15. Rents and royalties (1910)
A4Ø
A2Ø
16. Sale of propertyU11
2012 CENSUS OF GOVERNMENTSSURVEY OF SCHOOL SYSTEM FINANCES

D-2 Public Education Finances: 2012 U.S. Census Bureau
AmountOmit cents
Part I REVENUE – Continued
Section A – FROM LOCAL SOURCES – Continued
17. Interest earnings (1510)
18. Fines and forfeits
19. Private contributions (1920)
Section B – FROM STATE SOURCES (3100, 3200, 3800)
1. General formula assistance
2. Staff improvement programs
3. Special education programs
4. Compensatory and basic skills attainment programs
5. Bilingual education programs
6. Gifted and talented programs
7. Vocational education programs
8. School lunch programs
9. Capital outlay and debt service programs
10. Transportation programs
11. All other revenues from state sources
Section C – FROM FEDERAL SOURCES THROUGH THE STATE GOVERNMENT (4200, 4500)
1. Title I
2. Children with disabilities – IDEA
3. Math, science, and teacher quality
4. Safe and drug-free schools
5. Vocational and technical education
6. Child nutrition act – exclude commodities
7. Bilingual education
8.
Section D – FROM FEDERAL SOURCES DIRECTLY (4100, 4300, 4700, 4800)
1. Impact aid (Public Law 81–815 and Public Law 81–874)
All other federal aid through the state
2. Indian education
3. All other direct federal aid
CONTINUE WITH PART II ON PAGE 3
FORM F-33 (1-10-2013)Page 2
U22
U3Ø
U5Ø
CØ1
CØ4
CØ5
CØ6
CØ7
CØ8
CØ9
C1Ø
C11
C12
C13
C14
C15
C16
C17
C19
C25
B11
B1Ø
C2Ø
B12
B13
20. Miscellaneous other local revenue (1980, 1990)U97

Public Education Finances: 2012 D-3 U.S. Census Bureau
TOTAL (ALL currentoperation objects)
Part II CURRENT OPERATION EXPENDITURE
1. Instruction (1000)
2. Support services, pupils (2100)
3. Support services, instructional staff (2200)
CONTINUE WITH PART III ON PAGE 4
FORM F-33 (1-10-2013) Page 3
Employee benefits only(Object series 200,
except 240)
Salaries only(Object series 100)
4. Support services, general administration (2300)
5. Support services, school administration (2400)
6. Support services, operation and maintenance of plant (2600)
7. Support services, student transportation(2700)
8. Business/central/other support services (2500 and 2900)
Section B – ELEMENTARY-SECONDARY NONINSTRUCTIONAL PROGRAMS
9. Food services (3100)
10. Enterprise operations (3200)
11. Other
Section C – NONELEMENTARY-SECONDARY PROGRAMS
Section A – ELEMENTARY-SECONDARY EDUCATION INSTRUCTIONAL PROGRAMS – PREKINDERGARTEN THROUGH GRADE 12
12. Community services (3300)
13. Adult education
14. Other
Part III CAPITAL OUTLAY EXPENDITURES AmountOmit cents
1. Construction (object 450)
2. Land and existing structures (objects 710, 720, 740)
Z33 V1Ø E13
V11 V12 E17
V13 V14 EØ7
V15 V16 EØ8
V17 V18 EØ9
V21 V22 V4Ø
V23 V24 V45
V37 V38 V9Ø
V29 V3Ø E11
V32 V6Ø
V65
V7Ø
V75
V8Ø
F12
G15
(1) (2) (3)
Section D – EXHIBITS OF SELECTED ITEMS REPORTED ABOVE IN II-A AND II-B
15. Payments to private schools (object 563)
16. Payments to charter schools (object 566)
V91
V92
17. Teacher salaries – Regular education programs (program 100)
18. Teacher salaries – Special education programs (program 200)
19. Teacher salaries – Vocational education programs (program 300)
20. Teacher salaries – Other education programs (programs 400, 900)
Textbooks (function 1000, object 640)21.
Z35
Z36
Z37
Z38
V93

D-4 Public Education Finances: 2012 U.S. Census Bureau
AmountOmit cents
Part III CAPITAL OUTLAY EXPENDITURES – Continued
FORM F-33 (1-10-2013)Page 4
Part V STATE PAYMENTS ON BEHALF OF THE LOCAL EDUCATION AGENCY (Revenue source code 3900)
1. For employee benefits
2. All other (textbooks, school bus purchase, etc.)
Part VI DEBT
Section A – LONG TERM – Term of more than one year
1. Outstanding at beginning of the fiscal year
2. Issued during fiscal year (revenue code 5110)
3. Retired during fiscal year (object 831)
4. Outstanding at end of fiscal year (line 1 plus line 2 minus line 3)
Section B – SHORT TERM – Term of one year or less
1. Outstanding at beginning of fiscal year
2. Outstanding at end of fiscal year
Part VII CASH AND INVESTMENTS HELD AT END OF FISCAL YEAR
Type of assetFunds
Debt service Bond Other
Cash and deposits (include CD’s and security holdings)
Part VIII FALL MEMBERSHIP – October 2011
Enter the count of pupils enrolled on the school day closest to October 1, 2011
Membership
C38
C39
19H
21F
31F
41F
61V
66V
WØ1 W31 W61
V33
6.
Part IX
Student fees, nonspecified
Census local, NCES state revenue
Census state, NCES local revenue
SPECIAL PROCESSING ITEMS
A15
TØ7
C24
Item Code Amount
CONTINUE WITH PART IX ON PAGE 5
1.
2.
3.
Part IV OTHER EXPENDITURES BY LOCAL EDUCATION AGENCY
3. Payments to other school systems (objects 511, 512, 561, 562, 564, 565, 567, 591, 592)
4. Payments to state governments (object 569)
Q11
L12
Payments to local governments (object 920)5.
6. Interest on school system indebtedness (object 832)
M12
Ι86
3. Instructional equipment (object 730, function 1000)
4. All other equipment (object 730, functions 2000, 3000, 4000)
KØ9
K1Ø
1. Total salaries and wages (object 100 – ALL functions)
Total employee benefit payments (object 200 – ALL functions)
Z32
Z34
2.

Public Education Finances: 2012 D-5 U.S. Census Bureau
FORM F-33 (1-10-2013) Page 5
Part IX
10. State payment on behalf of the LEA, school administration employee benefits
SPECIAL PROCESSING ITEMS – Continued
JØ9
Item Code Amount
Remarks – Please use this space for any explanation that may be essential in understanding your reported data.If additional space is required, please attach a separate sheet.
12. State payment on behalf of the LEA, student transportation employee benefits
13. State payment on behalf of the LEA, business/central/other employee benefits
14. State payment on behalf of the LEA, other employee benefits
15. Support services expenditures, nonspecified
16. Equipment expenditure, nonspecified
17. Own retirement system transfer, instruction
18. Own retirement system transfer, support services
19. Federal revenue on behalf of school system
20. State payment on behalf of the LEA, instructional nonbenefits
21. State payment on behalf of the LEA, support services nonbenefits
22. State payment on behalf of the LEA, noninstructional programs nonbenefits
23. State payment on behalf of the LEA, nonelementary-secondary programs
24. State payment on behalf of the LEA, capital outlay
11.
J45
J9Ø
J1Ø
V85
K11
J12
J11
B23
J14
J96
J97
J98
J99
J4ØState payment on behalf of the LEA, operation and maintenance of plant employee benefits
4.
5.
6.
7.
8.
9.
State revenue, nonspecified
Federal revenue, nonspecified
State payment on behalf of the LEA, instruction employee benefits
State payment on behalf of the LEA, pupil support services employee benefits
State payment on behalf of the LEA, instructional staff support employee benefits
State payment on behalf of the LEA, general administration employee benefits
C35
C36
J13
J17
JØ7
JØ8
Part X ARRA FUNDS (Exhibits of selected items reported in Sections I-C,II-A, II-B, and III)
1. ARRA revenues – Title I
2. ARRA expenditures – Current operation expenditures for elementary-secondaryeducation programs (objects 100–600, 810, 820, and 890 for functions 1000, 2000,3100, and 3200)
HR1
HE1
3. ARRA expenditures – Capital outlay expenditures (objects 700, 710, 720, 730 and740 for functions 1000, 2000, 3100, and 3200, and ALL objects for function 4000) HE2

D-6 Public Education Finances: 2012 U.S. Census Bureau
BASIC INSTRUCTIONS AND SUGGESTIONS
FORM F-33 (1-10-2013)Page 6
FINAL AUDITED FIGURES ARE UNNECESSARY. If substantially accuratefigures can be supplied on a preliminary basis, please do notdelay submitting this report.
1. INCLUDE the unduplicated revenues and expenditures from all funds:
a. General fund
b. Special revenue funds
c. Federal projects funds
d. Debt service fund
2. EXCLUDE transfers of monies between funds, agency transactions,transactions of private trust funds, purchase of commodities, and purchase of securities for investment purposes.
3. In cases where revenues were not received, no expenditures made, or nodebt or assets, report "0" for the items. Please describe the basis of anyestimates or prorations used to report amounts requested on this form in the"Remarks" section.
Part I – REVENUE
Section A – FROM LOCAL SOURCES
Lines 1–5. Independent school districts should report their tax receipts here. Line 1 (property taxes) will be applicable to most independent school districts. Lines 2 through 5 will be applicable to only a relatively small number of districts. Taxes reported here should be those which the district has the power to levy. State taxes and state property tax relief payments should be excluded here and reported instead in section B. Include current and delinquent tax revenues and penalties.
Line 6. Dependent school systems should report their tax receipts and any other amounts appropriated by their parent government on line 6(Census code T02).
Line 7. Report taxes for education levied by separate county and citygovernments and transferred to the school system. Include moniesreceived from debt issued in the name of a local (nonschool system)government and transferred to the school system. Regional schoolsystems should report assessments received from cities and towns here.Assessments received from independent school districts should bereported on line 8.
Line 8. Report payments received from other school systems, both within and outside the state, for tuition, transportation, and other services (such as purchasing and data processing). Regional school systems should report assessments received from independent schooldistricts here. Assessments received from cities and towns should bereported on line 7.
Lines 9–14. Report all student fees on these lines. Gross receipts from sale of school breakfasts, lunches, and milk (from students, teachers, adults, but not from state or federal funds) should be entered on line 12.Gross district activity receipts for those funds under control of the custodian of district funds should be included on line 13. Revenues fromother sales and services, including community services activities should be entered on line 14. Report in Part IX the amount of any student fee that cannot be reported because the fee covers more than one of the items on lines 9 through 14, such as lump sum fees for both tuition andtransportation.
Line 15-20. Include revenues received from allowing temporarypossession or granting rights to the use of school district buildings, land,or other properties on line 15. Report amounts received from sale of realproperty, buildings (and improvements to them), land easements,rights-of-way, and other capital assets (buses, automobiles, etc.) on line 16. Include interest earnings from all funds held by the school systemon line 17. Report revenues from penalties imposed for violations of lawon line 18. Report gifts of cash or securities from private individuals ororganizations on line 19. Report receipts from refunds of prior yearexpenditures and other revenue from local sources not provided forelsewhere on line 20. Report in Part VI the amount of monies from debtissuances.
Section B – FROM STATE SOURCES
Include all state payments made directly to the localeducation agency. Exclude state payments made on behalfof the local education agency and report instead in Part V.
Line 1. Include revenue from general noncategorical state assistanceprograms such as foundation, minimum or basic formula support, principal apportionment, equalization, flat or block grants, and state public school fund distributions. Also include state revenue dedicated from major state taxes, such as income and sales taxes. Revenues fromminor state taxes should be included on line 11.
Line 2. Report revenues from programs designed to improve the quality andquantity of local education agency staff. Examples include additional teacherunits, teacher benefits, retirement and social security paid directly to localeducation agencies, mentor teachers, teacher induction, staff developmentcontracts and stipends, career ladder contracts, in-service training, healthinsurance, principal leadership, teacher quality contracts, and salaries forspecific types of instructional and support staff (other than for staff directlyassociated with the programs described on lines 3 through 10).
Line 3. Enter revenues for the education of physically and mentally disabledstudents.
Line 4. Include revenues from state compensatory education for "at risk" orother economically disadvantaged students, including migratory children(unless bilingual – see line 5) and orphans. Also include amounts from stateprograms directed toward the attainment of basic skills. Include categoricaleducation excellence and quality education programs that provide more thanstaff enhancements – such as materials, resource centers, and equipment.Programs that focus on staff should be reported on line 2.
Lines 5–10. Enter state revenues for the type of program indicated. Includecareer education programs on line 7; school lunch matching payments on line8; school construction, building aid, and interest and principal payments on line 9; and bus driver salaries and bus replacements on line 10.
Line 11. Report amounts for specific programs not described above on lines 1through 10 including instructional materials, textbooks, computer equipment,library resources, guidance and psychological services, driver education,energy conservation, enrollment increases and losses, health, alcohol and drugabuse, AIDS, child abuse, summer school, prekindergarten and early childhood,adult education (excluding vocational), desegregation, private schools, safetyand law enforcement, and community services.Also include on line 11 those items financed by relatively minor state taxes,licenses, fees, and funds such as severance and license taxes, timber andmotor vehicle excise taxes, payments in lieu of taxes, refunds, landreimbursement, and forest funds.
Report in Part IX the amount of any state revenue item that cannot be reportedbecause the item covers more than one of the items on lines 1 through 11, suchas "total state revenues" not broken down by program.
Section C – FROM FEDERAL SOURCES THROUGH THE STATEGOVERNMENT
Line 1. Include federal revenues distributed through Title I (College andCareer Ready Students) of the Elementary-Secondary Education Act (ESEA) asreauthorized by the No Child Left Behind Act of 2001 (NCLB). Report basic,concentration, targeted, and finance incentive grants.
Line 2. Report federal revenues awarded under the Individuals with DisabilitiesEducation Act (IDEA 2004). Include formula grants authorized in Part B of thislegislation. Exclude project grants authorized in Part D of the law. Report theseproject grants instead in Part I-D3.
Line 3. Report math, science, and teacher quality formula and project grantsprovided under Title II-A and B of the Elementary-Secondary Education Act(ESEA) as reauthorized by the No Child Left Behind Act of 2001 (NCLB).
Line 4. Include formula and project grants for safe and drug-free schoolsdistributed under Title IV-A of the Elementary-Secondary Education Act (ESEA)as reauthorized by the the No Child Left Behind Act of 2001 (NCLB).
Line 5. Report formula grants authorized by the Carl D. Perkins Career andTechnical Education Improvement Act of 2006 (Public Law 105-332). Includerevenues from State Basic and Tech-Prep formula grants.
CONTINUE ON PAGE 7
Line 6. Include revenues from Child Nutrition Act programs (national schoollunch, special milk, school breakfast and ala carte) sanctioned by Public Law79-396 and Public Law 89-642. Report cash payments only -- excludethe value of donated commodities.
Line 8. Enter the total of all other federal funds disbursed through the state tothe local education agency. Include formula grants authorized by the WorkforceInvestment Act of 1998.
Section D – FROM FEDERAL SOURCES DIRECTLY
Line 1. Include federal payments for construction (Public Law 81-815) and formaintenance and operation (Public Law 81-874).
Line 7. Include project grants for bilingual education provided under Title III of the Elementary-Secondary Education Act (ESEA) as reauthorized by the No Child Left Behind Act of 2001 (NCLB).
Line 2. Include both project and formula grants for Indian education distributedunder Title VII (formerly Title IX) of the Elementary-Secondary Education Act(ESEA) as reauthorized by the No Child Left Behind Act of 2001 (NCLB) andthe Johnson-O’Malley Act.
e. Capital projects funds
f. Food service fund
g. District activity funds
4. For help with questions, contact the Educational Finance and SpecialStatistics Branch of the U.S. Census Bureau at 1–800–622–6193 [email protected].

Public Education Finances: 2012 D-7 U.S. Census Bureau
FORM F-33 (1-10-2013)
Part II – CURRENT OPERATION EXPENDITUREInclude for the functions shown on lines 1 though 14 expenditures for salariesand wages only (column (1)), employee benefits only (column (2)), and allcurrent operation expenditure (column (3)). Column (3) totals shouldinclude amounts entered in columns (1) and (2). Additionally,column (3) totals should include such objects as contracts, rent, insurance,utilities, maintenance services, printing, tuition paid to private schools,purchase of food, supplies, and materials.
Exclude from Part II Include instead in:
Handbook references pertain to function codes contained inFinancial Accounting for Local and State School Systems,National Center for Education Statistics, 2009.
Section A – Elementary-secondary Education InstructionalPrograms – Prekindergarten through Grade 12
Line 1. Instruction (1000). Total current operation expenditure foractivities dealing with the interaction of teachers and students in theclassroom, home, or hospital as well as co-curricular activities. Reportamounts for activities of teachers and instructional aides or assistantsengaged in regular instruction, special education, and vocational education programs. Exclude adult education programs (report on line 13).
Line 2. Pupil support (2100). Report expenditures for administrative,guidance, health, and logistical support that enhance instruction. Includeattendance, social work, student accounting, counseling, student appraisal,information, record maintenance, and placement services. Also includemedical, dental, nursing, psychological, and speech services.
Line 3. Instructional staff support (2200). Include expenditures forsupervision of instruction service improvements, curriculum development,instructional staff training, academic assessment, and media, library, andinstruction-related technology services.
Line 4. General administration (2300). Expenditure for board ofeducation and executive administration (office of the superintendent)services.
Line 5. School administration (2400). Report expenditure for the office of the principal services.
Line 6. Operation and Maintenance of Plant (2600). Expenditure forbuildings services (heating, electricity, air conditioning, property insurance), care and upkeep of grounds and equipment, nonstudenttransportation vehicle operation and maintenance, and security services.
Line 7. Student Transportation (2700). Report expenditure for vehicleoperation, monitoring riders, and vehicle servicing and maintenance.
Line 8. Business/central/other support services (2500 and 2900).Include business support expenditures for fiscal services (budgeting, receivingand disbursing funds, payroll, internal auditing, and accounting), purchasing,warehousing, supply distribution, printing, publishing, and duplicating services.Also include central support expenditures for planning, research anddevelopment, evaluation, information, management services, and expendituresfor other support services not included on lines 2 through 7. Report in Part IX,line 15 (support service expenditures, nonspecified) any item that cannot bereported because it covers more than one of the items on lines 2 through 8,such as "total support services" not broken down by function.
Section B – Elementary-secondary Noninstructional Programs
Line 10. Enterprise operations (3200). Include expenditure forbusiness-like activities (such as a bookstore) where the costs are recouped largely with user charges.
Line 11. Other. Report the expenditure for other elementary-secondary non-instructional activities not related to food services or enterprise operations.Nonenterprise student activities should be included with "instruction" on line 1.
Section C – Nonelementary-secondary ProgramsLine 12. Community services (3300). Include any local education agencyexpenditure for providing noneducation services such as, operation of aswimming pool, public library, programs for the elderly, and child care centers.
Line 13. Adult education. Expenditures for basic adult educationclasses, such as GED or high school equivalency. Post-secondary programsfor adults should be reported on line 14.
Line 14. Other. All other nonelementary-secondary programs such as any post-secondary programs for adults.
Part III – CAPITAL OUTLAY EXPENDITURESInclude expenditures for construction of fixed assets (line 1); purchasing fixedassets including land and existing buildings and grounds (line 2); andequipment (lines 3 and 4). Instructional equipment (line 3) consists of allequipment (or capital outlay) recorded in general and operating funds under"instruction" – function code 1000.
Report in Part IX the amount of any equipment expenditure that cannot bebroken down into the categories of "instructional" and "other equipment."
Part IV – OTHER EXPENDITURES BY LOCAL EDUCATION AGENCYLine 1. Total salaries and wages. Enter the total expenditure for allsalaries and wages paid by the local education agency during the fiscal year.Include both here and in Part II-A, column 1, gross salaries without deductionof withholdings for income tax, employee contributions to Social Security andretirement coverage, etc. Do not include employer paid employee benefits inthese figures. The total entered for salaries and wages should at least beequal to the sum of the entries made in Part II-A, column 1, and be larger ifthe local education agency paid salaries for enterprise operations and fornonelementary-secondary program activities.
Line 3. Payments to other school systems. Report payments to in-stateand out-of-state public school systems for tuition, transportation, computer andpurchasing services, etc. Payments made to dependent school systems or toparent governments of dependent school systems should be included here.
Capital outlay expenditures Part III
Payments to other school systems Part IV, line 3Payments to the state, cities,counties, or special districts Part IV, lines 4 and 5
Debt service paymentsPart IV, line 6 and Part VI, Section, A line 3
State payments on behalf ofschool systems Part IX, lines 6–14
Also exclude inter-fund transfers and the purchase of stocks, bonds,securities, and other investment assets.
Page 7
Line 2. Total employee benefit payments. Enter the total expenditurefor all employee benefits paid by the local education agency during the fiscalyear. Include both here and in Part II-A, column 2, the employer share of stateor local employee retirement contributions, social security contributions, grouplife and health insurance, unemployment and worker’s compensation, and anytuition reimbursements. Exclude (and report in Part V) state payments madeon behalf of the local education agency. The total entered for employeebenefits should at least be equal to the sum of the entries made in Part II-A,column 2, and be larger if the local education agency paid employee benefitsfor nonelementary-secondary program activities.
CONTINUE ON PAGE 8
Section D – EXHIBITS OF SELECTED ITEMS REPORTED ABOVE INII-A AND II-BLine 15. Payments to private schools (object 563). Report allexpenditures to private schools for tuition and for any other purpose. Thesepayments will be deducted from the amounts reported in Parts II-A and II-Bwhen calculating per pupil expenditures for the school system. The fallmembership count of students supported by public school money butattending private schools should be excluded from the fall membershipreported in Part VIII. Identify in the remarks section the expenditure functionsfor which the private school payment was made, if possible. If no informationis provided, this amount will be deducted from instruction expenditure reportedin Part II-A1 when calculating per pupil expenditures.
Line 16. Payments to charter schools (object 566). Indicate in theremarks section whether fall membership counts of students attending charterschools are included in the school system’s membership reported in theCommon Core of Data Nonfiscal Survey or in Part VIII of this form. Alsoidentify in the remarks section the expenditure functions for which the charterschool payment was made, if possible. This information will be used indetermining per pupil expenditure amounts for the school system.
Lines 17–20. Teacher salaries. Report base salaries paid to certifiedteachers (object 111) and certified substitute teachers (object 113). Do notinclude salaries paid to instructional aides or assistants. Report salaries paid forregular programs (program 100) on line 17, special education programs(program 200) on line 18, vocational programs (program 300) on line 19, andother programs (programs 400, 900) on line 20. These amounts should also beincluded with the instruction salaries and total instruction amounts reported inSection A.
Line 21. Textbooks. Report expenditures for textbooks used forclassroom instruction (function 1000, object 640).
Line 3. Report the total of all other federal grants awarded directly to the localeducation agency. Include project grants authorized under Part D of IDEA, Head Start, Magnet Schools, and Gifted and Talented.
Report in Part IX the amount of any federal revenue item that cannot bereported because the item covers more than one of the items in Part IC1-9 andID1-3, such as "total federal revenues" not broken down by program.
Line 9. Food services (3100). Gross expenditure for cafeteria operations to include the purchase of food but excluding the value of donated commodities and purchase of food service equipment (reportequipment in Part III-4).
D-8 Public Education Finances: 2012 U.S. Census Bureau
FORM F-33 (1-10-2013)
Part VII – CASH AND INVESTMENTS HELD AT END OF FISCAL YEAR
Report the total amount of cash on hand and on deposit and investments infederal government, federal agency, state and local government andnongovernment securities. Report all investments at market value. Excludeaccounts receivable, value of real property, and all nonsecurity assets.
Part VIII – FALL MEMBERSHIP – OCTOBER, 2011
Include an unduplicated head count of pupils enrolled in the school system onthe closest date to October 1, 2011 as possible. Include pupils transferred intothe school system and exclude pupils transferred out. Also exclude pupilsattending private schools. You do not have to report any information in this part ifyou report the same information in the Common Core of Data Nonfiscal Survey.
Page 8
Part IX – SPECIAL PROCESSING ITEMS
These are special use items. Amounts should only be reported in this part if allpertinent financial data cannot be reported in Parts I through VIII. Before enteringdata in this part, please contact the Educational Finance and Special StatisticsBranch of the U.S. Census Bureau at 1–800–622–6193.
Line 1. Student fees, nonspecified. Report here any item in your chart ofaccounts that cannot be crosswalked into the items identified in Part I, Lines 9(tuition), 10 (transportation), 11 (textbook sales), 12 (school food service sales),or 13 (district activities). An example would be total student fees not broken downinto these separate categories.
Line 2. Census local, NCES state revenue. This category is reserved forany tax item classified as local by the U.S. Census Bureau and as state by theNational Center for Education Statistics.
Line 3. Census state, NCES local revenue. This category is reserved forany tax item classified as state by the U.S. Census Bureau and as local by theNational Center for Education Statistics.
Line 4. State revenue, nonspecified. Report here any item in your chartof accounts that cannot be crosswalked into the items identified in Part I-B, lines1 through 11. An example would be total state revenue not broken down intoseparate state aid programs.
Line 5. Federal revenue, nonspecified. Report here any item in yourchart of accounts that cannot be crosswalked into the items identified in Part I-C,lines 1 through 8, and Part I-D, lines 1 through 4. An example would be totalfederal aid not broken down into separate federal grant programs.
Line 6. State payment on behalf of the LEA, instruction. Reportexpenditures from the revenues reported in Part V, lines 1 and 2, that were madefor instruction. See definition for Part II-A, line 1.
Line 9. State payment on behalf of the LEA, generaladministration. This item consists of the actual or estimated expenditurefrom the revenues reported in Part V, line 1, for general administration. Seedefinitions for Part II-A, line 4.
Line 10. State payment on behalf of the LEA, schooladministration. This item consists of the actual or estimated expenditurefrom the revenues reported in Part V, line 1, for school administration. Seedefinitions for Part II-A, line 5.
Line 11. State payment on behalf of the LEA, operation andmaintenance of plant. This item consists of the actual or estimatedexpenditure from the revenues reported in Part V, line 1, for operation andmaintenance of plant. See definitions for Part II-A, line 6.
Line 12. State payment on behalf of the LEA, studenttransportation. This item consists of the actual or estimated expenditurefrom the revenues reported in Part V, line 1, for student transportation. Seedefinitions for Part II-A, line 7.
Line 13. State payment on behalf of the LEA, business/central/other. This item consists of the actual or estimated expenditure fromthe revenues reported in Part V, line 1, for business, central and other supportservices. See definitions for Part II-A, line 8.
Part V – STATE PAYMENTS ON BEHALF OF THE LOCALEDUCATION AGENCY
Include state payments that benefit the local education agency but which are notpaid directly. Report on line 1 amounts transferred by the state into state teacheror public employee retirement funds. Also include other employee benefittransfers, such as health, life, or unemployment compensation insurancepayments. Include on line 2 any other payments on behalf of the school system,such as for the purchase of textbooks or school buses purchased by the stateand given to the local education agency.
Part VI – DEBT
Report in section A bonded indebtedness and any other school district interest-bearing debt with a term of more than one year. Include generalobligation bonds, revenue bonds, refunding bonds, and certificates ofparticipation. Do not include lease purchase agreements, compensatedabsences, accounts payable, or any noninterest-bearing obligations. Report insection B interest-bearing tax anticipation and bond anticipation note balancesand other short-term debt with a term of one year or less.
Line 14. State payment on behalf of the LEA, other. Reportexpenditures from the revenues reported in Part V, line 1, that were made forother than instruction or support services. See definitions for Part II-B.
Line 16. Equipment expenditure, nonspecified. Report here any itemin your chart of accounts that cannot be crosswalked into the items identified inPart III, line 3 (instructional equipment) or line 4 (other equipment). An examplewould be total equipment not broken down by function.
Line 17. Own retirement system transfer, instruction. If the schoolsystem administers its own employee retirement fund (rather than participatingin a state government retirement system), please report the employercontribution for instructional employees.
Line 19. Federal revenue on behalf of school system. Report anyitem in your chart of accounts identified as received through federal payments made on behalf of the school system.
Line 15. Support services, nonspecified. Report here any item in yourchart of accounts that cannot be crosswalked into the items identified in PartII-A, lines 2 through 8.
Line 18. Own retirement system transfer, support services. If theschool system administers its own employee retirement fund (rather thanparticipating in a state government retirement system), please report theemployer contribution for support services and other noninstructionalemployees.
Line 20. State payment on behalf of the LEA, instructionalnonbenefits. Report expenditures from the revenues reported in Part V,line 2, that were made for instruction. See definition for Part II-A, line 1.
Line 21. State payment on behalf of the LEA, support servicesnonbenefits. Report expenditures from the revenues reported in Part V, line 2, that were made for support services. See definitions for Part II-A, lines 2 through 8.
Line 22. State payment on behalf of the LEA, noninstructionalprograms nonbenefits. Report expenditures from the revenues reported in Part V, line 2, that were made for noninstructional programs. See definitions for Part II-B.
Line 23. State payment on behalf of the LEA, nonelementary-secondary programs. Report expenditures from the revenues reported inPart V, lines 1 & 2, that were made for nonelementary-secondary programs.See definitions for Part II-C.
Line 24. State payment on behalf of the LEA, capital outlay. Reportexpenditures from the revenues reported in Part V, line 2, that were made forcapital outlay. See definitions for Part III.
Lines 4 and 5. Report payments to state and local governments, including repay-ments of loans. Also include debt service payments to state and localgovernments and school building authorities that incur debt instead of the schoolsystem.
Line 6. Interest on school system debt. Expenditure for interest incurredon both long-term and short-term indebtedness of the school system. Excludeprincipal payments, which should be reported in Part VI.
Line 7. State payment on behalf of the LEA, pupil support services.This item consists of the actual or estimated expenditure from the revenuesreported in Part V, line 1, for pupil support services. See definitions for Part II-A,line 2.
Line 8. State payment on behalf of the LEA, instructional staffservices. This item consists of the actual or estimated expenditure from therevenue reported in Part V, line 1, for instructional staff services. See definitionsfor Part II-A, line 3.
Part X – ARRA FUNDS (Exhibits of Selected Items Reported inSections I–C, II–A, II–B, and III)
For these three items, report amounts specifically from Public Law 111-5, theAmerican Recovery and Reinvestment Act of 2009 (ARRA). These amountsshould also be included with the associated items reported in I-C, II-A, II-B, and III.
Line 1. Enter ARRA revenues received for Title I (see detailed instructions atI-C, line 1).
Line 2. Enter ARRA expenditures made for current operation of elementary-secondary education programs (see detailed instructions at II-A and II-B), reporting only objects 100-600, 810, 820, and 890 for functions 1000,2000, 3100, and 3200.
Line 3. Enter ARRA expenditures made for capital outlays (see detailedinstructions at III), reporting only objects 700, 710, 720, 730, and 740 forfunctions 1000, 2000, 3100, 3200, and ALL objects for function 4000.