public disclosure community reinvestment … · cra appendix a: glossary ... million and gross...
TRANSCRIPT

PUBLIC DISCLOSURE
March 5, 2012
COMMUNITY REINVESTMENT ACT PERFORMANCE EVALUATION
Tioga State Bank RSSD No. 910118
1 Main Street PO Box 386
Spencer, NY 14883
FEDERAL RESERVE BANK OF NEW YORK 33 LIBERTY STREET NEW YORK, N.Y. 10045
NOTE: This document is an evaluation of this institution’s record of meeting the
credit needs of its entire community, including low- and moderate-income neighborhoods, consistent with safe and sound operation of the institution. This evaluation is not, nor should it be construed as, an assessment of the financial condition of this institution. The rating assigned to this institution does not represent an analysis, conclusion or opinion of the federal financial supervisory agency concerning the safety and soundness of this financial institution.

Tioga State Bank CRA Public Evaluation Spencer, NY March 5, 2012
BBi
TABLE OF CONTENTS
Institution's CRA Rating ...................................................................................................... BB1 Description of Institution ..................................................................................................... BB1 Description of the Bank’s Assessment Area ........................................................................ BB2 Scope of Examination...........................................................................................................BB2 Conclusions With Respect to Performance Criteria ............................................................ BB5
Fair Lending or Other Illegal Credit Practices Review…………………………………….BB7 MSA 13780 Binghampton, NY (Full Review)
Description of Operations.………………………………………………………...BB7 Conclusions With Respect to Performance Tests …………………………………BB8
Limited Scope Assessment Areas………………………………………………………...BB16 CRA Appendix A: Glossary .................................................................................. BB19 CRA Appendix B: 2010 Map of Assessment Areas .............................................. BB21

Tioga State Bank CRA Public Evaluation Spencer, NY March 5, 2012
BB1
INSTITUTION RATING Tioga State Bank (“TSB”) is rated Satisfactory. Major factors supporting the rating are:
A substantial majority of loans were made in the assessment area.
TSB’s loan-to-deposit ratio was reasonable.
The overall distribution of loans to borrowers of different incomes and businesses of different sizes reflects reasonable distribution.
The overall geographic distribution of loans reflects reasonable dispersion throughout the assessment area.
The level of community development loans, qualified investments and community
development services demonstrates excellent responsiveness to community development needs in the assessment area.
DESCRIPTION OF INSTITUTION TSB is a retail commercial bank, wholly owned by TSB Services Inc., a one-bank holding company. TSB operates in the southwestern portion of upstate New York with the majority of its branches located in Tioga and Broome Counties. TSB offers a variety of commercial and consumer financial products such as fixed and adjustable rate mortgages, home equity loans and lines of credit, personal and unsecured loans, and commercial and agricultural loan products. TSB operates 11 full-service branch offices, five of which are located in Tioga County, four in Broome County, one in Chemung county, and one in Tompkins County. TSB operates in a competitive market with branches of numerous local, regional, and some international banks operating in its assessment areas. Based on deposits reported to the Federal Deposit Insurance Corporation (“FDIC”) on June 30, 2011, TSB has the fourth largest deposit market share (10.5%) in the Binghamton metropolitan statistical area (“MSA”), the assessment area where the bank conducts a majority of its business. As of December 31, 2011, TSB’s total assets were $385 million, with total deposits of $304 million and gross total loans of $243 million. The table on the following page shows the composition of TSB’s loan portfolio according to the Consolidated Reports of Condition and Income. There are no financial or legal impediments preventing TSB from serving the credit needs of its assessment area. TSB received a satisfactory rating at the prior CRA examination, dated March 15, 2010, conducted by the Federal Reserve Bank of New York.

Tioga State Bank CRA Public Evaluation Spencer, NY March 5, 2012
BB2
Loan Portfolio Summary
LOAN TYPE DOLLAR AMOUNT* (‘000s)
PERCENT OF TOTAL
Commercial / Industrial & Non Farm Non Residential Real Estate
98,715
41%
Construction & Land Development 6,088 2% Secured by 1-4 Family Residential Real Estate 118,121 49% Multifamily 7,962 3% Consumer 7,550 3% Other 4,884 2% Total Gross Loans and Leases 243,320 100% *Data as of December 31, 2011 DESCRIPTION OF THE BANK’S ASSESSMENT AREA TSB has three assessment areas located in central and southern New York State, within three contiguous Metropolitan Statistical Areas (MSAs). The assessment areas are as follows:
MSA 13780 (Binghamton, NY), consisting of Tioga County and a portion of Broome County.
MSA 21300 (Elmira, NY), consisting of a portion of Chemung County.
MSA 27060 (Ithaca, NY), consisting of a portion of Tompkins County.
The assessment areas are in compliance with the requirements of Section 228.41 of Regulation BB and do not arbitrarily exclude low- and moderate-income (“LMI”) geographies. A map illustrating TSB’s assessment areas is in Appendix F.
SCOPE OF EXAMINATION Procedures and Products TSB was examined using the Federal Financial Institutions Examination Council’s (“FFIEC”) Interagency CRA Examination Procedures for Intermediate Small Institutions, which consists of the small bank lending test and a community development test. The examination covers the evaluation period January 1, 2010 through December 31, 2011 for the lending test. Examiners reviewed activities pertaining to the community development test for the period January 1, 2010 through February 29, 2012.
Tioga State Bank CRA Public Evaluation Spencer, NY March 5, 2012
BB3
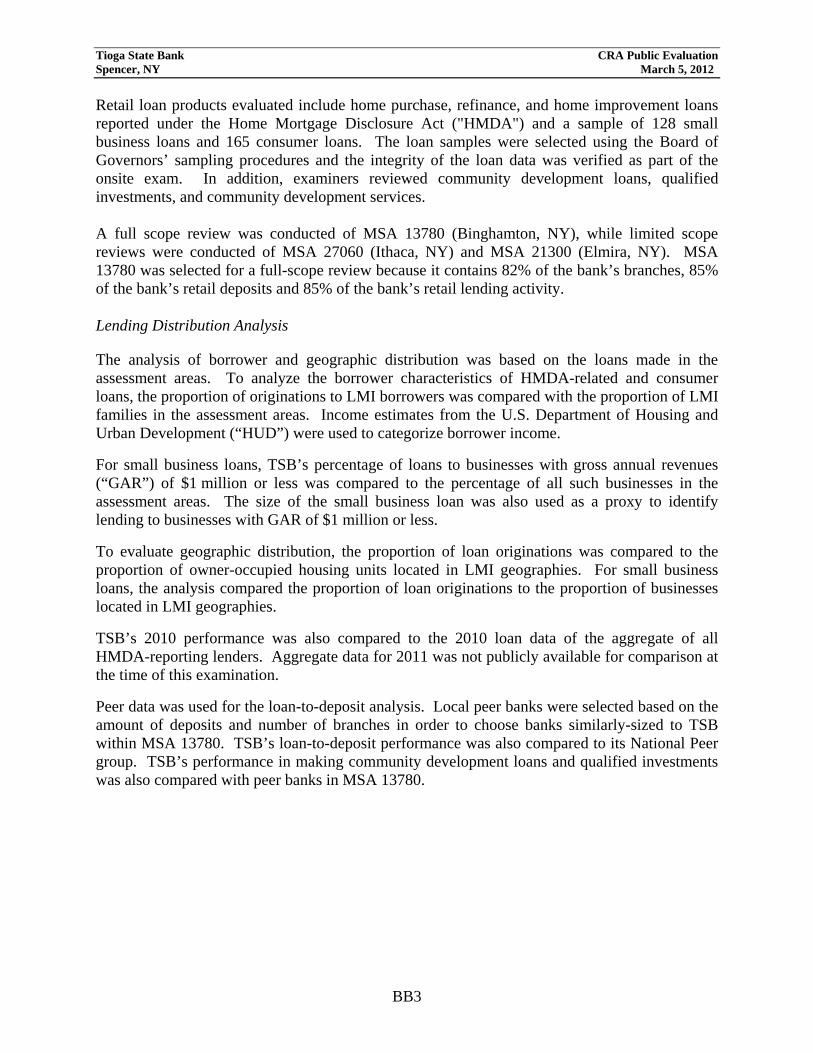
Retail loan products evaluated include home purchase, refinance, and home improvement loans reported under the Home Mortgage Disclosure Act ("HMDA") and a sample of 128 small business loans and 165 consumer loans. The loan samples were selected using the Board of Governors’ sampling procedures and the integrity of the loan data was verified as part of the onsite exam. In addition, examiners reviewed community development loans, qualified investments, and community development services. A full scope review was conducted of MSA 13780 (Binghamton, NY), while limited scope reviews were conducted of MSA 27060 (Ithaca, NY) and MSA 21300 (Elmira, NY). MSA 13780 was selected for a full-scope review because it contains 82% of the bank’s branches, 85% of the bank’s retail deposits and 85% of the bank’s retail lending activity. Lending Distribution Analysis
The analysis of borrower and geographic distribution was based on the loans made in the assessment areas. To analyze the borrower characteristics of HMDA-related and consumer loans, the proportion of originations to LMI borrowers was compared with the proportion of LMI families in the assessment areas. Income estimates from the U.S. Department of Housing and Urban Development (“HUD”) were used to categorize borrower income.
For small business loans, TSB’s percentage of loans to businesses with gross annual revenues (“GAR”) of $1 million or less was compared to the percentage of all such businesses in the assessment areas. The size of the small business loan was also used as a proxy to identify lending to businesses with GAR of $1 million or less.
To evaluate geographic distribution, the proportion of loan originations was compared to the proportion of owner-occupied housing units located in LMI geographies. For small business loans, the analysis compared the proportion of loan originations to the proportion of businesses located in LMI geographies.
TSB’s 2010 performance was also compared to the 2010 loan data of the aggregate of all HMDA-reporting lenders. Aggregate data for 2011 was not publicly available for comparison at the time of this examination.
Peer data was used for the loan-to-deposit analysis. Local peer banks were selected based on the amount of deposits and number of branches in order to choose banks similarly-sized to TSB within MSA 13780. TSB’s loan-to-deposit performance was also compared to its National Peer group. TSB’s performance in making community development loans and qualified investments was also compared with peer banks in MSA 13780.

Tioga State Bank CRA Public Evaluation Spencer, NY March 5, 2012
BB4
Total Population4
227,714 7,789 14,693 250,196
Population % of AA population 91% 3% 6% 100%
Families 58,303 2,260 3,945 64,508
Families % of AA families 90% 4% 6% 100%
Total Census Tracts4
58 2 3 63
Tracts % AA tracts 92% 3% 5% 100%
LMI tracts 17 0 0 17
LMI tracts % all AA LMI tracts 100% 0% 0% 100%
Total Owner-Occupied Units4
60,427 2,529 4,402 67,358
Units % of AA units 90% 4% 7% 100%
Business Establishments5
8,976 229 642 9,847
Bus. est. % AA bus. est. 91% 2% 7% 100%
Number of Branches1
9 1 1 11
Branches % all branches 82% 9% 9% 100%
Branches in LMI tracts 1 0 0 1
LMI branches % AA LMI branches 0% 0% 0% 0%
Branch Deposits ($'000s)2
261 9 38 308
Deposits % AA deposits 85% 3% 12% 100%
Deposit Market Share (% )/ Rank in Mkt. 10/4 .8/7 2/8
Home Purchase Originations3
104 4 16 124
HP originations % AA orig. 84% 3% 13% 100%
Refinance Originations3
116 10 13 139
Refi orig. % AA orig. 83% 7% 9% 100%
Home Improvement Originations3
230 9 29 268
Home Improvement orig. % AA orig. 86% 3% 11% 100%
Small Business Originations3
94 3 8 105
SB orig. % AA orig. 90% 3% 8% 100%
Consumer Loan Originations 119 8 15 142
SB orig. % AA orig. 84% 6% 11% 100%
Combined Loan Totals 663 34 81 778
% of AA Orig. 85% 4% 10% 100%(1) Branch numbers are as of 12/31/2011. (2) Branch deposits and deposit market share are from the FDIC as of 6/30/11. (3)Originations are loans reported under HMDA and samples of small business and consumer loans for 2010 through 2011. (4)Demographic information was obtained from the 2000 Census. (5)Business establishments information was reported by D&B for 2010.
Summary of Key Assessment Area Data
TotalsMSA 27060 (Ithaca, NY)
MSA 21300 (Elmira, NY)
MSA 13780 (Binghamton, NY)

Tioga State Bank CRA Public Evaluation Spencer, NY March 5, 2012
BB5
CONCLUSIONS WITH RESPECT TO PERFORMANCE CRITERIA LENDING TEST TSB’s overall record of meeting the credit needs of its assessment areas is satisfactory. TSB originated a substantial majority of loans within its assessment area and its loan-to-deposit ratio was reasonable. The overall distribution of loans to borrowers of different incomes and businesses of difference sizes was reasonable. Geographic distribution of HMDA-related, consumer, and small business loans represented reasonable penetration among geographies of different income levels. Loan-to-Deposit Ratio TSB’s loan-to-deposit ratio was reasonable given TSB’s size, financial condition, and the credit needs of its assessment areas. TSB’s average loan-to-deposit ratio for the eight most recent quarters ending December 31, 2011, was 73%, based on information contained in its Consolidated Report of Condition and Income. This ratio was slightly below but generally comparable to the national peer average of 78% and the average ratio of 80% for four similarly-situated banks with branches in the assessment area during the same time period.
Lending in the Assessment Area TSB originated a substantial majority of its loans, 88% by number, and 85% by dollar amount, overall, in its assessment areas. TSB originated 90% of its HMDA-related loans, 86% of its consumer loans, and 82% of its small business loans by number, within its assessment areas, asshown in the following table:
Lending Inside and Outside the Assessment Area
Loan Type
Inside Outside # % $
(‘000s) % # % $
(‘000s) %
Home Purchase 124 84 11,741 81 23 16 2,751 19 Refinancings 139 87 10,649 83 20 13 2,133 17
Home Improvement 268 94 7,655 91 18 6 751 9 Multifamily 22 92 4,691 96 2 8 223 4
Total HMDA 553 90 34,736 86 63 10 5,858 14 Consumer 142 86 1.909 75 23 14 642 25
Small Business 105 82 15,999 84 23 18 2,984 16 All Loans 800 88 52,644 85 109 12 9,484 15
Lending to Borrowers of Different Incomes and to Businesses of Different Sizes
TSB’s overall lending penetration among borrowers of different income levels (including LMIindividuals) and businesses of different sizes was reasonable based primarily on reasonableperformance in MSA 13780 (Binghamton, NY).
Tioga State Bank CRA Public Evaluation Spencer, NY March 5, 2012
BB6
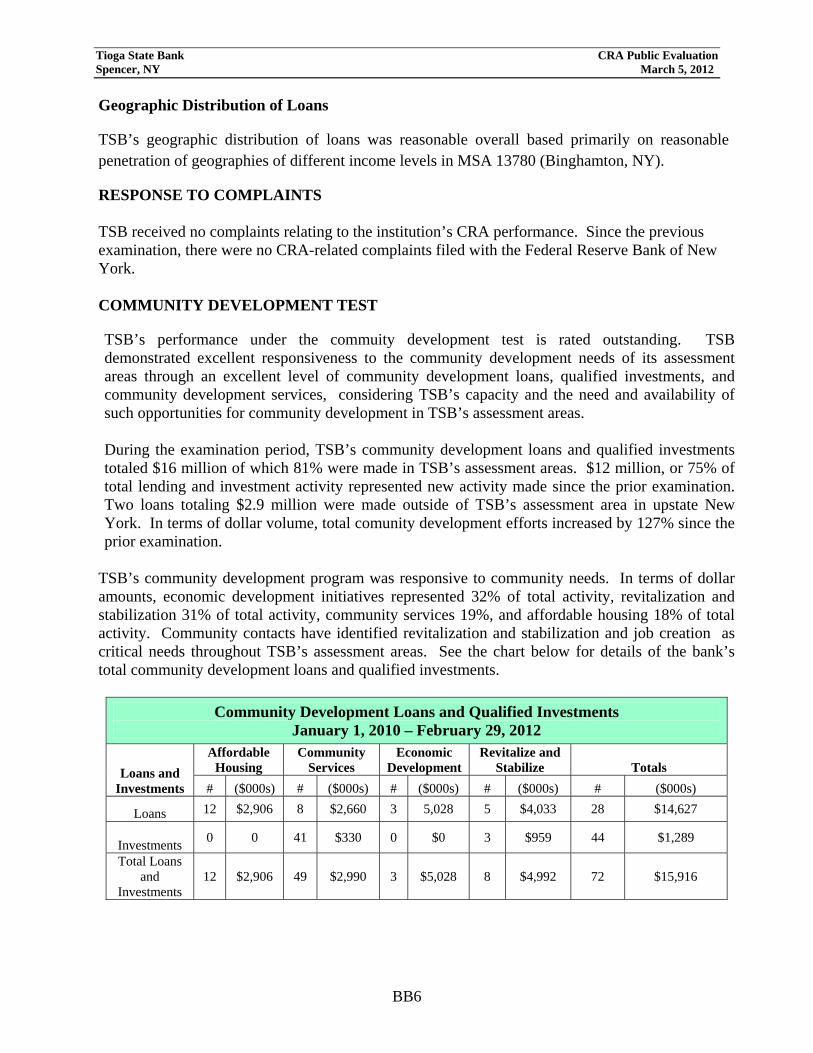
Geographic Distribution of Loans
TSB’s geographic distribution of loans was reasonable overall based primarily on reasonable penetration of geographies of different income levels in MSA 13780 (Binghamton, NY).
RESPONSE TO COMPLAINTS TSB received no complaints relating to the institution’s CRA performance. Since the previous examination, there were no CRA-related complaints filed with the Federal Reserve Bank of New York. COMMUNITY DEVELOPMENT TEST
TSB’s performance under the commuity development test is rated outstanding. TSB demonstrated excellent responsiveness to the community development needs of its assessment areas through an excellent level of community development loans, qualified investments, and community development services, considering TSB’s capacity and the need and availability of such opportunities for community development in TSB’s assessment areas. During the examination period, TSB’s community development loans and qualified investments totaled $16 million of which 81% were made in TSB’s assessment areas. $12 million, or 75% of total lending and investment activity represented new activity made since the prior examination. Two loans totaling $2.9 million were made outside of TSB’s assessment area in upstate New York. In terms of dollar volume, total comunity development efforts increased by 127% since the prior examination.
TSB’s community development program was responsive to community needs. In terms of dollar amounts, economic development initiatives represented 32% of total activity, revitalization and stabilization 31% of total activity, community services 19%, and affordable housing 18% of total activity. Community contacts have identified revitalization and stabilization and job creation as critical needs throughout TSB’s assessment areas. See the chart below for details of the bank’s total community development loans and qualified investments.
Community Development Loans and Qualified Investments January 1, 2010 – February 29, 2012
Loans and Investments
Affordable Housing
Community Services
Economic Development
Revitalize and Stabilize Totals
# ($000s) # ($000s) # ($000s) # ($000s) # ($000s)
Loans 12 $2,906 8 $2,660 3 5,028 5 $4,033 28 $14,627
Investments 0 0 41 $330 0 $0 3 $959 44 $1,289
Total Loans and
Investments 12 $2,906 49 $2,990 3 $5,028 8 $4,992 72 $15,916

Tioga State Bank CRA Public Evaluation Spencer, NY March 5, 2012
BB7
FAIR LENDING OR OTHER ILLEGAL CREDIT PRACTICES REVIEW
TSB is in compliance with the substantive provisions of the anti-discrimination laws andregulations. No evidence of discriminatory or other illegal credit practice was identified as beinginconsistent with helping to meet the credit needs of the assessment area.
METROPOLITAN AREA
MSA 13780 (BINGHAMTON, NY) DESCRIPTION OF OPERATIONS
TSB’s banking activities within its assessment areas were primarily conducted within MSA 13780. As of December 31, 2011, TSB operated 9 of 11 branches (82%) in this MSA. These branchesgenerated $261 million in deposits, which accounts for 85% of the bank’s total branch deposits asof June 30, 2011. Of the bank’s total HMDA loans (531) originated in the assessment areas during2010 and 2011, 85% were originated in this MSA. Of its total consumer loans (142) originated in the assessment areas, 84% were originated in this MSA. Of its total small business loans originated in the assessment areas (105), 90% were originated in this MSA. For additional assessment area data, see Summary of Key Assessment Area Data.
PERFORMANCE CONTEXT The following demographic and economic information was obtained from publicly availablesources that include the U.S. Department of Commerce’s Bureau of Census, the U.S. Department of Labor, and the National Association of Realtors. Demographic Characteristics According to the 2000 Census, the population of MSA 13780 is 227,714. The MSA is comprised of Broome and Tioga Counties, with Broome County representing 88% of the MSA’s population.The City of Binghamton is the largest city in the MSA and is located within Broome County. TSBhas historically operated primarily within Tioga County but has expanded into Broome Countyover the last few years. Of the 58 census tracts located in MSA 13780, 17 or 29% are LMI. All ofthe LMI census tracts are located in Broome County.
Income Characteristics According to the 2000 Census, MSA 13780 has 58,303 families, of which 10,767 (19%) are low-income families and 10,804 (19%) are moderate-income families. The HUD-adjusted median family income for MSA 13780 was $60,400 in 2010 and $61,000 in 2011. These income levels are low in comparison to New York State’s 2011 HUD-adjusted median family income of $70,400.
Housing Characteristics Housing costs are comparatively low in the MSA, particularly in comparison to the state averagemedian sales price. According to the National Association of Realtors, the median annual sales price of existing single-family homes in MSA 13780 was $110,000 in 2010 and increased slightly

Tioga State Bank CRA Public Evaluation Spencer, NY March 5, 2012
BB8
to $113,800 in 2011. New York State’s median annual sales price for an existing single-family home was $212,500 in 2011. Housing affordability remains difficult for low-income borrowers in the MSA. The median housing cost in the assessment area is about four times the median familyincome of a low-income borrower and 2 times the income of a moderate-income borrower.
Community contacts, reported, however, that the area has not been affected by the housingforeclosure crisis since housing prices were never inflated. A community development organization noted that home improvement lending is a need in the area because housing is relatively old, and many houses are in need of basic upgrades.
Labor, Employment and Economic Characteristics The region has a sizeable presence of computer, electronics, and defense-related manufacturing, although less than in the past. During this past economic recession, the Binghamton area registered a job loss of roughly 6%, steeper than New York as a whole, but roughly on par with the nation. Unemployment in MSA 13780 remains high and slightly above the State unemployment rate, as a whole. The area’s employment level was adversely affected by the loss oof the Presidential helicopter contract at Lockheed Martin, resulting in in the loss of 800 jobs. Flooding in 2011 caused by Hurricane Irene and Tropical Storm Lee brought major devastation to the region. Estimates from the New York Department of State estimated the flood damage in Broome County at $436 million and $280 million in Tioga County. FEMA designated Broome andTioga Counties a disaster area on September 13, 2011. See the table on the next page for additional assessment area details. CONCLUSIONS WITH RESPECT TO PERFORMANCE TESTS
Distribution by Borrower Income and Revenue Size of Business Lending performance in the assessment area relating to borrower distribution in 2010 wasreasonable overall, and reflected reasonable penetration among individuals of all income levels (including LMI) and businesses of different sizes. While home ownership is generally affordable to moderate-income borrowers in the MSA, housing costs are generally 3 to 4 times the incomelevels of low-income borrowers. Tioga’s performance in 2011 exceeded its performance in 2010with respect to borrower distribution of loans. Home Purchase Loans TSB’s distribution of home purchase loans to LMI borrowers was reasonable. In 2010, TSB made 14% of its home purchase loans to low-income borrowers while 19% of families in the MSA are of low-income. TSB’s performance in 2010 was above that of the market aggregate,which made 10% of its home purchase loans to low-income borrowers.
U.S. Department of Labor Annual Unemployment Rates
Area
2010
2011
MSA 13780
8.8%
8.4%
State of New York
8.6%
8.2%

Tioga State Bank CRA Public Evaluation Spencer, NY March 5, 2012
BB9
Performance in lending to moderate-income borrowers was poor, as 9% of TSB’s home purchase loans in 2010 were made to moderate-income borrowers, compared to 19% of all families in the MSA that were of moderate-income. TSB’s performance was significantly below the market aggregate, which made 28% of its home purchase loans to moderate-income borrowers in 2010. TSB’s 2011 performance was excellent as 22% of home purchase loans were made to moderate-income borrowers while performance to low-income borrowers was poor, as the bank made only one loan, or 2% of its total home purchase loans, to low-income borrowers.
Assessment Area Demographics
Assessment Area : MSA 13780 Broome/Tioga Counties
Income Categories Tract Distribution Families by Tract Income
Families < Poverty Level as % of
Families by Tract
Families by Family Income
# % # % # % # %
Low-income 4 6.9 1,366 2.3 437 32.0 10,767 18.5
Moderate-income 13 22.4 8,302 14.2 1,587 19.1 10,804 18.5
Middle-income 27 46.6 31,484 54.0 2,092 6.6 13,357 22.9
Upper-income 14 24.1 17,151 29.4 605 3.5 23,375 40.1
Unknown-income 0 0.0 0 0.0 0 0.0 0 0.0
Total Assessment Area 58 100.0 58,303 100.0 4,721 8.1 58,303 100.0
Housing Housing Types by Tract
Units by Owner-Occupied Rental Vacant
Tract # % % # % # %
Low-income 4,299 657 1.1 15.3 2,931 68.2 711 16.5
Moderate-income 19,144 6,158 10.2 32.2 10,623 55.5 2,363 12.3
Middle-income 51,199 34,477 57.1 67.3 12,767 24.9 3,955 7.7
Upper-income 24,946 19,135 31.7 76.7 4,736 19.0 1,075 4.3
Unknown-income 0 0 0.0 0.0 0 0.0 0 0.0
Total Assessment Area 99,588 60,427 100.0 60.7 31,057 31.2 8,104 8.1
Total Businesses by Businesses by Tract & Revenue Size
Tract Less Than or = $1 Million
Over $1 Million Revenue Not Reported
# % # % # % # %
Low-income 665 7.4 541 6.8 73 13.5 51 11.5
Moderate-income 1,447 16.1 1,271 15.9 107 19.9 69 15.5
Middle-income 4,512 50.3 4,062 50.8 234 43.4 216 48.5
Upper-income 2,352 26.2 2,118 26.5 125 23.2 109 24.5
Unknown-income 0 0.0 0 0.0 0 0.0 0 0.0
Total Assessment Area 8,976 100.0 7,992 100.0 539 100.0 445 100.0
Percentage of Total Businesses: 89.0 6.0 5.0
Based on 2000 Census Information.

Tioga State Bank CRA Public Evaluation Spencer, NY March 5, 2012
BB10
Refinance Loans TSB’s overall distribution of refinance loans to LMI borrowers in 2010 was reasonable based on reasonable penetration in lending to both low- and moderate-income borrowers. TSB made 5% of its refinance loans low-income borrowers and 15% of its refinance loans to moderate-income borrowers in 2010. The demographics indicate that 19% percent of families in the assessmentarea are of low-income and 19% are of moderate-income. Performance in lending to low-income borrowers was slightly below the market aggregate, which made 6% of its refinance loans to low-income borrowers and was also slightly below the market aggregate in lending to moderate-income borrowers as 19% of the market aggregate’s refinance loans were made tomoderate-income borrowers in 2010. Performance in 2011 was excellent, as 25% of TSB’s refinance loans were made to moderate-income borrowers, while performance to low-income borrowers was reasonable as 7% of refinance loans were made to low-income borrowers. Home Improvement Loans TSB’s overall distribution of home improvement loans to LMI borrowers in 2010 wasreasonable, based on reasonable performance in lending to both low-income borrowers and moderate-income borrowers. TSB made 14% of its home improvement loans to low-income borrowers and 16% of its home improvement loans to moderate-income borrowers. Nineteen percent of families in the assessment area are of low-income and 19% are of moderate-income. Performance was similar to the market aggregate, which made 14% of its home improvementloans to low-income borrowers in 2010, and slightly below the market aggregate in lending to moderate-income borrowers, as 21% of the market aggregate’s loans were made to moderate-income borrowers. Performance in 2011 was excellent as 28% of TSB’s refinance loans were to moderate-income borrowers while performance to low-income borrowers was reasonable as 11% of refinanceloans were to low-income borrowers.
Consumer Loans TSB’s overall distribution of consumer loans to LMI borrowers in 2010 was excellent based on excellent performance in lending to both low- and moderate-income borrowers. TSB made 31% of its consumer loans to low-income borrowers and 21% of its consumer loans to moderate-income borrowers. Demographics show that 24% of households in the assessment area are of low-income,while 16% are of moderate-income. Performance in 2011 was comparable to 2010. Small Business Loans TSB’s overall distribution of lending to small businesses was reasonable. During 2010, TSB made 72% of its small business loans to businesses with GAR of $ 1 million or less, compared to 89% of business establishments in the MSA with GAR of $1 million or less. Performance was significantly above the aggregate which, in 2010, made 37% of its small business loans to

Tioga State Bank CRA Public Evaluation Spencer, NY March 5, 2012
BB11
businesses with GAR of $1 million or less. During the review period, 78% of TSB’s total small business loans were in amounts of $100,000 or less compared to the aggregate, which made 92% of its small business loans in amounts of $100,000 or less. The average size of small business loans was $107,000. Loans in smaller amounts are responsive to the needs of small businesses.Performance in 2011 was comparable to 2010. Geographic Distribution of Loans
TSB’s geographic distribution of loans reflects overall reasonable dispersion throughout the entire assessment area including LMI census tracts considering performance context and demographic challenges in TSB’s assessment areas that make lending difficult in LMI census tracts. HMDA-related and consumer lending performance in 2010 was poor, while small business performance was good. Opportunities to make HMDA loans in low-income census tracts were very limited. Only 1%, or 657 in number, of owner-occupied housing units, were located in low-income census tracts. This performance context consideration is confirmed by the performance of the aggregate, which in 2010 made only 1% of its HMDA-related lending in low-income census tracts. Additionally, 32% of the families residing in low-income census tracts have incomes below the poverty level, further limiting lending opportunities.
Home Purchase Loans TSB’s overall home purchase lending performance in 2010 was reasonable in light of demographic and performance context considerations relating to housing affordability and availability of owner-occupied housing in the LMI census tracts within the assessment area. TSB’s performance in low-income census tracts is considered reasonable in light of these performance context considerations. TSB made only one home purchase loan, or 2% of its home purchase loans, in a low-income census tract while only 1% of all owner-occupied housing units were located in low-income tracts. The market aggregate’s performance in 2010 was similar, as it made only 1% of its home purchase loans in low-income census tracts.
TSB’s overall performance in moderate-income census tracts was reasonable. TSB originated 5% of its home purchase loans in moderate-income census tracts compared to 10% of owner-occupied housing units located in moderate-income census tracts in the MSA. TSB’s performance in moderate-income geographies was significantly below the market aggregate, which made 12% of its home purchase loans in moderate-income geographies in 2010. Home purchase performance in 2011, however, exceeded performance in 2010 as TSB made 13% of its home purchase loans inmoderate-income geographies in 2011.
Refinance Loans
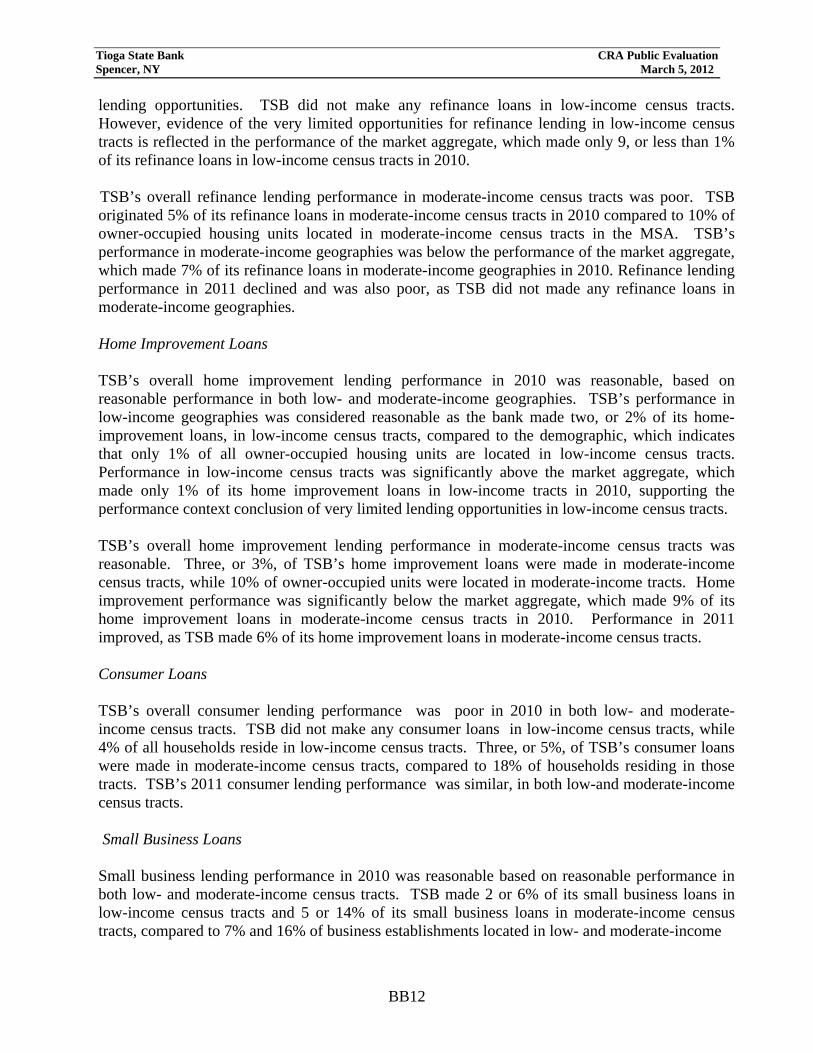
TSB’s overall refinance lending performance in low- and moderate-income geographies in 2010 was poor. TSB’s refinance lending performance in low-income census tracts, however, is considered reasonable considering performance context factors. For example, only 1% of all owner-occupied housing units are located in low-income census tracts indicating very limited
Tioga State Bank CRA Public Evaluation Spencer, NY March 5, 2012
BB12
lending opportunities. TSB did not make any refinance loans in low-income census tracts. However, evidence of the very limited opportunities for refinance lending in low-income census tracts is reflected in the performance of the market aggregate, which made only 9, or less than 1% of its refinance loans in low-income census tracts in 2010.
TSB’s overall refinance lending performance in moderate-income census tracts was poor. TSB originated 5% of its refinance loans in moderate-income census tracts in 2010 compared to 10% of owner-occupied housing units located in moderate-income census tracts in the MSA. TSB’s performance in moderate-income geographies was below the performance of the market aggregate,which made 7% of its refinance loans in moderate-income geographies in 2010. Refinance lending performance in 2011 declined and was also poor, as TSB did not made any refinance loans in moderate-income geographies. Home Improvement Loans TSB’s overall home improvement lending performance in 2010 was reasonable, based on reasonable performance in both low- and moderate-income geographies. TSB’s performance in low-income geographies was considered reasonable as the bank made two, or 2% of its home-improvement loans, in low-income census tracts, compared to the demographic, which indicates that only 1% of all owner-occupied housing units are located in low-income census tracts. Performance in low-income census tracts was significantly above the market aggregate, which made only 1% of its home improvement loans in low-income tracts in 2010, supporting the performance context conclusion of very limited lending opportunities in low-income census tracts. TSB’s overall home improvement lending performance in moderate-income census tracts was reasonable. Three, or 3%, of TSB’s home improvement loans were made in moderate-income census tracts, while 10% of owner-occupied units were located in moderate-income tracts. Home improvement performance was significantly below the market aggregate, which made 9% of its home improvement loans in moderate-income census tracts in 2010. Performance in 2011 improved, as TSB made 6% of its home improvement loans in moderate-income census tracts. Consumer Loans TSB’s overall consumer lending performance was poor in 2010 in both low- and moderate-income census tracts. TSB did not make any consumer loans in low-income census tracts, while 4% of all households reside in low-income census tracts. Three, or 5%, of TSB’s consumer loanswere made in moderate-income census tracts, compared to 18% of households residing in those tracts. TSB’s 2011 consumer lending performance was similar, in both low-and moderate-income census tracts. Small Business Loans Small business lending performance in 2010 was reasonable based on reasonable performance in both low- and moderate-income census tracts. TSB made 2 or 6% of its small business loans in low-income census tracts and 5 or 14% of its small business loans in moderate-income census tracts, compared to 7% and 16% of business establishments located in low- and moderate-income

Tioga State Bank CRA Public Evaluation Spencer, NY March 5, 2012
BB13
2010 Aggregate Comparison Loan Distribution Table Assessment Area: MSA 13780
Income Categories
HMDA By Tract Income By Borrower Income
Bank Aggregate Bank Aggregate # % % $(000s) % % $(000s) # % % $(000s) % % $(000s)
Home Purchase Low 1 2.3% 3.3% 1.8% 1.2% 6 13.6% 6.7% 10.0% 6.0% Moderate 2 4.5% 3.1% 11.5% 8.0% 4 9.1% 7.1% 28.4% 22.6%Middle 29 65.9% 54.9% 52.9% 49.1% 10 22.7% 16.2% 27.5% 27.4% Upper 12 27.3% 38.7% 33.9% 41.7% 21 47.7% 66.5% 28.1% 38.6% Unknown 0 0.0% 0.0% 0.0% 0.0% 3 6.8% 3.4% 6.0% 5.4% Total 44 100.0% 100.0% 100.0% 100.0% 44 100.0% 100.0% 100.0% 100.0% Refinance Low 0 0.0% 0.0% 0.4% 0.3% 3 4.8% 2.4% 5.5% 3.2% Moderate 3 4.8% 3.8% 6.8% 4.4% 9 14.5% 8.4% 19.2% 13.7% Middle 48 77.4% 73.9% 52.4% 48.2% 18 29.0% 28.1% 24.7% 21.3% Upper 11 17.7% 22.3% 40.3% 47.1% 25 40.3% 42.9% 43.1% 53.7%Unknown 0 0.0% 0.0% 0.0% 0.0% 7 11.3% 18.1% 7.5% 8.1% Total 62 100.0% 100.0% 100.0% 100.0% 62 100.0% 100.0% 100.0% 100.0% Home Improvement Low 2 2.2% 1.5% 1.3% 0.6% 13 14.1% 3.6% 14.2% 4.2%Moderate 3 3.3% 0.9% 8.8% 5.4% 15 16.3% 9.6% 20.8% 13.2%Middle 72 78.3% 79.9% 61.1% 53.6% 27 29.3% 35.7% 24.8% 23.8%Upper 15 16.3% 17.6% 28.8% 40.4% 32 34.8% 43.4% 37.4% 55.9% Unknown 0 0.0% 0.0% 0.0% 0.0% 5 5.4% 7.7% 2.9% 3.0% Total 92 100.0% 100.0% 100.0% 100.0% 92 100.0% 100.0% 100.0% 100.0% Multi-Family Low 2 22.2% 36.1% 13.6% 11.5% 0 0.0% 0.0% 0.0% 0.0% Moderate 5 55.6% 39.4% 50.0% 80.4% 0 0.0% 0.0% 0.0% 0.0%Middle 2 22.2% 24.5% 27.3% 6.6% 0 0.0% 0.0% 0.0% 0.0%Upper 0 0.0% 0.0% 9.1% 1.5% 0 0.0% 0.0% 0.0% 0.0%Unknown 0 0.0% 0.0% 0.0% 0.0% 9 100.0% 100.0% 100.0% 100.0% Total 9 100.0% 100.0% 100.0% 100.0% 9 100.0% 100.0% 100.0% 100.0% HMDA Totals Low 5 2.4% 5.5% 1.2% 1.6% 22 10.6% 3.8% 8.3% 4.2%Moderate 13 6.3% 6.9% 9.3% 12.3% 28 13.5% 7.3% 23.2% 16.3% Middle 151 72.9% 63.9% 53.4% 45.3% 55 26.6% 23.1% 25.8% 22.2% Upper 38 18.4% 23.7% 36.2% 40.8% 78 37.7% 45.4% 35.8% 43.0% Unknown 0 0.0% 0.0% 0.0% 0.0% 24 11.6% 20.3% 6.8% 14.4%Total 207 100.0% 100.0% 100.0% 100.0% 207 100.0% 100.0% 100.0% 100.0%
SMALL BUSINESS By Tract Income Bank Aggregate # % % $(000s) % % $(000s) Low 2 5.6% 1.0% 9.3% 12.0% Moderate 5 13.9% 16.5% 15.8% 13.6% Middle 22 61.1% 75.6% 45.2% 41.3%Upper 7 19.4% 6.9% 29.2% 33.0% Unknown 0 0.0% 0.0% 0.0% 0.0% Tract Unknown 0 0.0% 0.0% 0.6% 0.1% Total 36 100.0% 100.0% 100.0% 100.0% By Revenue $1 Million or Less 26 72.2% 58.8% 36.8% 38.1% By Loan Size $100,000 or less 28 77.8% 28.6% 92.3% 36.1% $100,001-$250,000 4 11.1% 20.2% 4.5% 21.0%$250,001-$1 Million 4 11.1% 51.2% 3.3% 42.9% Total 36 100.0% 100.0% 100.0% 100.0%
2010 Originations and Purchases

Tioga State Bank CRA Public Evaluation Spencer, NY March 5, 2012
BB14
census tracts, respectively. TSB’s performance was below the market aggregate in lending in low-income census tracts and slightly below the market aggregate in lending in moderate-income census tracts. The market aggregate made 9% and 16% of its small business loans in low- and moderate-income census tracts, respectively. TSB’s performance in 2011 was comparable to its 2010 performance.
COMMUNITY DEVELOPMENT TEST TSB’s community development performance in MSA 13780 demonstrates excellent responsiveness to the community development needs of the assessment area. Sixty-two percent or $9.8 million of TSB’s overall community development loans and investments were made in MSA 13780. This assessment considers TSB’s capacity and the need and availability of such opportunities for community development in MSA 13780. TSB’s level of community development activities compared favorably to two similarly-situated banks located in MSA 13780.
Community Development Loans
In MSA 13780, TSB made $8.5 million in community development loans. Of this total, 40% targeted affordable housing initiatives, 25% financed community services, and 35% targeted economic development.
Examples of TSB’s community development loans made in MSA 13780 include:
A $2.4 million loan to revitalize a moderate-income tract in downtown Binghamton through renovations to a commercial office building. The loan will also help keep jobs in the downtown area.
A $710,000 commercial loan to dental practice that provides services to a largely LMI population. The business has 15 offices throughout southern New York State.
2010 Consumer Loan Distribution Table Assessment Area: MSA 13780
Income Categories
Consumer Loan Totals
By Tract Income By Borrower Income
# % $(000s) % # % $(000s) % Low 0 0.0% 0 0.0% 19 31.1% 129 16.8% Moderate 3 4.9% 42 5.4% 13 21.3% 154 20.0% Middle 48 78.7% 575 74.7% 12 19.7% 217 28.2% Upper 10 16.4% 154 19.9% 17 27.9% 270 35.1% Unknown 0 0.0% 0 0.0% 0 0.0% 0 0.0% Total 61 100.0% 771 100.0% 61 100.0% 771 100.0%
2010 Originations and Purchases

Tioga State Bank CRA Public Evaluation Spencer, NY March 5, 2012
BB15
A $425,000 multi-family loan to renovate 12 units of housing, that are affordable to LMI individuals.
A $400,000 loan to finance renovations to a building owned by a non-profit corporation that provides comprehensive services to the disabled in Broome County. The services allow the disabled to live independently. The property is located in a low-income census tract.
Qualified Investments
In MSA 13780, the bank made $1.3 million in qualified investments and grant donations. Qualified investments consisted of three municipal bonds totaling $291,000 used to acquire school buses for a district where the majority of students receive free or reduced rate lunches, a $370,000 municipal bond to rebuild a waste water treatment center in a moderate-income area, and two bonds used to acquire fire and rescue trucks in designated disaster areas of Broome County. Qualified investments included donations to 38 community service organizations in Tioga and Broome Counties.
Community Development Services
TSB employees participated in community development service activities through offering technical assistance to various organizations that furnish community development services to LMI individuals. TSB’s community development services were primarily targeted to MSA 13780. In MSA 13780, 14 employees served as directors, treasurers, and committee members to 18 community development organizations. These organizations include:
A public benefit corporation in Tioga County that provides services to LMI people. The corporation provides assistance to projects that promote economic renewal and development within the community, increase the availability of individual and group housing within the community, and promote learning. Many of their projects target the LMI youth of the Spencer-Van Etten community.
A non-profit organization that finds qualified workers, provides job placement services, workforce training programs, and provides grants and financial assistance programs to companies in Broome and Tioga Counties.
Within MSA 13780, TSB operates nine branches, one of which is in a moderate-income tract. All branches provide a full range of financial services to the communities they serve.

Tioga State Bank CRA Public Evaluation Spencer, NY March 5, 2012
BB16
METROPOLITAN AREAS
(LIMITED REVIEW)
MSA 21300 (Elmira, NY) MSA 27060 (Ithaca, NY)
Conclusions regarding performance in the limited scope assessment areas were compared with the overall rating, which was based on the full-scope assessment area performance. Conclusions follow:
PERFORMANCE OF LIMITED SCOPE AREAS
Assessment Area Lending Test Community Development Test
MSA 21300 Below Below MSA 27060 Below Below
2010 Consumer Loan Distribution Table Assessment Area: MSA 21300
Income Categories
Consumer Loan Totals
By Tract Income By Borrower Income
# % $(000s) % # % $(000s) %
Low 0 0.0% 0 0.0% 3 50.0% 33 55.0%
Moderate 0 0.0% 0 0.0% 2 33.3% 22 36.7%
Middle 6 100.0% 60 100.0% 0 0.0% 0 0.0%
Upper 0 0.0% 0 0.0% 1 16.7% 5 8.3%
Unknown 0 0.0% 0 0.0% 0 0.0% 0 0.0% Total 6 100.0% 60 100.0% 6 100.0% 60 100.0%
2010 Originations and Purchases
2010 Consumer Loan Distribution Table Assessment Area: MSA 27060
Income Categories
Consumer Loan Totals
By Tract Income By Borrower Income
# % $(000s) % # % $(000s) %
Low 0 0.0% 0 0.0% 3 75.0% 11 33.0%
Moderate 0 0.0% 0 0.0% 1 25.0% 22 66.7%
Middle 4 100.0% 33 100.0% 0 0.0% 0 0.0%
Upper 0 0.0% 0 0.0% 0 0.0% 0 0.0%
Unknown 0 0.0% 0 0.0% 0 0.0% 0 0.0%Total 4 100.0% 33 100.0% 4 100.0% 33 100.0%
2010 Originations and Purchases
Tioga State Bank CRA Public Evaluation Spencer, NY March 5, 2012
BB17
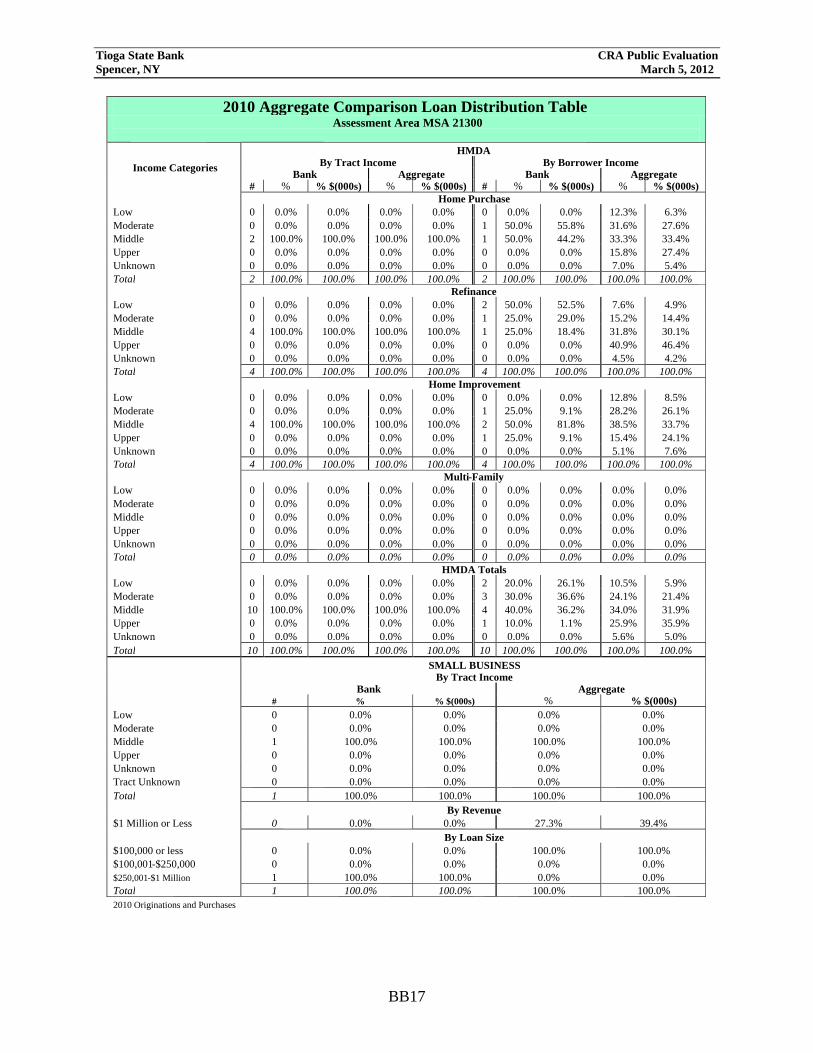
20 10 Aggregate Comparison Loan Distribution Table Assessment Area: MSA 21300
Income Categories HMDA
By Tract Income By Borrower Income Bank Aggregate Bank Aggregate
# % % $(000s) % % $(000s) # % % $(000s) % % $(000s) Home Purchase Low 0 0.0% 0.0% 0.0% 0.0% 0 0.0% 0.0% 12.3% 6.3% Moderate 0 0.0% 0.0% 0.0% 0.0% 1 50.0% 55.8% 31.6% 27.6% Middle 2 100.0% 100.0% 100.0% 100.0% 1 50.0% 44.2% 33.3% 33.4% Upper 0 0.0% 0.0% 0.0% 0.0% 0 0.0% 0.0% 15.8% 27.4% Unknown 0 0.0% 0.0% 0.0% 0.0% 0 0.0% 0.0% 7.0% 5.4% Total 2 100.0% 100.0% 100.0% 100.0% 2 100.0% 100.0% 100.0% 100.0% Refinance Low 0 0.0% 0.0% 0.0% 0.0% 2 50.0% 52.5% 7.6% 4.9% Moderate 0 0.0% 0.0% 0.0% 0.0% 1 25.0% 29.0% 15.2% 14.4% Middle 4 100.0% 100.0% 100.0% 100.0% 1 25.0% 18.4% 31.8% 30.1% Upper 0 0.0% 0.0% 0.0% 0.0% 0 0.0% 0.0% 40.9% 46.4% Unknown 0 0.0% 0.0% 0.0% 0.0% 0 0.0% 0.0% 4.5% 4.2% Total 4 100.0% 100.0% 100.0% 100.0% 4 100.0% 100.0% 100.0% 100.0% Home Improvement Low 0 0.0% 0.0% 0.0% 0.0% 0 0.0% 0.0% 12.8% 8.5% Moderate 0 0.0% 0.0% 0.0% 0.0% 1 25.0% 9.1% 28.2% 26.1% Middle 4 100.0% 100.0% 100.0% 100.0% 2 50.0% 81.8% 38.5% 33.7% Upper 0 0.0% 0.0% 0.0% 0.0% 1 25.0% 9.1% 15.4% 24.1% Unknown 0 0.0% 0.0% 0.0% 0.0% 0 0.0% 0.0% 5.1% 7.6% Total 4 100.0% 100.0% 100.0% 100.0% 4 100.0% 100.0% 100.0% 100.0% Multi-Family Low 0 0.0% 0.0% 0.0% 0.0% 0 0.0% 0.0% 0.0% 0.0% Moderate 0 0.0% 0.0% 0.0% 0.0% 0 0.0% 0.0% 0.0% 0.0% Middle 0 0.0% 0.0% 0.0% 0.0% 0 0.0% 0.0% 0.0% 0.0% Upper 0 0.0% 0.0% 0.0% 0.0% 0 0.0% 0.0% 0.0% 0.0% Unknown 0 0.0% 0.0% 0.0% 0.0% 0 0.0% 0.0% 0.0% 0.0% Total 0 0.0% 0.0% 0.0% 0.0% 0 0.0% 0.0% 0.0% 0.0% HMDA Totals Low 0 0.0% 0.0% 0.0% 0.0% 2 20.0% 26.1% 10.5% 5.9% Moderate 0 0.0% 0.0% 0.0% 0.0% 3 30.0% 36.6% 24.1% 21.4% Middle 10 100.0% 100.0% 100.0% 100.0% 4 40.0% 36.2% 34.0% 31.9% Upper 0 0.0% 0.0% 0.0% 0.0% 1 10.0% 1.1% 25.9% 35.9% Unknown 0 0.0% 0.0% 0.0% 0.0% 0 0.0% 0.0% 5.6% 5.0% Total 10 100.0% 100.0% 100.0% 100.0% 10 100.0% 100.0% 100.0% 100.0%
SMALL BUSINESS By Tract Income Bank Aggregate #
%
% $(000s)
% % $(000s) Low 0 0.0% 0.0% 0.0% 0.0% Moderate 0 0.0% 0.0% 0.0% 0.0% Middle 1 100.0% 100.0% 100.0% 100.0% Upper 0 0.0% 0.0% 0.0% 0.0% Unknown 0 0.0% 0.0% 0.0% 0.0% Tract Unknown 0 0.0% 0.0% 0.0% 0.0% Total 1 100.0% 100.0% 100.0% 100.0% By Revenue $1 Million or Less 0 0.0% 0.0% 27.3% 39.4% By Loan Size $100,000 or less 0 0.0% 0.0% 100.0% 100.0% $100,001- $250,000 0 0.0% 0.0% 0.0% 0.0% $250,001 -$1 Million
1 100.0% 100.0% 0.0% 0.0% Total 1 100.0% 100.0% 100.0% 100.0% 2010 Originations and Purchases

Tioga State Bank CRA Public Evaluation Spencer, NY March 5, 2012
BB18
2010 Aggregate Comparison Loan Distribution Table Assessment Area: MSA 27060
Income Categories
HMDA By Tract Income By Borrower Income
Bank Aggregate Bank Aggregate # % % $(000s) % % $(000s) # % % $(000s) % % $(000s)
Home Purchase Low 0 0.0% 0.0% 0.0% 0.0% 1 10.0% 7.1% 4.8% 2.5% Moderate 0 0.0% 0.0% 0.0% 0.0% 5 50.0% 45.4% 33.8% 28.7% Middle 10 100.0% 100.0% 100.0% 100.0% 2 20.0% 32.3% 26.9% 27.2% Upper 0 0.0% 0.0% 0.0% 0.0% 2 20.0% 15.3% 29.0% 37.0%Unknown 0 0.0% 0.0% 0.0% 0.0% 0 0.0% 0.0% 5.5% 4.6% Total 10 100.0% 100.0% 100.0% 100.0% 10 100.0% 100.0% 100.0% 100.0% Refinance Low 0 0.0% 0.0% 0.0% 0.0% 0 0.0% 0.0% 6.8% 4.7% Moderate 0 0.0% 0.0% 0.0% 0.0% 4 50.0% 38.5% 25.0% 19.7%Middle 8 100.0% 100.0% 100.0% 100.0% 2 25.0% 47.8% 27.8% 28.0%Upper 0 0.0% 0.0% 0.0% 0.0% 2 25.0% 13.6% 36.4% 43.5% Unknown 0 0.0% 0.0% 0.0% 0.0% 0 0.0% 0.0% 4.0% 4.2% Total 8 100.0% 100.0% 100.0% 100.0% 8 100.0% 100.0% 100.0% 100.0% Home Improvement Low 0 0.0% 0.0% 0.0% 0.0% 1 6.7% 0.8% 19.4% 10.9% Moderate 0 0.0% 0.0% 0.0% 0.0% 8 53.3% 42.7% 30.6% 21.0%Middle 15 100.0% 100.0% 100.0% 100.0% 0 0.0% 0.0% 19.4% 23.6%Upper 0 0.0% 0.0% 0.0% 0.0% 5 33.3% 55.2% 29.2% 44.4% Unknown 0 0.0% 0.0% 0.0% 0.0% 1 6.7% 1.3% 1.4% 0.1% Total 15 100.0% 100.0% 100.0% 100.0% 15 100.0% 100.0% 100.0% 100.0% Multi-Family Low 0 0.0% 0.0% 0.0% 0.0% 0 0.0% 0.0% 0.0% 0.0% Moderate 0 0.0% 0.0% 0.0% 0.0% 0 0.0% 0.0% 0.0% 0.0% Middle 0 0.0% 0.0% 100.0% 100.0% 0 0.0% 0.0% 0.0% 0.0% Upper 0 0.0% 0.0% 0.0% 0.0% 0 0.0% 0.0% 0.0% 0.0%Unknown 0 0.0% 0.0% 0.0% 0.0% 0 0.0% 0.0% 100.0% 100.0% Total 0 0.0% 0.0% 100.0% 100.0% 0 0.0% 0.0% 100.0% 100.0% HMDA Totals Low 0 0.0% 0.0% 0.0% 0.0% 2 6.1% 3.5% 8.4% 4.2% Moderate 0 0.0% 0.0% 0.0% 0.0% 17 51.5% 42.7% 29.2% 23.6%Middle 33 100.0% 100.0% 100.0% 100.0% 4 12.1% 30.1% 25.9% 26.9%Upper 0 0.0% 0.0% 0.0% 0.0% 9 27.3% 23.4% 32.2% 40.2% Unknown 0 0.0% 0.0% 0.0% 0.0% 1 3.0% 0.3% 4.3% 5.1% Total 33 100.0% 100.0% 100.0% 100.0% 33 100.0% 100.0% 100.0% 100.0%
SMALL BUSINESS By Tract Income Bank Aggregate # % % $(000s) % % $(000s) Low 0 0.0% 0.0% 0.0% 0.0% Moderate 0 0.0% 0.0% 0.0% 0.0% Middle 5 100.0% 100.0% 100.0% 100.0%Upper 0 0.0% 0.0% 0.0% 0.0%Unknown 0 0.0% 0.0% 0.0% 0.0% Tract Unknown 0 0.0% 0.0% 0.0% 0.0% Total 5 100.0% 100.0% 100.0% 100.0% By Revenue $1 Million or Less 4 80.0% 84.4% 47.2% 48.6% By Loan Size $100,000 or less 4 80.0% 39.7% 96.5% 55.9%$100,001-$250,000 1 20.0% 60.3% 2.8% 19.4% $250,001-$1 Million 0 0.0% 0.0% 0.7% 24.7% Total 5 100.0% 100.0% 100.0% 100.0%
2010 Originations and Purchases

Tioga State Bank CRA Public Evaluation Spencer, NY March 5, 2012
BB19
CRA APPENDIX A
GLOSSARY Census tract: A small subdivision of metropolitan and other densely populated counties. Census tract boundaries do not cross county lines; however, they may cross the boundaries of metropolitan statistical areas. Census tracts usually have between 2,500 and 8,000 persons, and their physical size varies widely depending upon population density. Census tracts are designed to be homogeneous with respect to population characteristics, economic status, and living conditions to allow for statistical comparisons. Community development: All agencies have adopted the following language. Affordable housing (including multifamily rental housing) for low- or moderate-income individuals; community services targeted to low- or moderate-income individuals; activities that promote economic development by financing businesses or farms that meet the size eligibility standards of the Small Business Administration’s Development Company or Small Business Investment Company programs (13 CFR 121.301) or have gross annual revenues of $1 million or less; or, activities that revitalize or stabilize low- or moderate-income geographies; or loans, investments or services that (i) Support, enable or facilitate projects or activities that meet eligible uses” criteria described in Section 2301c of the Housing and Economic Recovery Act of 2008 (“HERA”), Public Law 110-289, 122 Stat. 2654, as amended, and are conducted in designated target areas identified in plans approved by the United States Department of Urban and Development in accordance with the Neighborhood Stabilization program (“NSP”); (ii) Are provided no later than two years after the last date funds appropriated for the NSP are required to be spent by the grantees; (iii) Benefit low-, moderate- and middle-income individuals and geographies in the bank’s assessment area(s) or geographies outside the bank’s assessment area(s) provided the bank has adequately addressed the community development needs of its assessment area(s). Community Development Financial Institution (“CDFI”): A CDFI is an organization that has been certified by the U.S. Treasury as a provider of loans and services that assist specially funded institutions that revitalize LMI areas and assist LMI persons. Consumer loan(s): A loan(s) to one or more individuals for household, family, or other personal expenditures. A consumer loan does not include a home mortgage, small business, or small farm loan. This definition includes the following categories: motor vehicle loans, credit card loans, home equity loans, other secured consumer loans, and other unsecured consumer loans. Family: A family is a group of two people or more related by birth, marriage, or adoption and residing together; all such people (including related subfamily members) are considered as members of one family. Geography: A census tract delineated by the United States Bureau of the Census in the most recent decennial census. Home Mortgage Disclosure Act (“HMDA”): The statute that requires certain mortgage lenders

Tioga State Bank CRA Public Evaluation Spencer, NY March 5, 2012
BB20
that do business or have banking offices in a metropolitan statistical area to file annual summary reports of their mortgage lending activity. The reports include such data as the race, gender, and income of applicants, the amount of loan requested, and the disposition of the application (e.g., approved, denied, and withdrawn). Home mortgage loans: Includes home purchase and home improvement loans as defined in the HMDA regulation. This definition also includes multifamily (five or more families) dwelling loans, loans for the purchase of manufactured homes, and refinancing of home improvement and home purchase loans. Household: A household consists of all persons who occupy a housing unit. Persons not living in households are classified as living in group quarters. Low-income: Individual income that is less than 50% of the area median income, or a median family income that is less than 50%, in the case of a geography. Metropolitan Area (“MA”): A metropolitan statistical area (MSA) or a metropolitan division (MD) as defined by the Office of Management and Budget. A MSA is a core area containing at least one urbanized area of 50,000 or more inhabitants, together with adjacent communities having a high degree of economic and social integration with that core. A MD is a division of a MSA based on specific criteria including commuting patterns. Only a MSA that has a population of at least 2.5 million may be divided into MDs. Middle-income: Individual income that is at least 80% and less than 120% of the area median income, or a median family income that is at least 80% and less than 120%, in the case of a geography. Moderate-income: Individual income that is at least 50% and less than 80% of the area median income, or a median family income that is at least 50% and less than 80%, in the case of a geography. Owner-occupied units: Includes units occupied by the owner or co-owner, even if the unit has not been fully paid for or is mortgaged. Qualified investment: A qualified investment is defined as any lawful investment, deposit, membership share, or grant that has as its primary purpose community development. Small loan(s) to business (es): A loan included in “loans to small businesses” as defined in the Consolidated Report of Condition and Income (“Call Report”) and the Thrift Financial Reporting (“TFR”) instructions. These loans have original amounts of $1 million or less and typically are either secured by nonfarm or nonresidential real estate or are classified as commercial and industrial loans. However, thrift institutions may also exercise the option to report loans secured by nonfarm residential real estate as "small business loans" if the loans are reported on the TFR as nonmortgage, commercial loans. Upper-income: Individual income that is more than 120% of the area median income, or a median family income that is more than 120%, in the case of a geography.

I:t1
I:t1
tv -
Ch
em
un
g
Tio
ga
Tio
ga
Sta
te B
an
k
Ass
essm
ent A
rea
Janu
ary
1, 2
010
-D
ecem
ber
31, 2
011
To
mp
kin
s
Bro
om
e
Le
ge
nd
Zer
o In
com
e T
ract
s
Low
Inc
ome
Tra
cts
Mod
erat
e In
com
e T
ract
s
2000
Cen
sus
Tra
cts
Cou
ntie
s
~ As
sess
men
t Are
a
• B
ranc
h