public disclosure authorized report no: aus1511...
TRANSCRIPT
Report No: AUS1511
Republic of the Philippines
Strategy Update and Implementation Plan
Developing the Institutional Framework for the Water Supply and Sanitation Sector and Identifying Investment Plans & Programs
May 2013
EASPS
EAST ASIA AND PACIFIC
Pub
lic D
iscl
osur
e A
utho
rized
Pub
lic D
iscl
osur
e A
utho
rized
Pub
lic D
iscl
osur
e A
utho
rized
Pub
lic D
iscl
osur
e A
utho
rized
Pub
lic D
iscl
osur
e A
utho
rized
Pub
lic D
iscl
osur
e A
utho
rized
Pub
lic D
iscl
osur
e A
utho
rized
Pub
lic D
iscl
osur
e A
utho
rized
Standard Disclaimer:
This volume is a product of the staff of the International Bank for Reconstruction and Development/ The World Bank. The findings, interpretations, and conclusions expressed in this paper do not necessarily reflect the views of the Executive Directors of The World Bank or the governments they represent. The World Bank does not guarantee the accuracy of the data included in this work. The boundaries, colors, denominations, and other information shown on any map in this work do not imply any judgment on the part of The World Bank concerning the legal status of any territory or the endorsement or acceptance of such boundaries.
Copyright Statement:
The material in this publication is copyrighted. Copying and/or transmitting portions or all of this work
without permission may be a violation of applicable law. The International Bank for Reconstruction and
Development/ The World Bank encourages dissemination of its work and will normally grant permission to
reproduce portions of the work promptly.
For permission to photocopy or reprint any part of this work, please send a request with complete
information to the Copyright Clearance Center, Inc., 222 Rosewood Drive, Danvers, MA 01923, USA,
telephone 978-750-8400, fax 978-750-4470, http://www.copyright.com/.
All other queries on rights and licenses, including subsidiary rights, should be addressed to the Office of the
Publisher, The World Bank, 1818 H Street NW, Washington, DC 20433, USA, fax 202-522-2422, e-mail
Developing the Institutional Framework for the
Water Supply and Sanitation Sector and
Identifying Investment Plans & Programs
FINAL REPORT
MAY 2013
LIST OF ACRONYMS
ADB Asian Development Bank APIS Annual Poverty Indicator Surveys BWSA Barangay Water and Sanitation Association CAPEX Capital Expenditures CBO Community Based Organization CDA Cooperative Development Authority CIPH City-wide Investment Plan for Health CPC Certificate of Public Convenience CWA Clean Water Act DAR Department of Agrarian Reform DBM Department of Budget and Management DENR Department of Environment and Natural Resources DILG Department of the Interior and Local Government DOE Department of Energy DOF Department of Finance DOH Department of Health DPWH Department of Public Works and Highways EMB Environmental Management Bureau EO Executive Order FHSIS Field Health Services Information System FOREX Foreign Exchange GFI Government Financial Institutions GOP Government of the Philippines HHs Households HUC Highly Urbanized City IBRD International Bank for Rehabilitation and Development (World Bank) JMP Joint Monitoring Program KPI Key Performance Indicators LGU Local Government Units lps liters per second LWUA Local Water Utilities Administration MDG Millennium Development Goal MDGF Millennium Development Goal Fund MDFO Municipal Development Fund Office MDS Monthly Data Sheet MIPH Municipal-wide Investment Plan for Health mm millimeter MTPDP Medium Term Philippine Development Plan MWCI Manila Water Company, Inc. MWSI Maynilad Water Services, Inc. MWSS Metropolitan Waterworks and Sewerage System NAPC-WASCO National Anti-Poverty Commission-Water Supply Coordination Office NEDA National Economic and Development Authority NG National Government
NGO Non-Government Organizations NSSMP National Sewerage and Septage Management Programs NRW Non-Revenue Water NSO National Statistics Office
NWRB National Water Resources Board NWRMO National Water Resources Management Office OBA Output-Based Aid OP Office of the President OPEX Operational Expenditures PD Presidential Decree PIPH Province-wide Investment Plan for health PMO Project Management Office PNSDW Philippine National Standards for Drinking Water PPP Public-Private Partnership PSA Philippine Sanitation Alliance PSP Private Sector Participation PWSSR Philippine Water Supply and Sanitation Roadmap PSSR Philippine Sustainable Sanitation Roadmap R.A. Republic Act RO Regulatory Office RORB Return on Rate Base RWSA Rural water and Sanitation Association SBWRB Subic Bay Water Regulatory Board
SC Supreme Court
SEC Securities and Exchange Commission
TA Technical Assistance ToR Terms of Reference TWG Technical Working Group WB World Bank WD Water District WEDC Water, Engineering Development Center WHO/UNICEF World World Health organization/United Nation International Children
Emergency Fund WRC Water Water Regulatory Commission WSP Water Water Service Provider WSS Water Water Supply and Sanitation
TABLE OF CONTENTS
Page
EXECUTIVE SUMMARY 1 - 8
A INTRODUCTION 9 1. Background 9 2. Terms of Reference (TOR) 10 3. Methodology/Approach 10 4. Study Limitations 10 B. SECTOR ASSESSMENT 12 1. The Water and Sanitation Sector Overview 12 2. Water Supply Coverage 15
3. Millennium Development Goals: WS Targets 18 4. Public Health and Sanitation 19 5. WSS Sector Issues and Challenges 23 C. DEMAND GAP ANALYSIS 26 1. Population Projections 26 2. Served Population, 2011 28 3. Number of WSPs, 2011 32 4. LGUs with Septage and Sewerage facilities 32 5. Target Setting Basis 32 6. Target Summary 35 D. INVESTMENT REQUIREMENTS 37 1. Basic Formula 37 2. Basis for Infrastructure Cost Estimates 37 3. Unit Cost Estimates 38 4. Infrastructure Investment Requirements 40 5. Capacity Building Requirements 42 6. Fund Sourcing 43 E. INSTITUTIONAL RECOMMENDATIONS 44 1. Review of Sector Assessment Reports 44 2. Water Sector Constraints and Weaknesses 45 3. Sanitation Sector Constraints and Weaknesses 47 4. WSS Constraints Summary 48 5. Major Recommendations of Various WSS Studies 48 6. Institutional Recommendations 52 7. Structural Recommendations for DPWH 56 8. Infrastructure Programs 56
F. ACTION PLANNING FOR THE DPWH 61 1. The DPWH 61 2. DPWH WSS Sector Role 61
3. Proposed DPWH WSS Structure 63 4. Action Plans 64
Annexes A Terms of Reference 67 B Summary of Population Projections 69 C Sample Letter of DPWH Secretary Sent to Various Agencies 75 D Data Template
77 E Population Served in 2011 by Regions 78 F Number of Water Supply Providers 84 G Seventy Five Level III Data Samples 89 H Level III Unit Cost for all Main Island Locations 91 I Level III Unit Cost Considering All Samples 94 J Cost of an Upgradable Level III 96 K Breakdown of WDs and LGU WSPs According to Size Classification 97 Tables 1: Primary WSS Agencies and their Roles 13 2: Water Supply Providers 14 3: 2003 Market Share by Type of Provider 15 4: Population Served by Water Supply Providers, as of 2000 16 5: Regional Coverage 16 6: JMP: Use of Improved Drinking Water Sources 18 7: MDG Target for Water Supply 19 8: Projected Population Projections 29 9: Agencies Furnishing Data 30 10: 2011 Served Population 30 11: Comparison between 2003 and 2011 Coverage Data 30 12: Regional Comparison of Population Coverage, 2007 vs 2011 31 13: Comparison of Water Supply Providers 32 14: Water Supply Target Population To Be Served 35 15: Target Population To Be Served 35 16: Target LGUs 36 17: Unit Cost for Level III Water Supply System Infrastructure 39 18: Water Supply Investment Requirements, Php B 40 19: Sanitation Targets 41 20: Sanitation Investment Requirements 41 21: Summary of WSS Infrastructure Investment Requirements 42 22: WSP Training Duration 42 23: Major Sector Reports/Papers 44 24: Major Institutional Recommendations 48 25: Recommendations for Sector Framework 52 26: Major Roles of Agencies 53 27: Government WSPs by Connection Size 56 28: Water Supply Funding Source Requirements 57 29: WS Government Funding Requirements 57 30: Sanitation Fund Sources 58 31: Summary of WSS Funding Requirements from the National Government 58 32: Proposed Roles of the DPWH 63
33: Initial Manpower Complement of the WSS Unit 64 Figures: 1: Water Supply Coverage: NEDA and JMP 19 2: Types of Trends-Population Projections 27 3: Proposed WSS Structure in DPWH
63 References 101
Developing the Institutional Framework for the WSS Sector and Identifying Investment Plans and Programs April 2013
1
EXECUTIVE SUMMARY Developing the Institutional Framework for the Water Supply and Sanitation Sector and Identifying Investment Plans and Programs 1. The Secretary of the DPWH was appointed as the “Water Czar” to promote the
development of the sector. With the water supply MDG targets due by 2015 and with the water supply roadmap envisioning universal coverage by 2025, there is a need to establish the extent of investment required to improve water supply coverage and to sustain water supply operation through improved governance of water service providers and local governments. This project, through a Technical Assistance of the World Bank, was conceived to (1) determine the appropriate WSS structure within DPWH and develop its implementation and operation plan, and (2) identify targets, investment plans and programs.
2. The following methodology and approach were adopted for this study:
i. Stock taking on the type of utilities, their location and number of service connections (levels II and III);
ii. The following activities were done in parallel with the stock taking activities.
Population projections for all the towns/cities with the 2010 census data as baseline;
Gathering of data for cost estimating purposes,
Review of past sector reports to have an overview of reforms recommended;
iii. Tabulation of the data gathered to determine population served with Level III/II facilities;
iv. Determination of the demand gap by towns/cities;
v. Determination of the targeted % served by level III/II systems for the different design years, 2015, 2020 and 2025;
vi. Determination of the unit system cost in building a level III and II system,
including the upgrading of level IIs to level IIIs; vii. Identification of the total Investment requirements and the programs needed;
viii. Determination of the roles of the DPWH within the water sector and preparation
of its institutional framework;
ix. Recommendation of sector roles for the different agencies. 3. Out of 1,617 towns and cities outside the National Capital Region, 1,286 (80%) have
level II and/or level III services as reported by end of 2011.
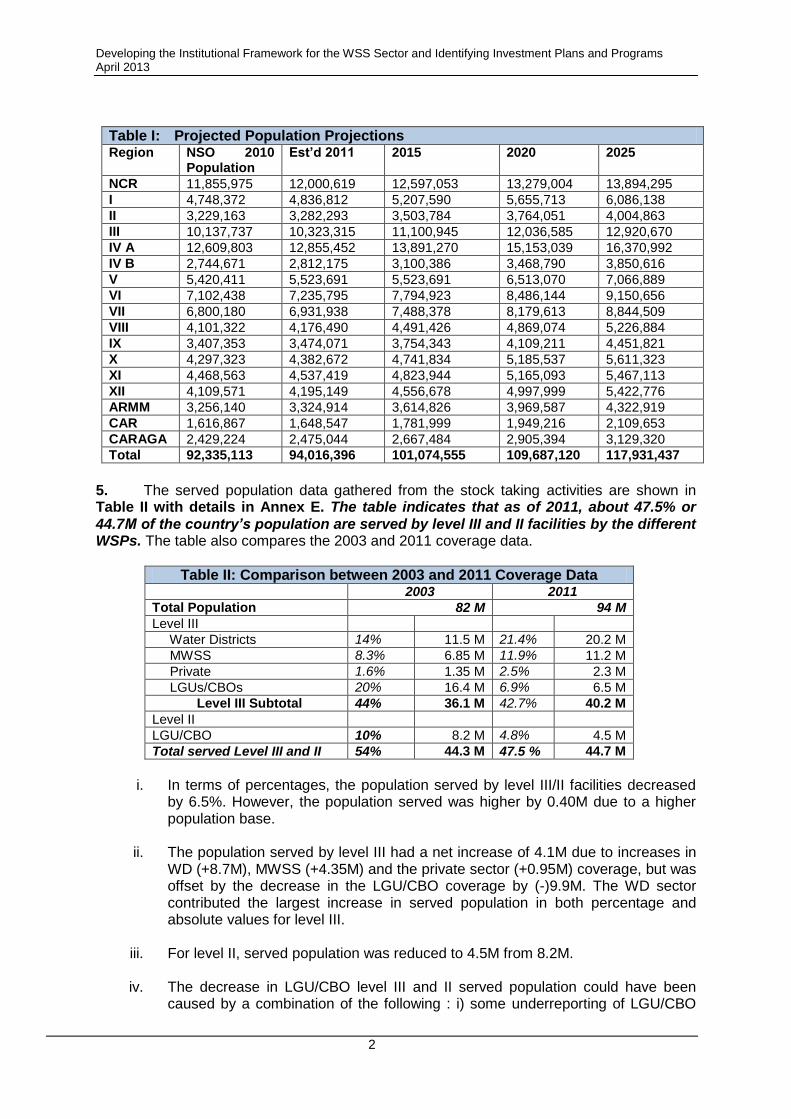
4. Table I shows the projected population projections.
Developing the Institutional Framework for the WSS Sector and Identifying Investment Plans and Programs April 2013
2
Table I: Projected Population Projections Region NSO 2010
Population Est’d 2011 2015 2020 2025
NCR 11,855,975 12,000,619 12,597,053 13,279,004 13,894,295
I 4,748,372 4,836,812 5,207,590 5,655,713 6,086,138
II 3,229,163 3,282,293 3,503,784 3,764,051 4,004,863
III 10,137,737 10,323,315 11,100,945 12,036,585 12,920,670
IV A 12,609,803 12,855,452 13,891,270 15,153,039 16,370,992
IV B 2,744,671 2,812,175 3,100,386 3,468,790 3,850,616
V 5,420,411 5,523,691 5,523,691 6,513,070 7,066,889
VI 7,102,438 7,235,795 7,794,923 8,486,144 9,150,656
VII 6,800,180 6,931,938 7,488,378 8,179,613 8,844,509
VIII 4,101,322 4,176,490 4,491,426 4,869,074 5,226,884
IX 3,407,353 3,474,071 3,754,343 4,109,211 4,451,821
X 4,297,323 4,382,672 4,741,834 5,185,537 5,611,323
XI 4,468,563 4,537,419 4,823,944 5,165,093 5,467,113
XII 4,109,571 4,195,149 4,556,678 4,997,999 5,422,776
ARMM 3,256,140 3,324,914 3,614,826 3,969,587 4,322,919
CAR 1,616,867 1,648,547 1,781,999 1,949,216 2,109,653
CARAGA 2,429,224 2,475,044 2,667,484 2,905,394 3,129,320
Total 92,335,113 94,016,396 101,074,555 109,687,120 117,931,437
5. The served population data gathered from the stock taking activities are shown in Table II with details in Annex E. The table indicates that as of 2011, about 47.5% or 44.7M of the country’s population are served by level III and II facilities by the different WSPs. The table also compares the 2003 and 2011 coverage data.
Table II: Comparison between 2003 and 2011 Coverage Data 2003 2011
Total Population 82 M 94 M
Level III
Water Districts 14% 11.5 M 21.4% 20.2 M
MWSS 8.3% 6.85 M 11.9% 11.2 M
Private 1.6% 1.35 M 2.5% 2.3 M
LGUs/CBOs 20% 16.4 M 6.9% 6.5 M
Level III Subtotal 44% 36.1 M 42.7% 40.2 M
Level II
LGU/CBO 10% 8.2 M 4.8% 4.5 M
Total served Level III and II 54% 44.3 M 47.5 % 44.7 M
i. In terms of percentages, the population served by level III/II facilities decreased
by 6.5%. However, the population served was higher by 0.40M due to a higher population base.
ii. The population served by level III had a net increase of 4.1M due to increases in WD (+8.7M), MWSS (+4.35M) and the private sector (+0.95M) coverage, but was offset by the decrease in the LGU/CBO coverage by (-)9.9M. The WD sector contributed the largest increase in served population in both percentage and absolute values for level III.
iii. For level II, served population was reduced to 4.5M from 8.2M.
iv. The decrease in LGU/CBO level III and II served population could have been
caused by a combination of the following : i) some underreporting of LGU/CBO
Developing the Institutional Framework for the WSS Sector and Identifying Investment Plans and Programs April 2013
3
data for 2011, ii) conversion of the LGU to private or WD models, iii) the facilities deteriorated and were abandoned or iv) the figures in 2003 may have been overstated.
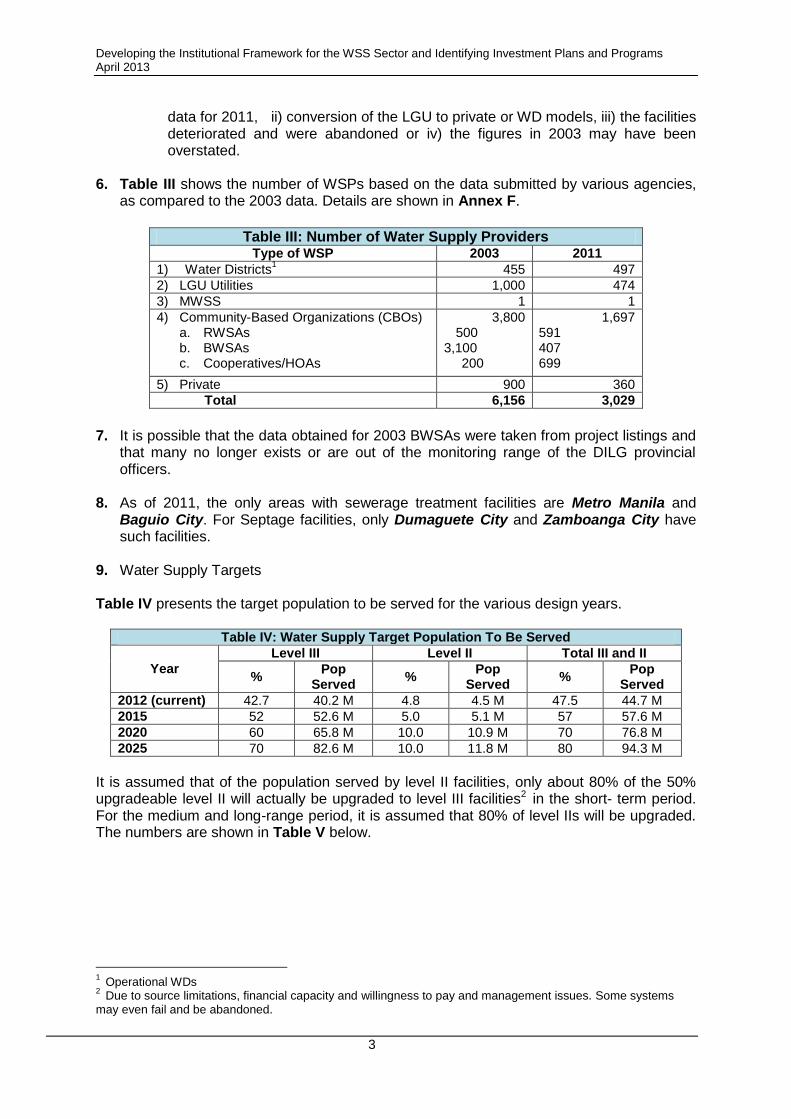
6. Table III shows the number of WSPs based on the data submitted by various agencies,
as compared to the 2003 data. Details are shown in Annex F.
Table III: Number of Water Supply Providers
Type of WSP 2003 2011
1) Water Districts1 455 497
2) LGU Utilities 1,000 474
3) MWSS 1 1
4) Community-Based Organizations (CBOs) a. RWSAs b. BWSAs c. Cooperatives/HOAs
3,800 500 3,100 200
1,697 591 407 699
5) Private 900 360
Total 6,156 3,029
7. It is possible that the data obtained for 2003 BWSAs were taken from project listings and
that many no longer exists or are out of the monitoring range of the DILG provincial officers.
8. As of 2011, the only areas with sewerage treatment facilities are Metro Manila and
Baguio City. For Septage facilities, only Dumaguete City and Zamboanga City have such facilities.
9. Water Supply Targets
Table IV presents the target population to be served for the various design years.
Table IV: Water Supply Target Population To Be Served
Year
Level III Level II Total III and II
% Pop
Served %
Pop Served
% Pop
Served
2012 (current) 42.7 40.2 M 4.8 4.5 M 47.5 44.7 M
2015 52 52.6 M 5.0 5.1 M 57 57.6 M
2020 60 65.8 M 10.0 10.9 M 70 76.8 M
2025 70 82.6 M 10.0 11.8 M 80 94.3 M
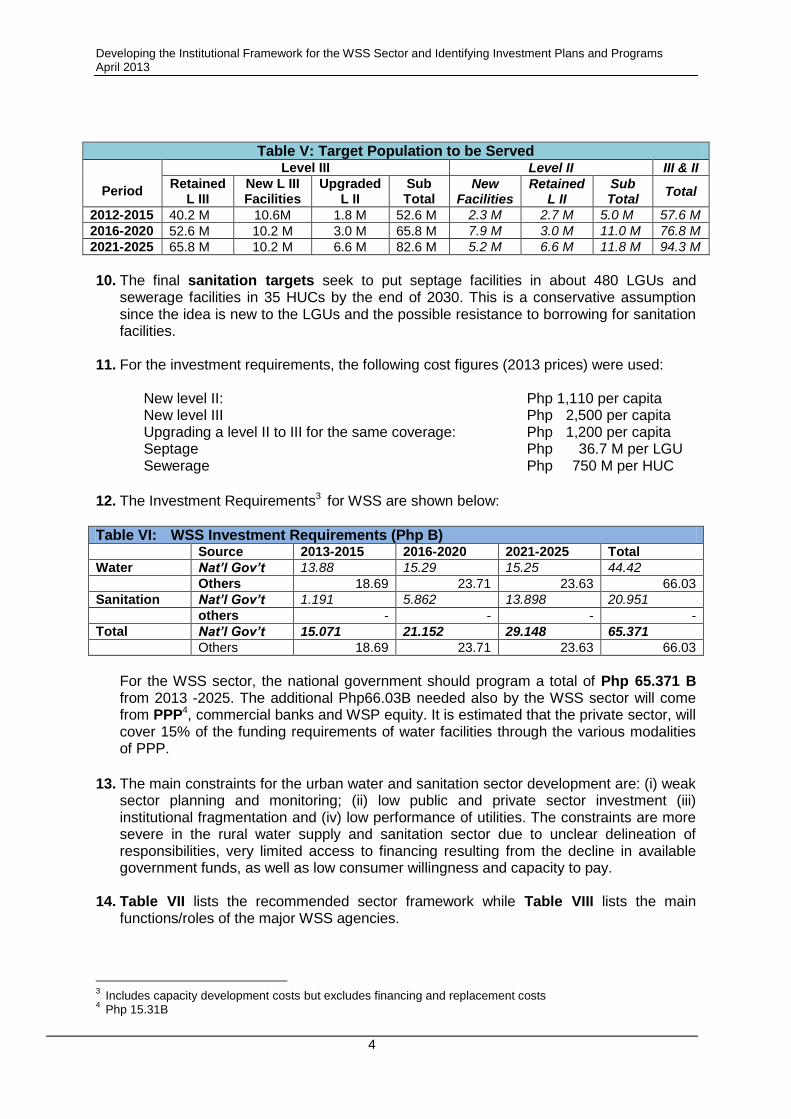
It is assumed that of the population served by level II facilities, only about 80% of the 50% upgradeable level II will actually be upgraded to level III facilities2 in the short- term period. For the medium and long-range period, it is assumed that 80% of level IIs will be upgraded. The numbers are shown in Table V below.
1 Operational WDs
2 Due to source limitations, financial capacity and willingness to pay and management issues. Some systems
may even fail and be abandoned.
Developing the Institutional Framework for the WSS Sector and Identifying Investment Plans and Programs April 2013
4
Table V: Target Population to be Served
Period
Level III Level II III & II
Retained L III
New L III Facilities
Upgraded L II
Sub Total
New Facilities
Retained L II
Sub Total
Total
2012-2015 40.2 M 10.6M 1.8 M 52.6 M 2.3 M 2.7 M 5.0 M 57.6 M
2016-2020 52.6 M 10.2 M 3.0 M 65.8 M 7.9 M 3.0 M 11.0 M 76.8 M
2021-2025 65.8 M 10.2 M 6.6 M 82.6 M 5.2 M 6.6 M 11.8 M 94.3 M
10. The final sanitation targets seek to put septage facilities in about 480 LGUs and
sewerage facilities in 35 HUCs by the end of 2030. This is a conservative assumption since the idea is new to the LGUs and the possible resistance to borrowing for sanitation facilities.
11. For the investment requirements, the following cost figures (2013 prices) were used:
New level II: Php 1,110 per capita New level III Php 2,500 per capita Upgrading a level II to III for the same coverage: Php 1,200 per capita Septage Php 36.7 M per LGU Sewerage Php 750 M per HUC
12. The Investment Requirements3 for WSS are shown below:
Table VI: WSS Investment Requirements (Php B) Source 2013-2015 2016-2020 2021-2025 Total
Water Nat’l Gov’t 13.88 15.29 15.25 44.42
Others 18.69 23.71 23.63 66.03
Sanitation Nat’l Gov’t 1.191 5.862 13.898 20.951
others - - - -
Total Nat’l Gov’t 15.071 21.152 29.148 65.371
Others 18.69 23.71 23.63 66.03
For the WSS sector, the national government should program a total of Php 65.371 B from 2013 -2025. The additional Php66.03B needed also by the WSS sector will come from PPP4, commercial banks and WSP equity. It is estimated that the private sector, will cover 15% of the funding requirements of water facilities through the various modalities of PPP.
13. The main constraints for the urban water and sanitation sector development are: (i) weak
sector planning and monitoring; (ii) low public and private sector investment (iii) institutional fragmentation and (iv) low performance of utilities. The constraints are more severe in the rural water supply and sanitation sector due to unclear delineation of responsibilities, very limited access to financing resulting from the decline in available government funds, as well as low consumer willingness and capacity to pay.
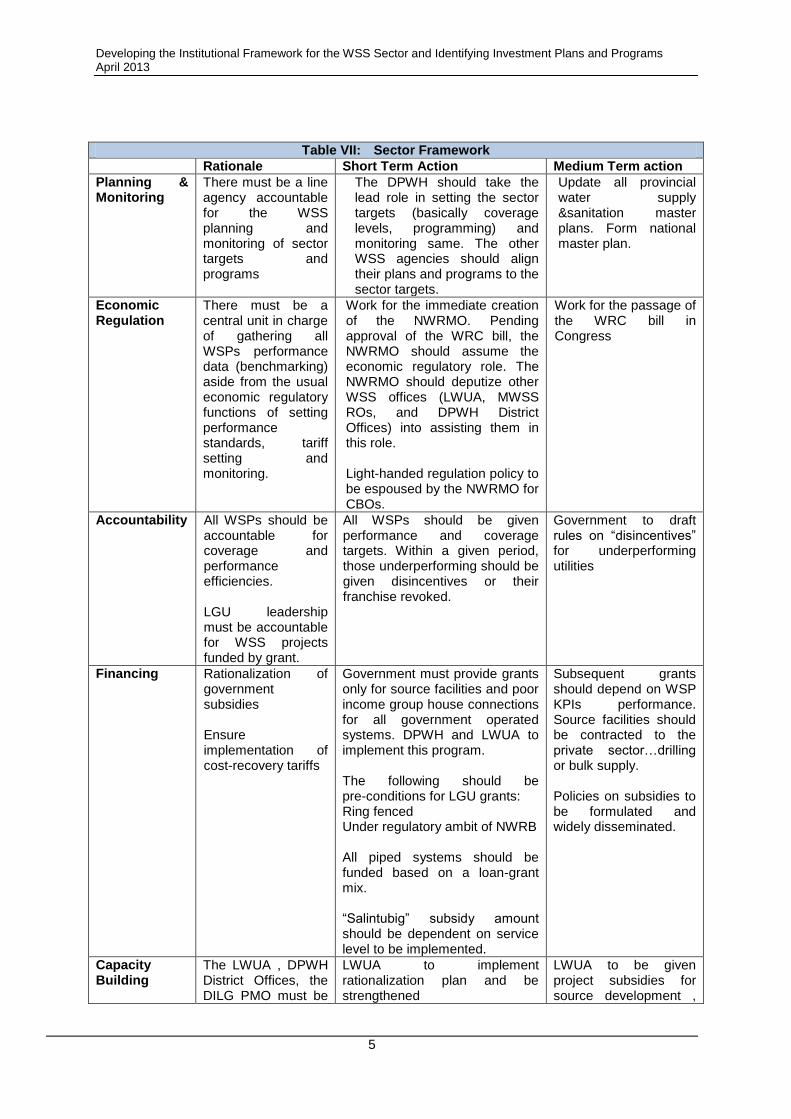
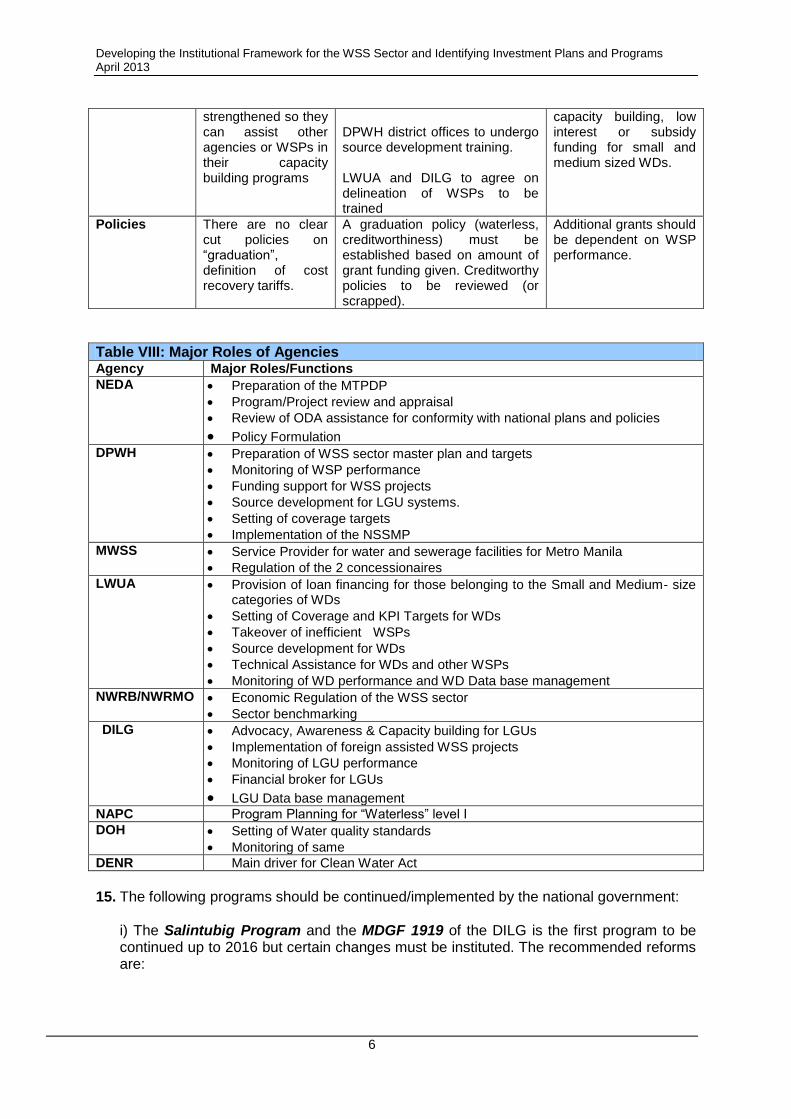
14. Table VII lists the recommended sector framework while Table VIII lists the main
functions/roles of the major WSS agencies.
3 Includes capacity development costs but excludes financing and replacement costs
4 Php 15.31B
Developing the Institutional Framework for the WSS Sector and Identifying Investment Plans and Programs April 2013
5
Table VII: Sector Framework
Rationale Short Term Action Medium Term action
Planning & Monitoring
There must be a line agency accountable for the WSS planning and monitoring of sector targets and programs
The DPWH should take the lead role in setting the sector targets (basically coverage levels, programming) and monitoring same. The other WSS agencies should align their plans and programs to the sector targets.
Update all provincial water supply &sanitation master plans. Form national master plan.
Economic Regulation
There must be a central unit in charge of gathering all WSPs performance data (benchmarking) aside from the usual economic regulatory functions of setting performance standards, tariff setting and monitoring.
Work for the immediate creation of the NWRMO. Pending approval of the WRC bill, the NWRMO should assume the economic regulatory role. The NWRMO should deputize other WSS offices (LWUA, MWSS ROs, and DPWH District Offices) into assisting them in this role. Light-handed regulation policy to be espoused by the NWRMO for CBOs.
Work for the passage of the WRC bill in Congress
Accountability All WSPs should be accountable for coverage and performance efficiencies. LGU leadership must be accountable for WSS projects funded by grant.
All WSPs should be given performance and coverage targets. Within a given period, those underperforming should be given disincentives or their franchise revoked.
Government to draft rules on “disincentives” for underperforming utilities
Financing Rationalization of government subsidies Ensure implementation of cost-recovery tariffs
Government must provide grants only for source facilities and poor income group house connections for all government operated systems. DPWH and LWUA to implement this program.
The following should be pre-conditions for LGU grants:
o Ring fenced o Under regulatory ambit of NWRB
All piped systems should be funded based on a loan-grant mix. “Salintubig” subsidy amount should be dependent on service level to be implemented.
Subsequent grants should depend on WSP KPIs performance. Source facilities should be contracted to the private sector…drilling or bulk supply. Policies on subsidies to be formulated and widely disseminated.
Capacity Building
The LWUA , DPWH District Offices, the DILG PMO must be
LWUA to implement rationalization plan and be strengthened
LWUA to be given project subsidies for source development ,
Developing the Institutional Framework for the WSS Sector and Identifying Investment Plans and Programs April 2013
6
strengthened so they can assist other agencies or WSPs in their capacity building programs
DPWH district offices to undergo source development training. LWUA and DILG to agree on delineation of WSPs to be trained
capacity building, low interest or subsidy funding for small and medium sized WDs.
Policies There are no clear cut policies on “graduation”, definition of cost recovery tariffs.
A graduation policy (waterless, creditworthiness) must be established based on amount of grant funding given. Creditworthy policies to be reviewed (or scrapped).
Additional grants should be dependent on WSP performance.
Table VIII: Major Roles of Agencies Agency Major Roles/Functions
NEDA Preparation of the MTPDP
Program/Project review and appraisal
Review of ODA assistance for conformity with national plans and policies
Policy Formulation DPWH Preparation of WSS sector master plan and targets
Monitoring of WSP performance
Funding support for WSS projects
Source development for LGU systems.
Setting of coverage targets
Implementation of the NSSMP
MWSS Service Provider for water and sewerage facilities for Metro Manila
Regulation of the 2 concessionaires
LWUA Provision of loan financing for those belonging to the Small and Medium- size categories of WDs
Setting of Coverage and KPI Targets for WDs
Takeover of inefficient WSPs
Source development for WDs
Technical Assistance for WDs and other WSPs
Monitoring of WD performance and WD Data base management
NWRB/NWRMO Economic Regulation of the WSS sector
Sector benchmarking
DILG Advocacy, Awareness & Capacity building for LGUs
Implementation of foreign assisted WSS projects
Monitoring of LGU performance
Financial broker for LGUs
LGU Data base management NAPC Program Planning for “Waterless” level I
DOH Setting of Water quality standards
Monitoring of same
DENR Main driver for Clean Water Act
15. The following programs should be continued/implemented by the national government:
i) The Salintubig Program and the MDGF 1919 of the DILG is the first program to be continued up to 2016 but certain changes must be instituted. The recommended reforms are:
Developing the Institutional Framework for the WSS Sector and Identifying Investment Plans and Programs April 2013
7
Only level II and III facilities should be given a budget of from Php 5-10M. Level I facilities must be allocated a maximum of only Php 2M.
LGU tariffs must be set through an ordinance prior to fund disbursement, otherwise, the subsidy shall be considered an interest free loan…to be paid from the LGU Internal Revenue Allotment Fund.
Groundwater source development activities shall be assisted by the LWUA and DPWH technical staff.
A graduation policy for waterless communities be formulated and implemented strictly.
ii) The LWUA must be rehabilitated through implementation of its rationalization program and be recapitalized or provided funds for projects which should be transformed into a revolving fund. These funds can be used also as counterpart funds for ODA loans
iii) A capacity development program should be developed and funds should be allocated between the DILG and LWUA. A MOA should be agreed upon between the two institutions on roles, coverage and strategies to be adopted. iv) The programs envisioned by the NSSMP should be implemented but reviewed to provide same percentage for subsidy for both sewerage and septage projects. v) DPWH must work for the implementation of the OBA program on a national scale.
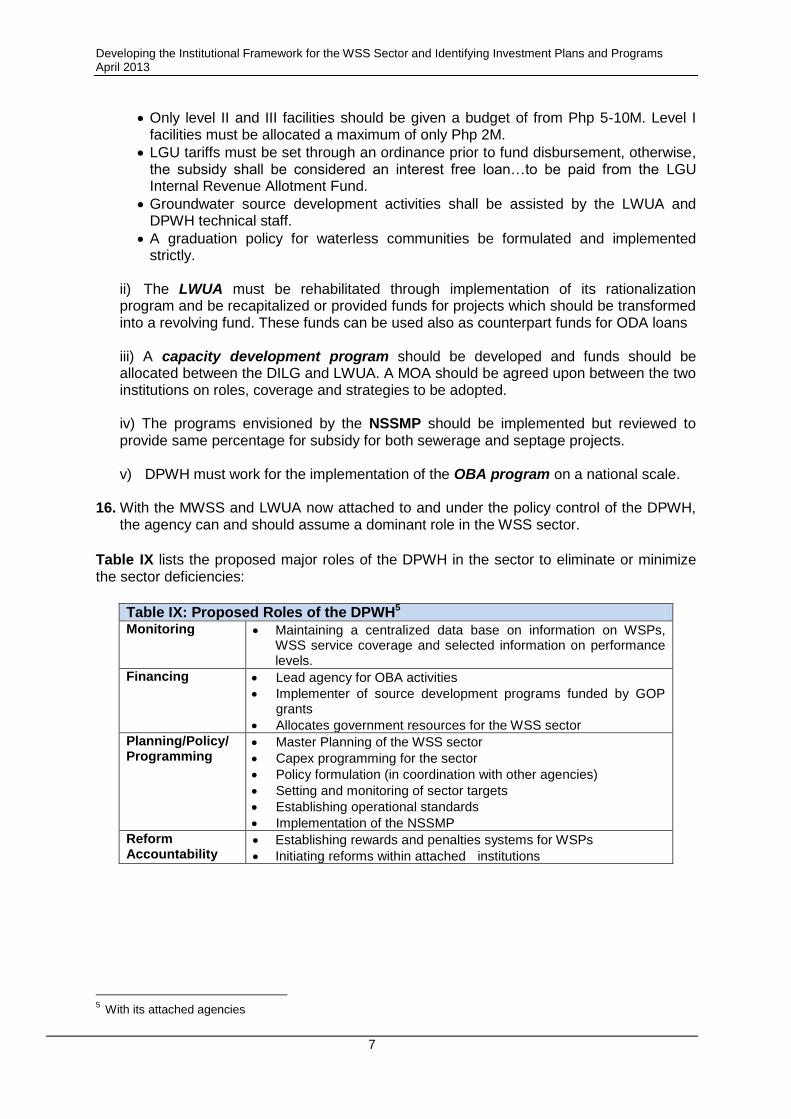
16. With the MWSS and LWUA now attached to and under the policy control of the DPWH,
the agency can and should assume a dominant role in the WSS sector.
Table IX lists the proposed major roles of the DPWH in the sector to eliminate or minimize the sector deficiencies:
Table IX: Proposed Roles of the DPWH5 Monitoring Maintaining a centralized data base on information on WSPs,
WSS service coverage and selected information on performance levels.
Financing Lead agency for OBA activities
Implementer of source development programs funded by GOP grants
Allocates government resources for the WSS sector
Planning/Policy/ Programming
Master Planning of the WSS sector
Capex programming for the sector
Policy formulation (in coordination with other agencies)
Setting and monitoring of sector targets
Establishing operational standards
Implementation of the NSSMP
Reform Accountability
Establishing rewards and penalties systems for WSPs
Initiating reforms within attached institutions
5 With its attached agencies
Developing the Institutional Framework for the WSS Sector and Identifying Investment Plans and Programs April 2013
8
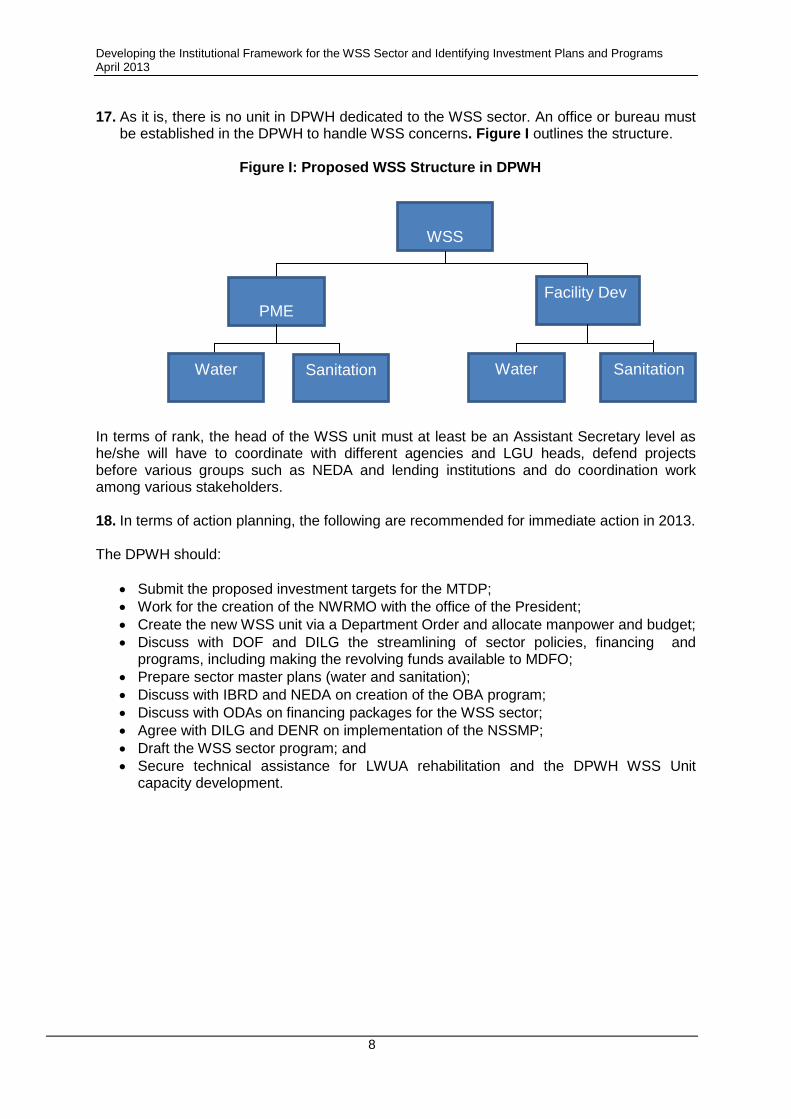
17. As it is, there is no unit in DPWH dedicated to the WSS sector. An office or bureau must be established in the DPWH to handle WSS concerns. Figure I outlines the structure.
Figure I: Proposed WSS Structure in DPWH
In terms of rank, the head of the WSS unit must at least be an Assistant Secretary level as he/she will have to coordinate with different agencies and LGU heads, defend projects before various groups such as NEDA and lending institutions and do coordination work among various stakeholders.
18. In terms of action planning, the following are recommended for immediate action in 2013. The DPWH should:
Submit the proposed investment targets for the MTDP;
Work for the creation of the NWRMO with the office of the President;
Create the new WSS unit via a Department Order and allocate manpower and budget;
Discuss with DOF and DILG the streamlining of sector policies, financing and programs, including making the revolving funds available to MDFO;
Prepare sector master plans (water and sanitation);
Discuss with IBRD and NEDA on creation of the OBA program;
Discuss with ODAs on financing packages for the WSS sector;
Agree with DILG and DENR on implementation of the NSSMP;
Draft the WSS sector program; and
Secure technical assistance for LWUA rehabilitation and the DPWH WSS Unit capacity development.
WSS
Facility Dev PME
Sanitation Water Sanitation Water
Developing the Institutional Framework for the WSS Sector and Identifying Investment Plans and Programs April 2013
9
A. INTRODUCTION
1. Background In 2011, the Aquino government charged the Department of Public Works and Highways (DPWH) to act as an overall coordinator in the water supply and sanitation (WSS) sector with the aim of improving sector performance. The department is seen to be the ‘main driver’ (i.e., having the mandate over the various service providers) and is the lead agency under the Inter-Agency Committee on Water that formulated the development and implementation plan of the proposed National Water Resources Management Office (NWRMO). The Secretary of the DPWH was appointed as the “Water Czar” to promote the development of the sector. With the water supply millennium development goal (MDG) targets due by 2015 and with the water supply roadmap envisioning universal coverage by 2025, there is a need to establish the extent of investment required to improve water supply coverage and to sustain water supply operation through improved governance of water service providers and local governments. A team, through a Technical Assistance (TA) of the World Bank, was engaged to (1) determine the appropriate WSS structure within DPWH and develop its implementation and operation plan, and (2) identify targets, investment plans, and programs.
2. Terms of Reference (shown as Annex A)
a. Objective This assignment shall: (1) determine the appropriate WSS structure within DPWH and develop its implementation and operation plan; and (2) identify targets, investment plans, and programs.
b. Scope of Work
i. Determine the gaps and challenges within the short-term (2015), medium-term (2020) and long-term period (2025);
ii. Develop an institutional framework of the WSS sector within DPWH and develop
implementation and operational plan; iii. Identify (politically) feasible actions or policy recommendations to improve the service
provision:
Determine interim or ‘quick-wins’ actions that can be undertaken.
Identify key elements that can be changed gradually in the short-to-medium-term (evolving role of Local Water Utilities Administration (LWUA), water districts (WDs), local government units (LGUs), etc.) and provide recommendation on how to bring about these changes;
iv. For each of the recommendations, identify:
Rationale for any recommended changes, i.e., problems or challenges that the recommended changes will be addressing
Policy instruments (Executive Orders [EOs.], Administrative Orders[AOs], etc.) needed to implement the changes
Action plan for implementing the recommendations
Developing the Institutional Framework for the WSS Sector and Identifying Investment Plans and Programs April 2013
10
Key players involved
Expected outcomes; and
v. Develop a Policy Note and presentation materials for government decision makers based on the above work.
3. Methodology/Approach
The following methodology and approach was agreed upon with World Bank and the team members:
i. Determination of the major agencies and other organizations which would have data on the type of utilities, their location, and number of service connections (levels II and III). Design of the form for the stock taking data;
ii. Assignment of the study team members to each of these agencies for stock taking
activities and interaction with various officials of the agencies/organizations identified;
iii. While the stock taking activities are on-going, the following activities are parallel activities: - Population projections for all the towns/cities with the 2010 census data as baseline; Gathering of data for cost estimating purposes - Review of past sector reports to have an overview of reforms recommended;
iv. Tabulation of the data gathered, i.e., type of WSPs, connections, and other data to
determine population served with Level III/II facilities;
v. Determination of the demand gap by towns/cities;
vi. Determination of the targeted % served by level III/II systems for the different design years, 2015, 2020 and 2025;
vii. Determination of the unit-system cost in building a level III and II system, including the
upgrading of level IIs to level IIIs;
viii. Identification of the total Investment requirements and the programs needed;
ix. Determination of the roles of the DPWH within the water sector and preparation of its institutional framework; and
x. Recommend sector roles for the different agencies.
4. Study Limitations
i. It is impossible to determine the population served by potable water as potability has its own parameters (meeting Philippine National Standards for Drinking Water [PNSDW] standards, monthly microbiological tests, chlorine residual data, etc.). Hence, the study will get the population served only by level III and II facilities as the served population with no value judgement on potability.
ii. Many of the stock taking data from the LGUs/CBOs have been supplied by the
Department of Interior and Local Government (DILG) regional offices. However, some LGUs have not been able to submit WSS data as of March 2013. When no current
Developing the Institutional Framework for the WSS Sector and Identifying Investment Plans and Programs April 2013
11
data from an LGU is obtained, data from past sector studies will be used whenever available and applicable.
iii. The team had planned on securing data on financial ratios (operating ratio) to
determine sustainability of the existing facilities. However, initial discussions with the agencies reveal that such data is either not available or is inaccurate. Only the WDs have such data.
Developing the Institutional Framework for the WSS Sector and Identifying Investment Plans and Programs April 2013
12
B. SECTOR ASSESSMENT
1. Water and Sanitation Sector Overview
a. Sector Institutions and their Roles
The major agencies involved in the sector are the National Economic Development Authority (NEDA), Department of Public Works and Highways (DPWH), Department of Finance (DOF), Department of Interior and Local Government (DILG), Department of Environment and Natural Resources (DENR), the Metropolitan Waterworks and Sewerage System (MWSS), Local Water Utilities Administration (LWUA), the National Water Resources Board (NWRB). Except for the MWSS, LWUA and the NWRB which are dedicated sector agencies, sector involvement among the rest merely form part of their overall mandates.
Local government units (LGUs) also play a critical role in the sector especially due to their area management role in local territories. Under the 2004-2010 Medium-Term Philippine Development Plan (MTPDP), the National Anti-Poverty Commission Water Supply Coordination Office (NAPC-WASCO) was created as the central coordinating unit for the implementation of the President’s Priority Program on Water (P3W). This program gives special attention to “waterless” LGUs. Several agencies appropriate oversight responsibilities for the sector resulting to overlaps in resource and economic regulation. The DENR and LGUs both have resource regulatory functions. On the other hand, while economic regulation is the core function of the NWRB, the same role is also played by LGUs (for LGU-run utilities), LWUA (for water districts), MWSS (for private water supply providers in Metro Manila) and other local Regulatory Boards created by LGUs to regulate private WSPs. Table 1 shows the delineated roles and responsibilities of the major agencies in the sector as of 2012. General policies concerning the water and sanitation sector are formulated by the NEDA in its Medium-Term Philippines Development Plan (MTPDP). Examples of general policies are decentralization of water supply provision, use of public-private partnership (PPP) and coverage targets. The MTPDP 2004–2010 aims at extending coverage of potable water to 92%–96% by 2010 through public and private investment, with priority given to 400 barangays with poor water supply coverage.[6 The responsibilities are defined by the 1976 Water Code of the Philippines and the 2004 Clean Water Act, which consolidated laws on water supply and sanitation and water resources management. The DOF takes the lead in financing water policies at the national level. The NWRB, under the DENR, is responsible for water resources management. However, the NWRB has limited capacity to execute these functions because of inadequate financial and technical capacities. The DPWH provides technical assistance in rural water supply systems. National standards for drinking water quality, as well as standards concerning sanitation and sewerage collection, are set by the Department of Health (DOH).
6
National Economic and Development Authority (NEDA) (2004). Medium-Term Philippine Development Plan 2004–2010
Developing the Institutional Framework for the WSS Sector and Identifying Investment Plans and Programs April 2013
13
b. Service levels (levels 1, II, III)
There are three service levels in the country:
Level I is a point source (shallow well, or a developed spring or a rainwater collector or infiltration gallery) with no distribution system, which serves users within about 25 meters from the source; Level II is a communal faucet system intended for rural areas where houses are clustered densely enough to warrant the development of a simple pipe distribution system with strategically placed public faucets.
Various sector studies and experiences have reported the upgrading of level II to level III systems. This is possible if the point source is a deep well or a spring capable of supplying additional demand, existing pipelines can be used and if there is good leadership within the WSP7.
7 WPEP, Sustainability of Community based RWS Organizations, WSP-IBRD, A de Vera, 2000
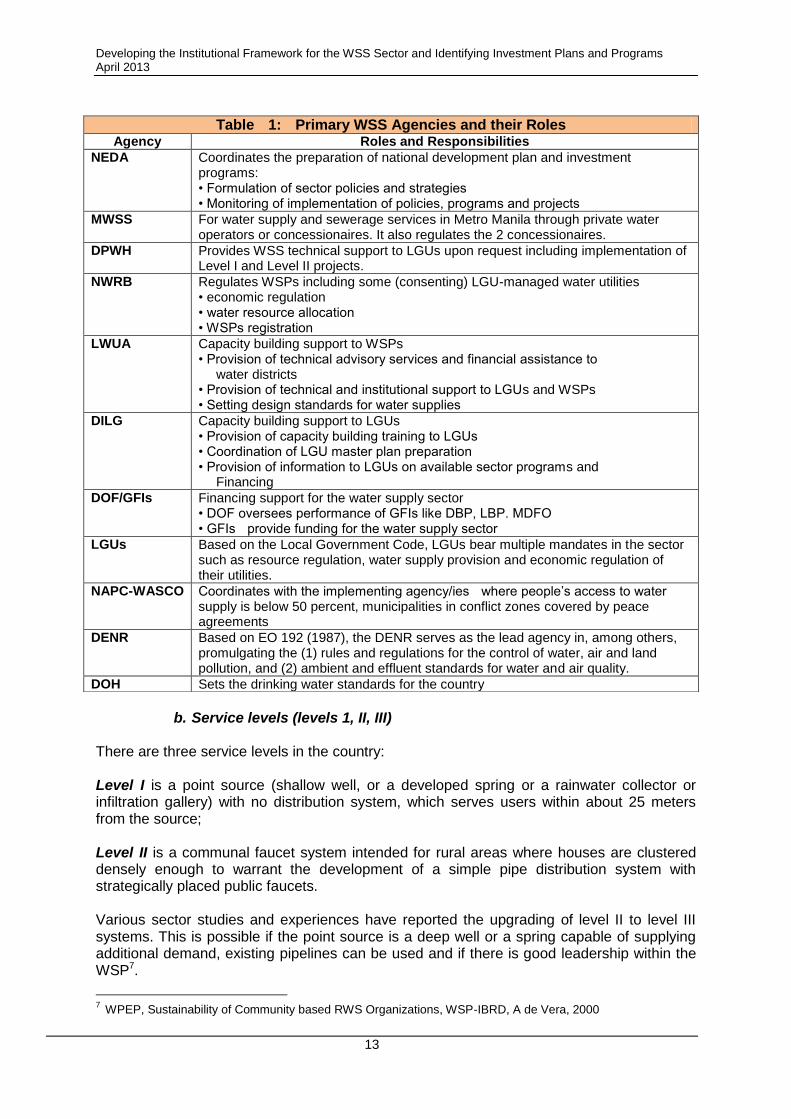
Table 1: Primary WSS Agencies and their Roles Agency Roles and Responsibilities
NEDA Coordinates the preparation of national development plan and investment programs: • Formulation of sector policies and strategies • Monitoring of implementation of policies, programs and projects
MWSS For water supply and sewerage services in Metro Manila through private water operators or concessionaires. It also regulates the 2 concessionaires.
DPWH Provides WSS technical support to LGUs upon request including implementation of Level I and Level II projects.
NWRB Regulates WSPs including some (consenting) LGU-managed water utilities • economic regulation • water resource allocation • WSPs registration
LWUA Capacity building support to WSPs • Provision of technical advisory services and financial assistance to water districts • Provision of technical and institutional support to LGUs and WSPs • Setting design standards for water supplies
DILG Capacity building support to LGUs • Provision of capacity building training to LGUs • Coordination of LGU master plan preparation • Provision of information to LGUs on available sector programs and Financing
DOF/GFIs Financing support for the water supply sector • DOF oversees performance of GFIs like DBP, LBP. MDFO • GFIs provide funding for the water supply sector
LGUs Based on the Local Government Code, LGUs bear multiple mandates in the sector such as resource regulation, water supply provision and economic regulation of their utilities.
NAPC-WASCO Coordinates with the implementing agency/ies where people’s access to water supply is below 50 percent, municipalities in conflict zones covered by peace agreements
DENR Based on EO 192 (1987), the DENR serves as the lead agency in, among others, promulgating the (1) rules and regulations for the control of water, air and land pollution, and (2) ambient and effluent standards for water and air quality.
DOH Sets the drinking water standards for the country
Developing the Institutional Framework for the WSS Sector and Identifying Investment Plans and Programs April 2013
14
Based on authors’ experiences, it can be assumed that only 50% of the existing level II systems are upgradable to level III due to the constraints mentioned.
Level III refers to the conventional household-connected system, metered or un-metered and is generally applicable to large and densely populated settlements, particularly urban areas.
c. Water Service Providers (WSPs)
There are several types of water service providers (WSPs) nationwide consisting of WDs, LGU utilities, Rural Water & Sanitation Associations (RWSAs), Barangay Water & Sanitation Associations (BWSAs), cooperatives and private utilities.
i. Water districts: Are water utilities classified as a government-owned and controlled
corporation created by LGUs in accordance with PD 198. Water districts operate level III systems.
ii. LGU-operated systems: LGU-run systems are systems directly owned and managed
by an LGU. The LGU could be a province, city, town or barangay. The LGU system may operate levels II or III systems or a combination of both.
iii. Community Based Organizations (CBOs): Are groups of people who have banded
together to own and operate water systems. CBOs fall into 3 major categories:
RWSAs/BWSAs: is a water system run by a non-profit, non-stock association usually covering one or more barangays.
Water Cooperative (Coop): is a water system owned and managed by a cooperative whose members contribute to the cooperative equity base.
Homeowners Association (HOA): A HOA is a utility owned and operated by an association of residents within a gated community.
iv. Private Firms: Are privately owned water systems operating within a given franchise
area. Examples are the 2 Metro Manila concessionaires, Subic Water, Balibago Waterworks, or systems still operated by the subdivision developers.
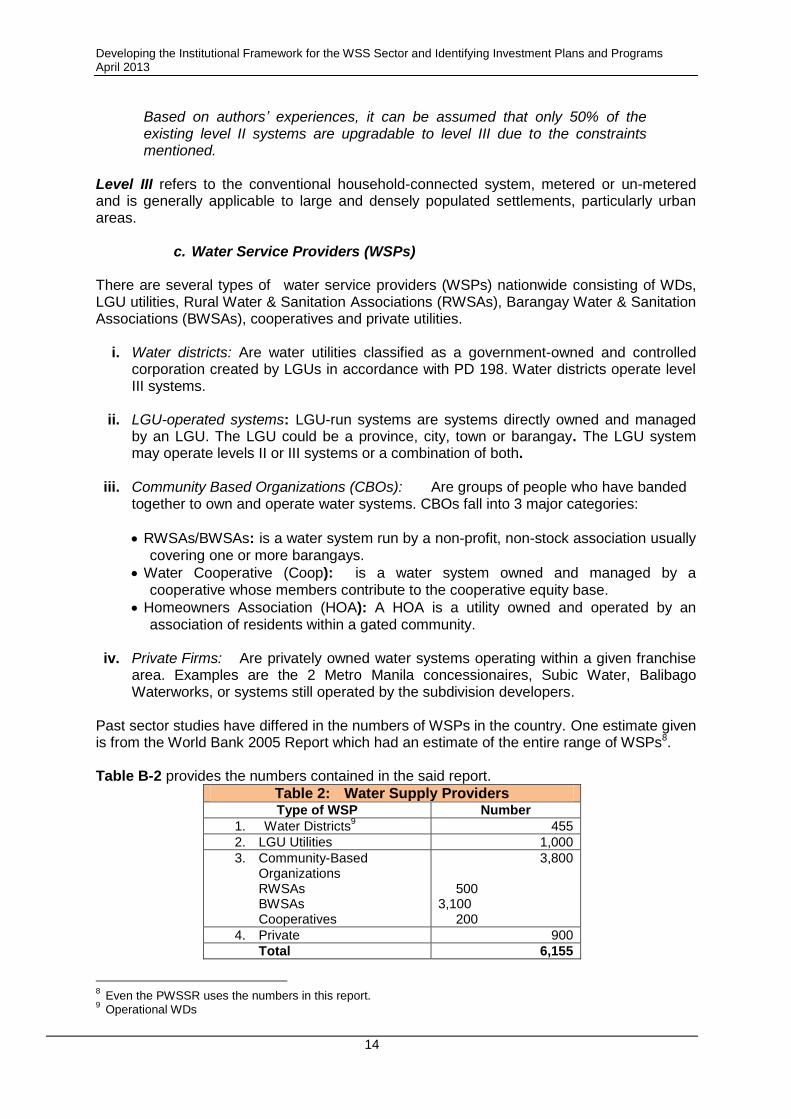
Past sector studies have differed in the numbers of WSPs in the country. One estimate given is from the World Bank 2005 Report which had an estimate of the entire range of WSPs8. Table B-2 provides the numbers contained in the said report.
Table 2: Water Supply Providers Type of WSP Number
1. Water Districts9 455
2. LGU Utilities 1,000
3. Community-Based Organizations RWSAs BWSAs Cooperatives
3,800
500 3,100 200
4. Private 900
Total 6,155
8
Even the PWSSR uses the numbers in this report. 9 Operational WDs
Developing the Institutional Framework for the WSS Sector and Identifying Investment Plans and Programs April 2013
15
2. Water Supply Coverage
The water and sanitation sector has not had a monitoring system in place over the last 20 years. Proof of this is that even the baseline for the MDG targets is conflicting coming from different sources. Currently, there are several sources of information on water supply and sanitation coverage in the provinces. The National Statistics Office (NSO) has its census on population and housing which is done every 10 years. The DOH conducts its national survey for the Field Health Services Information System (FHSIS) every year. Other surveys with water supply and sanitation coverage are those done by NSO, such as the Annual Poverty
Indicator Survey (APIS) and the MICS which is done on a sampling basis. However, the
definitions of water supply and sanitation coverage also vary from survey to survey. Since this study is concerned primarily with the coverage of Levels III and II facilities, the source documents are usually the NSO census data, Annual Poverty Indicators Survey, DILG data which were used by the 2005 World Bank Report, the Philippine Water Supply and Sanitation Sector Roadmap (PWSSR) and the DILG/DOH Sector Assessment (2011) and even the Joint Monitoring program and NEDA Progress Report on the Millennium Development Goals.
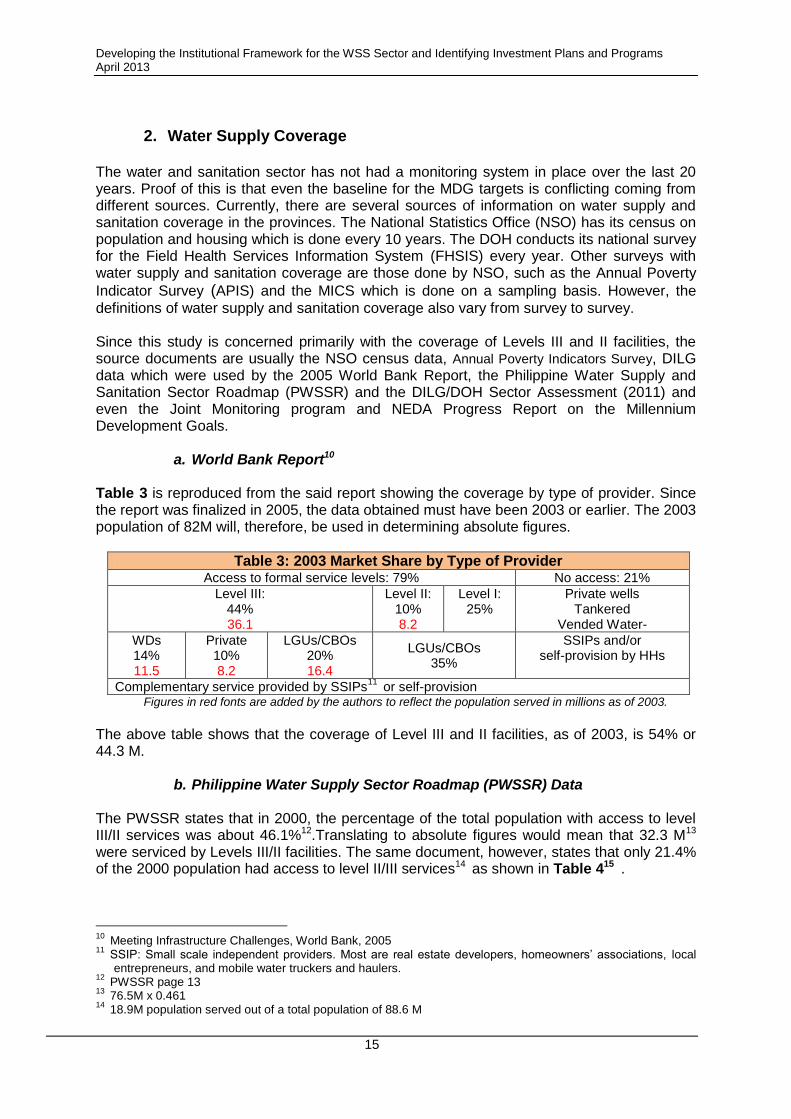
a. World Bank Report10 Table 3 is reproduced from the said report showing the coverage by type of provider. Since the report was finalized in 2005, the data obtained must have been 2003 or earlier. The 2003 population of 82M will, therefore, be used in determining absolute figures.
Table 3: 2003 Market Share by Type of Provider Access to formal service levels: 79% No access: 21%
Level III: 44% 36.1
Level II: 10% 8.2
Level I: 25%
Private wells Tankered
Vended Water-
WDs 14% 11.5
Private 10% 8.2
LGUs/CBOs 20% 16.4
LGUs/CBOs 35%
SSIPs and/or self-provision by HHs
Complementary service provided by SSIPs11
or self-provision Figures in red fonts are added by the authors to reflect the population served in millions as of 2003.
The above table shows that the coverage of Level III and II facilities, as of 2003, is 54% or 44.3 M.
b. Philippine Water Supply Sector Roadmap (PWSSR) Data The PWSSR states that in 2000, the percentage of the total population with access to level III/II services was about 46.1%12.Translating to absolute figures would mean that 32.3 M13 were serviced by Levels III/II facilities. The same document, however, states that only 21.4% of the 2000 population had access to level II/III services14 as shown in Table 415 .
10
Meeting Infrastructure Challenges, World Bank, 2005 11
SSIP: Small scale independent providers. Most are real estate developers, homeowners’ associations, local entrepreneurs, and mobile water truckers and haulers.
12 PWSSR page 13
13 76.5M x 0.461
14 18.9M population served out of a total population of 88.6 M
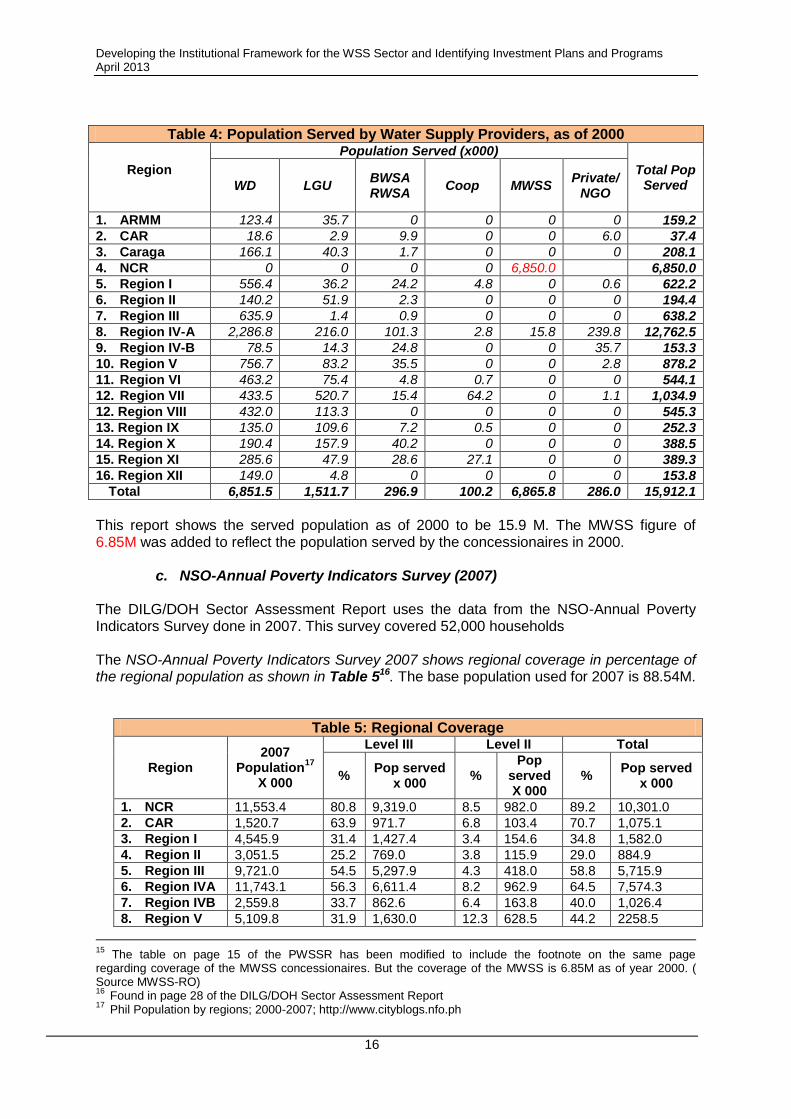
Developing the Institutional Framework for the WSS Sector and Identifying Investment Plans and Programs April 2013
16
Table 4: Population Served by Water Supply Providers, as of 2000
Region
Population Served (x000)
Total Pop Served WD LGU
BWSA RWSA
Coop MWSS Private/
NGO
1. ARMM 123.4 35.7 0 0 0 0 159.2
2. CAR 18.6 2.9 9.9 0 0 6.0 37.4
3. Caraga 166.1 40.3 1.7 0 0 0 208.1
4. NCR 0 0 0 0 6,850.0 6,850.0
5. Region I 556.4 36.2 24.2 4.8 0 0.6 622.2
6. Region II 140.2 51.9 2.3 0 0 0 194.4
7. Region III 635.9 1.4 0.9 0 0 0 638.2
8. Region IV-A 2,286.8 216.0 101.3 2.8 15.8 239.8 12,762.5
9. Region IV-B 78.5 14.3 24.8 0 0 35.7 153.3
10. Region V 756.7 83.2 35.5 0 0 2.8 878.2
11. Region VI 463.2 75.4 4.8 0.7 0 0 544.1
12. Region VII 433.5 520.7 15.4 64.2 0 1.1 1,034.9
12. Region VIII 432.0 113.3 0 0 0 0 545.3
13. Region IX 135.0 109.6 7.2 0.5 0 0 252.3
14. Region X 190.4 157.9 40.2 0 0 0 388.5
15. Region XI 285.6 47.9 28.6 27.1 0 0 389.3
16. Region XII 149.0 4.8 0 0 0 0 153.8
Total 6,851.5 1,511.7 296.9 100.2 6,865.8 286.0 15,912.1
This report shows the served population as of 2000 to be 15.9 M. The MWSS figure of 6.85M was added to reflect the population served by the concessionaires in 2000.
c. NSO-Annual Poverty Indicators Survey (2007)
The DILG/DOH Sector Assessment Report uses the data from the NSO-Annual Poverty Indicators Survey done in 2007. This survey covered 52,000 households The NSO-Annual Poverty Indicators Survey 2007 shows regional coverage in percentage of the regional population as shown in Table 516. The base population used for 2007 is 88.54M.
Table 5: Regional Coverage
Region 2007
Population17
X 000
Level III Level II Total
% Pop served
x 000 %
Pop served X 000
% Pop served
x 000
1. NCR 11,553.4 80.8 9,319.0 8.5 982.0 89.2 10,301.0
2. CAR 1,520.7 63.9 971.7 6.8 103.4 70.7 1,075.1
3. Region I 4,545.9 31.4 1,427.4 3.4 154.6 34.8 1,582.0
4. Region II 3,051.5 25.2 769.0 3.8 115.9 29.0 884.9
5. Region III 9,721.0 54.5 5,297.9 4.3 418.0 58.8 5,715.9
6. Region IVA 11,743.1 56.3 6,611.4 8.2 962.9 64.5 7,574.3
7. Region IVB 2,559.8 33.7 862.6 6.4 163.8 40.0 1,026.4
8. Region V 5,109.8 31.9 1,630.0 12.3 628.5 44.2 2258.5
15
The table on page 15 of the PWSSR has been modified to include the footnote on the same page regarding coverage of the MWSS concessionaires. But the coverage of the MWSS is 6.85M as of year 2000. ( Source MWSS-RO) 16
Found in page 28 of the DILG/DOH Sector Assessment Report 17
Phil Population by regions; 2000-2007; http://www.cityblogs.nfo.ph
Developing the Institutional Framework for the WSS Sector and Identifying Investment Plans and Programs April 2013
17
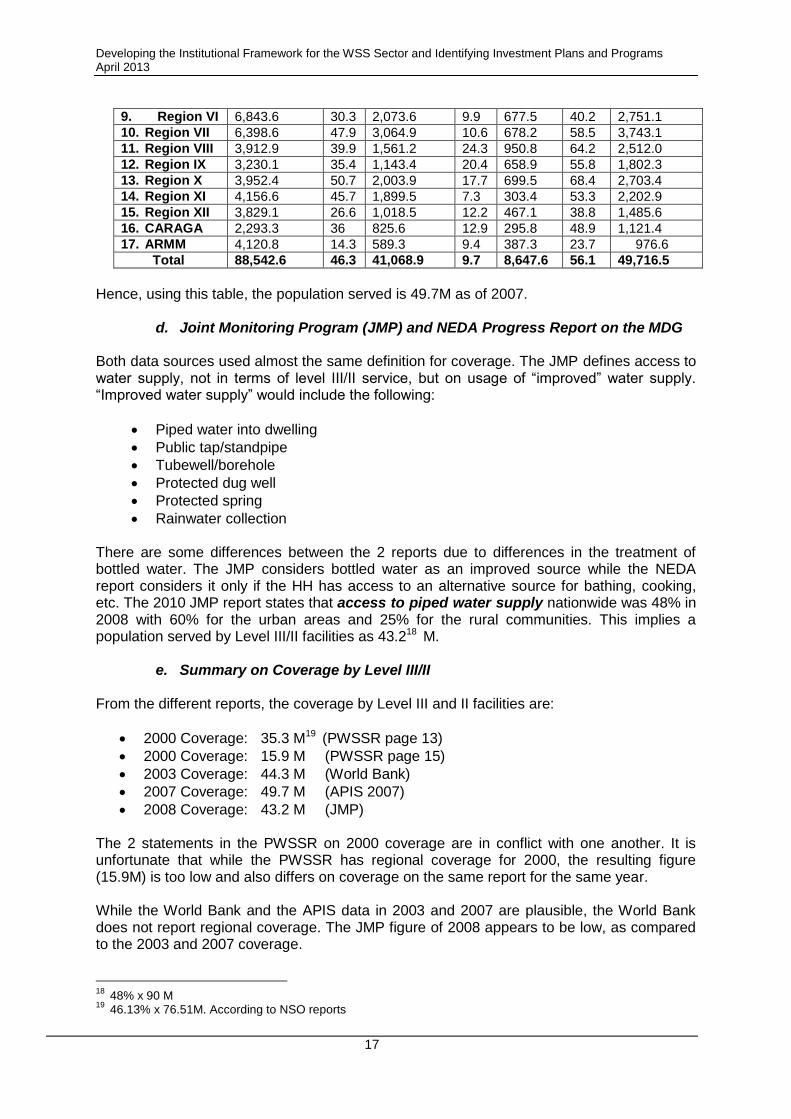
9. Region VI 6,843.6 30.3 2,073.6 9.9 677.5 40.2 2,751.1
10. Region VII 6,398.6 47.9 3,064.9 10.6 678.2 58.5 3,743.1
11. Region VIII 3,912.9 39.9 1,561.2 24.3 950.8 64.2 2,512.0
12. Region IX 3,230.1 35.4 1,143.4 20.4 658.9 55.8 1,802.3
13. Region X 3,952.4 50.7 2,003.9 17.7 699.5 68.4 2,703.4
14. Region XI 4,156.6 45.7 1,899.5 7.3 303.4 53.3 2,202.9
15. Region XII 3,829.1 26.6 1,018.5 12.2 467.1 38.8 1,485.6
16. CARAGA 2,293.3 36 825.6 12.9 295.8 48.9 1,121.4
17. ARMM 4,120.8 14.3 589.3 9.4 387.3 23.7 976.6
Total 88,542.6 46.3 41,068.9 9.7 8,647.6 56.1 49,716.5
Hence, using this table, the population served is 49.7M as of 2007.
d. Joint Monitoring Program (JMP) and NEDA Progress Report on the MDG Both data sources used almost the same definition for coverage. The JMP defines access to water supply, not in terms of level III/II service, but on usage of “improved” water supply. “Improved water supply” would include the following:
Piped water into dwelling
Public tap/standpipe
Tubewell/borehole
Protected dug well
Protected spring
Rainwater collection
There are some differences between the 2 reports due to differences in the treatment of bottled water. The JMP considers bottled water as an improved source while the NEDA report considers it only if the HH has access to an alternative source for bathing, cooking, etc. The 2010 JMP report states that access to piped water supply nationwide was 48% in 2008 with 60% for the urban areas and 25% for the rural communities. This implies a population served by Level III/II facilities as 43.218 M.
e. Summary on Coverage by Level III/II
From the different reports, the coverage by Level III and II facilities are:
2000 Coverage: 35.3 M19 (PWSSR page 13)
2000 Coverage: 15.9 M (PWSSR page 15)
2003 Coverage: 44.3 M (World Bank)
2007 Coverage: 49.7 M (APIS 2007)
2008 Coverage: 43.2 M (JMP) The 2 statements in the PWSSR on 2000 coverage are in conflict with one another. It is unfortunate that while the PWSSR has regional coverage for 2000, the resulting figure (15.9M) is too low and also differs on coverage on the same report for the same year. While the World Bank and the APIS data in 2003 and 2007 are plausible, the World Bank does not report regional coverage. The JMP figure of 2008 appears to be low, as compared to the 2003 and 2007 coverage.
18
48% x 90 M 19
46.13% x 76.51M. According to NSO reports
Developing the Institutional Framework for the WSS Sector and Identifying Investment Plans and Programs April 2013
18
This report will use both the 2003 coverage figure of the World Bank Report and the NSO-APIS 2007 regional data for comparison of existing data.
3. MDGs: Water Supply Targets
a. JMP Report
The WHO/UNICEF JMP for Water Supply and Sanitation is the official United Nations mechanism tasked with monitoring progress towards the Millennium Development Goal (MDG) relating to drinking-water and sanitation (MDG 7, Target 7(c), which is to: "Halve, by 2015, the proportion of people without sustainable access to safe drinking-water and basic sanitation".
Access to drinking-water and to basic sanitation is measured by the MDG indicators:
Proportion of population using an improved drinking-water source;20
Proportion of population using an improved sanitation facility.
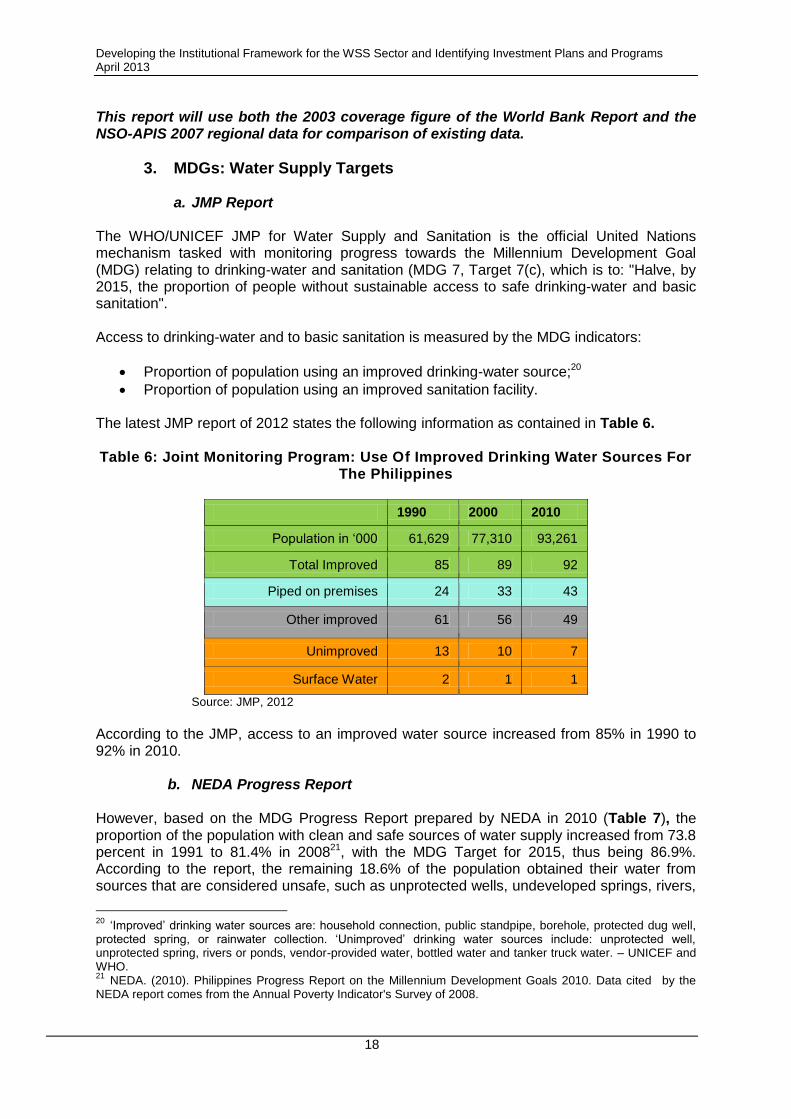
The latest JMP report of 2012 states the following information as contained in Table 6.
Table 6: Joint Monitoring Program: Use Of Improved Drinking Water Sources For
The Philippines
1990 2000 2010
Population in ‘000 61,629 77,310 93,261
Total Improved 85 89 92
Piped on premises 24 33 43
Other improved 61 56 49
Unimproved 13 10 7
Surface Water 2 1 1
Source: JMP, 2012
According to the JMP, access to an improved water source increased from 85% in 1990 to 92% in 2010.
b. NEDA Progress Report
However, based on the MDG Progress Report prepared by NEDA in 2010 (Table 7), the proportion of the population with clean and safe sources of water supply increased from 73.8 percent in 1991 to 81.4% in 200821, with the MDG Target for 2015, thus being 86.9%. According to the report, the remaining 18.6% of the population obtained their water from sources that are considered unsafe, such as unprotected wells, undeveloped springs, rivers,
20
‘Improved’ drinking water sources are: household connection, public standpipe, borehole, protected dug well, protected spring, or rainwater collection. ‘Unimproved’ drinking water sources include: unprotected well, unprotected spring, rivers or ponds, vendor-provided water, bottled water and tanker truck water. – UNICEF and WHO. 21
NEDA. (2010). Philippines Progress Report on the Millennium Development Goals 2010. Data cited by the NEDA report comes from the Annual Poverty Indicator's Survey of 2008.
Developing the Institutional Framework for the WSS Sector and Identifying Investment Plans and Programs April 2013
19
ponds, streams, rainwater, tanker trucks, and peddlers, among others.
Table 7: MDG Target For Water Supply
1991 (baseline year utilized in
Progress Report) 2008
Target for 2015
National Data
73.8%
81.4%
86.9%
Source: (NEDA, 2010)
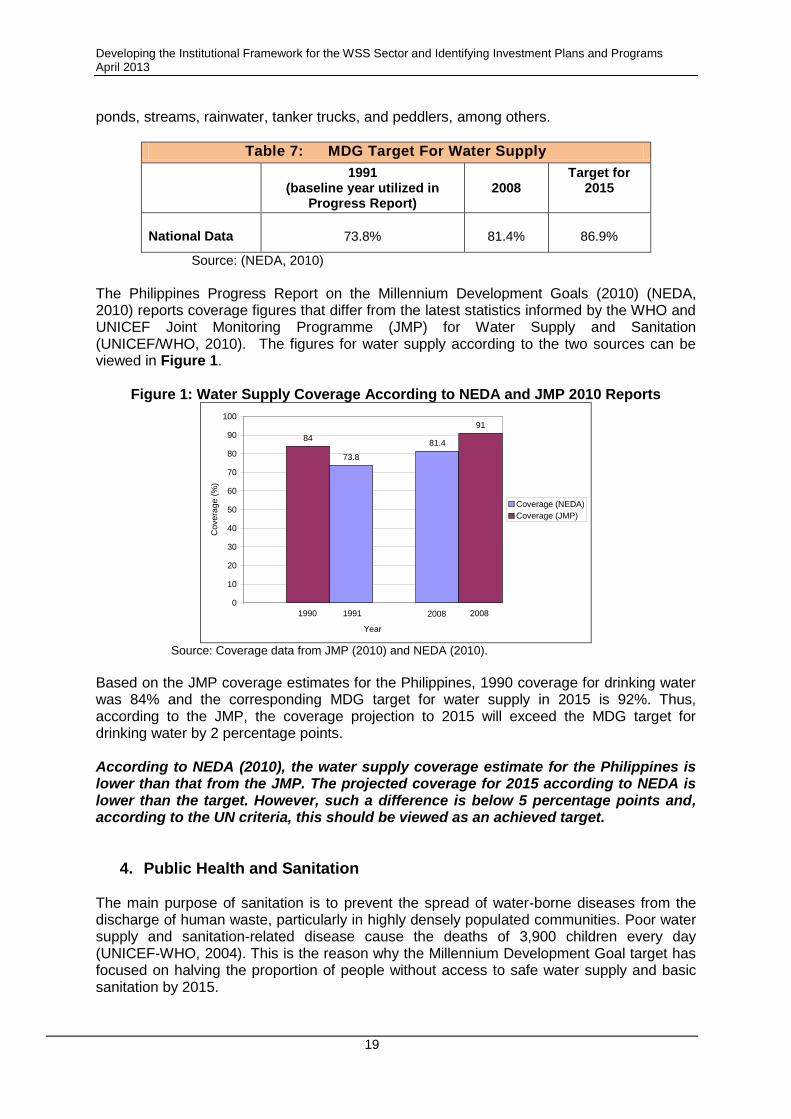
The Philippines Progress Report on the Millennium Development Goals (2010) (NEDA, 2010) reports coverage figures that differ from the latest statistics informed by the WHO and UNICEF Joint Monitoring Programme (JMP) for Water Supply and Sanitation (UNICEF/WHO, 2010). The figures for water supply according to the two sources can be viewed in Figure 1.
Figure 1: Water Supply Coverage According to NEDA and JMP 2010 Reports
73.8
81.484
91
0
10
20
30
40
50
60
70
80
90
100
1990 1991 2008
Year
Co
ve
rag
e (
%)
Coverage (NEDA)
Coverage (JMP)
1990 200820081991
Source: Coverage data from JMP (2010) and NEDA (2010).
Based on the JMP coverage estimates for the Philippines, 1990 coverage for drinking water was 84% and the corresponding MDG target for water supply in 2015 is 92%. Thus, according to the JMP, the coverage projection to 2015 will exceed the MDG target for drinking water by 2 percentage points. According to NEDA (2010), the water supply coverage estimate for the Philippines is lower than that from the JMP. The projected coverage for 2015 according to NEDA is lower than the target. However, such a difference is below 5 percentage points and, according to the UN criteria, this should be viewed as an achieved target.
4. Public Health and Sanitation The main purpose of sanitation is to prevent the spread of water-borne diseases from the discharge of human waste, particularly in highly densely populated communities. Poor water supply and sanitation-related disease cause the deaths of 3,900 children every day (UNICEF-WHO, 2004). This is the reason why the Millennium Development Goal target has focused on halving the proportion of people without access to safe water supply and basic sanitation by 2015.
Developing the Institutional Framework for the WSS Sector and Identifying Investment Plans and Programs April 2013
20
Many urban and peri-urban areas in the Philippines have priority disease profiles that include diarrhea, intestinal worms,22 skin disease, and other water-related diseases, such as malaria and dengue. Poor people in urban slum areas, particularly children, women, and the elderly, are more affected than others. Diarrhea still ranks as the second leading cause of morbidity in the country. There are about 38 million diarrhea cases per year, and over 11,000 deaths per year due to acute watery diarrhea.23 In 2006 the target for reduction in diarrhea incidence set by DOH was reached at 708 per 100,000. This decline was largely due to the increase in access to safe water and sanitation services, and hand washing. However, areas with high diarrhea prevalence continue to persist in areas, such as the Cordillera Administrative Region (CAR), Central Visayas (Region VII), and Central Luzon (Region III). ARMM (Autonomous Region of Muslim Mindanao) still has the worst performance compared to other regions in the country. The region has the poorest access to safe water (56%) and sanitary toilets (28%) (DOH-NEC, 2007), and has the highest reported incidence of water pollution and sanitation and hygiene-related diseases in the country. It has been observed that in the Philippines regions with poor access to safe water and sanitary toilets have higher incidences of diarrhea.24 In areas with access to safe water and sewerage facilities, the quality of service is substandard. Surveys show that one half or more of LGU-operated water systems do not meet drinking water quality standards (De Dios, 2008).25 This could explain why four out of seven water-borne disease outbreaks recorded in 2007 to 2008 were caused by the contamination of water from local water districts or LGU-managed water systems. Septage. The inadequacies of regular desludging of septic tanks may cause the release of practically raw sewage into the drainage system making storm drains as sewers. The septic tank overflows may spread water-borne diseases though the contamination of groundwater source and through water pipe infiltration in areas where negative pressure occurs. There is also a high probability of human contact with the raw sewage, particularly in flood-prone areas during the rainy season. The floodwater can also bring with it sewage from submerged septic tanks. These wastes are highly pathogenic and can transmit a variety of human diseases, including gastro-enteritis, diarrhea, typhoid, cholera, dysentery, and hepatitis. The discharge of raw or partially treated sewage results in the degradation of the water quality of the receiving bodies of water. Improperly designed and maintained septic tanks are directly discharging raw sewage into the drainage systems. According to the Philippine Environment Report of the World Bank (World Bank, 2003), 48% of the 2.2 million metric tons of organic pollution discharged annually into the environment came from domestic sources.
a. Responsibilities for Sanitation Services Water districts in the Philippines are mandated under Presidential Decree (PD) 198 and the Clean Water Act of 2004 (RA 9275) to provide sanitation services to the population in their franchise areas. However, most water utilities focus only on water supply services. Only a
22
Such as ascariasis, hookworm, tapeworm, threadworm and whipworm. 23
Rory Villaluna, Streams of Knowledge. 2009. Philippine Sustainable Sanitation Sector Roadmap (PSSR). 24
Morton J et al. (2006) Philippines Environment Monitor 2006 on Environmental Health. Washington: World Bank 25
De Dios Jr (2008) Program Implementation Review (PIR): Environmental and Occupational Health Office, February 8, 2008. Antipolo City, Philippines.
Developing the Institutional Framework for the WSS Sector and Identifying Investment Plans and Programs April 2013
21
few water districts have initiated activities for sanitation, mostly limited to providing septage collection services to septic tank users. Collected septage is commonly discharged in an uncontrolled manner in rivers and dumpsites. Due to the low priority given by WDs to sanitation, the main responsibility for sanitation lies largely with the LGUs. The existing legal and regulatory mechanisms are generally adequate, although some local governments are behind with implementation procedures. Most local government officials understand well the issues and approaches required. The major hindrances are the lack of budgets for monitoring, maintenance, and service expansion, and the lack of an urban management paradigm in which both government and the citizenry understand the problems, agree on the solutions, and are willing to take the steps necessary to improve prevailing conditions. While LGUs are mandated to provide essential services, including water and sanitation services, 97% of funds earmarked for water and sanitation go to water supply and only 3% for sanitation and wastewater treatment (Philippine Water Supply Roadmap, 2008).26 There have been pilot projects on sewerage and wastewater treatment implemented by national agencies and LGUs. However, some of them have become non-operational (e.g., stabilization pond in Cauayan, Isabela) due to poor operation and maintenance. Although some capacity building has been provided by development agencies without local government support, investment capital and long-term capacity building support, it will not result in effective sanitation and wastewater management programs. To ensure sustainability it is important that initiatives are broadly supported by all stakeholders, notably the communities, which need to be achieved through extensive and long-term awareness campaigns aimed at behavioral change and demand creation for sanitation services.
b. Sanitation Coverage
i) JMP 2010 Report Based on the 2010 WHO-UNICEF Joint Monitoring Program (JMP) Report, in 2008, total households with improved use of sanitation facilities reached 80% in the urban areas and 69% in the rural areas or a combined total of 76%. Based on this, the Philippine Sustainable Sanitation Roadmap (PSSR) states that projections for 2015, the year for which the MDG sanitation target is set, indicates that the 79% target coverage to meet the MDG, can be achieved27. In spite of this, 25% still have no access to sanitary facilities and 14% still practice open defecation in the rural areas. The Annual Poverty Indicator Survey (APIS) Report indicates that for households with sanitary toilet, the regions with the lowest coverage are ARMM (50.0%), Region VIII (77.7%), Region IX (78.6%), Regions VII and IVB (79.9%). Similar to water supply, data for sanitation is also conflicting. A DOH Field Health Information Survey report indicated that coverage is actually declining. In 2008, the Environmental Health Report says we have reached 76.8% coverage which is still way below the DOH’s National Objectives for Health (NOH) target of 91% in 2010. The MTPDP also targeted 86-91% coverage within the period 2004 to 2010. Moreover, while the MDG goals are about access to sanitary toilets, the issue on the quality of toilets, such as bottomless septic tanks and lack of adequate septage management, still needs to be addressed.
26
NEDA. 2008. Philippine Water Supply Sector Roadmap. 27
Government of the Philippines. 2007. Philippine Sustainable Sanitation Roadmap. Manila.
Developing the Institutional Framework for the WSS Sector and Identifying Investment Plans and Programs April 2013
22
ii) Philippine Sustainable Sanitation Sector Roadmap Access to sanitation. Some 20 million Filipinos do not have access to improved sanitation, about 15 million share toilets, and 9% of the population still defecates in the open.28 On-site sanitation (latrines, many connected to septic tanks which, however, are generally poorly constructed) is the principle form of wastewater treatment in Philippine cities. Only an estimated 3% of the population is currently connected to a piped sewerage network. Outside of Metro Manila, only three cities (Baguio, Vigan and Zamboanga) have sewer systems, serving less than 3% of their service area populations (WPEP, 2003). The Vigan and Zamboanga systems were built by the Americans in the late 1920s or early 1930s. The systems cover limited areas in the downtown business districts and serve an insignificant portion of the urban population of the host cities (EMB, 2005 - National Water Quality Status Report: 2001 to 2005). Thus, domestic wastewater largely goes untreated (at least 90% according to the World Bank) and the majority of the population is exposed to raw sewage. The World Bank estimates that the Philippines lose $1.4 billion per year in the form of health, environmental, and economic costs.
iii) Phil Water Situation Report29
c. Sanitation Initiatives
i. National Sewerage and Septage Management Program (NSSMP). The NSSMP has been approved by NEDA in 2012. The NSSMP describes the needed institutional arrangements, financing options, and intervention and investment frameworks that will help LGUs and service providers develop sewerage, septage, and combined sewerage-septage projects. In the program, capital cost for septage management is estimated to range from PhP4 million to PhP71 million per project and per LGU, or a total of PhP12.3 billion for all the septage management undertakings. On the other hand, capital costs for sewerage systems are estimated at PhP820 million per highly urbanized city (HUC) at PhP410 million per phase or a total of PhP14 billion for 17 HUCs. Total capital costs for both septage management and sewerage systems are estimated at PhP26.3 billion. The LGU or local water districts shall shoulder cost for all septage management programs, while a 40-60 percent cost sharing for the sewerage systems shall be implemented (40% from the national government, 60% between HUCs and water districts). The 40% NG capital cost share, estimated to be about PhP5.6 billion, will be spread until 2020.
28
Rory Villaluna, Streams of Knowledge. 2009. Philippine Sustainable Sanitation Sector Roadmap (PSSSR). 29
WEDC Report, 2006
Developing the Institutional Framework for the WSS Sector and Identifying Investment Plans and Programs April 2013
23
ii. Philippine Sanitation Alliance (PSA). This USAID technical assistance program began in 2007 and has facilitated six LGUs (including Dumaguete, municipalities in Mactan Island, and San Fernando in La Union) to implement septage management with reference to the relevant provisions in the Clean Water Act of 2004. The PSA program was due to finish in September 2011. The program at Dumaguete has been very successful. The septage treatment plant (SpTP) started operations in October 2010. There is 50:50 cost sharing between the WD and LGU. The SpTP for San Fernando is presently under construction. For sewerage development in highly urbanized areas outside Manila, the national government can provide 40% cost share. However, there is no cost sharing for septage management which is viewed to be affordable for beneficiaries (e.g., at Dumaguete P2/m3 of water used is added to the water bill).
5. WSS Sector Issues and Challenges.
The MTPDP (Medium Term Philippine Development Plan) identifies and prioritizes the issues and challenges besetting the sector. These include the disparities in water supply coverage across regions, depletion of groundwater (especially in Metro Manila and Metro Cebu), lack of cost recovery on investments, institutional weaknesses and low willingness of consumers to pay. Pollution of water sources poses an additional threat to the sustainability of water supply systems and exposes the population to environmentally-related diseases.
a. WSP Service Performance. Results of benchmarking conducted by DILG covering
45 utilities also reveal that performance levels of utilities based on key performance indicators still fall under ideal or industry standards. Among the WSPs covered, the LGUs have the most dismal performance in almost all of the indicators used in the study. Benchmarking of these WSPs and five more utilities will be updated under the
MDGF 1919 program30
being coordinated by NEDA and DILG.
The slow expansion of services, low quality of services and inefficient operations of
water utilities are attributed to the weak regulatory and financing framework in the sector, lack of technical and managerial capacity, lack of access to financing for WSS (water and sanitation) development and dependence on subsidies for the majority of service providers. Thus, regulatory, financing and utility reforms are imperative to drive WSPs to improve their service performance.
Utility reform measures such as ring-fencing, benchmarking, business planning and
performance contracting have been introduced as part of capacity building and performance improvement glide path for WSPs.
b. Regulation. NWRB, by virtue of RA 2677 (Public Service Law), regulates private
providers and LGU-run utilities. In 2002, EO 123 was issued to address the conflicting role of LWUA as both a financing institution and a regulator, by transferring the regulation of water districts to NWRB (2002). However the regulation of WDs was never really done by NWRB due to inadequate resources. In fact, NWRB wrote LWUA stating that the LWUA maintain the status quo until NWRB is able to do it. In 2010, EO 806 was issued transferring the administration of NWRB from the Office of the President to DENR. EO 860 also superseded EO 123 by transferring the regulation of
30
MDGF 1919 is a UNICEF-funded program called ”Enhancing Access to and Provision of water services with Active Participation of the Poor”. This involves the application and replication of water governance sound practices and other capacity development tools, to be piloted in 36 waterless municipalities in 5 regions.
Developing the Institutional Framework for the WSS Sector and Identifying Investment Plans and Programs April 2013
24
water districts back to LWUA on the basis that the Water Code does not provide for the economic regulation of water service providers by NWRB. EO 860 glossed over the fact that the mandate given to NWRB to regulate water utilities was not contained in the Water Code but rather in the Public Service Act. The same EO also justified the removal of the DOF and DOH Secretaries from the board of NWRB.
In 2009 the Water Sub-Committee of INFRACOM endorsed the passage of a bill
proposing the creation of a Water Regulatory Commission (WRC) as the ideal solution to address the economic regulatory concerns of the sector. Patterned after the Energy Regulatory Commission, the purpose of the WRC is to consolidate all water regulatory powers, currently housed in several agencies, into one authority. It is envisioned that with the creation of the WRC, there will finally exist an oversight body for water supply and sanitation—setting targets, rationalizing tariffs across the country and attracting investments into the sector. The proposed bill has been filed in Congress in 2012.
In October 2011, President Benigno Aquino III issued Executive Order No. 62
mandating the creation of an Inter-Agency Committee on Water under the leadership of the Department of Public Works and Highways (DPWH), which was tasked to develop the Water Sector Master Plan that will effectively address the issues and concerns of the water sector. The Committee was likewise directed to recommend to the President the appropriate organizational structure of all concerned agencies for the effective implementation of the water sector master plan. The National Economic and Development Authority (NEDA), Department of Budget and Management (DBM), Department of Interior and Local Government (DILG), Office of the President (OP) and such other concerned agencies were made part of the Inter-agency Committee on Water.
NEDA and DPWH then jointly commissioned a study on the Preparation of the
Philippine Water Resources Sector Development Plan. The study was designed to develop a framework plan for the efficient and effective management of the country’s water resources. The result of the framework plan was the recommendation to reconstitute, elevate and strengthen the current NWRB into a National Water Resources Management Office (NWRMO) under the Office of the President through the issuance of an EO.
In 2012, a draft EO had been prepared creating the National Water Resources
Management Office. c. Financing. The financing policy for the sector calls for the rationalization of allocation
of public resources to focus on the identified 432 waterless barangays and municipalities, and to expand services of formal providers to unserved populations in respective franchise areas. The policy recognizes the scarcity of public resources, and thus espouses targeted subsidies and leveraging with private resources. However, it has been noted that national government subsidies were not directed to the Roadmap targets and, instead of improving the enabling environment for private financing institutions to lend to water supply and sanitation projects, government financing crowds out private bank financing. Specifically:
National government subsidy for waterless barangays and municipalities, amounting to P1.5 billion in 2009, was given to LWUA and was apparently used to support the revival and creation of new water districts. Although it may be argued that these investments contributed to service expansion, still the public
Developing the Institutional Framework for the WSS Sector and Identifying Investment Plans and Programs April 2013
25
resources were not used for the top priority areas. Moreover, the sustainability of these revived or new water districts has to be assessed. If these new districts do not achieve technical and financial viability, then the investments would have been put to waste.
About 212 (40%) out of 524 municipalities identified as beneficiaries of this fund were not in the original list of 432; the identification of municipalities/ beneficiaries have become largely discretionary under the LWUA administration. The current Waterless Barangay Program is now (2013) being implemented by the DILG and NAPC (National Anti-Poverty Commission).
LWUA financing competed directly with private financing, instead of encouraging market-based lending for utilities that have the ability to access the capital market. LWUA offered deeply concessional terms and constricted the issuance of financing waivers for water districts to borrow from other sources. Without the waiver, water district loans outside of LWUA will be in junior positions.
Development partners have been seeking from the government unequivocal and operational rationalization guidelines on the allocation of grants and subsidies. In particular, devel-opment partners are asking for the criteria for providing these grants and subsidies for water supply and sanitation projects, how the grants can be leveraged so that more resources will be generated, and the most efficient, effective and sustainable financing model to implement leveraging of public with private resources.
d. Public-Private Partnerships (PPP). There is no concerted effort to encourage
PPPs. Private sector participation on bulk supply or distribution is largely private sector initiated and is thus episodic and sporadic. There is no clear policy on incentives and regulation, especially those dealing with LGUs. Fortunately, however, there is a strong entrepreneurial spirit, as evidenced by the entry of bulk suppliers to WDs and small water service providers in areas with no water supply facilities.
e. Key Challenges for Septic Management:31
Little awareness of septage management among local governments and utilities.
National institutions lack of septage management expertise
Little national funding to implement the Clean Water Act, including septage management projects.
Very little enforcement of environmental regulations for non-industrial sources.
f. Lack of Monitoring and Updated Data This is already evident from the conflicting numbers in population served by the different reports. There is no agency responsible for collating data on WSPs.
g. Emerging threat of climate change particularly to the sources of water and existing facilities. Climate change provisions should be factored in the design of facilities as well as other ancillary programs like watershed development programs.
31
AECOM International Development and Swiss Institute of Aquatic Sciences and Technology (for USAID). 2010. A Rapid Assessment of Septage Management in Asia: Policies and Practices in India, Indonesia, Malaysia, the Philippines, Sri Lanka, Thailand, and Vietnam.
Developing the Institutional Framework for the WSS Sector and Identifying Investment Plans and Programs April 2013
26
C. DEMAND-GAP ANALYSIS The demand-gap analysis will need two sets of data: how many are being served now and what is the future target. To determine how many are being served now, a stock taking of existing WSPs and their number of service connections were gathered from the different public agencies, as well as from private groups. To determine the future targets, It is necessary to do population projections to determine the population for year 2011 and the different design years.
1. Population Projections Population projections are estimates of future populations based on statistical models that extrapolate past and present trends into the future. Population projections involve the ratio method and the geometric rate of increase method in extrapolating population for the different design years.For this study, the design/target years are 2015, 2020, and 2025.
Pertinent data listed below were acquired from National Statistics Office (NSO), Water Districts, City or Municipal Planning and Development Offices, and the Internet:
1995 Census of Population, National Statistics Office;
2000 Census of Population, National Statistics Office;
2007 Census of Population, National Statistics Office;
2010 Census of Population, National Statistics Office;
Projected Populations by Five-Year Age Group and Sex, by Region and Province and by Five Calendar Years: 2000 – 2040 (Medium Series).
a. Methodology The NSO, in collaboration with the Inter-Agency Working Group on Population Projections, had prepared the Projected Population by Region and by Five-Calendar Year 2000–2040 (Medium Series), which is available in the NSO website. This projection, which is based on the actual 2000 census, is the latest NSO-released long-term projection. Interpolating the projected population of the region/province will show that it does not coincide with the last actual NSO count for year 2010 regional/provincial population. Adjustments in the projected population are, therefore, needed to take account of the actual data from the 2010 Census of Population. The trend-based (geometric growth rate) method was used in this Project. The ratio method of projecting the population of a city or municipality involves the computation of ratios of the population of a city or municipality over the population of the province where it is located for the last four (4) years when a census was carried out, in this case for the 1995, 2000, 2007 and 2010 census years. The city or municipality is then classified based on the trend of these ratios. These ratios are extrapolated and then applied to the five-year interval projected populations of the province to derive the projected city or municipal populations. The population projection for each Municipality/City used the Ratio Method. For each municipality or city, the historical ratio was computed as:
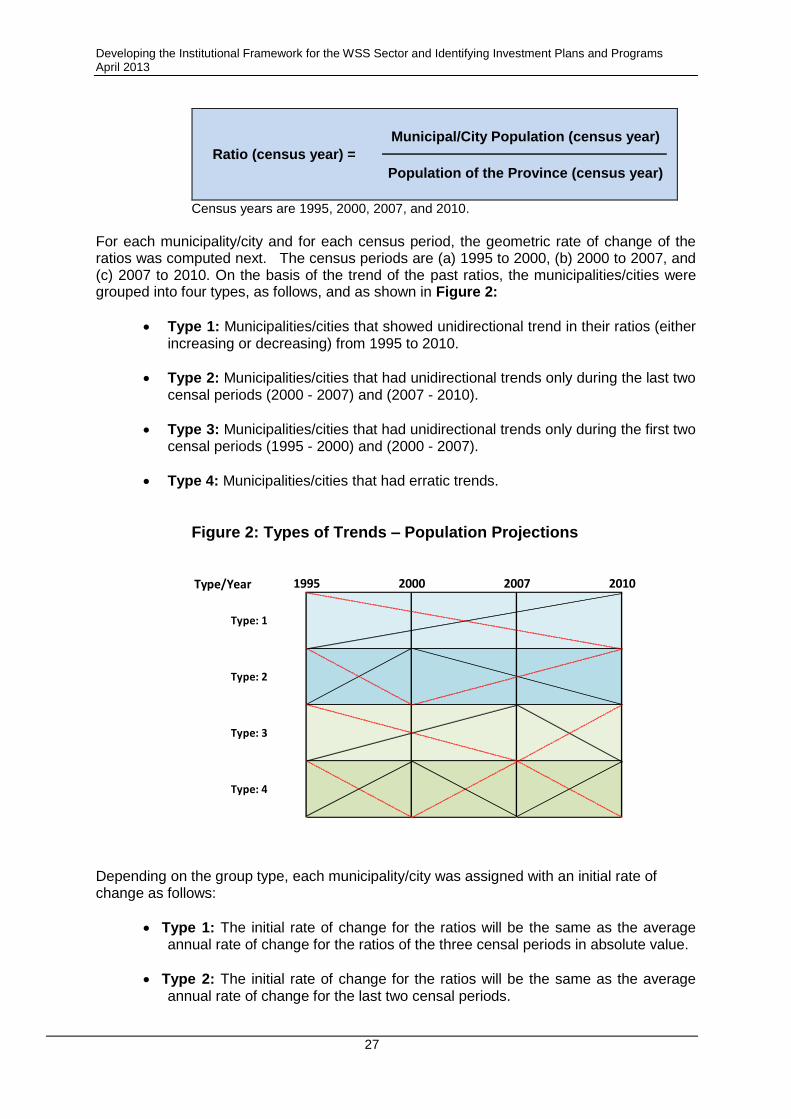
Developing the Institutional Framework for the WSS Sector and Identifying Investment Plans and Programs April 2013
27
Municipal/City Population (census year)
Population of the Province (census year)
Ratio (census year) =
Census years are 1995, 2000, 2007, and 2010.
For each municipality/city and for each census period, the geometric rate of change of the ratios was computed next. The census periods are (a) 1995 to 2000, (b) 2000 to 2007, and (c) 2007 to 2010. On the basis of the trend of the past ratios, the municipalities/cities were grouped into four types, as follows, and as shown in Figure 2:
Type 1: Municipalities/cities that showed unidirectional trend in their ratios (either increasing or decreasing) from 1995 to 2010.
Type 2: Municipalities/cities that had unidirectional trends only during the last two censal periods (2000 - 2007) and (2007 - 2010).
Type 3: Municipalities/cities that had unidirectional trends only during the first two censal periods (1995 - 2000) and (2000 - 2007).
Type 4: Municipalities/cities that had erratic trends.
Figure 2: Types of Trends – Population Projections
Type/Year 2007 2010
Type: 1
Type: 2
Type: 3
Type: 4
1995 2000
Depending on the group type, each municipality/city was assigned with an initial rate of change as follows:
Type 1: The initial rate of change for the ratios will be the same as the average annual rate of change for the ratios of the three censal periods in absolute value.
Type 2: The initial rate of change for the ratios will be the same as the average annual rate of change for the last two censal periods.
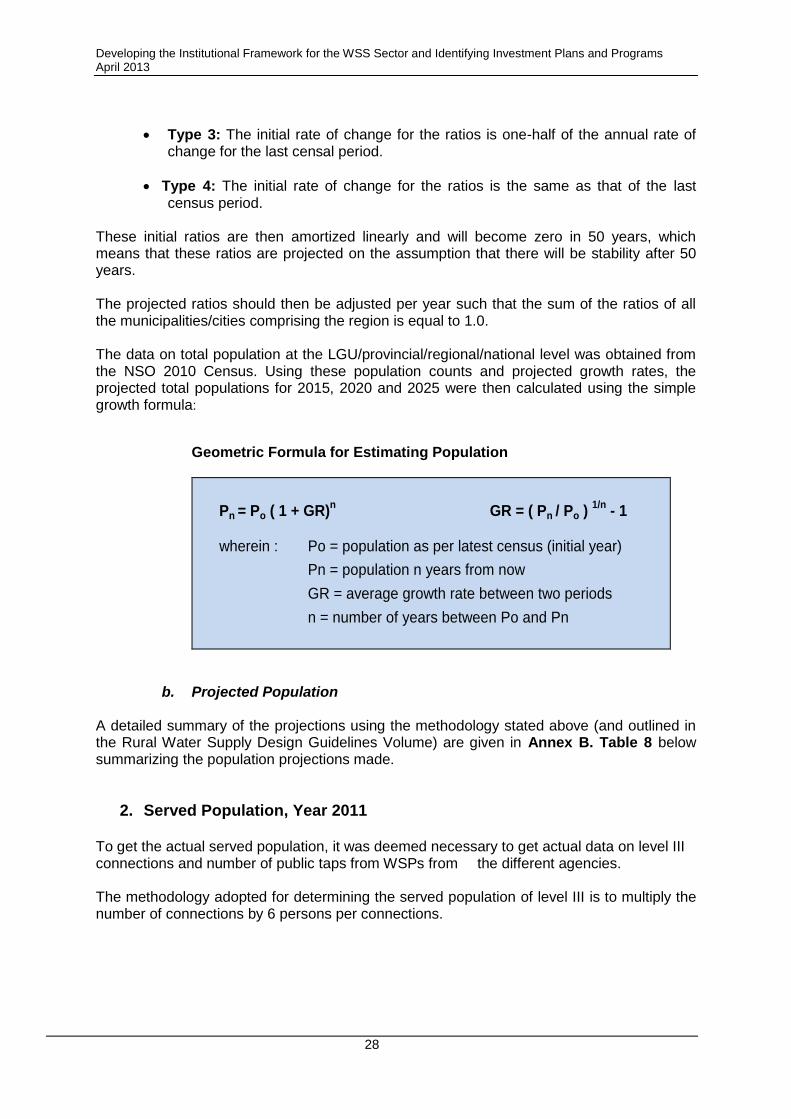
Developing the Institutional Framework for the WSS Sector and Identifying Investment Plans and Programs April 2013
28
Type 3: The initial rate of change for the ratios is one-half of the annual rate of change for the last censal period.
Type 4: The initial rate of change for the ratios is the same as that of the last census period.
These initial ratios are then amortized linearly and will become zero in 50 years, which means that these ratios are projected on the assumption that there will be stability after 50 years.
The projected ratios should then be adjusted per year such that the sum of the ratios of all the municipalities/cities comprising the region is equal to 1.0.
The data on total population at the LGU/provincial/regional/national level was obtained from the NSO 2010 Census. Using these population counts and projected growth rates, the projected total populations for 2015, 2020 and 2025 were then calculated using the simple growth formula:
Geometric Formula for Estimating Population
Pn = Po ( 1 + GR)n
GR = ( Pn / Po ) 1/n
- 1
wherein : Po = population as per latest census (initial year)
Pn = population n years from now
GR = average growth rate between two periods
n = number of years between Po and Pn
b. Projected Population A detailed summary of the projections using the methodology stated above (and outlined in the Rural Water Supply Design Guidelines Volume) are given in Annex B. Table 8 below summarizing the population projections made.
2. Served Population, Year 2011 To get the actual served population, it was deemed necessary to get actual data on level III connections and number of public taps from WSPs from the different agencies. The methodology adopted for determining the served population of level III is to multiply the number of connections by 6 persons per connections.
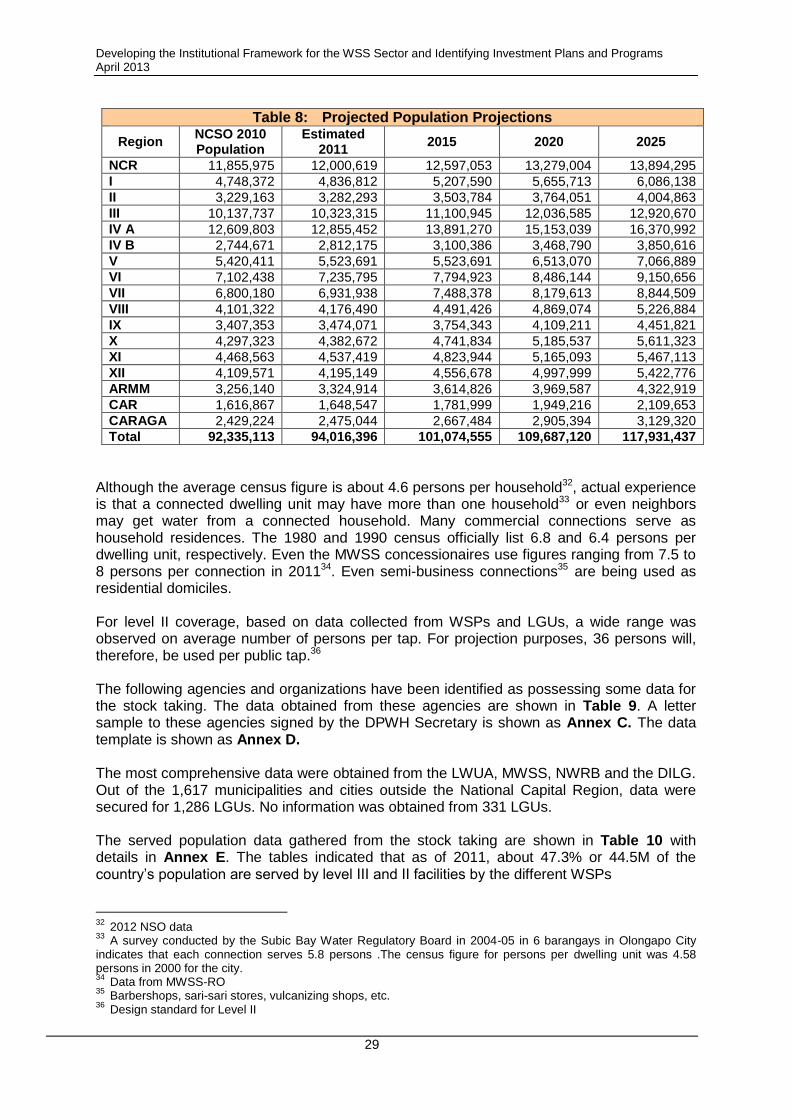
Developing the Institutional Framework for the WSS Sector and Identifying Investment Plans and Programs April 2013
29
Table 8: Projected Population Projections
Region NCSO 2010 Population
Estimated 2011
2015 2020 2025
NCR 11,855,975 12,000,619 12,597,053 13,279,004 13,894,295
I 4,748,372 4,836,812 5,207,590 5,655,713 6,086,138
II 3,229,163 3,282,293 3,503,784 3,764,051 4,004,863
III 10,137,737 10,323,315 11,100,945 12,036,585 12,920,670
IV A 12,609,803 12,855,452 13,891,270 15,153,039 16,370,992
IV B 2,744,671 2,812,175 3,100,386 3,468,790 3,850,616
V 5,420,411 5,523,691 5,523,691 6,513,070 7,066,889
VI 7,102,438 7,235,795 7,794,923 8,486,144 9,150,656
VII 6,800,180 6,931,938 7,488,378 8,179,613 8,844,509
VIII 4,101,322 4,176,490 4,491,426 4,869,074 5,226,884
IX 3,407,353 3,474,071 3,754,343 4,109,211 4,451,821
X 4,297,323 4,382,672 4,741,834 5,185,537 5,611,323
XI 4,468,563 4,537,419 4,823,944 5,165,093 5,467,113
XII 4,109,571 4,195,149 4,556,678 4,997,999 5,422,776
ARMM 3,256,140 3,324,914 3,614,826 3,969,587 4,322,919
CAR 1,616,867 1,648,547 1,781,999 1,949,216 2,109,653
CARAGA 2,429,224 2,475,044 2,667,484 2,905,394 3,129,320
Total 92,335,113 94,016,396 101,074,555 109,687,120 117,931,437
Although the average census figure is about 4.6 persons per household32, actual experience is that a connected dwelling unit may have more than one household33 or even neighbors may get water from a connected household. Many commercial connections serve as household residences. The 1980 and 1990 census officially list 6.8 and 6.4 persons per dwelling unit, respectively. Even the MWSS concessionaires use figures ranging from 7.5 to 8 persons per connection in 201134. Even semi-business connections35 are being used as residential domiciles.
For level II coverage, based on data collected from WSPs and LGUs, a wide range was observed on average number of persons per tap. For projection purposes, 36 persons will, therefore, be used per public tap.36
The following agencies and organizations have been identified as possessing some data for the stock taking. The data obtained from these agencies are shown in Table 9. A letter sample to these agencies signed by the DPWH Secretary is shown as Annex C. The data template is shown as Annex D. The most comprehensive data were obtained from the LWUA, MWSS, NWRB and the DILG. Out of the 1,617 municipalities and cities outside the National Capital Region, data were secured for 1,286 LGUs. No information was obtained from 331 LGUs. The served population data gathered from the stock taking are shown in Table 10 with details in Annex E. The tables indicated that as of 2011, about 47.3% or 44.5M of the country’s population are served by level III and II facilities by the different WSPs
32
2012 NSO data 33
A survey conducted by the Subic Bay Water Regulatory Board in 2004-05 in 6 barangays in Olongapo City indicates that each connection serves 5.8 persons .The census figure for persons per dwelling unit was 4.58 persons in 2000 for the city. 34
Data from MWSS-RO 35
Barbershops, sari-sari stores, vulcanizing shops, etc. 36
Design standard for Level II
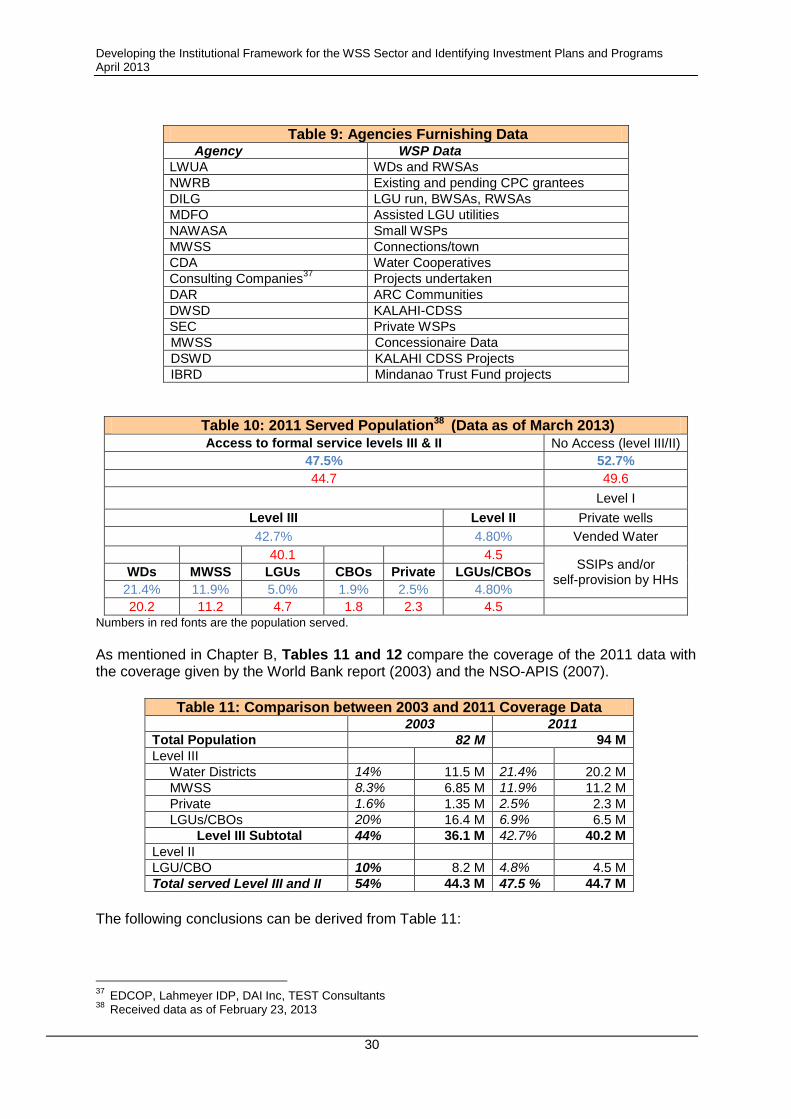
Developing the Institutional Framework for the WSS Sector and Identifying Investment Plans and Programs April 2013
30
Table 9: Agencies Furnishing Data Agency WSP Data
LWUA WDs and RWSAs
NWRB Existing and pending CPC grantees
DILG LGU run, BWSAs, RWSAs
MDFO Assisted LGU utilities
NAWASA Small WSPs
MWSS Connections/town
CDA Water Cooperatives
Consulting Companies37
Projects undertaken
DAR ARC Communities
DWSD KALAHI-CDSS
SEC Private WSPs
MWSS Concessionaire Data
DSWD KALAHI CDSS Projects
IBRD Mindanao Trust Fund projects
Table 10: 2011 Served Population38 (Data as of March 2013) Access to formal service levels III & II No Access (level III/II)
47.5% 52.7%
44.7 49.6
Level I
Level III Level II Private wells
42.7% 4.80% Vended Water
40.1 4.5 SSIPs and/or
self-provision by HHs WDs MWSS LGUs CBOs Private LGUs/CBOs
21.4% 11.9% 5.0% 1.9% 2.5% 4.80%
20.2 11.2 4.7 1.8 2.3 4.5 Numbers in red fonts are the population served.
As mentioned in Chapter B, Tables 11 and 12 compare the coverage of the 2011 data with the coverage given by the World Bank report (2003) and the NSO-APIS (2007).
Table 11: Comparison between 2003 and 2011 Coverage Data
2003 2011
Total Population 82 M 94 M
Level III
Water Districts 14% 11.5 M 21.4% 20.2 M
MWSS 8.3% 6.85 M 11.9% 11.2 M
Private 1.6% 1.35 M 2.5% 2.3 M
LGUs/CBOs 20% 16.4 M 6.9% 6.5 M
Level III Subtotal 44% 36.1 M 42.7% 40.2 M
Level II
LGU/CBO 10% 8.2 M 4.8% 4.5 M
Total served Level III and II 54% 44.3 M 47.5 % 44.7 M
The following conclusions can be derived from Table 11:
37
EDCOP, Lahmeyer IDP, DAI Inc, TEST Consultants 38
Received data as of February 23, 2013
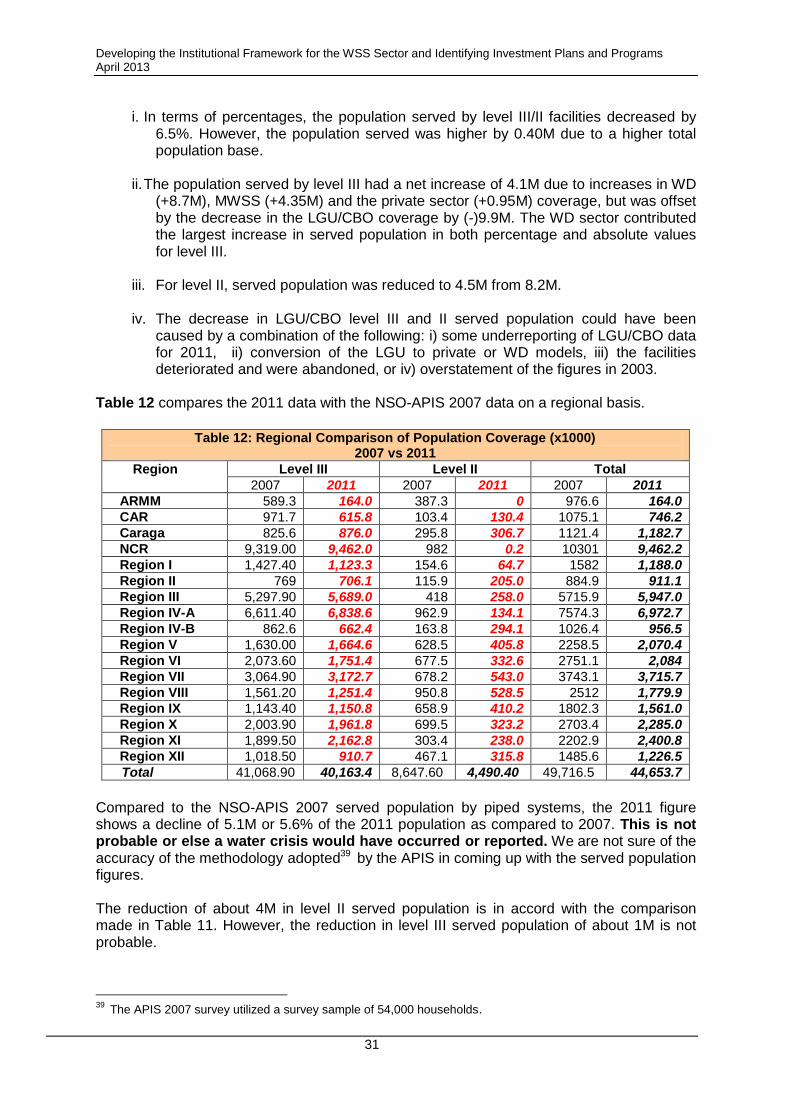
Developing the Institutional Framework for the WSS Sector and Identifying Investment Plans and Programs April 2013
31
i. In terms of percentages, the population served by level III/II facilities decreased by 6.5%. However, the population served was higher by 0.40M due to a higher total population base.
ii. The population served by level III had a net increase of 4.1M due to increases in WD
(+8.7M), MWSS (+4.35M) and the private sector (+0.95M) coverage, but was offset by the decrease in the LGU/CBO coverage by (-)9.9M. The WD sector contributed the largest increase in served population in both percentage and absolute values for level III.
iii. For level II, served population was reduced to 4.5M from 8.2M.
iv. The decrease in LGU/CBO level III and II served population could have been
caused by a combination of the following: i) some underreporting of LGU/CBO data for 2011, ii) conversion of the LGU to private or WD models, iii) the facilities deteriorated and were abandoned, or iv) overstatement of the figures in 2003.
Table 12 compares the 2011 data with the NSO-APIS 2007 data on a regional basis.
Table 12: Regional Comparison of Population Coverage (x1000)
2007 vs 2011
Region Level III Level II Total
2007 2011 2007 2011 2007 2011
ARMM 589.3 164.0 387.3 0 976.6 164.0
CAR 971.7 615.8 103.4 130.4 1075.1 746.2
Caraga 825.6 876.0 295.8 306.7 1121.4 1,182.7
NCR 9,319.00 9,462.0 982 0.2 10301 9,462.2
Region I 1,427.40 1,123.3 154.6 64.7 1582 1,188.0
Region II 769 706.1 115.9 205.0 884.9 911.1
Region III 5,297.90 5,689.0 418 258.0 5715.9 5,947.0
Region IV-A 6,611.40 6,838.6 962.9 134.1 7574.3 6,972.7
Region IV-B 862.6 662.4 163.8 294.1 1026.4 956.5
Region V 1,630.00 1,664.6 628.5 405.8 2258.5 2,070.4
Region VI 2,073.60 1,751.4 677.5 332.6 2751.1 2,084
Region VII 3,064.90 3,172.7 678.2 543.0 3743.1 3,715.7
Region VIII 1,561.20 1,251.4 950.8 528.5 2512 1,779.9
Region IX 1,143.40 1,150.8 658.9 410.2 1802.3 1,561.0
Region X 2,003.90 1,961.8 699.5 323.2 2703.4 2,285.0
Region XI 1,899.50 2,162.8 303.4 238.0 2202.9 2,400.8
Region XII 1,018.50 910.7 467.1 315.8 1485.6 1,226.5
Total 41,068.90 40,163.4 8,647.60 4,490.40 49,716.5 44,653.7
Compared to the NSO-APIS 2007 served population by piped systems, the 2011 figure shows a decline of 5.1M or 5.6% of the 2011 population as compared to 2007. This is not probable or else a water crisis would have occurred or reported. We are not sure of the accuracy of the methodology adopted39 by the APIS in coming up with the served population figures.
The reduction of about 4M in level II served population is in accord with the comparison made in Table 11. However, the reduction in level III served population of about 1M is not probable.
39
The APIS 2007 survey utilized a survey sample of 54,000 households.
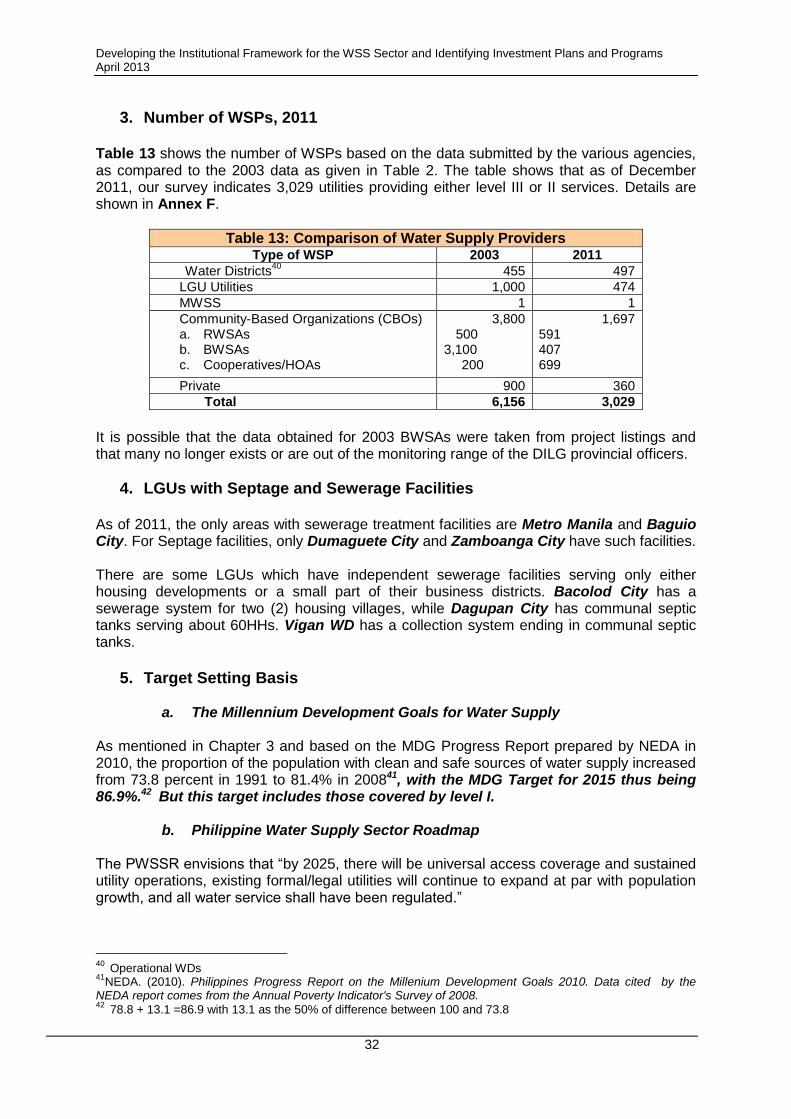
Developing the Institutional Framework for the WSS Sector and Identifying Investment Plans and Programs April 2013
32
3. Number of WSPs, 2011 Table 13 shows the number of WSPs based on the data submitted by the various agencies, as compared to the 2003 data as given in Table 2. The table shows that as of December 2011, our survey indicates 3,029 utilities providing either level III or II services. Details are shown in Annex F.
Table 13: Comparison of Water Supply Providers Type of WSP 2003 2011
Water Districts40
455 497
LGU Utilities 1,000 474
MWSS 1 1
Community-Based Organizations (CBOs) a. RWSAs b. BWSAs c. Cooperatives/HOAs
3,800 500 3,100 200
1,697 591 407 699
Private 900 360
Total 6,156 3,029
It is possible that the data obtained for 2003 BWSAs were taken from project listings and that many no longer exists or are out of the monitoring range of the DILG provincial officers.
4. LGUs with Septage and Sewerage Facilities As of 2011, the only areas with sewerage treatment facilities are Metro Manila and Baguio City. For Septage facilities, only Dumaguete City and Zamboanga City have such facilities.
There are some LGUs which have independent sewerage facilities serving only either housing developments or a small part of their business districts. Bacolod City has a sewerage system for two (2) housing villages, while Dagupan City has communal septic tanks serving about 60HHs. Vigan WD has a collection system ending in communal septic tanks.
5. Target Setting Basis
a. The Millennium Development Goals for Water Supply
As mentioned in Chapter 3 and based on the MDG Progress Report prepared by NEDA in 2010, the proportion of the population with clean and safe sources of water supply increased from 73.8 percent in 1991 to 81.4% in 200841, with the MDG Target for 2015 thus being 86.9%.42 But this target includes those covered by level I.
b. Philippine Water Supply Sector Roadmap
The PWSSR envisions that “by 2025, there will be universal access coverage and sustained utility operations, existing formal/legal utilities will continue to expand at par with population growth, and all water service shall have been regulated.”
40
Operational WDs 41
NEDA. (2010). Philippines Progress Report on the Millenium Development Goals 2010. Data cited by the NEDA report comes from the Annual Poverty Indicator's Survey of 2008. 42
78.8 + 13.1 =86.9 with 13.1 as the 50% of difference between 100 and 73.8
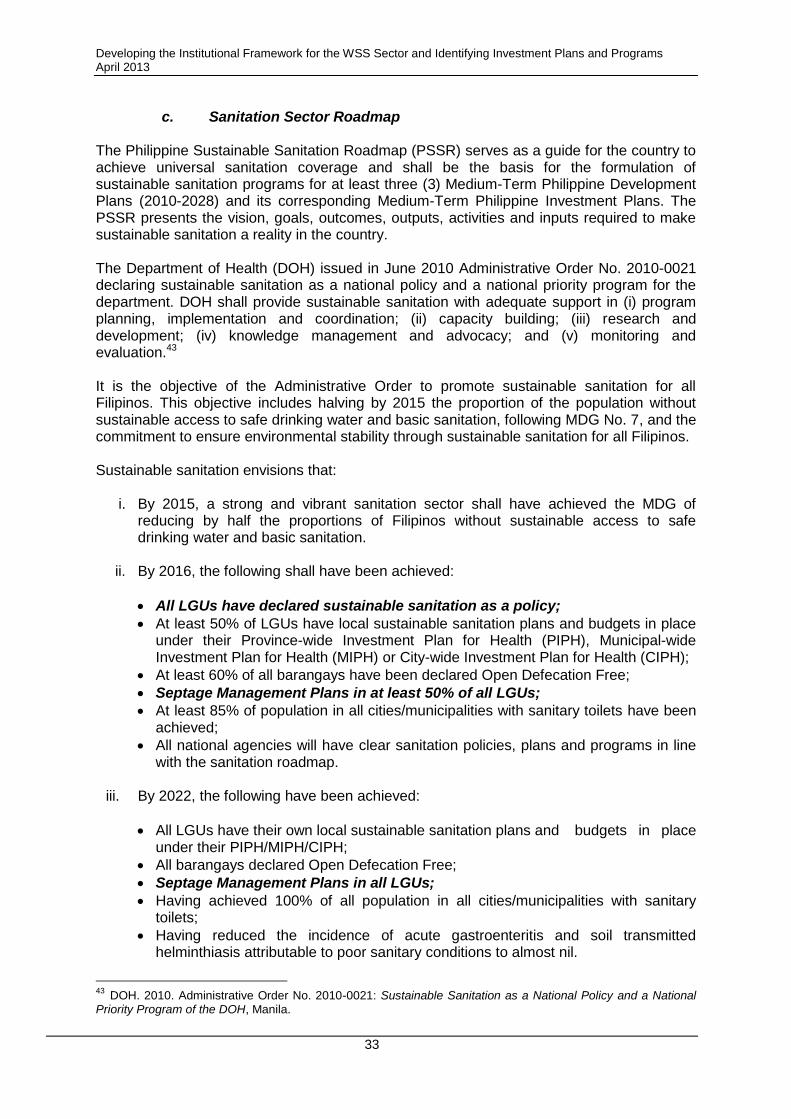
Developing the Institutional Framework for the WSS Sector and Identifying Investment Plans and Programs April 2013
33
c. Sanitation Sector Roadmap The Philippine Sustainable Sanitation Roadmap (PSSR) serves as a guide for the country to achieve universal sanitation coverage and shall be the basis for the formulation of sustainable sanitation programs for at least three (3) Medium-Term Philippine Development Plans (2010-2028) and its corresponding Medium-Term Philippine Investment Plans. The PSSR presents the vision, goals, outcomes, outputs, activities and inputs required to make sustainable sanitation a reality in the country.
The Department of Health (DOH) issued in June 2010 Administrative Order No. 2010-0021 declaring sustainable sanitation as a national policy and a national priority program for the department. DOH shall provide sustainable sanitation with adequate support in (i) program planning, implementation and coordination; (ii) capacity building; (iii) research and development; (iv) knowledge management and advocacy; and (v) monitoring and evaluation.43
It is the objective of the Administrative Order to promote sustainable sanitation for all Filipinos. This objective includes halving by 2015 the proportion of the population without sustainable access to safe drinking water and basic sanitation, following MDG No. 7, and the commitment to ensure environmental stability through sustainable sanitation for all Filipinos.
Sustainable sanitation envisions that:
i. By 2015, a strong and vibrant sanitation sector shall have achieved the MDG of
reducing by half the proportions of Filipinos without sustainable access to safe drinking water and basic sanitation.
ii. By 2016, the following shall have been achieved:
All LGUs have declared sustainable sanitation as a policy;
At least 50% of LGUs have local sustainable sanitation plans and budgets in place under their Province-wide Investment Plan for Health (PIPH), Municipal-wide Investment Plan for Health (MIPH) or City-wide Investment Plan for Health (CIPH);
At least 60% of all barangays have been declared Open Defecation Free;
Septage Management Plans in at least 50% of all LGUs;
At least 85% of population in all cities/municipalities with sanitary toilets have been achieved;
All national agencies will have clear sanitation policies, plans and programs in line with the sanitation roadmap.
iii. By 2022, the following have been achieved:
All LGUs have their own local sustainable sanitation plans and budgets in place under their PIPH/MIPH/CIPH;
All barangays declared Open Defecation Free;
Septage Management Plans in all LGUs;
Having achieved 100% of all population in all cities/municipalities with sanitary toilets;
Having reduced the incidence of acute gastroenteritis and soil transmitted helminthiasis attributable to poor sanitary conditions to almost nil.
43 DOH. 2010. Administrative Order No. 2010-0021: Sustainable Sanitation as a National Policy and a National
Priority Program of the DOH, Manila.
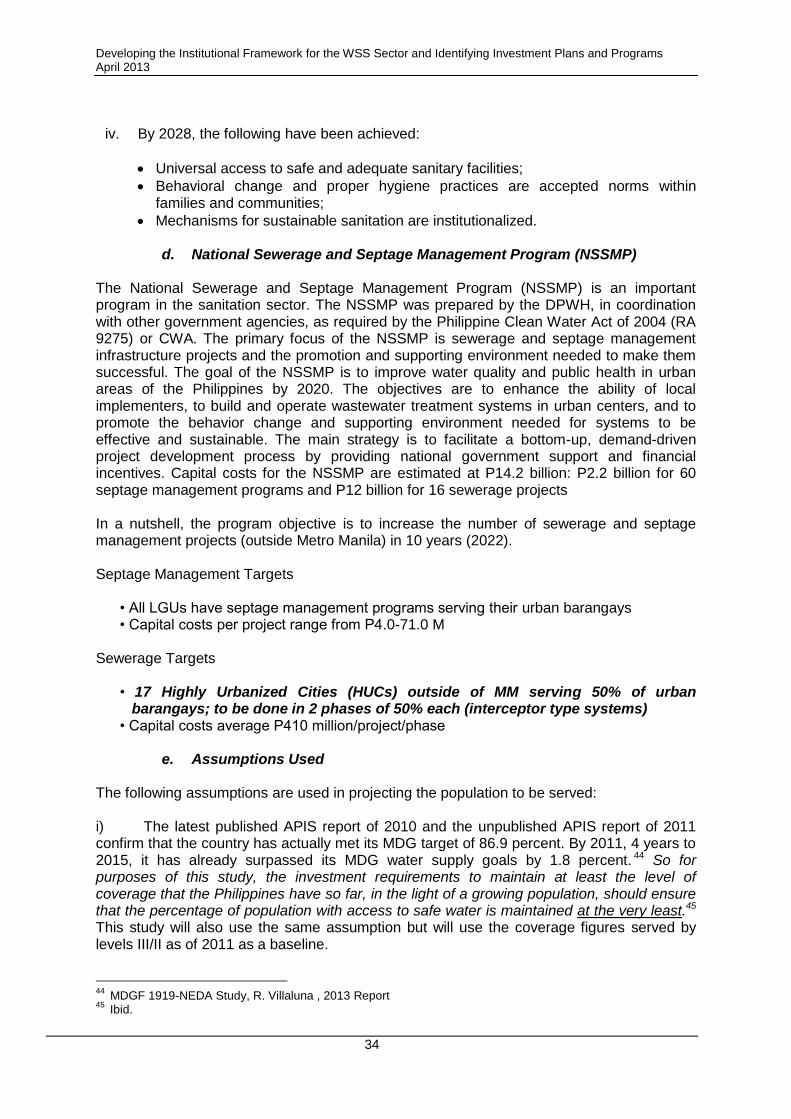
Developing the Institutional Framework for the WSS Sector and Identifying Investment Plans and Programs April 2013
34
iv. By 2028, the following have been achieved:
Universal access to safe and adequate sanitary facilities;
Behavioral change and proper hygiene practices are accepted norms within families and communities;
Mechanisms for sustainable sanitation are institutionalized.
d. National Sewerage and Septage Management Program (NSSMP)
The National Sewerage and Septage Management Program (NSSMP) is an important program in the sanitation sector. The NSSMP was prepared by the DPWH, in coordination with other government agencies, as required by the Philippine Clean Water Act of 2004 (RA 9275) or CWA. The primary focus of the NSSMP is sewerage and septage management infrastructure projects and the promotion and supporting environment needed to make them successful. The goal of the NSSMP is to improve water quality and public health in urban areas of the Philippines by 2020. The objectives are to enhance the ability of local implementers, to build and operate wastewater treatment systems in urban centers, and to promote the behavior change and supporting environment needed for systems to be effective and sustainable. The main strategy is to facilitate a bottom-up, demand-driven project development process by providing national government support and financial incentives. Capital costs for the NSSMP are estimated at P14.2 billion: P2.2 billion for 60 septage management programs and P12 billion for 16 sewerage projects
In a nutshell, the program objective is to increase the number of sewerage and septage management projects (outside Metro Manila) in 10 years (2022).
Septage Management Targets
• All LGUs have septage management programs serving their urban barangays • Capital costs per project range from P4.0-71.0 M
Sewerage Targets
• 17 Highly Urbanized Cities (HUCs) outside of MM serving 50% of urban
barangays; to be done in 2 phases of 50% each (interceptor type systems) • Capital costs average P410 million/project/phase
e. Assumptions Used
The following assumptions are used in projecting the population to be served:
i) The latest published APIS report of 2010 and the unpublished APIS report of 2011 confirm that the country has actually met its MDG target of 86.9 percent. By 2011, 4 years to 2015, it has already surpassed its MDG water supply goals by 1.8 percent. 44 So for purposes of this study, the investment requirements to maintain at least the level of coverage that the Philippines have so far, in the light of a growing population, should ensure that the percentage of population with access to safe water is maintained at the very least.45 This study will also use the same assumption but will use the coverage figures served by levels III/II as of 2011 as a baseline.
44
MDGF 1919-NEDA Study, R. Villaluna , 2013 Report 45
Ibid.
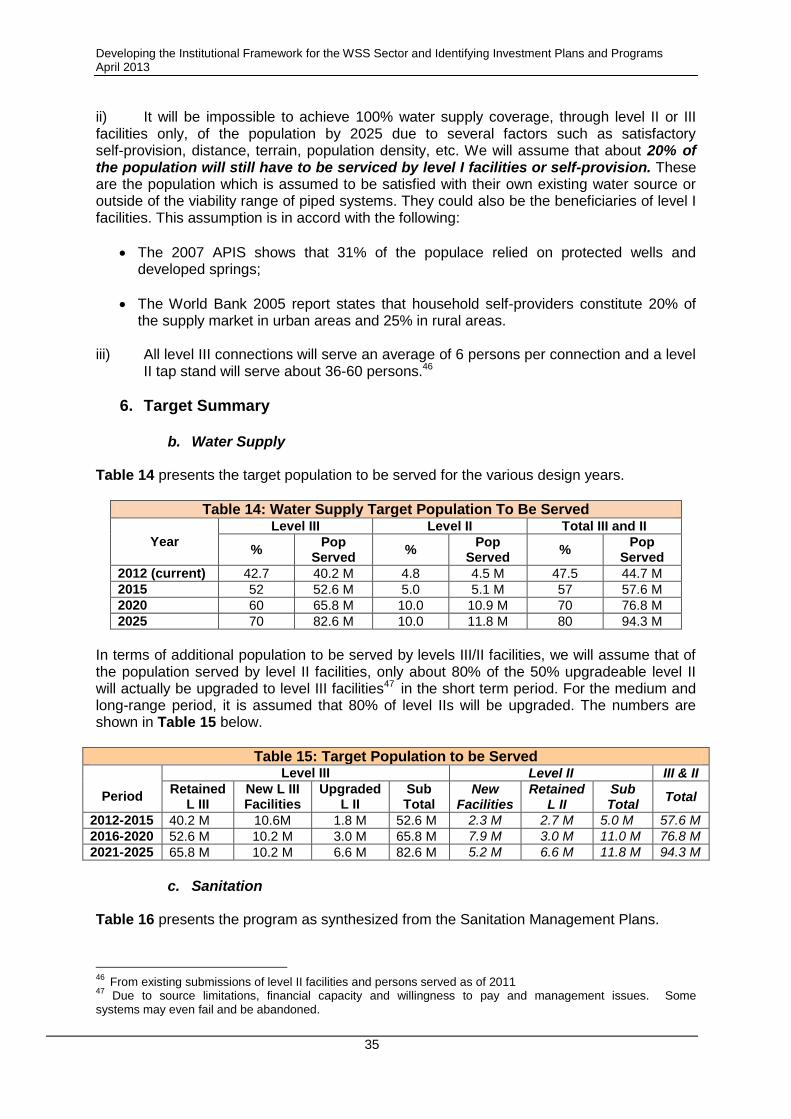
Developing the Institutional Framework for the WSS Sector and Identifying Investment Plans and Programs April 2013
35
ii) It will be impossible to achieve 100% water supply coverage, through level II or III facilities only, of the population by 2025 due to several factors such as satisfactory self-provision, distance, terrain, population density, etc. We will assume that about 20% of the population will still have to be serviced by level I facilities or self-provision. These are the population which is assumed to be satisfied with their own existing water source or outside of the viability range of piped systems. They could also be the beneficiaries of level I facilities. This assumption is in accord with the following:
The 2007 APIS shows that 31% of the populace relied on protected wells and developed springs;
The World Bank 2005 report states that household self-providers constitute 20% of the supply market in urban areas and 25% in rural areas.
iii) All level III connections will serve an average of 6 persons per connection and a level
II tap stand will serve about 36-60 persons.46
6. Target Summary
b. Water Supply
Table 14 presents the target population to be served for the various design years.
Table 14: Water Supply Target Population To Be Served
Year
Level III Level II Total III and II
% Pop
Served %
Pop Served
% Pop
Served
2012 (current) 42.7 40.2 M 4.8 4.5 M 47.5 44.7 M
2015 52 52.6 M 5.0 5.1 M 57 57.6 M
2020 60 65.8 M 10.0 10.9 M 70 76.8 M
2025 70 82.6 M 10.0 11.8 M 80 94.3 M
In terms of additional population to be served by levels III/II facilities, we will assume that of the population served by level II facilities, only about 80% of the 50% upgradeable level II will actually be upgraded to level III facilities47 in the short term period. For the medium and long-range period, it is assumed that 80% of level IIs will be upgraded. The numbers are shown in Table 15 below.
Table 15: Target Population to be Served
Period
Level III Level II III & II
Retained L III
New L III Facilities
Upgraded L II
Sub Total
New Facilities
Retained L II
Sub Total
Total
2012-2015 40.2 M 10.6M 1.8 M 52.6 M 2.3 M 2.7 M 5.0 M 57.6 M
2016-2020 52.6 M 10.2 M 3.0 M 65.8 M 7.9 M 3.0 M 11.0 M 76.8 M
2021-2025 65.8 M 10.2 M 6.6 M 82.6 M 5.2 M 6.6 M 11.8 M 94.3 M
c. Sanitation
Table 16 presents the program as synthesized from the Sanitation Management Plans.
46 From existing submissions of level II facilities and persons served as of 2011
47 Due to source limitations, financial capacity and willingness to pay and management issues. Some
systems may even fail and be abandoned.
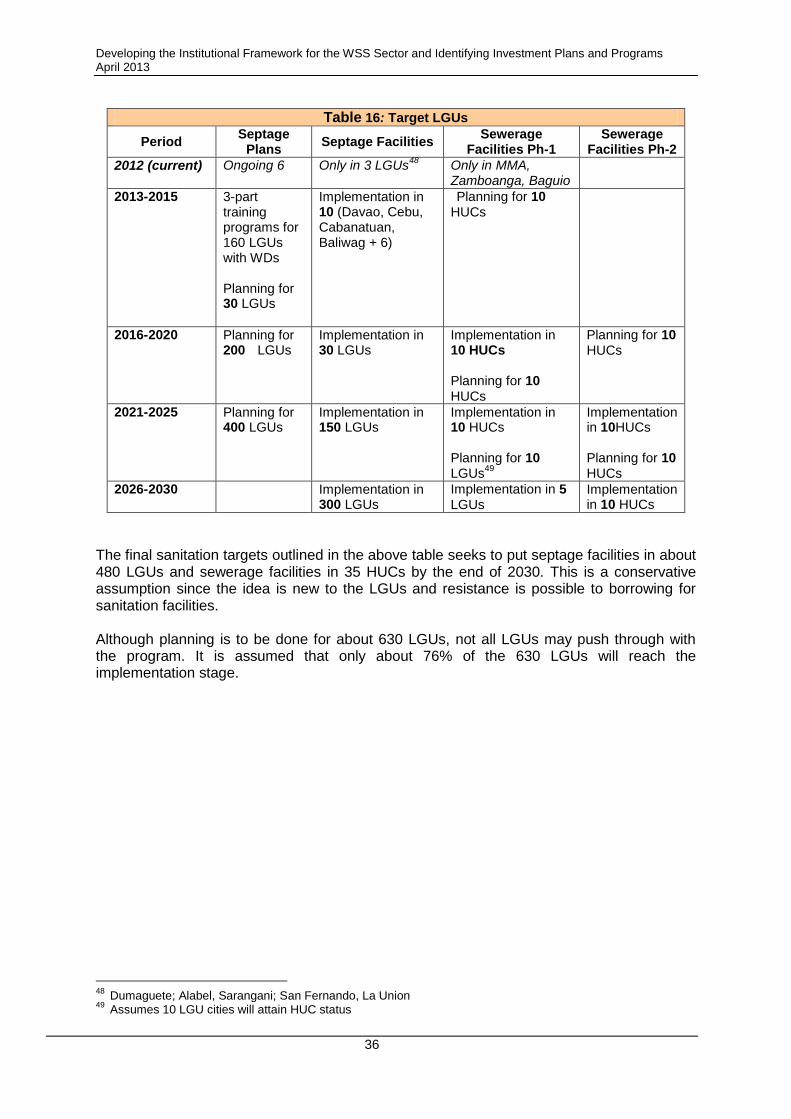
Developing the Institutional Framework for the WSS Sector and Identifying Investment Plans and Programs April 2013
36
Table 16: Target LGUs
Period Septage
Plans Septage Facilities
Sewerage Facilities Ph-1
Sewerage Facilities Ph-2
2012 (current) Ongoing 6 Only in 3 LGUs48
Only in MMA, Zamboanga, Baguio
2013-2015 3-part training programs for 160 LGUs with WDs Planning for 30 LGUs
Implementation in 10 (Davao, Cebu, Cabanatuan, Baliwag + 6)
Planning for 10 HUCs
2016-2020 Planning for 200 LGUs
Implementation in 30 LGUs
Implementation in 10 HUCs Planning for 10 HUCs
Planning for 10 HUCs
2021-2025 Planning for 400 LGUs
Implementation in 150 LGUs
Implementation in 10 HUCs Planning for 10 LGUs
49
Implementation in 10HUCs Planning for 10 HUCs
2026-2030 Implementation in 300 LGUs
Implementation in 5 LGUs
Implementation in 10 HUCs
The final sanitation targets outlined in the above table seeks to put septage facilities in about 480 LGUs and sewerage facilities in 35 HUCs by the end of 2030. This is a conservative assumption since the idea is new to the LGUs and resistance is possible to borrowing for sanitation facilities. Although planning is to be done for about 630 LGUs, not all LGUs may push through with the program. It is assumed that only about 76% of the 630 LGUs will reach the implementation stage.
48
Dumaguete; Alabel, Sarangani; San Fernando, La Union
49 Assumes 10 LGU cities will attain HUC status
Developing the Institutional Framework for the WSS Sector and Identifying Investment Plans and Programs April 2013
37
D. INVESTMENT REQUIREMENTS
1. Basic Formula The investment requirements presented herein will be for infrastructure development and capacity building.
The basic formula for water supply infrastructure is to multiply the number of persons to be served by the unit cost per person for level II or Level III facilities. This cost shall include the necessary technical studies needed.
The capacity development cost shall be a percentage of the infrastructure cost. Inflation is assumed at 4% per annum.
2. Basis and Assumptions for Infrastructure Cost Estimates
The basic documents used for the cost/system or cost per household would be the following:
Rural Water Supply Guidelines prepared for the sector agencies.
PWSSR
NSSMP
Project Cost of various agencies
The cost data will likewise be compared with the unit cost recommendations in the preliminary report prepared by R. Villaluna50.
a. Level I
It is not possible to upgrade existing level I to level II/III facilities unless the source is a spring or deep well. Almost all Level I sources are shallow wells only which are not designed or built to supply even level II demand. Although we can assume that 10% of level I are upgradable, conversion into a level II/III system is like building a new level II/III system.
b. Level II Systems
A review of level II source facilities designed by LGUs and national agencies reveals that many of the well sources are not upgradable to supplying level III demand due to the following:
Well casing diameters are usually 100 mm or smaller which does not lend itself to upgrading larger pump assemblies and specific capacities are usually low with well construction usually just an open hole at the bottom.
The power line used (or available) is only a single phase line which can be used by a pump with a maximum output of only 6 lps. This is assuming that the well casing diameter is 150 mm or larger.
50
Determining the Investment Requirements for Improved water supply coverage in the Phil; R Villaluna for NEDA, Preliminary Report, Dec 2012
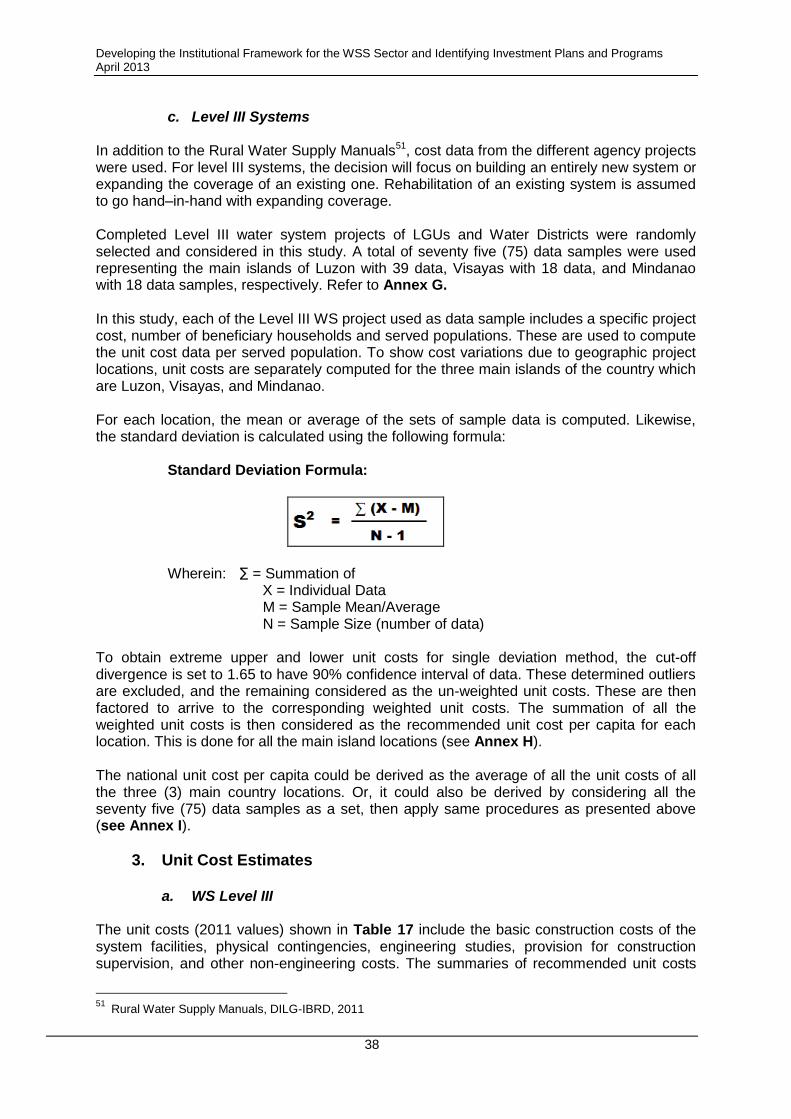
Developing the Institutional Framework for the WSS Sector and Identifying Investment Plans and Programs April 2013
38
c. Level III Systems
In addition to the Rural Water Supply Manuals51, cost data from the different agency projects were used. For level III systems, the decision will focus on building an entirely new system or expanding the coverage of an existing one. Rehabilitation of an existing system is assumed to go hand–in-hand with expanding coverage.
Completed Level III water system projects of LGUs and Water Districts were randomly selected and considered in this study. A total of seventy five (75) data samples were used representing the main islands of Luzon with 39 data, Visayas with 18 data, and Mindanao with 18 data samples, respectively. Refer to Annex G. In this study, each of the Level III WS project used as data sample includes a specific project cost, number of beneficiary households and served populations. These are used to compute the unit cost data per served population. To show cost variations due to geographic project locations, unit costs are separately computed for the three main islands of the country which are Luzon, Visayas, and Mindanao. For each location, the mean or average of the sets of sample data is computed. Likewise, the standard deviation is calculated using the following formula:
Standard Deviation Formula:
Wherein: ∑ = Summation of X = Individual Data M = Sample Mean/Average N = Sample Size (number of data)
To obtain extreme upper and lower unit costs for single deviation method, the cut-off divergence is set to 1.65 to have 90% confidence interval of data. These determined outliers are excluded, and the remaining considered as the un-weighted unit costs. These are then factored to arrive to the corresponding weighted unit costs. The summation of all the weighted unit costs is then considered as the recommended unit cost per capita for each location. This is done for all the main island locations (see Annex H). The national unit cost per capita could be derived as the average of all the unit costs of all the three (3) main country locations. Or, it could also be derived by considering all the seventy five (75) data samples as a set, then apply same procedures as presented above (see Annex I).
3. Unit Cost Estimates
a. WS Level III The unit costs (2011 values) shown in Table 17 include the basic construction costs of the system facilities, physical contingencies, engineering studies, provision for construction supervision, and other non-engineering costs. The summaries of recommended unit costs
51 Rural Water Supply Manuals, DILG-IBRD, 2011
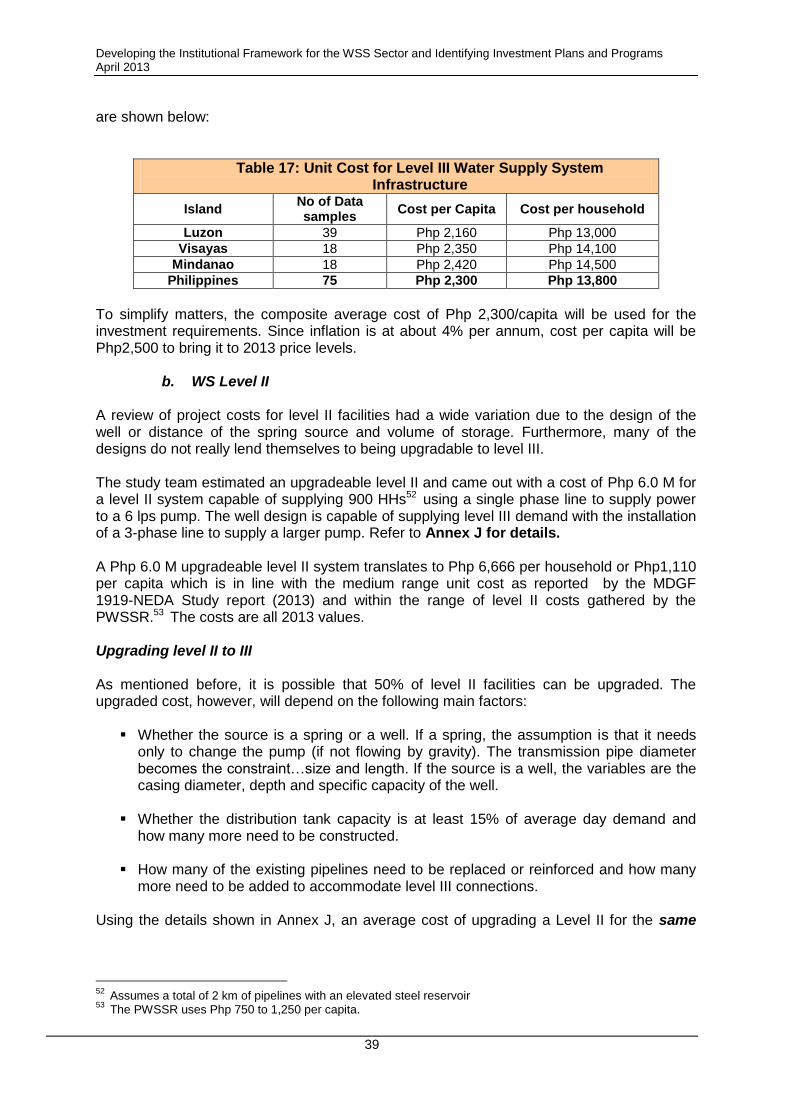
Developing the Institutional Framework for the WSS Sector and Identifying Investment Plans and Programs April 2013
39
are shown below:
Table 17: Unit Cost for Level III Water Supply System Infrastructure
Island No of Data samples
Cost per Capita Cost per household
Luzon 39 Php 2,160 Php 13,000
Visayas 18 Php 2,350 Php 14,100
Mindanao 18 Php 2,420 Php 14,500
Philippines 75 Php 2,300 Php 13,800
To simplify matters, the composite average cost of Php 2,300/capita will be used for the investment requirements. Since inflation is at about 4% per annum, cost per capita will be Php2,500 to bring it to 2013 price levels.
b. WS Level II
A review of project costs for level II facilities had a wide variation due to the design of the well or distance of the spring source and volume of storage. Furthermore, many of the designs do not really lend themselves to being upgradable to level III.
The study team estimated an upgradeable level II and came out with a cost of Php 6.0 M for a level II system capable of supplying 900 HHs52 using a single phase line to supply power to a 6 lps pump. The well design is capable of supplying level III demand with the installation of a 3-phase line to supply a larger pump. Refer to Annex J for details.
A Php 6.0 M upgradeable level II system translates to Php 6,666 per household or Php1,110 per capita which is in line with the medium range unit cost as reported by the MDGF 1919-NEDA Study report (2013) and within the range of level II costs gathered by the PWSSR.53 The costs are all 2013 values.
Upgrading level II to III As mentioned before, it is possible that 50% of level II facilities can be upgraded. The upgraded cost, however, will depend on the following main factors:
Whether the source is a spring or a well. If a spring, the assumption is that it needs
only to change the pump (if not flowing by gravity). The transmission pipe diameter becomes the constraint…size and length. If the source is a well, the variables are the casing diameter, depth and specific capacity of the well.
Whether the distribution tank capacity is at least 15% of average day demand and
how many more need to be constructed. How many of the existing pipelines need to be replaced or reinforced and how many
more need to be added to accommodate level III connections.
Using the details shown in Annex J, an average cost of upgrading a Level II for the same
52
Assumes a total of 2 km of pipelines with an elevated steel reservoir 53
The PWSSR uses Php 750 to 1,250 per capita.
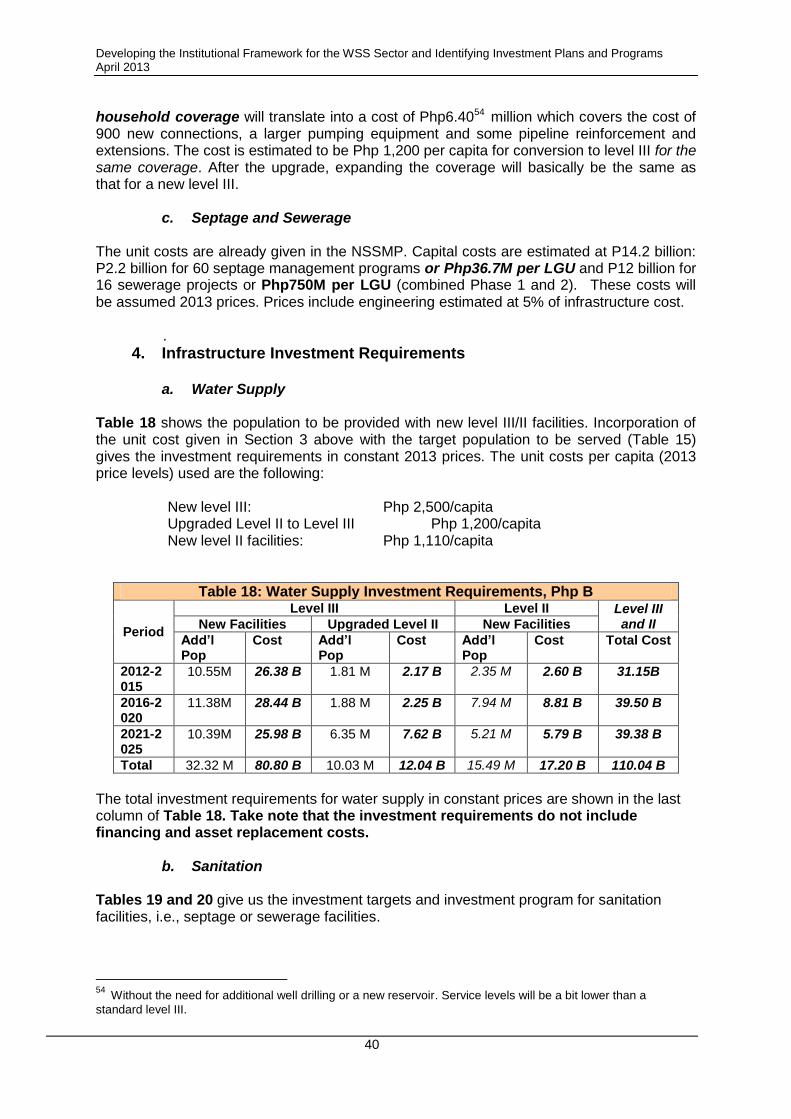
Developing the Institutional Framework for the WSS Sector and Identifying Investment Plans and Programs April 2013
40
household coverage will translate into a cost of Php6.4054 million which covers the cost of 900 new connections, a larger pumping equipment and some pipeline reinforcement and extensions. The cost is estimated to be Php 1,200 per capita for conversion to level III for the same coverage. After the upgrade, expanding the coverage will basically be the same as that for a new level III.
c. Septage and Sewerage
The unit costs are already given in the NSSMP. Capital costs are estimated at P14.2 billion: P2.2 billion for 60 septage management programs or Php36.7M per LGU and P12 billion for 16 sewerage projects or Php750M per LGU (combined Phase 1 and 2). These costs will be assumed 2013 prices. Prices include engineering estimated at 5% of infrastructure cost.
.
4. Infrastructure Investment Requirements
a. Water Supply
Table 18 shows the population to be provided with new level III/II facilities. Incorporation of the unit cost given in Section 3 above with the target population to be served (Table 15) gives the investment requirements in constant 2013 prices. The unit costs per capita (2013 price levels) used are the following:
New level III: Php 2,500/capita Upgraded Level II to Level III Php 1,200/capita New level II facilities: Php 1,110/capita
Table 18: Water Supply Investment Requirements, Php B
Period
Level III Level II Level III and II New Facilities Upgraded Level II New Facilities
Add’l Pop
Cost Add’l Pop
Cost Add’l Pop
Cost Total Cost
2012-2015
10.55M 26.38 B 1.81 M 2.17 B 2.35 M 2.60 B 31.15B
2016-2020
11.38M 28.44 B 1.88 M 2.25 B 7.94 M 8.81 B 39.50 B
2021-2025
10.39M 25.98 B 6.35 M 7.62 B 5.21 M 5.79 B 39.38 B
Total 32.32 M 80.80 B 10.03 M 12.04 B 15.49 M 17.20 B 110.04 B
The total investment requirements for water supply in constant prices are shown in the last column of Table 18. Take note that the investment requirements do not include financing and asset replacement costs.
b. Sanitation
Tables 19 and 20 give us the investment targets and investment program for sanitation facilities, i.e., septage or sewerage facilities.
54 Without the need for additional well drilling or a new reservoir. Service levels will be a bit lower than a
standard level III.
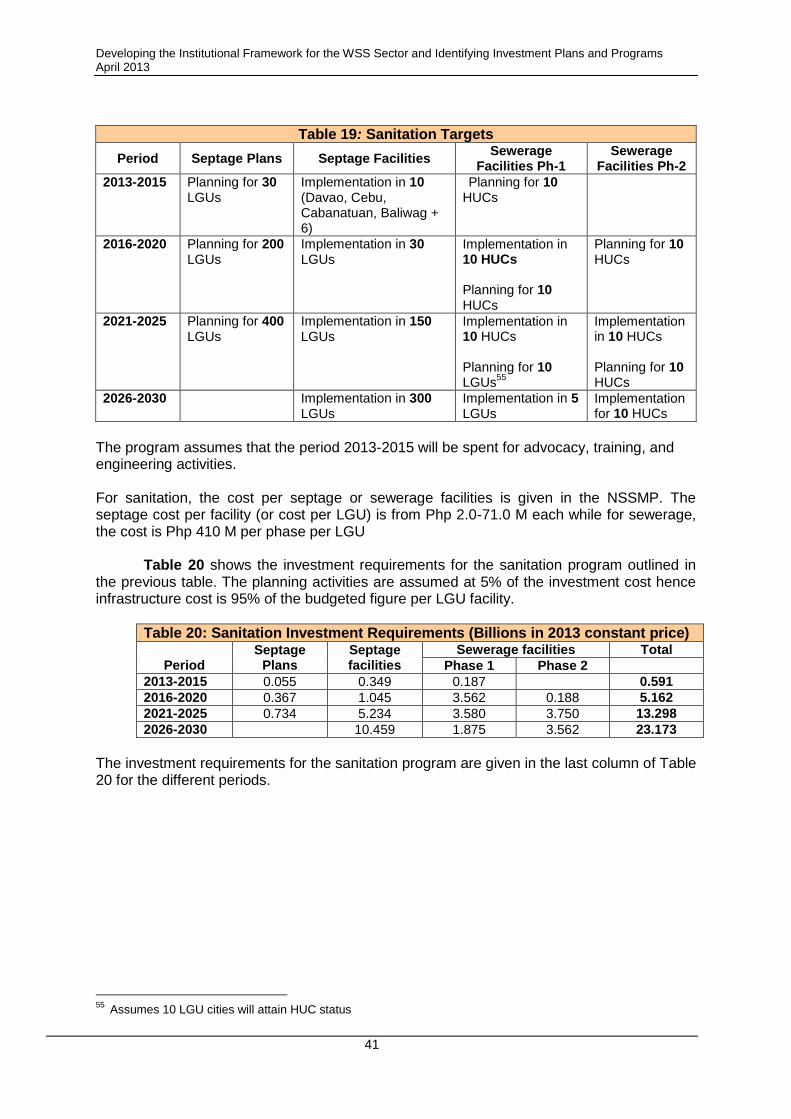
Developing the Institutional Framework for the WSS Sector and Identifying Investment Plans and Programs April 2013
41
Table 19: Sanitation Targets
Period Septage Plans Septage Facilities Sewerage
Facilities Ph-1 Sewerage
Facilities Ph-2
2013-2015 Planning for 30 LGUs
Implementation in 10 (Davao, Cebu, Cabanatuan, Baliwag + 6)
Planning for 10 HUCs
2016-2020 Planning for 200 LGUs
Implementation in 30 LGUs
Implementation in 10 HUCs Planning for 10 HUCs
Planning for 10 HUCs
2021-2025 Planning for 400 LGUs
Implementation in 150 LGUs
Implementation in 10 HUCs Planning for 10 LGUs
55
Implementation in 10 HUCs Planning for 10 HUCs
2026-2030 Implementation in 300 LGUs
Implementation in 5 LGUs
Implementation for 10 HUCs
The program assumes that the period 2013-2015 will be spent for advocacy, training, and engineering activities.
For sanitation, the cost per septage or sewerage facilities is given in the NSSMP. The septage cost per facility (or cost per LGU) is from Php 2.0-71.0 M each while for sewerage, the cost is Php 410 M per phase per LGU
Table 20 shows the investment requirements for the sanitation program outlined in the previous table. The planning activities are assumed at 5% of the investment cost hence infrastructure cost is 95% of the budgeted figure per LGU facility.
Table 20: Sanitation Investment Requirements (Billions in 2013 constant price)
Period Septage
Plans Septage facilities
Sewerage facilities Total
Phase 1 Phase 2
2013-2015 0.055 0.349 0.187 0.591
2016-2020 0.367 1.045 3.562 0.188 5.162
2021-2025 0.734 5.234 3.580 3.750 13.298
2026-2030 10.459 1.875 3.562 23.173
The investment requirements for the sanitation program are given in the last column of Table 20 for the different periods.
55
Assumes 10 LGU cities will attain HUC status
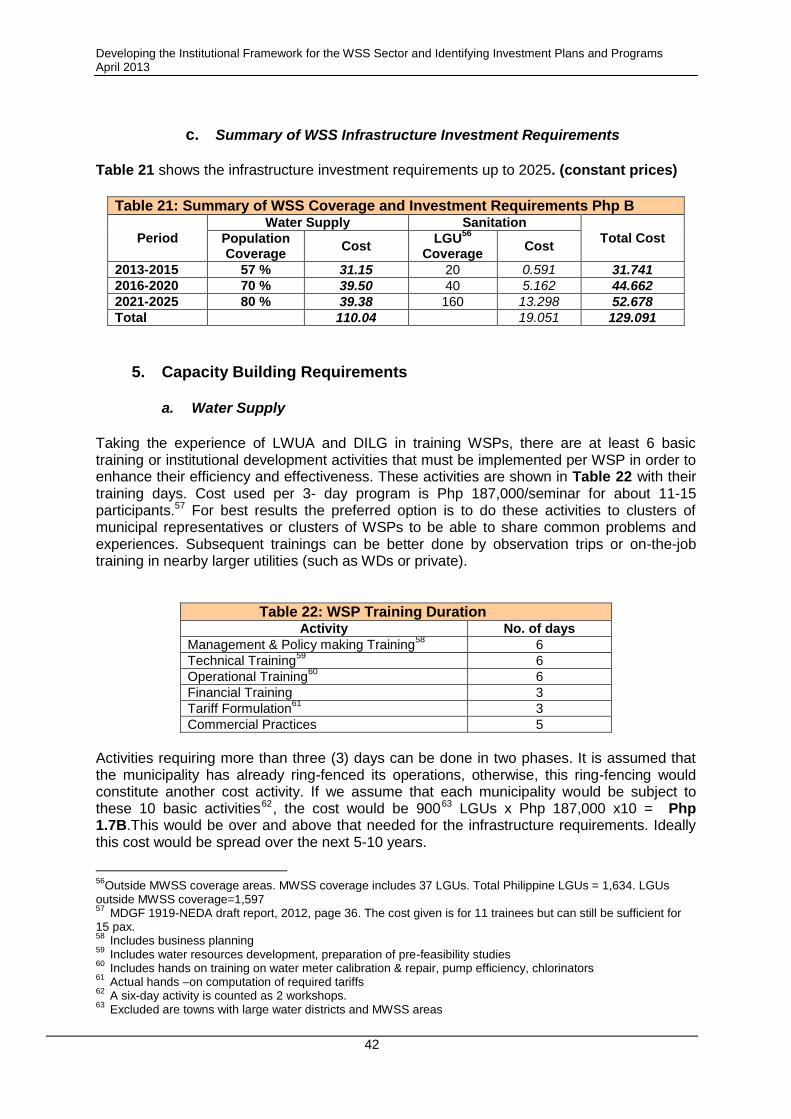
Developing the Institutional Framework for the WSS Sector and Identifying Investment Plans and Programs April 2013
42
c. Summary of WSS Infrastructure Investment Requirements Table 21 shows the infrastructure investment requirements up to 2025. (constant prices)
Table 21: Summary of WSS Coverage and Investment Requirements Php B
Period
Water Supply Sanitation
Total Cost Population Coverage
Cost LGU
56
Coverage Cost
2013-2015 57 % 31.15 20 0.591 31.741
2016-2020 70 % 39.50 40 5.162 44.662
2021-2025 80 % 39.38 160 13.298 52.678
Total 110.04 19.051 129.091
5. Capacity Building Requirements
a. Water Supply
Taking the experience of LWUA and DILG in training WSPs, there are at least 6 basic training or institutional development activities that must be implemented per WSP in order to enhance their efficiency and effectiveness. These activities are shown in Table 22 with their training days. Cost used per 3- day program is Php 187,000/seminar for about 11-15 participants.57 For best results the preferred option is to do these activities to clusters of municipal representatives or clusters of WSPs to be able to share common problems and experiences. Subsequent trainings can be better done by observation trips or on-the-job training in nearby larger utilities (such as WDs or private).
Table 22: WSP Training Duration Activity No. of days
Management & Policy making Training58
6
Technical Training59
6
Operational Training60
6
Financial Training 3
Tariff Formulation61
3
Commercial Practices 5
Activities requiring more than three (3) days can be done in two phases. It is assumed that the municipality has already ring-fenced its operations, otherwise, this ring-fencing would constitute another cost activity. If we assume that each municipality would be subject to these 10 basic activities62, the cost would be 90063 LGUs x Php 187,000 x10 = Php 1.7B.This would be over and above that needed for the infrastructure requirements. Ideally this cost would be spread over the next 5-10 years.
56
Outside MWSS coverage areas. MWSS coverage includes 37 LGUs. Total Philippine LGUs = 1,634. LGUs outside MWSS coverage=1,597
57 MDGF 1919-NEDA draft report, 2012, page 36. The cost given is for 11 trainees but can still be sufficient for
15 pax.
58 Includes business planning
59
Includes water resources development, preparation of pre-feasibility studies
60 Includes hands on training on water meter calibration & repair, pump efficiency, chlorinators
61
Actual hands –on computation of required tariffs
62 A six-day activity is counted as 2 workshops.
63
Excluded are towns with large water districts and MWSS areas
Developing the Institutional Framework for the WSS Sector and Identifying Investment Plans and Programs April 2013
43
b. Sanitation
The capacity requirements for sanitation would be similar for water supply. While the 10 basic workshops are needed per LGU, 2 - 4 of the workshops would be devoted to advocacy requirements among the communities within the LGUs, as well as LGU officials. The total cost would be 1,000 x Php 187,000 x 10= Php 1.9 B. Again, similar to the water sector, this would be over and above that needed for infrastructures.
6. Fund Sourcing
There are many possible sources of funds for these WSS undertakings. But utilization of these sources is subject to government policies for the sector. As an example: How much subsidy should government provide, should LWUA continue to fund WDs, will there be ODA funds available for Output Based Aid (OBA), what is the graduation program for waterless communities, how about PPPs and so forth and so on.
The fund sourcing will be discussed in detail in Chapter E after proposed sector policies are recommended.
The major fund sources would be the government itself (either subsidy or loans), banks (public and private), ODAs (thru direct loans or channeled to GFIs or through an OBA facility), the WSPs themselves, or from public-private partnership (PPP).
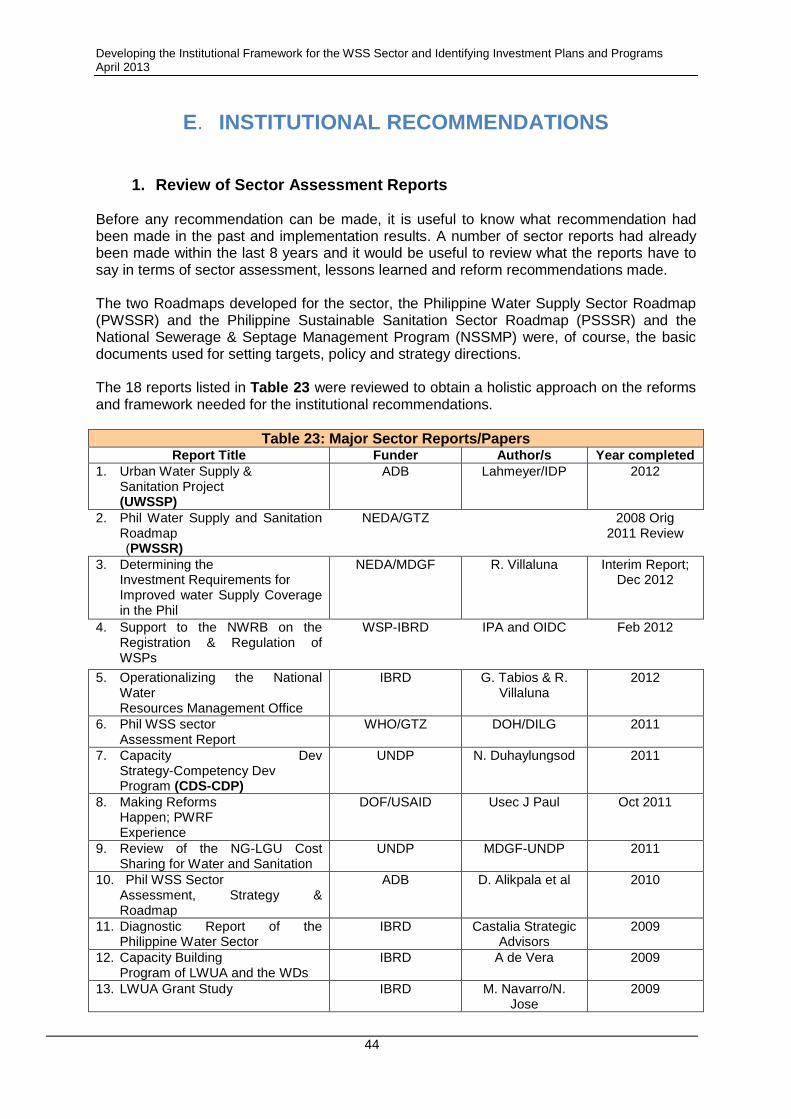
Developing the Institutional Framework for the WSS Sector and Identifying Investment Plans and Programs April 2013
44
E. INSTITUTIONAL RECOMMENDATIONS
1. Review of Sector Assessment Reports
Before any recommendation can be made, it is useful to know what recommendation had been made in the past and implementation results. A number of sector reports had already been made within the last 8 years and it would be useful to review what the reports have to say in terms of sector assessment, lessons learned and reform recommendations made. The two Roadmaps developed for the sector, the Philippine Water Supply Sector Roadmap (PWSSR) and the Philippine Sustainable Sanitation Sector Roadmap (PSSSR) and the National Sewerage & Septage Management Program (NSSMP) were, of course, the basic documents used for setting targets, policy and strategy directions. The 18 reports listed in Table 23 were reviewed to obtain a holistic approach on the reforms and framework needed for the institutional recommendations.
Table 23: Major Sector Reports/Papers Report Title Funder Author/s Year completed
1. Urban Water Supply & Sanitation Project (UWSSP)
ADB Lahmeyer/IDP 2012
2. Phil Water Supply and Sanitation Roadmap (PWSSR)
NEDA/GTZ 2008 Orig 2011 Review
3. Determining the Investment Requirements for Improved water Supply Coverage in the Phil
NEDA/MDGF R. Villaluna Interim Report; Dec 2012
4. Support to the NWRB on the Registration & Regulation of WSPs
WSP-IBRD IPA and OIDC Feb 2012
5. Operationalizing the National Water Resources Management Office
IBRD G. Tabios & R. Villaluna
2012
6. Phil WSS sector Assessment Report
WHO/GTZ DOH/DILG 2011
7. Capacity Dev Strategy-Competency Dev Program (CDS-CDP)
UNDP N. Duhaylungsod 2011
8. Making Reforms Happen; PWRF Experience
DOF/USAID Usec J Paul Oct 2011
9. Review of the NG-LGU Cost Sharing for Water and Sanitation
UNDP MDGF-UNDP 2011
10. Phil WSS Sector Assessment, Strategy & Roadmap
ADB D. Alikpala et al 2010
11. Diagnostic Report of the Philippine Water Sector
IBRD Castalia Strategic Advisors
2009
12. Capacity Building Program of LWUA and the WDs
IBRD A de Vera 2009
13. LWUA Grant Study IBRD M. Navarro/N. Jose
2009
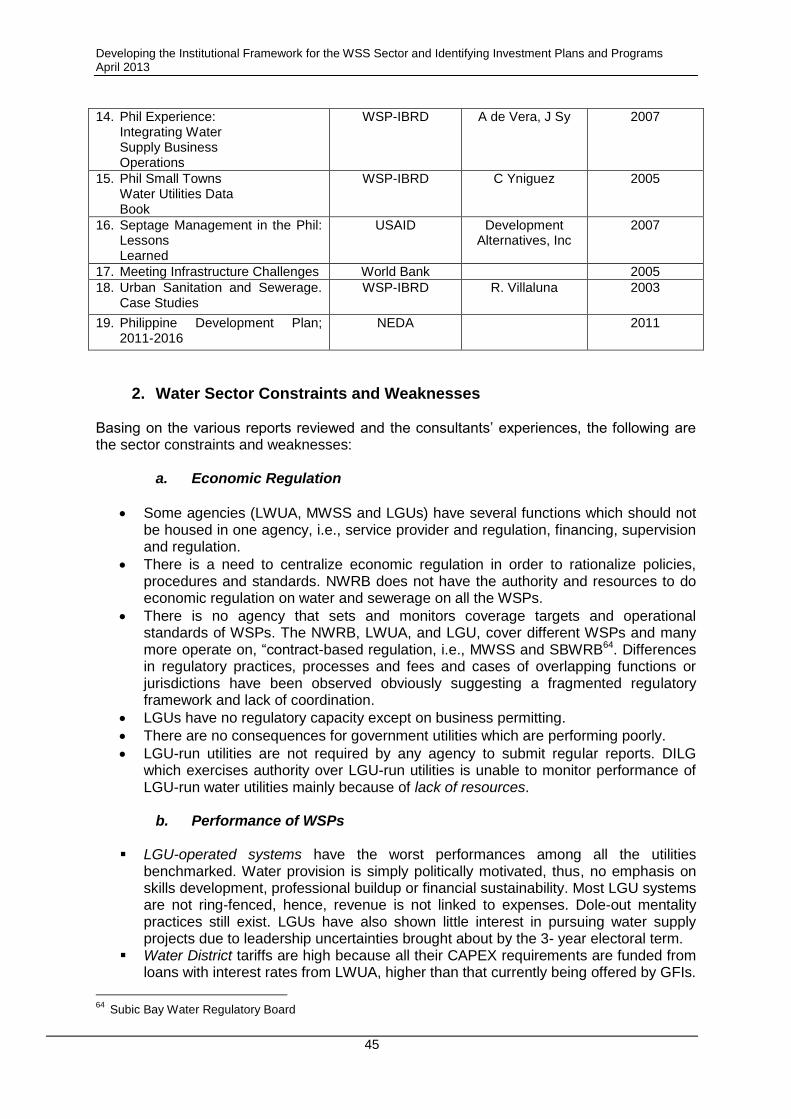
Developing the Institutional Framework for the WSS Sector and Identifying Investment Plans and Programs April 2013
45
14. Phil Experience: Integrating Water Supply Business Operations
WSP-IBRD A de Vera, J Sy 2007
15. Phil Small Towns Water Utilities Data Book
WSP-IBRD C Yniguez 2005
16. Septage Management in the Phil: Lessons Learned
USAID Development Alternatives, Inc
2007
17. Meeting Infrastructure Challenges World Bank 2005
18. Urban Sanitation and Sewerage. Case Studies
WSP-IBRD R. Villaluna 2003
19. Philippine Development Plan; 2011-2016
NEDA 2011
2. Water Sector Constraints and Weaknesses
Basing on the various reports reviewed and the consultants’ experiences, the following are the sector constraints and weaknesses:
a. Economic Regulation
Some agencies (LWUA, MWSS and LGUs) have several functions which should not be housed in one agency, i.e., service provider and regulation, financing, supervision and regulation.
There is a need to centralize economic regulation in order to rationalize policies, procedures and standards. NWRB does not have the authority and resources to do economic regulation on water and sewerage on all the WSPs.
There is no agency that sets and monitors coverage targets and operational standards of WSPs. The NWRB, LWUA, and LGU, cover different WSPs and many more operate on, “contract-based regulation, i.e., MWSS and SBWRB64. Differences in regulatory practices, processes and fees and cases of overlapping functions or jurisdictions have been observed obviously suggesting a fragmented regulatory framework and lack of coordination.
LGUs have no regulatory capacity except on business permitting.
There are no consequences for government utilities which are performing poorly.
LGU-run utilities are not required by any agency to submit regular reports. DILG which exercises authority over LGU-run utilities is unable to monitor performance of LGU-run water utilities mainly because of lack of resources.
b. Performance of WSPs
LGU-operated systems have the worst performances among all the utilities
benchmarked. Water provision is simply politically motivated, thus, no emphasis on skills development, professional buildup or financial sustainability. Most LGU systems are not ring-fenced, hence, revenue is not linked to expenses. Dole-out mentality practices still exist. LGUs have also shown little interest in pursuing water supply projects due to leadership uncertainties brought about by the 3- year electoral term.
Water District tariffs are high because all their CAPEX requirements are funded from loans with interest rates from LWUA, higher than that currently being offered by GFIs.
64
Subic Bay Water Regulatory Board
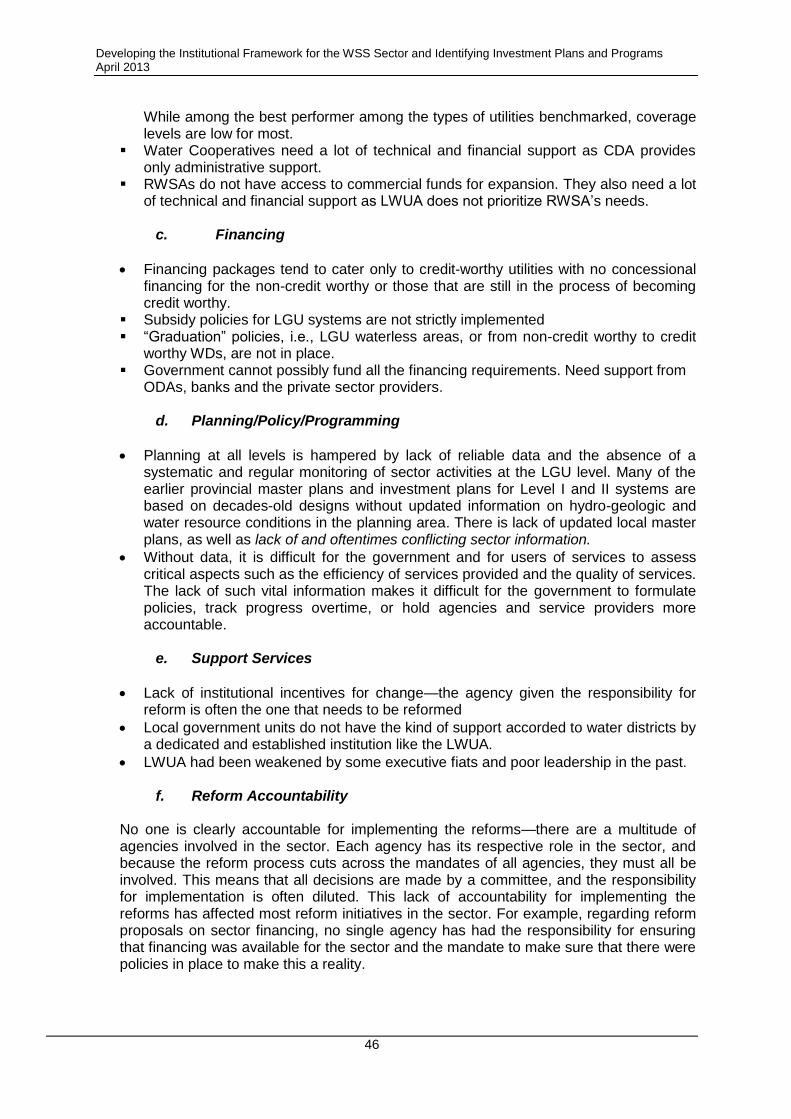
Developing the Institutional Framework for the WSS Sector and Identifying Investment Plans and Programs April 2013
46
While among the best performer among the types of utilities benchmarked, coverage levels are low for most.
Water Cooperatives need a lot of technical and financial support as CDA provides only administrative support.
RWSAs do not have access to commercial funds for expansion. They also need a lot of technical and financial support as LWUA does not prioritize RWSA’s needs.
c. Financing
Financing packages tend to cater only to credit-worthy utilities with no concessional financing for the non-credit worthy or those that are still in the process of becoming credit worthy.
Subsidy policies for LGU systems are not strictly implemented “Graduation” policies, i.e., LGU waterless areas, or from non-credit worthy to credit
worthy WDs, are not in place. Government cannot possibly fund all the financing requirements. Need support from
ODAs, banks and the private sector providers.
d. Planning/Policy/Programming
Planning at all levels is hampered by lack of reliable data and the absence of a systematic and regular monitoring of sector activities at the LGU level. Many of the earlier provincial master plans and investment plans for Level I and II systems are based on decades-old designs without updated information on hydro-geologic and water resource conditions in the planning area. There is lack of updated local master plans, as well as lack of and oftentimes conflicting sector information.
Without data, it is difficult for the government and for users of services to assess critical aspects such as the efficiency of services provided and the quality of services. The lack of such vital information makes it difficult for the government to formulate policies, track progress overtime, or hold agencies and service providers more accountable.
e. Support Services
Lack of institutional incentives for change—the agency given the responsibility for reform is often the one that needs to be reformed
Local government units do not have the kind of support accorded to water districts by a dedicated and established institution like the LWUA.
LWUA had been weakened by some executive fiats and poor leadership in the past.
f. Reform Accountability
No one is clearly accountable for implementing the reforms—there are a multitude of agencies involved in the sector. Each agency has its respective role in the sector, and because the reform process cuts across the mandates of all agencies, they must all be involved. This means that all decisions are made by a committee, and the responsibility for implementation is often diluted. This lack of accountability for implementing the reforms has affected most reform initiatives in the sector. For example, regarding reform proposals on sector financing, no single agency has had the responsibility for ensuring that financing was available for the sector and the mandate to make sure that there were policies in place to make this a reality.
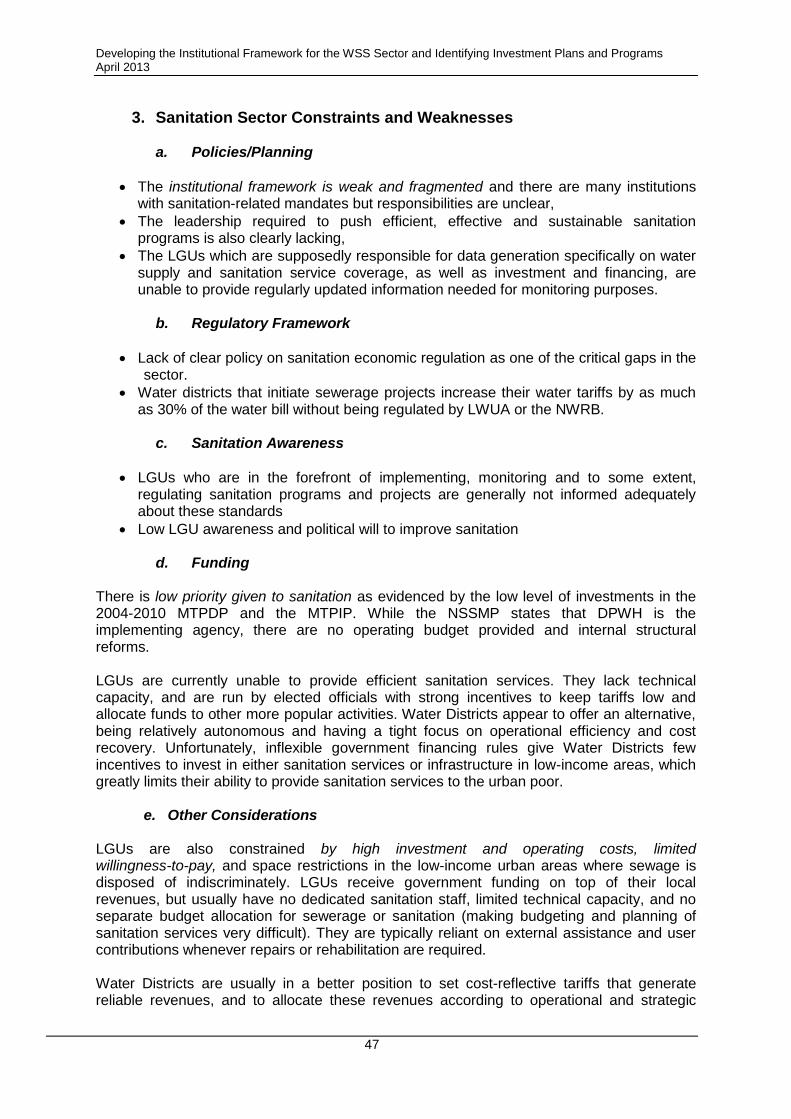
Developing the Institutional Framework for the WSS Sector and Identifying Investment Plans and Programs April 2013
47
3. Sanitation Sector Constraints and Weaknesses
a. Policies/Planning
The institutional framework is weak and fragmented and there are many institutions with sanitation-related mandates but responsibilities are unclear,
The leadership required to push efficient, effective and sustainable sanitation programs is also clearly lacking,
The LGUs which are supposedly responsible for data generation specifically on water supply and sanitation service coverage, as well as investment and financing, are unable to provide regularly updated information needed for monitoring purposes.
b. Regulatory Framework
Lack of clear policy on sanitation economic regulation as one of the critical gaps in the sector.
Water districts that initiate sewerage projects increase their water tariffs by as much as 30% of the water bill without being regulated by LWUA or the NWRB.
c. Sanitation Awareness
LGUs who are in the forefront of implementing, monitoring and to some extent, regulating sanitation programs and projects are generally not informed adequately about these standards
Low LGU awareness and political will to improve sanitation
d. Funding
There is low priority given to sanitation as evidenced by the low level of investments in the 2004-2010 MTPDP and the MTPIP. While the NSSMP states that DPWH is the implementing agency, there are no operating budget provided and internal structural reforms.
LGUs are currently unable to provide efficient sanitation services. They lack technical capacity, and are run by elected officials with strong incentives to keep tariffs low and allocate funds to other more popular activities. Water Districts appear to offer an alternative, being relatively autonomous and having a tight focus on operational efficiency and cost recovery. Unfortunately, inflexible government financing rules give Water Districts few incentives to invest in either sanitation services or infrastructure in low-income areas, which greatly limits their ability to provide sanitation services to the urban poor.
e. Other Considerations
LGUs are also constrained by high investment and operating costs, limited willingness-to-pay, and space restrictions in the low-income urban areas where sewage is disposed of indiscriminately. LGUs receive government funding on top of their local revenues, but usually have no dedicated sanitation staff, limited technical capacity, and no separate budget allocation for sewerage or sanitation (making budgeting and planning of sanitation services very difficult). They are typically reliant on external assistance and user contributions whenever repairs or rehabilitation are required.
Water Districts are usually in a better position to set cost-reflective tariffs that generate reliable revenues, and to allocate these revenues according to operational and strategic
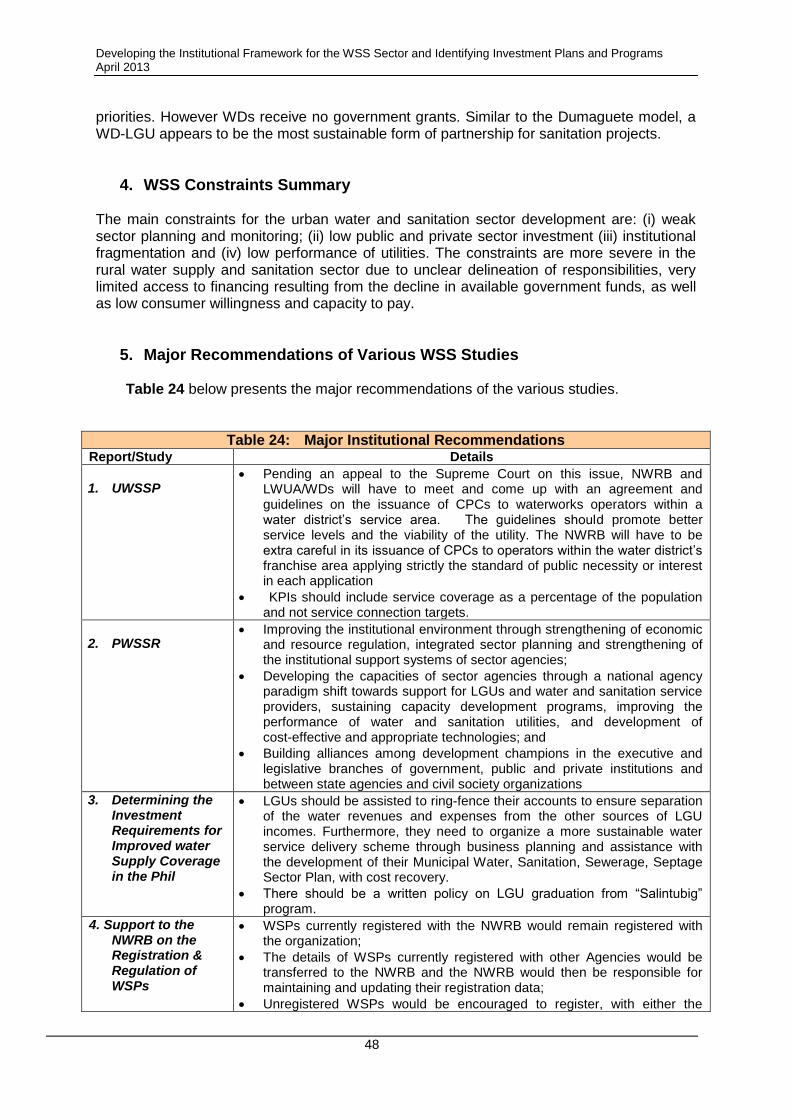
Developing the Institutional Framework for the WSS Sector and Identifying Investment Plans and Programs April 2013
48
priorities. However WDs receive no government grants. Similar to the Dumaguete model, a WD-LGU appears to be the most sustainable form of partnership for sanitation projects.
4. WSS Constraints Summary
The main constraints for the urban water and sanitation sector development are: (i) weak sector planning and monitoring; (ii) low public and private sector investment (iii) institutional fragmentation and (iv) low performance of utilities. The constraints are more severe in the rural water supply and sanitation sector due to unclear delineation of responsibilities, very limited access to financing resulting from the decline in available government funds, as well as low consumer willingness and capacity to pay.
5. Major Recommendations of Various WSS Studies
Table 24 below presents the major recommendations of the various studies.
Table 24: Major Institutional Recommendations Report/Study Details
1. UWSSP
Pending an appeal to the Supreme Court on this issue, NWRB and LWUA/WDs will have to meet and come up with an agreement and guidelines on the issuance of CPCs to waterworks operators within a water district’s service area. The guidelines should promote better service levels and the viability of the utility. The NWRB will have to be extra careful in its issuance of CPCs to operators within the water district’s franchise area applying strictly the standard of public necessity or interest in each application
KPIs should include service coverage as a percentage of the population and not service connection targets.
2. PWSSR
Improving the institutional environment through strengthening of economic and resource regulation, integrated sector planning and strengthening of the institutional support systems of sector agencies;
Developing the capacities of sector agencies through a national agency paradigm shift towards support for LGUs and water and sanitation service providers, sustaining capacity development programs, improving the performance of water and sanitation utilities, and development of cost-effective and appropriate technologies; and
Building alliances among development champions in the executive and legislative branches of government, public and private institutions and between state agencies and civil society organizations
3. Determining the Investment Requirements for Improved water Supply Coverage in the Phil
LGUs should be assisted to ring-fence their accounts to ensure separation of the water revenues and expenses from the other sources of LGU incomes. Furthermore, they need to organize a more sustainable water service delivery scheme through business planning and assistance with the development of their Municipal Water, Sanitation, Sewerage, Septage Sector Plan, with cost recovery.
There should be a written policy on LGU graduation from “Salintubig” program.
4. Support to the NWRB on the Registration & Regulation of WSPs
WSPs currently registered with the NWRB would remain registered with the organization;
The details of WSPs currently registered with other Agencies would be transferred to the NWRB and the NWRB would then be responsible for maintaining and updating their registration data;
Unregistered WSPs would be encouraged to register, with either the
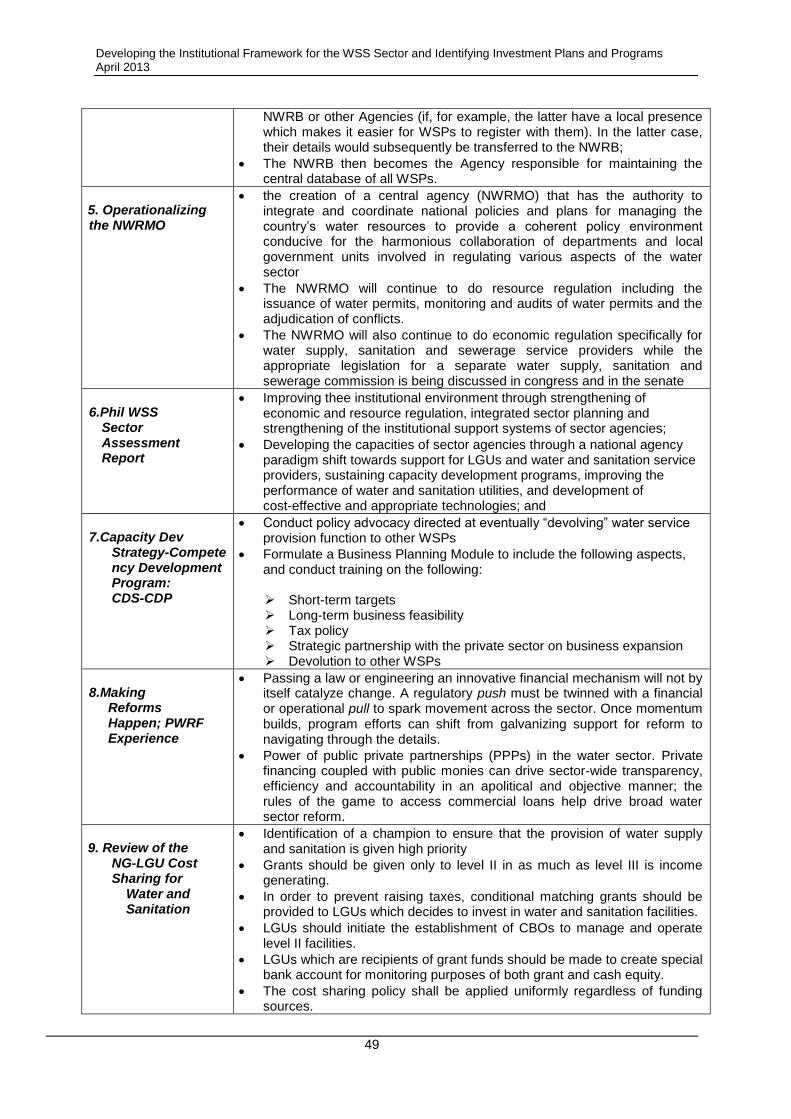
Developing the Institutional Framework for the WSS Sector and Identifying Investment Plans and Programs April 2013
49
NWRB or other Agencies (if, for example, the latter have a local presence which makes it easier for WSPs to register with them). In the latter case, their details would subsequently be transferred to the NWRB;
The NWRB then becomes the Agency responsible for maintaining the central database of all WSPs.
5. Operationalizing the NWRMO
the creation of a central agency (NWRMO) that has the authority to integrate and coordinate national policies and plans for managing the country’s water resources to provide a coherent policy environment conducive for the harmonious collaboration of departments and local government units involved in regulating various aspects of the water sector
The NWRMO will continue to do resource regulation including the issuance of water permits, monitoring and audits of water permits and the adjudication of conflicts.
The NWRMO will also continue to do economic regulation specifically for water supply, sanitation and sewerage service providers while the appropriate legislation for a separate water supply, sanitation and sewerage commission is being discussed in congress and in the senate
6.Phil WSS Sector Assessment Report
Improving thee institutional environment through strengthening of economic and resource regulation, integrated sector planning and strengthening of the institutional support systems of sector agencies;
Developing the capacities of sector agencies through a national agency paradigm shift towards support for LGUs and water and sanitation service providers, sustaining capacity development programs, improving the performance of water and sanitation utilities, and development of cost-effective and appropriate technologies; and
7.Capacity Dev
Strategy-Competency Development Program: CDS-CDP
Conduct policy advocacy directed at eventually “devolving” water service provision function to other WSPs
Formulate a Business Planning Module to include the following aspects, and conduct training on the following:
Short-term targets Long-term business feasibility Tax policy Strategic partnership with the private sector on business expansion Devolution to other WSPs
8.Making Reforms Happen; PWRF Experience
Passing a law or engineering an innovative financial mechanism will not by itself catalyze change. A regulatory push must be twinned with a financial or operational pull to spark movement across the sector. Once momentum builds, program efforts can shift from galvanizing support for reform to navigating through the details.
Power of public private partnerships (PPPs) in the water sector. Private financing coupled with public monies can drive sector-wide transparency, efficiency and accountability in an apolitical and objective manner; the rules of the game to access commercial loans help drive broad water sector reform.
9. Review of the
NG-LGU Cost Sharing for
Water and Sanitation
Identification of a champion to ensure that the provision of water supply and sanitation is given high priority
Grants should be given only to level II in as much as level III is income generating.
In order to prevent raising taxes, conditional matching grants should be provided to LGUs which decides to invest in water and sanitation facilities.
LGUs should initiate the establishment of CBOs to manage and operate level II facilities.
LGUs which are recipients of grant funds should be made to create special bank account for monitoring purposes of both grant and cash equity.
The cost sharing policy shall be applied uniformly regardless of funding sources.
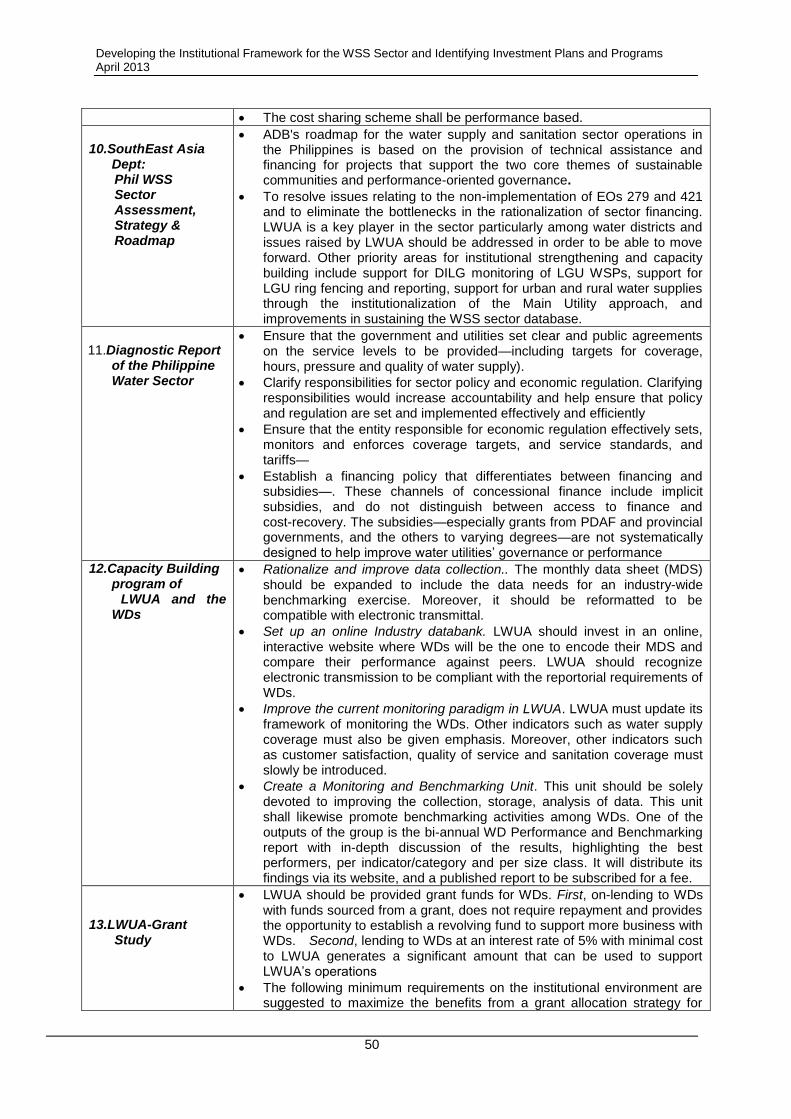
Developing the Institutional Framework for the WSS Sector and Identifying Investment Plans and Programs April 2013
50
The cost sharing scheme shall be performance based.
10.SouthEast Asia
Dept: Phil WSS Sector Assessment, Strategy & Roadmap
ADB's roadmap for the water supply and sanitation sector operations in the Philippines is based on the provision of technical assistance and financing for projects that support the two core themes of sustainable communities and performance-oriented governance.
To resolve issues relating to the non-implementation of EOs 279 and 421 and to eliminate the bottlenecks in the rationalization of sector financing. LWUA is a key player in the sector particularly among water districts and issues raised by LWUA should be addressed in order to be able to move forward. Other priority areas for institutional strengthening and capacity building include support for DILG monitoring of LGU WSPs, support for LGU ring fencing and reporting, support for urban and rural water supplies through the institutionalization of the Main Utility approach, and improvements in sustaining the WSS sector database.
11.Diagnostic Report
of the Philippine Water Sector
Ensure that the government and utilities set clear and public agreements on the service levels to be provided—including targets for coverage, hours, pressure and quality of water supply).
Clarify responsibilities for sector policy and economic regulation. Clarifying responsibilities would increase accountability and help ensure that policy and regulation are set and implemented effectively and efficiently
Ensure that the entity responsible for economic regulation effectively sets, monitors and enforces coverage targets, and service standards, and tariffs—
Establish a financing policy that differentiates between financing and subsidies—. These channels of concessional finance include implicit subsidies, and do not distinguish between access to finance and cost-recovery. The subsidies—especially grants from PDAF and provincial governments, and the others to varying degrees—are not systematically designed to help improve water utilities’ governance or performance
12.Capacity Building program of
LWUA and the WDs
Rationalize and improve data collection.. The monthly data sheet (MDS) should be expanded to include the data needs for an industry-wide benchmarking exercise. Moreover, it should be reformatted to be compatible with electronic transmittal.
Set up an online Industry databank. LWUA should invest in an online, interactive website where WDs will be the one to encode their MDS and compare their performance against peers. LWUA should recognize electronic transmission to be compliant with the reportorial requirements of WDs.
Improve the current monitoring paradigm in LWUA. LWUA must update its framework of monitoring the WDs. Other indicators such as water supply coverage must also be given emphasis. Moreover, other indicators such as customer satisfaction, quality of service and sanitation coverage must slowly be introduced.
Create a Monitoring and Benchmarking Unit. This unit should be solely devoted to improving the collection, storage, analysis of data. This unit shall likewise promote benchmarking activities among WDs. One of the outputs of the group is the bi-annual WD Performance and Benchmarking report with in-depth discussion of the results, highlighting the best performers, per indicator/category and per size class. It will distribute its findings via its website, and a published report to be subscribed for a fee.
13.LWUA-Grant Study
LWUA should be provided grant funds for WDs. First, on-lending to WDs with funds sourced from a grant, does not require repayment and provides the opportunity to establish a revolving fund to support more business with WDs. Second, lending to WDs at an interest rate of 5% with minimal cost to LWUA generates a significant amount that can be used to support LWUA’s operations
The following minimum requirements on the institutional environment are suggested to maximize the benefits from a grant allocation strategy for
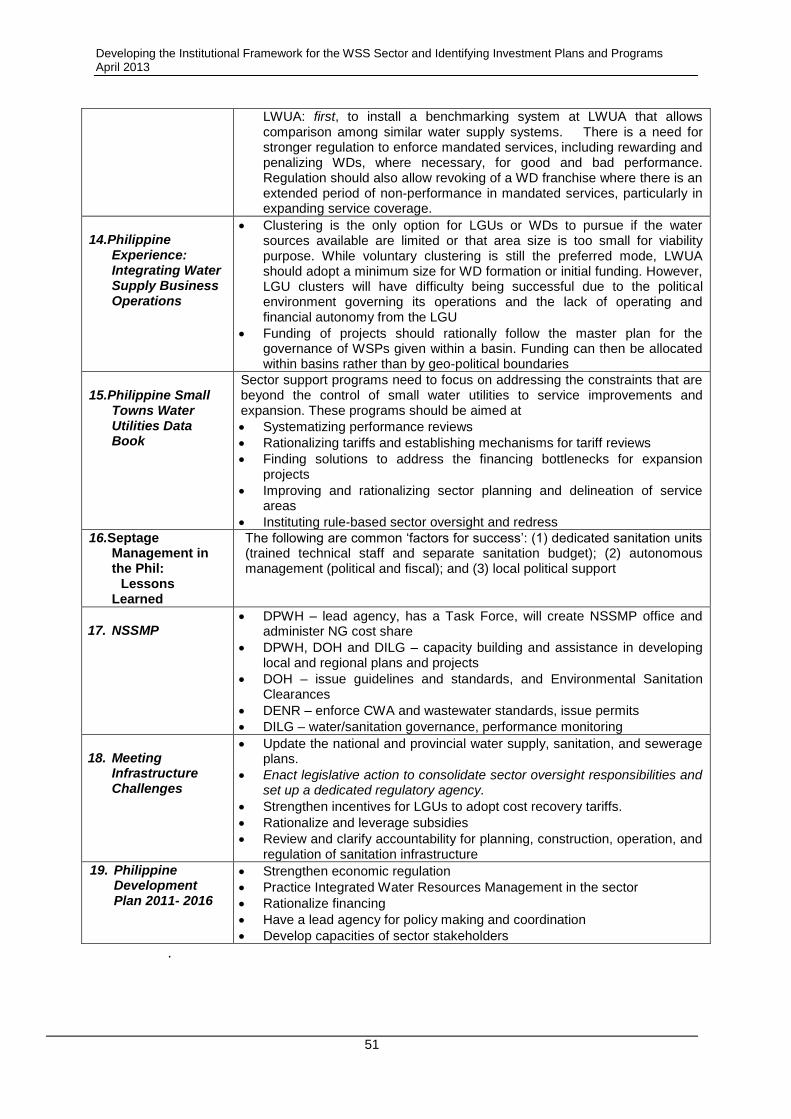
Developing the Institutional Framework for the WSS Sector and Identifying Investment Plans and Programs April 2013
51
LWUA: first, to install a benchmarking system at LWUA that allows comparison among similar water supply systems. There is a need for stronger regulation to enforce mandated services, including rewarding and penalizing WDs, where necessary, for good and bad performance. Regulation should also allow revoking of a WD franchise where there is an extended period of non-performance in mandated services, particularly in expanding service coverage.
14.Philippine
Experience: Integrating Water Supply Business Operations
Clustering is the only option for LGUs or WDs to pursue if the water sources available are limited or that area size is too small for viability purpose. While voluntary clustering is still the preferred mode, LWUA should adopt a minimum size for WD formation or initial funding. However, LGU clusters will have difficulty being successful due to the political environment governing its operations and the lack of operating and financial autonomy from the LGU
Funding of projects should rationally follow the master plan for the governance of WSPs given within a basin. Funding can then be allocated within basins rather than by geo-political boundaries
15.Philippine Small
Towns Water Utilities Data Book
Sector support programs need to focus on addressing the constraints that are beyond the control of small water utilities to service improvements and expansion. These programs should be aimed at
Systematizing performance reviews
Rationalizing tariffs and establishing mechanisms for tariff reviews
Finding solutions to address the financing bottlenecks for expansion projects
Improving and rationalizing sector planning and delineation of service areas
Instituting rule-based sector oversight and redress
16.Septage Management in the Phil:
Lessons Learned
The following are common ‘factors for success’: (1) dedicated sanitation units (trained technical staff and separate sanitation budget); (2) autonomous management (political and fiscal); and (3) local political support
17. NSSMP
DPWH – lead agency, has a Task Force, will create NSSMP office and administer NG cost share
DPWH, DOH and DILG – capacity building and assistance in developing local and regional plans and projects
DOH – issue guidelines and standards, and Environmental Sanitation Clearances
DENR – enforce CWA and wastewater standards, issue permits
DILG – water/sanitation governance, performance monitoring
18. Meeting
Infrastructure Challenges
Update the national and provincial water supply, sanitation, and sewerage plans.
Enact legislative action to consolidate sector oversight responsibilities and set up a dedicated regulatory agency.
Strengthen incentives for LGUs to adopt cost recovery tariffs.
Rationalize and leverage subsidies
Review and clarify accountability for planning, construction, operation, and regulation of sanitation infrastructure
19. Philippine Development Plan 2011- 2016
Strengthen economic regulation
Practice Integrated Water Resources Management in the sector
Rationalize financing
Have a lead agency for policy making and coordination
Develop capacities of sector stakeholders
.
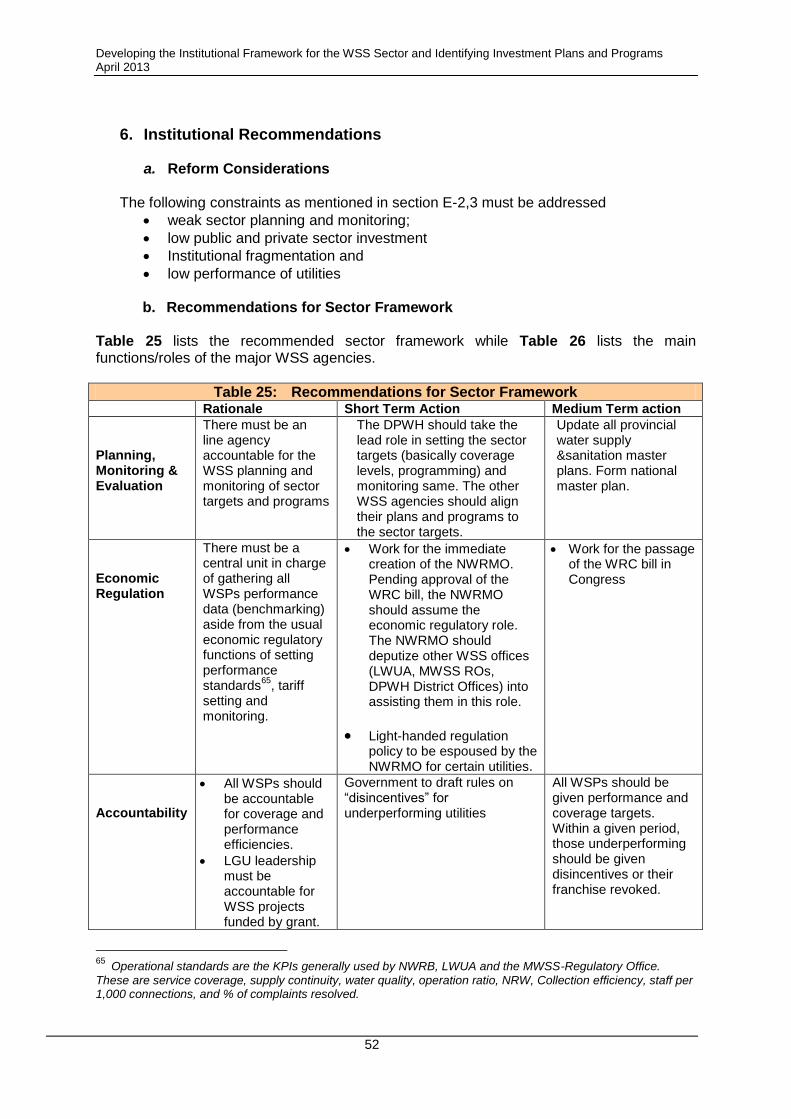
Developing the Institutional Framework for the WSS Sector and Identifying Investment Plans and Programs April 2013
52
6. Institutional Recommendations
a. Reform Considerations
The following constraints as mentioned in section E-2,3 must be addressed
weak sector planning and monitoring;
low public and private sector investment
Institutional fragmentation and
low performance of utilities b. Recommendations for Sector Framework
Table 25 lists the recommended sector framework while Table 26 lists the main functions/roles of the major WSS agencies.
Table 25: Recommendations for Sector Framework Rationale Short Term Action Medium Term action
Planning, Monitoring & Evaluation
There must be an line agency accountable for the WSS planning and monitoring of sector targets and programs
The DPWH should take the lead role in setting the sector targets (basically coverage levels, programming) and monitoring same. The other WSS agencies should align their plans and programs to the sector targets.
Update all provincial water supply &sanitation master plans. Form national master plan.
Economic Regulation
There must be a central unit in charge of gathering all WSPs performance data (benchmarking) aside from the usual economic regulatory functions of setting performance standards
65, tariff
setting and monitoring.
Work for the immediate creation of the NWRMO. Pending approval of the WRC bill, the NWRMO should assume the economic regulatory role. The NWRMO should deputize other WSS offices (LWUA, MWSS ROs, DPWH District Offices) into assisting them in this role.
Light-handed regulation policy to be espoused by the NWRMO for certain utilities.
Work for the passage of the WRC bill in Congress
Accountability
All WSPs should be accountable for coverage and performance efficiencies.
LGU leadership must be accountable for WSS projects funded by grant.
Government to draft rules on “disincentives” for underperforming utilities
All WSPs should be given performance and coverage targets. Within a given period, those underperforming should be given disincentives or their franchise revoked.
65 Operational standards are the KPIs generally used by NWRB, LWUA and the MWSS-Regulatory Office.
These are service coverage, supply continuity, water quality, operation ratio, NRW, Collection efficiency, staff per 1,000 connections, and % of complaints resolved.
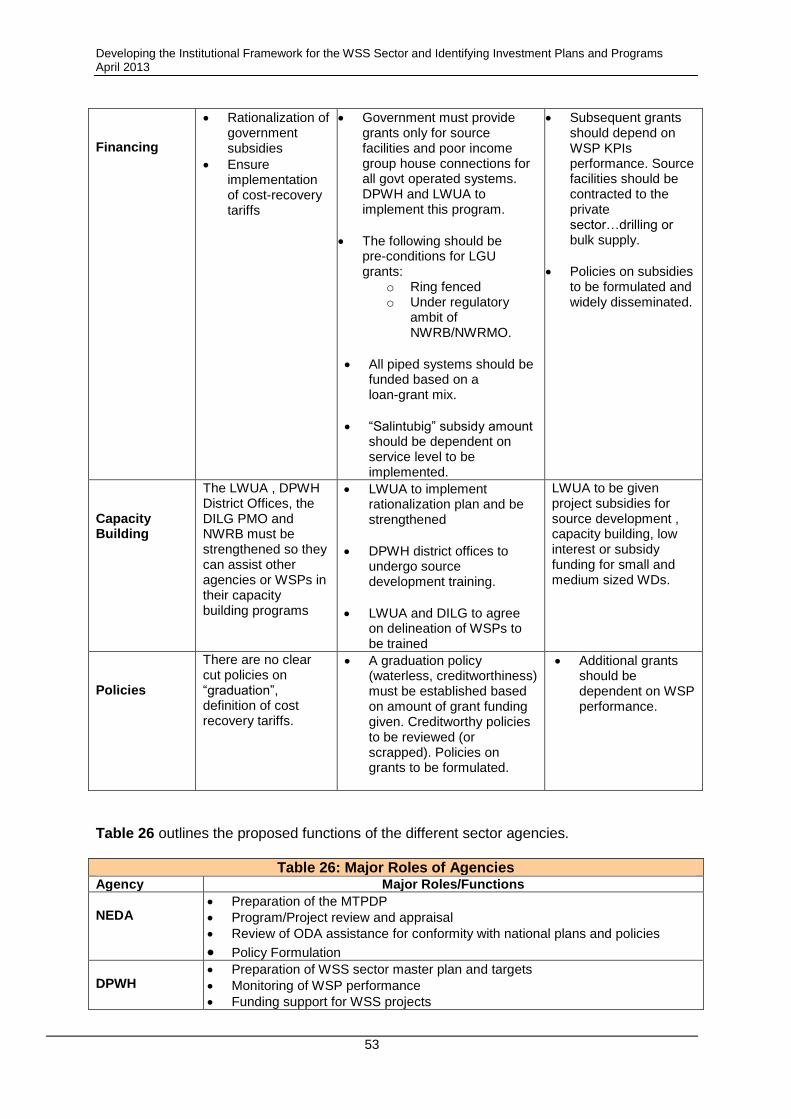
Developing the Institutional Framework for the WSS Sector and Identifying Investment Plans and Programs April 2013
53
Financing
Rationalization of government subsidies
Ensure implementation of cost-recovery tariffs
Government must provide grants only for source facilities and poor income group house connections for all govt operated systems. DPWH and LWUA to implement this program.
The following should be pre-conditions for LGU grants:
o Ring fenced o Under regulatory
ambit of NWRB/NWRMO.
All piped systems should be funded based on a loan-grant mix.
“Salintubig” subsidy amount should be dependent on service level to be implemented.
Subsequent grants should depend on WSP KPIs performance. Source facilities should be contracted to the private sector…drilling or bulk supply.
Policies on subsidies to be formulated and widely disseminated.
Capacity Building
The LWUA , DPWH District Offices, the DILG PMO and NWRB must be strengthened so they can assist other agencies or WSPs in their capacity building programs
LWUA to implement rationalization plan and be strengthened
DPWH district offices to undergo source development training.
LWUA and DILG to agree on delineation of WSPs to be trained
LWUA to be given project subsidies for source development , capacity building, low interest or subsidy funding for small and medium sized WDs.
Policies
There are no clear cut policies on “graduation”, definition of cost recovery tariffs.
A graduation policy (waterless, creditworthiness) must be established based on amount of grant funding given. Creditworthy policies to be reviewed (or scrapped). Policies on grants to be formulated.
Additional grants should be dependent on WSP performance.
Table 26 outlines the proposed functions of the different sector agencies.
Table 26: Major Roles of Agencies Agency Major Roles/Functions
NEDA
Preparation of the MTPDP
Program/Project review and appraisal
Review of ODA assistance for conformity with national plans and policies
Policy Formulation DPWH
Preparation of WSS sector master plan and targets
Monitoring of WSP performance
Funding support for WSS projects
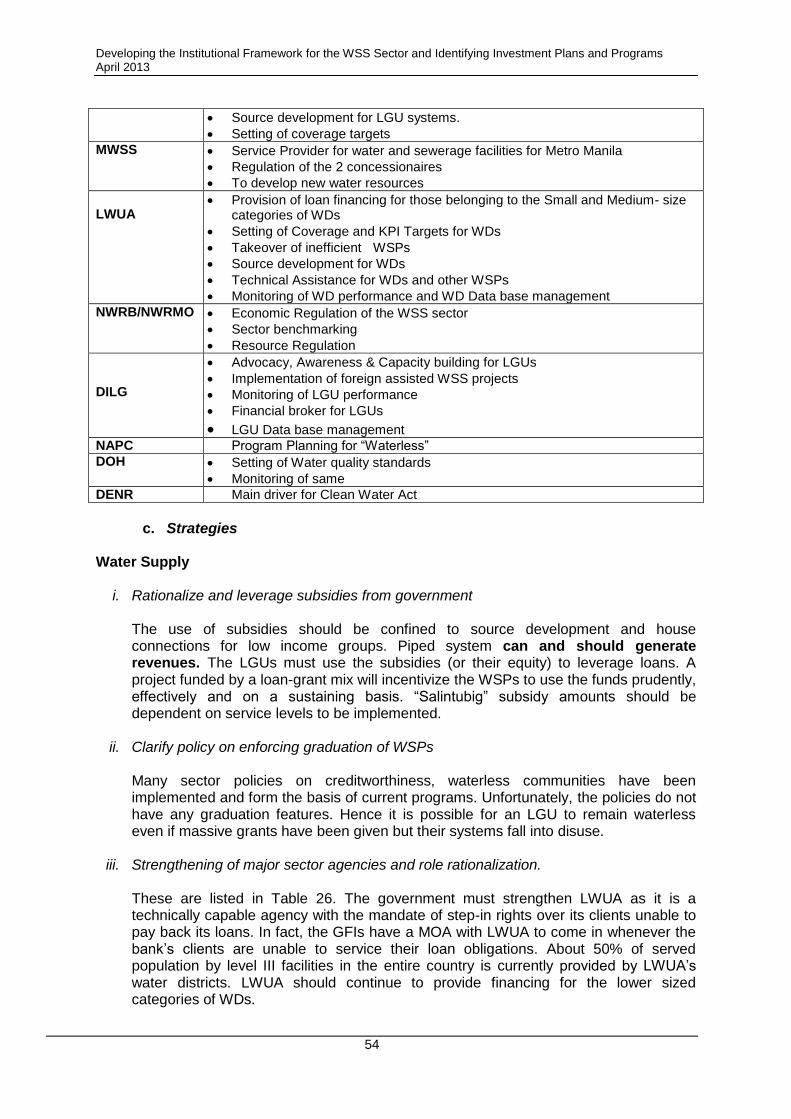
Developing the Institutional Framework for the WSS Sector and Identifying Investment Plans and Programs April 2013
54
Source development for LGU systems.
Setting of coverage targets
MWSS Service Provider for water and sewerage facilities for Metro Manila
Regulation of the 2 concessionaires
To develop new water resources
LWUA
Provision of loan financing for those belonging to the Small and Medium- size categories of WDs
Setting of Coverage and KPI Targets for WDs
Takeover of inefficient WSPs
Source development for WDs
Technical Assistance for WDs and other WSPs
Monitoring of WD performance and WD Data base management
NWRB/NWRMO Economic Regulation of the WSS sector
Sector benchmarking
Resource Regulation
DILG
Advocacy, Awareness & Capacity building for LGUs
Implementation of foreign assisted WSS projects
Monitoring of LGU performance
Financial broker for LGUs
LGU Data base management NAPC Program Planning for “Waterless”
DOH Setting of Water quality standards
Monitoring of same
DENR Main driver for Clean Water Act
c. Strategies
Water Supply
i. Rationalize and leverage subsidies from government
The use of subsidies should be confined to source development and house connections for low income groups. Piped system can and should generate revenues. The LGUs must use the subsidies (or their equity) to leverage loans. A project funded by a loan-grant mix will incentivize the WSPs to use the funds prudently, effectively and on a sustaining basis. “Salintubig” subsidy amounts should be dependent on service levels to be implemented.
ii. Clarify policy on enforcing graduation of WSPs
Many sector policies on creditworthiness, waterless communities have been implemented and form the basis of current programs. Unfortunately, the policies do not have any graduation features. Hence it is possible for an LGU to remain waterless even if massive grants have been given but their systems fall into disuse.
iii. Strengthening of major sector agencies and role rationalization.
These are listed in Table 26. The government must strengthen LWUA as it is a technically capable agency with the mandate of step-in rights over its clients unable to pay back its loans. In fact, the GFIs have a MOA with LWUA to come in whenever the bank’s clients are unable to service their loan obligations. About 50% of served population by level III facilities in the entire country is currently provided by LWUA’s water districts. LWUA should continue to provide financing for the lower sized categories of WDs.
Developing the Institutional Framework for the WSS Sector and Identifying Investment Plans and Programs April 2013
55
iv. More accountability of WSPs
Many WSPs are not really accountable for their results as there is no agency assigned to monitor performance. Furthermore, there are no dis-incentives for poor performance. Incentives and dis-incentives must be used together.
v. Centralization of Economic Regulation
There must be an agency tasked to do economic regulation (tariff setting, setting of operational standards, performance monitoring) as well as monitoring coverage levels and benchmarking.
vi. Promotion of PPP
This is to have the resources and capability of the private sector into improving sector coverage and WSP performance.
Sanitation66 The achievement of the sustainable sanitation for all is based on the following strategies:
i. Clarification of accountability for planning, construction, operation, and regulation of
sanitation infrastructure;
As it is, the responsibilities are diffused to so many agencies that no one is really accountable. LGUs should be made accountable with national agencies providing assistance.
ii. Strengthening of sanitation governance and regulatory mechanisms with the LGUs as
the principal implementers of sanitation with the support of DOH. The NWRMO can be the regulatory office for sanitation;
iii. Improving service delivery through capacity development of regional, provincial,
city/municipal officials and barangays on sustainable sanitation. Provision of technical assistance to LGUs and local utilities in planning and implementing sanitation improvements;
iv. Financing and adequate infrastructure investments to ensure that resources are
available especially for strategic approaches and for priority areas. The plans of the NSSMP must be implemented;
v. Promoting sanitation during emergency response.
The LGUs and their utilities must be given this role. The national agencies can help but the main accountable unit (LGU) must be identified; and
vi. Implementation of the Clean Water Act
The strict implementation of the CWA will reinforce the policy that sanitation should be given adequate attention by those concerned.
66
Philippine Sanitation Sector Roadmap
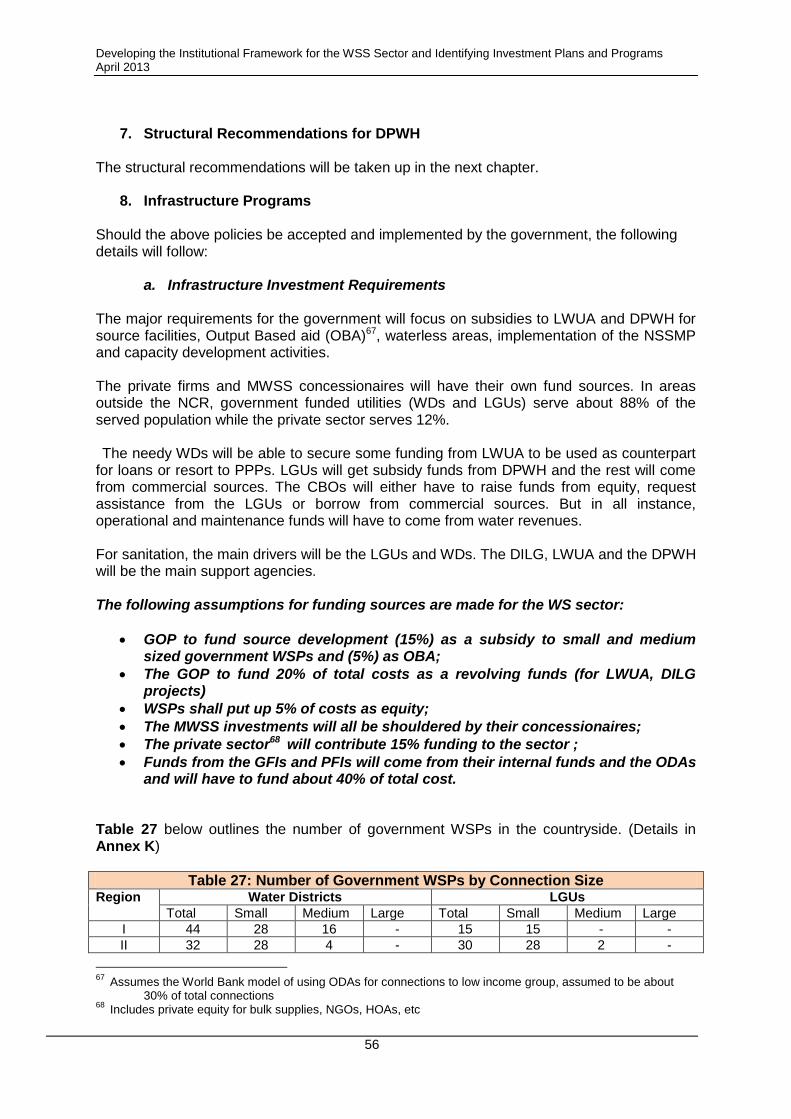
Developing the Institutional Framework for the WSS Sector and Identifying Investment Plans and Programs April 2013
56
7. Structural Recommendations for DPWH
The structural recommendations will be taken up in the next chapter.
8. Infrastructure Programs Should the above policies be accepted and implemented by the government, the following details will follow:
a. Infrastructure Investment Requirements
The major requirements for the government will focus on subsidies to LWUA and DPWH for source facilities, Output Based aid (OBA)67, waterless areas, implementation of the NSSMP and capacity development activities.
The private firms and MWSS concessionaires will have their own fund sources. In areas outside the NCR, government funded utilities (WDs and LGUs) serve about 88% of the served population while the private sector serves 12%. The needy WDs will be able to secure some funding from LWUA to be used as counterpart for loans or resort to PPPs. LGUs will get subsidy funds from DPWH and the rest will come from commercial sources. The CBOs will either have to raise funds from equity, request assistance from the LGUs or borrow from commercial sources. But in all instance, operational and maintenance funds will have to come from water revenues.
For sanitation, the main drivers will be the LGUs and WDs. The DILG, LWUA and the DPWH will be the main support agencies.
The following assumptions for funding sources are made for the WS sector:
GOP to fund source development (15%) as a subsidy to small and medium sized government WSPs and (5%) as OBA;
The GOP to fund 20% of total costs as a revolving funds (for LWUA, DILG projects)
WSPs shall put up 5% of costs as equity;
The MWSS investments will all be shouldered by their concessionaires;
The private sector68 will contribute 15% funding to the sector ;
Funds from the GFIs and PFIs will come from their internal funds and the ODAs and will have to fund about 40% of total cost.
Table 27 below outlines the number of government WSPs in the countryside. (Details in Annex K)
Table 27: Number of Government WSPs by Connection Size Region Water Districts LGUs
Total Small Medium Large Total Small Medium Large
I 44 28 16 - 15 15 - -
II 32 28 4 - 30 28 2 -
67
Assumes the World Bank model of using ODAs for connections to low income group, assumed to be about 30% of total connections 68
Includes private equity for bulk supplies, NGOs, HOAs, etc
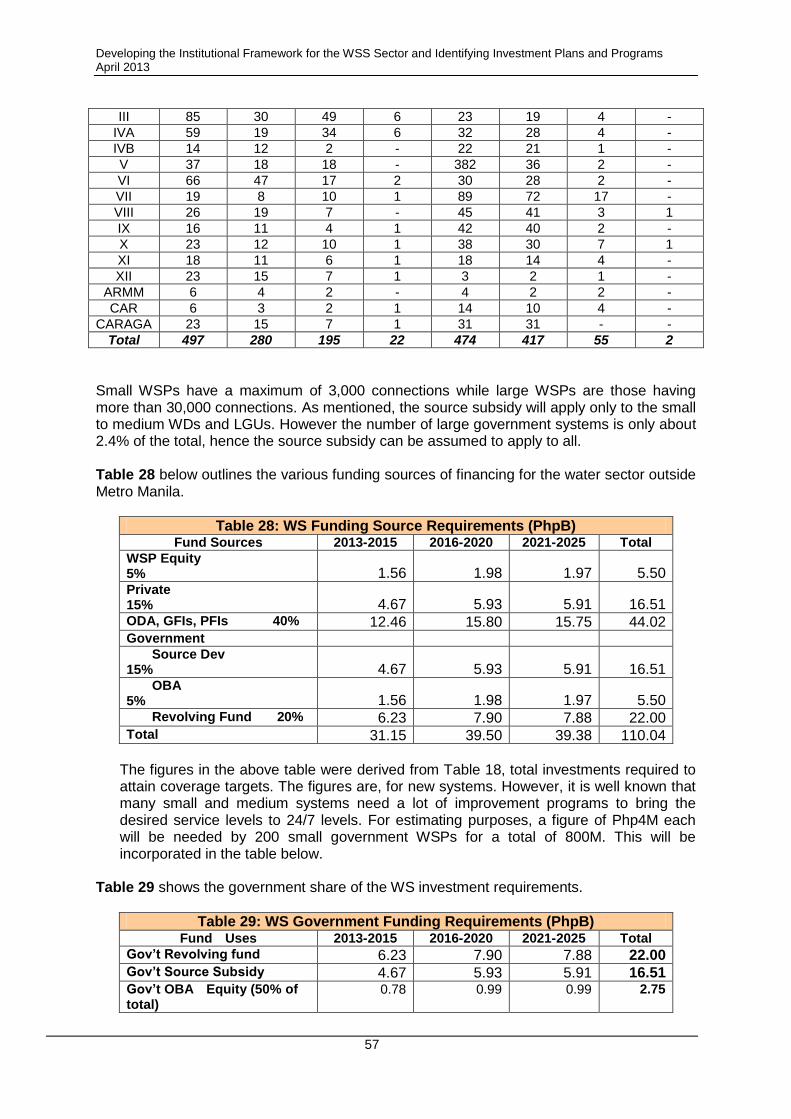
Developing the Institutional Framework for the WSS Sector and Identifying Investment Plans and Programs April 2013
57
III 85 30 49 6 23 19 4 -
IVA 59 19 34 6 32 28 4 -
IVB 14 12 2 - 22 21 1 -
V 37 18 18 - 382 36 2 -
VI 66 47 17 2 30 28 2 -
VII 19 8 10 1 89 72 17 -
VIII 26 19 7 - 45 41 3 1
IX 16 11 4 1 42 40 2 -
X 23 12 10 1 38 30 7 1
XI 18 11 6 1 18 14 4 -
XII 23 15 7 1 3 2 1 -
ARMM 6 4 2 - 4 2 2 -
CAR 6 3 2 1 14 10 4 -
CARAGA 23 15 7 1 31 31 - -
Total 497 280 195 22 474 417 55 2
Small WSPs have a maximum of 3,000 connections while large WSPs are those having more than 30,000 connections. As mentioned, the source subsidy will apply only to the small to medium WDs and LGUs. However the number of large government systems is only about 2.4% of the total, hence the source subsidy can be assumed to apply to all. Table 28 below outlines the various funding sources of financing for the water sector outside Metro Manila.
Table 28: WS Funding Source Requirements (PhpB) Fund Sources 2013-2015 2016-2020 2021-2025 Total
WSP Equity 5% 1.56 1.98 1.97 5.50 Private 15% 4.67 5.93 5.91 16.51 ODA, GFIs, PFIs 40% 12.46 15.80 15.75 44.02 Government
Source Dev 15% 4.67 5.93 5.91 16.51 OBA 5% 1.56 1.98 1.97 5.50 Revolving Fund 20% 6.23 7.90 7.88 22.00 Total 31.15 39.50 39.38 110.04
The figures in the above table were derived from Table 18, total investments required to attain coverage targets. The figures are, for new systems. However, it is well known that many small and medium systems need a lot of improvement programs to bring the desired service levels to 24/7 levels. For estimating purposes, a figure of Php4M each will be needed by 200 small government WSPs for a total of 800M. This will be incorporated in the table below.
Table 29 shows the government share of the WS investment requirements.
Table 29: WS Government Funding Requirements (PhpB) Fund Uses 2013-2015 2016-2020 2021-2025 Total
Gov’t Revolving fund 6.23 7.90 7.88 22.00 Gov’t Source Subsidy 4.67 5.93 5.91 16.51 Gov’t OBA Equity (50% of total)
0.78 0.99 0.99 2.75
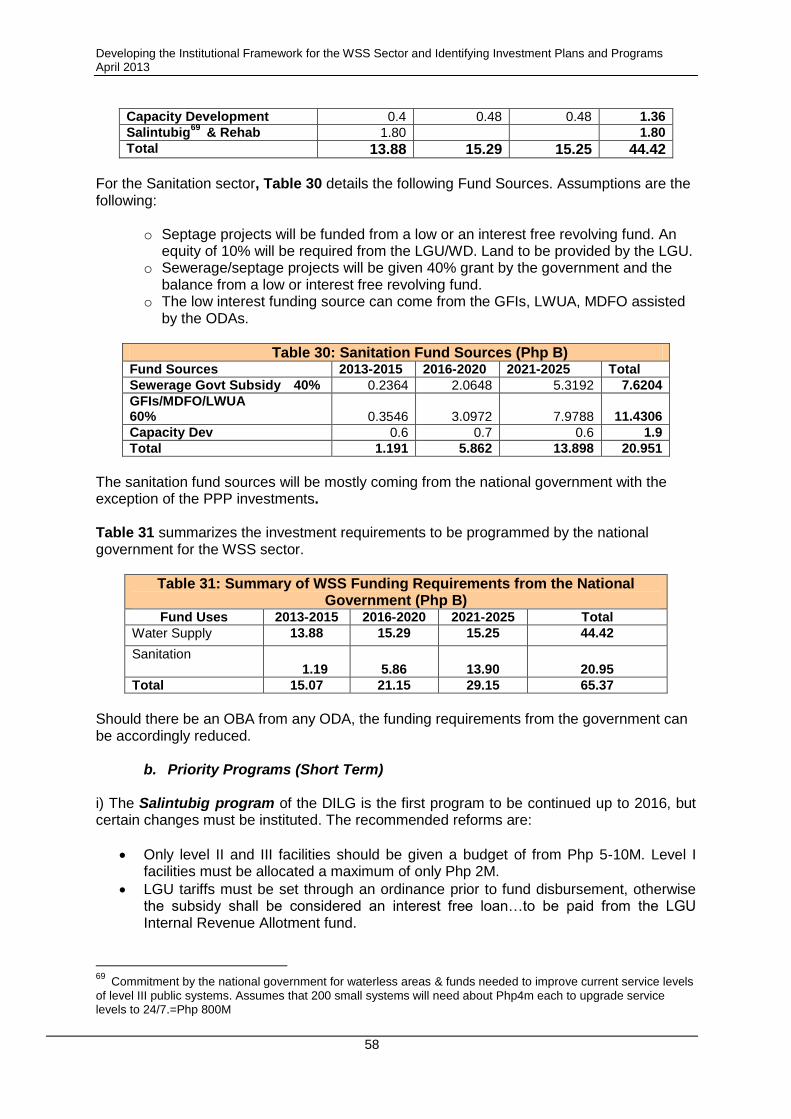
Developing the Institutional Framework for the WSS Sector and Identifying Investment Plans and Programs April 2013
58
Capacity Development 0.4 0.48 0.48 1.36
Salintubig69
& Rehab 1.80 1.80
Total 13.88 15.29 15.25 44.42
For the Sanitation sector, Table 30 details the following Fund Sources. Assumptions are the following:
o Septage projects will be funded from a low or an interest free revolving fund. An
equity of 10% will be required from the LGU/WD. Land to be provided by the LGU. o Sewerage/septage projects will be given 40% grant by the government and the
balance from a low or interest free revolving fund. o The low interest funding source can come from the GFIs, LWUA, MDFO assisted
by the ODAs.
Table 30: Sanitation Fund Sources (Php B) Fund Sources 2013-2015 2016-2020 2021-2025 Total
Sewerage Govt Subsidy 40% 0.2364 2.0648 5.3192 7.6204
GFIs/MDFO/LWUA 60% 0.3546 3.0972 7.9788 11.4306
Capacity Dev 0.6 0.7 0.6 1.9
Total 1.191 5.862 13.898 20.951
The sanitation fund sources will be mostly coming from the national government with the exception of the PPP investments. Table 31 summarizes the investment requirements to be programmed by the national government for the WSS sector.
Table 31: Summary of WSS Funding Requirements from the National Government (Php B)
Fund Uses 2013-2015 2016-2020 2021-2025 Total
Water Supply 13.88 15.29 15.25 44.42
Sanitation 1.19
5.86
13.90
20.95
Total 15.07 21.15 29.15 65.37
Should there be an OBA from any ODA, the funding requirements from the government can be accordingly reduced.
b. Priority Programs (Short Term)
i) The Salintubig program of the DILG is the first program to be continued up to 2016, but certain changes must be instituted. The recommended reforms are:
Only level II and III facilities should be given a budget of from Php 5-10M. Level I facilities must be allocated a maximum of only Php 2M.
LGU tariffs must be set through an ordinance prior to fund disbursement, otherwise the subsidy shall be considered an interest free loan…to be paid from the LGU Internal Revenue Allotment fund.
69 Commitment by the national government for waterless areas & funds needed to improve current service levels
of level III public systems. Assumes that 200 small systems will need about Php4m each to upgrade service levels to 24/7.=Php 800M
Developing the Institutional Framework for the WSS Sector and Identifying Investment Plans and Programs April 2013
59
Groundwater source development activities shall be assisted by the LWUA and DPWH technical staff.
A graduation policy for waterless communities be formulated and implemented strictly.
The implementation started in 2011 with an allocation of P 1.5 Billion to fund the capacity development and infrastructure investment requirements of waterless municipalities. ii) MDGF 1919-Enhancing Access to and Provision of Water Services with the Active Participation of the Poor This is a Joint Program (JP) implemented between and among DILG and NEDA for the Government of the Philippines and UN agencies (UNDP and UNICEF). Under the arrangement, NEDA is responsible for Outcome 1-Investment Mechanism and Policies established while DILG is responsible for Outcome 2-Enhanced Local Capacities for LGUs, Water Service Providers and communities in the pilot 36 waterless municipalities to develop, operate and maintain the potable water supply systems. The JP is funded by the Spanish Grant Achievement Fund amounting to $ 5.374 M and implemented starting June 2009 and supposed to end May 2013 but the timetable has been extended. iii) The LWUA must be rehabilitated through implementation of its rationalization program and be recapitalized or provided funds for projects which should be transformed into a revolving fund. These funds can be used also as counterpart funds for ODA loans. To start the rehabilitation of LWUA, the Secretary of the DPWH should instruct his representative to join the LWUA Board in order to establish a quorum.70 Then LWUA should be given funding as a counterpart to its pending ODA assisted projects.
iv) A capacity development program should be developed and funds should be allocated between the DILG and LWUA. A MOA should be agreed upon between the two institutions on roles, coverage and strategies to be adopted.
Establishment/Strengthening of Regional WATSAN Hubs: This is currently being promoted by DILG to ensure sustainability in the delivery of capacity development interventions to the LGUs, Water Service Providers specifically LGU-managed water supply systems and Rural/Barangay Waterworks Associations (BWSAs) and communities. The DILG will be establishing Regional Water Supply and Sanitation Hubs across the country to provide/cater to the capacity development requirements. The Hubs will be composed of Academe, Local Research Institutes, Water Supply Service Providers e.g. WDs, CSOs/NGOs, Private Sector e.g. Consulting Firms, Drillers, Contractors who will be responsible for capacitating the LGUs and WSPs from planning, implementing, operating and managing the water supply and sanitation services to ensure sustainability.
The drawback to this program, as again, is that the accountabilities are diffused.
v) The programs envisioned by the NSSMP should be implemented but reviewed to provide some subsidy even for septage projects and a subsidy larger than 40% for sewerage projects for HUCs.
vi) DPWH must work for the implementation of the OBA program on a national scale.
70
According to EO 62 series 2011, the Sec of the DPWH is an ex-officio LWUA Board member.
Developing the Institutional Framework for the WSS Sector and Identifying Investment Plans and Programs April 2013
60
9. Other Recommendations
a. WSPs All CBOs should be encouraged to transform themselves into cooperatives or water districts. Cooperatives and WDs have the ability to raise equity funds and have the corporate personality to access funds from GFIs.
b. Implementing OBAs
Should OBAs be possible, there would be requirements for implementation. These are an implementing agency, government counterpart funds and a validating agency. Either LWUA or the DPWH can be the implementing or validating agency. The GFIs can be the repository bank and the counterpart fund can come from the revolving fund subsidy.
c. Role of DPWH The DPWH should assume a dominant role in the sector. Specific recommendations are covered in the next chapter.
d. LGU WSS Funding
Aside from the source subsidy funds, government funding to the LGUs should be coursed through the MDFO or the appropriate GFIs. The MDFO can handle the funding through its regular water and environmental projects for the LGUs.
Developing the Institutional Framework for the WSS Sector and Identifying Investment Plans and Programs April 2013
61
F. ACTION PLANNING FOR THE DPWH
1. THE DPWH
Mandate The Department of Public Works and Highways (DPWH) is one of the three departments of the government undertaking major infrastructure projects. The DPWH is mandated to undertake (a) the planning of infrastructure, such as national roads and bridges, flood control, water resources projects and other public works; and (b) the design, construction, and maintenance of national roads and bridges, and major flood control systems. Functions The DPWH functions as the engineering and construction arm of the Government tasked to continuously develop its technology for the purpose of ensuring the safety of all infrastructure facilities and securing for all public works and highways the highest efficiency and quality in construction. DPWH is currently responsible for the planning, design, construction and maintenance of infrastructure, especially the national highways, flood control and water resources development system, and other public works in accordance with national development objectives. Current Structure The DPWH has five (5) bureaus, six (6) services, 16 regional offices, 24 project management offices, 16 regional equipment services and 118 district engineering offices. There is no dedicated unit for the WSS sector.
2. DPWH WSS SECTOR ROLE
While the DPWH is the primary infrastructure agency of the government, its role in the WSS had been diminished in the past due to the creation of dedicated water agencies71, the LGU Code, NEDA Board Resolutions, and the active role of other Departments in the sector. There are about 16 agencies with various roles within the WSS sector. And the PWSSR lists the function of DPWH as “provision of technical support to LGUs upon request including implementation of Level I and II projects.”
a. Sector Constraints and Weaknesses
Based on the previous chapter, the following are the major sector deficiencies:
o Regulation/Monitoring There is no agency that sets and monitors coverage targets
and operational standards of WSPs. The NWRB, LWUA, and LGU, cover different WSPs and many more operate on, “contract-based regulation i.e. MWSS and SBWRB72. There is no agency tasked with centralized stock taking of activities within the sector and validating same.
71
MWSS, LWUA, RWDC, NWRB 72
Subic Bay Water Regulatory Board
Developing the Institutional Framework for the WSS Sector and Identifying Investment Plans and Programs April 2013
62
o Financing: Financing packages tend to cater only to credit-worthy utilities with no
concessional financing for the non-credit worthy or those that are still in the process of becoming credit worthy.
There is low priority given to sanitation as evidenced by the low level of investments in the 2004-2010 MTPDP and the MTPIP. While the NSSMP states that DPWH is the implementing agency, there are no operating budget and internal structural reforms.
o Planning/Policy/Programming: Planning at all levels is hampered by lack of
reliable data and the absence of a systematic and regular monitoring of sector activities at the LGU level. Many of the earlier provincial master plans and investment plans for Level I and II systems are based on decades-old designs without updated information on hydro-geologic and water resource conditions in the planning area. There is lack of updated local master plans, as well as lack of and oftentimes conflicting sector information.
Without data, it is difficult for the government and for users of services to assess critical aspects such as the efficiency of services provided and the quality of services. The lack of such vital information makes it difficult for the government to formulate policies, track progress overtime, or hold agencies and service providers more accountable.
o Reform Accountability: No one is clearly accountable for implementing the
reforms—there are a multitude of agencies involved in the sector. Each agency has its respective role in the sector, and because the reform process cuts across the mandates of all agencies, they must all be involved. This means that decisions are usually made by committees, and the responsibility for implementation is often diluted. This lack of accountability for implementing the reforms has affected most reform initiatives in the sector. For example, regarding reform proposals on sector financing, no single agency has had the responsibility for ensuring that financing was available for the WSS sector and the mandate to make sure that there were policies in place to make this a reality. The leadership required to push efficient, effective and sustainable sanitation programs is clearly lacking.
LGUs are constrained by high investment and operating costs, limited willingness-to-pay, and space restrictions in the low-income urban areas where sewage is disposed of indiscriminately. LGUs receive government funding on top of their local revenues, but usually have no dedicated sanitation staff, limited technical capacity, and no separate budget allocation for sewerage or sanitation (making budgeting and planning of sanitation services very difficult). They are typically reliant on external assistance and user contributions whenever repairs or rehabilitation are required.
b. Proposed Roles of the DPWH
With the MWSS and LWUA now under the policy control of the DPWH, the agency can and should assume a dominant role in the WSS sector.
Table 32 lists the proposed major roles of the DPWH in the sector to eliminate or minimize the sector deficiencies:
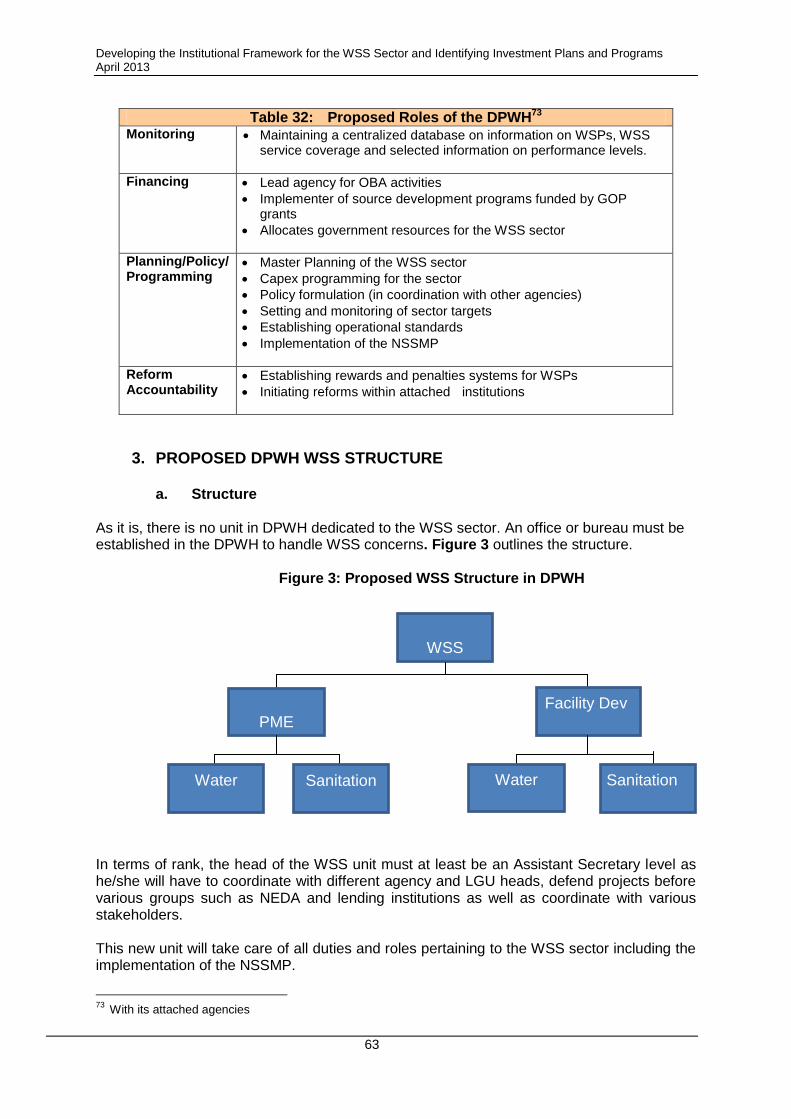
Developing the Institutional Framework for the WSS Sector and Identifying Investment Plans and Programs April 2013
63
Table 32: Proposed Roles of the DPWH73 Monitoring Maintaining a centralized database on information on WSPs, WSS
service coverage and selected information on performance levels.
Financing Lead agency for OBA activities
Implementer of source development programs funded by GOP grants
Allocates government resources for the WSS sector
Planning/Policy/ Programming
Master Planning of the WSS sector
Capex programming for the sector
Policy formulation (in coordination with other agencies)
Setting and monitoring of sector targets
Establishing operational standards
Implementation of the NSSMP
Reform Accountability
Establishing rewards and penalties systems for WSPs
Initiating reforms within attached institutions
3. PROPOSED DPWH WSS STRUCTURE
a. Structure
As it is, there is no unit in DPWH dedicated to the WSS sector. An office or bureau must be established in the DPWH to handle WSS concerns. Figure 3 outlines the structure.
Figure 3: Proposed WSS Structure in DPWH
In terms of rank, the head of the WSS unit must at least be an Assistant Secretary level as he/she will have to coordinate with different agency and LGU heads, defend projects before various groups such as NEDA and lending institutions as well as coordinate with various stakeholders.
This new unit will take care of all duties and roles pertaining to the WSS sector including the implementation of the NSSMP.
73
With its attached agencies
WSS
Facility Dev PME
Sanitation Water Sanitation Water
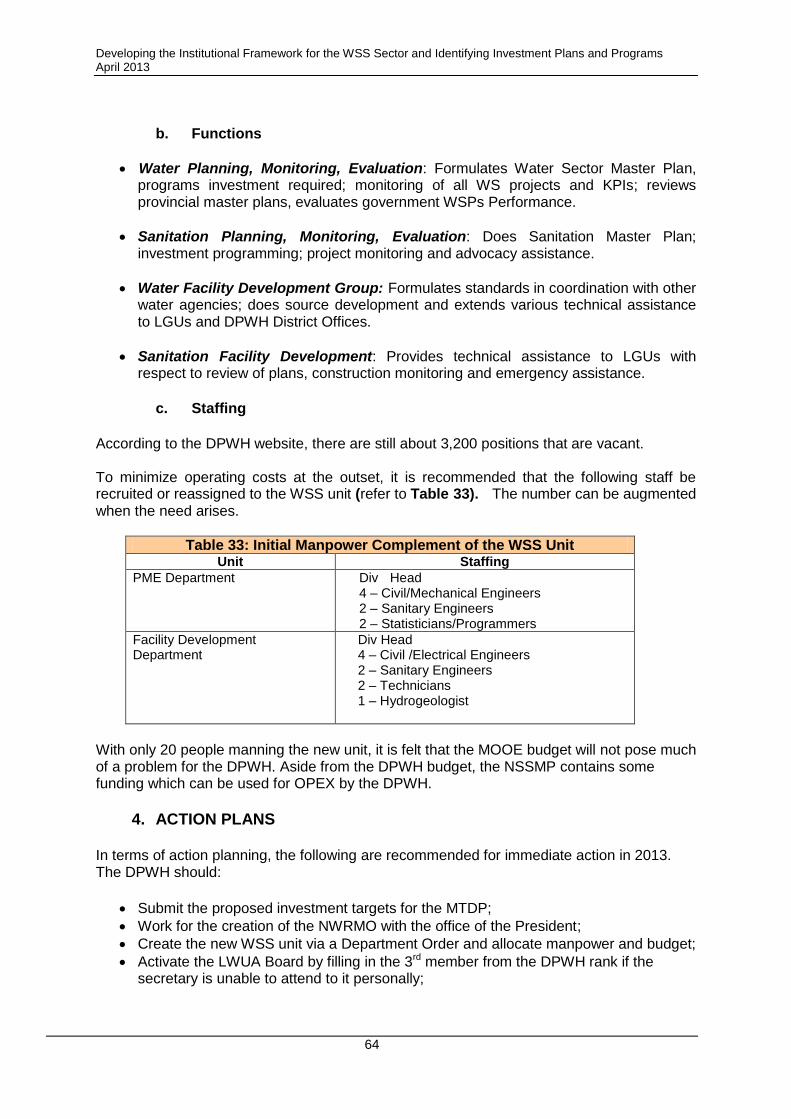
Developing the Institutional Framework for the WSS Sector and Identifying Investment Plans and Programs April 2013
64
b. Functions
Water Planning, Monitoring, Evaluation: Formulates Water Sector Master Plan, programs investment required; monitoring of all WS projects and KPIs; reviews provincial master plans, evaluates government WSPs Performance.
Sanitation Planning, Monitoring, Evaluation: Does Sanitation Master Plan; investment programming; project monitoring and advocacy assistance.
Water Facility Development Group: Formulates standards in coordination with other water agencies; does source development and extends various technical assistance to LGUs and DPWH District Offices.
Sanitation Facility Development: Provides technical assistance to LGUs with respect to review of plans, construction monitoring and emergency assistance.
c. Staffing
According to the DPWH website, there are still about 3,200 positions that are vacant. To minimize operating costs at the outset, it is recommended that the following staff be recruited or reassigned to the WSS unit (refer to Table 33). The number can be augmented when the need arises.
Table 33: Initial Manpower Complement of the WSS Unit Unit Staffing
PME Department Div Head 4 – Civil/Mechanical Engineers 2 – Sanitary Engineers 2 – Statisticians/Programmers
Facility Development Department
Div Head 4 – Civil /Electrical Engineers 2 – Sanitary Engineers 2 – Technicians 1 – Hydrogeologist
With only 20 people manning the new unit, it is felt that the MOOE budget will not pose much of a problem for the DPWH. Aside from the DPWH budget, the NSSMP contains some funding which can be used for OPEX by the DPWH.
4. ACTION PLANS
In terms of action planning, the following are recommended for immediate action in 2013. The DPWH should:
Submit the proposed investment targets for the MTDP;
Work for the creation of the NWRMO with the office of the President;
Create the new WSS unit via a Department Order and allocate manpower and budget;
Activate the LWUA Board by filling in the 3rd member from the DPWH rank if the secretary is unable to attend to it personally;
Developing the Institutional Framework for the WSS Sector and Identifying Investment Plans and Programs April 2013
65
Discuss with DOF and DILG the streamlining of sector policies, financing and programs;
Prepare sector master plans (water and sanitation);
Discuss with IBRD and NEDA the creation of the OBA program on a national scale;
Discuss with ODAs financing packages for the WSS sector;
Agree with DILG and DENR on implementation of the NSSMP;
Prepare a WSS sector program;
Secure technical assistance for LWUA rehabilitation and the DPWH WSS Unit capacity development.
Developing the Institutional Framework for the WSS Sector and Identifying Investment Plans and Programs April 2013
66
List of Annexes
ANNEX A: TERMS OF REFERENCE ANNEX B: SUMMARY OF POPULATION PROJECTIONS ANNEX C: SAMPLE LETTER OF DPWH SECRETARY SENT TO VARIOUS GOV’T AGENCIES ANNEX D: THE DATA TEMPLATE ANNEX E: POPULATION SERVED BY LEVEL III AND LEVEL II FOR YR 2011 BY REGION ANNEX F: NUMBER OF WATER SUPPLY PROVIDERS ANNEX G: SEVENTY FIVE (75) DATA SAMPLES ANNEX H: LEVEL III UNIT COSTS FOR ALL THE MAIN ISLAND LOCATIONS ANNEX I: LEVEL III UNIT COST DERIVED BY CONSIDERING ALL THE SEVENTY FIVE (75) DATA SAMPLES ANNEX J: AVERAGE COST OF AN UPGRADABLE LEVEL II ANNEX K: BREAKDOWN OF WDS AND LGU WSPs
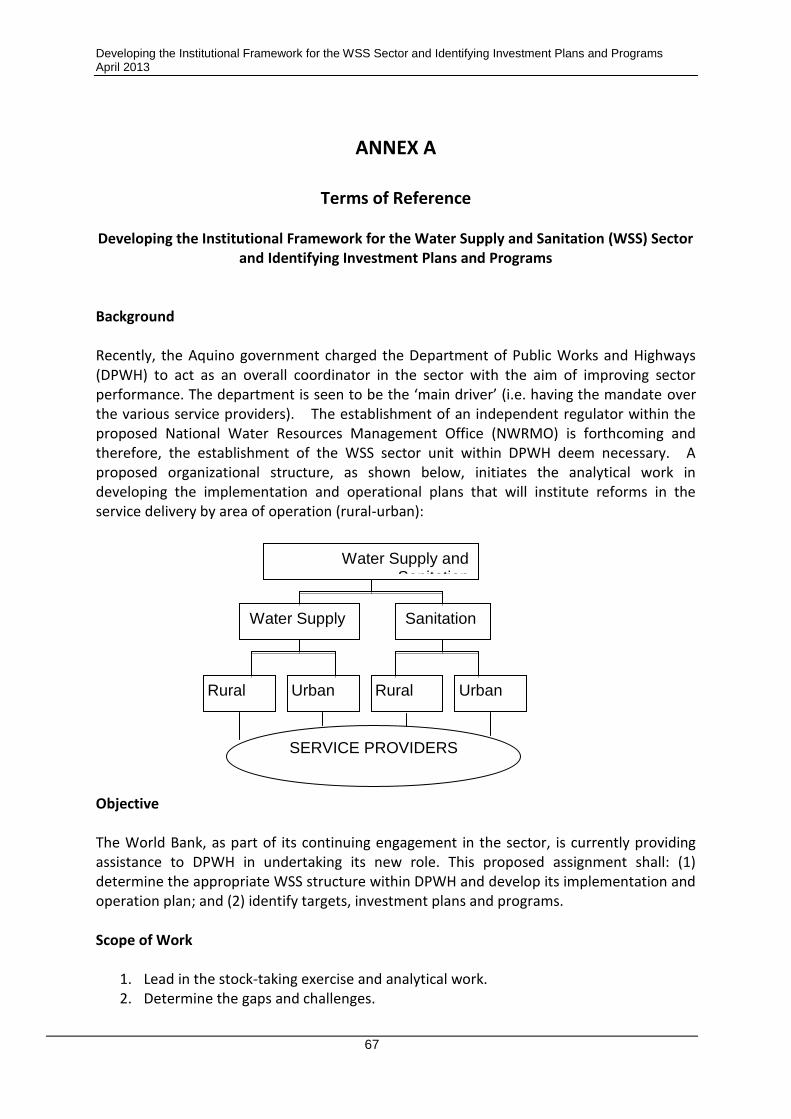
Developing the Institutional Framework for the WSS Sector and Identifying Investment Plans and Programs April 2013
67
ANNEX A
Terms of Reference
Developing the Institutional Framework for the Water Supply and Sanitation (WSS) Sector
and Identifying Investment Plans and Programs
Background Recently, the Aquino government charged the Department of Public Works and Highways (DPWH) to act as an overall coordinator in the sector with the aim of improving sector performance. The department is seen to be the ‘main driver’ (i.e. having the mandate over the various service providers). The establishment of an independent regulator within the proposed National Water Resources Management Office (NWRMO) is forthcoming and therefore, the establishment of the WSS sector unit within DPWH deem necessary. A proposed organizational structure, as shown below, initiates the analytical work in developing the implementation and operational plans that will institute reforms in the service delivery by area of operation (rural-urban):
Objective The World Bank, as part of its continuing engagement in the sector, is currently providing assistance to DPWH in undertaking its new role. This proposed assignment shall: (1) determine the appropriate WSS structure within DPWH and develop its implementation and operation plan; and (2) identify targets, investment plans and programs. Scope of Work
1. Lead in the stock-taking exercise and analytical work. 2. Determine the gaps and challenges.
Water Supply and Sanitation
Water Supply Sanitation
Rural Urban Rural Urban
SERVICE PROVIDERS
Developing the Institutional Framework for the WSS Sector and Identifying Investment Plans and Programs April 2013
68
3. Develop an institutional framework of the WSS sector within DPWH and develop implementation and operational plan.
4. Identify (politically) feasible actions or policy recommendations to improve the service provision:
a. Determine interim or ‘quick-wins’ actions that can be undertaken. b. Identify key elements that can be changed gradually in the
short-to-medium-term (evolving role of LWUA, WDs, LGUs, etc.) and provide recommendation on how to bring about these changes
5. For each of the recommendations, identify: a. Rationale for any recommended changes, i.e. problems or challenges that the
recommended changes will be addressing b. Policy instruments (E.O., Administrative Orders, etc.) needed to implement
the changes c. Action plan for implementing the recommendations d. Key players involved e. Expected outcomes
6. Develop a Policy Note and presentation materials for government decision makers based on the above work.
Selection Criteria The consultant should have management and leadership skills, must have at least 10 years actual experience in the sector in both urban and rural projects, and must have working experience in a water sector government agency. Timeframe: The work will be undertaken up to 3 months
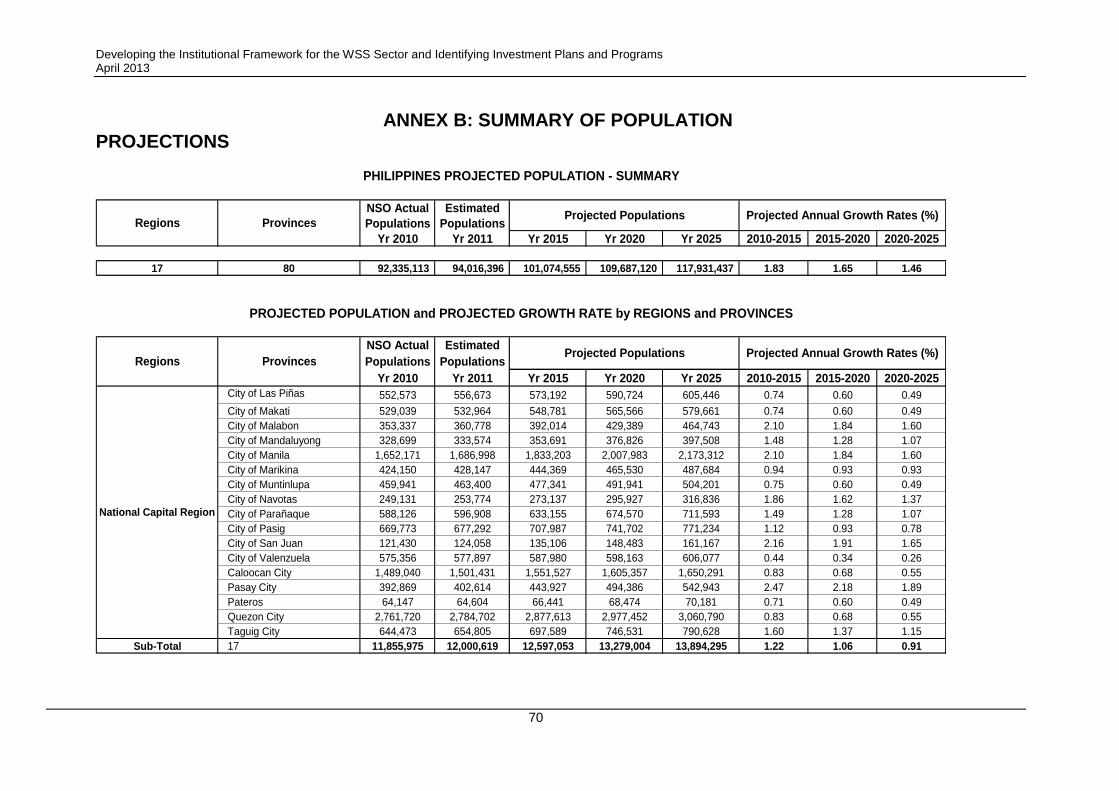
Developing the Institutional Framework for the WSS Sector and Identifying Investment Plans and Programs April 2013
70
ANNEX B: SUMMARY OF POPULATION PROJECTIONS
NSO Actual Estimated
Populations Populations
Yr 2010 Yr 2011 Yr 2015 Yr 2020 Yr 2025 2010-2015 2015-2020 2020-2025
17 80 92,335,113 94,016,396 101,074,555 109,687,120 117,931,437 1.83 1.65 1.46
NSO Actual Estimated
Populations Populations
Yr 2010 Yr 2011 Yr 2015 Yr 2020 Yr 2025 2010-2015 2015-2020 2020-2025
City of Las Piñas 552,573 556,673 573,192 590,724 605,446 0.74 0.60 0.49
City of Makati 529,039 532,964 548,781 565,566 579,661 0.74 0.60 0.49
City of Malabon 353,337 360,778 392,014 429,389 464,743 2.10 1.84 1.60
City of Mandaluyong 328,699 333,574 353,691 376,826 397,508 1.48 1.28 1.07
City of Manila 1,652,171 1,686,998 1,833,203 2,007,983 2,173,312 2.10 1.84 1.60
City of Marikina 424,150 428,147 444,369 465,530 487,684 0.94 0.93 0.93
City of Muntinlupa 459,941 463,400 477,341 491,941 504,201 0.75 0.60 0.49
City of Navotas 249,131 253,774 273,137 295,927 316,836 1.86 1.62 1.37
City of Parañaque 588,126 596,908 633,155 674,570 711,593 1.49 1.28 1.07
City of Pasig 669,773 677,292 707,987 741,702 771,234 1.12 0.93 0.78
City of San Juan 121,430 124,058 135,106 148,483 161,167 2.16 1.91 1.65
City of Valenzuela 575,356 577,897 587,980 598,163 606,077 0.44 0.34 0.26
Caloocan City 1,489,040 1,501,431 1,551,527 1,605,357 1,650,291 0.83 0.68 0.55
Pasay City 392,869 402,614 443,927 494,386 542,943 2.47 2.18 1.89
Pateros 64,147 64,604 66,441 68,474 70,181 0.71 0.60 0.49
Quezon City 2,761,720 2,784,702 2,877,613 2,977,452 3,060,790 0.83 0.68 0.55
Taguig City 644,473 654,805 697,589 746,531 790,628 1.60 1.37 1.15
Sub-Total 17 11,855,975 12,000,619 12,597,053 13,279,004 13,894,295 1.22 1.06 0.91
National Capital Region
PROJECTED POPULATION and PROJECTED GROWTH RATE by REGIONS and PROVINCES
Regions ProvincesProjected Populations Projected Annual Growth Rates (%)
PHILIPPINES PROJECTED POPULATION - SUMMARY
Regions ProvincesProjected Populations Projected Annual Growth Rates (%)
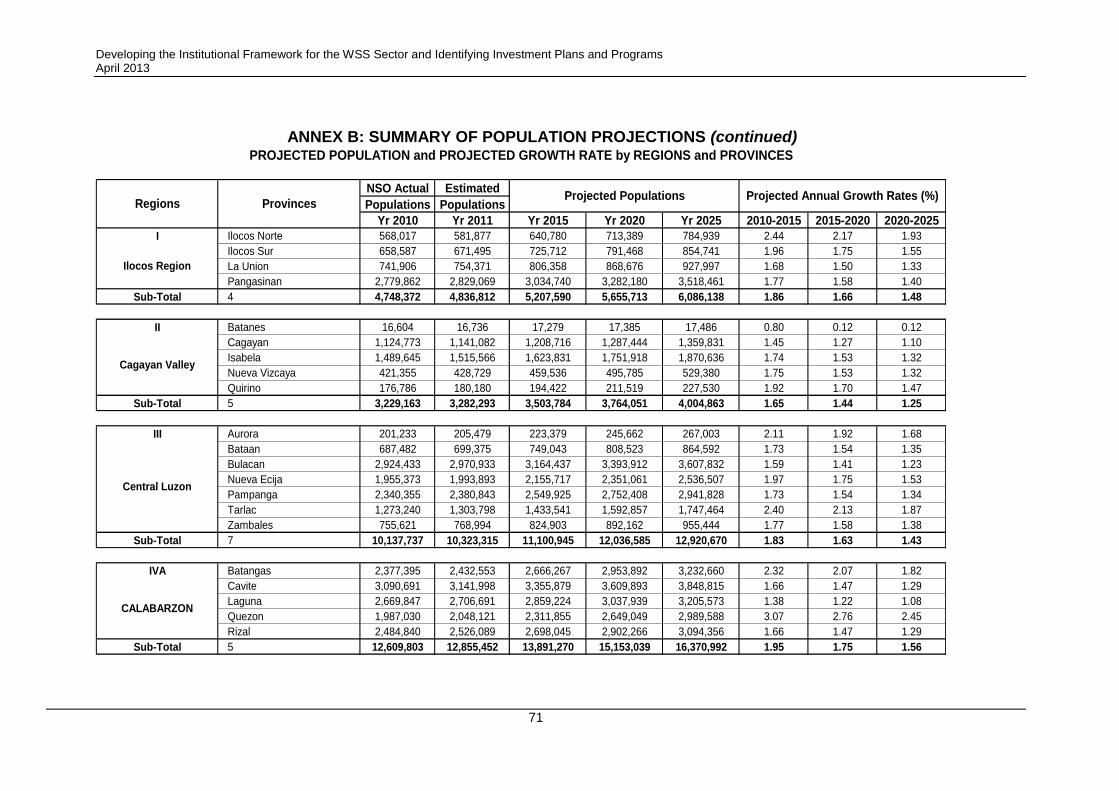
Developing the Institutional Framework for the WSS Sector and Identifying Investment Plans and Programs April 2013
71
ANNEX B: SUMMARY OF POPULATION PROJECTIONS (continued)
NSO Actual Estimated
Populations Populations
Yr 2010 Yr 2011 Yr 2015 Yr 2020 Yr 2025 2010-2015 2015-2020 2020-2025
I Ilocos Norte 568,017 581,877 640,780 713,389 784,939 2.44 2.17 1.93
Ilocos Sur 658,587 671,495 725,712 791,468 854,741 1.96 1.75 1.55
La Union 741,906 754,371 806,358 868,676 927,997 1.68 1.50 1.33
Pangasinan 2,779,862 2,829,069 3,034,740 3,282,180 3,518,461 1.77 1.58 1.40
Sub-Total 4 4,748,372 4,836,812 5,207,590 5,655,713 6,086,138 1.86 1.66 1.48
II Batanes 16,604 16,736 17,279 17,385 17,486 0.80 0.12 0.12
Cagayan 1,124,773 1,141,082 1,208,716 1,287,444 1,359,831 1.45 1.27 1.10
Isabela 1,489,645 1,515,566 1,623,831 1,751,918 1,870,636 1.74 1.53 1.32
Nueva Vizcaya 421,355 428,729 459,536 495,785 529,380 1.75 1.53 1.32
Quirino 176,786 180,180 194,422 211,519 227,530 1.92 1.70 1.47
Sub-Total 5 3,229,163 3,282,293 3,503,784 3,764,051 4,004,863 1.65 1.44 1.25
III Aurora 201,233 205,479 223,379 245,662 267,003 2.11 1.92 1.68
Bataan 687,482 699,375 749,043 808,523 864,592 1.73 1.54 1.35
Bulacan 2,924,433 2,970,933 3,164,437 3,393,912 3,607,832 1.59 1.41 1.23
Nueva Ecija 1,955,373 1,993,893 2,155,717 2,351,061 2,536,507 1.97 1.75 1.53
Pampanga 2,340,355 2,380,843 2,549,925 2,752,408 2,941,828 1.73 1.54 1.34
Tarlac 1,273,240 1,303,798 1,433,541 1,592,857 1,747,464 2.40 2.13 1.87
Zambales 755,621 768,994 824,903 892,162 955,444 1.77 1.58 1.38
Sub-Total 7 10,137,737 10,323,315 11,100,945 12,036,585 12,920,670 1.83 1.63 1.43
IVA Batangas 2,377,395 2,432,553 2,666,267 2,953,892 3,232,660 2.32 2.07 1.82
Cavite 3,090,691 3,141,998 3,355,879 3,609,893 3,848,815 1.66 1.47 1.29
Laguna 2,669,847 2,706,691 2,859,224 3,037,939 3,205,573 1.38 1.22 1.08
Quezon 1,987,030 2,048,121 2,311,855 2,649,049 2,989,588 3.07 2.76 2.45
Rizal 2,484,840 2,526,089 2,698,045 2,902,266 3,094,356 1.66 1.47 1.29
Sub-Total 5 12,609,803 12,855,452 13,891,270 15,153,039 16,370,992 1.95 1.75 1.56
Ilocos Region
Cagayan Valley
Central Luzon
CALABARZON
PROJECTED POPULATION and PROJECTED GROWTH RATE by REGIONS and PROVINCES
Regions ProvincesProjected Populations Projected Annual Growth Rates (%)
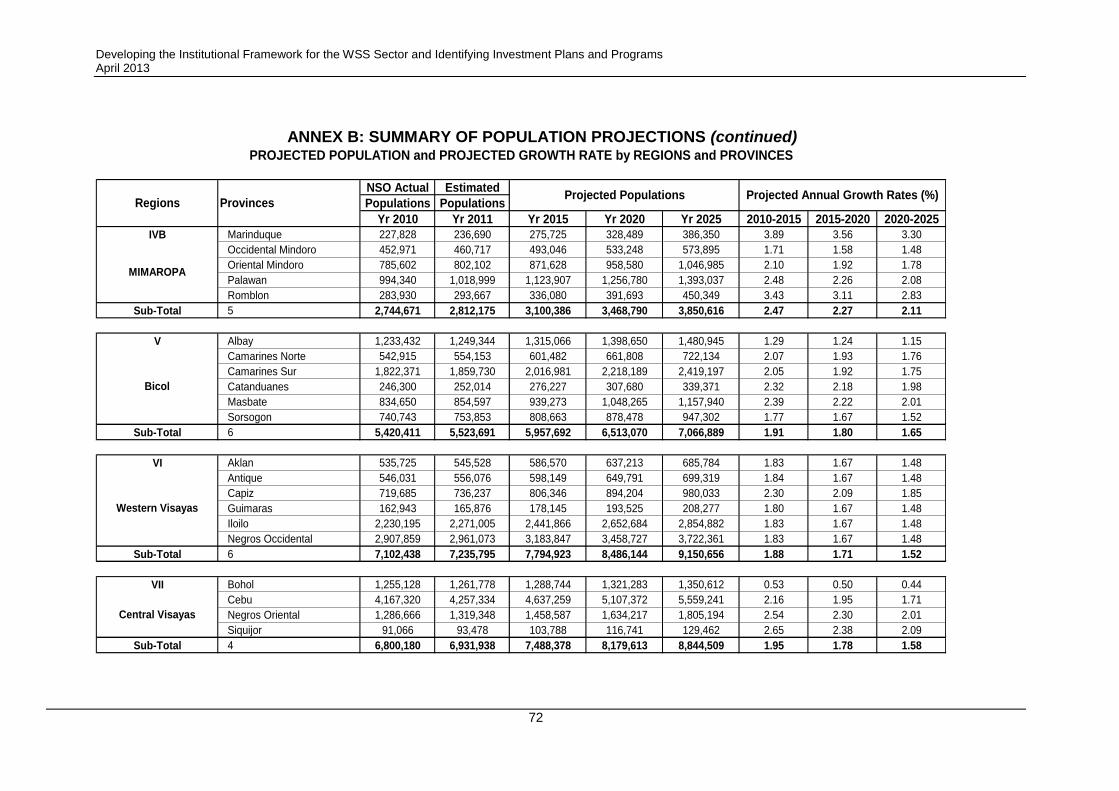
Developing the Institutional Framework for the WSS Sector and Identifying Investment Plans and Programs April 2013
72
ANNEX B: SUMMARY OF POPULATION PROJECTIONS (continued)
NSO Actual Estimated
Populations Populations
Yr 2010 Yr 2011 Yr 2015 Yr 2020 Yr 2025 2010-2015 2015-2020 2020-2025
IVB Marinduque 227,828 236,690 275,725 328,489 386,350 3.89 3.56 3.30
Occidental Mindoro 452,971 460,717 493,046 533,248 573,895 1.71 1.58 1.48
Oriental Mindoro 785,602 802,102 871,628 958,580 1,046,985 2.10 1.92 1.78
Palawan 994,340 1,018,999 1,123,907 1,256,780 1,393,037 2.48 2.26 2.08
Romblon 283,930 293,667 336,080 391,693 450,349 3.43 3.11 2.83
Sub-Total 5 2,744,671 2,812,175 3,100,386 3,468,790 3,850,616 2.47 2.27 2.11
V Albay 1,233,432 1,249,344 1,315,066 1,398,650 1,480,945 1.29 1.24 1.15
Camarines Norte 542,915 554,153 601,482 661,808 722,134 2.07 1.93 1.76
Camarines Sur 1,822,371 1,859,730 2,016,981 2,218,189 2,419,197 2.05 1.92 1.75
Catanduanes 246,300 252,014 276,227 307,680 339,371 2.32 2.18 1.98
Masbate 834,650 854,597 939,273 1,048,265 1,157,940 2.39 2.22 2.01
Sorsogon 740,743 753,853 808,663 878,478 947,302 1.77 1.67 1.52
Sub-Total 6 5,420,411 5,523,691 5,957,692 6,513,070 7,066,889 1.91 1.80 1.65
VI Aklan 535,725 545,528 586,570 637,213 685,784 1.83 1.67 1.48
Antique 546,031 556,076 598,149 649,791 699,319 1.84 1.67 1.48
Capiz 719,685 736,237 806,346 894,204 980,033 2.30 2.09 1.85
Guimaras 162,943 165,876 178,145 193,525 208,277 1.80 1.67 1.48
Iloilo 2,230,195 2,271,005 2,441,866 2,652,684 2,854,882 1.83 1.67 1.48
Negros Occidental 2,907,859 2,961,073 3,183,847 3,458,727 3,722,361 1.83 1.67 1.48
Sub-Total 6 7,102,438 7,235,795 7,794,923 8,486,144 9,150,656 1.88 1.71 1.52
VII Bohol 1,255,128 1,261,778 1,288,744 1,321,283 1,350,612 0.53 0.50 0.44
Cebu 4,167,320 4,257,334 4,637,259 5,107,372 5,559,241 2.16 1.95 1.71
Negros Oriental 1,286,666 1,319,348 1,458,587 1,634,217 1,805,194 2.54 2.30 2.01
Siquijor 91,066 93,478 103,788 116,741 129,462 2.65 2.38 2.09
Sub-Total 4 6,800,180 6,931,938 7,488,378 8,179,613 8,844,509 1.95 1.78 1.58
MIMAROPA
Bicol
Western Visayas
Central Visayas
PROJECTED POPULATION and PROJECTED GROWTH RATE by REGIONS and PROVINCES
Regions ProvincesProjected Populations Projected Annual Growth Rates (%)
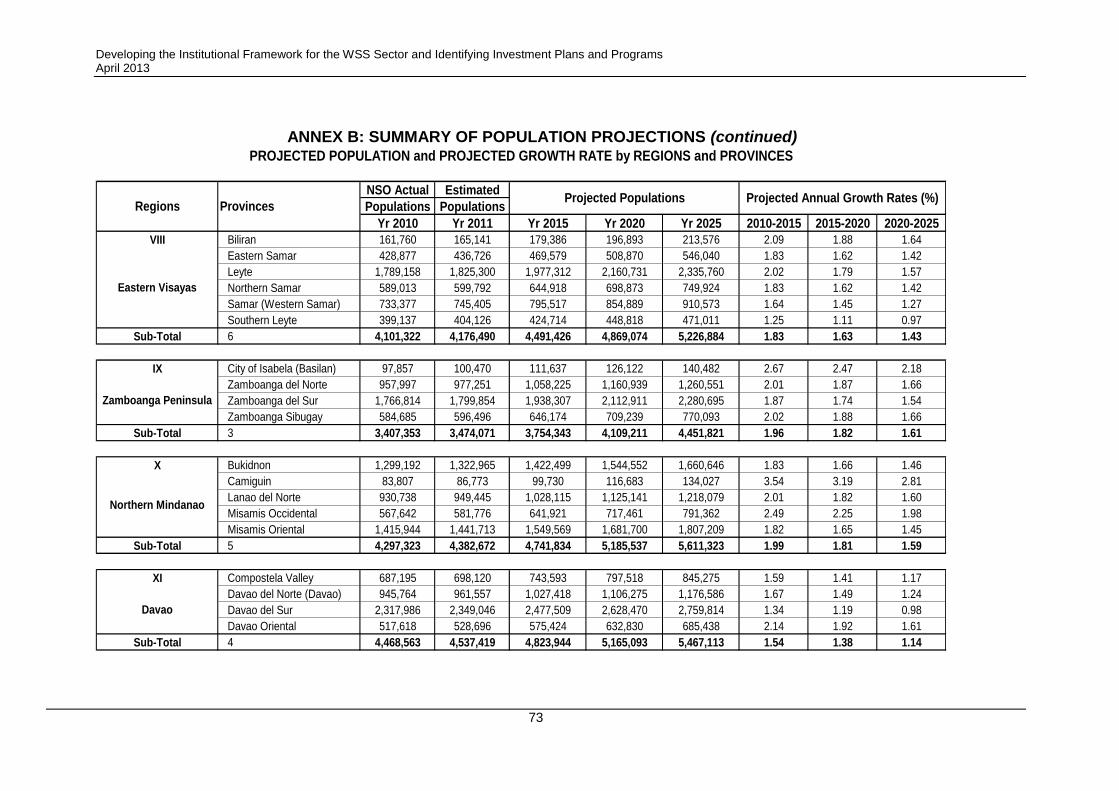
Developing the Institutional Framework for the WSS Sector and Identifying Investment Plans and Programs April 2013
73
ANNEX B: SUMMARY OF POPULATION PROJECTIONS (continued)
NSO Actual Estimated
Populations Populations
Yr 2010 Yr 2011 Yr 2015 Yr 2020 Yr 2025 2010-2015 2015-2020 2020-2025
VIII Biliran 161,760 165,141 179,386 196,893 213,576 2.09 1.88 1.64
Eastern Samar 428,877 436,726 469,579 508,870 546,040 1.83 1.62 1.42
Leyte 1,789,158 1,825,300 1,977,312 2,160,731 2,335,760 2.02 1.79 1.57
Northern Samar 589,013 599,792 644,918 698,873 749,924 1.83 1.62 1.42
Samar (Western Samar) 733,377 745,405 795,517 854,889 910,573 1.64 1.45 1.27
Southern Leyte 399,137 404,126 424,714 448,818 471,011 1.25 1.11 0.97
Sub-Total 6 4,101,322 4,176,490 4,491,426 4,869,074 5,226,884 1.83 1.63 1.43
IX City of Isabela (Basilan) 97,857 100,470 111,637 126,122 140,482 2.67 2.47 2.18
Zamboanga del Norte 957,997 977,251 1,058,225 1,160,939 1,260,551 2.01 1.87 1.66
Zamboanga del Sur 1,766,814 1,799,854 1,938,307 2,112,911 2,280,695 1.87 1.74 1.54
Zamboanga Sibugay 584,685 596,496 646,174 709,239 770,093 2.02 1.88 1.66
Sub-Total 3 3,407,353 3,474,071 3,754,343 4,109,211 4,451,821 1.96 1.82 1.61
X Bukidnon 1,299,192 1,322,965 1,422,499 1,544,552 1,660,646 1.83 1.66 1.46
Camiguin 83,807 86,773 99,730 116,683 134,027 3.54 3.19 2.81
Lanao del Norte 930,738 949,445 1,028,115 1,125,141 1,218,079 2.01 1.82 1.60
Misamis Occidental 567,642 581,776 641,921 717,461 791,362 2.49 2.25 1.98
Misamis Oriental 1,415,944 1,441,713 1,549,569 1,681,700 1,807,209 1.82 1.65 1.45
Sub-Total 5 4,297,323 4,382,672 4,741,834 5,185,537 5,611,323 1.99 1.81 1.59
XI Compostela Valley 687,195 698,120 743,593 797,518 845,275 1.59 1.41 1.17
Davao del Norte (Davao) 945,764 961,557 1,027,418 1,106,275 1,176,586 1.67 1.49 1.24
Davao del Sur 2,317,986 2,349,046 2,477,509 2,628,470 2,759,814 1.34 1.19 0.98
Davao Oriental 517,618 528,696 575,424 632,830 685,438 2.14 1.92 1.61
Sub-Total 4 4,468,563 4,537,419 4,823,944 5,165,093 5,467,113 1.54 1.38 1.14
Eastern Visayas
Zamboanga Peninsula
Northern Mindanao
Davao
PROJECTED POPULATION and PROJECTED GROWTH RATE by REGIONS and PROVINCES
Regions ProvincesProjected Populations Projected Annual Growth Rates (%)
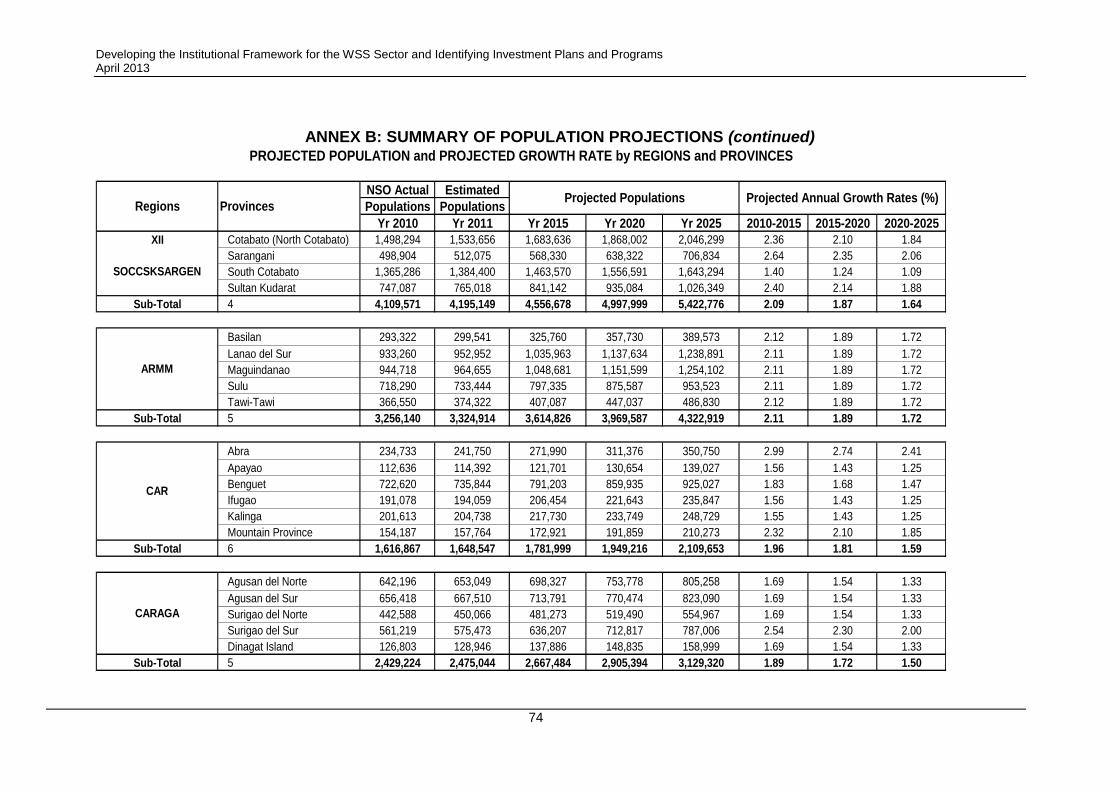
Developing the Institutional Framework for the WSS Sector and Identifying Investment Plans and Programs April 2013
74
ANNEX B: SUMMARY OF POPULATION PROJECTIONS (continued)
NSO Actual Estimated
Populations Populations
Yr 2010 Yr 2011 Yr 2015 Yr 2020 Yr 2025 2010-2015 2015-2020 2020-2025
XII Cotabato (North Cotabato) 1,498,294 1,533,656 1,683,636 1,868,002 2,046,299 2.36 2.10 1.84
Sarangani 498,904 512,075 568,330 638,322 706,834 2.64 2.35 2.06
South Cotabato 1,365,286 1,384,400 1,463,570 1,556,591 1,643,294 1.40 1.24 1.09
Sultan Kudarat 747,087 765,018 841,142 935,084 1,026,349 2.40 2.14 1.88
Sub-Total 4 4,109,571 4,195,149 4,556,678 4,997,999 5,422,776 2.09 1.87 1.64
Basilan 293,322 299,541 325,760 357,730 389,573 2.12 1.89 1.72
Lanao del Sur 933,260 952,952 1,035,963 1,137,634 1,238,891 2.11 1.89 1.72
Maguindanao 944,718 964,655 1,048,681 1,151,599 1,254,102 2.11 1.89 1.72
Sulu 718,290 733,444 797,335 875,587 953,523 2.11 1.89 1.72
Tawi-Tawi 366,550 374,322 407,087 447,037 486,830 2.12 1.89 1.72
Sub-Total 5 3,256,140 3,324,914 3,614,826 3,969,587 4,322,919 2.11 1.89 1.72
Abra 234,733 241,750 271,990 311,376 350,750 2.99 2.74 2.41
Apayao 112,636 114,392 121,701 130,654 139,027 1.56 1.43 1.25
Benguet 722,620 735,844 791,203 859,935 925,027 1.83 1.68 1.47
Ifugao 191,078 194,059 206,454 221,643 235,847 1.56 1.43 1.25
Kalinga 201,613 204,738 217,730 233,749 248,729 1.55 1.43 1.25
Mountain Province 154,187 157,764 172,921 191,859 210,273 2.32 2.10 1.85
Sub-Total 6 1,616,867 1,648,547 1,781,999 1,949,216 2,109,653 1.96 1.81 1.59
Agusan del Norte 642,196 653,049 698,327 753,778 805,258 1.69 1.54 1.33
Agusan del Sur 656,418 667,510 713,791 770,474 823,090 1.69 1.54 1.33
Surigao del Norte 442,588 450,066 481,273 519,490 554,967 1.69 1.54 1.33
Surigao del Sur 561,219 575,473 636,207 712,817 787,006 2.54 2.30 2.00
Dinagat Island 126,803 128,946 137,886 148,835 158,999 1.69 1.54 1.33
Sub-Total 5 2,429,224 2,475,044 2,667,484 2,905,394 3,129,320 1.89 1.72 1.50
SOCCSKSARGEN
CARAGA
CAR
ARMM
PROJECTED POPULATION and PROJECTED GROWTH RATE by REGIONS and PROVINCES
Regions ProvincesProjected Populations Projected Annual Growth Rates (%)
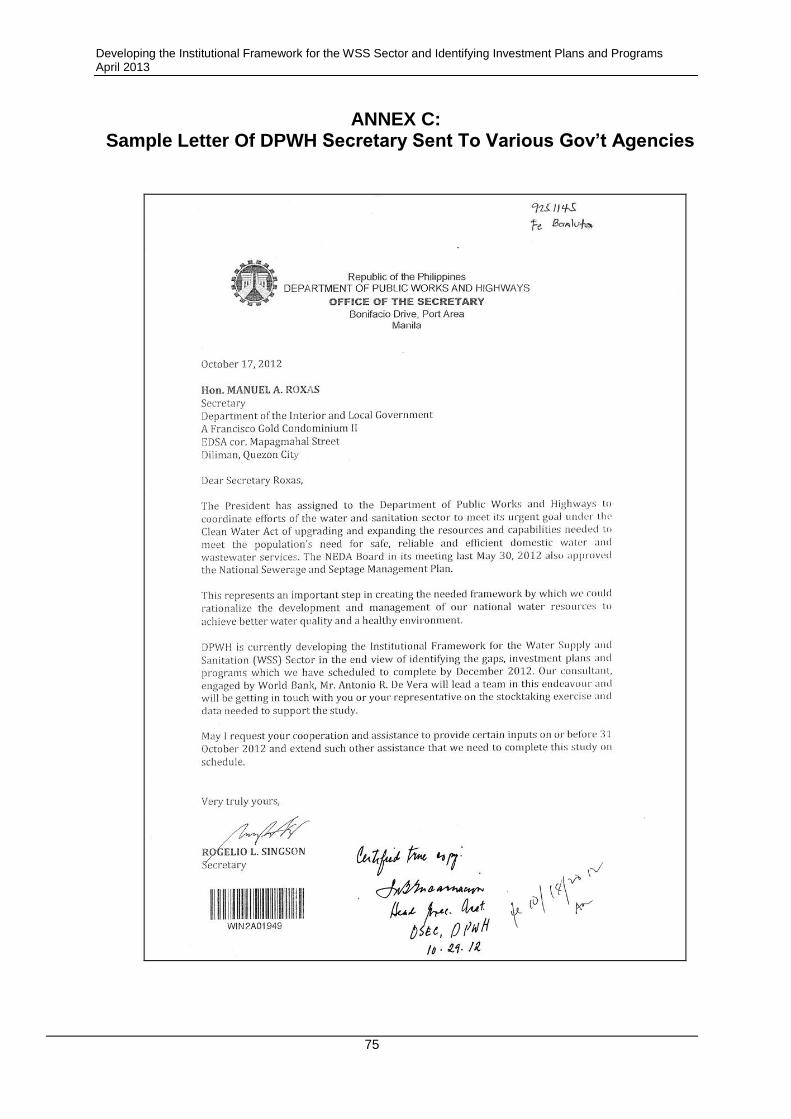
Developing the Institutional Framework for the WSS Sector and Identifying Investment Plans and Programs April 2013
75
ANNEX C: Sample Letter Of DPWH Secretary Sent To Various Gov’t Agencies
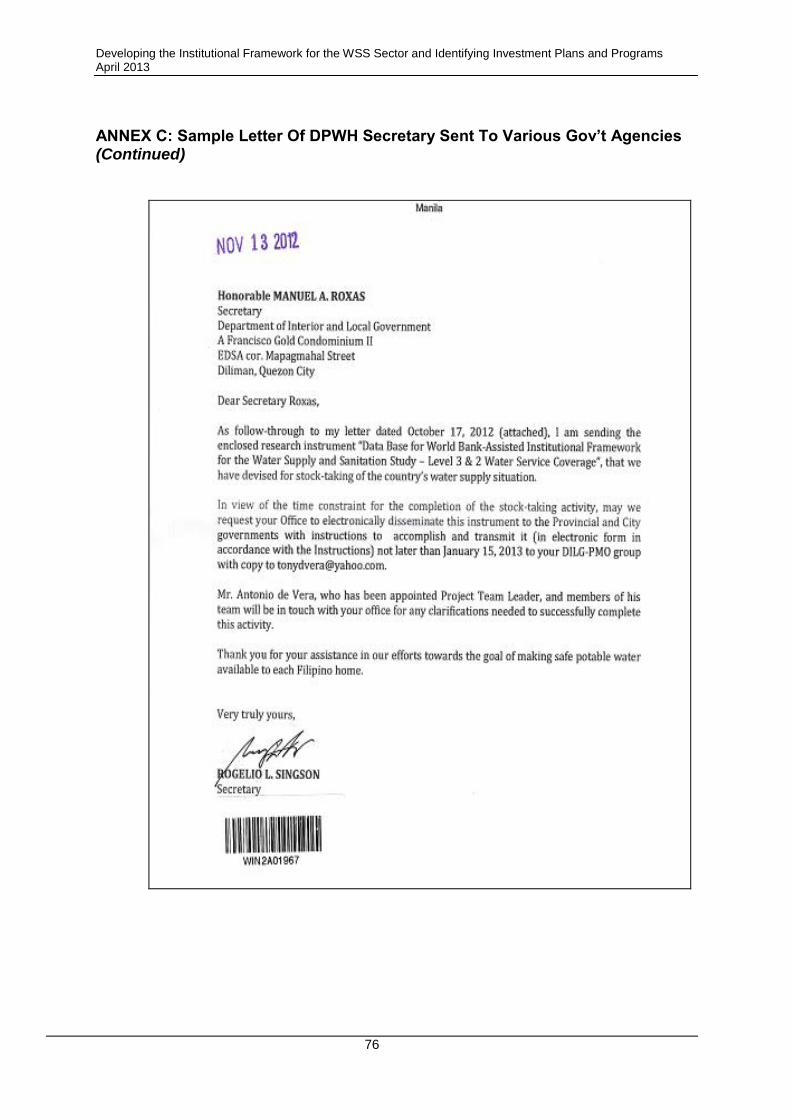
Developing the Institutional Framework for the WSS Sector and Identifying Investment Plans and Programs April 2013
76
ANNEX C: Sample Letter Of DPWH Secretary Sent To Various Gov’t Agencies (Continued)
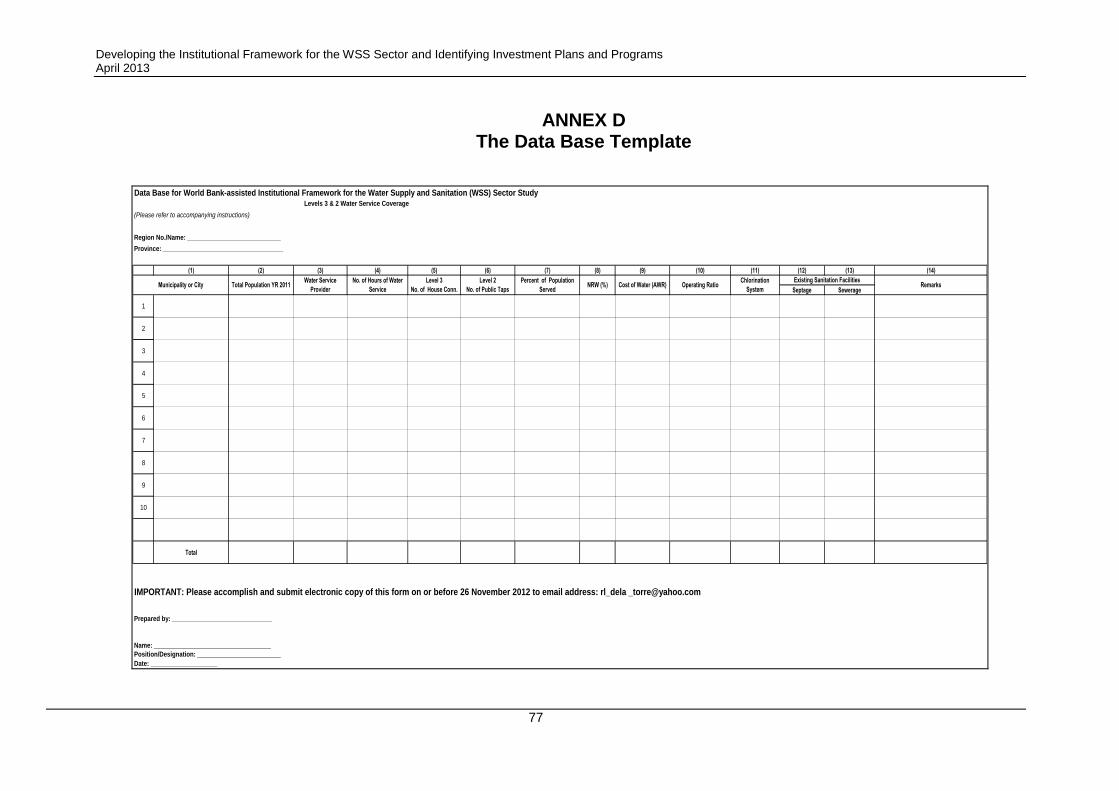
Developing the Institutional Framework for the WSS Sector and Identifying Investment Plans and Programs April 2013
77
ANNEX D The Data Base Template
Data Base for World Bank-assisted Institutional Framework for the Water Supply and Sanitation (WSS) Sector Study
(Please refer to accompanying instructions)
Region No./Name: ____________________________
Province: ____________________________________
(1) (2) (3) (4) (5) (6) (7) (8) (9) (10) (11) (12) (13) (14)
Septage Sewerage
1
2
3
4
5
6
7
8
9
10
Total
IMPORTANT: Please accomplish and submit electronic copy of this form on or before 26 November 2012 to email address: rl_dela [email protected]
Date: ____________________
Levels 3 & 2 Water Service Coverage
Prepared by: ______________________________
RemarksLevel 2
No. of Public Taps
Percent of Population
ServedNRW (%) Cost of Water (AWR) Operating Ratio
Chlorination
System
Name: ___________________________________
Position/Designation: _________________________
Existing Sanitation FacilitiesLevel 3
No. of House Conn.Municipality or City Total Population YR 2011
Water Service
Provider
No. of Hours of Water
Service
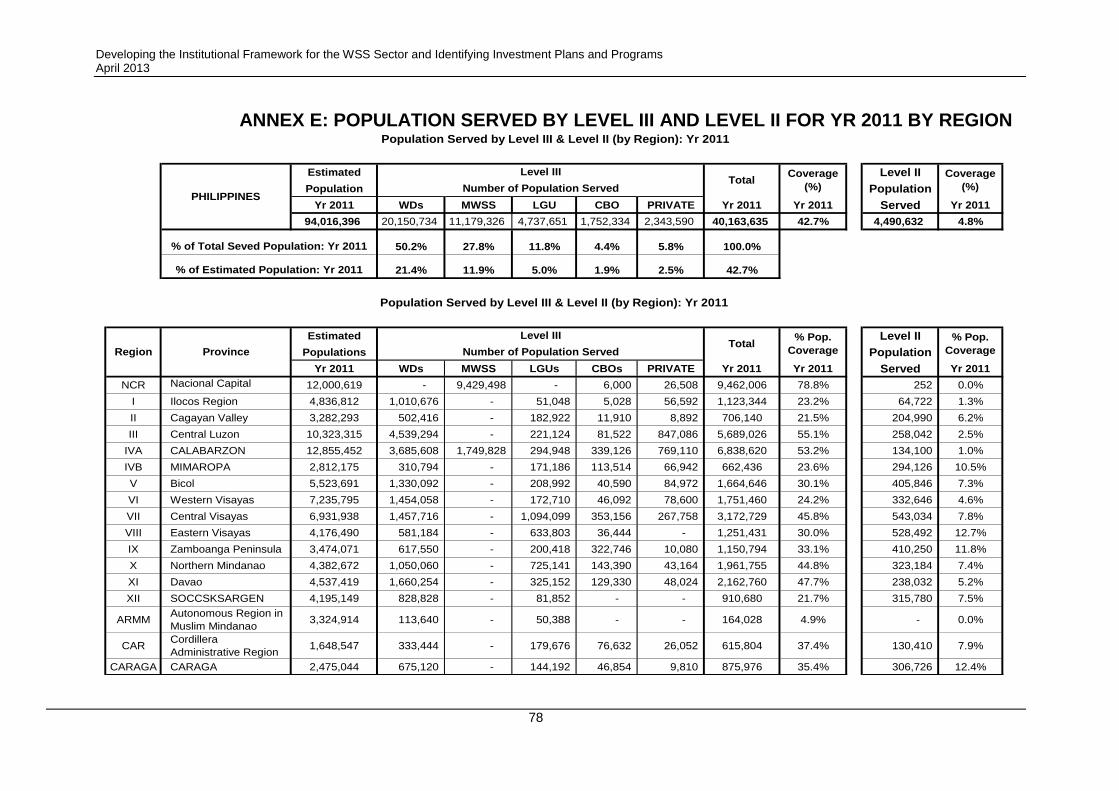
Developing the Institutional Framework for the WSS Sector and Identifying Investment Plans and Programs April 2013
78
ANNEX E: POPULATION SERVED BY LEVEL III AND LEVEL II FOR YR 2011 BY REGION
Estimated Level II
Population Population
Yr 2011 WDs MWSS LGU CBO PRIVATE Yr 2011 Yr 2011 Served Yr 2011
94,016,396 20,150,734 11,179,326 4,737,651 1,752,334 2,343,590 40,163,635 42.7% 4,490,632 4.8%
50.2% 27.8% 11.8% 4.4% 5.8% 100.0%
21.4% 11.9% 5.0% 1.9% 2.5% 42.7%
Estimated Level II
Populations Population
Yr 2011 WDs MWSS LGUs CBOs PRIVATE Yr 2011 Yr 2011 Served Yr 2011
NCR Nacional Capital
Region12,000,619 - 9,429,498 - 6,000 26,508 9,462,006 78.8% 252 0.0%
I Ilocos Region 4,836,812 1,010,676 - 51,048 5,028 56,592 1,123,344 23.2% 64,722 1.3%
II Cagayan Valley 3,282,293 502,416 - 182,922 11,910 8,892 706,140 21.5% 204,990 6.2%
III Central Luzon 10,323,315 4,539,294 - 221,124 81,522 847,086 5,689,026 55.1% 258,042 2.5%
IVA CALABARZON 12,855,452 3,685,608 1,749,828 294,948 339,126 769,110 6,838,620 53.2% 134,100 1.0%
IVB MIMAROPA 2,812,175 310,794 - 171,186 113,514 66,942 662,436 23.6% 294,126 10.5%
V Bicol 5,523,691 1,330,092 - 208,992 40,590 84,972 1,664,646 30.1% 405,846 7.3%
VI Western Visayas 7,235,795 1,454,058 - 172,710 46,092 78,600 1,751,460 24.2% 332,646 4.6%
VII Central Visayas 6,931,938 1,457,716 - 1,094,099 353,156 267,758 3,172,729 45.8% 543,034 7.8%
VIII Eastern Visayas 4,176,490 581,184 - 633,803 36,444 - 1,251,431 30.0% 528,492 12.7%
IX Zamboanga Peninsula 3,474,071 617,550 - 200,418 322,746 10,080 1,150,794 33.1% 410,250 11.8%
X Northern Mindanao 4,382,672 1,050,060 - 725,141 143,390 43,164 1,961,755 44.8% 323,184 7.4%
XI Davao 4,537,419 1,660,254 - 325,152 129,330 48,024 2,162,760 47.7% 238,032 5.2%
XII SOCCSKSARGEN 4,195,149 828,828 - 81,852 - - 910,680 21.7% 315,780 7.5%
ARMMAutonomous Region in
Muslim Mindanao3,324,914 113,640 - 50,388 - - 164,028 4.9% - 0.0%
CARCordillera
Administrative Region1,648,547 333,444 - 179,676 76,632 26,052 615,804 37.4% 130,410 7.9%
CARAGA CARAGA 2,475,044 675,120 - 144,192 46,854 9,810 875,976 35.4% 306,726 12.4%
Population Served by Level III & Level II (by Region): Yr 2011
% of Total Seved Population: Yr 2011
% of Estimated Population: Yr 2011
PHILIPPINES
Number of Population Served
TotalLevel III
Number of Population Served
Level III
Population Served by Level III & Level II (by Region): Yr 2011
Region ProvinceTotal
% Pop.
Coverage
% Pop.
Coverage
Coverage
(%)
Coverage
(%)
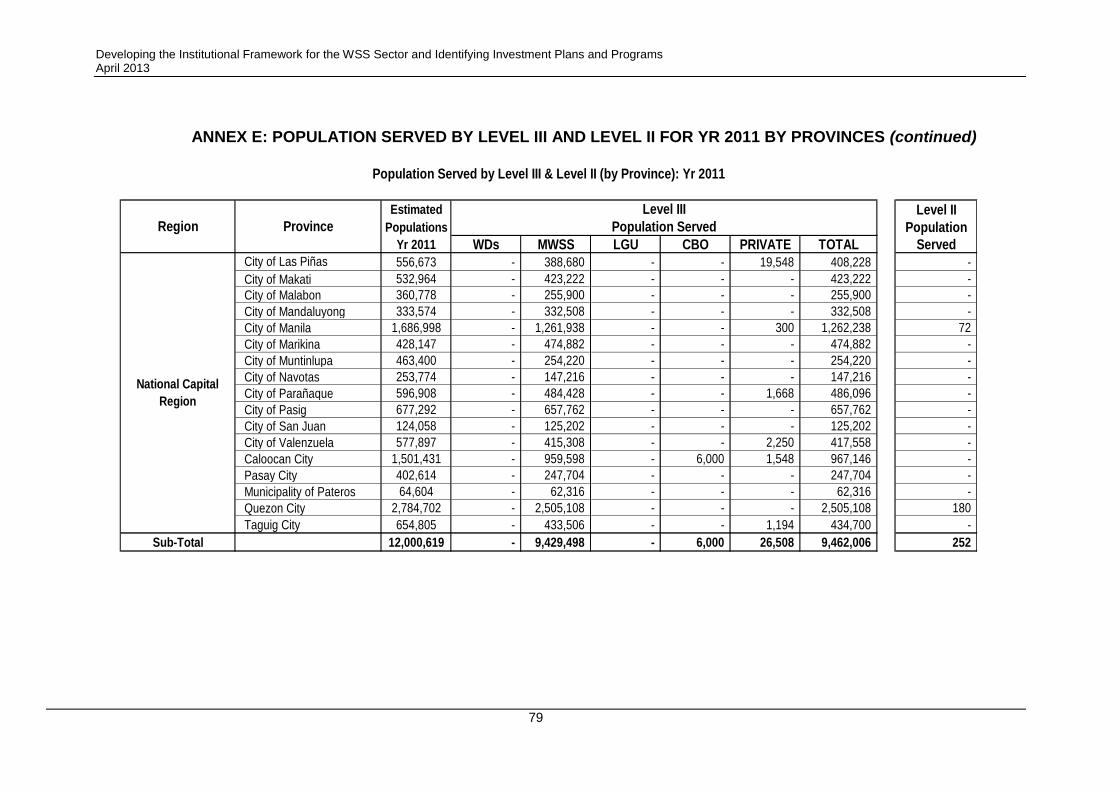
Developing the Institutional Framework for the WSS Sector and Identifying Investment Plans and Programs April 2013
79
ANNEX E: POPULATION SERVED BY LEVEL III AND LEVEL II FOR YR 2011 BY PROVINCES (continued)
6
Estimated Level II
Populations Population
Yr 2011 WDs MWSS LGU CBO PRIVATE TOTAL ServedCity of Las Piñas 556,673 - 388,680 - - 19,548 408,228 -
City of Makati 532,964 - 423,222 - - - 423,222 -
City of Malabon 360,778 - 255,900 - - - 255,900 -
City of Mandaluyong 333,574 - 332,508 - - - 332,508 -
City of Manila 1,686,998 - 1,261,938 - - 300 1,262,238 72
City of Marikina 428,147 - 474,882 - - - 474,882 -
City of Muntinlupa 463,400 - 254,220 - - - 254,220 -
City of Navotas 253,774 - 147,216 - - - 147,216 -
City of Parañaque 596,908 - 484,428 - - 1,668 486,096 -
City of Pasig 677,292 - 657,762 - - - 657,762 -
City of San Juan 124,058 - 125,202 - - - 125,202 -
City of Valenzuela 577,897 - 415,308 - - 2,250 417,558 -
Caloocan City 1,501,431 - 959,598 - 6,000 1,548 967,146 -
Pasay City 402,614 - 247,704 - - - 247,704 -
Municipality of Pateros 64,604 - 62,316 - - - 62,316 -
Quezon City 2,784,702 - 2,505,108 - - - 2,505,108 180
Taguig City 654,805 - 433,506 - - 1,194 434,700 -
Sub-Total 12,000,619 - 9,429,498 - 6,000 26,508 9,462,006 252
National Capital
Region
Population Served by Level III & Level II (by Province): Yr 2011
Region Province
Level III
Population Served
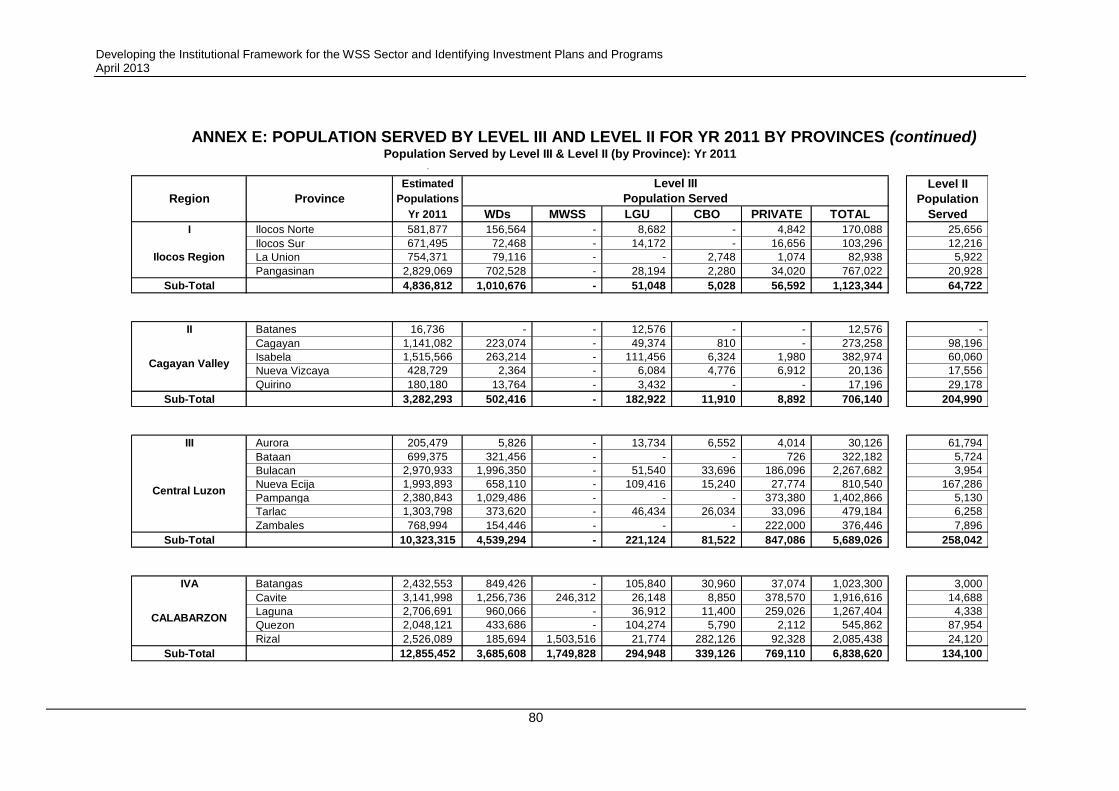
Developing the Institutional Framework for the WSS Sector and Identifying Investment Plans and Programs April 2013
80
ANNEX E: POPULATION SERVED BY LEVEL III AND LEVEL II FOR YR 2011 BY PROVINCES (continued)
6
Estimated Level II
Populations Population
Yr 2011 WDs MWSS LGU CBO PRIVATE TOTAL Served
I Ilocos Norte 581,877 156,564 - 8,682 - 4,842 170,088 25,656
Ilocos Sur 671,495 72,468 - 14,172 - 16,656 103,296 12,216
La Union 754,371 79,116 - - 2,748 1,074 82,938 5,922
Pangasinan 2,829,069 702,528 - 28,194 2,280 34,020 767,022 20,928
Sub-Total 4,836,812 1,010,676 - 51,048 5,028 56,592 1,123,344 64,722
6
II Batanes 16,736 - - 12,576 - - 12,576 -
Cagayan 1,141,082 223,074 - 49,374 810 - 273,258 98,196
Isabela 1,515,566 263,214 - 111,456 6,324 1,980 382,974 60,060
Nueva Vizcaya 428,729 2,364 - 6,084 4,776 6,912 20,136 17,556
Quirino 180,180 13,764 - 3,432 - - 17,196 29,178
Sub-Total 3,282,293 502,416 - 182,922 11,910 8,892 706,140 204,990
6
III Aurora 205,479 5,826 - 13,734 6,552 4,014 30,126 61,794
Bataan 699,375 321,456 - - - 726 322,182 5,724
Bulacan 2,970,933 1,996,350 - 51,540 33,696 186,096 2,267,682 3,954
Nueva Ecija 1,993,893 658,110 - 109,416 15,240 27,774 810,540 167,286
Pampanga 2,380,843 1,029,486 - - - 373,380 1,402,866 5,130
Tarlac 1,303,798 373,620 - 46,434 26,034 33,096 479,184 6,258
Zambales 768,994 154,446 - - - 222,000 376,446 7,896
Sub-Total 10,323,315 4,539,294 - 221,124 81,522 847,086 5,689,026 258,042
6
IVA Batangas 2,432,553 849,426 - 105,840 30,960 37,074 1,023,300 3,000
Cavite 3,141,998 1,256,736 246,312 26,148 8,850 378,570 1,916,616 14,688
Laguna 2,706,691 960,066 - 36,912 11,400 259,026 1,267,404 4,338
Quezon 2,048,121 433,686 - 104,274 5,790 2,112 545,862 87,954
Rizal 2,526,089 185,694 1,503,516 21,774 282,126 92,328 2,085,438 24,120
Sub-Total 12,855,452 3,685,608 1,749,828 294,948 339,126 769,110 6,838,620 134,100
CALABARZON
Population Served by Level III & Level II (by Province): Yr 2011
Region Province
Level III
Population Served
Ilocos Region
Cagayan Valley
Central Luzon
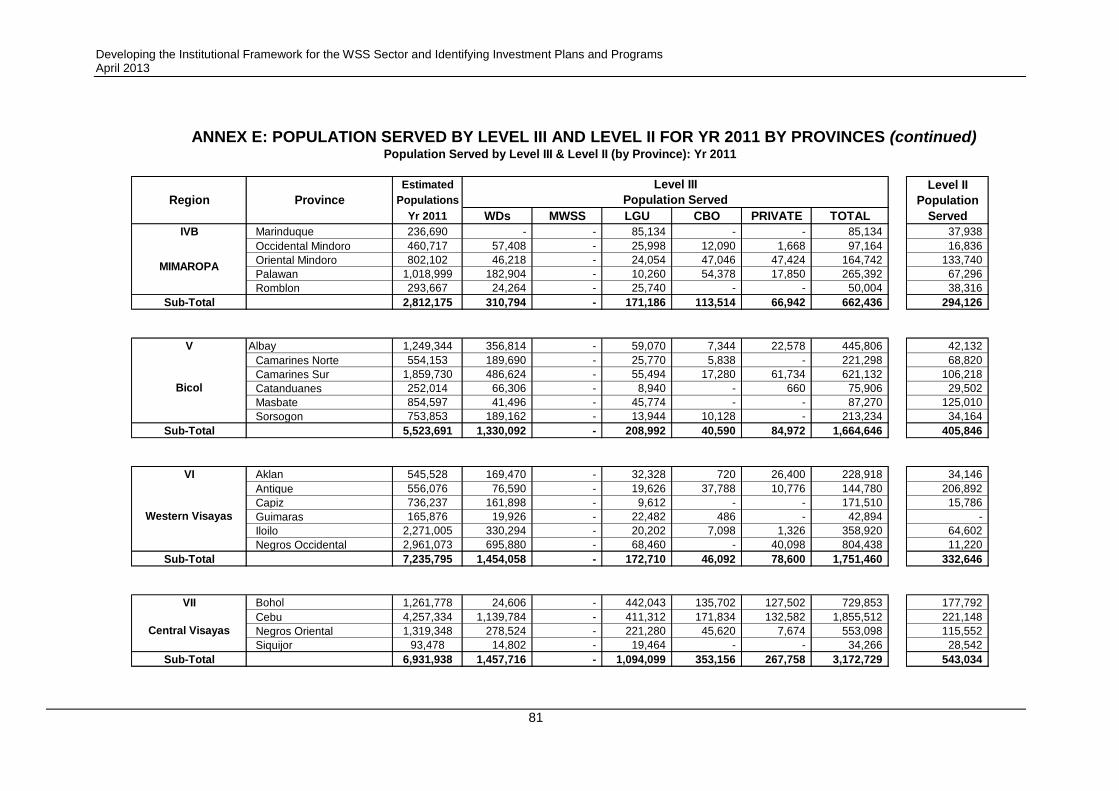
Developing the Institutional Framework for the WSS Sector and Identifying Investment Plans and Programs April 2013
81
ANNEX E: POPULATION SERVED BY LEVEL III AND LEVEL II FOR YR 2011 BY PROVINCES (continued)
6
Estimated Level II
Populations Population
Yr 2011 WDs MWSS LGU CBO PRIVATE TOTAL Served
IVB Marinduque 236,690 - - 85,134 - - 85,134 37,938
Occidental Mindoro 460,717 57,408 - 25,998 12,090 1,668 97,164 16,836
Oriental Mindoro 802,102 46,218 - 24,054 47,046 47,424 164,742 133,740
Palawan 1,018,999 182,904 - 10,260 54,378 17,850 265,392 67,296
Romblon 293,667 24,264 - 25,740 - - 50,004 38,316
Sub-Total 2,812,175 310,794 - 171,186 113,514 66,942 662,436 294,126
6
V Albay 1,249,344 356,814 - 59,070 7,344 22,578 445,806 42,132
Camarines Norte 554,153 189,690 - 25,770 5,838 - 221,298 68,820
Camarines Sur 1,859,730 486,624 - 55,494 17,280 61,734 621,132 106,218
Catanduanes 252,014 66,306 - 8,940 - 660 75,906 29,502
Masbate 854,597 41,496 - 45,774 - - 87,270 125,010
Sorsogon 753,853 189,162 - 13,944 10,128 - 213,234 34,164
Sub-Total 5,523,691 1,330,092 - 208,992 40,590 84,972 1,664,646 405,846
6
VI Aklan 545,528 169,470 - 32,328 720 26,400 228,918 34,146
Antique 556,076 76,590 - 19,626 37,788 10,776 144,780 206,892
Capiz 736,237 161,898 - 9,612 - - 171,510 15,786
Guimaras 165,876 19,926 - 22,482 486 - 42,894 -
Iloilo 2,271,005 330,294 - 20,202 7,098 1,326 358,920 64,602
Negros Occidental 2,961,073 695,880 - 68,460 - 40,098 804,438 11,220
Sub-Total 7,235,795 1,454,058 - 172,710 46,092 78,600 1,751,460 332,646
6
VII Bohol 1,261,778 24,606 - 442,043 135,702 127,502 729,853 177,792
Cebu 4,257,334 1,139,784 - 411,312 171,834 132,582 1,855,512 221,148
Negros Oriental 1,319,348 278,524 - 221,280 45,620 7,674 553,098 115,552
Siquijor 93,478 14,802 - 19,464 - - 34,266 28,542
Sub-Total 6,931,938 1,457,716 - 1,094,099 353,156 267,758 3,172,729 543,034
Central Visayas
Population Served by Level III & Level II (by Province): Yr 2011
Region Province
Level III
Population Served
MIMAROPA
Bicol
Western Visayas
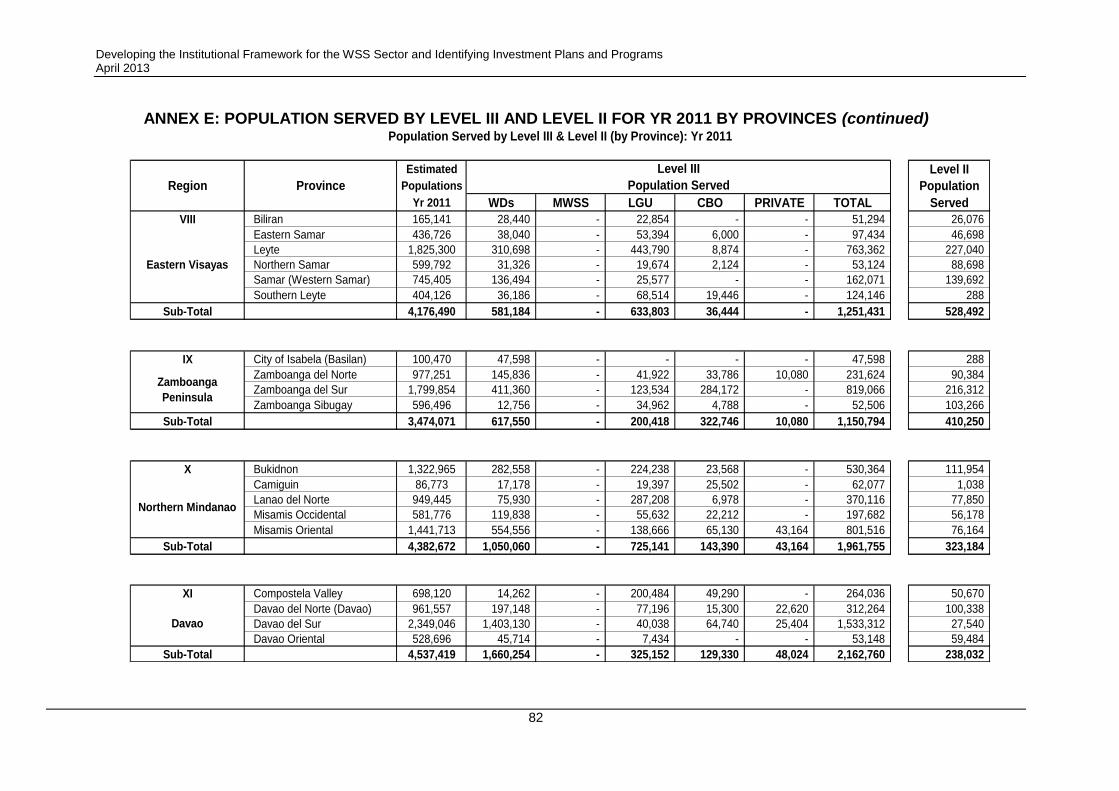
Developing the Institutional Framework for the WSS Sector and Identifying Investment Plans and Programs April 2013
82
ANNEX E: POPULATION SERVED BY LEVEL III AND LEVEL II FOR YR 2011 BY PROVINCES (continued)
6
Estimated Level II
Populations Population
Yr 2011 WDs MWSS LGU CBO PRIVATE TOTAL Served
VIII Biliran 165,141 28,440 - 22,854 - - 51,294 26,076
Eastern Samar 436,726 38,040 - 53,394 6,000 - 97,434 46,698
Leyte 1,825,300 310,698 - 443,790 8,874 - 763,362 227,040
Northern Samar 599,792 31,326 - 19,674 2,124 - 53,124 88,698
Samar (Western Samar) 745,405 136,494 - 25,577 - - 162,071 139,692
Southern Leyte 404,126 36,186 - 68,514 19,446 - 124,146 288
Sub-Total 4,176,490 581,184 - 633,803 36,444 - 1,251,431 528,492
6
IX City of Isabela (Basilan) 100,470 47,598 - - - - 47,598 288
Zamboanga del Norte 977,251 145,836 - 41,922 33,786 10,080 231,624 90,384
Zamboanga del Sur 1,799,854 411,360 - 123,534 284,172 - 819,066 216,312
Zamboanga Sibugay 596,496 12,756 - 34,962 4,788 - 52,506 103,266
Sub-Total 3,474,071 617,550 - 200,418 322,746 10,080 1,150,794 410,250
6
X Bukidnon 1,322,965 282,558 - 224,238 23,568 - 530,364 111,954
Camiguin 86,773 17,178 - 19,397 25,502 - 62,077 1,038
Lanao del Norte 949,445 75,930 - 287,208 6,978 - 370,116 77,850
Misamis Occidental 581,776 119,838 - 55,632 22,212 - 197,682 56,178
Misamis Oriental 1,441,713 554,556 - 138,666 65,130 43,164 801,516 76,164
Sub-Total 4,382,672 1,050,060 - 725,141 143,390 43,164 1,961,755 323,184
6
XI Compostela Valley 698,120 14,262 - 200,484 49,290 - 264,036 50,670
Davao del Norte (Davao) 961,557 197,148 - 77,196 15,300 22,620 312,264 100,338
Davao del Sur 2,349,046 1,403,130 - 40,038 64,740 25,404 1,533,312 27,540
Davao Oriental 528,696 45,714 - 7,434 - - 53,148 59,484
Sub-Total 4,537,419 1,660,254 - 325,152 129,330 48,024 2,162,760 238,032
Northern Mindanao
Population Served by Level III & Level II (by Province): Yr 2011
Region Province
Level III
Population Served
Davao
Eastern Visayas
Zamboanga
Peninsula
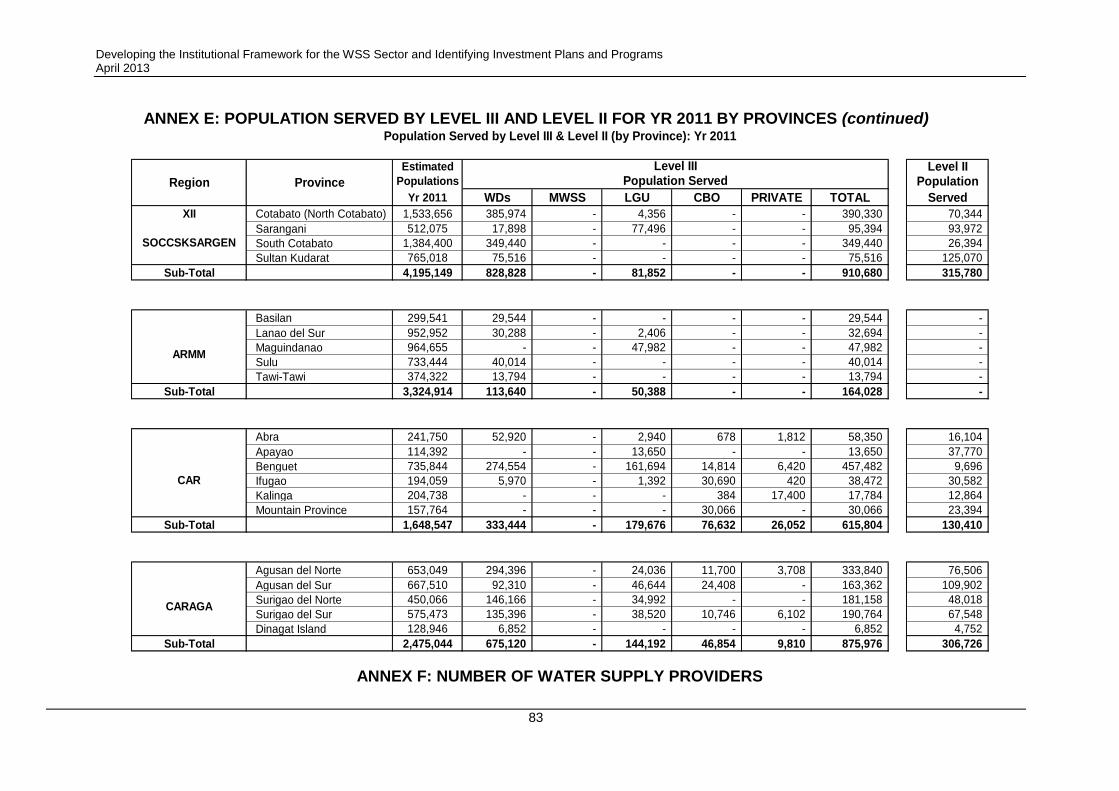
Developing the Institutional Framework for the WSS Sector and Identifying Investment Plans and Programs April 2013
83
ANNEX E: POPULATION SERVED BY LEVEL III AND LEVEL II FOR YR 2011 BY PROVINCES (continued)
6
Estimated Level IIPopulations Population
Yr 2011 WDs MWSS LGU CBO PRIVATE TOTAL Served
XII Cotabato (North Cotabato) 1,533,656 385,974 - 4,356 - - 390,330 70,344
Sarangani 512,075 17,898 - 77,496 - - 95,394 93,972
South Cotabato 1,384,400 349,440 - - - - 349,440 26,394
Sultan Kudarat 765,018 75,516 - - - - 75,516 125,070
Sub-Total 4,195,149 828,828 - 81,852 - - 910,680 315,780
6
Basilan 299,541 29,544 - - - - 29,544 -
Lanao del Sur 952,952 30,288 - 2,406 - - 32,694 -
Maguindanao 964,655 - - 47,982 - - 47,982 -
Sulu 733,444 40,014 - - - - 40,014 -
Tawi-Tawi 374,322 13,794 - - - - 13,794 -
Sub-Total 3,324,914 113,640 - 50,388 - - 164,028 -
6
Abra 241,750 52,920 - 2,940 678 1,812 58,350 16,104
Apayao 114,392 - - 13,650 - - 13,650 37,770
Benguet 735,844 274,554 - 161,694 14,814 6,420 457,482 9,696
Ifugao 194,059 5,970 - 1,392 30,690 420 38,472 30,582
Kalinga 204,738 - - - 384 17,400 17,784 12,864
Mountain Province 157,764 - - - 30,066 - 30,066 23,394
Sub-Total 1,648,547 333,444 - 179,676 76,632 26,052 615,804 130,410
6
Agusan del Norte 653,049 294,396 - 24,036 11,700 3,708 333,840 76,506
Agusan del Sur 667,510 92,310 - 46,644 24,408 - 163,362 109,902
Surigao del Norte 450,066 146,166 - 34,992 - - 181,158 48,018
Surigao del Sur 575,473 135,396 - 38,520 10,746 6,102 190,764 67,548
Dinagat Island 128,946 6,852 - - - - 6,852 4,752
Sub-Total 2,475,044 675,120 - 144,192 46,854 9,810 875,976 306,726
CARAGA
SOCCSKSARGEN
ARMM
CAR
Population Served by Level III & Level II (by Province): Yr 2011
Region Province
Level IIIPopulation Served
ANNEX F: NUMBER OF WATER SUPPLY PROVIDERS
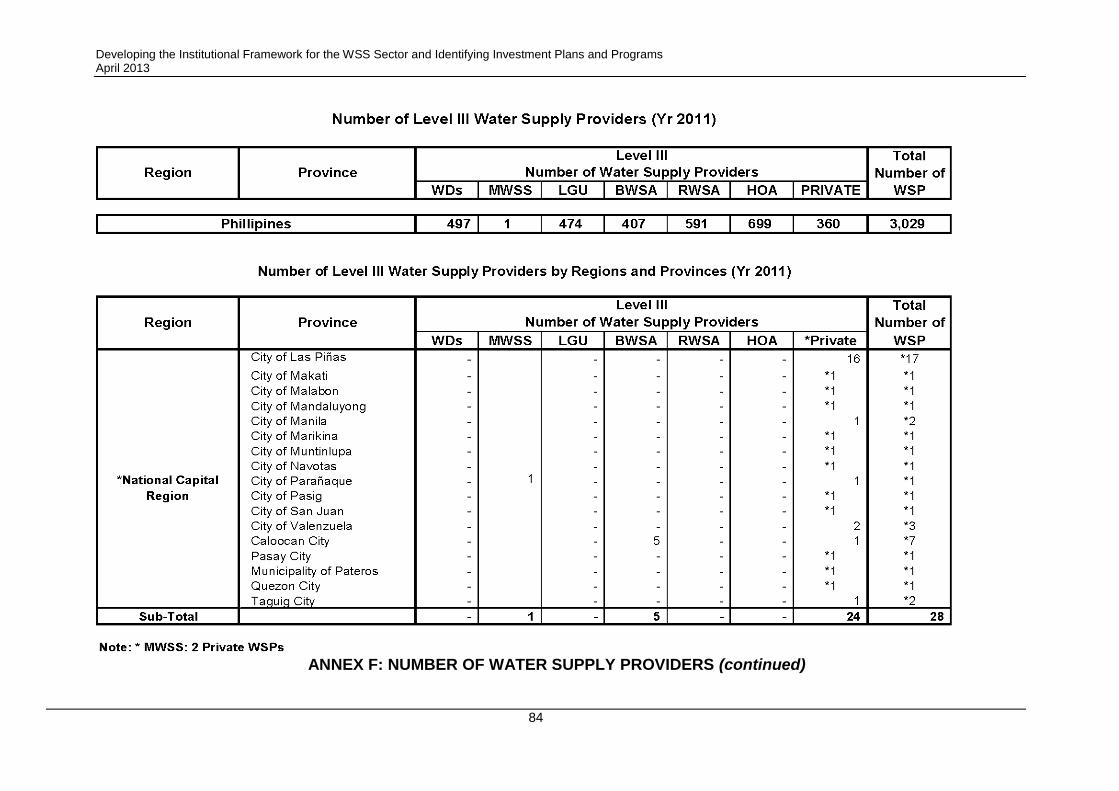
Developing the Institutional Framework for the WSS Sector and Identifying Investment Plans and Programs April 2013
84
ANNEX F: NUMBER OF WATER SUPPLY PROVIDERS (continued)
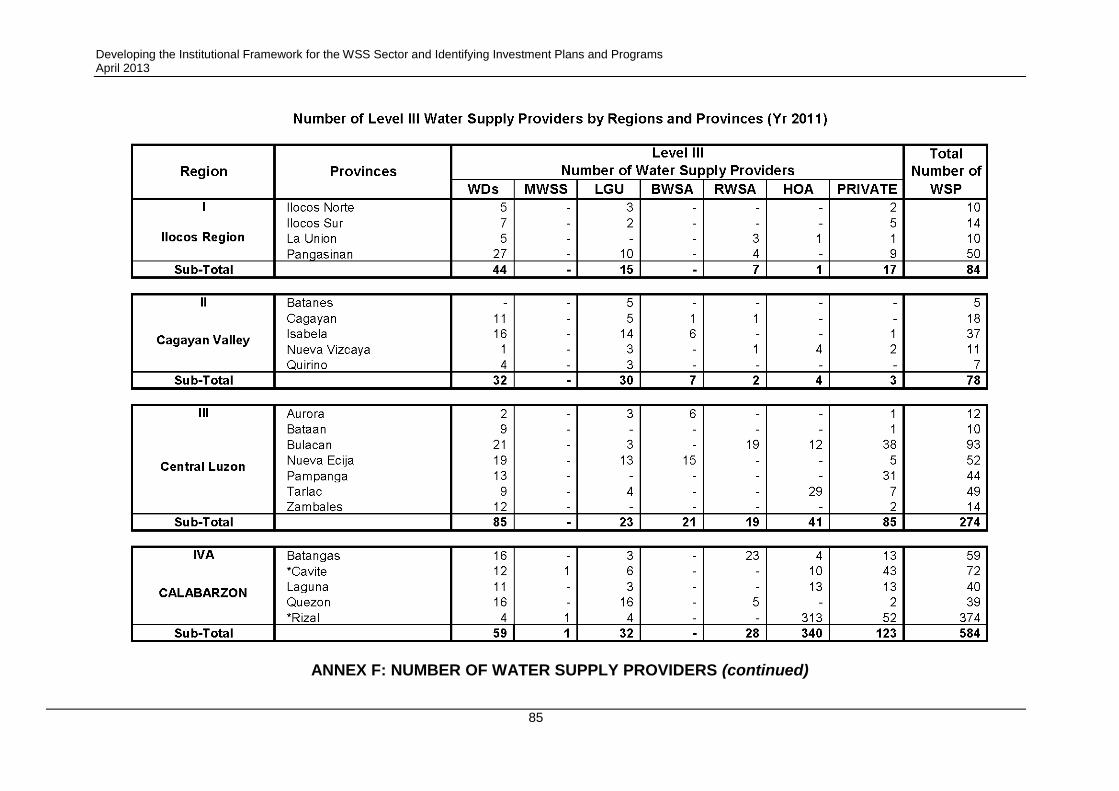
Developing the Institutional Framework for the WSS Sector and Identifying Investment Plans and Programs April 2013
85
ANNEX F: NUMBER OF WATER SUPPLY PROVIDERS (continued)
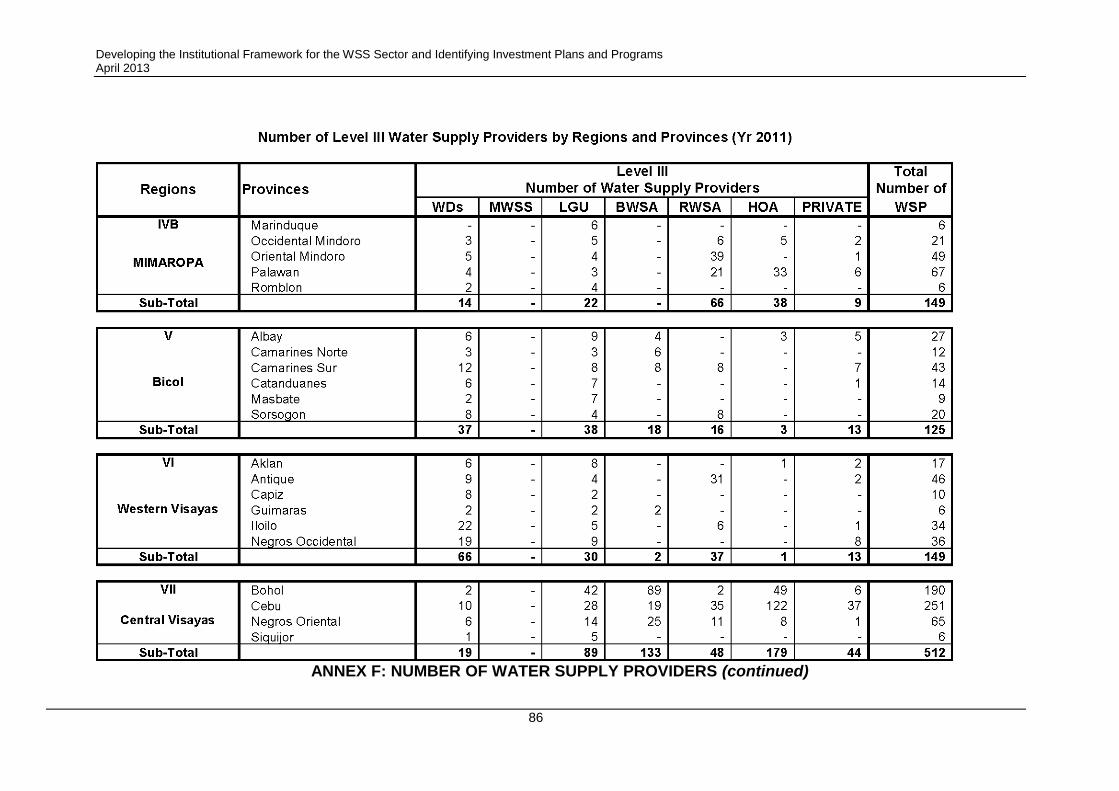
Developing the Institutional Framework for the WSS Sector and Identifying Investment Plans and Programs April 2013
86
ANNEX F: NUMBER OF WATER SUPPLY PROVIDERS (continued)
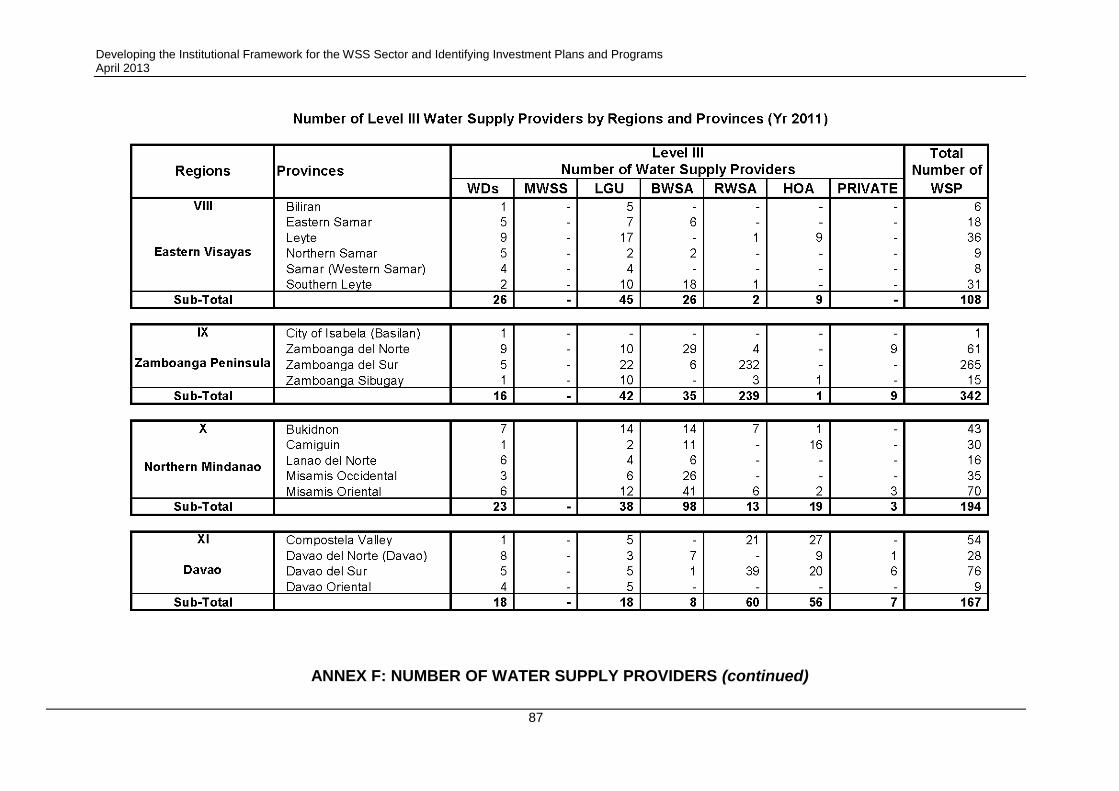
Developing the Institutional Framework for the WSS Sector and Identifying Investment Plans and Programs April 2013
87
ANNEX F: NUMBER OF WATER SUPPLY PROVIDERS (continued)
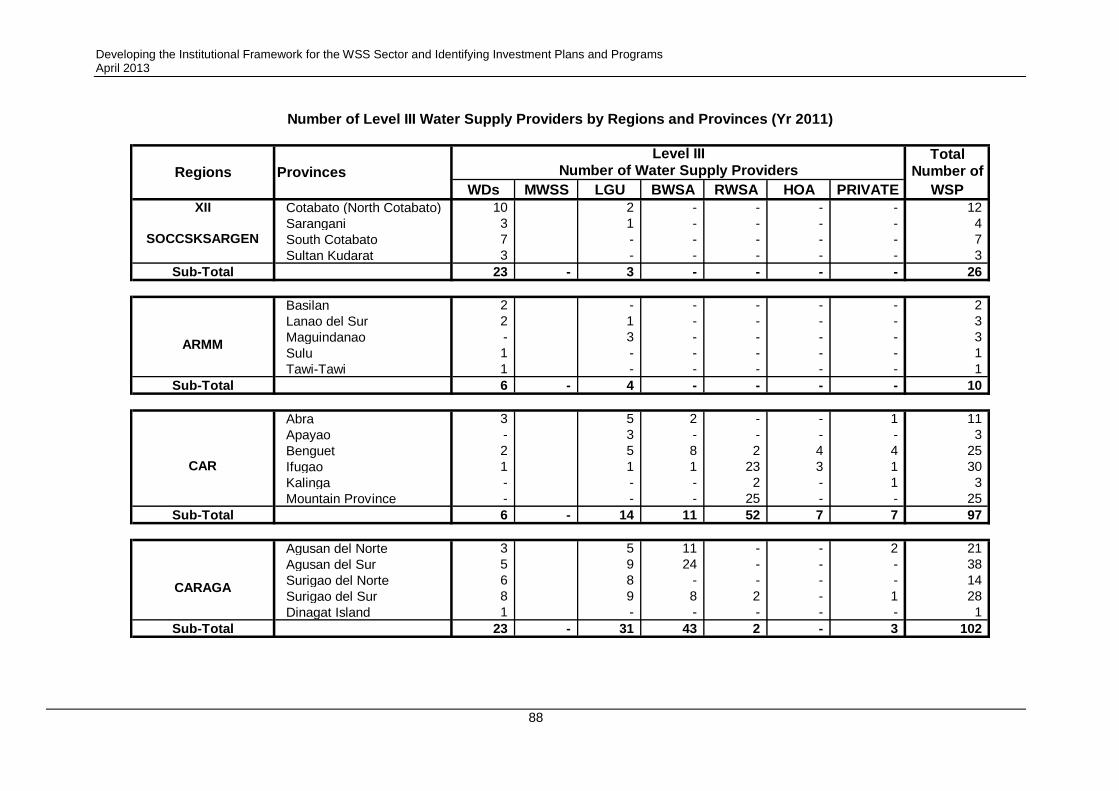
Developing the Institutional Framework for the WSS Sector and Identifying Investment Plans and Programs April 2013
88
Total
Number of
WDs MWSS LGU BWSA RWSA HOA PRIVATE WSP
XII Cotabato (North Cotabato) 10 2 - - - - 12
Sarangani 3 1 - - - - 4
South Cotabato 7 - - - - - 7
Sultan Kudarat 3 - - - - - 3
Sub-Total 23 - 3 - - - - 26
Basilan 2 - - - - - 2
Lanao del Sur 2 1 - - - - 3
Maguindanao - 3 - - - - 3
Sulu 1 - - - - - 1
Tawi-Tawi 1 - - - - - 1
Sub-Total 6 - 4 - - - - 10
Abra 3 5 2 - - 1 11
Apayao - 3 - - - - 3
Benguet 2 5 8 2 4 4 25
Ifugao 1 1 1 23 3 1 30
Kalinga - - - 2 - 1 3
Mountain Province - - - 25 - - 25
Sub-Total 6 - 14 11 52 7 7 97
Agusan del Norte 3 5 11 - - 2 21
Agusan del Sur 5 9 24 - - - 38
Surigao del Norte 6 8 - - - - 14
Surigao del Sur 8 9 8 2 - 1 28
Dinagat Island 1 - - - - - 1
Sub-Total 23 - 31 43 2 - 3 102
Level III
Number of Water Supply Providers
Number of Level III Water Supply Providers by Regions and Provinces (Yr 2011)
CARAGA
ARMM
CAR
SOCCSKSARGEN
Regions Provinces
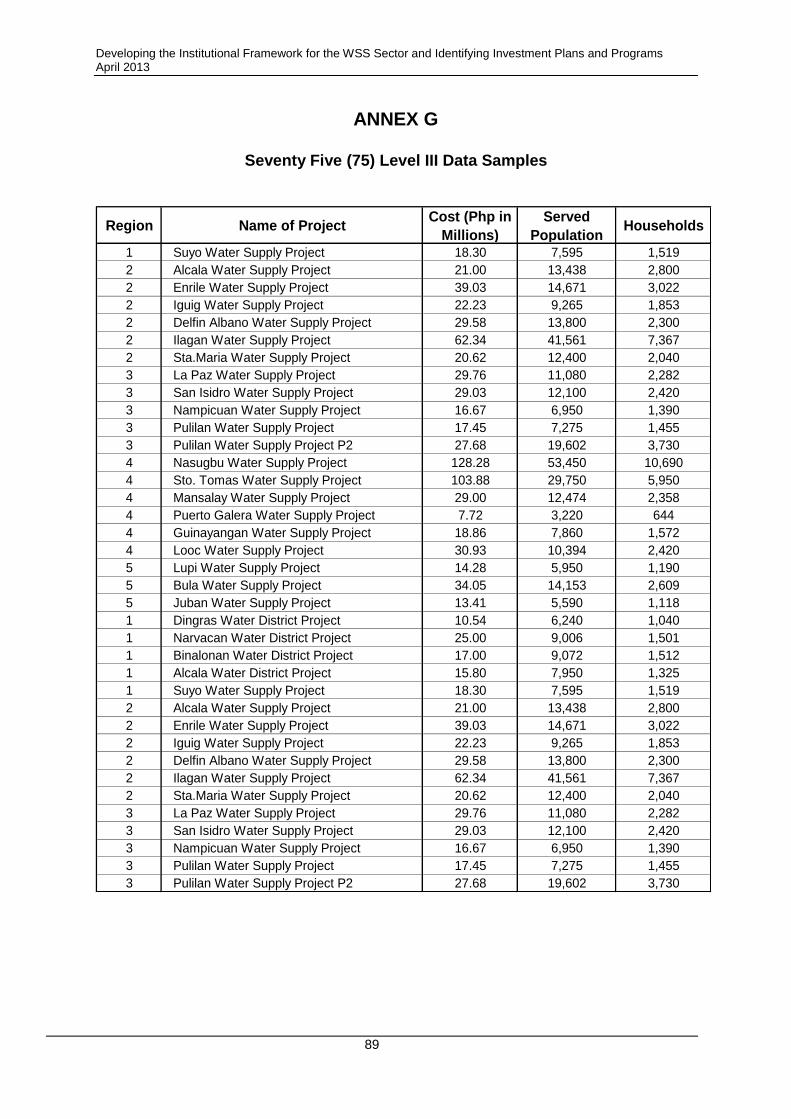
Developing the Institutional Framework for the WSS Sector and Identifying Investment Plans and Programs April 2013
89
ANNEX G
Seventy Five (75) Level III Data Samples
Region Name of ProjectCost (Php in
Millions)
Served
PopulationHouseholds
1 Suyo Water Supply Project 18.30 7,595 1,519
2 Alcala Water Supply Project 21.00 13,438 2,800
2 Enrile Water Supply Project 39.03 14,671 3,022
2 Iguig Water Supply Project 22.23 9,265 1,853
2 Delfin Albano Water Supply Project 29.58 13,800 2,300
2 Ilagan Water Supply Project 62.34 41,561 7,367
2 Sta.Maria Water Supply Project 20.62 12,400 2,040
3 La Paz Water Supply Project 29.76 11,080 2,282
3 San Isidro Water Supply Project 29.03 12,100 2,420
3 Nampicuan Water Supply Project 16.67 6,950 1,390
3 Pulilan Water Supply Project 17.45 7,275 1,455
3 Pulilan Water Supply Project P2 27.68 19,602 3,730
4 Nasugbu Water Supply Project 128.28 53,450 10,690
4 Sto. Tomas Water Supply Project 103.88 29,750 5,950
4 Mansalay Water Supply Project 29.00 12,474 2,358
4 Puerto Galera Water Supply Project 7.72 3,220 644
4 Guinayangan Water Supply Project 18.86 7,860 1,572
4 Looc Water Supply Project 30.93 10,394 2,420
5 Lupi Water Supply Project 14.28 5,950 1,190
5 Bula Water Supply Project 34.05 14,153 2,609
5 Juban Water Supply Project 13.41 5,590 1,118
1 Dingras Water District Project 10.54 6,240 1,040
1 Narvacan Water District Project 25.00 9,006 1,501
1 Binalonan Water District Project 17.00 9,072 1,512
1 Alcala Water District Project 15.80 7,950 1,325
1 Suyo Water Supply Project 18.30 7,595 1,519
2 Alcala Water Supply Project 21.00 13,438 2,800
2 Enrile Water Supply Project 39.03 14,671 3,022
2 Iguig Water Supply Project 22.23 9,265 1,853
2 Delfin Albano Water Supply Project 29.58 13,800 2,300
2 Ilagan Water Supply Project 62.34 41,561 7,367
2 Sta.Maria Water Supply Project 20.62 12,400 2,040
3 La Paz Water Supply Project 29.76 11,080 2,282
3 San Isidro Water Supply Project 29.03 12,100 2,420
3 Nampicuan Water Supply Project 16.67 6,950 1,390
3 Pulilan Water Supply Project 17.45 7,275 1,455
3 Pulilan Water Supply Project P2 27.68 19,602 3,730
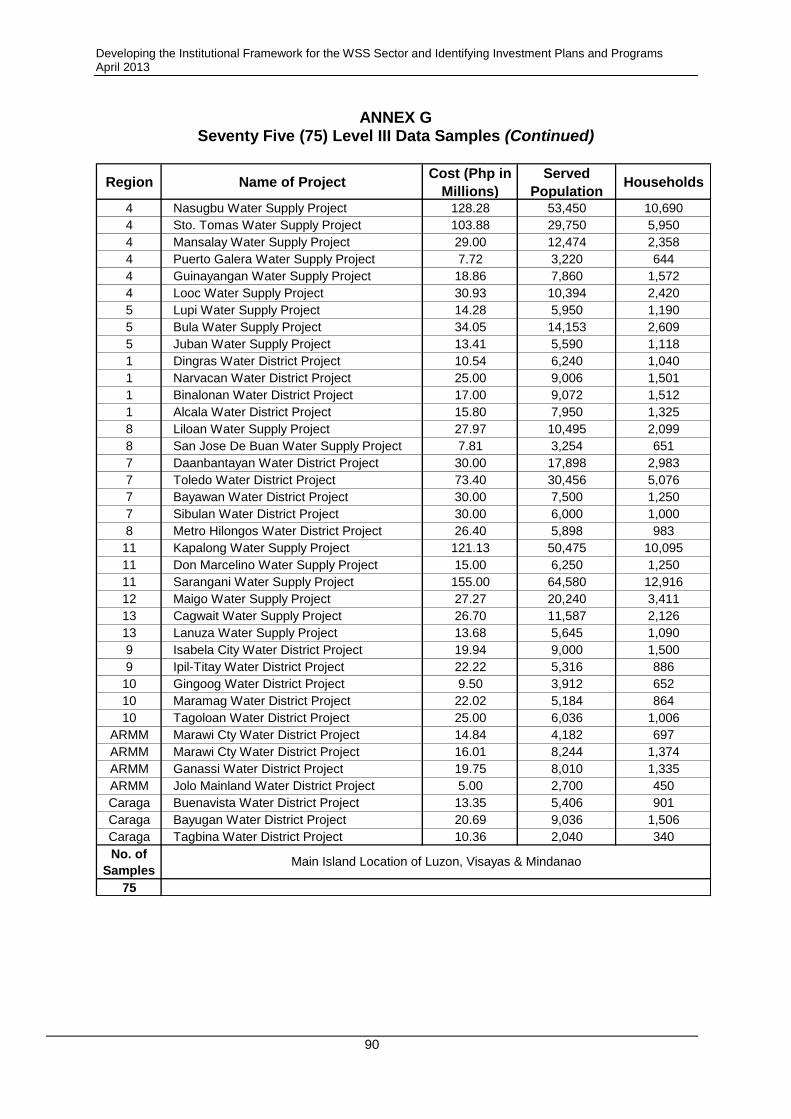
Developing the Institutional Framework for the WSS Sector and Identifying Investment Plans and Programs April 2013
90
ANNEX G Seventy Five (75) Level III Data Samples (Continued)
Region Name of ProjectCost (Php in
Millions)
Served
PopulationHouseholds
4 Nasugbu Water Supply Project 128.28 53,450 10,690
4 Sto. Tomas Water Supply Project 103.88 29,750 5,950
4 Mansalay Water Supply Project 29.00 12,474 2,358
4 Puerto Galera Water Supply Project 7.72 3,220 644
4 Guinayangan Water Supply Project 18.86 7,860 1,572
4 Looc Water Supply Project 30.93 10,394 2,420
5 Lupi Water Supply Project 14.28 5,950 1,190
5 Bula Water Supply Project 34.05 14,153 2,609
5 Juban Water Supply Project 13.41 5,590 1,118
1 Dingras Water District Project 10.54 6,240 1,040
1 Narvacan Water District Project 25.00 9,006 1,501
1 Binalonan Water District Project 17.00 9,072 1,512
1 Alcala Water District Project 15.80 7,950 1,325
8 Liloan Water Supply Project 27.97 10,495 2,099
8 San Jose De Buan Water Supply Project 7.81 3,254 651
7 Daanbantayan Water District Project 30.00 17,898 2,983
7 Toledo Water District Project 73.40 30,456 5,076
7 Bayawan Water District Project 30.00 7,500 1,250
7 Sibulan Water District Project 30.00 6,000 1,000
8 Metro Hilongos Water District Project 26.40 5,898 983
11 Kapalong Water Supply Project 121.13 50,475 10,095
11 Don Marcelino Water Supply Project 15.00 6,250 1,250
11 Sarangani Water Supply Project 155.00 64,580 12,916
12 Maigo Water Supply Project 27.27 20,240 3,411
13 Cagwait Water Supply Project 26.70 11,587 2,126
13 Lanuza Water Supply Project 13.68 5,645 1,090
9 Isabela City Water District Project 19.94 9,000 1,500
9 Ipil-Titay Water District Project 22.22 5,316 886
10 Gingoog Water District Project 9.50 3,912 652
10 Maramag Water District Project 22.02 5,184 864
10 Tagoloan Water District Project 25.00 6,036 1,006
ARMM Marawi Cty Water District Project 14.84 4,182 697
ARMM Marawi Cty Water District Project 16.01 8,244 1,374
ARMM Ganassi Water District Project 19.75 8,010 1,335
ARMM Jolo Mainland Water District Project 5.00 2,700 450
Caraga Buenavista Water District Project 13.35 5,406 901
Caraga Bayugan Water District Project 20.69 9,036 1,506
Caraga Tagbina Water District Project 10.36 2,040 340
No. of
Samples
75
Main Island Location of Luzon, Visayas & Mindanao
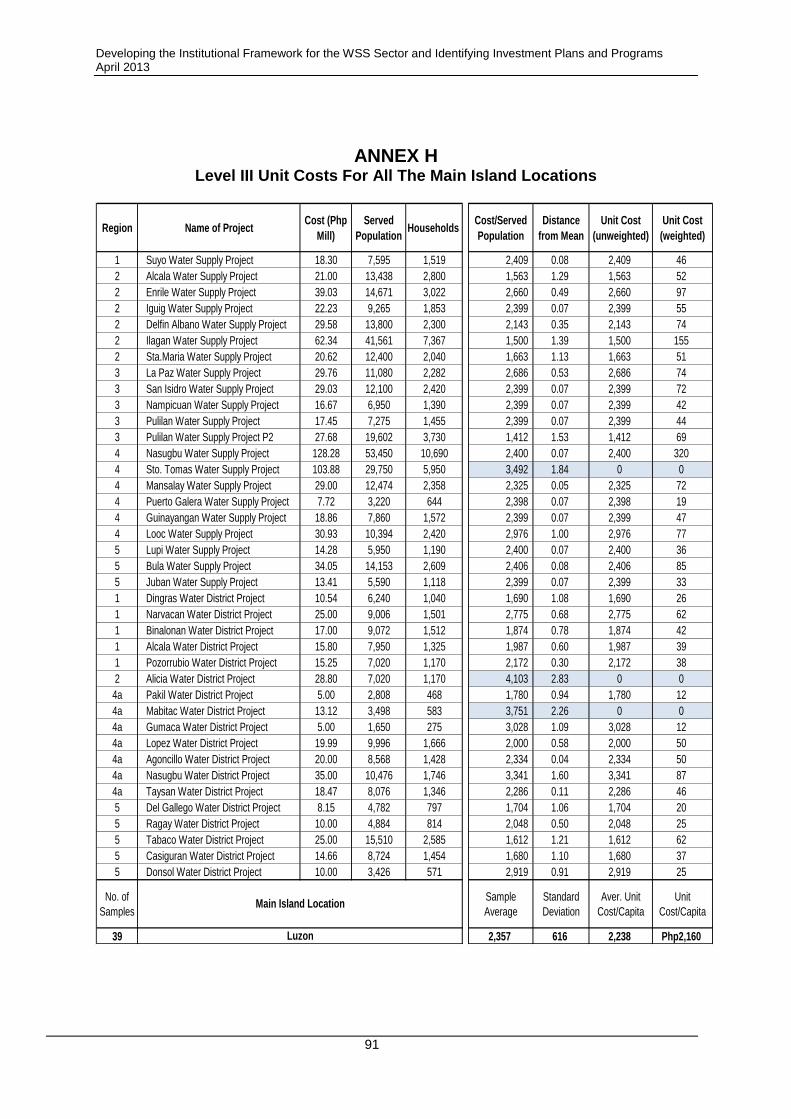
Developing the Institutional Framework for the WSS Sector and Identifying Investment Plans and Programs April 2013
91
ANNEX H Level III Unit Costs For All The Main Island Locations
Region Name of ProjectCost (Php
Mill)
Served
PopulationHouseholds
Cost/Served
Population
Distance
from Mean
Unit Cost
(unweighted)
Unit Cost
(weighted)
1 Suyo Water Supply Project 18.30 7,595 1,519 2,409 0.08 2,409 46
2 Alcala Water Supply Project 21.00 13,438 2,800 1,563 1.29 1,563 52
2 Enrile Water Supply Project 39.03 14,671 3,022 2,660 0.49 2,660 97
2 Iguig Water Supply Project 22.23 9,265 1,853 2,399 0.07 2,399 55
2 Delfin Albano Water Supply Project 29.58 13,800 2,300 2,143 0.35 2,143 74
2 Ilagan Water Supply Project 62.34 41,561 7,367 1,500 1.39 1,500 155
2 Sta.Maria Water Supply Project 20.62 12,400 2,040 1,663 1.13 1,663 51
3 La Paz Water Supply Project 29.76 11,080 2,282 2,686 0.53 2,686 74
3 San Isidro Water Supply Project 29.03 12,100 2,420 2,399 0.07 2,399 72
3 Nampicuan Water Supply Project 16.67 6,950 1,390 2,399 0.07 2,399 42
3 Pulilan Water Supply Project 17.45 7,275 1,455 2,399 0.07 2,399 44
3 Pulilan Water Supply Project P2 27.68 19,602 3,730 1,412 1.53 1,412 69
4 Nasugbu Water Supply Project 128.28 53,450 10,690 2,400 0.07 2,400 320
4 Sto. Tomas Water Supply Project 103.88 29,750 5,950 3,492 1.84 0 0
4 Mansalay Water Supply Project 29.00 12,474 2,358 2,325 0.05 2,325 72
4 Puerto Galera Water Supply Project 7.72 3,220 644 2,398 0.07 2,398 19
4 Guinayangan Water Supply Project 18.86 7,860 1,572 2,399 0.07 2,399 47
4 Looc Water Supply Project 30.93 10,394 2,420 2,976 1.00 2,976 77
5 Lupi Water Supply Project 14.28 5,950 1,190 2,400 0.07 2,400 36
5 Bula Water Supply Project 34.05 14,153 2,609 2,406 0.08 2,406 85
5 Juban Water Supply Project 13.41 5,590 1,118 2,399 0.07 2,399 33
1 Dingras Water District Project 10.54 6,240 1,040 1,690 1.08 1,690 26
1 Narvacan Water District Project 25.00 9,006 1,501 2,775 0.68 2,775 62
1 Binalonan Water District Project 17.00 9,072 1,512 1,874 0.78 1,874 42
1 Alcala Water District Project 15.80 7,950 1,325 1,987 0.60 1,987 39
1 Pozorrubio Water District Project 15.25 7,020 1,170 2,172 0.30 2,172 38
2 Alicia Water District Project 28.80 7,020 1,170 4,103 2.83 0 0
4a Pakil Water District Project 5.00 2,808 468 1,780 0.94 1,780 12
4a Mabitac Water District Project 13.12 3,498 583 3,751 2.26 0 0
4a Gumaca Water District Project 5.00 1,650 275 3,028 1.09 3,028 12
4a Lopez Water District Project 19.99 9,996 1,666 2,000 0.58 2,000 50
4a Agoncillo Water District Project 20.00 8,568 1,428 2,334 0.04 2,334 50
4a Nasugbu Water District Project 35.00 10,476 1,746 3,341 1.60 3,341 87
4a Taysan Water District Project 18.47 8,076 1,346 2,286 0.11 2,286 46
5 Del Gallego Water District Project 8.15 4,782 797 1,704 1.06 1,704 20
5 Ragay Water District Project 10.00 4,884 814 2,048 0.50 2,048 25
5 Tabaco Water District Project 25.00 15,510 2,585 1,612 1.21 1,612 62
5 Casiguran Water District Project 14.66 8,724 1,454 1,680 1.10 1,680 37
5 Donsol Water District Project 10.00 3,426 571 2,919 0.91 2,919 25
No. of
Samples
Sample
Average
Standard
Deviation
Aver. Unit
Cost/Capita
Unit
Cost/Capita
39 2,357 616 2,238 Php2,160
Main Island Location
Luzon
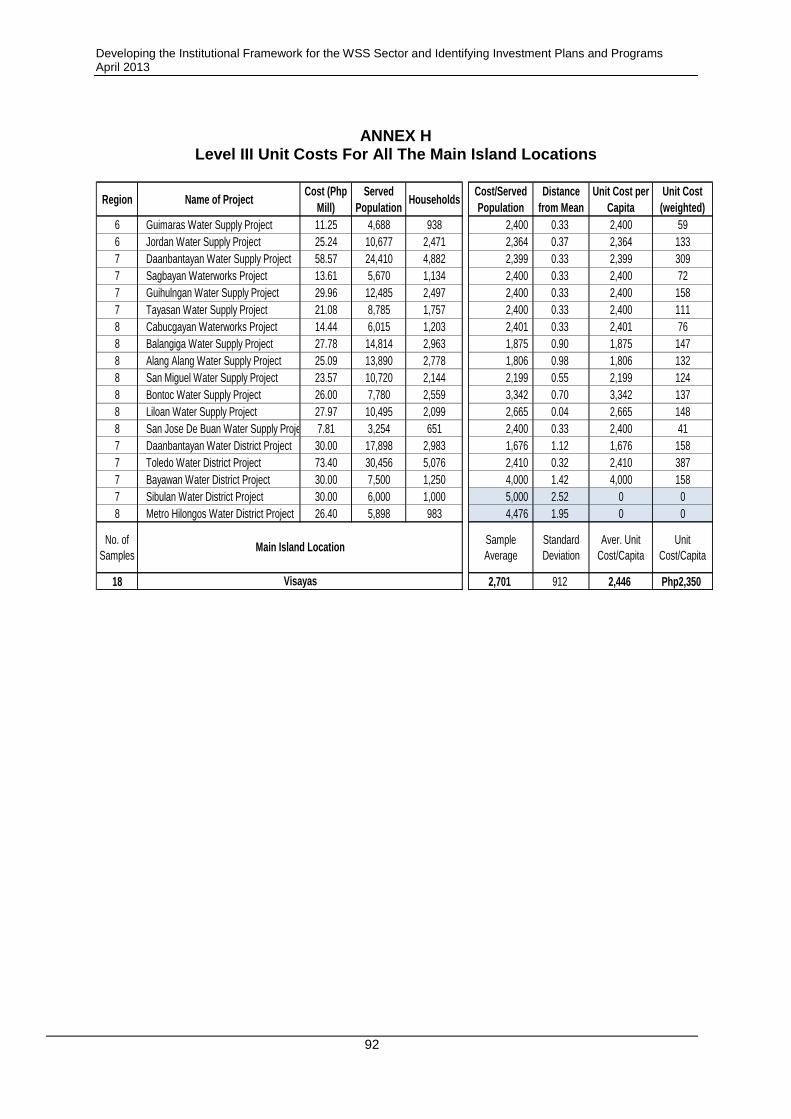
Developing the Institutional Framework for the WSS Sector and Identifying Investment Plans and Programs April 2013
92
ANNEX H
Level III Unit Costs For All The Main Island Locations
Region Name of ProjectCost (Php
Mill)
Served
PopulationHouseholds
Cost/Served
Population
Distance
from Mean
Unit Cost per
Capita
Unit Cost
(weighted)
6 Guimaras Water Supply Project 11.25 4,688 938 2,400 0.33 2,400 59
6 Jordan Water Supply Project 25.24 10,677 2,471 2,364 0.37 2,364 133
7 Daanbantayan Water Supply Project 58.57 24,410 4,882 2,399 0.33 2,399 309
7 Sagbayan Waterworks Project 13.61 5,670 1,134 2,400 0.33 2,400 72
7 Guihulngan Water Supply Project 29.96 12,485 2,497 2,400 0.33 2,400 158
7 Tayasan Water Supply Project 21.08 8,785 1,757 2,400 0.33 2,400 111
8 Cabucgayan Waterworks Project 14.44 6,015 1,203 2,401 0.33 2,401 76
8 Balangiga Water Supply Project 27.78 14,814 2,963 1,875 0.90 1,875 147
8 Alang Alang Water Supply Project 25.09 13,890 2,778 1,806 0.98 1,806 132
8 San Miguel Water Supply Project 23.57 10,720 2,144 2,199 0.55 2,199 124
8 Bontoc Water Supply Project 26.00 7,780 2,559 3,342 0.70 3,342 137
8 Liloan Water Supply Project 27.97 10,495 2,099 2,665 0.04 2,665 148
8 San Jose De Buan Water Supply Project 7.81 3,254 651 2,400 0.33 2,400 41
7 Daanbantayan Water District Project 30.00 17,898 2,983 1,676 1.12 1,676 158
7 Toledo Water District Project 73.40 30,456 5,076 2,410 0.32 2,410 387
7 Bayawan Water District Project 30.00 7,500 1,250 4,000 1.42 4,000 158
7 Sibulan Water District Project 30.00 6,000 1,000 5,000 2.52 0 0
8 Metro Hilongos Water District Project 26.40 5,898 983 4,476 1.95 0 0
No. of
Samples
Sample
Average
Standard
Deviation
Aver. Unit
Cost/Capita
Unit
Cost/Capita
18 2,701 912 2,446 Php2,350
Main Island Location
Visayas
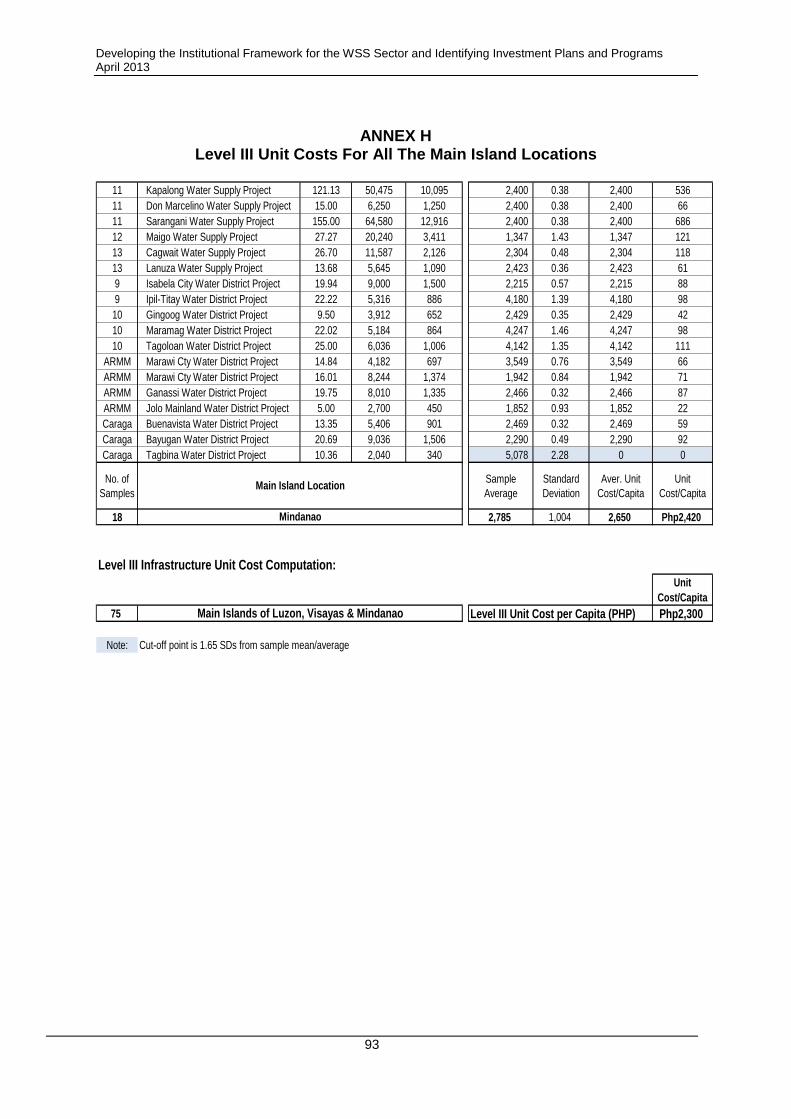
Developing the Institutional Framework for the WSS Sector and Identifying Investment Plans and Programs April 2013
93
ANNEX H
Level III Unit Costs For All The Main Island Locations
11 Kapalong Water Supply Project 121.13 50,475 10,095 2,400 0.38 2,400 536
11 Don Marcelino Water Supply Project 15.00 6,250 1,250 2,400 0.38 2,400 66
11 Sarangani Water Supply Project 155.00 64,580 12,916 2,400 0.38 2,400 686
12 Maigo Water Supply Project 27.27 20,240 3,411 1,347 1.43 1,347 121
13 Cagwait Water Supply Project 26.70 11,587 2,126 2,304 0.48 2,304 118
13 Lanuza Water Supply Project 13.68 5,645 1,090 2,423 0.36 2,423 61
9 Isabela City Water District Project 19.94 9,000 1,500 2,215 0.57 2,215 88
9 Ipil-Titay Water District Project 22.22 5,316 886 4,180 1.39 4,180 98
10 Gingoog Water District Project 9.50 3,912 652 2,429 0.35 2,429 42
10 Maramag Water District Project 22.02 5,184 864 4,247 1.46 4,247 98
10 Tagoloan Water District Project 25.00 6,036 1,006 4,142 1.35 4,142 111
ARMM Marawi Cty Water District Project 14.84 4,182 697 3,549 0.76 3,549 66
ARMM Marawi Cty Water District Project 16.01 8,244 1,374 1,942 0.84 1,942 71
ARMM Ganassi Water District Project 19.75 8,010 1,335 2,466 0.32 2,466 87
ARMM Jolo Mainland Water District Project 5.00 2,700 450 1,852 0.93 1,852 22
Caraga Buenavista Water District Project 13.35 5,406 901 2,469 0.32 2,469 59
Caraga Bayugan Water District Project 20.69 9,036 1,506 2,290 0.49 2,290 92
Caraga Tagbina Water District Project 10.36 2,040 340 5,078 2.28 0 0
No. of
Samples
Sample
Average
Standard
Deviation
Aver. Unit
Cost/Capita
Unit
Cost/Capita
18 2,785 1,004 2,650 Php2,420
Unit
Cost/Capita
75 Level III Unit Cost per Capita (PHP) Php2,300
Note: Cut-off point is 1.65 SDs from sample mean/average
Mindanao
Main Islands of Luzon, Visayas & Mindanao
Level III Infrastructure Unit Cost Computation:
Main Island Location
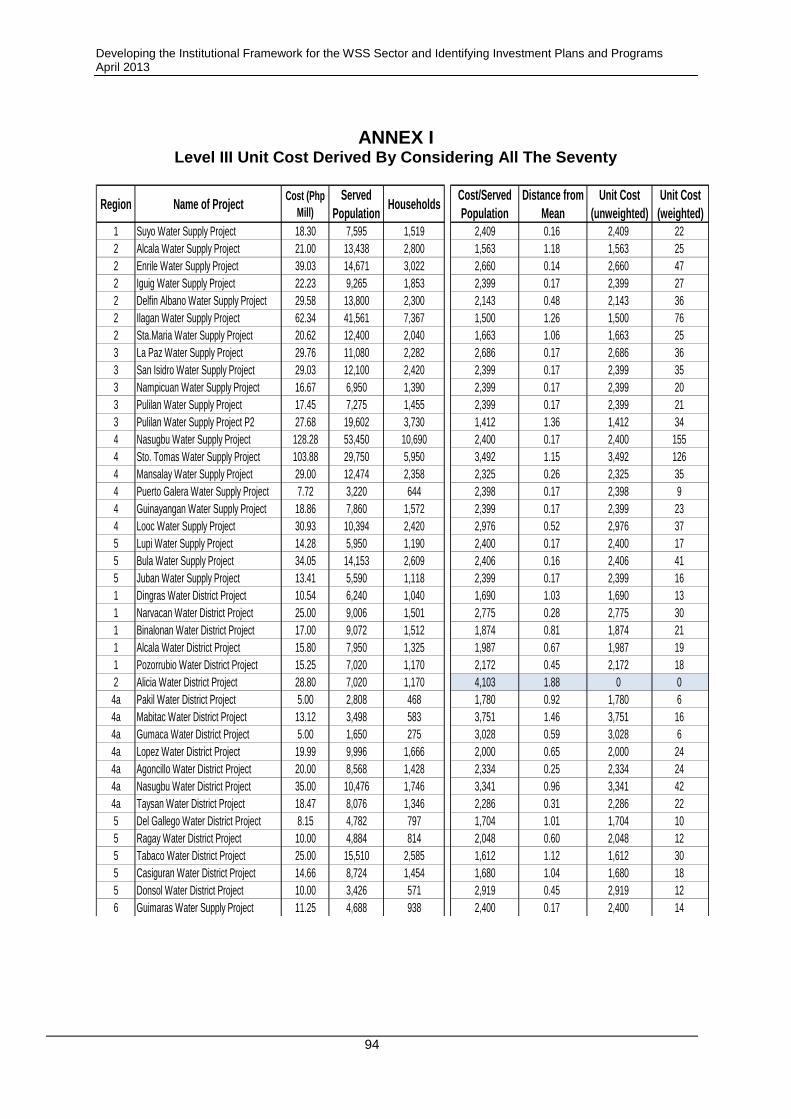
Developing the Institutional Framework for the WSS Sector and Identifying Investment Plans and Programs April 2013
94
ANNEX I Level III Unit Cost Derived By Considering All The Seventy
Region Name of ProjectCost (Php
Mill)
Served
PopulationHouseholds
Cost/Served
Population
Distance from
Mean
Unit Cost
(unweighted)
Unit Cost
(weighted)
1 Suyo Water Supply Project 18.30 7,595 1,519 2,409 0.16 2,409 22
2 Alcala Water Supply Project 21.00 13,438 2,800 1,563 1.18 1,563 25
2 Enrile Water Supply Project 39.03 14,671 3,022 2,660 0.14 2,660 47
2 Iguig Water Supply Project 22.23 9,265 1,853 2,399 0.17 2,399 27
2 Delfin Albano Water Supply Project 29.58 13,800 2,300 2,143 0.48 2,143 36
2 Ilagan Water Supply Project 62.34 41,561 7,367 1,500 1.26 1,500 76
2 Sta.Maria Water Supply Project 20.62 12,400 2,040 1,663 1.06 1,663 25
3 La Paz Water Supply Project 29.76 11,080 2,282 2,686 0.17 2,686 36
3 San Isidro Water Supply Project 29.03 12,100 2,420 2,399 0.17 2,399 35
3 Nampicuan Water Supply Project 16.67 6,950 1,390 2,399 0.17 2,399 20
3 Pulilan Water Supply Project 17.45 7,275 1,455 2,399 0.17 2,399 21
3 Pulilan Water Supply Project P2 27.68 19,602 3,730 1,412 1.36 1,412 34
4 Nasugbu Water Supply Project 128.28 53,450 10,690 2,400 0.17 2,400 155
4 Sto. Tomas Water Supply Project 103.88 29,750 5,950 3,492 1.15 3,492 126
4 Mansalay Water Supply Project 29.00 12,474 2,358 2,325 0.26 2,325 35
4 Puerto Galera Water Supply Project 7.72 3,220 644 2,398 0.17 2,398 9
4 Guinayangan Water Supply Project 18.86 7,860 1,572 2,399 0.17 2,399 23
4 Looc Water Supply Project 30.93 10,394 2,420 2,976 0.52 2,976 37
5 Lupi Water Supply Project 14.28 5,950 1,190 2,400 0.17 2,400 17
5 Bula Water Supply Project 34.05 14,153 2,609 2,406 0.16 2,406 41
5 Juban Water Supply Project 13.41 5,590 1,118 2,399 0.17 2,399 16
1 Dingras Water District Project 10.54 6,240 1,040 1,690 1.03 1,690 13
1 Narvacan Water District Project 25.00 9,006 1,501 2,775 0.28 2,775 30
1 Binalonan Water District Project 17.00 9,072 1,512 1,874 0.81 1,874 21
1 Alcala Water District Project 15.80 7,950 1,325 1,987 0.67 1,987 19
1 Pozorrubio Water District Project 15.25 7,020 1,170 2,172 0.45 2,172 18
2 Alicia Water District Project 28.80 7,020 1,170 4,103 1.88 0 0
4a Pakil Water District Project 5.00 2,808 468 1,780 0.92 1,780 6
4a Mabitac Water District Project 13.12 3,498 583 3,751 1.46 3,751 16
4a Gumaca Water District Project 5.00 1,650 275 3,028 0.59 3,028 6
4a Lopez Water District Project 19.99 9,996 1,666 2,000 0.65 2,000 24
4a Agoncillo Water District Project 20.00 8,568 1,428 2,334 0.25 2,334 24
4a Nasugbu Water District Project 35.00 10,476 1,746 3,341 0.96 3,341 42
4a Taysan Water District Project 18.47 8,076 1,346 2,286 0.31 2,286 22
5 Del Gallego Water District Project 8.15 4,782 797 1,704 1.01 1,704 10
5 Ragay Water District Project 10.00 4,884 814 2,048 0.60 2,048 12
5 Tabaco Water District Project 25.00 15,510 2,585 1,612 1.12 1,612 30
5 Casiguran Water District Project 14.66 8,724 1,454 1,680 1.04 1,680 18
5 Donsol Water District Project 10.00 3,426 571 2,919 0.45 2,919 12
6 Guimaras Water Supply Project 11.25 4,688 938 2,400 0.17 2,400 14
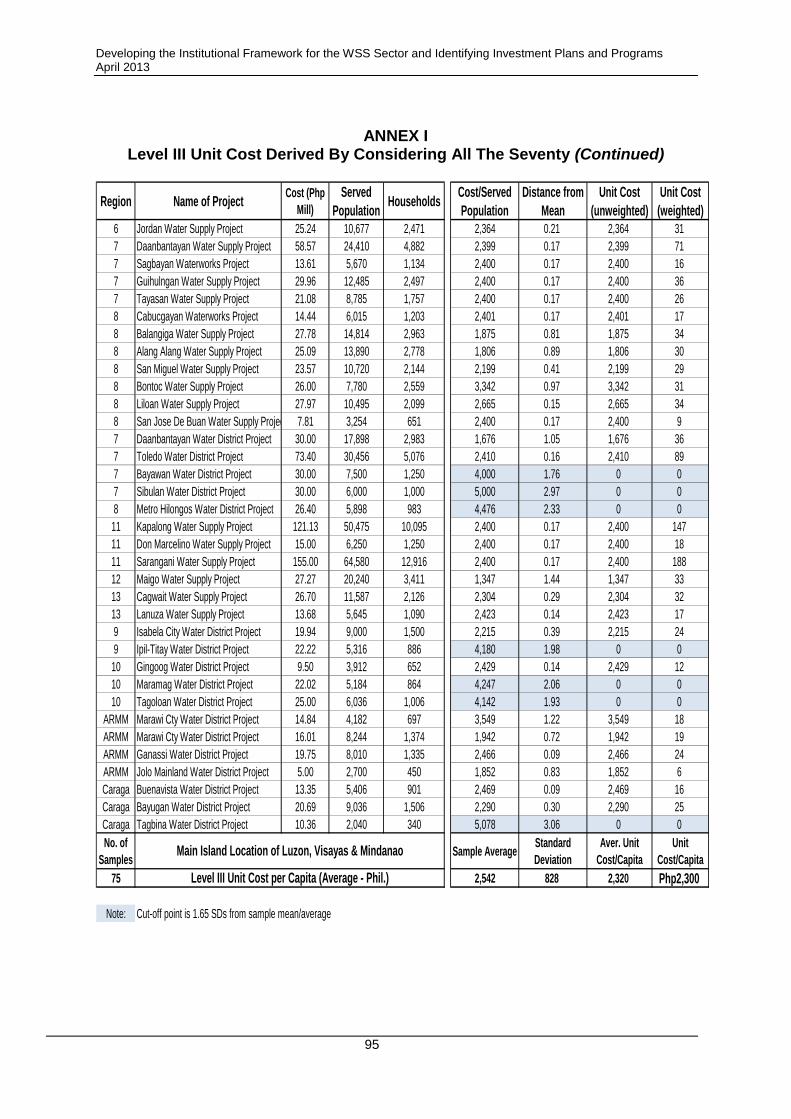
Developing the Institutional Framework for the WSS Sector and Identifying Investment Plans and Programs April 2013
95
ANNEX I
Level III Unit Cost Derived By Considering All The Seventy (Continued)
Region Name of ProjectCost (Php
Mill)
Served
PopulationHouseholds
Cost/Served
Population
Distance from
Mean
Unit Cost
(unweighted)
Unit Cost
(weighted)
6 Jordan Water Supply Project 25.24 10,677 2,471 2,364 0.21 2,364 31
7 Daanbantayan Water Supply Project 58.57 24,410 4,882 2,399 0.17 2,399 71
7 Sagbayan Waterworks Project 13.61 5,670 1,134 2,400 0.17 2,400 16
7 Guihulngan Water Supply Project 29.96 12,485 2,497 2,400 0.17 2,400 36
7 Tayasan Water Supply Project 21.08 8,785 1,757 2,400 0.17 2,400 26
8 Cabucgayan Waterworks Project 14.44 6,015 1,203 2,401 0.17 2,401 17
8 Balangiga Water Supply Project 27.78 14,814 2,963 1,875 0.81 1,875 34
8 Alang Alang Water Supply Project 25.09 13,890 2,778 1,806 0.89 1,806 30
8 San Miguel Water Supply Project 23.57 10,720 2,144 2,199 0.41 2,199 29
8 Bontoc Water Supply Project 26.00 7,780 2,559 3,342 0.97 3,342 31
8 Liloan Water Supply Project 27.97 10,495 2,099 2,665 0.15 2,665 34
8 San Jose De Buan Water Supply Project 7.81 3,254 651 2,400 0.17 2,400 9
7 Daanbantayan Water District Project 30.00 17,898 2,983 1,676 1.05 1,676 36
7 Toledo Water District Project 73.40 30,456 5,076 2,410 0.16 2,410 89
7 Bayawan Water District Project 30.00 7,500 1,250 4,000 1.76 0 0
7 Sibulan Water District Project 30.00 6,000 1,000 5,000 2.97 0 0
8 Metro Hilongos Water District Project 26.40 5,898 983 4,476 2.33 0 0
11 Kapalong Water Supply Project 121.13 50,475 10,095 2,400 0.17 2,400 147
11 Don Marcelino Water Supply Project 15.00 6,250 1,250 2,400 0.17 2,400 18
11 Sarangani Water Supply Project 155.00 64,580 12,916 2,400 0.17 2,400 188
12 Maigo Water Supply Project 27.27 20,240 3,411 1,347 1.44 1,347 33
13 Cagwait Water Supply Project 26.70 11,587 2,126 2,304 0.29 2,304 32
13 Lanuza Water Supply Project 13.68 5,645 1,090 2,423 0.14 2,423 17
9 Isabela City Water District Project 19.94 9,000 1,500 2,215 0.39 2,215 24
9 Ipil-Titay Water District Project 22.22 5,316 886 4,180 1.98 0 0
10 Gingoog Water District Project 9.50 3,912 652 2,429 0.14 2,429 12
10 Maramag Water District Project 22.02 5,184 864 4,247 2.06 0 0
10 Tagoloan Water District Project 25.00 6,036 1,006 4,142 1.93 0 0
ARMM Marawi Cty Water District Project 14.84 4,182 697 3,549 1.22 3,549 18
ARMM Marawi Cty Water District Project 16.01 8,244 1,374 1,942 0.72 1,942 19
ARMM Ganassi Water District Project 19.75 8,010 1,335 2,466 0.09 2,466 24
ARMM Jolo Mainland Water District Project 5.00 2,700 450 1,852 0.83 1,852 6
Caraga Buenavista Water District Project 13.35 5,406 901 2,469 0.09 2,469 16
Caraga Bayugan Water District Project 20.69 9,036 1,506 2,290 0.30 2,290 25
Caraga Tagbina Water District Project 10.36 2,040 340 5,078 3.06 0 0
No. of
SamplesSample Average
Standard
Deviation
Aver. Unit
Cost/Capita
Unit
Cost/Capita
75 2,542 828 2,320 Php2,300
Note: Cut-off point is 1.65 SDs from sample mean/average
Main Island Location of Luzon, Visayas & Mindanao
Level III Unit Cost per Capita (Average - Phil.)
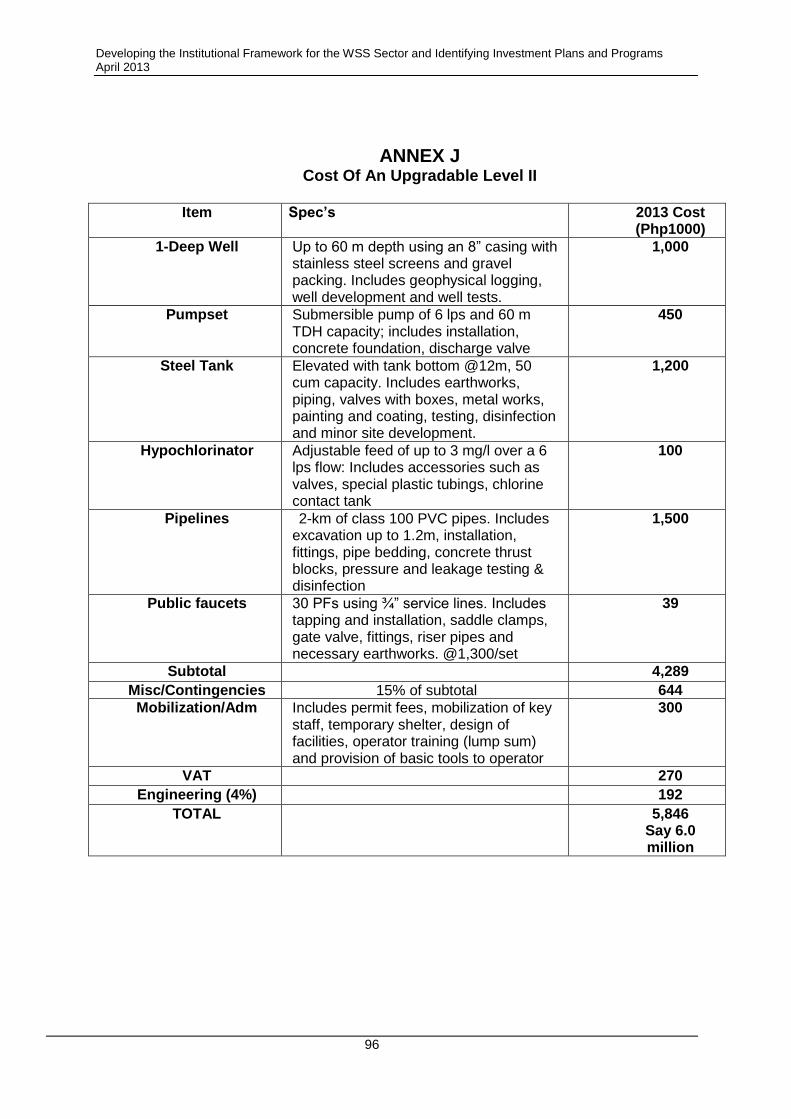
Developing the Institutional Framework for the WSS Sector and Identifying Investment Plans and Programs April 2013
96
ANNEX J Cost Of An Upgradable Level II
Item Spec’s 2013 Cost
(Php1000) 1-Deep Well Up to 60 m depth using an 8” casing with
stainless steel screens and gravel packing. Includes geophysical logging, well development and well tests.
1,000
Pumpset Submersible pump of 6 lps and 60 m TDH capacity; includes installation, concrete foundation, discharge valve
450
Steel Tank Elevated with tank bottom @12m, 50 cum capacity. Includes earthworks, piping, valves with boxes, metal works, painting and coating, testing, disinfection and minor site development.
1,200
Hypochlorinator Adjustable feed of up to 3 mg/l over a 6 lps flow: Includes accessories such as valves, special plastic tubings, chlorine contact tank
100
Pipelines 2-km of class 100 PVC pipes. Includes excavation up to 1.2m, installation, fittings, pipe bedding, concrete thrust blocks, pressure and leakage testing & disinfection
1,500
Public faucets 30 PFs using ¾” service lines. Includes tapping and installation, saddle clamps, gate valve, fittings, riser pipes and necessary earthworks. @1,300/set
39
Subtotal 4,289
Misc/Contingencies 15% of subtotal 644 Mobilization/Adm Includes permit fees, mobilization of key
staff, temporary shelter, design of facilities, operator training (lump sum) and provision of basic tools to operator
300
VAT 270
Engineering (4%) 192
TOTAL 5,846 Say 6.0 million
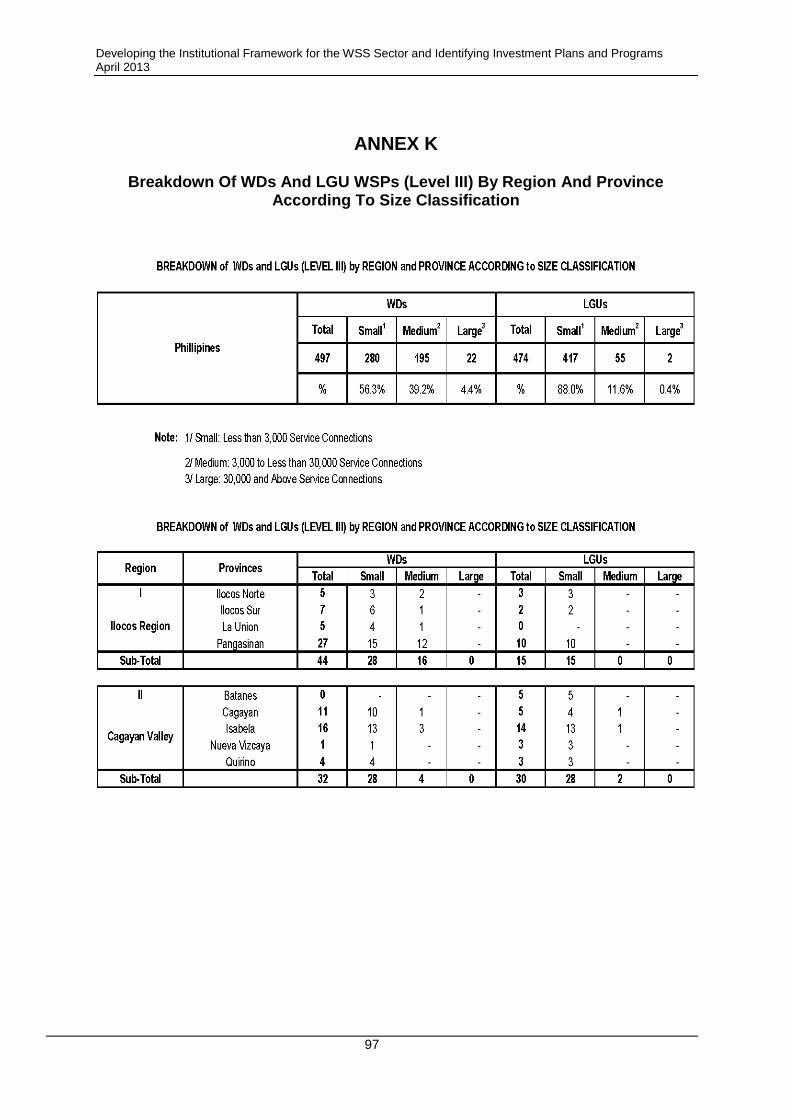
Developing the Institutional Framework for the WSS Sector and Identifying Investment Plans and Programs April 2013
97
ANNEX K
Breakdown Of WDs And LGU WSPs (Level III) By Region And Province
According To Size Classification
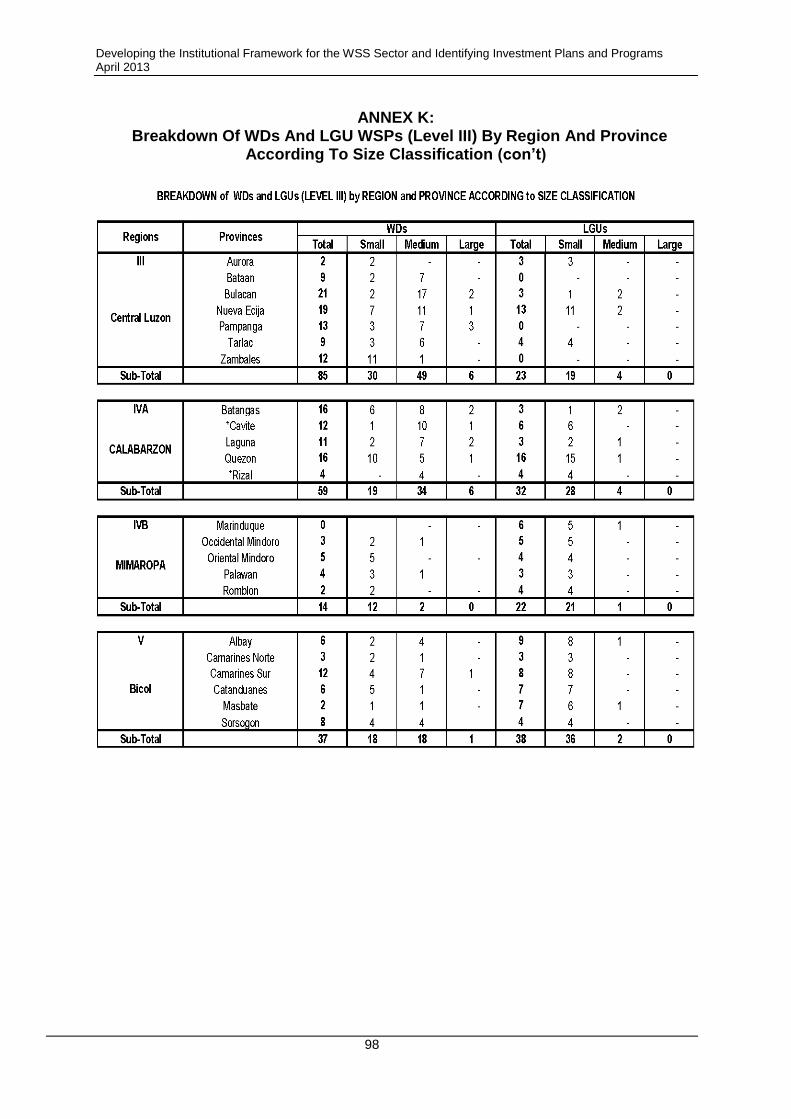
Developing the Institutional Framework for the WSS Sector and Identifying Investment Plans and Programs April 2013
98
ANNEX K: Breakdown Of WDs And LGU WSPs (Level III) By Region And Province
According To Size Classification (con’t)
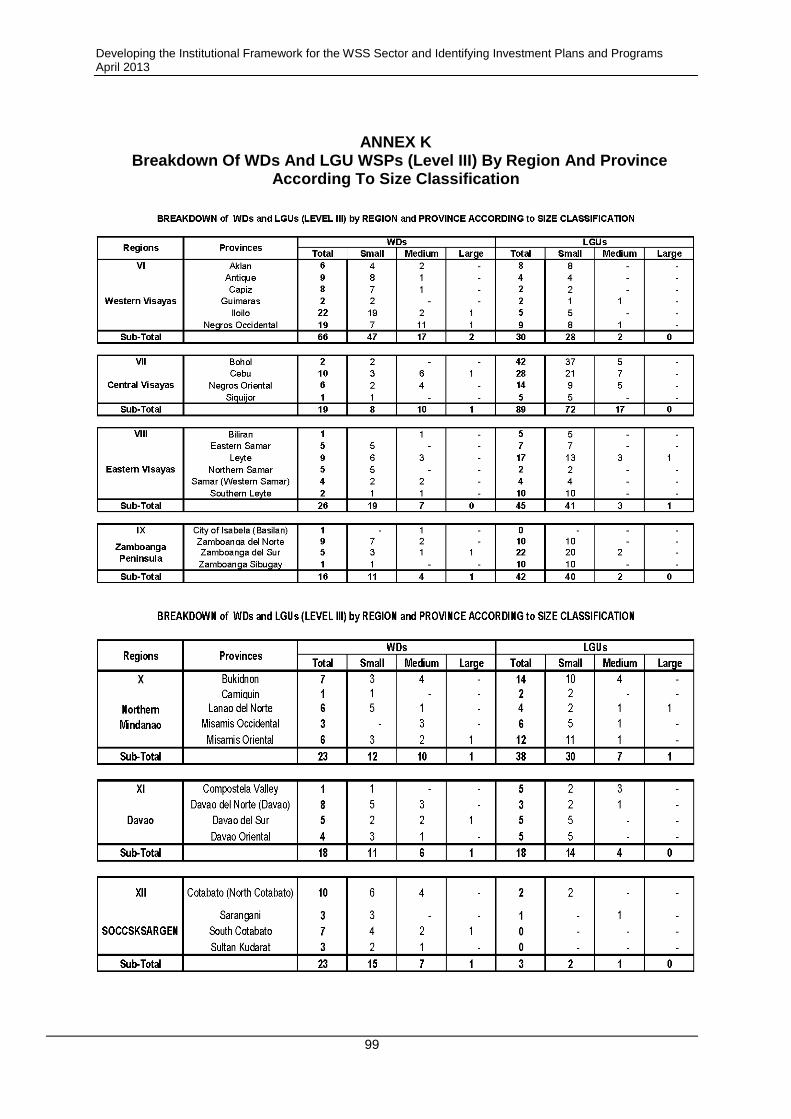
Developing the Institutional Framework for the WSS Sector and Identifying Investment Plans and Programs April 2013
99
ANNEX K
Breakdown Of WDs And LGU WSPs (Level III) By Region And Province According To Size Classification
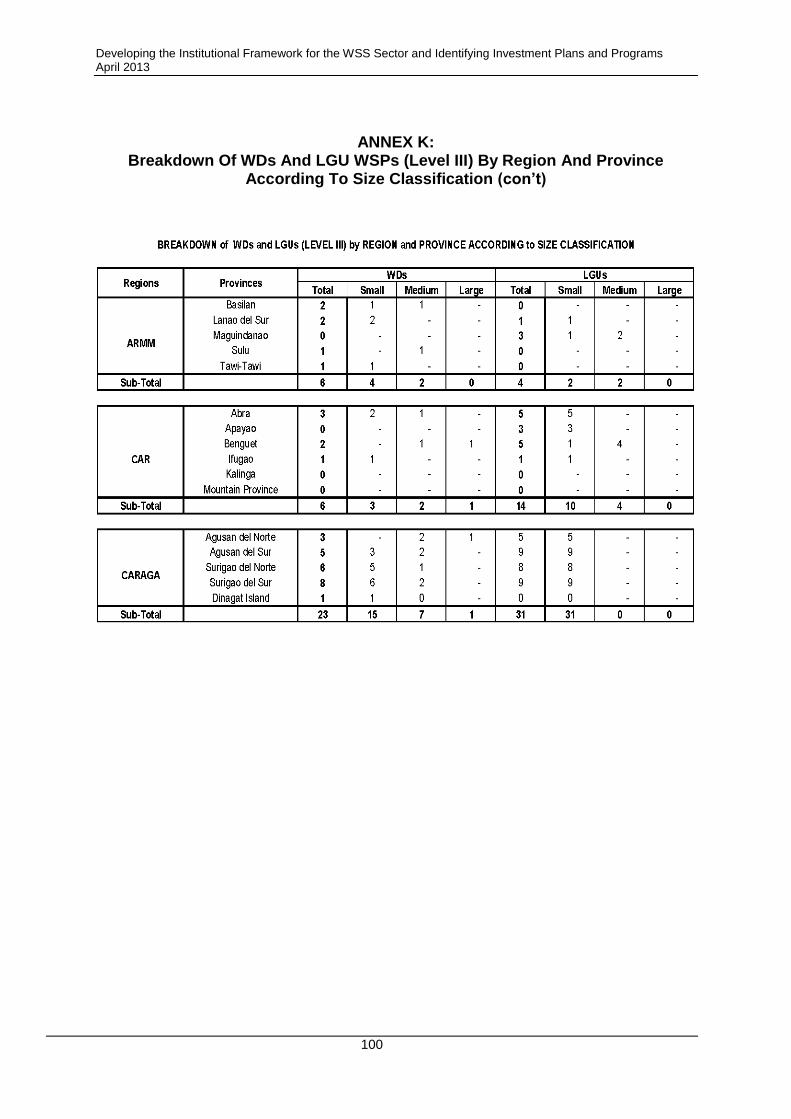
Developing the Institutional Framework for the WSS Sector and Identifying Investment Plans and Programs April 2013
100
ANNEX K:
Breakdown Of WDs And LGU WSPs (Level III) By Region And Province According To Size Classification (con’t)
Developing the Institutional Framework for the WSS Sector and Identifying Investment Plans and Programs April 2013
101
REFERENCES
1. Sustainability of Community-based RWS Organizations, WSP-IBRD, A de Vera,
WPEP 2000.
2. Medium-Term Philippine Development Plan 2004–2010, National Economic and
Development Authority (NEDA) (2004).
3. Meeting Infrastructure Challenges, World Bank, 2005.
4. Philippine Water Sector Assessment Report, DILG-DOH, WHO-GTZ, 2011.
5. Philippine Population by regions; 2000-2007; http://www.cityblogs.nfo.ph.
6. DILG/DOH. (2011). The Philippine Water Supply and Sanitation Sector Assessment
Report. 7. NAPC. (2011). Targetting Waterless Municipalities.
8. National Statistics Office. (2010). Annual Poverty Indicators Survey.
9. NEDA. (2010). Philippines Progress Report on the Millenium Development Goals 2010.
10. UNICEF/WHO. (2012). Progress on Drinking Water and Sanitation 2012 Update.
11. Philippine Sustainable Sanitation Sector Roadmap, DOH, 2009.
12. Morton J et al. Philippines Environment Monitor 2006 on Environmental Health. Washington: World Bank, 2006.
13. Program Implementation Review (PIR): De Dios, Jr., Environmental and
Occupational Health Office, February 8, 2008. Antipolo City, Philippines.
14. Philippine Water Supply Sector Roadmap, NEDA, 2008.
15. WEDC Report, 2006. 16. A Rapid Assessment of Septage Management in Asia: Policies and Practices in
India, Indonesia, Malaysia, the Philippines, Sri Lanka, Thailand, and Vietnam, AECOM International Development and Swiss Institute of Aquatic Sciences and Technology (for USAID). 2010.
17. 2010 NSO data. 18. The Annual Poverty Indicator Survey, 2007. 19. Urban Water Supply & Sanitation Project, Poyry-IDP, ADB, 2012. 20. Support to the NWRB on the Registration and Regulation of WSPs, IPA and OIDC,
WSP-IBRD, 2012.
Developing the Institutional Framework for the WSS Sector and Identifying Investment Plans and Programs April 2013
102
21. Operationalizing the National Water Resources Management Office, Tabios and
Villaluna, IBRD, 2012. 22. Capacity Development Strategy Competency Development Program, N.
Duhaylungsod, UNDP, 2011. 23. Making Reforms Happen, PWRF Experience, PPT by Usec J Paul, 2011. 24. Review of the NG-LGU Cost Sharing for Water and Sanitation, MDGF-UNDP, 2011. 25. Philippine WSS Sector Assessment, Strategy & Roadmap, D. Alikpala et al, ADB,
2010. 26. Diagnostic Report of the Philippine Water Sector, Castalia Strategic Advisors,
IBRD, 2009. 27. Capacity Building Program of LWUA and the WDs, A de Vera, IBRD, 2009. 28. LWUA Grant Study, Navarro & Jose, IBRD, 2009. 29. Philippine Experience; Integrating Water Supply Business Operations, WSP-IBRD,
de Vera & Sy, 2007. 30. Philippine Small Towns Water Utilities Data Book, C Yniguez, WSP-IBRD, 2005. 31. Septage Management in the Philippines: Lessons Learned, DAI, USAID, 2007. 32. Urban Sanitation and Sewerage Case Studies, R Villaluna, WEP-IBRD, 2003. 33. Executive Order No. 62, s. 201. 34. Philippine Development Plan, NEDA, 2011-2016. 35. Rural Water Supply 3-Volume Manuals, DILG-IBRD, A de Vera et al, 2011.

Document of the World Bank