public disclosure authorized primary school...
TRANSCRIPT

Poliy ReMoh
WORKING PAPERS
Education and Social Policy
Education and Social Policy DepartmentThe World BankOctober 1993WPS 1208
Primary School Achievementin English and Mathematics
in Zimbabwe
A Multi-Level Analysis
Levi M. Nyaguraand
Abby Riddell
In Zimbabwe's primary schools, higher achievement in math isassociated with the amount of teacher training and instructionaltime, as well as the pupil-teacher ratio. Higher achievement inEnglish is associated with the pupil-teacher and textbook-to-pupilratios as well as the amount of teacher training.
Policy Rsearch Woking Papers dissmninate the findings of work in progn nd mncourage the exchange of ideas among Bank saff andall othe in eraed in devlopmeai ues Theepa pm, distnbuted by the Rech Advisry Staff, cary thenames of the authors, reflectonlytherviaew, and shouldbeuaed and ctedaccordingly.Thefndings,interpreutions.andcorclusiorl arethe authors' own.Tney shouldniu be attsibuted to the World Bank its Board of Direc , itr managunut, or any iuts manber countries.
Pub
lic D
iscl
osur
e A
utho
rized
Pub
lic D
iscl
osur
e A
utho
rized
Pub
lic D
iscl
osur
e A
utho
rized
Pub
lic D
iscl
osur
e A
utho
rized

l
Poga R |w
Education and Social Policy
WPS 1208
This paper- a product of the Educationi and Social Policy Department - was prepared for the BuildingResearch Capacity work program, which helps countries improve their capabilities in education research,evaluation, and asseq: ments so they can inform policymakers about local learning conditions. Support forthe research was proviu'cd by the Population and Human Resources Department and the Afr.can CapacityDevelopment Fund. Copies of this paperare available free from the World Bank, 1818 H StreetNW, Wash-ington DC 20433. Please c:mntat Ian Conacny, room S6-228, extension 33069 (October 1993, 33 pages).
Using a multilevel modeling procedure, Nyagura ("African") schools, low-fee schools, and districtand Riddell explore: council schools in both subjects.
* The percentage of variance in prima.-y In English, school-type differences persistschool achievement in Zimbabwe that could be after controlling for student intake variables. Forattributed to the types of schools and classes mathematics, they disappear.attended.
School and class variables related to higher* The differences between schools in student math achievcmcnt include the amount of teacher
achievement in mathematics and English. training and instructional time, and pupil-teacherratio.
* The reasons for these differences.Higher achievement in English is related to
They compare filve types of schools. Stu- the pupil-teacher and textbook-to-pupil ratios,dents in Formcr A ("European") schools and and to the amount of teacher training.high-fee schools outperform those in Forner B
The Policy Rcscarch Working Paper Series disseminates the findings of work under way in the Bank. An ob;ective of thc scriesis to get thcsc findings out quickly, ever, if presentations are less than fully polished. The findings, interpretations, andconclusions in these papers do not necessarily represent official Bank policy.
Produced by the Policy Pescarch Dissemination Center
Education and Social Policy DepartmentHuman Resources Development and Operations Policy
The World Bank
Primary School Achievement in Englishand Mathematics in Zimbabwe:
A Multilevel Analysis
Levi M. Nyaguraand
Abby RiddeI*
* The helpful comments of Rosemary Bellew and Marlaine E. Lockheed are gratefully acknowledged.

Acknowledgement
This paper was prepared for the Building Research Capacity work program which tacklesproblems associated with improving the capacity of countries to conduct education research, evaluation,and assessments to inform policy makers about the conditions of learning in their countries. Other papersin the seriec include:
e Harris (1991) Effective Assessment of Educational Progress. A review of strategies formeasuring learning achievement. PHREE/91/34;
* lion (1992) A Frameworkfor Costing Tests in 7hird World Settings. PHREE/92/65;
* Larach and Lockheed (1992) World Bank Lending for Educational Testing. A GeneralOperational Review. PHREE/92/62R;
* Lockheed (1991) Multidimensional Evaluation: Measures for both right nand and lefthand sides of the equation. PHREE/91/46;
* Lockheed (1991) World Bank Supportfor Capacity Building.
Support for the research was provided by the Populatioia and Human Resources Department andthe African Capac ty Developmen. Fund. The heipful comments of Rosemary Bellew are gratefullyacknowledged.
Marlaine E. LockheedEducation and Social Policy Department

Table of Contents
1. Introduction .. (..1....... ( )The Education System.. ................................... ()Schooltynes .................................... (2)
II. Data and Method.. ... ... (3)Sample.. .......... (3)Variables .......................................... (4)Pupil Level Differences .................................... (5)Class Level Differences .................................... (5)School Level Differences .................................... (7)M ethodology ............................................. (I 1)
1Il. Results: Modeling English and Mathematics Achievement .............. . (11)Variance Components Models for Ernglish and Mathematics Achievement .. ..... (12)Schooltype Differences in English and Mathematics Achievement .... ........ (13)Testing Variables in Individual Regressions .......................... (14)Progression Toward the 'Best' Model of English Achievement .............. (20)Progression Toward the 'Best' Model of Mathematics Achievement .... ....... (22)Analysis of Residuals ...................................... (26)
IV. Conclusions ............................ (29)References ...................... ........................ . ... (31)Armnex A: Glossary of Variable Names ........... .. .............. (32)
Tables
Table 1. Breakdown of Sample by School Type, Classes and Pupils . .(4)Table 2. Mean Values of Student-Level Variables by Schooltype . .(6)Table 3. Mean Values of Class-Level Variables by School Types .. (8)Table 4. Mean Values of School-level Variables by School Type .. (10)Table 5. Frequency of Resource Availability by Type of Primary School . .(12)Table 6. Variance Components Models for English and Mlathematics Achievement . .(13)Table 7. Schooltype Differences (Base Model) for English and Mathematics Achievement . . . (14)Table 8. Coefficients of Student-Level Variables Estimated in Individual Multi-Level
Regressions on English and Mathematics Achievement ... . .......... . . . . . (15)Table 9. Coefficients of Class-Level Variables Estimated in Individual Multi-Level Regressions
on English and Mathematics Achievement ....... . . .......... I . . . . . . . (17)Table 10. Coefficients (Standard Errors) aind Variance Explained for Combinations of Student-
level and School-t-pe Variables Regressed on English Achievement . ....... . . . (19)Table 11. Coefficients (Standard Errors) and Variance Explained for Combinations of Student-
level and School-type Variables Regressed on Mathematics Achievement ....... . (24)Table 12. Bottom and Top Schools Ranked by Standardized School Level Residuals for
English . . . . . . . . . . . . . . . . . . . . . . . . . . . . . . . . . . . . . . . . . . . . . . . . (27)Table 13. Bottom and Top Schools Ranked by Standardized Class Level Residuals for
Mathematics .............. .. . ......................... .. . (28)

Primary School Achievement in English and Mathematicsin Zimbabwe: A Multilevel Analysis
1. Introduction
1. Zimbabwe has undergone tremendous expansion in its education system since Independence in1980. Primary school enrollment doubled in the first three years of Independence and has grown steadilyever since. Access to primary education is now almost universal. Like secondary education, which hasundergone even more rapid expansion, the initial concern with access has given way to an increased focuson the quality of educacion. Alongside the rapid expansion in the numbers of schools and studentsenrolled at primary and secondary education has been a correspondent rapid increase in the numbersenrolled in teachers' colleges-an increase of nearly five-fold in the first ten years of Independence. Tothe extent that examination scores on matherratics and English achievement tests are a measure of schoolquality, this study aims to identify what factors ac,ount for differences in school quality across the rangeof Zimbabwean schools.
the Education System
2. Zimbabwe inherited a set of highly disparate educational institutions, which reflected the raciallydiscriminating policies of the white settler community as well as a British colonial pattern of education,deAgned to offer different types of education for different economic classes. Since Independence, newschooltypes have been added, overwhelming relying on local communities to establish schools under theauthority of the district councils in the rural areas, or the city councils in the new high-density urbanareas. In aOdition, the number of private, high-fee-paying schools has increased since Independence,swelling the ranks of schools alternative to the central government- and mission-run schools formerlycatering to the so-called 'Europeanis' (whites), or increasingly, the relatively well-off o; all races. Thegamut of schooltypes explored in this study, therefore, goes from the prototypical, well-endowed, English'public' school to the newer and relatively un,' .-resourced district and city council schools.
3. Zimbabwe's education system has a seven year primary cycle followed by a four year plus twoyear secondary cycle. Whereas the examinations in mathematics and English given at Grade 7 used tobe for the purpose of selecting those able to advance to secondary school, they are no longer intendedfor such purpose, though in practice, they are often used as a streaming device for secondary schoolclasces as well as a weeding device between secondary schools. The transition rate to secondary schoolfrom Grade 7 at Independence was 27%, but this rate shot up to 86% in thP first year of Independence,as those formerly denied a secondary education were afforded access to the new schools. By 1990 thesehigh rates had diipped to about two-thirds of Grade 7 completers entering Form I classes.'
4. Thrt , questions comprise the focal points of this study of Zimbabwe's primary schools ten yearsafter Independence:
Form I is eauivalent to Grade 8. No study has been carried out to determine the factors behind the differentialrates of access-no less attainment-at secondary school since Independence, but it can be assumed that acombination of factors is responsible, including the adjustment of the system to over-age students, initially, theestablishment of new secondary schools, and two additional factors which require investigation: changes in thequality of education and the elasticity of demand for secondary education given different householdcharacteristics.

(a) What differences across schooltypes can be found in English and mathematicachievements at Grade 7, the final year of primary schooling?
(b) What accounts for between-school variation in English and mathematic achievements?(c) Which are the most 'effective' primary schools in Zimbabwe?
Schooltypes
5. Education policy since Independence has changed the nature of many of the schooltypes inheritedin 1980. Not the least of such policies has been the abolition of racial discrimination. For instance, theformer whites-only central-government-run schools are now predominantly black. Such changes,however, have not completely altered their inherited traditions. On the surface, the uniforms have oftenremained the same so that if the streets of Salisbury were once filled with little Gatsby-esque'Englishmen' in their boater hats, similar apparel now adorns Af :can faces in Harare. The surfacetraditions, however, belie the schooltype differences which we wish to investigate here, some of whichrelate to pre-existng, physical resource endowments as well as ethos.2
6. Five schooltypes were selected as representative of the gamut of schooltypes existing in thecountry in 1990. Two central government schooltypes, the former 'Group A' and the former 'Group B'schools were included. These schools are funded predominantly by the government.' Group A schoolswere those catering for the so-called 'European' community prior to Independence and had well-trainedteachers, well-resourced physical plants and active parent-teacher associations. Group B schools werethose catering to the African urban populatioti and had less favorable resources afforded them both bygovernment as well as by the less-well-off parents whose children they served. Staffing of Group Bschools reflected the non-standard (less arduous) teachers' qualifications permitted in these schools.Different pupil-teacher ratios were legislated before Independence for the different government schools.Today, although they have been equalized, the physical plant of the Group A schools, catering for smallerclass sizes, has made it difficult to equalize resources across them in practice.
7. Distinct from central-government-funded schools are three alternative schooltypes: 'high-fee-paying schools' and two forms of local-government-funded schools, 'low-fee-paying' and 'district council'schools. 'High-fee-paying schools' are what they say they are, but in addition, comprise really twostrands of 'private' schooltypes. They include the mission schools, often boarding, which have a longhistory in Zimbabwe, dating back to the turn of the century and catering for both 'European' and Africancommunities, traditionally separately. In addition are the schools based on the English 'public school'prototype, being well-endowed in every respect, and designed for the well-to-do. Some of these havebeen around for many years, but added to their number are many more which have been registered since
2 Although data werR not collected in this study on variables related to school 'ethos', it is assumed that indelineating the dii i-ent sC.iooltvpes and stratifying the sample according to these schooltypes that some of thedifferentiation unaccountei for by the physical resource variables on which data were collected can be tracedto such harder-to-esearch factor,--and indeed should be the subject of further investigations of the 'effective'schools identifieu. Had gov_-nTr -,chools been taken t-gether as one schooltype, this aifferentiationevidenced in this research would L. oeen lost
3 Tuition was not charged at primary schools in Zimbabwe until 1992 when differential rates were introducedfor rural vs. urban schools in an attempt to have parents who were able to pay, especially in the urban areas,contribute to the costs of their children's education on a scale similar to the sacrifices made by parents in therural areas in the establishment, no less endowment, of their new schools.
2

Independence. and which are designed to cater to a similar clientele, enlarged by those numbers retreatingfrom what is no longer an exclusive government system.'
8. The remaining two schooltype classlfic itions both derive from local government sources, and arenew since Independence, th 'low-fee-paying schools' catering to t-he African urban population not servedby the insufficient numbers of central government schools, and the district coun:i. schools, servingsimilarly under-provided, rural African communities. Both local government schooltypes share poorresource bases due to their recent establishment, as well as the rela:iye poverty of the communities fromwhich they obtain their support.
9. All five schoolt)pes delineated in this study receive central government funding for theiroperation, namely in teachers' salaries, afforded on the basis of the same pupil-teacher ratio throughout,and the same per capita grants across the non-central government schooltypes. The central governmentschooltypes have all of their major running costs paid for by the central government, unlike the restwhich have to make up the difference from parents' pockets or odter sources (e.g., beer hall profits).
I1. Dcta and Method
Sample
10. The target group for this stujy consisted of 1990 Grade 7 pupils, their teachers and the heads oftheir schools. The school population was stratified into the five schooltypes described above. Threeregions were selected from which schools were randormly sampled from randomly selected districts.Criteria for selecting the regions were that a fair representation of Ndebele and Shona children shouldbe included, as weal as a fair representation of both urban and rural schools.
'1. The districts and the number of schools selected were:
(a) In Harare Region: Harare District (31 schools).(b) In Mashonaland West Region: Chegutu (7 schools), Kadoma (9 schools), Lomagundi (9
schools), Hurungwe (10 schools), arid Kariba (3 schools).(c) In Matabeleland North Region: Bulawayo (i4 schools), Binga (4 schools), Bubi (4
schools), Hwange (5 schools), Lupane (7 schools), Nkayi (7 schools) and Nyamandlovu(8 schools).
12. A stratified random sample proportional to the size of the primary schools and the size of thedistricts in the chosen regions was drawn. All Grade 7 children and their tcachers at the selected schoolswere then surveyed, as well as the heads of all the schools. Table I provides a breakdown of the sampleby schooltype, classes and pupils.5
4 It is not necessary to suggest that the motives of this enlarged clientele are racist. lTe enlarged numbers areseeking out more exclusive, and in their view, higher-quality schools, at miinimum, on grounds of class, if notfor other reasons.
5 It would not appear that the numbers of schools sampled within each of the schooltype strata reflect therepresentation of that schooltype within the total population of schools. Statistics for 1991 show that some 6 %of primary schools in Zimbabwe were government schools, 6% (mission and trust schools, read 'high-fee-paying'), 1 % urban council (read 'low-fee-paying'), 73 % district council schools, 5 % rural council schools and9% other types of schools. (Ross and Postlethwaite 1992, p.4) Government and low-fee-paying schools seemto be oversampled, which would give an urban bias to the sample.
3

Table 1. Breakdown of Sample by School 7ype, Classes and Pupils(percent)
Final Sample
Original School Sample School Clars Pupils
Schoo! Type A %b Response X V N V N %'Rate (%b)
Former A 14 12 64 9 1OC 19 IOC 642 5'
Former B 19 16 53 10 12 44 23 1840 27
High Fee Paying 9 8 78 7 8 14 7 408 6
Low Fee Paying 15 13 73 11 13 34 18 1380 20
District Council 61 52 80 49 57 81 42 2657 38
Total 118 100 73 86 100 ,92 100 6927 100
Notes:a A = Former Government Group A; B = Former Govemment Croup B;HFP = High Fee-Paying; LFP = Low Fee-Paying; DC = District Council
b Percentage of original samplec Percentage of final sample
Variables
13. The variables on which information was collected were at thrae levels, describing differencesbetween students in their backgrounds, between classes, and between schools. Three questionnaires wereused to collect this information, addressed to the students, their Grade 7 teachers, and the heads ef theirschools. In addition, other information was collected from the Ministry of Education's statistical returns,the ED46 (Part II). Data for the study were collected between July and December 1990.
14. The outcome variables used were Grade 7 Examination scores in English and mathematics,obtained from the Examinations Branch of the Ministry of Education. These exams are scored on astanine scale, from 9 (low) to 1 (high). In order for the results of the regressions to be more easilyinterpretable, these scores v.ere transformed (new score= 10-old score) so that 9, instead of 1, is thehighest score. The student variables include gender, cge, years spent in pre-school, years taken tocomplete primary education, days the pupil was absent from school, time devoted to English andmathematics homework, home language, number of children in the family and parents' educatiun levels.
15. Class level variables report teachers' information (gender, age, qualification, experience),teacher's use of time for academic activities and games and sports, class size, class textbook availabilityin English and mathematics, and teaching load.
16. School level variables include organizational information (streaming of pupils, number of sessions,teacher stability, distribution of time to academic and sports activities, school size, time devoted toschool-based inservice activities), material and non-material inputs (textbook availability, library books,teacher experience, percentage trained teachers, professional support to teachers through sup rvision bythe head teacher), social composition (ethnic and gender composition of the school, boarding status), and
4

head teacher's data (gender, qualifiwation, teaching expierience, administrative experience, and whetherreceived training as a head teacher.)
17. The complete list of variables on which information was collected can be found in Annex A. Thedifferences between the schooltypes can be easily judged, variable by variable, from Tables 2-4, whichreports means and standard deviations (in pdrentheses) for variables Included in this study.6
Pupil Level Differences
18. As cali be seen in Table 2, the highest average scores in both subjects are obtained at the high-fee-paying and former Group A schools. As already pointed out under the description of varia3les,scores range from 1 (low) to 9 (high); scores of 4-9 are considered passing. Table 2 also illustrates thedifferences in intake of the different schooltypes by stuJent background variables, which may account forsome of these differences in achievement. Relative to an average of 44% of the fathets of the sampledstudent population having no education, 66% of the fathers of district council school pLpils wereuneducated, against lows of 7% and 14%, respectively, for former Group A and high-fee-paying schools.Whereas more than half of the fathers of the pupils sampled in the high-fee-paying and Group A schoolshad secondary education, only 1 to 2 % were similarly educated at the district council, Group B, and low-fee-paying schools. In addition to coming from less educated families, students attending the low-f3e-paying and district council schools come from larger families and district council school pupils takelonger, on average, to complete primary education.
Class Level Differences
19. Information collected at the class level illustrates significant schooltype differences as A -Il (Table3). The lowest percentage of female teachers are found in district ~.ouncil schools, 8% on average,whereas 79% of the teachers in the high-fee-paying schools surveyed were women.7 77% of the teacherssurveyed claimed that they had ieceived 'standard' teacher ,raining requiring completion of Form IV plus
6 Only those variables capable of being utilized in the study are reported in Table 2. This is not the completelist, because in the data entry, the value 0 used for 'non-response' overlapped with a real value of 0, mak-ingthese variables unusable. The variables which had to be eliminated from the analysis for this reason included:PRESCHYR (Years spent in pre-school); DAYSABS (Number of days a pupil was absent from school in termsI and 2 of 1990); EHWTIME and MHWTIME (hours per week devoted to English or mathematics homework,respectively); TCHABS (Number of days a teacher was absent from school in terms 1 and 2 of 1990);EUNSUP and MUNSUP (Unsupervised English/mathemnatics study hours per week); and LIBBOOKS (Totalnumber of books in the school library).
7 On its own, one cannot mqke much of such a statistic, but further investigation would be appropriate todetermine the reasons behind such gender disparities in teacher allocation. It could reflect the inadequacy ofteachers' housing and the difficulty of young, unmarried women moving out to rural areas different from theirown, particularly as untrained or less experienced, new recruits comprise the majori:, f those taking up suchpositions.
5

table 2. Mean Values of Student-Level Variable: by Scho/ltype(standard deviations in parentheses)
All Former F ,mer High Fee Low Fee Distric;Variable Scl.ools Group A Group B Paying Paying Council
Grade 7 English score 5,? 8.2 5.7 8.2 5.7 4.6(2.2) (1.2) (1.9) (1.7) (2.0) (1.9)
Grade 7 mathematics score 4.9 6.8 4.7 6.8 5.2 4.1(2.2) (1.9) (2.1) (2 9) (2.1) (2.0)
Age in years 13.7 12.9 13.5 12.7 13.9 14.1(1.5) (0.8) (I.1) (1.2) (1.4) (1.7)
Years taken to reach Gr. 7 ';. 2 7.1 7.1 7.2 7.2 7.4(0.6) (0.4' (0.5) (0.5) (0.5) (0.9)
Nunmber of children in family 6.6 5.8 5.7 5.4 7.1 7.7(3.9) (2.1) (3.7) (1.8) (4.0) (4.4)
father's education
No education 44% 7% 42% 14% 439% 66%
Primary 16% 5% 19%o 5% 18% 18%
Junior Certificate 24% 36% 30% 19% 29% 13%
O-Level 10% 25% 9% 28% 8% 2%
A-Level or higher 6% 26% 1% 35% 2% 1%
Mother's education
No education 52% 12% 50% 11% 54% 75%
Primary 20% 16% 24% 9% 23% 18%
Junior Certificate 19% 45% 23% 23% 19% 6%
O-Level 6% 14% 4% 31% 3% 1%
A-Level or higher 4% 14% - 26% 1% -
Noe.: For categorical variables percentages in each categorv are shown
3-4 years of teacher training.' The highest proportion of untrained teachers was found in the districtcouncil schools-25%. Further teacher characteristics underline the discrepancies in teachers'
This statistic seems high and could retlect either inflated reporting on the part of the teachers surveyed or amisunderstanding of the various categories of qualification. About 50% of primary school teachers wereuntrained in 1990. However, it is possible that within schools, the allocation of trained teachers is more infavor of the Grade 7 classes, thus accounting for this discrepancy. Such an hypothesis would be borne out inpart if school level repornog of percentages of trained teachers were closer to the expected figures. As onewill see below, the figures at the school lean in this direction, but higher proportions of 'standard trained'teachers are still reported tian what would be expected.
6

backgrounds across the various schooltypes: the youngest-as well as least experienced,understandably-teachers are found in the district council schools. Whereas the average age of teachersat high-fee-paying schools was 42, with 18 years of teaching experience, the average age of teachers atdistrict council schools was 30, with an average of 9 years of teaching experience. As would beexpected, less experienced teachers require longer planning timre to prepare their classes. Nearly twiceas much time is spent in class preparation at district council schools relat; e to high -fee-paying schools,
20, Average class sizes ranged from 31 at the high-fee-paying schools up to 43 at t. ? low-fee-payingschools. The less well-resourced urban schools have to contend with larger numbers o pupils on top oftheir other disadvantages. The discrepancy inherited between Group A and other urban schools is stillprevalent-their average class size is closer to the high-fee-paying schools than the otiter central or localgovernment schools. This is no doubt related to the smaller physical classroom sizes, amo.ig otherfactors.
21. If some of the above schooltype differencts could have been anticipated, one of the most strikingfacts uncovereu in the descriptive analysis of schooltype differences is that low-fee-paying and districtcouncil schools spend only three-qu.-ters of the amount of time in mathematics instruction in comparisonwith other school types. It could be that fewer hours of instructional time is related to the larger teachingloads of teachers at these schools. An extra 3-5 hours teaching per .veek is assip ted district councilschool teachers, relative to their counterparts in other schooltypes. Peculiarly, while district councilschool teachers spend less time on average on mathematics instruction, they spend more time on averagein teaching games.
22. Add to the above factors the lower availability of textbooks at the classroom level, and beforethe more poorl- qua!ified teacher h- even entered the classroom, one has weighe-d in very disparatefactors across the various schooltypes. There are three tiers in the availability of textbooks: pupils atdistrict council schools have fewer than one textbook for every two pupils; at low-fee-paying and GroupB schools two textbooks are shared, on average, between three pupils; and at Group A and high-fee-paying schools, there is just under one textbook for every pupil on average.
23. Eight other class level variables on which data were collected in all schools were not found todiffer signifiantly across schooltypes.9 They relate to the amount of time a teacher uses for planningclasses in mathematics,, .arking in both subjects, the overali instructional time in English, and the amountof time given to classroom activities and supervised study in both subjects. As can be seen fromexamining Table 2, there are larger discrepancies across the English planning time variable than is thecase for mathematics. The opposite holds true for the amount of instructional time ;.. mathematics orEnglish.
School Level Differences
24. Differences between schooltypes are also found in comparisons of school-level variables, furtherhighlighting what seems to be the underlying princi9le: 'to those that have, they shall be given,' ratherthan the other way around (Table 4). For instance, if it is assumed that it is a more difficult task tocreate a new school than to carry on the traditions of an older one, it would seem appropriate to allocatethe most experienced head teachers to the newer schools, rather than filling the ranks of the older,
(p>.0 5 )
7

Table 3. Mean Values of Class-Level Variables by School 7ypes(standard deviations in parentheses)
All Former Former High Fee Low Fee DistrictVariable Schools Group A Group B Paying Paying Council
Female teacher 27% 26% 41% 79% 32% 8%Teacher's age 33.3 37.2 36.0 42.2 31.3 30.0
(8.8) (7.4) (8.7) (12.3) (6.3) (7.6)Teacher's qualificationStandard trained 77% 100% 71% 79% 88% 69%(Form IV and Cert. Ed.)Form IV and 2 years 3% - 7% 14% 3% -
Form II and 2-3 years 10% - 23% 7% 6% 7%(PTL/PTH/T3/T4)Untrained 11% - - - 3% 25%
Teacher experience 10.9 13.7 12.5 17.9 8.5 9.1(8.6) (8.0) (9.5) (9.5) (5.5) (8.4)
Class size 37.8 33.8 42.6 31.1 42.9 35.0(7.7) (6.7) (3.3) (4.7) (3.6) (8.6)
Hours/week planning 4.7 3.7 4.6 2.9 4.3 5.6English (3.4) (2.5) (2.3) (1.6) (2.4) (4.3)
Hours/week planning 4.2 3.8 4.3 2.8 3.9 4.7mathematics' (3.2) (2.6) (2.3) '1.4) (2.7) (4.0)
Hours/week grading 5.8 5.0 5.8 5.7 5.5 6.2English' (3.3) (2.5) (3.1) (3.0) (2.4) (3.9)
Hours/week grading 4.9 5.1 4.9 5.3 4.2 5.2mathematics' (3.1) (2.8) (3.3) (2.2) (2.2) (3.4)
Instructional hours in 164 164 171 162 169 159English' (51) (65) (76) (38) (44) (32)
Instructional hours in 103 123 120 126 92 90mathematics (51) (71) (71) (38) (48) (25)
Hours/week class 3.3 3.7 3.0 2.9 3.5 3.5activities in English' (1.9) (2.3) (1.5) (1.9) (1.6) (2.1)
Hours/week class 2.8 3.2 2.5 2.8 2.5 3.0activities in mathematics (1.7) (2.0) (1.3) (1.2) (1.2) (2.1)
Grade 7 English textbook .61 .92 .69 .88 .65 .42to pupil ratio (.29) (.19) (.28) (.22) (.31) (.19)
Grade 7 mathematics .63 .95 .63 .92 .68 .48textbook to pupil ratio (.30) (.16) (.28) (.22) (.29) (.25)
Hours/week supervised 2.9 2.6 3.4 3.9 2.8 2.5study in English' (2.1) (2.2) (2.3) (1.9) (2.2) (1.7)
Hours/week supervised 2.6 3.1 2.7 3.2 2.2 2.4study in mathematics' (1.8) (2.3) (2.2) (1.3) (1.3) (1.8)
Teacher's teaching 26.9 24.2 25.6 25.8 26.4 28.8hours/week (6.0) (1.5) (4.4) (6.1) (6.2) (7.0)
Teacher's hours/week on 26.9 24.2 25.6 25.8 26.4 28.8games (6.0) (1.5) (4.4) (6.1) (6.2) (7.0)
Note: ' Contrasts not significant (p>.05).For categorical variables percentages in each category are shown
8

established schools. Unfortunately, as we saw in reviewing the proportion of untrained teachers atdifferent schooltypes, it was those in greatest need who attracted the least qualified staff. The leastexperienced head teachers were in charge of the district council schools. Similarly, as with teachers, thefewest number of female school heads were found at the district council schools, some 2%, comparedwith a high of 57% in the case of the high-fee-paying schools.
25. Regarding school organization, the norm is for coeducational unstreamed day schools. Single-sexschools were found only among Group A and the high-fee-paying schools. (There are others in the widerpopulation, but this is characteristic.) This was also the case for boarding schools: they were only foundat Group A and high-fee-paying schools. Finally most primary schools do not stream their classes byability levels. However, where this is most prevalent is in the Group A schools, followed by the high-'ee-paying schools.'°
26. The largest schools, understandably, practice double-sessioning. This is in the case of the GroupB and low-fee-paying schools, whose average sizes are 1462 and 1023 pupils, respectively, compared toaverage figures between 432 and 645 for the rest. The lowest pupil-teacher ratios were found at the high-fee-paying schools (25), followed by the Group A schools (33). There is still a good deal of disparitybetween central government schooltypes. The average pupil-teacher ratio for the Group B schools was38-closer to the averages for district council and low-fee-paying schools than to Group A schools.
27. Several of the schooltype variables demonstrate the same discrepancies illustrated as those detailedat the class level. For instance, the pe;centage of 'standard' trained teachers varies from 49% for districtcouncil schools to 96% for high-fee-paying schools. It is encouraging that the amount of supervisionafforded both experienced and inexperienced teachers at district council schools is considerably higherthan at the other schooltypes, averaging three visits per term, as against fewer than two visits per termat the other schooltypes. The least experienced teachers are found at the low-fee-paying schools, set offeven from the district council schools, with an average of four versus seven years teaching experienceon average. Teacher stability is similarly lowest at the low-fee-paying schools, even with respect to thedistrict council schools, averaging 2.8 vs. 4.5 years, respectively. Textbook provision across theschooltypes varies from a low of one textbook to every three children in the district council schools upto four textbooks for every five children at the high-fee-paying schools.
28. Differences in resource availability between the various types of primary schools in Zimbabweare pronounced, especially in quantity and types of material and non-material resource. A survey of 30of the 86 primary schools in this study revealed that of the 12 material inputs listed in Table 5, ruraldistrict council schools on average had only 30 percent, while low fee paying schools had 55 percent,former Group B schools had 56 percent, former Group A schools had 80 percent and high fee payingschools had almost all the resources. Rural district council schools are further constrained by shortagesof classroom level resources such as chalk, pens and pencils, paper, maps and charts and dictionaries.Deserving of special note are the unexpected significant shortages of basic instructional materials informer group A, former group B and low fee paying primary schools. In particular only 57 percent offormer group A government schools reported always having enough of pens and pencils, writingpaper/exercise books, maps, charts and dictionaries. As many as 29 percent of former group A
10 Of course taking the head teacher's word for granted may not be portraying the reai situatiou. In previousstudies in which such questions were asked, the heads' ansv ers did not tally with the descriptive analysis ofstreaming. It is presumed that this was because streaming is frowned upor by the Ministry of Education, giventhat the Grade 7 test is not intended as a selection device. See Riddell (1988).
9

Table 4. Mean Values of School-level Variables by School Tvpe(standard deviations in parentheses)
All Former Former High Fee Low Fee DistrictVariable Schools Group A Group B Paying Paying Council
Female headmaster 9% - 10% 57% 18% 2%Headmaster's teaching 22.0 23.8 26.9 26.6 18.7 20.7experience in yearsa (9.5) (10.1) (7.1) (8.9) (7.1) (10. 1)
Coeducational school 95% 89% 100% 57% 100% 100%Boarding school 8% 22% 0% 57% 9% 0%Steaming 33% 67% 10% 43% 27% 31%Two sessions 41% 0% 90% 14% 55% 39%Pupil enrollment 645 619 1462 432 1023 429
(473) (243) (265) (138) (628) (251)Pupil to teacher ratio 36.6 32.9 38.0 25.4 37.5 38.5
(6.2) (4.4) (2.7) (6.9) (9.3) (3.8)Percent pupils African 92.6 79.0 100.0 36.7 100.0 100.0
(20.3) (17.3) (0) (28.7) (0) (0)School time in hours" 1007 925 1062 1027 1003 1009
(132) (65) (117) (107) (161) (137)Academic time in hours * 699 648 688 659 729 711
(122) (118) (139) (88) (153) (116)Game time in hours a 228 307 210 224 284 205
(151) (133) (136) (110) (184) (151)Professional time in hours 23.9 18.3 20.9 13.5 19.9 28.0
(17.0) (23.6) (13.2) (7.0) (12.7) (17.7)Headmaster supervision of 2.4 1.7 1.5 1.5 1.7 3.0experienced teachers (1.9) (.9) (1. 0) (.5) (.9) (2.2)
Headmaster supervision of 2.4 1.7 1.5 1.5 1.7 3.0inexperienced teachers (1.9) (.9) (1. 0) (.5) (.9) (2.2)
Mathematics textbook to pupil .50 .75 .52 .83 .59 .39ratio for all grades (.25) (.31) (.18) (.29) (.20) (.17)
English textbook to pupil ratio .50 .75 .52 .83 .59 .39for all grades (.25) (.31) (.18) (.29) (.20) (.17)% Trained teachers 64.8 93.3 87.0 96.4 70.3 49.3
(28.3) (7.0) (7.0) (7.5) (24.7) (24.7)Average teaching experience in 7.5 7.4 10.4 10.8 42 7.1years (4.0) (1.3) (2.8) (6.6) (1.1) (3.9)
Average teaching experience in 4.5 4.1 6.9 5.2 2.8 4.5this school (2.0) (1.2) (1.5) (1.9) (1.4) (1.9)
Notes. ' Contrasts not signif;cant (p> .05).For categorical variables percentages in each category are shown.
10

government schools reported not always having enough instruct. >nal guides for their teachers. In formergroup B government schools over 70 percent did not always have enough pens, pencils, and writingpaper/exercise books. Only 14 percent of the former group B schools reported always having enoughdictionaries while only 43 percent reported always having enough maps and charts. Regarding chalk andinstructional guides only 57 percent of former group B schools always had enough of these resources.The situation in low fee paying schools was comparable to that of former group B government schoolsexcept that chalk is always enough in low fee paying schools.
29. Four school-level variables were found to be invariant across sohooltypes. These concern theamount of time in the school calendar, the amount of time allocated to .cademic subjects, to games andsports, and to school-based, professional activities such as in-service workshops.
Methodology
30. Studies of school effectiveness have been plagued by methodological controversy, some of whichhas been resolved by the use of multilevel regression models. In this study, we have chosen to use thethree-level software package ML3 (Prosser, Rasbash, Goldstein 1991). The multilevel regression enablesus to model complex relationships simultaneously at different units of analysis and hence overcomes theproblem of the choice of unit of analysis. Moreover, the inherent nesting of educational systems in whichstudents are nested in classes which, in turn, are nested in schools, which, themselves, are nested indistricts or regions, makes the covariances within each level of direct interest. In contrast, ordinary leastsquares regression analysis assumes away these structures with the effect of: (a) producing less efficientparameter estimates, the greater is the clustering within these different levels, and (b) losing theinteresting interrelationships between the different levels.
'11. Results: Modeling English and Mathematics Achievement
31. Five steps were taken in modelling English and mathematics achievement. First, the sources ofvariation in achievement were determined by modelling a constant at each of the three levels: betweenstudents, between classes, and between schools. Second, each variable was regressed individually onEnglish and mathematics achievement in order tu weed out insignificant variables and to have a base-linecoefficient to compare with the estimates in multiple regression. Third, sets of individual variables ateach level were tested in combination in order to obtain the best predictors of student, class, and schoollevel variance in achievement. Fourth, the surviving subsets were tested in combination with each otherto render the most powerful equation utilizing the more manipulable variables. Fifth, school levelresiduals were estimated for each school in order to pick out possible outliers meriting furtherinvestigation. At each stage of the analysis, listwise deletion of missing variables was applied to thosevariables used in a particular regression. This enabled us to retain the largest possible data set at eachstage.
32. Punctuating the above set of analyses, we ran several others around schooltype and othercontextual differences as well as testing for random effects, the results of which will be discussed laterin this paper.
II

Table S. Frequency of Resource Availability by 7ype of Primary School(Percent)
Resource High Fee Former Forrner Low Fee RuralPaying Group A Group B Paying DistrictN=4 N=7 N=7 N=7 N=5
School Vehicle 100 100 0 14 0Telephone 100 100 86 86 20File Cabinets 100 100 100 86 60Typewriter 100 100 100 100 60Television 100 28 0 14 0Computer 75 28 0 14 0Radio 100 43 71 57 80Duplicating Machine !00 86 86 28 0Equipped Library 100 86 14 43 0Staff Room 100 86 86 100 40School Office 100 100 100 100 100School Hall 75 100 28 14 0
[All Resources] [96] [80] [56] [55] [30]
Always Enough:
Chalk 100 86 57 100 60Pens, Pencils 100 57 28 57 40Paper 100 57 28 71 60Instructional Guide 100 71 57 43 80Maps, Charts 100 57 43 28 40Dictionaries 100 57 14 28 20
Variance Components Models for English and Mathematics Achievement
33. The first model partitions the total variance into the variance between students, between classes,and between schools around an overall mean. The results are given in Table 6. The average achievementin English is 5.41. Of the total variance which we seek to explain, 44% is between schools, 8% betweenclasses, and 48% between students. Typically, in ordinary least squares regression, the variance betweenstudents is confounded with that between classes and between schools, making it impossible to ascertainwhether the resulting equations are really explaining between school differences or rather, merely thedifferences between students, implying the basis of their selection into those schools, or, indeed, theirchoice of those schools.
34. The mean achievement in mathematics, 4.7% is lower than for English. In comparison with thevariance components model for English, we can see that schools do not vary as much in mathematics
12

Table 6. Variance Components Models for English and Mathematics Achievement
English % of total Mathematics % of totalvariance variance
Fixed ParametersConstant (mean achievement) 5.410 - 4.67Standard error .18 0.15
Random ParametersBetween school variance 2.449 44 1.393 26Standard error .42 .29
Between class variance .435 8 .764 14Standard error .07 .12
Between student variance 2.71 48 3.176 59Standard error .05 .05
Total variance 5.594 100 5.339 100
achievement as they do in English achievement". Twenty-six percent of overall variance in mathematicsachievement is between schools. On the other hand, there is more between class variance in achievementin mathematics, as well as more between student variance by comparison with English.
Schooltype Differences in English and Mathematics Achievement
35. As we are interested not only in between school differences in general but in differences acrossthe different schooltypes, a further base model was run to test schooltype differentiation in English andmathematics achievement. The results are reported in Table 7. The mean achievement(constant) is forGroup A schools which served as the reference point. As could be expected, the different schooltypesare heavily 'loaded' variables, delineating tremendous resource disparities, as indicated in our descriptiveanalyses above. Thirty-six percent of overall variance in English achievement is explained by theinclusion of these schooltype variables and 83% of between school differences. Schooltype explains amuch smaller proportion of the overall variance in mathematics achievement-only 14%-by comparison,but 56% of between school differences.
36. High-fee-paying schools are not reliably different from Group A schools in English ormathematics achievement, but the contrasts across the range of schooltypes are highly significant(p<.0001)12. The ranking of schooltypes by mean achievement is the same across the two subjects:Group A and high-fee-paying schools are at the top, followed by Group B and low-fee-paying schools,and at the bottom, district council schools. These results are unadjusted for differences in studentbackground.
Smaller between school differences in mathematics achievement have also been found in previous research, atsecondary level (Riddell 1988).
2Chi-square statistic for English: 235.92 (4df); for mathematics: 38.08 (4df).
13

Table 7. Schooltype Differences (Base Model) for English and Mathematics Achievement
English AMathematics
Variable Coefficient Standard Error Coefficient Standard Error
Constant 8.23 .28 5.39 .24
Former B -2.57 .36 -.76 .36
High-fee-paying -. 12 .42' .75 .40'
Low-fee-paying -2.68 .37 -.77 .26
District Council -3.80 .30 -.99 .24
School-level variance 83 % 56%explained
Total variance explained 36% 14%
Note: ' Not significant (p>.05)
Testing Variables in Individual Regressions
37. Before proceeding with any further model-building, we tested each of the usable variables in ourdata set for its contribution toward an explanation of the variation in English and mathematicsachievement. The results are reported in Tables 8-10, for student level, class level, and school levelvariables, respectively.
38. Student Level Variables. The best set of student level predictors included the same variables forboth subjects: the pupil's age, whether or not s/he had repeated a grade, the family size, and the father'seducational level (Table 8).
39. Both the log transformation and the natural metric of pupil's age were tried. The logtransformation fit the data better for English and the natural metric marginally better for mathematics"3 ,but the log transformations were used for both subjects, for comparability, explaining 16% of betweenschool differences in each subject. The negative coefficients for both variabLs are what one would expectto find, rather than the positive coefficient for age regressed on English in the natural rretric. Wherethere is significant repetition at primary school, one would expect to find a high correlation between theage of the pupil and the number of school years a pupil has attended primary school. This is not the casein Zimbabwe, where there are relatively low repetition rates. Indeed the correlation between these twovariables is .03. An age greater than the average Grade 7 pupil's age would normally indicate some sortof hardship in access to primary school.
40. Children who had repeated a grade (determined simply by the number of school years they'dattended primary school) had a stronger negative relationship on mathematics achievemert than on Englishachievement, reducing the score by .5 point.
3 For English (t=9.7) for the log of age against (t= 2.0) for the natural metric; for mathematics (t=6.5) for thelog of age against (t=7.5) for the natural metric.
14

Table 8. Coefficients of Student-Level Variables Estimated in Individual Multi-Level Regressions onEnglish and Mathematics Achievement(Standard Errors)
English Mathematics
Percen Varance Eplained Percent Variance Erplained
Variable Coefficier Sch. Cl. Stud. To:. Coefficietu Sch. Cl. Stud. Tot,
Female (O=male) .01 (.04)' - - -.05 (04)- - -
ASe .04 (.02) 3 1 I -1 .15 (.02) 13 2 1 4
Log Age -6.29 (.65) 16 2 8 1 1 4.65 (.72) 16 4 6 7
Repeater (O= Non-Repeater) -.13 (.06) 1 - 2 1 -.49 (.06) 8 1 3 4
Non-English -.11 (.08)' - - - .16 (.09)' - -
Family Sze -. 04 (.01) 5 2 4 4 -.03 (.01) 6 - 2 2
Father's Educatiort 10 - 6 7 - 17 - 3 5(Reference = No Education)Prinary .10 (.07)' .11 (.07)'Jun-ior Certificate .21 (.06) .12 (.07)''0' Level .16 (.09)' .09 (.10)''A' Level .46 (.12) .39 (.13)
Mother's Education(Reference=No Education)Primary .08 (.06)' .02 (.07)'Junior Certificate -.05 (.07)' -.21 (.08)''O' Level -.10 (.11)' -.30 (.12)''A' Level .04 (.14)' -.04 (.16)'
Notes:. Not significant (p > .05)b Chi-square (p=.0003) for English and (p=.02) for m.athematics for comparisons across utegories.
Counterintuitive.Measured froin grand mean except where noted.
41. A pupil's family size had a small influence on both her/his English and mathematics achievement.Children from smaller families did better on both examinations.
42. Father's education had the strongest effect on achievement in both subjects, explaining 7% and10% of the total variance in English and mathematics achievement, respectively. Although individualdummy variables were not always significant, the contrasts across the categories were significant."' Thehighest increments in achievement were estimated for children whose fathers had an 'A' level education,as could be expected.
43. Several student level variables were found to be insignificant predictors of Grade 7 examinationresults: gender, home language, and mother's education. Although gender was not found to be a
i4 The chi-square tests produced results of (p= .0003) and (p=.02) for English and mathematics, respectively.
15

significant variable, the direction of the influence of gender was different for the two subjects, being apositive relationship for girls in English, and a negative relationship in mathematics." Similarly, forhome language, although insignificant, the coefficient for the regression on English was negative, aswould be expected, unlike that for the regression on mathematics. Seventy-five percent of the pupils inthe sample reported that their mothers had no education, so the lack of s-gnificance of mother's educationcan best be understood by the lack of discrimination of this variable, rather than its being counter-intuitive.
44. Class Level Variables. The best set of class level explanatory variables consisted of the teacher'sgender, the teacher's age, the teacher's qualifications, the availability of texts in the classroom, and formathematics, additionally, the amount of instructional time devoted to mathematics (Table 9).
45. On first inspection, female teachers seem to have a strong influence on achievement in bothEnglish and mathematics, raising achievement by between .56 and .66 points. It is important to note thatin this sample 82% of female teachers are in urban schools, however, urban being defined as Bulawayoand Harare, and not including those small towns which were also sampled. The strength of the regressionof teacher's gender on achievement disappears when regressed together with the urban/rural variable.
46. Older teachers seem to have a positive influence on pupils' Grade 7 achievement. The logtransformations of this variable only marginally improved the fit, so the natural metric was retained. Tenpercent of between school differences were explained by this variable. Teachers at the low-fee-payingand district council schools were younger than the average teacher's age of 33 years. No doubt someof these differences are being captured by this variable. Not surprisingly, teacher's qualificationsinfluenced pupil achievement in English and maCiematics. Reported in Table 9 are both the regressionsof the dummy variables for all the qualification bands, using 'standard trained' as the reference point, aswell as the dummy variable for 'standard trained' vs. all the other categories. It is clear that teacher'squalifications have a stronger influence on mathematics achievement than on English. The differentiationof the 'untrained' qualification band from 'standard trained' is most notable for mathematics achievement.
47. The final significant class level variable uncovered in the individual regressions for both subjectswas the availability of textbooks. This influence was stronger for mathematics than for English,accounting for 57% of between school variation in mathematics, 40% in English. The log transformationof this variable was tested, but did not fit better than the natural metric.'6
48. As already pointed out, there was much variation in the number of hours of instructional timedevoted to mathematics between schooltypes. Not surprisingly, therefore, this variable added a furtherdimension to the explanation of achievement differences, whereas it was not significant in the regressionon English achievement.
I5 While such tests of significance are relevant for average, fixed relationships across classes and schools, furtherinve.;-gation is merited to determine whether a gender gap exists in individual schools (entailing modellinggender as a random variabie at least between schools). Prelimiry investigations of gender as a randomvariable at the school level regressed on mathematics achievement, point to the existence of varying slopesbetween schools, with the gender gap smaller, the higher the achievement of boys in the school.
16 Raudenbush and Bhumirat (1992) illustrate the use of the logs of various physical resource variables in a schooleffectiveness study of Thailand, enabling investigation of diminishing returns to resources. This was attemptedhere.
16

Table 9. Coefficients of Class-Level Variables Estimated in Individual Multi-Level Regressions on Englishand Mathematics Achievement(Standard Errors)
English Mathematics
Percent Variance Explained Percent VaHance Explained
Variable Coefficient Sch. Cl. Stud. Tot. Coefficien Sch. Cl. Stud. Tot.
Female teacher .56 (.16) 12 5 - 6 .66 (.19) 16 2 - 4(0inMale)
Teacher's Age .02 (.01) 10 - 4 .03 (.01) 22 - - 4
Log Teachers' Age 1.52 (.73) 10 - 4 2.42 ( .87) 23 4
Teacher Oualificatione - 8 3 - 28 - - 7(Reference-StandardTrained)
Form 4 + 2 years .24 (.24)- - .14 ( .45)'
Form 2 + 2-3 years -.07 (.13) - - -.28 ( .28)' - - - -
Untrained *.41 (.14) - -1.41 ( .32) -
StandardTrained .40 (.17) 6 2 - 3 .59 ( .21) 14 - 3(0 - Untrained & Non-Std. Qual.)
Teacher Experience .014 (.008) .019 (.01)' 15 - 3
Ciass Size .03 (.019) - - - - .026 (.016)' -
Log Class Size 2.36 (1 2)' 2 3 - 1 1.94 (I1C7)' 4 I
Planning Time -. 03 (.02)' - - - -.018 (.023)'
Marking Time -.003 k.01)' - - - - .003 (.02)'
Instruction Time .0002 (.0008)- - - - .004 (.002) 14 - - 3
Log Instruction Time .44 (.78)' - - 1.80 (.55) 1 - 4
Class Activities -.03 (.04)' - - - .04 (.06)' - -
Tex, Available 1.86 (.33) 40 - 16 2.21 (.32) 57 - 13
Log Texts 2.45 (.46) 38 - - 15 2.92 (.44) 53 - - 12
Supervised Study 04 (.04)' - - - - .13 (.06) 2 3 -
Teaching Load -.0006 (.02)' - - - - -.005 (.02)' -
Game Time .02 (.04) - - - - 002 (.05)'
Notes: 'Not sigai ficant (p > .05)b Chi-square p=.0177 for contrasts for English; p=.0002 for Mathematics.
Measured from grand mean except where noted.
17

49. Several of the variables on which data were collected at the class level were not found to besignificant in explaining variation in English and mathematics achievement. Among these were the yearsof teaching experience of the classroom teacher and classroom size, both often thought to be reliablepredictors of student achievement. The log transformation of class size was tried in case diminishingreturns characterized the regression of this variable on achievement, but neither variable fit well. Therange of class sizes in Zimbabwe is relatively contained, compared to many other countries in which theratio from the top to the bottom would be several times higher.
50. None of the variables describing the use of time by the teacher in class or in preparation for theclass was significant, outside of instructional time in mathematics, as already noted. The provision ofsupervised study in mathematics was marginally significant, explaining very little variation inachievement.
51. School Level Variables. The best set of school level variables uncovered ir -he individualregressions on English and mathematics achievement included: the gender of the head teacher, the head'squalifications, whether the school was single-sex, also whether boarding, the average pupil-teacher ratioat the school, the percentage of African pupils, the amount of supervision of both experienced andinexperienced teachers at the school, the overall school availability of texts, whether or not there was alibrary, and the percentage of trained teachers at the school (Table 10).
52. Some of these variables explain much of the variance in achievement but this is due to the factthat they distinguish a small sub-sample of the schools surveyed. For instance, having a female headteacher, being a single-sex or a boarding school, and having a low percentage of African pupils are alldistinguishing characteristics of a very small proportion of the schools sampled. Only 9% of the schoolshad a female head, nearly all at high-fee-paying schools. Ninety-five percent of the schools werecoeducational, those single-sex being only at Group A and more often high-fee-paying schools. Boardingschools, similarly, were found almost exclusively among Group A and high-fee-paying schools andconstituted only 8% of those sampled. Finally, Group A schools and high-fee-paying schools alone hadless than 100% African enrollment, comprising 79% for Group A schools and 37% for high-fee-payingschools. Thus, unless one is specifically interested in contrasting boarding with day schools, or single-sexwith coeducational schools-in which case a different sampling frame would have been devised-it isunhelpful to rely on such variables to explain the variance in achievement in modelling for schooleffectiveness purposes because their explanatory power swamps other variables of greater interest to andgreater capacity for manipulation by education authorities.
53. Several other variables which describe the school were of interest. Pupils at schools having a'standard trained' head teacher achieved better results in both Grade 7 subjects. The effect of the size ofschools on performance is not negative, but rather positive, the log transformationfitting better than the natural metric, and explaining 8% of between school differences in both subjects."The percentage of trained teachers at a school has a very positive effect on achievement in both subjects,explaining 25% and 29% of between school differences in English and mathematics achievement,respectively.
54. A most peculiar finding emerges from the regressions on English and mathematics achievementof the variables denoting the number of times experienced and inexperienced teachers are supervised.
'7 For English (t= 1. 39) for the natural metric and (t=2.78) for the log of school size; for mathernatics, (t=2.0)and (t=2.74), respectively.
18

Tuble 10. Coefficients (Standard Errors) and Variance Explainedfor Combinations of Student-level andSchool-type Variables Regressed on English Achievement
Coefficient (Standard Errors)
Variable JE 2E 3E 4E SE 6E
Constant 5.62 6.00 4.85 5.10 5.89 5.90(.16) (.21) (.19) (.19) (.13) (.12)
Log age -5.02 -5.00 - -5.14 - -5.05(.66) ( 66) (.67) (.67)
Repeater -0.46 -0.46 - -0.47 - -0.44(.06) (.06) (.06) (.06)
Farily size -0.04 -0.04 -0.04 4-004(.01) (.01) (.01) (.01)
Father prinmary 0.09 0.09 0°10 0.09(.06)' (.06)' (.07)' (.07)'
FatherJ. C. 0.15 0.15 - 0.16 - 0.13(.06) (.06) (.06) (.06)
FatherO 0.12 0.13 - 0.13 0.13(.09)' (.09)' (.09)' (.09)'
Father A 0.39 0.39 - 0.40 - 0.37(.11) (. 11) (.12) (.12)
Former B - -0.22(.21)'
High Fee Paying - 0.20 - - - -
(.25)'Low Fee Paying - -0.40
(. 19)District Council - -0.77 -
(.19)Female teacher - - 0.63 0.28
(.16) (.08)Age of teacher - - 0.03 0.03
(.01) (.01)Standard trained teacher - - 0.73 0.67
(.19) (.18)Tcxts (class) - 1.42 1.15 - -
(.33) (.32)Pupil-teacher ratio 0- - - -. 06 -0.05
(.02) (.02)Texs - - - - 1.81 1.48
(.56) (.53)Trained teacher - - - - 0,03 0.02
(.005) (.005)Percent Variance explained 17 21 24 33 32 37(total)
School 27 35 57 66 65 70Class 8 10 0 5 2 11Student . 10 10 0 9 7 10
Notes: * Average for non-repeater, father no education at grand means as noted.b Measured from grand mean.
Significant, negative coefficients, stronger for the supervision of inexperienced than for experiencedteachers result from these regressions. Although it doesn't stand to reason in the case of the supervisionof experienced teachers, the negative coefficient for the supervision of inexperienced teachers may betouching on the fact that there are fewer trained teachers at, for example, district council schools, which,as we have already noted, report greater amounts of supervision at their schools. Intuitively, one wouldexpect head teachers' supervision to have a positive effect; further investigation is clearly necessary tounderstand better what is producing not only a negative coefficient, but a negative connotation!
19

55. The availability of textbooks at the school level corroborates the strong positive relationship withachievement found at the class level, though here the relationship is stronger for English than formathematics. The existence of a school library also has a positive relationship with Grade 7 achievement,stronger for English than for mathematics.
56. The percentage of trained teachers in the school is the strongest variable explaining betweenschool differences in English and mathematics achievement, explaining 47% and 52% of thesedifferences, respectively.
57. Variables which were not significant in explaining differences in Grade 7 achievement includedthe head teacher's teaching experience as well as the average number of years of teaching experience atthe school, whether the head had received t:.ining as a head, the head teacher's administrativeexperience, whether the school practiced ability streaming (as reported by the head), whether there weredouble-sessions at the school, the amount and division of school instructional time into total number ofhours, academic time, game time and professional time, and the average number of years teachers spendat the particular school, a measure of teacher stability.
58. The lack of relationship between achievement and the different variables denoting teachingexperience seems puzzling, particularly given the significance of the teacher's age variable. However,the effect of new blood in a profession such as teaching has been noted by other researchers, and it maybe that a similar phenomenon is being touched upon here. S The importance in the regressions onachievement of 'standard' trained teachers vs. other categories would still fit in with this theory becausethe new recruits, having completed their teacher training courses, would be relatively inexperienced,compared with their more experienced, 'non-standard'-trained counterparts. Further investigation ofteacher variables would be necessary to weed out alternative theories, together with the more interestinginterrelationship of teacher training qualification bands with teaching practices.
Progression Toward the 'Best' Model of English Achievement
59. Having run all three base analyses: (a) the variance components model; (b) the base schooltypemodel; and (c) the regressions of individual variables on English achievement-we put together thestudent level variables which could be combined in a single equation without loss of significance due tomulticollinearity between the constituent variables. The resultant Model IE is reported in column 1 ofTable 10. All of the significant student level variables were able to be included. Seventeen percent ofthe variance in English achievement was explained by the introduction of these variables, comprising27% of the between school variance, 8% of the between class variance and 10% of the between studentvariance. The significant drop in the school level variance is important to note because over one-quarterof between school differences can be seen to be accounted for by student background variables overwhich we have no control. This means that after the inclusion of these variables, 39% of the totalvariance comprises between school differences what we are seeking to explain in our further modellingand 9% of between class differences. the remainder, 52%, comprising further differences betweenstudents. We can only hope to explain the 48%o of the variance which is between schools and betweenclasses in our further modelling.
60. To what extent have these student background variables accounted for the schooltype differencesillustrated in Table 7? The answer is that they have explained nearly all of them. Examination of Model
Is See (Riddell and Nyagura, 1991) for similar findings in Zimbabwe's secondary schools.
20

2E (column 2 of TabNe 10) shows that the schooltype variable coefficients are much smaller than thosereported in Table 7. Group B schools cannot be differentiated from Group A schools (our referencepoint) once these student background variables have been accounted for. High-fee-paying schools couldnot be distinguished fr3m Group A schools i;\ our earlier base model, nor can they here. However, oncethese student backgroiind variables hive been regressed on English achievement, there is little left of thelow-fee-paying and district council schooltype coefficients either, though they are still significant.'9
61. Two further models were tested at this point: (a) whether the relationship between repeaters andEnglish achievement varied from school to school; and (b) whether the best socio-economic statusindicator, father's education, varied in its relationship with English achievement from school to school.Neither proved to be a fruitful tangentt.
62. The next stage in model-building was to test combinations of class level variables together.Model 3E (column 3 of Table 10) repo,s the results of including our best set of class level explanatoryvariables. The correlation between teaihefs' qualifications and the availability of classroom textsincreased the estimate of the former and red'!ed that of the latter, but all remained significant incombination and explained 24% of the total varik,n in English achievement and 57% of between schooldifferences. Model 3E is not really legitimat.e, liven that no adjustments have been made for studentbackground variables. The more representalive !v.3del 4E (column 4) combines the set of class levelvariables in Model 3E with those student b4- Kground variables used in the earlier stage of model-building. The coefficient of the variable for teacher'- gender is reduced greatly in combination with thestudent background variable, but still retains its significar.ce. The other variables are hardly affected incombination. Thirty-three percent of the overall variance in English dchievement has been explained bythis stage-16% over and above the effect of the student background variables alone. Sixty-six percentof between school differences have been explained-39% over and above the prior student level model.In addition, five percent of class level variance has been explained, and 9% of between studentdifferences.'
63. At the next stage of model-building, different combinations of school level variables wereregressed on English achievement. The results of the best set are reported in column 5 of Table 10,including the pupil-teacher ratio at the school, the availability of textbooks in general, and the percentageof trained teachers at the school. Model SE illustrates that 32% of the total variance in Englishachievement is explained by these three variables alone, 65% of between school differences, 2% ofbetween class differences, and 7% of between student diffetences. All three coefficients have beenconsiderably reduced from their values when regressed individually on achievement, but they are stillsignificant.
19 The inclusion of the schooltype variables is for purposes of comparison with our base models and not formodel-building. Their explanatory power is too great for playing out the effects of any of the other variableswe would like to test. (In the base schooltype model (Table 4) 83% of between school differences wereexplained by inclusion of these variables alone.
3' Just as with the prior stage, the schooltype differentiation still remaining was tested by adding the schooltypevariables to those variables already regressed on English achievement in Model 4E. The relative advantagesof the Groip B and high-fee-paying schools still seen in Model 2E are accounted for by the inclusion of theclass level variables, their coefficients being significantly reduced. The disadvantages of the low-fee-payingand district council schools, however, have not entirely been accounted for.
21

64. Model 6E (column 6 of Table 10), builds more correctly upon Model IE, with adjustments madefor student background factors. Thirty-seven percent of the total variance has been explained, 70%between schools, 11% betweei, classes, and 10% between students. This is an additional 20% of the totalvariance explained by these school level attributes over Model IE, 43% between schools, and 3%between classes.21
65. In the final stage of model-building, several combinations of the three sets of 'best' variables weretested in order to get the best predictive power. Understandably, because classrooms are on the receivingend of school policies and school resources, and thus some of the variables are describing at the classlevel the effect of variables collected at the school level, it was not possible to combine much across thesetwo levels due to multicollinearity. In fact, the 'best' predictive model proved to be Model 6E, relyingon only the student and school level explanatory variables. The mean English achievement of a pupilwho has not repeated a grade and whose father has no education, is of average age (13.7) and family size(6.6), and at a school with the average values of 36.6 pupils to each teacher, one textbook for every twopupils, and 65% trained teachers, is 5.9. For each additional pupil above the average pupil-teacher ratio,the child's English achievement is predicted to drop .05 points; if instead of having to share a textbookbetween two pupils, each pupil had her/his own, the child's achievement would increase by .74 points;and if instead of two-thirds of the teachers being trained, they all were tra.ned, the child's achievementwould similarly be predicted to increase .7 points. If the child were over the average age, for everyincrease of .1 of the logarithm of the child's age, the child's score would decrease by .5 points. If thechild had repeated a grade, one would expect her/his achievement to be lower by .44 points. For everyadditional child in the family, the pupil's achievement would be expected to be .04 points lower.Finally, if the child's father had received an 'A'-level education, it would be expected that the child'sEnglish achievement would be .37 points higher, alternatively, with education only up to the JuniorCertificate, .13 points higher.
66. If one relies solely on the final model for purposes of interpretation and policy implications, therichness of the 'story' built up to explain what accounts for achievement differences in English will belost. It is important to utilize the informaLion collected in the process of model building as well. Thepieces of the 'story' for English achievement will be put together once we have explored the 'best' modelexplaining the variance in mathematics achievement, so that we can compare our findings across subjects.
Progression To ward the 'Best' Model of Mathematics Achievement
67. The same steps were taken with respect to model-building to explain variation in mathematicsachievement as were taken to explain English achievement. All the student level predictors were ableto be included in the regression on mathematics achievement and are reported in Model IM (column 1)of Table 11. They include the same variables as for English: logarithm of the pupil's age, whether ornot the child had repeated a grade, the size of the pupil's family, and the father's educational level. Thesevariables combined accounted for 11 % of the total variance, but 30% of what was already a smalleramount of variation between schools than was the case for English achievement, 2% of between class
21 Adding the schooltype variables at this stage had the effect, as with the class level model, of reducing thecoefficients of the Group B and high-fee-paying schools and raising those of the low-fee-paying and districtcouncil schools. Only the district council schools rernained significantly different, below the other schooltypes.
22

Table 11. Coefficients (Standard Errors) and Variance Explained or Combinations of Student-level andSchool-type Variables Regressed on Mathematics Achievement
Coefficient (St. error)
Variable IM 2M 3M 4M 5M 6M
ConstantV 4.84 4.40 4.51 5.07 5.10 4.77(.14) (.20) (.20) (.11) (.11) (.17)
Log ageb -3.63 - -3,47 - -3.44 -3.54(.74) (78) (.79) (.79)
Repeater -.40 - -.44 - -.42 -.42(.07) (.07) (.07) (.07)
Family sizeb -.02 - -.03 - -.03 -.03(.01) (.01) (.01) (.01)
Father primary 0.09 - .07 - .06 0.07(.07)' (.08)0 (.08)0 (.08)'
Father J. C. 0.06 - .05 - .04 0.04(.07)' (.07)' (.07)- (.07)0
Father O 0.05 - .06 - .08 0.09(-1)' (.10)' (.10)' (. 1)0
Father A 0.33 - .29 - .28 0.30(.13) (.14) (.14) (.12)
Female teacher - .50 0.41 -
(. 19) (.18)Age of teacherb - .02 0.019 - - -
(.01) (.0 1)Standard trained - .60 0.57 - - .39teacher (.22) (.21) (.19)Log Instr. Timeb - 1.14 1.00 - - 1.09
(.52) (.49) (.47)Grade 7M Textsb - 1.83 1.68 - -
(.36) (.34)Supervised Studyb - .15 .14 - - .13
(.05) (.05) (.04)Texts (class)b - - - - - 1.88
(.29)Pupil-teacher ratio - - - -.054 -.04 -0.05
(.02) (.02) (.01)School Texts - - - 1.33 1.13 1.48
(.50) (.47) (.53)Trained teachers - - - .02 0.02 0.02
(.005) (.004) (.005)Percent Variance 11 21 24 19 22 27explained (total)
School 30 76 80 76 81 93Class 2 3 11 - -
Student 4 1 3 2 3 3
Notes: 'Constant Average for non-repeat. r, father no education, at grand means ab uotedb Measured from grand mean
Non-significant (p > .50)
23

differences and only 4% of between student differences. Model IM, like Model IE for English, givesus a new base model, for the adjustments made for student background factors renders the 'real' betweenschool differences which we set out to explain. They comprise a mere 20% of the total variance inachievement after adjusting for student background factors, half the size of the share for English. Onthe other hand, between class and remaining between student differences comprise a considerably largershare than for English 1, 16% and 64%, against 9% and 53%, respectively.
68. To what extent do student background factors account for schooltype differences? First of allbetween school differences have been accounted for entirely by the introduction of the student backgroundand schooltype variables. The school level variance at this stage, .175 (.1), is no longer formallysignificant. The model resulting from adding the schooltype variables to the student background factorsis not really valid. Schooltype differences are accentuated, rather than diminished, as would beexpected.
69. Model 2M (column 2 of Table 11) reports the results of combining the best set of class levelvariables regressed on mathematics achievement. Included are the gender and age of the teacher, whetherthe teacher received what is now standard teacher training, the amount of instructional time devoted tomathematics, the availability of mathematic textbooks in the classroom, and the amount of supervisedstudy time afforded by the teacher. These variables account for 21 % of the total variance, comprising76% percent of between school differences, 3% between class, and 1% between students. Model 3M(column 3) which builds upon the more valid Model IM, adjusting for student background variables,illustrates that the addition of these class level variables accounts for an additional 13% of the totalvariance, comprising an additional 50% of the between school variance and an additional 9% of thebetveen class variance in achievement. As with Model IM the addition of the schooltype variables atthis stage was not possible without couriterintuitive results.
70. Model 4M (column 4 of Table 11) presents the results of the best possible combination of schoollevel variables, according to the same criteria used in the modelling of English achievement: an attemptwas made to use those variables of the greatest policy impoitance, rather than those descriptive variables,such as boarding or single-sex, over which little, relative control can be yielded and whose weightswamps other variables. The regression on mathematics achievement of the three variables, the overallpupil-teacher ratio at the school, the availability of school textbooks, and the percentage of trainedteachers at the school accounted for 19% of the total variance in mathematics achievement, 76% ofbetweer school differences, and 2% of between student differences. Compared to Model IM, ModelSM (column 5) which also regresses the student background variables at the same time as the school levelvariables, on mathematics achievement, represents an additional 11 % of the total variance explained, anadditional 51% between schools.
71. Different combinations of variables at all three levels were regressed on mathematics achievementin an attempt to arrive at the most powerful equation. Model 6M (column 6 of Table 11) reports our'best' equation, accounting for 27% of the overall variance in achievement, 93% of variation between
22 Whereas the span of the schooltype dummy variables had been between .3 and .45 standard deviation unitsbefore including pupil's charactenstics, after adjustment the spread was from .02 to 1.13 standard deviationunits. The coefficients of the schooltype dummy variables in the model tested at this stage were: B -1.77 (.32);HFP -.04(.39); LFP -1.51 (.33); DC -2.46 (.29).
24

schools and 3% between students. No significant between school variation remains23, but the betweenclass variation is untouched by the variables in combination. This implies, as we saw at an earlier stage,that after accounting for student background differences, much of the variation in mathematicsachievement is not between schools, but rather between individ.'al classes. This gives much more roomfor improvement to the class teacher than was the case found for English achievement.
72. In this 'final' model, the average mathematics achievement, the constant, is for a pupil of averageage (13.7 years) who has not repeated a grade and whose father has no education. An increase of .1points in the log of the student's age would predict a lowering of achievement of just over a third of apoint; if the child had repeated a grade, we would expect her/his achievement to bc lower by .42 points;for chiliren coming from families one child larger than the average family size of 6.6 children, we wouldexpect a marginal lowering of .03 in their mathematics achievement. Were the child of a father havingan 'A' level education, we would expect the child's achievement to be raised by just under a third of apoint. For every I point increase in the log of instruction time afforded mathematics above the averagetime of 103 hours, we would expect a similar increment in mathematics achievement of 1. 11 points. Wepredict a tremendous boost in achievement for improvements in the accessibility of textbooks: if insteadof having to share two textbooks in class approximately between three pupils, the ratio were raised toabout three books for every four pupils, we would predict an increase in the child's achievement inmathematics of nearly two points (1.88)! For each additional hour of supervised study time above theaverage of 2.6 hours per week, the pupil's mathematics achievement is predicted to rise by .13 points.Finally, for each additional pupil increasing the average pupil-teacher ratio of 36.6, a decrease in thepupil's achievement of .05 points is predicted.
Analysis of Residuals
73. Having arrived at our 'best' models for explaining English and mathematics achievement, the finalstage in the analysis is to analyze the residuals in order to detect 'outliers', cases worthy of furtherexamination. The use of residuals in multilevel regression as a proxy for school effects cannot be a finelyhoned technique. Because the confidence intervals are generally quite wide and therefore the rankingsof schools will overlap, it is not valid to do more than a broad brush slice off the top and the bottom ofthe residuals in urder to detect 'most effective' and 'least effective' schools.
74. Table 12 reports those schools whose school level residuals were at least two standard deviationsabove or below the mean predicted English achievement. Among the bottom ranked schools are fourdistrict council schools, two low-fee-paying schools and one Group B school. Among the top rankedschools are five Group A schools, one low-fee-paying school and a four district council schools. AnattL'-pt was made to determine what characterizes these schools beyond those variables controlled for inthe final Model 6E from which these residuals are obtained. There seems to be nothing exceptional fromthe information at hand, except the curious finding that the time afforded to games at the school is higherthan average, and the time afforded to professional activities lower! Given the limited variables on whichdata were collected, and the fact that nothing is reported about the overall ethos of the school, nor indeed,the classroom teaching practices fostered, further investigation at the particular schools in question isreally what is required in order to ascertain what the group of 'effective' schools has in common thatwould have policy implications for those schools further down on the ranking.
23 The between school vanance for this model is .101 (.09).
25
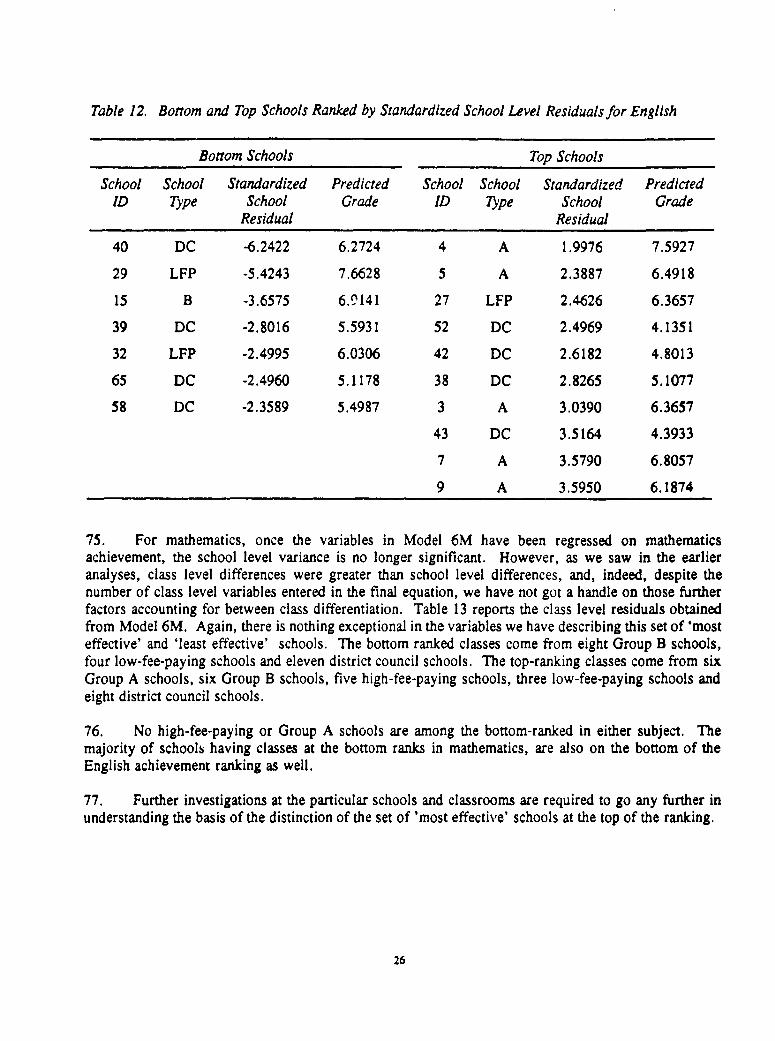
Table 12. Bottom and Top Schools Ranked by Standardized School Level Residuals for English
Bottom Schools Top Schools
School School Standardized Predicted School School Standardized PredictedID Type School Grade ID Tpe School Grade
Residual Residual
40 DC -6.2422 6.2724 4 A 1.9976 7.5927
29 LFP -5.4243 7.6628 5 A 2.3887 6.4918
15 B -3.6575 6.9141 27 LFP 2.4626 6.3657
39 DC -2.8016 5.5931 52 DC 2.4969 4.1351
32 LFP -2.4995 6.0306 42 DC 2.6182 4.8013
65 DC -2.4960 5.1178 38 DC 2.8265 5.1077
58 DC -2.3589 5.4987 3 A 3.0390 6.3657
43 DC 3.5164 4.3933
7 A 3.5790 6.8057
9 A 3.5950 6.1874
75. For mathematics, once the variables in Model 6M have been regressed on mathematicsachievement, the school level variance is no longer significant. However, as we saw in the earlieranalyses, class level differences were greater than school level differences, and, indeed, despite thenumber of class level variables entered in the final equation, we have not got a handle on those furtherfactors accounting for between class differentiation. Table 13 reports the class level residuals obtainedfrom Model 6M. Again, there is nothing exceptional in the variables we have describing this set of 'mosteffective' and 'least effective' schools. The bottom ranked classes come from eight Group B schools,four low-fee-paying schools and eleven district council schools. The top-ranking classes come from sixGroup A schools, six Group B schools, five high-fee-paying schools, three low-fee-paying schools andeight district council schools.
76. No high-fee-paying or Group A schools are among the bottom-ranked in either subject. Themajority of schools having classes at the bottom ranks in mathematics, are also on the bottom of theEnglish achievement ranking as well.
77. Further investigations at the particular schools and classrooms are required to go any further inunderstanding the basis of the distinction of the set of 'most effective' schools at the top of the ranking.
26

Table 13. Bottom and Top Schools Ranked by Standardized Class Level Residuals for Mathematics
Bottom Classes Top Classes
School ID School 7ype Standardized Predicted Grade School ID School 7ype Standardized School Predicted GradeSchool Residual Residual
10.4 B -5.7973 7.0685 4.1 A 2.0310 6.5901
10.3 B -5.4183 6.7904 66.1 DC 2.0479 5.7459
67.1 DC -4.6370 5.8178 11.3 B 2.0738 6.8185
40.1 DC -3.7392 6.5901 26.1 HFP 2.1157 6.7946
72.1 DC -3.6692 5.9388 23.1 HFP 2.1664 6.5013
27.3 LFP -3.2153 6.5796 25.1 HFP 2.1816 6.4570
29.4 LFP -3.0695 6.1854 23.2 HFP 2.1928 6.7946
80.1 DC -2.9900 5.9519 57.2 DC 2.2201 6.9277
15.2 B -2.8587 6.8998 3.1 A 2.4819 5.9891
68.1 DC -2.6275 6.1327 36.4 LFP 2.5897 5.4936
55.2 DC -2.5516 6.2604 19.5 B 2.6113 6.6152
74.2 DC -2.4797 6.5652 53.1 DC 2.6269 6.4730
19.1 B -2.4391 6.3517 22.1 HFP 2.6679 6.6434
29.2 LFP -2.4325 6.37,1 18.3 B 2.7200 6.7204
39.2 DC -2.2454 6.1904 2.1 A 2.7908 6.1723
31.1 LFP -2.1992 7.1530 14.1 B 2.8623 6.5652
83.2 DC -2.1418 6.7765 27.1 LFP 2.8946 6.5901
a,.4 B -2.1321 6.4952 9.1 A 2.8949 6.5551
48.2 DC -2.1209 6.4807 63.1 DC 3.2841 6.0377
11.4 B -2.1075 7.0299 48.1 DC 3.6110 6.5465
64.1 DC -2.0986 6.8047 43.2 DC 3.6232 6.1890
13.1 B -2.0519 5.9891 53.3 DC 3.6952 6.4448
15.4 B -2.0027 7.1530 7.1 A 3.7206 6.3028
12.4 B 3.7501 6.7485
52.1 DC 4.3216 6.6525
8.1 A 4.7144 6.2762
29.7 LFP 6.0517 5.7615
10.1 B 6.4707 6.4037
27

IV. Conclusions
78. We are now at the stage where it is possible to answer some of the questions raised in thisresearch. We have found that schooltype differences in English achievement go considerably beyonddifferences in student intake, whereas for mathematics achievement, once one has controlled for studentbackground variables, schooltype is not a significant discriminating factor. We can account forschooltype differences in English, however, with either class or school level variables. We have foundthat for mathematics achievement, focussing at the class level is likely to be more productive ininfluencing achievement, whereas the broader school level focus for English achievement may be moreappropriate. We are able to account entirely for between school differences in mathematics on the basisof the variables included in our model. Differences between schools in English achievement, however,remain, after our best attempts at modelling with the variables at hand.
79. What are the handles at our disposal for influencing achievement in either of these two subjects?Not surprisingly, textbooks and trained teachers come up as highly significant variables across bothsubjects, at both the class and school levels.2' Both trained teachers and the availability of textbooksfor mathematics instruction are more important than for English, however, in equalizing disparities acrossschools, as can be seen first in the individual regressions on achievement and subsequently in the furthermodelling carried out. More of the variance in mathematics achievement between schools is explainedby these variables. In addition, older teachers seem to achieve better results with their charges than newrecruits across both subjects. Also, teacher's gender seemed to be a promising variable at first, the pupilsof female teachers outperforming those of male teachers. However, once we understood that the variablewas describing in fact the urbanicity of the school, further concentration on this variable proved futile,particularly outside the introduction of additional classroom practice variables (not available in this study).
80. Two addit:onal class level variables proved of importance in explaining achievement differencesin mathematics, but not in English. The amount of instructional time devoted to mathematics and thenumber of hours of supervised study given by the teacher were significant. Clearly these are both areasmeriting attention by the responsible authorities of the different schooltypes. In particular, supervisedstudy, which has also proved to be a successful non-formal type of education in Zimbabwe through 'studygroups"'5, may hold out an inexpensive, supplementary means of raising students' mathematicsperformance.
81. At the school level, the three variables, the pupil-teacher ratio, the availability of textbooks, andthe percentage of trained teachers, proved highly significant across both subjects, explaining morebetween school differences in mathematics, but accounting for more of the total variance in English.
82. What is of interest in examining the interaction of these different variables with the schooltypevariables is the intractable disadvantage of the low-fee-paying and district council schools, the poor
24 The average academic qualifications of the teachers at the schools surveyed in a 1992 survey of Zimbabwe'sprimary schools was the most important factor distinguishing its group of 'most effective' schools, also. Inaddition to the physical resources which also distinguished this group, the pupil-teacher ratio and those schoolswith more full-time female teachers as well as tbose with more teaching experience who lived on their ownwere the notable factors. (Ross and Postlethwaite 1992)
25 Study groups consist of groups of students brought together in registered study centers with a mentor, providedat government expense.
28

cousins to the other schooltypes. Although we can go quite far in explaining the differentiation acrossschools and schooltypes with the inclusion of the variables on which data were gathered in this study, itis notable that after accounting for student background influences on the 'effectiveness' of differentschooltypes, as well as the manifold class and school level variables, there is still something which ismissing in these two schooltypes, relative to the others. We would allege that the newness of theseschooltypes, together with their disadvantageous physical resourcing afforded either by the governmentor their relatively much poorer supporting communities, requires attention by central government re: theequalization of no longer just access, but rather, of access to quality education. Further investigationsat some of the outliers detected in the residuals analysis should be of some help in determining furthercharacteristics at the school and classroom level which can ameliorate disparities in primary schoolachievement in English and mathematics in the face of physical resource disparities.
29

References
Prosser, R., Rasbash, J. and Goldstein, H., ML3: Software for Three-level Analysis: Users' Guide forXI, Institute of Education, University of London, 199i.
Raudenbush, Stephen W. and Bhumirat, Chinnapat, "The Distribution of Resources for PrimaryEducation and its Consequences for Educational Achievement in Thailand", !nternational Journalof Educational Research, Spring 1992.
Riddell, Abby Rubin, "School Effectiveness in Secondary Education in Zimbabwe: A MultilevelAnalysis." unpublished Ph.d, Institute of Education, University of London, 1988.
Riddell, Abby Rubin and Nyagura, Levi Martin, "What Causes Differences in Achievement inZimbabwe's Secondary Schools?", Policy Research and External Affairs Working Paper, WPS705, The World Bank, Washington, D.C., June, 1991.
Ross, Kenneth N. and Postlethwaite, T. Neville, "Indicators of the Quality of Education: A Summaryof a National Study of Primary Schools in Zimbabwe:, IIEP Research Report No. 96,International Institute for Educational Planning, Paris, 1992.
30

Annex A: Glossary of Variable Names
Student-level Dependent Variables
GR7E: Grade 7 English examination score measured in November 1990; possiblescore: 1-9.
GR7M: Grade 7 mathematics examination score measured in November 1990; possiblescore: 1-9.
Student-level Explanatory Variables
SEX: A dummy variable (I = female; 0=male)
AGE: Age in years as of November 1990
PRESCHYR: Years spent in preschool
SCHLYRS: Total years taken to reach Grade 7
DAYSABS: Number of days a pupil was absent from school in terms 1 and 2 in 1990
EHWTIME: Hours per week devoted to English homework
MHWTIME: Hours per week devoted to mathematics homework
HOMLAN: A dummy variable (I =Non-English; 0=English)
FAMSIZE: Number of children in the family
FEDUC: Father's education level (I =Did not go to school; 2=Primary Education up toGrade 7; 3=Form 2/Grade 9 (Junior Certificate); 4= Form 4 (0-level), 5=Form6 (A-level); 6= University degree(s).
MEDUC: Mother's education level (1=Did not go to school; 2=Primary Education up toGrade 7; 3=Form 2/Grade 9 (Junior Certificate); 4= Form 4 (0-level), 5=Form6 (A-level)- 6=University degree(s).
Class-level Explanatory Variables
TCHSEX: A dummy variable (I=Female; 0=Male)
TCHAGE: Teacher's age in years as of 1990
TCHQUAL: A dummy variable (I =trained, i.e. Form 4 plus 2 to 4 years training & Form2/Standard 6 plus 2 to 3 years training; 0=untrained)
CTCHEXP: Years Grade 7 teacher has taught
31

CLSIZE: Number of students in the class
EP' AN: Teacher's English planning hours per week
MPLAN: Teacher's mathematics planning hours per week
EMARK: Hours per week spent grading/marking English pupils' work
MMARK: Hours per week spent grading/marking mathematics pupils' work
EINSTR: Total English hours of instruction before Grade 7 examination
MINSTR: Total mathematics hours of instruction before Grade 7 examination
TCHABS: Days teacher was absent from school in terms I and 2 of 1990
ECLACT: Hours per week spent on pupil classroom activities in English
MCLACT: Hours per week spent on pupil classroom activities in mathematics
GR7ETEXT: English textbook availability in Grade 7, i.e. ratio of pupils per English textbook.1 =one textbook per pupil; 0.5=one textbook per two pupils; 0.33=one textbookper three pupils; 0.25=one textbook per four or more pupils
GR7MTEXT: Mathematics textbook availability in Grade 7. See GR7ETEXT for meaning.
ESUPSTDY: Supervised English study hours per week
EUNSUP: Unsupervised English study hours per week
MSUPSTDY: Supervised mathematics study hours per week
MUNSUP: Unsupervised mathematics study hours per week
TCHLOAD: Teacher's total teaching hours per week
TCHGAME: Hours per week spent by the teacher on games and sports
School-level Explanatory Variables
HMSEX: A dummy variable (1= Female; 0=Male)
HMQUAL: A dummy variable (1 =Qualified headmaster; 0=Under-qualified headmaster)
HMTCHEXP: Headmaster's teaching experience in years
HMTRD: A dummy variable (I= trained as HM; 0 =untrained as HM)
32

HNMADMIN: Headmaster's administrative experience in years
SCHLSEX: A dummy variable (I = single sex school; 0= co-education school)
BOARD: A dummy variable (I= Partly boarding; 0=not boarding)
STREAM: A dummy variable (I =streaming; 0=No streaming)
SESSION: A dummy variable (I =one session; 0=two or more sessions)
SIZE: Number of pupils enrolled in the school
TPR: School average number of pupils per teacher
PERCAF: Percentage total enrolment African
SCHLTIME: Total school working hours in terms 1 and 2 of 1990
ACADETIME: Total hc *rs spent on academic activities in terms 1 and 2 of 1990
GAMETIME: Total hours spent on games and sports in terms 1 and 2 of 1990
PROFTIME: Total hours spent on school based inservice activities in terms 1 and 2 of 1990
SUPVEXP: Number of times per term experienced teachers were supervised by the headmaster
SUPVINEX: Number of times per term inexperienced teachers (2 years) were supervised by theheadmaste-
ETEXT: English textbook availability for all grades in the school. See GR7ETEXT formeaning
MTEXT: Mathematics textbook availability for all grades in the school. See GR7ETEXTfor meaning
LIBRARY: A durrmy variable (I =school has a library; 0=No library)
LIBBOOKS: Total number of books in the school library
TRDTCH: Percentage of trained teachers in the school
TCHEXPER: Average number of years teachers have taught based on first appointment toteaching
TCHTHIS: Average number of years teachers have taught in present school
33

Policy Research Working Paper Series
ContactTitle Author Date for paper
WPSI 180 The Financing and Taxation of U.S. Harry Huizlnga September 1993 R. VoDirect Investment Abroad 33722
WPS1 181 Reforming Health Care: A Case for Zeljko Bogetic September 1993 F. SmithStay-Well Health Insuranes Dennis Heffley 36072
WPS1 182 Corporate Governance in Central Cheryl W. Gray September 1993 M. Bergand Eastern Europe: Lessons from Rebecca J. Hanson 31450Advanced Market Economies
WPS1 183 Who Would Vote for Inflatlon In Cheikh Kane September 1993 T. HollestelleBrazil? An Integrated Framework Jacques Morisett 30968Approach to Inflation and IncomeDistribution
WPS1 184 Providing Social Benefits in Russia: Simon Commander September 1993 0. del CidRedefining the Roles of Firms and Richard Jackman 35195and Government
WPS1 185 Reforming Hungarian Agricultural Morris E. Morkre September 1993 N. ArtisTrade Policy: A Quantitative David G. Tarr 38004Eva!uation
WPS1 186 Recent Estimates of Capital Flight Stijn Claessens September 1993 R, VoDavid Naude 33722
WPS1 187 How Should Sovereign Debtors Andrew Warner September 1993 J. QueenRestructure Their Debts? Fixed 33740Interest Rates, Flexible InterestRates, or Inflation-indexed
WPS1188 Developmentalism, Socialism, and Mario Marcel September 1993 S. FlorezFree Market Reform: Three Decades Andres Solimano 39075of Income Distribution in Chile
WPS1 189 Can Communist Economies Alan Gelb September 1993 PRDTMTransform Incrementally? China's Gary Jefferson 37471Experiance inderjit Singh
WPS1 190 The Government's Role in Japanese Yoon Je Cho September 1993 T. Ishibeand Korean Credit Markets: A New Thomas Hellmann 37665Institutional Economics Perspective
WPS1 191 Rent-Sharing in the Multi-Fibre Geoffrey J. Bannister September 1993 A. DaruwalaArrangement: The Case of Mexico 33713
WPS1 192 Effects of Tax Reform on Argentina's Jacques Morisset September 1993 G. CarterRevenues Alejandro lzquierdo 30603
WPS1 193 The Armenian Labor Market in Milan Vodopivec September 1993 S. FlorezTransition: Issues and Options Wayne Vroman 39075

Policy Research Working Paper Series
ContactTltle Author Date for paper
WPS1 194 How Fast Has Chinese Industry Tom Rawski September 1993 E. KhineGrown? 37471
WPS1 195 The Enterprise Sector and Mark Schaffer September 1993 E. KhineEmergence of the Polish Fiscal 37471Crisis, 1990-91
WPS1 196 Corporate Tax Structure and Jeffrey Bernstein Sup'ember 1993 C. JonesProduction Anwar Shah 37754
WPS1 197 Determinants of Inflation among Bruno Boccara September 1993 C. JonesFranc Zone Countries in Africa Shantayanan Devarajan 37754
WPS1198 Enterprise Reform in China: The Natalie Lichtenstein September 1993 M. RangarajanEvolving Legal Framework 81710
WPS1199 Public Pension Governance and Olivia Mitchell October 1993 D. EvansPerformance: Lessons for Developing 37496Countries
WPS1200 The Life-Cycle Distributional Jane Falkingham October 1993 D. EvansConsequences of Pay-As-You-Go PaulJohnson 37496and Funded Pension Systems
WPS1201 Five Criteria for Choosing among Margaret E. Grosh October 1993 M. OuinteroPoverty Programs 37792
WPS1202 Privatization and Foreign Investment Frank Sader October 1993 Rose Voin the Developing World, 1988-92 33722
WPS1203 Determinants of Value-Added Tax Zeljko Bogetic October 1993 F. SmithRevenue: A Cross-Section Analysis Fareed Hassan 36072
WPS1 204 Structural Adjustment, Economic Nisha Agrawal October 1993 K. RiveraPerformance, and Aid Dependency Zafar Ahmed 34141in Tanzania Michael Mered
Roger Nord
WPS1205 Wage and Employment Decisions Simon Commander October 1993 0. del Cidin the Russian Economy: An Analysis Leonid Liberman 36303of Developments in 1992 Ruslan Yemtsov
WPS1206 Empirical Perspectives on National Ishac Diwan October 1993 A. YideruIndex Funds Vihang Errunza 36067
Lemma W. SAnbet
WPS1207 Characteristics and Performance Bill H. Kinsey October 1993 H. Binswangerof Settlement Programs: A Review Hans P. Binswanger 31871
WPS1208 Primary School Achievement in Levi M. Nyagura October 1993 I. ConachyEnglish and Mathematics in Abby Riddell 33669