public disclosure authorized pakistan development update · public disclosure authorized ......
TRANSCRIPT

April 2014
Poverty Reduction and Economic Management, South Asia Region
The World Bank
Pakistan Development Update
Pub
lic D
iscl
osur
e A
utho
rized
Pub
lic D
iscl
osur
e A
utho
rized
Pub
lic D
iscl
osur
e A
utho
rized
Pub
lic D
iscl
osur
e A
utho
rized
Pakistan Development Update 2014
2
Table of Contents
Summary ............................................................................................................................................................ 5
Recent Economic Developments ...................................................................................................................... 7
Economic growth is picking up, driven by industry and services sectors ....................................................... 7
Fiscal consolidation is allowing recovery in credit to private sector .............................................................. 9
Inflationary concerns resurfaced .................................................................................................................. 10
Fiscal consolidation is taking place ............................................................................................................... 11
Public debt continues to be a source of concern .......................................................................................... 14
Marginal growth of financial flows continues to make external sector vulnerable ..................................... 15
Financial Sector Developments ...................................................................................................................... 18
Progress with Structural Reforms ................................................................................................................. 19
Medium-Term Outlook .................................................................................................................................. 21
Box 1: FBR Tax Strategy ................................................................................................................................. 23
Box 2: The Tax Directory of Parliamentarians .............................................................................................. 24
Box 3: Reform of State-Owned Enterprises (SOEs) ....................................................................................... 25
Annex 1: World Bank Support to Pakistan .................................................................................................... 26
Annex 2: Pakistan Data Sheet ....................................................................................................................... 27
This brief was prepared by Saadia Refaqat (Economist, SASEP) under the guidance of Jose R. Lopez-Calix
(Lead Economist, SASEP). Sector analysis are contributed by: Summary (Jose R. Lopez-Calix), Hanid
Mukhtar (fiscal and progress with structural reforms), Mehwish Ashraf (debt), Muhammad Waheed (real
and monetary), Saadia Refaqat (inflation, balance of payments and medium-term outlook), and Rafay Khan
(financial sector).

Pakistan Development Update 2014
3
List of Acronyms
3G Third Generation
ADB Asian Development Bank
ATM Average Time to Maturity
ATR Average Time to Re-fixing
BISP Benazir Income Support Programme
BOI Board of Investment
BOP Balance of Payments
CAR Capital Adequacy Ratio
CASA Central Asia South Asia
CY Calendar Year
CCI Council of Common Interest
CCOP Cabinet Committee on Privatization
CCOR Cabinet Committee on Restructuring
CCTs Conditional Cash Transfers
CEOs Chief Executive Officers
CGT Capital Gains Tax
CNG Compressed Natural Gas
CSF Coalition Support Fund
DPC Development Policy Credit
ECC Economic Coordination Committee
EFF Extended Fund Facility
EMBI Emerging Market Bond Index
EOBI Employees Old Age Benefits Institution
EU European Union
FATA Federally Administered Tribal Areas
FBR Federal Board of Revenue
FDI Foreign Direct Investment
FPI Foreign Portfolio Investment
FY Fiscal Year
GDP Gross Domestic Product
GSP Generalized System of Preferences
GST General Sales Tax
H1 First Half (of the fiscal year)
IMF International Monetary Fund
KESC Karachi Electricity Supply Corporation
KIBOR Karachi Interbank Offered Rate
KSE Karachi Stock Exchange
LOI Letter of Intent
LSM Large-scale Manufacturing
M2 Broad Money
MDTF-KP Multi Donor Trust Fund – Khyber Pakhtunkhwa
MFN Most Favored Nation

Pakistan Development Update 2014
4
MOUs Memorandums of Understanding
MRTBs Market Related Treasury Bills
MTBs Market Treasury Bills
NDA Net Domestic Asset
NFA Net Foreign Asset
NFNE Non-food, non-energy
NISP National Income Support Programme
NPLs Non-performing Loans
NSS National Saving Schemes
PASSCO Pakistan Agricultural Storage and Supplies Corporation
PBS Pakistan Bureau of Statistics
PEPCO Pakistan Electric Power Company
PIA Pakistan International Airlines
PK Pakistan
PML (N) Pakistan Muslim League (Nawaz)
POL Petroleum, Oils and Lubricants
PSBs Private Sector Businesses
PTCL Pakistan Telecommunications Company Limited
Q1 First Quarter (of the fiscal year)
RM Reserve Money
ROA Return on Asset
ROE Return on Equity
Rs Pakistani Rupee
SAFTA South Asian Free Trade Agreement
SBP State Bank of Pakistan
SECP Securities and Exchange Commission of Pakistan
SEZs Special Economic Zones
SMEs Small and Medium Enterprises
SOEs State Owned Enterprises
SROs Statutory Regulatory Orders
US United States
US$ United States Dollar
USC Utility Stores Corporation
WAPDA Water and Power Development Authority
YoY Year-on-Year
Pakistan Development Update 2014
5
Summary
Pakistan’s economy is weak but at a turning point. Growth recovery is underway, with the projected
GDP growth approaching 3.6-4.0 percent, driven by dynamic manufacturing and service sectors,
better energy availability, and early revival of investor confidence. Inflation is steady at 7.9 percent
(y-o-y). The fiscal deficit is contained at around 6 percent of GDP due to improved tax collection and
restricted current and development expenditure. The current account deficit remains modest, at
around 1 percent of GDP, supported by strong remittances and export dynamism, and the external
position is slowly improving since monetary and exchange rate policies switched gear toward
rebuilding reserves last November. Performance under the IMF program remains satisfactory, with
the 2nd
Review concluded on March 24. Domestic and external risks, however, remain high, but are
declining.
Economic activity is gradually improving. Preliminary data for FY14 show growth picking up,
driven mainly by services and manufacturing. Growth improved in wholesale and retail trade,
finance, and insurance. Acceleration in growth of large-scale manufacturing came from strong
performance of agro-based industries, iron and steel, construction, and external demand-driven
cotton yarn- and fabrics-based textiles. Agriculture appears slightly below target owing to
unfavorable weather conditions. On the demand side, growth continues to be driven by private
consumption. Credit to the private sector has started to rebound and had posted nominal growth of
4.6 percent, y-o-y, as of mid-March 2014. However, private investment recovery is mild; and much of
this is inherited from the crowding out of private-sector credit by government borrowing, which grew
at close to nil in FY13.
A significant correction of a loose fiscal stance is taking place to ensure sustainability. Pakistan is
on track to meet a fiscal deficit target of 5.8 percent of GDP in FY14. FBR collection is slightly below
target. On the expenditure side, energy-related subsidies have been reduced with tariff adjustments.
However, while the government dealt with the stock of the circular debt, which has resulted in
reduced load-shedding in the first months of the year, the circular debt is re-emerging. Public
investment –constrained by lack of fiscal space and any commitment to reduce the fiscal deficit –
remains contained. Public debt remains above the 60 percent of GDP allowed by the Fiscal
Responsibility Law, and justified by security reasons. As large fiscal deficits have been financed
increasingly through domestic borrowing, rollover risk has increased. External financing available to
the government is scarce, but expected to improve in the last two quarters.
The external position is fragile but strengthening. The current account deficit was small, at around
1 percent of GDP by end-FY13 and remains so. In contrast, net official foreign exchange reserves
declined to the equivalent of 1.3 months of imports at the end of June 2013 (bottoming down to 0.6
month of imports by the end of November 2013). But they had risen to above 1.1 month of imports as
of March 26, 2014. This is due in part to the fact that since the second quarter of FY14, the SBP
increased its policy rate and has started to purchase dollars on the spot market, turning decisively
toward rebuilding the external position.
Three sources of risk appear worrisome. Pakistan imports more than it exports, the latter being
constrained by low productivity and competitiveness, limited access to reliable energy, and
cumbersome business regulations. Political events keep FDI flows and private investment low, which
also affects foreign reserves. Uncertain political environment undermines investor confidence and
depresses economic activity. The troubled domestic energy sector continues to endure a long-due
complex inheritance on its circular debt which, contrary to the government’s plans, might affect the
magnitude of fiscal adjustment. However, Pakistan’s Emerging Markets Bonds Index Plus (EMBI+)
risk spread keeps declining from the high levels shown at the start of the new administration. Market

Pakistan Development Update 2014
6
confidence in the government’s program is bearing fruit, as the EMBI has almost halved from 1,011
basis points in March 2013 to around 468 basis points as of March 26, 2014. The government intends
to benefit from it and return to the international markets with the placement of a US$500 million –
US$1 billion Eurobond in the fourth quarter of the current fiscal year.
Pakistan Development Update 2014
7
Recent Economic Developments
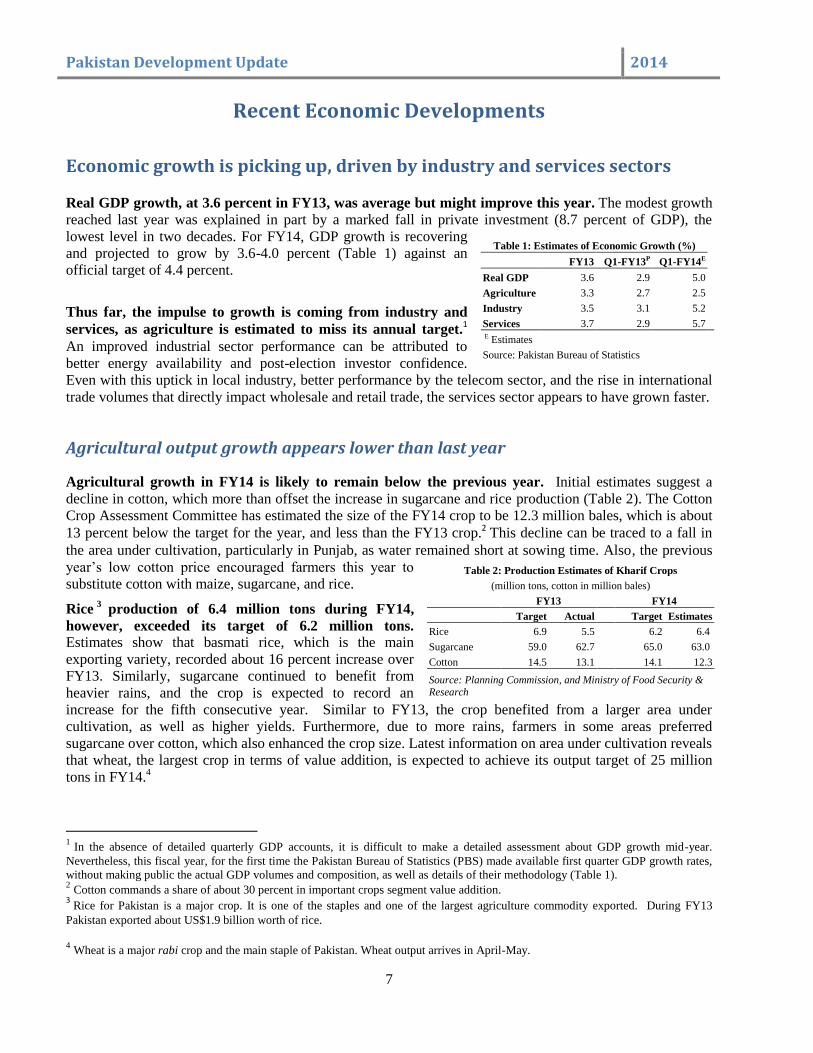
Economic growth is picking up, driven by industry and services sectors Real GDP growth, at 3.6 percent in FY13, was average but might improve this year. The modest growth
reached last year was explained in part by a marked fall in private investment (8.7 percent of GDP), the
lowest level in two decades. For FY14, GDP growth is recovering
and projected to grow by 3.6-4.0 percent (Table 1) against an
official target of 4.4 percent.
Thus far, the impulse to growth is coming from industry and
services, as agriculture is estimated to miss its annual target.1
An improved industrial sector performance can be attributed to
better energy availability and post-election investor confidence.
Even with this uptick in local industry, better performance by the telecom sector, and the rise in international
trade volumes that directly impact wholesale and retail trade, the services sector appears to have grown faster.
Agricultural output growth appears lower than last year
Agricultural growth in FY14 is likely to remain below the previous year. Initial estimates suggest a
decline in cotton, which more than offset the increase in sugarcane and rice production (Table 2). The Cotton
Crop Assessment Committee has estimated the size of the FY14 crop to be 12.3 million bales, which is about
13 percent below the target for the year, and less than the FY13 crop.2 This decline can be traced to a fall in
the area under cultivation, particularly in Punjab, as water remained short at sowing time. Also, the previous
year’s low cotton price encouraged farmers this year to
substitute cotton with maize, sugarcane, and rice.
Rice3
production of 6.4 million tons during FY14,
however, exceeded its target of 6.2 million tons. Estimates show that basmati rice, which is the main
exporting variety, recorded about 16 percent increase over
FY13. Similarly, sugarcane continued to benefit from
heavier rains, and the crop is expected to record an
increase for the fifth consecutive year. Similar to FY13, the crop benefited from a larger area under
cultivation, as well as higher yields. Furthermore, due to more rains, farmers in some areas preferred
sugarcane over cotton, which also enhanced the crop size. Latest information on area under cultivation reveals
that wheat, the largest crop in terms of value addition, is expected to achieve its output target of 25 million
tons in FY14.4
1 In the absence of detailed quarterly GDP accounts, it is difficult to make a detailed assessment about GDP growth mid-year.
Nevertheless, this fiscal year, for the first time the Pakistan Bureau of Statistics (PBS) made available first quarter GDP growth rates,
without making public the actual GDP volumes and composition, as well as details of their methodology (Table 1). 2 Cotton commands a share of about 30 percent in important crops segment value addition.
3 Rice for Pakistan is a major crop. It is one of the staples and one of the largest agriculture commodity exported. During FY13
Pakistan exported about US$1.9 billion worth of rice.
4 Wheat is a major rabi crop and the main staple of Pakistan. Wheat output arrives in April-May.
Table 1: Estimates of Economic Growth (%)
FY13 Q1-FY13P Q1-FY14E
Real GDP 3.6 2.9 5.0
Agriculture 3.3 2.7 2.5
Industry 3.5 3.1 5.2
Services 3.7 2.9 5.7 E Estimates
Source: Pakistan Bureau of Statistics
Table 2: Production Estimates of Kharif Crops
(million tons, cotton in million bales)
FY13
FY14
Target Actual Target Estimates
Rice 6.9 5.5 6.2 6.4
Sugarcane 59.0 62.7 65.0 63.0
Cotton 14.5 13.1 14.1 12.3
Source: Planning Commission, and Ministry of Food Security & Research
Pakistan Development Update 2014
8
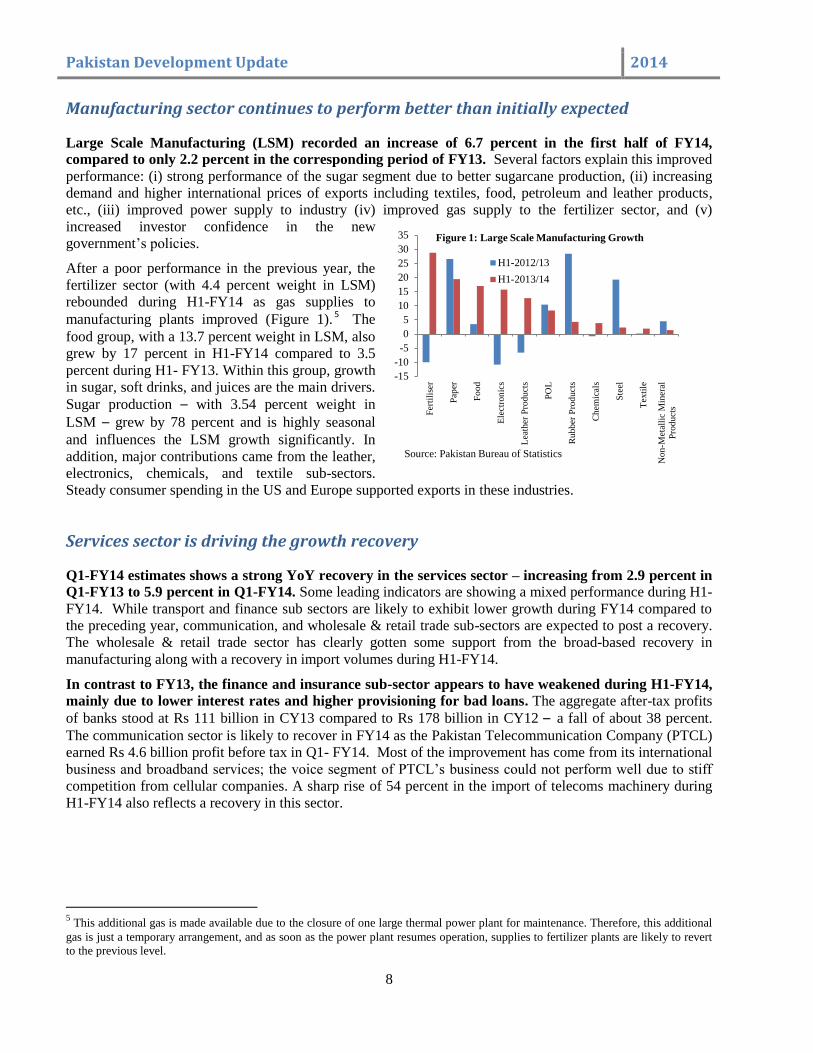
Manufacturing sector continues to perform better than initially expected
Large Scale Manufacturing (LSM) recorded an increase of 6.7 percent in the first half of FY14,
compared to only 2.2 percent in the corresponding period of FY13. Several factors explain this improved
performance: (i) strong performance of the sugar segment due to better sugarcane production, (ii) increasing
demand and higher international prices of exports including textiles, food, petroleum and leather products,
etc., (iii) improved power supply to industry (iv) improved gas supply to the fertilizer sector, and (v)
increased investor confidence in the new
government’s policies.
After a poor performance in the previous year, the
fertilizer sector (with 4.4 percent weight in LSM)
rebounded during H1-FY14 as gas supplies to
manufacturing plants improved (Figure 1).5 The
food group, with a 13.7 percent weight in LSM, also
grew by 17 percent in H1-FY14 compared to 3.5
percent during H1- FY13. Within this group, growth
in sugar, soft drinks, and juices are the main drivers.
Sugar production – with 3.54 percent weight in
LSM – grew by 78 percent and is highly seasonal
and influences the LSM growth significantly. In
addition, major contributions came from the leather,
electronics, chemicals, and textile sub-sectors.
Steady consumer spending in the US and Europe supported exports in these industries.
Services sector is driving the growth recovery
Q1-FY14 estimates shows a strong YoY recovery in the services sector – increasing from 2.9 percent in
Q1-FY13 to 5.9 percent in Q1-FY14. Some leading indicators are showing a mixed performance during H1-
FY14. While transport and finance sub sectors are likely to exhibit lower growth during FY14 compared to
the preceding year, communication, and wholesale & retail trade sub-sectors are expected to post a recovery.
The wholesale & retail trade sector has clearly gotten some support from the broad-based recovery in
manufacturing along with a recovery in import volumes during H1-FY14.
In contrast to FY13, the finance and insurance sub-sector appears to have weakened during H1-FY14,
mainly due to lower interest rates and higher provisioning for bad loans. The aggregate after-tax profits
of banks stood at Rs 111 billion in CY13 compared to Rs 178 billion in CY12 – a fall of about 38 percent.
The communication sector is likely to recover in FY14 as the Pakistan Telecommunication Company (PTCL)
earned Rs 4.6 billion profit before tax in Q1- FY14. Most of the improvement has come from its international
business and broadband services; the voice segment of PTCL’s business could not perform well due to stiff
competition from cellular companies. A sharp rise of 54 percent in the import of telecoms machinery during
H1-FY14 also reflects a recovery in this sector.
5 This additional gas is made available due to the closure of one large thermal power plant for maintenance. Therefore, this additional
gas is just a temporary arrangement, and as soon as the power plant resumes operation, supplies to fertilizer plants are likely to revert
to the previous level.
-15
-10
-5
0
5
10
15
20
25
30
35
Fer
tili
ser
Pap
er
Fo
od
Ele
ctro
nic
s
Lea
ther
Pro
du
cts
PO
L
Ru
bb
er P
rod
uct
s
Ch
emic
als
Ste
el
Tex
tile
No
n-M
etal
lic
Min
eral
Pro
du
cts
Figure 1: Large Scale Manufacturing Growth
H1-2012/13
H1-2013/14
Source: Pakistan Bureau of Statistics

Pakistan Development Update 2014
9
Fiscal consolidation is allowing recovery in credit to private sector
Monetary tightening has begun since end-2013. The SBP increased the policy rate by 50 basis points (bps)
successively in September and November 2013
(Figure 2) to deal with two concerns: a continued
deterioration in the balance of payments position,
and a worsening of inflation outlook during Q1-
FY14. Real weighted average lending rates remain
only marginally positive in recent months.
KIBOR6, which is used as a nominal benchmark
for loans to the corporate sector, has increased by
95 bps on average up to mid-January 2014.
Growth in both reserve money (RM) and broad
money (M2) are largely influenced by fiscal
borrowings for budgetary support and changes
in the external position. The monetary expansion,
YoY, had decelerated to 13 percent by end-January 2014 from 18 percent at end-January 2013, which is
explained by a substantial contraction in Net Foreign
Assets (NFA) of the SBP due to depletion of foreign
exchange reserves to support the rupee. Specifically,
the NFA of SBP contracted by Rs 256 billion at end-
January 2014 (Table 3).
On the other hand, this contraction in NFA is offset
by an increase in Net Domestic Assets (NDA) of the
banking system, by Rs 640 billion (7.5 percent for
July-January FY14. Unlike the previous year, where
NDA growth was almost exclusively driven by
government borrowings, during FY14 so far the
private sector also contributed to this expansion (Table
3). Still, by end-January 2014, government borrowing
from the central bank stood at Rs 431 billion
compared to a retirement of Rs 134 billion in the
comparable period of FY13. The magnitude of central
bank borrowings touched Rs 842 billion by end-
November 2013, as the government shifted from its
previous practice of raising debt mainly from
scheduled banks (Figure 3). It is only since the policy
rate hikes in September and, especially November of
2013 that scheduled banks’ investment in government papers increased, thereby allowing government to retire
some of the SBP borrowing.
A positive development is the mild revival of growth in private sector credit. The private sector borrowed
Rs 299 billion during July-January FY14. By end-December, Private Sector Businesses (PSBs) availed Rs
272 billion during H1-FY14 compared to only Rs 147 billion in H1-FY13. This stemmed from credit uptake
by businesses (textiles, energy, commerce and trade) as well as consumers. Private credit recovery is
attributable to better performance in industry and services due to improved supplies of electricity after
settlement of the energy sector’s circular debt by the government; while more buoyant business sentiment
after the May 2013 elections, in turn, led to a better performance of industry and services sectors. While
6 Karachi Interbank Offered Rate.
Table 3: Monetary Aggregates (Flow since end-June)
Stock
Flow till end-
January
Rs billion 30-Jun-13 FY13 FY14
NFA 269 -28 -248
of which: SBP 133 -84 -256
NDA 8589 605 640
Government borrowing: 5737 618 384
Of which:
Budgetary borrowing 5246 686 485
from SBP 2213 -134 431
from Scheduled banks 3033 820 54
Commodity operations 468 -67 -101
Non-govt sector borrowing: 3664 140 365
Of which:
Private sector 3357 109 299
Public Sector Enterprises 288 32 66
M2 8858 577 393
Growth (YoY)
18 13
RM 2535 250 209
Growth (YoY) 16 13
Source: State Bank of Pakistan
-4.0
-2.0
0.0
2.0
4.0
6.0
Jul-
10
Sep
-10
Nov
-10
Jan-1
1
Mar
-11
May
-11
Jul-
11
Sep
-11
Nov
-11
Jan-1
2
Mar
-12
May
-12
Jul-
12
Sep
-12
Nov
-12
Jan-1
3
Mar
-13
May
-13
Jul-
13
Sep
-13
Nov
-13
Jan-1
4
Real WALR Real Policy Rate
Figure 2: Real Policy and Weighted Average Lending Rates
Real rates calculated using YoY inflation

Pakistan Development Update 2014
10
cement and textiles are modernizing and expanding their production capacity due to higher expected demand
(both domestically and internationally, in light of
the EU granting GSP-Plus trading status to
Pakistan), sugar sector is investing heavily in
bagasse-based power generation projects.
Inflationary concerns resurfaced
The average headline inflation appears to have
firmed up in the single digits. Average headline
inflation during first eight months of FY14 stood at
8.6 percent compared to 8.2 percent during the
same period last year, and 7.4 percent for the full
FY13. The last fiscal year ended with over 60
percent of items registering single-digit inflation
and around 20 percent of items exhibiting deflationary
tendencies (Figure 4). Some favorable supply and
demand factors explain this decline: good weather helped
improve the food supply chain and a sharp reduction in
administered prices (mainly energy and CNG charges) in
the months preceding the general elections.
A temporary rise in inflation rates was predictable in
early FY14. The fiscal year started with the government
revising the GST rate upward from 16 percent to 17
percent. Furthermore, by October, the government levied
an additional 2 percent VAT on selected manufacturing
items. More significant were the several rounds of
upward adjustments in the prices of energy items.7, 8
All
of these have been instrumental in raising inflationary
expectations9 and eventually leading to a broad-based
increase in the headline rate. For instance, following the
upward revisions of administered prices in August and October 2013, the number of non-food items
registering double-digit inflation increased from 28 percent to 36 percent by December 2013 (Figure 5). This
is evident also in significant increases in energy and
housing-related inflation during the first seven months
of FY14, compared to a negligible impact during the
latter part of FY13 (Figure 5). Subdued global
economic trends, a restrained outlook for global
commodity prices, and the international price of oil10
have helped contain the imported content of inflation.
As mentioned earlier, the SBP increased the policy
interest rate by 100 bps during this period to manage
expectations and rein in inflation. Overall, the average
7 Electricity tariffs for commercial, bulk residential, and industrial users were increased by almost 24 percent on August 2013. A second adjustment for
domestic consumers took place in October 2013, when tariffs were increased on average by 16 percent. 8 Energy-related items have an almost 30 percent share in the CPI basket. 9 Upward revision in the VAT rate was only announced at the time of the budget. Moreover, upward revisions in energy and gas prices are expected but
the increase in scale is unclear. 10 Agricultural commodity indices declined from 161.6 in Q3-2013 to 160.3 in January 2014. Similarly, non-fuel commodities and energy indices during this period declined from 166.0 and 195.7 to 164.9 and 188.8 respectively (Source: IMF Commodities Database).
-600
-400
-200
0
200
400
600
800
1000
05
-Jul-
13
19
-Jul-
13
02
-Aug
-13
16
-Aug
-13
30
-Aug
-13
13
-Sep
-13
27
-Sep
-13
11
-Oct
-13
25
-Oct
-13
08
-Nov
-13
22
-Nov
-13
06
-Dec
-13
20
-Dec
-13
03
-Jan
-14
17
-Jan
-14
31
-Jan
-14
Figure 3: Budgetary Borrowings (Rs Billion)
From SBP From Scheduled Banks
0
5
10
15
0
5
10
15
Jan-1
3
Feb
-13
Mar
-13
Apr-
13
May
-13
Jun
-13
Jul-
13
Aug
-13
Sep
-13
Oct
-13
Nov
-13
Dec
-13
Jan-1
4
percen
t
Figure 5: Contribution to CPI: January 2013 –
January 2014 (y-o-y % change)
Food Non-food, non-energyEnergy and housing Headline
Source: State Bank of Pakistan
0%
20%
40%
60%
80%
100%
Jun
-13
Aug
-13
Oct
-13
Dec
-13
Jun
-13
Aug
-13
Oct
-13
Dec
-13
Jun
-13
Aug
-13
Oct
-13
Dec
-13
Overall CPI Food Non-Food
Figure 4: Percentage of items as per YoY
inflation outcome
Deflation over last year Single-digit inflationDouble-digit inflation
Source: State Bank of Pakistan

Pakistan Development Update 2014
11
headline rate for FY14 is expected to be below 10 percent, somewhat higher than the target of 8 percent set by
the government – as a result of the delayed cost of fiscal adjustment.11
Non-food, non-energy (NFNE) core inflation has significantly declined. During the same period (July-
February) NFNE core inflation averaged 8.3 percent, or 190 bps lower than the same period last year. This
indicates that the risk of demand-driven inflation remains low.
Fiscal consolidation is taking place Fiscal balance appears to be improving. After six of years of running a high fiscal deficit, Pakistan’s fiscal
indicators seems to be improving. Two factors explain this apparent departure from the past. First, the newly-
elected government appears to be more committed to fiscal discipline. The FY14 budget presented a strong
revenue effort to bring down the fiscal deficit from 8 percent of GDP in FY13 to 6.4 percent in FY14.
Second, the government prepared an economic reform program with fiscal consolidation as its cornerstone.
The program is supported by the IMF under the Extended Fund Facility (EFF), and commits the government
to take actions to lower the fiscal deficit to 5.8 percent of GDP. This over-2 percent reduction in fiscal deficit
is to be achieved through a 1 percentage point increase in the tax-to-GDP ratio and expenditure compression,
mainly by reducing untargeted power subsidies, for the remaining 1 percentage point of GDP.
The government has initiated bold and far-reaching reforms of the tax system. In order to address some
of the deep-seated structural problems with the revenue system, the government has moved simultaneously on
many fronts. Not only has it increased the tariff rates (especially of GST) and cut down some fiscal
concessions, it is also trying to expand the tax base to untaxed or lightly-taxed sectors. The Federal Board of
Revenue (FBR) has prepared a new tax strategy to establish a coherent basis for its tax efforts (see Box 1 for
details). It has committed to remove most of the tax exemptions (supported or not by SROs) over the next
three-year period. At the same time, it has started issuing notices to potential, but unregistered, taxpayers. To
date, about 70,000 notices have been issued, resulting in registration of 6,500 new taxpayers, while
assessment orders have been issued to another 5,300 individuals. This process will continue for the next two
years, with a plan to issue at least 100,000 notices each year. Similarly, the FBR is aggressively pursuing a
scheme of auditing of tax returns to ensure appropriate tax compliance. A total of 41,700 cases have been
selected for tax audits and to date 10,400 audits have been completed. As a first step towards enhancing
transparency of the tax system, the FBR recently published a Tax Directory of Parliamentarians (see Box 2).
11 Due to revision in tax rates and ongoing upward revisions in the administered prices of energy items, as discussed earlier.

Pakistan Development Update 2014
12
Table 4. Pakistan: Fiscal Accounts, 2009/10–FY14
(In percent of GDP; unless otherwise indicated)
2009/10 2010/11 FY12 FY13 FY14
Actual Actual Actual Jul-Dec P. Actual Budget Jul-Dec Proj.
Revenue and grants 14.1 12.4 13.0 6.2 13.3 14.5 6.6 14.3
Total Revenue 13.8 12.1 12.6 6.2 13.0 14.2 6.5 14.1
Tax revenue 10.0 9.3 10.1 4.3 9.6 10.8 4.5 10.3
Of which: Federal Board of Revenue 8.9 8.5 9.4 3.7 8.5 9.6 4.0 9.0
Nontax revenue 3.9 2.9 2.5 1.9 3.4 3.4 2.0 3.8
Grants 0.3 0.3 0.4 0.0 0.3 0.3 0.1 0.2
Expenditure 20.2 19.0 21.4 8.8 21.0 20.6 8.6 19.9
Current expenditure 16.8 16.5 17.7 7.6 16.0 15.6 7.3 15.8
Interest 4.3 3.8 4.4 2.3 4.3 4.5 2.3 4.7
Subsidies 1.5 2.7 2.8 3.3 1.3 0.9 3.3 1.3
Other federal 2.2 1.9 1.9 3.4 1.9 5.2 2.9 1.5
Provincial 4.2 4.3 4.8 2.0 4.8 5.0 2.1 4.8 Development expenditure & net
lending/1 3.4 2.6 3.7 1.2 5.0 5.0 1.3 4.1
Overall balance
Excluding grants -6.4 -6.9 -8.8 -2.6 -8.0 -6.4 -2.1 -5.8
Including grants -6.1 -6.6 -8.4 -2.6 -7.7 -6.1 -2.0 -5.6
Financing 6.1 6.6 8.4 2.6 7.7 6.1 2.0 5.6
External 0.9 0.3 0.3 0.3 0.0 0.5 -0.2 0.3
Domestic 5.2 6.3 8.1 2.4 7.7 5.6 2.2 5.3
Memorandum items:
Nominal GDP (billions of Pakistani rupees) 14,967 18,285 20,091 23,655 22,909 25,887 26,001 26,139
Sources: Pakistani authorities for historical data; and World Bank staff estimates and projections.
1/ Includes impact of repayment of circular debt and expenditure on BISP/NISP.
H1-FY14 performance raises hopes of achieving fiscal targets
The fiscal consolidation effort appears to be paying off. During the first six months of the fiscal year, the
fiscal deficit (2.1 percent of GDP) was significantly below (by 0.5 percent of GDP) the level achieved during
the same period of last year (Table 4). While the government could not lower the power sector subsidy to the
desired level, despite substantial increases in power tariffs for large consumers, yet the recurrent expenditure
of the government was below the level of first half of last fiscal year. This was mainly because the
government made strong efforts to scale back its non-salary, non-interest recurrent expenditure by controlling
the release of budgetary funds for these activities. Other recurrent expenditure of the federal government was
0.5 percent below the level of H1-FY13. Development expenditure was slightly higher than registered during
the first half of FY13 but is projected to be below its allocation. Revenue collection also showed improvement
as both tax and non-tax revenues were higher than collections for the same period of last year.

Pakistan Development Update 2014
13
4.0
3.6
1.1
0.7
0.6
3.7
3.2
1.0
1.1
0.5
3.9
3.4
1.1
1.3
0.6
0.0 1.0 2.0 3.0 4.0 5.0
Sales tax
Direct taxes
Customs
Other
Federal excise
Percent of GDP
Figure 6: Tax Collection
2013/14 (Proj.) 2012/13 2011/12
2.5
4.4
2.8
1.3
1.9
4.8
2.4
4.3
1.3
1.4
1.9
4.8
2.4
4.7
1.3
1.1
1.5
4.8
0.0 1.0 2.0 3.0 4.0 5.0 6.0
Defence
Interest
Federal subsides
Grants
Other federal
Provincial
Percent of GDP
Figure 7: Recurrent Expenditure
2013/14 (Proj.) 2012/13 2011/12
1.6 1.9
0.1
1.6
1.8 1.6
1.9 2.1
0.1
0.0
0.5
1.0
1.5
2.0
2.5
Federal Dev. Exp. Provincial Dev. Exp. Net lending
Percen
t o
f G
DP
Figure 8: Development Expenditure
2011/12 2012/13 2013/14 (Proj.)
Outlook for fiscal targets vis-à-vis budgeted targets remains positive
Revenue collection is expected to be close to the revised target of Rs 2,345. On the basis of performance
during the first half of the year, the
seasonality in fiscal transactions and the
expected impact of government’s policy
actions, it is projected that FBR tax collection
would not only recover from the
exceptionally poor performance of FY13, but
its tax-to-GDP ratio would much exceed the
level achieved in FY12 and be quite close to
its annual revised target (10.3 percent of
GDP). Collection of all federal taxes is
projected to be significantly higher than last
year while owing to positive trend in
collection of provincial tax, especially
services GST, some increase is expected to
come from collection of provincial revenue (Figure 6).
Recurrent expenditure is expected to remain below the level achieved last year. On the expenditure side,
current expenditure of the federal government
is projected to decline. The government’s
austerity measures are responsible for a
significant reduction in federal government
“other” recurrent spending, while better
financial health of SOEs would imply smaller
demand on federal grants to support these
enterprises. Interest payments would be higher
due to higher accumulated debt, increase in
interest rate by SBP and depreciation of rupee
(Figure 7)12
.
Development spending of the government
(inclusive of net lending to the public corporate sector) is projected to decline from 5 percent of GDP in
FY13 to 4.1 percent in FY14 but only because of a sharp fall in net lending. The apparent fall in overall
development expenditure is an outcome of accounting protocols which include all lending (net of repayments)
of the federal government to SOEs as development
expenditure. In FY13, the sharp increase in
development spending was due solely to very high
levels (equivalent of 1.4 percent of GDP)13
of
federal government’s lending to power sector
enterprises to discharge their payments arrears to
other energy sector corporations. Without this
exceptional net lending, the development
expenditure in FY13 would have been at about the
same level as in FY12 (3.4 percent of GDP) and
on the basis of higher development spending
12
A sizeable portion of government’s domestic debt is in 3-month or 6-month T-Bills. As such, a within-year increase in interest rate
(especially if it is during the first half of the fiscal year) does impact interest payments of the government during the same year. 13
In addition, there was additional federal lending of 0.2 percent of GDP to finance other expenditures of SOEs.

Pakistan Development Update 2014
14
during the first of the FY14 and that many development projects have been only recently started, development
spending could reach about 4 percent of GDP, with some increase in federal and provincial governments’
development expenditures (Figure 8).
Overall, the fiscal deficit is expected to fall from 8 percent of GDP in FY13 to 5.8 percent in FY14.
Expected budget support from multilateral donor agencies (i.e., the World Bank and ADB), should also
improve external financing for the budget, but repayments, especially to the IMF, will also be higher. In net
terms, the external financing position in FY14 is expected to be substantially better than in FY13. The lower
deficit along with higher external financing implies that the need for domestic financing would be much lower
than in the last three years. This could help not only in containing inflationary pressures but also freeing
additional banks’ resources for private credit.
Public debt continues to be a source of concern Public debt continues to exceed the cap of 60 percent of GDP set by the Fiscal Responsibility and Debt
Limitation Act, justified for security reasons. Over the last
two years, the public debt to GDP remained well above the
threshold of 60 percent limit specified by the act passed in
2005 (Figure 9). Large fiscal deficits and their monetary
financing coupled with negligible foreign debt-creating flows
fuelled this trend as well as the increasing share of domestic
debt over the years. During the first half of FY14, the public
debt-to-GDP ratio stood at about 58.9 percent. This is almost
the same level as of December 2012. In line with the
expectations of accelerating though moderate growth, near-
double-digit inflation, and a lower but still large fiscal deficit
for the ongoing fiscal year, the public debt-to-GDP ratio
looks likely to be breached again in FY14.
Domestic debt creation has become increasingly
skewed towards short-term instruments, primarily
MRTBs. Domestic debt increased by almost Rs 1.9
trillion, from Rs 9.5 trillion at end-December 2012 to
Rs 10.2 trillion by end-December 2013. Floating
debt14
constituted more than two-third of this addition
(Figure 10). Within this category, central bank
borrowing gained prominence despite the SBP
Amendment Act 201215
being in place. A high Rs 1.3
trillion (or 89 percent of the floating debt) on
aggregate has been borrowed from the SBP via
MRTBs during this period to finance the budgetary
deficit. This clearly implies that the government is
utilizing fortnightly auctions to roll over the existing stock of treasury bills.16
Refinancing risk remains heightened especially for domestic debt. The redemption profile on domestic
debt is frontloaded with more than Rs 6 trillion of domestic debt maturing in FY14, representing 64.2 percent
14 Short-term domestic debt that includes Market Treasury Bills (MTBs) and Market-Related Treasury Bills (MRTBs). 15 Section 9c of the Act stipulates that net borrowing from the SBP has to be brought to nil on a quarterly basis. 16 The auction targets remained very close to the maturities falling in the respective quarters during January-December 2013. This ratio averaged to 1.05 times. The acceptance to targets ratio also approximated to 1.03 times.
40%
45%
50%
55%
60%
65%
70%
75%
80%
85%
0
2
4
6
8
10
12
14
16
FY12 FY13 H1-FY13 H1-FY14
Rs
tril
lion
Figure 9: Trends in Public Debt
External Domestic Public Debt to GDP (RHS)
Source: State Bank of Pakistan and staff calculations
14%
8% 83%
6%
77%
Figure 10: Domestic Debt Dynamics, December 2013
Permanent Unfunded MRTBs MTBs

Pakistan Development Update 2014
15
of the domestic debt portfolio.17
The refinancing risk on domestic debt is further aggravated by the put option
embedded NSS instruments giving investors the right of early redemption.18 , 19
This redemption profile
translates in an average time to maturity (ATM) of 1.8 years (Table 5). In contrast, the redemption profile on
external debt is significantly smoother and exhibits an ATM of 10.1 years, indicating limited exposure to
refinancing risk.
Exposure to interest rate changes is a substantial risk given the short-term nature of the domestic
securities. Around 67 percent of total domestic debt is exposed to interest rate refixing within one year.20
For
external loans, the share of debt exposed to refixing within one year stands at 22 percent, illustrating that a
relatively large share of external debt has been contracted in variable rates. Average time to refixing (ATR)
for domestic debt is very low, at 1.8 years, comparable to the ATM for domestic debt, while the ATR on
external debt is significantly longer, at 9.2 years. Under these conditions, a 1 percent increase in domestic
interest rates would increase interest payments by Rs 63 billion whereas a 1 percent increase in interest rates
on external debt would increase interest payments by Rs 8.4 billion.
DSA results point towards a declining public debt trajectory in future. Results of a Debt Sustainability
Analysis21
(DSA) show that Pakistan’s risk of debt distress on external and public debt remains low.
Moreover, gross financing needs are projected to decline over the medium-term once the past IMF-Stand By
Agreement is fully repaid and total interest payments average around 29 percent of total revenues (including
grants) over the projection horizon.
Marginal growth of financial flows continues to make external sector vulnerable
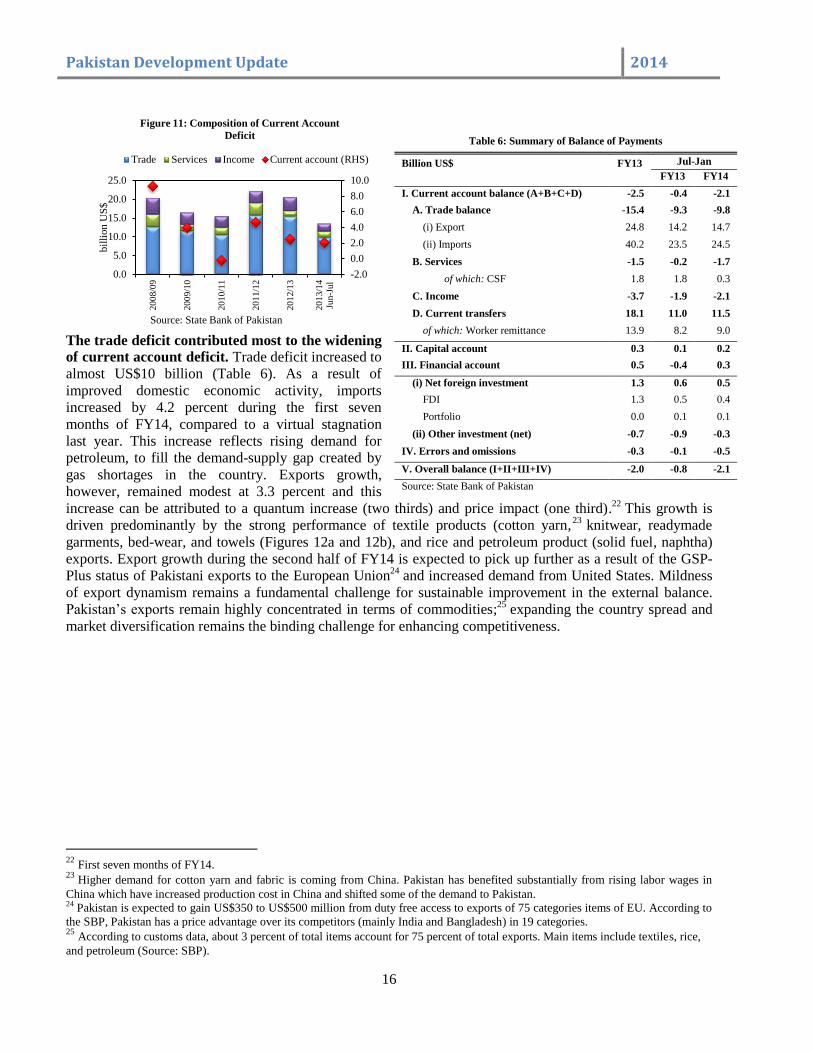
During the first seven months of FY14, the fundamental weaknesses in the balance of payments
position persisted. The current account posted a deficit of US$ 2.0 billion, equivalent to 0.9 percent of GDP,
compared to a deficit of 0.2 percent of GDP during the same period last year. Strong inflows of remittance
continued to keep the current account deficit in check. However, for the third consecutive year, paucity of
financial inflows remained the main source of BOP stress (Figure 11).
17 This number is driven mainly by T-Bills and borrowing from the SBP, accounting for Rs 5.2 trillion. 18 If investors opted to redeem all NSS instruments in 2013/14 the total domestic debt maturing in 2013/14 would increase to about Rs 8 trillion. 19 A constant redemption profile for NSS instruments is assumed. However, rising interest rates may lead investors to redeem their investments in NSS
instruments earlier, hence increasing required roll-over. 20 Comprising all MTBs and borrowing from the SBP, as well as longer term domestic debt that matures in 2013/14. 21 World Bank Debt Sustainability Analysis, 2013/14.
Table 5. Public Debt: Cost and Risk Indicators, end-June 2013
Risk Indicators External debt Domestic debt Total debt
Cost of debt Weighted Average Interest Rate (%) 1.9 10.7 7.8
Refinancing risk ATM (years) 10.1 1.8 4.5
Debt maturing in 1yr (% of total) 8.9 64.2 46.0
Interest rate risk
ATR (years) 9.2 1.8 4.2
Debt re-fixing in 1yr (% of total) 22.2 67.2 52.4
Fixed rate debt (% of total) 83.4 39.6 54.0
Source: Pakistani authorities and World Bank staff calculations
Pakistan Development Update 2014
16
-2.0
0.0
2.0
4.0
6.0
8.0
10.0
0.0
5.0
10.0
15.0
20.0
25.0
200
8/0
9
200
9/1
0
201
0/1
1
201
1/1
2
201
2/1
3
201
3/1
4
Jun-J
ul
bil
lion
US
$
Figure 11: Composition of Current Account
Deficit
Trade Services Income Current account (RHS)
Source: State Bank of Pakistan
The trade deficit contributed most to the widening
of current account deficit. Trade deficit increased to
almost US$10 billion (Table 6). As a result of
improved domestic economic activity, imports
increased by 4.2 percent during the first seven
months of FY14, compared to a virtual stagnation
last year. This increase reflects rising demand for
petroleum, to fill the demand-supply gap created by
gas shortages in the country. Exports growth,
however, remained modest at 3.3 percent and this
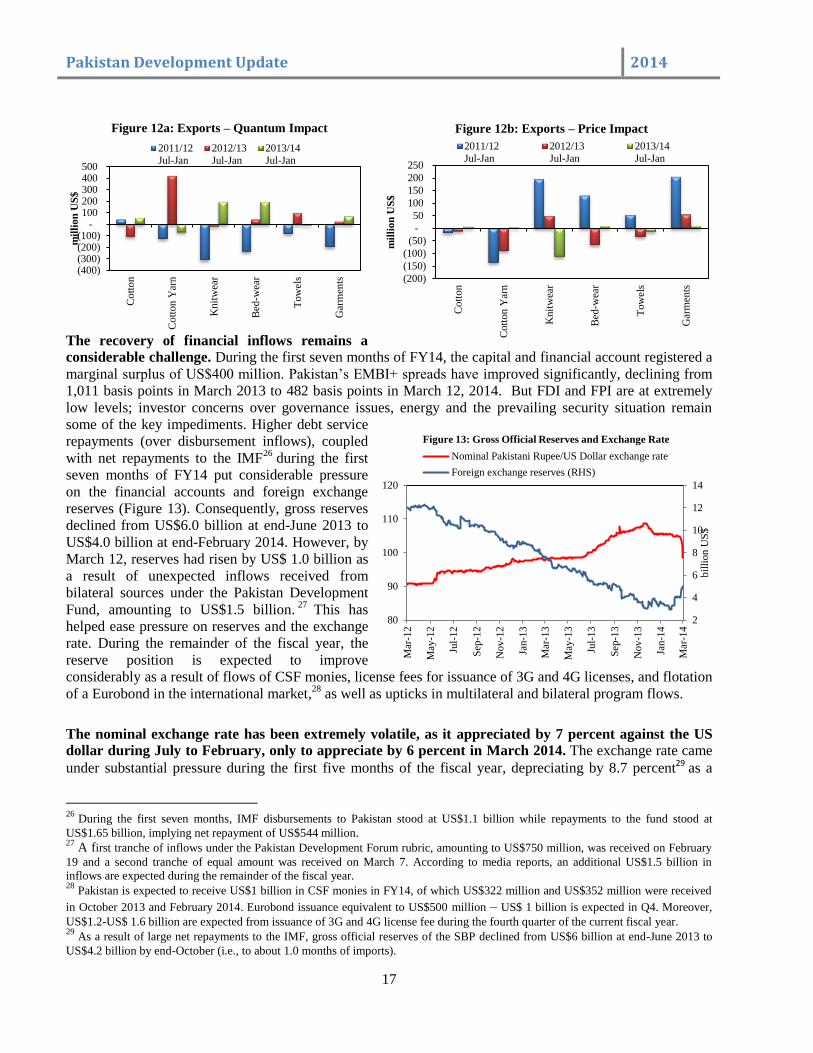
increase can be attributed to a quantum increase (two thirds) and price impact (one third).22
This growth is
driven predominantly by the strong performance of textile products (cotton yarn,23
knitwear, readymade
garments, bed-wear, and towels (Figures 12a and 12b), and rice and petroleum product (solid fuel, naphtha)
exports. Export growth during the second half of FY14 is expected to pick up further as a result of the GSP-
Plus status of Pakistani exports to the European Union24
and increased demand from United States. Mildness
of export dynamism remains a fundamental challenge for sustainable improvement in the external balance.
Pakistan’s exports remain highly concentrated in terms of commodities;25
expanding the country spread and
market diversification remains the binding challenge for enhancing competitiveness.
22
First seven months of FY14. 23
Higher demand for cotton yarn and fabric is coming from China. Pakistan has benefited substantially from rising labor wages in
China which have increased production cost in China and shifted some of the demand to Pakistan. 24 Pakistan is expected to gain US$350 to US$500 million from duty free access to exports of 75 categories items of EU. According to
the SBP, Pakistan has a price advantage over its competitors (mainly India and Bangladesh) in 19 categories. 25
According to customs data, about 3 percent of total items account for 75 percent of total exports. Main items include textiles, rice,
and petroleum (Source: SBP).
Table 6: Summary of Balance of Payments
Billion US$ FY13 Jul-Jan
FY13 FY14
I. Current account balance (A+B+C+D) -2.5 -0.4 -2.1
A. Trade balance -15.4 -9.3 -9.8
(i) Export 24.8 14.2 14.7
(ii) Imports 40.2 23.5 24.5
B. Services -1.5 -0.2 -1.7
of which: CSF 1.8 1.8 0.3
C. Income -3.7 -1.9 -2.1
D. Current transfers 18.1 11.0 11.5
of which: Worker remittance 13.9 8.2 9.0
II. Capital account 0.3 0.1 0.2
III. Financial account 0.5 -0.4 0.3
(i) Net foreign investment 1.3 0.6 0.5
FDI 1.3 0.5 0.4
Portfolio 0.0 0.1 0.1
(ii) Other investment (net) -0.7 -0.9 -0.3
IV. Errors and omissions -0.3 -0.1 -0.5
V. Overall balance (I+II+III+IV) -2.0 -0.8 -2.1
Source: State Bank of Pakistan
Pakistan Development Update 2014
17
(400) (300) (200) (100)
- 100 200 300 400 500
Co
tton
Co
tton
Yar
n
Knit
wea
r
Bed
-wea
r
Tow
els
Gar
men
ts
mil
lio
n U
S$
Figure 12a: Exports – Quantum Impact
2011/12
Jul-Jan
2012/13
Jul-Jan
2013/14
Jul-Jan
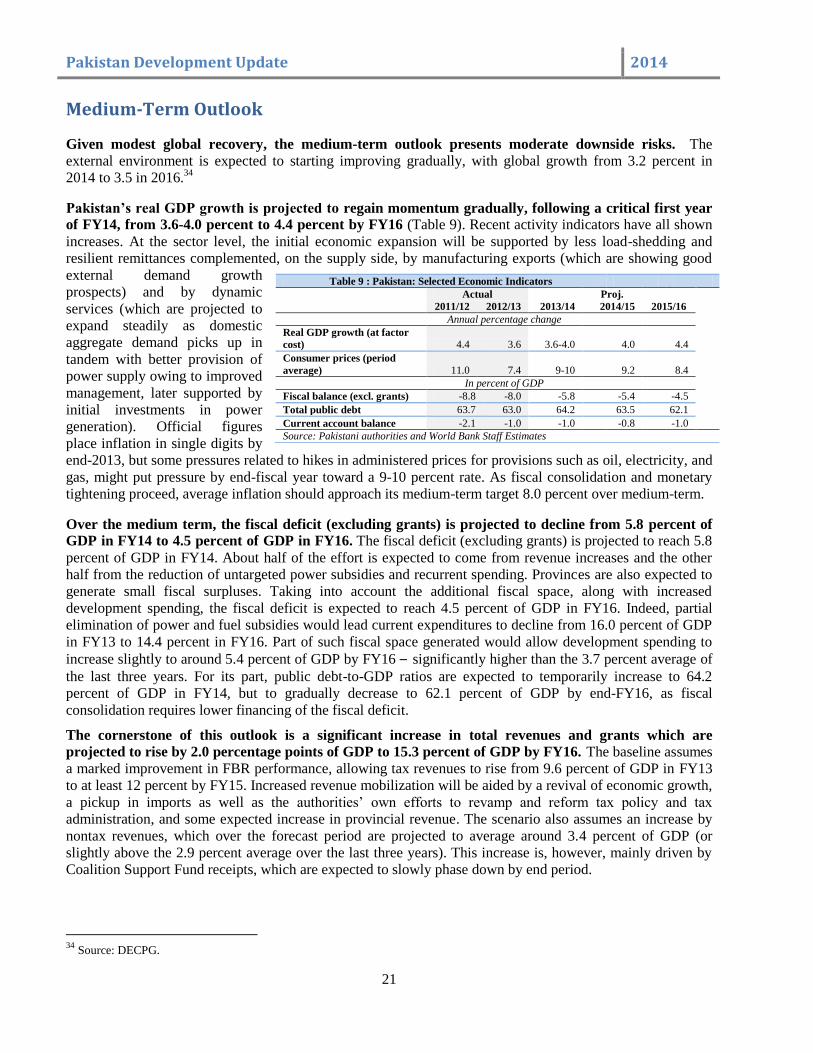
The recovery of financial inflows remains a
considerable challenge. During the first seven months of FY14, the capital and financial account registered a
marginal surplus of US$400 million. Pakistan’s EMBI+ spreads have improved significantly, declining from
1,011 basis points in March 2013 to 482 basis points in March 12, 2014. But FDI and FPI are at extremely
low levels; investor concerns over governance issues, energy and the prevailing security situation remain
some of the key impediments. Higher debt service
repayments (over disbursement inflows), coupled
with net repayments to the IMF26
during the first
seven months of FY14 put considerable pressure
on the financial accounts and foreign exchange
reserves (Figure 13). Consequently, gross reserves
declined from US$6.0 billion at end-June 2013 to
US$4.0 billion at end-February 2014. However, by
March 12, reserves had risen by US$ 1.0 billion as
a result of unexpected inflows received from
bilateral sources under the Pakistan Development
Fund, amounting to US$1.5 billion.27
This has
helped ease pressure on reserves and the exchange
rate. During the remainder of the fiscal year, the
reserve position is expected to improve
considerably as a result of flows of CSF monies, license fees for issuance of 3G and 4G licenses, and flotation
of a Eurobond in the international market,28
as well as upticks in multilateral and bilateral program flows.
The nominal exchange rate has been extremely volatile, as it appreciated by 7 percent against the US
dollar during July to February, only to appreciate by 6 percent in March 2014. The exchange rate came
under substantial pressure during the first five months of the fiscal year, depreciating by 8.7 percent29 as a
26
During the first seven months, IMF disbursements to Pakistan stood at US$1.1 billion while repayments to the fund stood at
US$1.65 billion, implying net repayment of US$544 million. 27
A first tranche of inflows under the Pakistan Development Forum rubric, amounting to US$750 million, was received on February
19 and a second tranche of equal amount was received on March 7. According to media reports, an additional US$1.5 billion in
inflows are expected during the remainder of the fiscal year. 28
Pakistan is expected to receive US$1 billion in CSF monies in FY14, of which US$322 million and US$352 million were received
in October 2013 and February 2014. Eurobond issuance equivalent to US$500 million – US$ 1 billion is expected in Q4. Moreover,
US$1.2-US$ 1.6 billion are expected from issuance of 3G and 4G license fee during the fourth quarter of the current fiscal year. 29
As a result of large net repayments to the IMF, gross official reserves of the SBP declined from US$6 billion at end-June 2013 to
US$4.2 billion by end-October (i.e., to about 1.0 months of imports).
(200)
(150)
(100)
(50)
-
50
100
150
200
250
Co
tton
Co
tton
Yar
n
Knit
wea
r
Bed
-wea
r
Tow
els
Gar
men
ts
mil
lio
n U
S$
Figure 12b: Exports – Price Impact
2011/12
Jul-Jan
2012/13
Jul-Jan
2013/14
Jul-Jan
2
4
6
8
10
12
14
80
90
100
110
120
Mar
-12
May
-12
Jul-
12
Sep
-12
Nov
-12
Jan-1
3
Mar
-13
May
-13
Jul-
13
Sep
-13
Nov
-13
Jan-1
4
Mar
-14
bil
lion
US
$
Figure 13: Gross Official Reserves and Exchange Rate
Nominal Pakistani Rupee/US Dollar exchange rate
Foreign exchange reserves (RHS)

Pakistan Development Update 2014
18
result of net repayments to IMF, weak official inflows, and heavy debt repayments30
. Since November,
however, the SBP has started to purchase dollars on the spot market, turning decisively toward rebuilding the
external position and reserves.31
Moreover, in January, a considerable portion of oil import payments was
moved out of the interbank market to FE-25,32
easing further pressure on the exchange rate. However, recent
inflows of what appear to be Saudi funds have improved the reserve position and helped the rupee undershoot
its value back to around Rs 98/1 US$. This nominal appreciation will certainly hurt both exports and customs-
related tax revenues.
Financial Sector Developments
The concentration of the financial sector’s balance sheet remained tilted towards the public sector, its operating performance remained steady, while the solvency indicators of banks remained robust
Banking sector profitability was steady, declining only slightly in calendar year 2013. The benchmark
interest rate (6-month KIBOR) increased from 9.4 percent in December 2012 to 10.2 percent in December
2013. Return on assets (ROA) and return on equity
(ROE) during the last quarter of 2013 was at 1.7
percent and 18.4 percent, compared to 2 percent and
21.4 percent during the same period last year. The
sector’s liquidity and solvency positions remain
strong backed by sluggish growth in advances and
sizeable concentration of the asset portfolio in
government securities which carry low risk
weightages. Capital adequacy ratio (CAR) stood at
14.9 percent in December 2013, a slight decrease
over the same period last year (Table 7).
Non-Performing Loans (NPLs) showed a slight
decline. NPLs decreased slightly, from 14.5 percent
in December 2012 to 13.0 percent in December
2013. Adequate provisioning also kept net NPLs ratio in check at 3.1 percent in December 2013. NPLs in
small and medium enterprises (SMEs) remain high, representing 32.3 percent of loans, followed by the
agricultural sector (14 percent) and consumer sector
(13.6 percent). The largest share of the portfolio is
the corporate sector (66.8 percent of loans) where
the NPL ratio is 13.4 percent.
Microfinance continues to expand. The formal
microfinance banks continue to explore new
approaches to expand its outreach, including
branchless banking. The sector registered a 20.0
percent increase in active borrowers, 36 percent
30 After substantial purchases of foreign exchange in August in the run-up to the IMF board meeting, the SBP returned to net dollar
sales in September and October to counter the exchange rate pressures and maintain market liquidity (IMF Country Report no. 14/1),
January 2014. 31
As agreed under the IMF program. 32
Almost 40 percent of total oil import payments have been moved from interbank market to FE-25. This implies that these payments
will be financed by creating loans against dollar deposits in commercial banks.
Table 7: Selected Key Indicators of the Banking Sector
Dec 2012 Dec 2013
Profit Before Tax (Rs bn) 179 165
ROA Before Tax (%) 2.0 1.7
ROE Before Tax (%) 21.4 18.4
Advances to Deposits Ratio (%) 52.2 48.6
Liquid Assets/Total Deposits (%) 64.5 60
Capital Adequacy Ratio (%) 15.6 14.9
Gross NPLs to Loans (%) 14.5 13.0
Net NPLs to Loans (%) 4.6 3.1
6 month KIBOR (%) 9.38 10.15
Source: Quarterly Compendium of the Banking System, December 2013
SBP.
Table 8: Microfinance Sector in Pakistan
Dec 2012 Dec 2013 Active Borrowers 2,355,943 2,832,715
Gross Loan Portfolio (Rs mn) 38,238 52,092
Average Loan Size (Rs) 24,131 26,838
Number of Savers 4,682,422 5,977,426
Value of Savings (Rs mn) 24,974 34,784
Portfolio At Risk >30 days 1.4% 1.2%
Source: Micro WATCH Issue 26 and 30: Pakistan Microfinance Network

Pakistan Development Update 2014
19
growth in gross loan portfolio, 27 percent increase in savers and 40 percent in value of savings over the
calendar year (Table 8). Portfolio at risk declined slightly to 1.2 percent due to adequate write-offs of bad
loans.
The equity market stays on the bullish trajectory begun in the past calendar year. The KSE-100 index
crossed the 20,000 point threshold for the first time in 2013 and increased its market capitalization to Rs 6
billion, signifying an increase of 42 percent over calendar year 2013. In terms of returns, the KSE-100 index
increased 49.4 percent in 2013, making it one of the best-performing stock markets in the world for a third
consecutive year. The upward trend in turnover volumes and the KSE-100 index has been driven by the
monetary easing cycle, foreign portfolio investment, resilient corporate profitability, a smooth political
transition to a business-friendly democratic government, and a number of capital market reforms including
revamping of a capital gains tax (CGT) regime, introduction of revised code of corporate governance, etc. The
growth has also been led by increased investor confidence in the policies of the incumbent government.
Among those policies is the revival of the privatization program (see below and Box 3: SOE Reforms).
Progress with Structural Reforms
The government is pursuing a comprehensive program of economic and social reforms, with a main
purpose of reinvigorating a broad-based private sector-led economic growth. As a first step in this
direction, the government is striving to re-establish macroeconomic stability through fiscal consolidation,
with a main target of achieving a fiscal deficit of 4 percent of GDP or less33
. In addition, it has applied
stringent measures to control non-development and discretionary expenditure. In parallel, it has implemented
core structural reforms that include:
Energy sector reforms. The main emphasis is on: (i) managing power sector tariffs and subsidies, with
the Economic Coordination Committee (ECC) approving the Tariff and Subsidy Policy Guidelines which
include a subsidy policy for low-income residential customers; (ii) improving power sector performance
and opening the market to private participation by instructing poorly performing distribution companies
to outsource their high loss-making feeders to the private sector; (iii) enhancing sector accountability and
transparency by requiring each distribution company to itemize the amount of subsidy in each customer’s
bill, as well as publishing on their websites monthly billing and collection data aggregated by consumer
category.
Privatization. As a main step in this direction, the government aims to revive and revitalize Pakistan’s
privatization program that had been more or less stalled for over eight years. The Cabinet Committee on
Privatization (CCOP) has approved a list of 31 state-owned enterprises (SOEs) to be privatized in a
phased approach. The privatization of three SOEs is in an advanced stage. Two SOEs are expected to be
put up for sale in the next six months, while the government is divesting it shares in three SOEs through
domestic and international stock markets.
Financial sector development. To eliminate the financial markets of some of its inherent distortions, the
government is in the process of enacting a Credit Bureau law, which will institutionalize access to finance
and credit information and strengthen creditors’ rights, which could be critical for investment recovery.
Similarly, the government has notified rules for micro insurance in order to enhance transparency of the
sector and help to increase the density and affordability of insurance, especially of the low-income
population. The government is also in the process of enhancing the supervisory role of the Securities and
Exchange Commission of Pakistan (SECP) over the corporatization of postal life insurance.
Facilitating doing business: Private-sector investment is inhibited by Pakistan’s cumbersome business
procedures. During the last two years, the SECP had developed and rolled out an electronic platform for
the business registration system, which had led to a significant reduction in the time taken to register a
33
By FY17.

Pakistan Development Update 2014
20
business. Yet 21 days and 10 procedures are still needed to register a business in Pakistan. To further
facilitate business registration, the government has been working to develop a “one-stop-shop” for
business registration, creating a shared platform for registration between the SECP, the Federal Board of
Revenue (FBR), and the Employees’ Old Age Benefit Institution (EOBI), to reduce the time and cost to
businesses in the registration process. In the same way, creation of Special Economic Zones (SEZs) will
help foster foreign investment. For this the government has recently approved a SEZ bill in order to
provide a coherent framework for SEZs and one SEZ is approved for establishment by Board of
Investment (BOI).
Trade and tariff reforms. The government is undertaking trade policy reforms which could stimulate
growth and competition and increase consumer welfare. Simplifying tariff rates, and eliminating the
statutory regulatory orders (SROs) that establish special tariff rates and improving trade relations with
Pakistan’s commercial partners, especially those of SAFTA, are among the government’s main policy
goals to provide a level playing field and a much-needed boost to growth and investment. The
government is committed to achieve a simple statutory (Most Favored Nation) rates regime of four slabs
by end-2016/17.
Strengthening social safety nets. Protecting the most vulnerable from the ill-effects of its structural
adjustment reforms measures, the government has not only enhanced the monthly stipend provided to the
beneficiaries of the Benazir Income Support Program (BISP) by 20 percent, it has also expanded the
coverage of BISP to over 5.5 million families. Meanwhile, the BISP has signed MOUs with the provincial
education authorities to initiate Conditional Cash Transfers (CCTs) in 20 districts of the country. This
will provide the families monthly cash transfers from the BISP on the condition that they send their
school-aged children to primary schools.
Pakistan Development Update 2014
21
Medium-Term Outlook
Given modest global recovery, the medium-term outlook presents moderate downside risks. The
external environment is expected to starting improving gradually, with global growth from 3.2 percent in
2014 to 3.5 in 2016.34
Pakistan’s real GDP growth is projected to regain momentum gradually, following a critical first year
of FY14, from 3.6-4.0 percent to 4.4 percent by FY16 (Table 9). Recent activity indicators have all shown
increases. At the sector level, the initial economic expansion will be supported by less load-shedding and
resilient remittances complemented, on the supply side, by manufacturing exports (which are showing good
external demand growth
prospects) and by dynamic
services (which are projected to
expand steadily as domestic
aggregate demand picks up in
tandem with better provision of
power supply owing to improved
management, later supported by
initial investments in power
generation). Official figures
place inflation in single digits by
end-2013, but some pressures related to hikes in administered prices for provisions such as oil, electricity, and
gas, might put pressure by end-fiscal year toward a 9-10 percent rate. As fiscal consolidation and monetary
tightening proceed, average inflation should approach its medium-term target 8.0 percent over medium-term.
Over the medium term, the fiscal deficit (excluding grants) is projected to decline from 5.8 percent of
GDP in FY14 to 4.5 percent of GDP in FY16. The fiscal deficit (excluding grants) is projected to reach 5.8
percent of GDP in FY14. About half of the effort is expected to come from revenue increases and the other
half from the reduction of untargeted power subsidies and recurrent spending. Provinces are also expected to
generate small fiscal surpluses. Taking into account the additional fiscal space, along with increased
development spending, the fiscal deficit is expected to reach 4.5 percent of GDP in FY16. Indeed, partial
elimination of power and fuel subsidies would lead current expenditures to decline from 16.0 percent of GDP
in FY13 to 14.4 percent in FY16. Part of such fiscal space generated would allow development spending to
increase slightly to around 5.4 percent of GDP by FY16 – significantly higher than the 3.7 percent average of
the last three years. For its part, public debt-to-GDP ratios are expected to temporarily increase to 64.2
percent of GDP in FY14, but to gradually decrease to 62.1 percent of GDP by end-FY16, as fiscal
consolidation requires lower financing of the fiscal deficit.
The cornerstone of this outlook is a significant increase in total revenues and grants which are
projected to rise by 2.0 percentage points of GDP to 15.3 percent of GDP by FY16. The baseline assumes
a marked improvement in FBR performance, allowing tax revenues to rise from 9.6 percent of GDP in FY13
to at least 12 percent by FY15. Increased revenue mobilization will be aided by a revival of economic growth,
a pickup in imports as well as the authorities’ own efforts to revamp and reform tax policy and tax
administration, and some expected increase in provincial revenue. The scenario also assumes an increase by
nontax revenues, which over the forecast period are projected to average around 3.4 percent of GDP (or
slightly above the 2.9 percent average over the last three years). This increase is, however, mainly driven by
Coalition Support Fund receipts, which are expected to slowly phase down by end period.
34
Source: DECPG.
Table 9 : Pakistan: Selected Economic Indicators
Actual
Proj.
2011/12 2012/13 2013/14 2014/15 2015/16
Annual percentage change
Real GDP growth (at factor
cost) 4.4 3.6 3.6-4.0
4.0
4.4
Consumer prices (period
average) 11.0 7.4 9-10
9.2
8.4
In percent of GDP
Fiscal balance (excl. grants) -8.8 -8.0 -5.8 -5.4 -4.5
Total public debt 63.7 63.0 64.2 63.5 62.1
Current account balance -2.1 -1.0 -1.0 -0.8 -1.0
Source: Pakistani authorities and World Bank Staff Estimates

Pakistan Development Update 2014
22
The current account deficit is projected to approach a modest 1 percent of GDP by end-FY14, and
remain modest during the projection period supported by some export recovery, strong dynamism of
remittances and imports favored by low international oil prices. Higher financial inflows are expected to
be attracted by lower country risk, privatizations, new trade relations with neighbors and the opening of
special economic zones and multilateral flows. Official foreign exchange reserves are expected to build from
US$6.0 billion by the end of FY13 to about US$16 billion by the end-FY16 (equivalent to three months of
imports). The main projected sources of financing are the Coalition Support Fund, Pakistan
Telecommunication Company Ltd. privatization, and sales of G3 and G4 telecoms licenses. IMF and donor
financing should help rebuild this critical buffer.
Pakistan Development Update 2014
23
Box 1: FBR Tax Strategy
The Federal Board of revenue (FBR) has prepared a tax reform strategy aimed at increasing tax collection from 9.7
percent to 14 percent of GDP by FY17. The main goal of the strategy is to raise tax-to-GDP ratio from 9.5 percent in
FY13 to 15 percent in FY18. This is consistent with government’s commitment to achieve a sustainable fiscal deficit of
around 4 percent of GDP by FY17.
The FBR tax strategy has four focus areas:
(i) Rationalization of concessionary regime: The main focus is to achieve a sizeable revenue gain by eliminating all
Statutory Regulatory Orders (SROs) which provide ad hoc tax exemptions or concessions over a period of three
years. The critical SROs are to be made part of tax law through an action of the parliament, while the remainder
would be phased out. The FBR plans to start eliminating the first batch of SROs identified in the FY15 budget,
which, along with other budgetary measures, will yield up to 0.75 percent of GDP in revenue. In addition, the
existing tax laws will be amended to prohibit a resort to such ad-hoc policy measures in the future.
(ii) Reducing the tax gap: The FBR intends to take a number of actions to strengthen its tax enforcement capabilities.
The key initiatives include: initiating sector studies to estimate the tax potential of each sector; facilitating access to
information on bank accounts of potential tax evaders and tax avoiders; enhancing FBR capacity for undertaking
and expanding the coverage of tax audits; and institutionalizing a risk-based system of sales tax registration, which
would not only expand the tax base but also be capable of detecting and forestalling the abuse of the tax refund
process. These measures will be supplemented by a computerized risk-based evaluation of sales tax returns and an
automated system of sales tax refunds; establishing an electronic monitoring system to assess accurate volumes of
industrial production; and developing an anti-smuggling strategy.
(iii) Broadening of the tax base: To bring more of the large percentage of unregistered taxpayers, both individuals and
businesses, into the tax net, the FBR has started using third-party information on financial activities, such as the
acquisition of real estate, purchase of motor vehicles, foreign travel expenses, etc. On the basis of this information,
the FBR has started issuing tax notices to these potential taxpayers to register and begin paying their tax dues. Over
the next two years, the FBR intends to issue at least 100,000 notices to such individuals and businesses. In addition,
the FBR has made it a mandatory requirement for all exporters and importers to register with FBR; government
departments have been instructed to purchase goods and services only from registered taxpayers; registered
taxpayers are discouraged to make any sale to unregistered taxpayers by levy of an additional 1 percent tax on those
sales. Similarly, any purchase of goods and services from unregistered individuals and firms is subjected to a 1
percent withholding tax, and supplies of electricity and gas to unregistered businesses are subject to a 5 percent
surcharge.
(iv) Management improvement and behavioral change: To strengthen its internal controls to combat corruption within
the system, the FBR has devised a plan for integrity management and performance appraisal. For this purpose, an
Integrity Management Unit will be established which will provide input on integrity-related matters, process
corruption-related complaints, prepare profiles of officers, and coordinate with other anti-corruption agencies.
Pakistan Development Update 2014
24
Non-
Filers
8%
Zero-
Filers
38%
Positive-
Filers
54%
Figure B2.1: Non-filers, Positive filers, and
Zero-filers
41
270
153 177
892
244
0
200
400
600
800
1000
Bal
och
ista
n A
ssem
bly
Khy
ber
Pak
htu
nkh
wa
Ass
embl
Nat
ional
Ass
embly
Pun
jab A
ssem
bly
Sen
ate
Sin
dh
Ass
emblyR
s T
ho
usa
nd
per P
arli
am
en
taria
n Figure B2.2: Average Tax Paid by Assemblies
Box 2: The Tax Directory of Parliamentarians
For the first time in the country’s history, the federal tax authorities in Pakistan have published a tax directory providing
tax details of amounts paid by each member of the national senate and national and provincial assemblies, beginning in
tax year 2013. Pakistan tax collection is adversely impacted by a culture of weak tax compliance, tax avoidance, and tax
evasion. One reason for this non-supportive tax culture is the perception within the public that the country’s tax system
supports and abets the affluent and powerful segments of the population in not paying their due share in taxes, and that
therefore a disproportionately higher burden is imposed on people who are already in the tax net. The tax directory is an
attempt to enhance the transparency of the tax system and dispel the impression that parliamentarians do not carry out
their tax obligations.
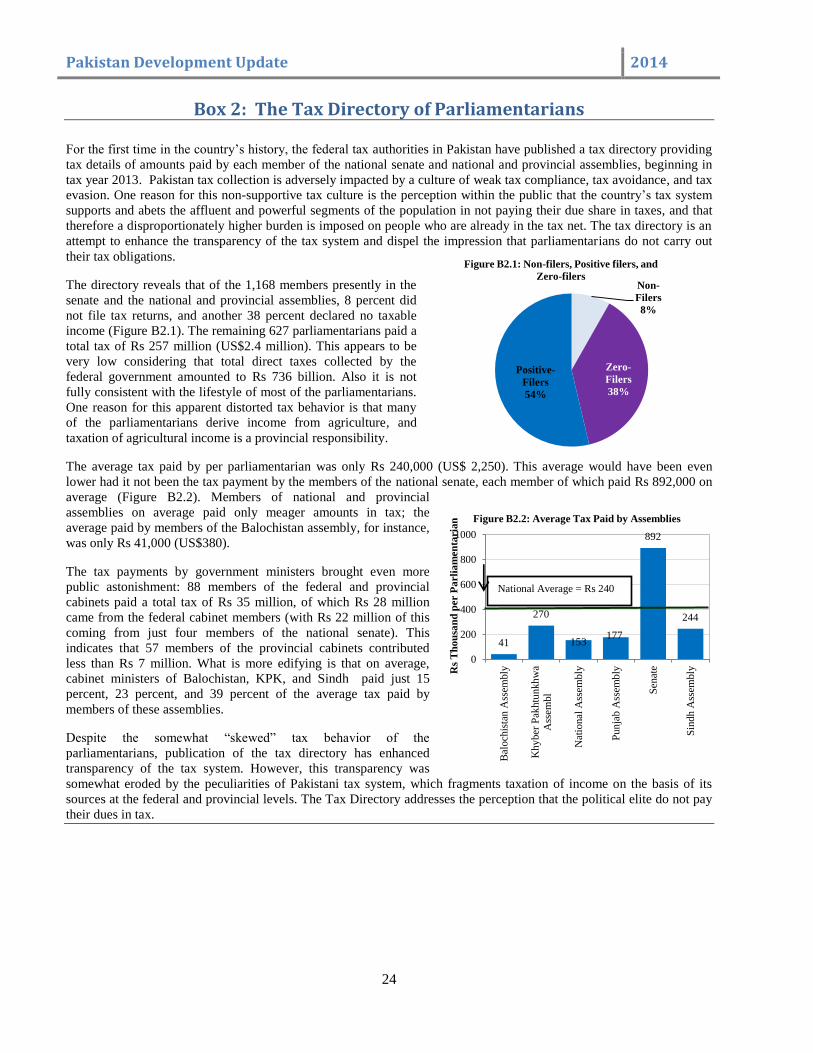
The directory reveals that of the 1,168 members presently in the
senate and the national and provincial assemblies, 8 percent did
not file tax returns, and another 38 percent declared no taxable
income (Figure B2.1). The remaining 627 parliamentarians paid a
total tax of Rs 257 million (US$2.4 million). This appears to be
very low considering that total direct taxes collected by the
federal government amounted to Rs 736 billion. Also it is not
fully consistent with the lifestyle of most of the parliamentarians.
One reason for this apparent distorted tax behavior is that many
of the parliamentarians derive income from agriculture, and
taxation of agricultural income is a provincial responsibility.
The average tax paid by per parliamentarian was only Rs 240,000 (US$ 2,250). This average would have been even
lower had it not been the tax payment by the members of the national senate, each member of which paid Rs 892,000 on
average (Figure B2.2). Members of national and provincial
assemblies on average paid only meager amounts in tax; the
average paid by members of the Balochistan assembly, for instance,
was only Rs 41,000 (US$380).
The tax payments by government ministers brought even more
public astonishment: 88 members of the federal and provincial
cabinets paid a total tax of Rs 35 million, of which Rs 28 million
came from the federal cabinet members (with Rs 22 million of this
coming from just four members of the national senate). This
indicates that 57 members of the provincial cabinets contributed
less than Rs 7 million. What is more edifying is that on average,
cabinet ministers of Balochistan, KPK, and Sindh paid just 15
percent, 23 percent, and 39 percent of the average tax paid by
members of these assemblies.
Despite the somewhat “skewed” tax behavior of the
parliamentarians, publication of the tax directory has enhanced
transparency of the tax system. However, this transparency was
somewhat eroded by the peculiarities of Pakistani tax system, which fragments taxation of income on the basis of its
sources at the federal and provincial levels. The Tax Directory addresses the perception that the political elite do not pay
their dues in tax.
National Average = Rs 240

Pakistan Development Update 2014
25
Box 3: Reform of State-Owned Enterprises (SOEs)
State-owned enterprises (SOEs) are a sizable element in Pakistan’s economic landscape. More than 150 of them operate
in a wide range of economic sectors, including infrastructure (power, transport, and logistics), energy (oil and gas,
mining), financial services (banks, insurance), and manufacturing. SOEs contribute around 10 percent to GDP while
representing about one-third of stock market capitalization.
Many SOEs are marred by weak corporate governance, cost-ineffective service delivery, poor service provision and
considerable financial losses. Figure B3 illustrates the fiscal burden of SOEs in the form of contingent liabilities through
guarantees and direct outlays through subsidies. In FY12, Rs 512 billion (2.5 percent of GDP) was spent on subsidies, of
which Rs 464 billion (2.2 percent of GDP) went to the power sector. Apart from direct subsidies, guarantees outstanding
to SOEs amounted to another Rs 517 billion (2.5 percent of GDP).
Figure B3: Guarantees Outstanding and Subsidies Issued to SOEs
While reforming and privatizing SOEs has been on the agenda of a succession of political establishments over the last
two decades, the lack of professional and transparent board appointments, inadequate performance monitoring, and
limited accountability frameworks have repeatedly hindered the government’s ability to introduce sustainable reforms
within SOEs. Key policy issues include: (i) the absence of a legal and regulatory framework for state-owned enterprises;
(ii) a lack of clearly defined roles for government as owner, policy maker, coordinator, subsidy deliverer, and regulator;
and (iii) weak corporate governance standards, particularly with respect to board nominations, appointment of CEOs, and
performance measurement.
SOE reform was a key agenda in the manifesto of the PML (N), the leading political party in the country. After getting
elected, the Prime Minister publically reaffirmed his party’s commitment to privatization. The key objective of
privatization is to improve Pakistan’s fiscal position by reducing subsidies and eliminating direct and contingent fiscal
losses to the government, caused by the ill-managed SOEs. In line with this commitment, the Cabinet Committee on
Privatization (CCOP), on October 3, 2013, approved a priority list of 31 SOEs – out of the Council of Common Interest
(CCI)’s approved list of 65 SOEs – to be taken up for privatization. Besides Pakistan International Airlines (PIA), the list
includes power generation and distribution companies, energy (exploration and distribution) companies, banks, etc. The
preamble to the list states that the restructuring in preparation for privatization of PIA, Pakistan Steel Mills, and Pakistan
Railways will proceed under the supervision of the Cabinet Committee on Restructuring (CCOR). As for other SOEs,
especially the blue chip companies, the government plans for block sales, secondary public offerings for institutional
investors and the general public, or international listings.
In line with the commitment of the current government, the Securities and Exchange Commission of Pakistan has also
organized a number of workshops and conferences on corporate governance in SOEs. These workshops have focused on
training managers of local SOEs on international best practices. The government has also initiated the process for
reconstituting the boards of selective SOEs
559 516
609
396
512
367
0
100
200
300
400
500
600
700
FY 2011 FY2012 FY2013
Figure B3.1: Guarantees and
Subsidies FY 2011-13 (Rs Billion)
Guarantees Outstanding Subsidies Issued
264.0
843.0
6.1 6.0 5.9
Figure B3.2: Subsidies Issued FY
2013 (RsMillion)
Wapda/Pepco KESC PASSCO
USC Others

Pakistan Development Update 2014
26
Annex 1: World Bank Support to Pakistan
Table A1: FY2014 Pipeline (updated February 25, 2014)
Project Name
Total
Commitment
(US$ m) Status of Preparation
Federal
1 Dasu Hydropower Stage 1 Project 700 Going to the Board on May 29,2014
2 Power Sector Reform DPC 500 Going to the Board on May 1, 2014
3 PK Growth, Investment &
Competitiveness DPC
500 Going to the Board on May 1, 2014
4 CASA 1000 40 Going to the Board on March 27, 2014
Federal Total 1740
Punjab
5 Punjab Public Management Reform
Project
50 Signed and Effective
Punjab Total 50
IDA Total 1790
KP/FATA
/Baluchist
an
6 MDTF-KP Emergency Roads
Recovery Project
9.1 Signed and Effective
7 MDTF-KP Emergency Roads
Recovery Project
7.8 Going to the Board on March 31, 2014
KP/FATA Total (MTDF) 16.9
Total FY14 1,806.9
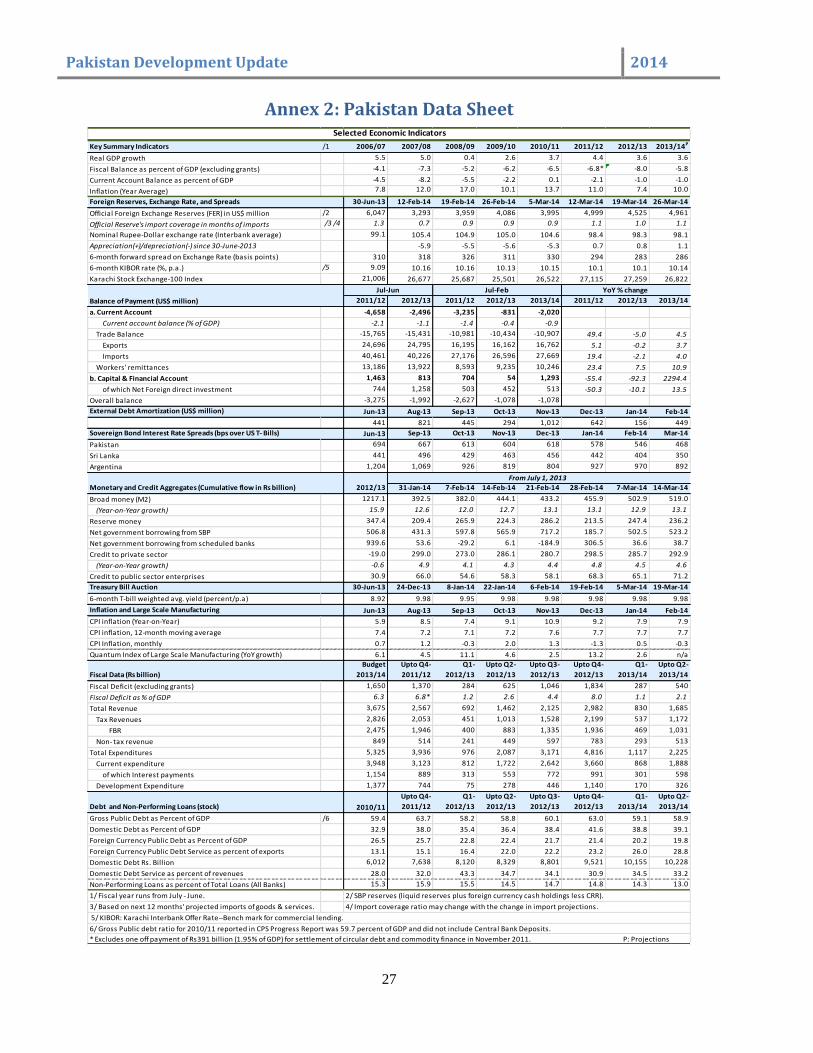
Pakistan Development Update 2014
27
Annex 2: Pakistan Data Sheet
Key Summary Indicators /1 2006/07 2007/08 2008/09 2009/10 2010/11 2011/12 2012/13 2013/14P
Real GDP growth 5.5 5.0 0.4 2.6 3.7 4.4 3.6 3.6
Fiscal Balance as percent of GDP (excluding grants) -4.1 -7.3 -5.2 -6.2 -6.5 -6.8* -8.0 -5.8
Current Account Balance as percent of GDP -4.5 -8.2 -5.5 -2.2 0.1 -2.1 -1.0 -1.0
Inflation (Year Average) 7.8 12.0 17.0 10.1 13.7 11.0 7.4 10.0
Foreign Reserves, Exchange Rate, and Spreads 30-Jun-13 12-Feb-14 19-Feb-14 26-Feb-14 5-Mar-14 12-Mar-14 19-Mar-14 26-Mar-14
Official Foreign Exchange Reserves (FER) in US$ million /2 6,047 3,293 3,959 4,086 3,995 4,999 4,525 4,961
Official Reserve's import coverage in months of imports /3 /4 1.3 0.7 0.9 0.9 0.9 1.1 1.0 1.1
Nominal Rupee-Dollar exchange rate (Interbank average) 99.1 105.4 104.9 105.0 104.6 98.4 98.3 98.1
Appreciation(+)/depreciation(-) since 30-June-2013 -5.9 -5.5 -5.6 -5.3 0.7 0.8 1.1
6-month forward spread on Exchange Rate (basis points) 310 318 326 311 330 294 283 286
6-month KIBOR rate (%, p.a.) /5 9.09 10.16 10.16 10.13 10.15 10.1 10.1 10.14
Karachi Stock Exchange-100 Index 21,006 26,677 25,687 25,501 26,522 27,115 27,259 26,822
2011/12 2012/13 2011/12 2012/13 2013/14 2011/12 2012/13 2013/14
a. Current Account -4,658 -2,496 -3,235 -831 -2,020
Current account balance (% of GDP) -2.1 -1.1 -1.4 -0.4 -0.9
Trade Balance -15,765 -15,431 -10,981 -10,434 -10,907 49.4 -5.0 4.5
Exports 24,696 24,795 16,195 16,162 16,762 5.1 -0.2 3.7
Imports 40,461 40,226 27,176 26,596 27,669 19.4 -2.1 4.0
Workers' remittances 13,186 13,922 8,593 9,235 10,246 23.4 7.5 10.9
b. Capital & Financial Account 1,463 813 704 54 1,293 -55.4 -92.3 2294.4
of which Net Foreign direct investment 744 1,258 503 452 513 -50.3 -10.1 13.5
Overall balance -3,275 -1,992 -2,627 -1,078 -1,078
External Debt Amortization (US$ million) Jun-13 Aug-13 Sep-13 Oct-13 Nov-13 Dec-13 Jan-14 Feb-14
441 821 445 294 1,012 642 156 449
Sovereign Bond Interest Rate Spreads (bps over US T- Bills) Jun-13 Sep-13 Oct-13 Nov-13 Dec-13 Jan-14 Feb-14 Mar-14
Pakistan 694 667 613 604 618 578 546 468
Sri Lanka 441 496 429 463 456 442 404 350
Argentina 1,204 1,069 926 819 804 927 970 892
Monetary and Credit Aggregates (Cumulative flow in Rs billion) 2012/13 31-Jan-14 7-Feb-14 14-Feb-14 21-Feb-14 28-Feb-14 7-Mar-14 14-Mar-14
Broad money (M2) 1217.1 392.5 382.0 444.1 433.2 455.9 502.9 519.0
(Year-on-Year growth) 15.9 12.6 12.0 12.7 13.1 13.1 12.9 13.1
Reserve money 347.4 209.4 265.9 224.3 286.2 213.5 247.4 236.2
Net government borrowing from SBP 506.8 431.3 597.8 565.9 717.2 185.7 502.5 523.2
Net government borrowing from scheduled banks 939.6 53.6 -29.2 6.1 -184.9 306.5 36.6 38.7
Credit to private sector -19.0 299.0 273.0 286.1 280.7 298.5 285.7 292.9
(Year-on-Year growth) -0.6 4.9 4.1 4.3 4.4 4.8 4.5 4.6
Credit to public sector enterprises 30.9 66.0 54.6 58.3 58.1 68.3 65.1 71.2
Treasury Bill Auction 30-Jun-13 24-Dec-13 8-Jan-14 22-Jan-14 6-Feb-14 19-Feb-14 5-Mar-14 19-Mar-14
6-month T-bill weighted avg. yield (percent/p.a) 8.92 9.98 9.95 9.98 9.98 9.98 9.98 9.98
Inflation and Large Scale Manufacturing Jun-13 Aug-13 Sep-13 Oct-13 Nov-13 Dec-13 Jan-14 Feb-14
CPI inflation (Year-on-Year) 5.9 8.5 7.4 9.1 10.9 9.2 7.9 7.9
CPI inflation, 12-month moving average 7.4 7.2 7.1 7.2 7.6 7.7 7.7 7.7
CPI Inflation, monthly 0.7 1.2 -0.3 2.0 1.3 -1.3 0.5 -0.3
Quantum Index of Large Scale Manufacturing (YoY growth) 6.1 4.5 11.1 4.6 2.5 13.2 2.6 n/a
Fiscal Data (Rs billion)
Budget
2013/14
Upto Q4-
2011/12
Q1-
2012/13
Upto Q2-
2012/13
Upto Q3-
2012/13
Upto Q4-
2012/13
Q1-
2013/14
Upto Q2-
2013/14
Fiscal Deficit (excluding grants) 1,650 1,370 284 625 1,046 1,834 287 540
Fiscal Deficit as % of GDP 6.3 6.8* 1.2 2.6 4.4 8.0 1.1 2.1
Total Revenue 3,675 2,567 692 1,462 2,125 2,982 830 1,685
Tax Revenues 2,826 2,053 451 1,013 1,528 2,199 537 1,172
FBR 2,475 1,946 400 883 1,335 1,936 469 1,031
Non- tax revenue 849 514 241 449 597 783 293 513
Total Expenditures 5,325 3,936 976 2,087 3,171 4,816 1,117 2,225
Current expenditure 3,948 3,123 812 1,722 2,642 3,660 868 1,888
of which Interest payments 1,154 889 313 553 772 991 301 598
Development Expenditure 1,377 744 75 278 446 1,140 170 326
Debt and Non-Performing Loans (stock) 2010/11
Upto Q4-
2011/12
Q1-
2012/13
Upto Q2-
2012/13
Upto Q3-
2012/13
Upto Q4-
2012/13
Q1-
2013/14
Upto Q2-
2013/14
Gross Public Debt as Percent of GDP /6 59.4 63.7 58.2 58.8 60.1 63.0 59.1 58.9
Domestic Debt as Percent of GDP 32.9 38.0 35.4 36.4 38.4 41.6 38.8 39.1
Foreign Currency Public Debt as Percent of GDP 26.5 25.7 22.8 22.4 21.7 21.4 20.2 19.8
Foreign Currency Public Debt Service as percent of exports 13.1 15.1 16.4 22.0 22.2 23.2 26.0 28.8
Domestic Debt Rs. Billion 6,012 7,638 8,120 8,329 8,801 9,521 10,155 10,228
Domestic Debt Service as percent of revenues 28.0 32.0 43.3 34.7 34.1 30.9 34.5 33.2
Non-Performing Loans as percent of Total Loans (All Banks) 15.3 15.9 15.5 14.5 14.7 14.8 14.3 13.0
1/ Fiscal year runs from July - June.
3/ Based on next 12 months' projected imports of goods & services.
6/ Gross Public debt ratio for 2010/11 reported in CPS Progress Report was 59.7 percent of GDP and did not include Central Bank Deposits.
* Excludes one off payment of Rs391 billion (1.95% of GDP) for settlement of circular debt and commodity finance in November 2011. P: Projections
5/ KIBOR: Karachi Interbank Offer Rate--Bench mark for commercial lending.
Selected Economic Indicators
Balance of Payment (US$ million)
4/ Import coverage ratio may change with the change in import projections.
2/ SBP reserves (liquid reserves plus foreign currency cash holdings less CRR).
YoY % change Jul-FebJul-Jun
From July 1, 2013