public disclosure authorized no. €.-2...
TRANSCRIPT

RV~T NO. €.-2 '3
INTERNATIONAL BAKK FOR RECONSTRUCTION AND DEVELOPi.lI~NT
APPENDIX II TO THE PHESIDE!{T' S REPORT
OB THE BELGIAN IDAN AP~LICjI.TIOl'J
• REPORT ON T~rr~ BELGILN EC ONOMY
•
Economic Department
Prepared by: A. Stevenson ltebruary 1, 1949
Pub
lic D
iscl
osur
e A
utho
rized
Pub
lic D
iscl
osur
e A
utho
rized
Pub
lic D
iscl
osur
e A
utho
rized
Pub
lic D
iscl
osur
e A
utho
rized

•
•
,Area:
Population:
Far value:
BELGIUM
Selected Statistics
11,775 square miles (30,497 sq.' km.)
8;S12j195 persons (1947 census)
BF 1 :; $0.-0228167
National income in 19L.8 (current prices): BF 2ho-250 billion - U~5.5-5:7 billion)--":j6lt6-670 per head

•
•
MAP OF BELGIUM
o I
rIIlJ OVER /500'
MILES 50
«
D BELOW /500'
100 I
(;('5(1 COAL F If L 0 ~REGIONS
• . AM ~Q
UTRECHT(~ • ARNHEM
eDELFT

TABLe; OF CONTENTS
Summary and Conclusions
III Belgium's Recovery .l~fter the Har 1 • (a) Circumstances Aiding Recovery 1
(b) Government Policy 2
(c) Aspects of Economic Recovery 4
II. Problerls of Headj'ustment 11
(a.) Foreign Tra.de and Balance of Payments 11
(b) :Prices, Costs and Capital :):i'or!'!la tion 20
Statistical Appendix
"

SUi~jI11JffiY AND CONCLUSIONS --...........-..-...,..~.........--.. -----...............
1. Because of a combj.nat.ion of fortune.te circ1.lr.1stances and Govern-
ment policy, the pace of economic recovery in Belgium since the war h-:s :1:o€en e~:.
tremely rapid. In November 1948 the index of industrial production stood at
124. (1936 through 1938 average = 100). The rate of recovery has, hmlJever,
been uneven. It has been most striking in steel prC'duction, netal G8nn-
factures and the generation of electric power, least satisfactory in various
consumers' goods industries such as the production of textiles, glass and • leather goods, where the level of activity has recently .fallsn substantially
and unemployment has become serious. heconstruction has been slowoer in
agriculture than in industry but is on the whole satisfactory.
2. The surplus money, which resulted from the inflation of the first
postwar years, has now been ma'~ched by price rises so that the money supply
has remained at about the same level for over a yeo.r. This has been achieved
by a proGressive reduction of the deficit on the general budget (down to
BF 4.8 billion in the 1949 estimates), and by the tight credit : ;:,licy of the
Central Bank. Partly as a consequence of the liberal economic policy of the • Government, how'ever, the general prioe level standf- at the relatively high
level of aC/.)ut four tines the prewar figure.
3. Progress has also teen made toward the achievement of the Benelux
Economic Union but substantial differences still exist between the economic
posi ti011S and policies of the two major ~Jartners, Belgium and the Nether-
lanuo. A strenuous effort will be required if economic union is to be at-
tained, as scheduled, by January 1, 1950.
4. Although the postwa.r increase and recent steadiness of its gold
holdings are indicative of the comparat~ve strength of Belgium's external
•
•
ii
financial position, the balance of payments shows ceJ'.'tain vfeaknesses. To a
large extent :Belgium has been covering its deficit with the ~{estern Herilis
phere with gold and dollars obtained from other countries, notably in :~H.l'Ore,
and maintaining its exports by granting substantial net crl.3di-ts on paYl:lent
agreement accounts.
It has become increasingly clear that equilibrium in intra-E~ .... ropean
trade cannot be restored quickly, that other countries cannot contim.l6 to
finance Belgium's dollar deficit by payments from dwindling monetary reserves)
and that Belgium is not in a position to grant large additional net credits
vd.thout ri.lnning the risk of further inflation. To cope with these p~oblems~
the OEEC Intra-European Payments Plan has been developedl linking dollar
allocations with provisions for financing intra-European trade. If this
system functions as is hoped and is continued in some suitable form for the
remainder of the ERP period, it should prove a considerable aid to Belgium
in the attairuaent of equilibrium in the Belgian balance of payments with
other participating countries •
S'Q,ch an equilibrium does not necessarily mean that Belgian receipts
from and payment3 to Europe will balance exactly. EVen alloY:ing for in
crea.sed exports to and pe'rhaps reduced imports from the Western Hemisphr3re,
Bel~ium will in the long-run probably still have a deficit with the Western
Hemisphere a.nd some - though reduced - surplus lJ'rith ~urope. Thus j.ts abilit:r
to meet its dollar payments wj.ll again depend on its ability to earn dolla.rs
through surpluses with other areas incl\lding Europe. 'rhis is the major risk
involved in a dollar loan to Belgium,
It is a l?isk which is, of course, cemm -. to many other European coun-
tries and, furthermore, the long-run outlook for the Belgian balance of

••
•
iii.
payments is brighter than for most in sev.eral respects. Al though its net in
come from transit trade is not likely to recover fully to the prev.rar level,
Belgium has not, like the United Kingdom or The Netherlands, been forced to
liquidate a large portion of its foreign investments. Neither has it ac
cumulated large foreit;"t1 debts like the United Kingdom, '1'he Netherlands or
France. In particular its U.S. and C&.nadian dollar payments on account of
interest and amortization are not very heavy. Assuming that LOA loans con
t.inue, though on a reduced scale, it is estimated that these payments will
average less than ~p20 million in the 10 year s following the end of T~RP com
pared, fo:;. example, with well over $40 ;nillion for The l'Jetherlands. Belgi'..lm
V\rill, like other European countries, suffer from the partial loss of Ge~many
both as a market and a supplier, but it will not be so severely affected as
The Netherlands. Finally, its position in the Congo is secure, unlike that
of the Dutch in the Indies. Thus the structural adjustments required in the
Belgian balance of payments are smaller than i!l the case of many countries in
\vestern Europe while Belgi1lJ'U is in a relatively strong position to make them •
5. Thoubh Belgium's foreign trade problem is not all of its own
naking, it can contrtbute to the solution of it by lowering costs and pric-3s
and thus improving 'its competitive position against the approaching daY:'Jhen
the vrorldwide shortage of goods comes to an end. For the present, the most
promising r.1ethod of reducing costs is by modernizing equipment, in other
words, by increased investment. The information available does not permitl a
defini te conclusion on the problem of v\rhether and to what extent the Belgian
economy has suffered from under-investment since the war. Statistic~l data
indicate that actual investment in 19h7 fell beloy! a level v.rhich the 1J.3lgian
Government nonsidered sati$factory by about BF 8 billion, the greatest ;,:' .:,1 ;.

•
, •
iv
discrepancy being in the coal, steel, tar distillation and electric pO'wer in
dustries, and in agriculture, housing and public works.
The domestic capital market is unable to meet the demand for funds
on the scale required to fill a gap of this magnitude, The Belgian Treasury
is still chronically short of cash, and since the overall budget for 19;-~9
provides for a deficit of almost BF 5 billion, savings of the state cannot
be expected to contribute. On the other hand, some of the projects included
in the Belgian investment program might be omitted, but on balance it would
appear probable - on the basis of the lirni ted information available - that
with sOtle further calls on foreign capita.l and perhaps a further limited
amount of deficit financing a fairly satisfactory rate of capi'tal formation
can be achieved.

•
I. BELGIU}JI'S RECOVERY AFTER TI::C :.;JtR
Because of a combination of fortunate circmnstanC8s ~1d govern-
ment policy, the pace of economic recovery in Belgium since the war vrcs o:~-
tremely rapid.
(a) Circumstances Aiding Recovery
Belgian material war losses, officially estimated at about ::3? 150
billion in terms of 1939 prices, were light compared, for eX81nple , with
those of the Netherlands. Besides, more than half was composed of clearing
balances with other enemy ... held areas, occupation costs, requisitioning of
stocks and similar charges. The:re had also been damage to persons and IT op-
erty, but 1i ttle dislocation had ocourred in the labor force, "the tran.s
portation systend/ or the tools of prodl.lction. The ta.sk of reconverting
Belgium's industrial machine to peacetime production was therefcre co41-
paratively easy.
Equally' i.mportant to the country's economic recovery vvas its
strong gold and foreign exchange position. BelgiUITl's gold stock was re-
st.ored vrithout loss after the war. Substantial interest and dividend re-
ceipts had been built up during the war from inveqtments abroad and in the
Congo and, in addition, the latter possessed reserves of foreign currency
acr'!"LUllulated from its profitable wartime trade. Furthermore, the early
J .. iberatiol1 of the country, rrith the important seaport of Antwerp in ltforking
order, made Belgirun a vital supply base :f.c~' the allied armies during the
closing months of the war, and, as a result, the country built up a Mutua.L
Aid credit equivalent to over ~:i340 million in supplying goods, services
. j
It may be noted that conqiderable reconstruction work on the trans-portation system was "....ndertaken by the Alli~d Armies.
•
•
- 2 -
and pay for allied troops. The cOD'iparative strength of the franc also 811-
co~raged the inflow of funds from abroad.
The high degree of social stability in postwar Del~ium and of po-
litical stability in the past year have also aided economic revival. Both
in voting strength and influence the Communist Party is rather su:8.11. Al
though differences - notably concerning th~ royal question and the granti·-6
of subsidies to Catholic schools ..,.. exist between the Christian Social P&rty
and the Socialist Party, the coali tiol! which has governed Belgium since :March
1947, these have not been sufficiently serious to threaten stable Government
and thus hinder agricultural or industrial production. Harmonious industrial
relations have also played an important part~ Strikes have occurred (for
example $ in the metal industry in June 1948), but on the whole the machinery
for reconciling differences arising between labor and management has up till
now proved effective ~n reducing labor unrest. The Governm~nt f s policy of
increasing the coverage of social security legislation and of :.;ranting cash
subsidies to t'ecQnomically weak" member$ qf the corlll1unity has also contrib
uted to the achievement of a high degree of social pea.ce.
(b) Government Pol;icl
Th1s favorable situation has made it much easier for the Belgian
Government to carry through the liberal economic policies which were adopted.
These polici~s were directed to restoring the standard of consu,mption as
rapidly as 'possible on the theory that maximum production could be achieved
by relying on the incentive of the individual to produce and ensuring that
money incomes could be converted into real goods. vrith the pr;imary emphasis
on satisfying the demand for consumers' goods, pub~ic works e:x.pendi tures

•
,
•
- 3 -
were reduced to a minimum and a stringent credit policy pu:-:sued.
This high level of consumption was not satisfied by domest.ic r)rQ
duction alone. The Government follow'ed a bold policy of encoura~~iDr; irrJ.po:'ts
and a large volume of consumers' goods as vlell as of foodstuffs and inC:LLS
trial raw materials, was permitted to enter the country,.
Moneta~J stability was a necessary precondition for the success of
such a policy, however, and the war had left a Ie 0B.CY of snrplus T'lOney in
Belgium, for the mone:y· supply had expanded to over three tir:es the prewar
level while the volume of goods available was considerably smaller. Besides
keeping a '~ight control over credit it VTaS necessar.f to deal with the conse
quences of tte wartime inflationar.y process. In September 1944, two-thirds
of the currency in circulation and bank d~posits were withdra1vn or blocked~
Of the deposits blocked, 60% Here frozen indefinitely and converted into a
forced longterm loan, the other ho% being blocked temporarily and gradually
unfrozen". In order to amortize this ,forced loan, a single 5;'6 tax was ir:l
posed on capital values and special taxes were levied 011 wartime profits •
Subsequently, control of monetar.y eApansion was exercised by the tracitional
means of raising the discount rate (from l};s in 191+5 to 3~~',~ in .tI.Uuust. 1947),
by requiring banks to hold from 50 to 65/~ of their assets in t·he forn of
Treasury obligations, and by trying, thouGh not always succcssful:'y, to re
duce Government expenditures in order to m~Lnir;1ize the need for irJ.'l·'1.tionary
financing. To combat undue price rises, wages were frozen, sonel')rice con
trols and subsidies instituted - though these wel"'e alv~ays considered as a
short-run measure - and imports of consumers' goods deliberately encouraged"

•
•
- 4 -
(c) !spects of Economic RecoverJ
The considerable measure of success achieved in Belgian recoYl-
struction is evident .from available indices of industrial procluctiOlto
the middle of 1946 the general index of industrial output,.!.! although ctill
well below the level reached in the boom year 1937, had practically recovr.~red
to the level of the base period (1936-38 average), anc~ by the end 0':: 1;:L7
it was almost la% higher. Although the rate of e:X:0ansion bas slcnred in 1948,
the index of industridl production has, on the whole, continued to devolop
satisfactorily, the November figure of 124" 0 (provisional) comparing favora.bl~
with the level of 113.0 which was reached in the corresponding mont~ of the
previous yearo
Progress has, howeve:t', been uneven, and in some sectors output has
actually decreased. The recovery has been especial1:'l :rr.arked in the heavy
industries and in the ge~1eration of electrical power. In Hovembf;::;' the pro-
visional indices of steel production, metal manufactures and. electric power
production stood at 135.9, 143.6 and 162.8 (1936-38 averages = 100) and were
all well above the levels achieved in the corresponding D.onth of 1947.31
Coal production j s still I1andicapped by an inaclequCite labor force and low
productivity but the provisional figure for Novembc.;r was 2,338,000 metric
tons or almost 97% of the 1936-38 average cOl:1pared -:-,'ith 1,.710,000 tons in
November 1947. Construction has 8.1so la~l;ed SO ... 16 .hat, as ui)YG be e .. ~;)8cteu
--------------------------------------The index used is that pub1ishec: b~- ~l.~;ence ~cono:r!1i-(lue et i'~l1cL-"cit)re, which gives a significantly higher f'i:~ure tha:a t.hat of the index published by the Institute of ~cc~1omic and Social Researcl1 of the 1Jniversity of Louvain Q
In the metal-work:i,.ng industry-, hou6ver, nev'T orders shovre(~ ~~iJns of declining,

'.
•
- 5 -
in view of the shortage of skilled workers and of Belgium I s overall Gc')u.olJic
policy of encouraging consumption rather than investment. The weakest spot
is in the textile industry Yfhere the cOlabination of a sat uTLted dO:n.8Ctic ,
market and export difficulties has caused considerable contraction in Tec8rlt
months. In Hovember 1948 the index of textile production (natural fibers)
stood at 90.9% of the 1936-.38 average or about 257~ J.o"V~-er the.n the C')l'Te:=:-
ponding month in 1947.
As i.n most other countries, l·~~construction in agriculture l~as been
slower than in :Lndustry. In the food J8ar 1)46/47, it received a shClr'!) set-
back from the severe vrinter and the subsequent sUT,nncr drout;Lt. ~Iol'V8vGr, the
p:n:Gt1iret.;~ in 1947/48 is - much brighter. Su!;ar beet and lifheat harvests ap-
pear to be close to prewar levels 0 The wartime trl: ~r1 tovrard the production
of food crops and away from i'oduer crops is now being reversed and the nro-
duction of meat, for example, is increasing. Furthel'" progress is de)endent,
to a significant degree, on the supply of imported foodstufis. The diet of
the population in the year 1947/48, however, still appears to have been some-
what belovr the prevvar level in terms of calory '" protein and fat contcnt~
COl'robo'rative evic!ence of the countrJ's economic revival is fllrllishec
by statistics of railroad and shipping activity" but here too SumE} recent
signs of w·eakness are visible. Freight traffic on the state railroads has
reached prewar levels. The recovery has been SlOYTer on inland waten'J'ays
1fhere the volume of traffic in June 1948 \'Tas still abo-ut. 20~h below tl:at of
prewar, mainly because of the lmr level of ilJ.ternational traffic. TLe ab-
normal situation in Antvrerp, which profited froIn tb.e grc;ater destruction
at Rotterdam but was hindered by the low level of economic activity in Ger-
many and the Anglo-American policy of routing traffic through IIamburg and
I

•
•
- 6 -
Bremen, is now passing" However, Belgiurn~5 grovtfing trade difficulties have
brought new prob~ems. In the course of 1948, the volume of merche,ndise un
loaded from ocean-going vessels has dropped steadily while that of ];.c:cc: ;:'1.1 ....
dise loaded has shown a slightly rising trend. In October the total volume
of merchandise hancUed from ocean-going vessels 'was down from the postnar
peak to around three-quarters of the prewar level, and about hO-50% of t:'.8
city's dock "workers are now idle. The recent agreement with the Bizone au
thorities to route an increased volume of traffic through the ports of the
Low Countries should, hOTfever, allevi2.te this situation at, least in part.
The high rate of production and. iraportc:.tiol1 has 1'il180. the SllOPS
with goods. At least through the summer of 1948 t1:~e volUl.16 of retail sales
appears to have been approximately at prewar levels l:hen allo-rrance is made
for the intervening rise in prices.
The general price level, however, is ver-y high, and this rerr!ains
one of the most difficult problems with which the Belgian Government has to
deal. Although, as has been indicated above, the monetary purge dealt with
the accumulated wartirr.e inflation, the cost of maintaininG allied troops set
up a further inflationary process l?sting through 1945. Subsequently, the
trend of wor1-d prices al1ct the Del,'~ian policy of dropping price subsidies and
rationing as quickly as possible and allowing prices to find their own level
resul ted in a further i)rice rise. Since the spring of 1948, hovv8ver, both
vrholesale and retail price indices have remained fairly stable at around
four times the prevrar level. Rationing is nOH eliminaJued. :/ith tlw en(,.1. of
sugar rationing on January 1, 191+9, all rationing at tho retail level carne
to an end.
The Belgian labor force has increased frOEl 3,750,000 in 1;]6 to
•
•
- 7 -
over 4,000,000 today_ There is still a shortage of skilled workers in the
construction industry, and above all in the coal mines, where only the em-
ployment of forei.gn workers first prisoners of war and later Italians an(
displaced persons - avoided a serious si tua tion. As has alreaoy teen ir:.di-
ca ted, however, non-seasonal unemploYTllent has increased rather sL.arply in
recent months, especially in the textile, ~;lass, leather an(~ other non-
durable consumers t goods industries and amonG the Antwerp dOC].i:ers. Seasonal
unemployment is also growing rapidly, for example,in the construction in-
dustry. In the last weelc of 1948, the number of totally unemployed (185,000)
was three times as great as it 1j;as a year ago and the number of those vlhol1y
and partially unemployed re ached 317, 000 or 14;& of the insured population
and about 8% of the total labor force. Seasonal unemployment may increase
further in the coming months. The above total is also temporarily inflated
as a result of the recent dispute between the Belgian and French authorities ..
in view of France t s slH)rtage of Belgian francs - over the transfer to Bel-
gium of earnings of Belgian frontier vvorkers in France. A compromise settle-
ment has since been reached. For various reasons, notably differences of
the skj.lls required and the nature of the work -many of the unemployed. tex-
tile workers, for example, are v[ornen - and also because of cifficul ties of
housing a.nd language J it is unl~kely that many of the unemployecl can be ab
sorbed into the industries where labor shortages are prevalent.~ The
gra'yit:r of the problem vras recognized in the Prime i:,1inister r s policy state-
ment of November 30 and in the subsequent announcement that a suppl.ementary
It is in.teresting to note that whereas Belgium intends to import 7,000 workers for the mining, metal and construction iEd.ustries by the end of 1948, negotiations have been reported to be going on between the Bri ti.sh and Belgian Governments aiming at an agreement allowing BelGian textile workers to take up employment in the United Y~ngdom.

•
•
- 8 -
budget will be introduced to alleviate the situation.
Money waees have risen substantially thou~h apparently rather 1.ess
than retail prices.. However, various benefit::;, such as family alJ.ow8 ~·.ces ,
are now received by certain groups of \yorker~. Unfortunately the publi~)hed
index of money wages is not satisfactory and no index of the ~ost of livinG
is available so that it is difficult to reach a definite conclusion on the
level of real wages. In the opinion of COl'ilpetent obsorvers, it is ~;om.el'fhat
below prewar •
Price increases appear to have completely absorbed the inflation
generated :tn the first lJostwar years. The tight credit policy of the Na-
tional Bank and 'the improving budgetary position have ~revented new pressures
from arising. For well over a year now the total money supply has remained
practically stationary. In Septeluber 1948 it amounted to BF 158.5 billion
compared with 154.3 million in the corresponding month of the previous year.
'1'he progress towarQ-s equilibrium in the GovernmE;3l1t f:i,.nances is clearly ~hown
by the stefidy reduction of deficits on the general budget, i.e., the ordil'lary:
extraor.dinary and special war budgets taken together:
Deficit on the General Budg~
1945 1946 1941 1948 1949, est,
Billion Belgian Francs
35.8 37.1 32.0 13 • .5 4.8
The public debt rose considerably during the war and its structure
has recently been,cll.anged significantly as a result of the reform of the
National Bank and the new convention between the state and the Bank. Of
state debt of BF 51 b~lliOl1 to the National Bank, BF 35 billion were

•
•
- 9 -
consolidated, the proceeds of the revaluation of the gold stock vrere usod
to reduce the Government debt to the Bapk by BF 10.5 billion, and BF 4.5
bi.llion were cancelled because notes to that value were not presented ':cr
exchange in cormection with the monetary reform leaving a balance of over
BF l billion. IJainly as a result of these changes, the consolidated debt
rose from BF 108 billion at the end of August (including J3F 40 bill:i.on of
the monetary reform loan) to BF 143 billion at the end of September. Short
te:t,'11l debt on the contrary fell from BF 123 billion to 77 billion, ana the
tote.l public debt from BF 263 billion to 252 billion. 7bis fieure should
be compared to a national inC01(18 estimated at :OF 215 billion in 19Lr7 and
240 to 250 billion (fp5e5-5.7 billion) in 19h8. It may be !1otcd that the
relationship between total public debt and national income in Del:.:;i1..UU is
rather $imilar to that existing in the United States where total Govern-
ment debt at the end of December 1948 anounted to about f.~253 billion com
pared 1ii th a national income of ~;224 billion for the year ~ There has been
some rise in Belgian long-term E.~xternal debt this year to, reach BF 13 billion
at:tre end of September, but it is still equal to less than 5j& of the total
public de bt •
Despite its liberal import policy, Belgium1s external financial
position has remained strong. The 'BOld and foreign exchange holdings of
the National Bank amounted to the equivalent of ~~931 million at the end of
November 1948 and were almost exa.ctly at the level of September 1947 just
after the end of the period of sterlin[; convertibility. Gold holdin;Js,
Vfhich had dropped from $735 million at the end of 19L.6 to f ,578 ttillion in
February 1948, had risen ag.;lin by the end of NovemLer to (.:,634. I,lillion, or
almost the level o:f mid SU1TlJTl€r 1947.

•
•
.... 10 -
Belgian recovery has not only been accomplisL.eci Hithoat sulx:.t<'::':1tial
liquidation of its gold and dollar reserves, but also 'l.vithout ver;'T l~eav:l ad-
dition~ to its foreign debt burden. This compar~ti vely favorable sit·~cd.i()n
has been achieved by substantial oxports - some of them ;.lroducts i1!lported
from the Congo and exported in processed form - and recently by some reduc
tion in imports from the dollar area ;"}:/ by favorable terms of trade, 8.nd
also probably as a result of some influx of flight capital from other
European countries. Provisional figures place Belgi-am's trade deficit for
1948 at BF 13 ~l billion 'Vuith eA~orts covering 85% of imports. The trade
deficit i~ December, Y.fhen eArports covered about 92% of imports, was only
BF 604 million (provisional) compared with a montbly average of BF 1,094
million for the year. It may be noted that whereas the volume of imports
has recently been at about the 1937 :Level, that ot expoj,"ts probably nOT!
stands at over 80% of the 1937 figure" IJo official data, however, have
been released since the first quarter of the year,
Progress has also been made toward the achiF,lvement of the Denel1.1.x
Economic Union., On January 1, 1948, the customs union between the three
c0untries came into being. quantitative restrictions were maintaineo. for
the tine being, but full economic union is scheduled to be achieved by
Ja.nuary 1, 1950. Substantial differences still exist bet'V'reen the econol'fJic
positions and policies of the two major pal"tners, BeJ,.gium and the Nether-
lands, however, and a strenuous effort will be required if economic 'Wlion is
to be realized by that date.
I, I.
'rotal imports, hmvever, have not fallen. The high fiGures for November and December 1947 were caused by the anticipation of the inauguration of the some1J'rhat higher Benelux tariff at the beginning of 192-1-8.

•
•
- 11 -
IIo PROBLEMS OF READJUSTMENT
Yihile Belgium has reoovered from the effects of t.he 1v'"ar to an,;:~{:....
tent at least equal to that of any other country formerly occu)iec~ b~" an
enemy J there are two major problems which must be solved if tLis recovr::ry
is to continue~ 'rhe first of these is concerned with foreign trade and tIle
balance of payments, the second with the level of prices and the rate of
cap~tal formation.
(a) Forejgn Tra.de and Balance of Payments ~ (
The postwar increase and recent steadiness of J3elgian gold and
foreign exchange holdings is an indication of the compara.tive strength of
the country I s external financ~.al position. HOTvever 1 the balance of payments
for 1947 summarized below shows oertain weakness~s~
•
•
- 12 -
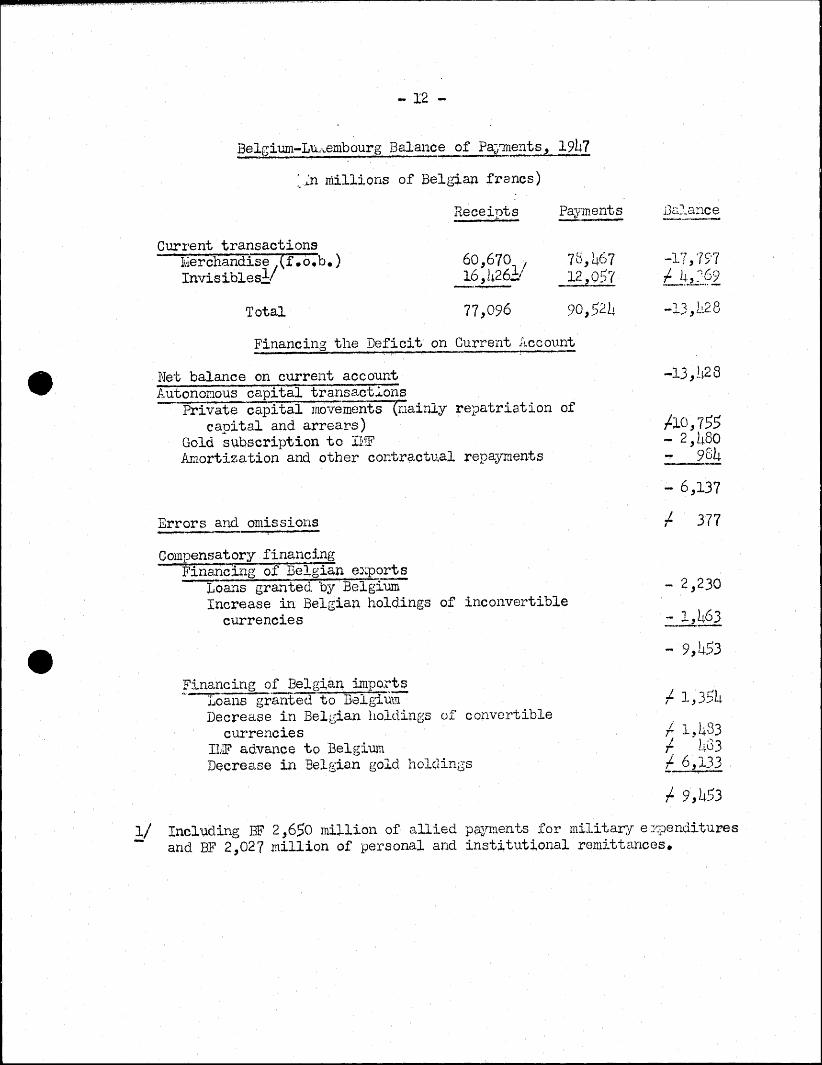
Belgiurn-Lu,.,,,embourg Balance. of P~ents, 1947
~~n millions of Belgian francs)
Receipts Payments
Current transactions lvierchandise j(t .0. b.) 60,670 I 78,467 Invisibles! 26,4261' 12,05'"(
Total 77,096 90 ,52!~
Financing the Deficit on Current Il.ccount
Net balance on current account Autonotlous capital transact':'ons - Priva.te"" capital movements (l:lainly repatriation of
capital and arrears) Gold subscription to IHF Amortiza tion and other cor:tr.;:t.ctual repayments
Errors and omissions i
Compensatory financing FinariCIi1g of Belgian export s ---roans granted by Belgium
Increase in Belgian holdings of inconvertible currencies
Financing of Belgiar+ impo,rts "-roans-granted to Belgium
Decrease in Belgian holdings of convertible currencies
IliJF advance to Belgium Dec·rease in Belgian gold holdings
jJD.1ance -----
-17,75'7 L4,~:.?2
l':{ \ r' 8 - .... ..- ,t..t'C.
-13,h28
1-10 ,755 - 2,480 ..,. 984 ---
6,137
377
- 2,230
9 I rJ3 - ,.+::>
.;. 1,354
;. 1,433 ;. hG3 t 6,133
.;. 9,453
Including BF 2,6.50 million of allied payments for military e ::.:penditures and BF 2,027 million of personal and institutional remittances.

•
•
.... 13 -
Belg~ um I s overall cu;crent account deficit Yias moderate - BF 13. h brl.liou
U~306 m.illion) compared with total current l)ayments of BF 90.5 bill~on
(~?2 ,065 million) ~ but this was achieved as a result of
(a) exceptional and often non-recurring receipts (incl'lding
dollar receipts) on both current and. capital account. r:'he
repatriation of private long and short-term capital, for
example, amounted to DF 10.8 billion" alld Je10i~n received
BF 2.7 billion of allied paym.ents for military 8:"~~)enc.liture,'3 •
(b) the expenditure of considerable gold ane. hard currenc;y' re
~-:,urces (BF 8.1 billion including a.dvc8nces fran the ILF) aHd
the accurnulation of substantial credit b&lances in soft
currencies.
It is also significant that BelgiUlll actuglly lent more than she borrovored.
Eowever, this was not all a sign of strength since it involved lending
through payments agreements to support exports to countries short of Belgian
francs aild borrowing hard currencies to finance i~:!ports especially from the
",jestern Hemisphere.
The vu] nerabjlity of Belgium's position arises chiefly £'ro:,: the
geographical distrib~tion of its trade in the postwar ye~rs. Before the
war J Belgium's imrr;ediate neighbors and the United Kin..;dom GOO.l\. :;2,~ of her
exports and provided her with 45ib of her Dnport reqJi:ceJ.lt:.dtS. Ger:-:'any ac
counted for about 12% of Belgian imports anlt exports. In 1:7L~7 th8se coun
tries were able to take only 37C;s of Belgimn I s exports largely because they
could furnish Belgium with only 29% of her import needs. Imports from the
United states J which had 9~mounted to only 10io of the total in 1939, rose to
26% in 1947. Bxports to the United States, hovvever, fell from 9;b of the

•
•
... II..,. '-
total in 1939 to only h% in 1947.
The significance of these changes can be seen from the following
synoptic table of Belgian trade balances yli th various parts of tr~e v;orld.:
Geographical ~stribution of Belgian Trade "'---. ~-
Yiestern Hemisphere Sterling area
U.K., Sire & Iceland C'~,:1er sterling area
Other EGA countries Belgian Colonies Other countries
(In, millions of Be 191an francs)
1938
-1,83t.6 f. )8L~q7
,,1,213.2 -1,094.8 I' 8 r 11 .3 -1,213.2
,'1,242.8 8SS.1
-23,919.5
1/ U.K. only. 2/ bxcluding ~ire, Iceland & U.K. colonjes. Y Including Eire, Iceland & IT.K. colonios.
l1.nnual Ra t6 Ja~.-Sep~~94£
-2,013.1 lJh.6
Before the war Belgium used its substantial export surplus with Kurope - and
also its net income on account of invisible items - to meet its trade dei'icit
with the ';i1estern Hemisphere and other overseas areas. The dentruction ilnd
impoverisnnent of war disturbed this balance. tll though they stood in great
need of Belgian supplies of steel, machinery and other industrial l)roducts,
most countries of Lurope could no longer £?xport as much to Belgium as t:1ey
had before the war nor earn surpluses in convertible currencies elsewhere _
especially after the suspension of sterlin{;; convertibilitJ.~ in 11.Ugust 1947 _
to meet trade deficits with Belgium. The loss 0::: the German trade was es-
pecial1y serious since Belgium had received a considerable volurae of equip-
ment from that source before the wa.r. In the postv,,".:·~r years, the only' large
source has been the United States.. In 1947 Belgium had an overall trade
deficit of almost BF 24 billion. Its deficit with the western Hemisphere

•
•
- l5 -
was even slightly larger.. The trade surplus wi i}h v-lestem Enrope, Lov;cver? t;:as
less than BF 2 billion mainly because the prewa~ surplus with the United King-
dom was replaced by a substantial deficit. In ad.di tion, hOYleVer, Be1[iuu :rlr;~t
helve obt.ained large net receipts from these countries arising out of curl'e:!"1t
invisible items, repatriation 0:(' assets and the failure of exportel"s·to031€~.um
to repatria.te the proceed:;) of their sales since it has had a substa~ltial 6P.r···
plus of most Eu.ropean currencies including sterling.') Lith most of Belgium's
best customers chronically short of Belgian f:ranes, Belgian exports, es?e-
cially of so-called non-essential goods, have encountered increo.sing diffi-
cuI ty in fjnding markets although they have been sustained by substant.ial
Belgian credits to rrlost European count:ries" Obversely Belgium, unable to ob-
tain needed sl.lpplies from its old sources and thl1.s increasingly depend.ent on
the ~'iestern Hemisphere., has not been able to increase :L ts expor" . 0 that
area €i10ugh, and has had to rely on other mea.ns of acquiring hard currenc:ies.
The import surplus 'with the Congo is a source of strength rather than of weak-
ness since nany of tbe imported products vvere processed and excha.:rlt;ed agCti!lst
hard currencies •
An analysis of its exchange transactions carried oat by the Interna
tional l'lonetary FundY shows clearly the means by which the deficit wi t.h the
.~estern Hemisphere was financed. As has already been indi.ca t6 '? part of the
Belgian dollar deficit was met by long-term borrmving, bJ short-·term credi.ts
and International i.ionetary Fund advances, and by sales of gold from the re-
serves of the Central Bank. 'Ehe largest part, hovfever, was paid vd th net
1/ N~te 'on Fin~ncing of 1947 Belgian Baiance of' l.la:'J'm~nts: prepared bY-- Hobert Triffin, H.D 742, Novet1ber 8, 194$. It should be noted that
the exchange control data refer not only to current account transactions but also to certain capital transactions and ar~ not directly comparable to those presented in the ba.lance of pa;yments.

- 16 -
gold and dollar receipt$ from va~ious European countries. These amounted to
the equivalent of BF 16.5 billion (:,;)375 mi}.lion), of which BF 12 billion
( 273 '11') f th TJ' t d 1'-' d BF 2 1 b'"'' " " r::r' '1" ) " ml ~on carle rom e l n~ ",e '~lng om, 0 W. :L.L-'_lOn \ .. './;' IDJ_. ~ . ..Lon
from li'rance and BF 1.3 bil:1.,ion ('S30 million) from the Netherlands. rrhese
sums, supf-lemen ted by smaller payreents by BelGium. in s-ter~ine to Brazil and
Uruguay, vrere applied to payments to the d'estern Hemispher~.
Provisional fi~"llres for 1948 shmv an overall trade defici -:., of Eli' 13.13
billion. It m.ay be noted, hO'.'Jeyer, that the data for the latest months show • only a small trade deficit so that, if a small surplus on invisible items is
assumed, ti_r::1 overall current account positj_cm is now approxinately in equi-
librium. This year no large net receipts are to be expected on uovernment
account. .Ii.ssuminF. personal and institutional rend tta:1ces and other invisible
items on which no information is available to be rupnins 2.t the same rate as
in 1947, one might expect an overall deficit on current aCC01.:mt for the i'ull
year ot about BF5-6 billion. The decline in the overall tracle deficit results
mainly from the decreased deficit with the '4estern Hemisphere partly because
• imports were abnormall~T high in 1947 and partly as a cODBequence of Bt:::lgian
restrictions (thro'lgh licenses) on imports from that area. ;l'he trade defici.t
with the ':,:estern Hemisphere for the first ten months of the year amounts to
BF 11-12 billion. However~ varioUG extraordinary receipts of hard cu.rrencies,
for example payments in U.S. and Canadian dollars for allied mtlitarJ ex-
pendj.tures in Belgium, will also not be available in any volume this ~~ear.
The Belgian dollar deficit for the first ten months of 19h8 haS been
met substantially from the same sources as in 19h?.. Borrowing ;from the
United States amounted to the equivalent of BF 2.192 billion and advances
from the Interna tiona1 ir!onetary :F'und to BF O. 961~ billion. il.s a result of the
•
•
.,; 17 ....
lag in EGA financing, reimbu.rsements on that account were very srriall., (In
the last months of the year, however, they have risen considerably). Net [ol{
and dollar payments to Belgiu..m by countries outs ':" the Western He.n:i s;.Jbe:.. ... e
and the Bizone were again by far the most important, source of hard cur:::"2~lcy.
{,lost of these payments were made by EGA countries to whic~ Belgium also ex ....
tended substantial additional net credits. It may be noted that tlle iSold and
dollars received by Belgium '}'rere more than sufficient to fill the dollar gap~
In the first ten months cf the year the C01Jntry's gold re.J8t'veS· rose by BF
2.1 billion.
It has become increasingly clear that equilibrium in intra-European
trade could not be restored quickly, that other cou!1tries c0111d. not continue
to finance Belgium's dolla.r deficit b~T payments from dwindling monetary re-:
serves, and that Belgj.um was not 1n a position +,0 gra.nt large adeli tional
net credits without substantial risk of furt.her ;infIe.tion. To cope with this
problem, the OEEe intra-E.;uropean Payments Plan was developed linl-:::ing dollar
allocations li~Titl~ provisions for financing intra-European trade. For the
period .A~)ril through June 1948, Belgium-Luxembourg received an EHP allocat:l.on
of ",20 million (:;;17 million in loans and ~p3 willion in gr.ants). Under the
OEbG 1948/49 il.l1Dual P::-,ogram, dollar aid for the period Jul;y- 19l.lB through June
19L~9 amounts to ~;2S0 million. Thus Belgium will receive for the 15 months
,;ii270 million, of which ,~S9.5 r.:illion is to be in loans. Of the ;,i250 million
for the period from J'uly 194[r through June 19L.9, however, only ·i~42.5 m;illion
is unconditionally available to finance a Belgian net impo·rt. surplus. The
remaining ~207.5 million is only available as BelgiQm makes equivalent grants
(drawing rights) to other participating countries, notably the Netherlands,
France,. the United Kingdom,. Norway and the Bizone. Up to the end of October,

•
•
.. 18 -
ECA reimbursements were less than "1>10 million although p~ocure'nent author~_z.a
tions were much larger .)j Furthermore, other EGA. countries expect to Eiake
gold and dollar payments to Bel~ium substantially larger than the gold. and
dollar receipts shown by Belgium, and Belgium may also receive some gold and
qollar pay.nents from countries outside the Western Hemisphere and not :f.ar-
ticipa.ting in the European Recovery Program~ Since the country's gold and
dollar deficit for the period July 1948 t~rough June 1949 is expected to run
2 / at a rate of about '~33 million per month"J Belgium might well reach the end
of the fiscal yea.r vvith a loss of monetary reserves considerably lOIHer than
the .;,147.6 ':-'lillion anticipated in t!1e Of ,Ee 1948-h9 annual program.V 7.he
burden on Belgium, namely the Belgian franc grants to other ECA cO'lntries ~
is, of course, not inconsiderable, but the fact that, it is offset by equiv-
alent dollar grants should prevent its having serious effects on the monetary
system. If the aLEC Pa;y-m~nts Plan funetions as is hoped and is continued in
sOr',e suitable form for the relilainder of the ERP peri.od, it should allovl a
breathing space in which equilibrium in the Belgian balance of payments with
the other participating countries may be reached •
Such a.n equilibrium does not of course necessartl:f mean that Belgian
rece5 !yts from and payments to Europe should balance exactly. The strncture
of intra-European trade after the EHP period cannot be foretold. That it
will be ctfferent from prewar, however, is clearly i'oreshadowed by the
---""---""T,-- I --_._--_. __ _
In the last months of the year, reimburser;lents {'jere apparently substantial. The Eximbank credit is e}~hausted and although ·~!32 million of the Canadian credit is undisbursed, it is unlikely that it '~vill be used. Thus Belgium has no other source of hard clJ,rrency to tap, The Bel~ian current account deficit in gold and dollars is estimated in the Belgian submission to OEEC at ~:j)346.8 million, and there are ex.pected to be other transactions ;Lnvol ving net gold and dollar payments amounting to :.»)0.8 million. ':'he United Kingdom used tvm-tbirds of its dravring rights on Belgium within two months.

•
•
- 19 -
realization in the Uni ted Kinbdor~ longterL1 plan that the Uni ted I(~ingdorn, c. t
least for a time J cannot afford its large pre'war surplus with continental
Lurope, including Belgium. Thus Belgium r s foreign trade lJroblems £Lre ~)ot.
merely transitc,ry but involve important structural adjus"cments in its t:::-Elc .. e,
for example, increased exports to thet'~estern Hemisphere and pe~:'haps red'".cetl
iIilports from that area. -'.Jven ~alloviing for such changes, h:::)\!!8VOr, Eelgi.ml
will probably still have a deficit with the VJestern Hemisphere and some -
though reduced - surplus with Europe. Thus, its ability to meet its dollar
payments will again depend to an important extent on its ab11i t,y, to earn
dollars thl 'Jugh surpluses Yli th other areas incl'J.ding ~urope, in othE.r v:ords
on the achievement of a substantial degree 01 conv6:::-tibility of :buropean
currencies.
This is, of course, true of pra.c;·~ically all European. countries and
the long-run outlook for the Belbian balance of pa;y'ITlents is brie:;hter tha!l
for many in several respects. Although its net income from transit trade is
not likely to recover fully to the prerfar level, Belgium has not, like the
Uni ted KingdoY:1 or the Netherlands, been forced to liquidate a 12.rge 'p1.)rt~.on
of its foreign i.nvestments but Oa.s probably' continued to incre.:lse its ea:cr.il1g
assets abroad. Neither has it aCCuInul4ted large foreign debts li:~e t:'le TJni tad
Kingdom, the Netherlands or France. In particular its U. S. a.nd Canadian
dollar payments on account of interest and amortiza'hion are not very lleavy.
Assuming that ECho loans continue, though on a reduced scale, it is estil:mted
that these pa~rynents will average less ttan ~20 million in the 10 year s fol
lovring the end of ERP compo,red, for example, with well over ,:~hC) mil1 ion for
the Netherlands. Belgium will, like other European countries, suffer from
the loss of Germany both as a market and a supplier, but it v{ill not be so

•
•
- 20
severely affected as tl!e lietherlands. Finally, its position in the CODGO is
.secure unlike that of th3 Dutch in t.he Indies. Thus the struc~ural 3.d~'_lSt
ments re-iuired in the Belgian balance of pa~mlents, though painful, are s';'~c~:ler
than in the case of many countr les in ,ifestern Europe, and Belgium is in a
stronGer position to nake them than mo.st.
To a breat extent Belgium's foreign trade problen is not of its ov;n
:'Jaking. How8ve~.', this does not mean Ghat it cannot contribute to its S0J_U
tiona In sone fields, as the l-'rime .;.·iinister indicated in his policy state ....
ment of :·Jover:1ber 30, .iJ3lgian ex}")orts are already hindered by hi0;h ~C'ri.ces.
Belgiu'l :'TIust soon face the fact that :!rices and costs are ont of line V'.fith
the realities of a cO:flpetitive mar~:et. It h.::.s been possible to postpone
corrective act.ion in tllis area ~nly because of the lHorJ.dwide sJ.l0rt.ahe of boods,
1N11en t~e supply of cOr.ll.10di ties catches up with the denand, hOFever, Belgian
producers may well find themselves at a disadvant2 u e in ~'rorld n.C:i.rl~ets unless
costs are reduced.
(b) ~ces, Costs and Capit:~l Formation
An attack on the high level of prices and costs might be pursued
alonG tl!{O f.1ain l.ines, either by reducing money waGes or by ct:tting costs
through the introduction of better machinery and other means of usin_'l labor
more efficiently. Hot Guch can be expected of a policy of wae;e reduction~
In a 11lodern incl~J.strial economy, wages are fairly rigid in a dovn1ward direc
ti.on. Furthermore, in the pt;:lculiar BelGian situation, where important sec
tors of industry, notably the production of durable goods, are 'working at
full capacity and all the adjustri1ent would be thrm~m on the other parts of
the economy, mainly that producing norl-durable goods, the cut in employment
•
•
- 21 -
in these sectors re~uired to induce 8. sufficiont degree of deflation "!7Quld be
very large. That it is larger than the Belgian Govern1l1ent is prepared to
face is indicated by the Finance Hinister' s recent announcement that a 31lPi)le
mentary budget..!! will be :introduced to combat the growing unemplo~."~.lent which
may be expected to become :1eavier in the winter months. With the possib.Ll.it:r
of any substantial reduction in lTIoney wages excl11ded, the Jelgian pI'ice ~)J'ob-
lem, therefore, resolves itself r.la.inly into an investment problem •
A future currl:l1cy devaluation can also, of course, not be left out
of account and r::.iGht becoJ:'le desirable in the fut11.re. For the present, hovr-
ever, the Belgian franc is strOl1b in rela.tion to nIl European currencies e:::-
cept the Swiss franc I) It '1!ould 'be naturally prefe7.~able if any such n.easure
r,"c:"e t2.!{en v,Ii thin the framework of a general readjustment of I:uropean cur-
ren~ies •
l'he advantage of the Belgian f,ostwa:- policy of enCOUr3.bing consl~mp-
tion ar.d curbing monetar:r e:::pansion has already been stressed. It lIas, how-
ever, had the obvious disadvantage in that effort 'Nas channelled into the
l'roducti.Jn of consumption boads and e):ports at the price of neglecting recon-
struction of war da;ilage and re-equipment of indl~stry and necessar~.7' public
vvorks such as the improvement of roads, ports, etc. Bele:,imn has thus co.rl"ied
out its remarkable recovery viith industrial eq'lipr.J.ent w!1ic:1 is, on U-J.e idhole,
rather old. l~bout 50% of Be16ia.n TIachin8 tools, for example, and 35~~; of its
coking ovens are more than 20 years old, while railway engines have an
average age of 26 years. Besides, product.ive equipment 'Nas inadequately
Y;1aintained during the war and often suffered attrition from accelerated war
11 Li ttle provision was r:lade in the ordinary budGet for IJubli.c 1nrorks. W'hether or not. the supplementary bud6et will be financed by borro1f'!i:1g or out of taxation, the Finance 11inister did not say_
•
•
- 22 -
use. The recovery has also, as for example in the case G:~ electric po"rer
production, been accomplished by runninb the available equipment at a :-::-ate
of utilization far above normal. It should, hOlffeVer, be noted tLat al'L}~o·.1;::11
the average a66 of Belgia.n equipment seems high by American standards, it is
by no means unique in Europe.
In order ~o determine the maE-ni tude of the countr~r' s investIJ1e~t lil'ob
lem and to aid in its execu'L.ion, the ~rinistry of l:'Jconomic Coordinat.ion and
National Re-equipment has collected the individual investment requirements
in each industry to ..:;,ether with the necessary public ymrks prograilS. It
should be made clear that this is not an oyerall plan involving priorities
or allocations but morely a collection of data. Indeed, Belbium has per~aps
suffered some disadvantage recently because of an inadequate coordtnation of
investment and certain projects have been built Khich could not be considered
of the highest degree of urgency_ In the ':Chird Heport on Investraents re
cently issued by the Linistry of Lconomic Coordination and IJational He-equip
ment, the annual cost of the total ten-year public .::.nd private investnent
program has been put at almost 13F 40 billion compared with act'ual invest
ment::; by BF 3)~ billion in 1947. In the first few years of recover;.', the
annual cost of required investment is put at BF 42 billion. Although the
available Belgian data on national income and c.;;l.pital formation are far f'tJIn
satisfactory, it is interestint:, to set them alongside the fiLures for the
United Kingdom.

•
•
- 23 -
National I.!l£.2me and C api tal Formation in 19h 7
Belgium United Kingdom (BF billion) 11 milli~
(1) National income 215 8,770 (2) Gross capital formation at home 3h.0 1, 94l~ (3) Net borrowing abroad and sale of
13'.4 assets to foreigners 675 (4) Total caf'ital formation (2)-(3) 20.6 / 1 0"Q , ,.b" (5) Net capital formation at home 15,.0! 1,169 (6) Total capital formation as a per~
centage of national income 9.6 lLl..5 (7) Net capital formation at home as
a percentage of national incase 7,+0 13.3
Y No information is available on depreciation allowances in,Belgium. It has been assumed that they bore the same relationship to national income as was the case in the United Kingdom (9%).
It would thus appt-.~ar that in 1947 the rate of capital formation in Belgium
was significantly lower than it was in the United ICingdom~ Figures such as
tl'!ese should of course be used V\rl. th great caution and merely to illustrate
the nature of the problem. The data j especially the Belgian, are far from
satisfactory and a small error, for example in depreciation allo'\lyances,
could change the figure for net' capital formation significantly. The esti.,..
ma tes of depreciation allowances in the United Kingdom are ob tained from tax
data. based on original rather than replacement costs and are thus lovv.
Finally, such calculations cannot distinguish between investments that are
directly connected vvi th the industrial or agricultural apparatus of the coun-
try and those that are not.
fEhe ratio of 1947 investment to the required average for the ten-
year period varies considerably between different sectors, In a large part
of the private se~tor the rate of investment in 1947 appears to have been
fa:irly satisfactory. In coal minins and electrio pOVfer production, how-
ever, and to a less extent in the steel and "coal ch~mistryU industries, this
•
•
- 24 -
was not the case, Investment in coal mines and electric power amount6d to
BF 1300 and 1451 Iilillion in 194?, compa.red lJvi th yearl? re4uire''1en-ss during
the first few years of recovery of BF 2100 and 2700 milli.on respe~ti vcl.Y ~
Investment in the steel industry and in "coal chemistry" amounted to BF 750
and SOD million compared with BF 1100 and 750 million respecti vel~T. The
1947 fiGure for housing and agriculture 'NCl,S also well below the esti!.w .. ted
annual average requirements for the next few years.
In the public sector, the ratio of actual invest!:1ents in 19h7 to re
quired investments vras far 101\'e2.", for in 19h7 actual investments reached only
about two-thirds of the estil:lated yearly req,'\.lirements during the first few
years of recovery~ The ratio was lowest in railroads, ports and publ:LC 'works
where actual investments in 1947 amounted to only DF 2733) 262 and 2865
million compared with yearly re~uirements during the first few years of re
covery of BF 4500, 1000 and 4800 million. The decJ.ining deficit in the over
all budget (estimated at less than BF 5 billion for 19L,.9) has thus been
achieved at a rather heavy cost in deferred reconstruction and re-equipr:lent~
The provision of a large volume of ~onsumption goods has not up till
now improved the incentive to save and high interest :rates are an indication
of the difficulty of raising money as well as an instrument of monetary
policy~ Although the overall result of the Gutt monetary reform 'Jiras salutary,
it did have the undesirable effect of creating some distru.st of the currency
and consequently of reducing the public's desire to & ~.ve ~ In addition,
Government tax policy may also have impeded capital formation somevvhat al
though depreciation allo·wances seem rela.tively generous compa.red for example,
to the United Kingdom.
The Government has tried various measures including, for example,
•
•
loans with lottery features, to encourage savings, but the success of these
has been very limited. The rate of net accumulation of deposits '!:i!ith the
Caisse Generale d'Epargne et de Hetraite is about the same as last yt:;o.r,
Tr:e capital market has shown some '~endency to absorb an increased volume of
funds through nev.[ issues, perhaps as a result of the decline in the import
surplus. It is clear, hOlf!ever, that the aOJ:16stic capital narket is unable
to meet the demand for funds on the scale required to fill a gap as large
as that between realized and required investment in 1947 which amounted to
BF 8 billion. The Belgian Treasury is still chronically short of cash, and
since the overall budget for 1949 provides for a d,efici t of almost BF 5
billion, savings of the state cannot be expected to fill such a ga.p either.
Some additiona.l funds trlill be available from abroad. The proceeds
of E,CA loans and unconditional grants for which Belgium has not yet been
reimbursed will amount to about BF 2.3 billion in the current fiscal year,
and the proposed IBRD loan YlTould give an additional BF 0.7 billi0l1 11 ~To in..,.
formation is available on the volume of industrial self-f:Lnancing in 19h8 •
Unless it is substantially e;reater than in 1947 or unless tax receipts are
increased either by hea.vier taxes or improved ~011ection .. it is hard to see
how investments as large as the requirements of the Third Report of the
.L.:inistry of I.conomic Coordination and National TIe-equipment can be met in
full ~lthout resort to some deficit financing on the part of the Government.
Perhaps this is the meaning of the recently annou.nced supplementary budget.
As a result of the recent Central Bank reform, net new' borr:)wing facilities
of about BF 4 billion 'Here made available to the state. Up to the end of
October about BF 1.5 billion of this appears to have been used 11p_ Despite
the existence of growing unemployment in BelGium~ such deficit financing

•
•
- 26 -
would have inflationary effects on the price level since resources in the in
vestment goods industries .... which would be affected most - .. :\re still fully
employed. On the other hand, the Third Report on Investments is in no sense
an investment plan so that some projects might be omitted and 'Ghe inflat:.ionar:.
:L11lpact thus minimized. On balance it would appear probable ... on the basis of
the limited information available - that with moderate calls on foreign capi-.
tal and perhaps a further limi ted volume of deficit financing;) a fairly satis
factory rate of capital formation can be achieved •
•
•
Table I
Table II
Table III
Table IV
Table V
Table VI
TaL":"e VII
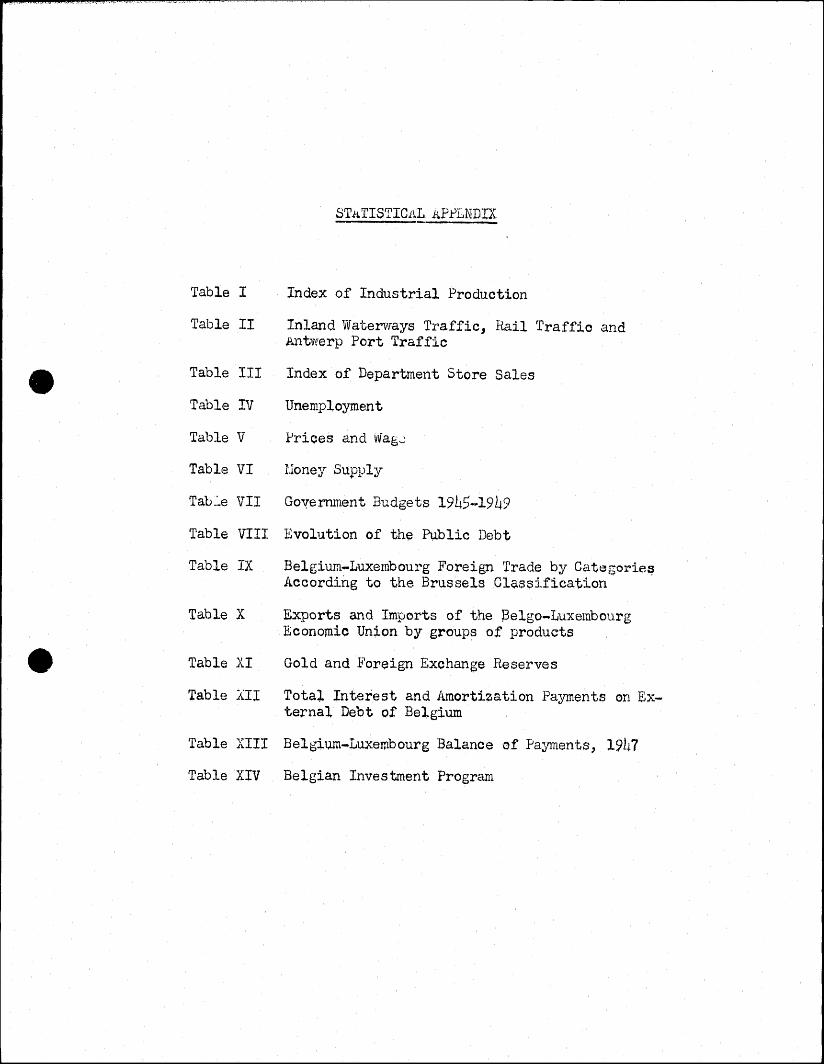
STaTISTICAL .APfLNDIX
Index of Industrial Production
Inland Watenvays Traffic, Rail Traffic and Antwerp Port Traffic
Index of Department Store Sales
Unemployment
Prices and vljag~
Uoney Supply
Goyernment Budgets 1945-1949
Table VIII Evolution of th~ Public Debt
Table IX
Table X
Table XI
Belgium~Luxernbourg Foreign Trade by Categorie~ According to the Brussels Classification
Exports and Imports of the ~elgo-Luxembourg Economic Union by groups of products
Gold and Foreign Exchange Reserves
Table Xlr Total Interest and Amortization Payments on External Debt of Belgium
Table XIII Belgium-Luxembourg Balance of Payments, 1941
Table XIV Belgian Investment Program

;'~
I.ABLE I
Index of InnU8~~i~1 Prcduction
(Av8raee 19~,6-1938 = 100)
Textiles I~iet[;l Constrac- l\iatural Artificial
Coal Steel Products tion Fibers Fibers Cement w"eight 20 10 20 10 16 4 '10
Production Production Production Production Pre [1000 M!T.l Index ~lOOO M!T_) Index (1000 M.T.} Index Index Index Index (1000 l',;f.T.J Index_ -'He~
1936-38 2,420 100 259 100 110 100 100 100 100 250 100 j
1946: January 1,944 80.3 154 59,,·4 85 77.3 60 80.6 209.1 50 20 July 1,828 75.5 201 77.t: 108 98.2 90 89 298.3 192 76.8
1947: January 2,140 88.4 228 88 125 113.6 65 119.2 4-17 .• 1 181 72.4 February 1,934 79.9 209 80._ 7 117 106 .. 4 65 106.2 370.5 12J 49.2 March 2,198 90.8 229 88.4 116 105~.5 90 115.3 361 .. 7 145 58.0 April 2,184 90.2 234- 90.3 127 115.5 9.r' 122.7 376 .. 4 215 86 May 2,081 86 0 0 228 88,,0 130 118,,2 9~ 106.4 353..9 236 94.4 June 2,010 83.0 232 89(16 122 11009 97 110.9 348.8 197 78.8 July 1,860 76.9 243 93.8 130 118.2 90 104,,7 274,.6 250 100 August 1,826 75.5 227 8707 125 11306 87 97.5 15808 233 93.2 September 2,004 8208 209 80.7 130 118.2 97 110.6 287/).5 222 88.8 October 2,143 83 .. 6 27 9 107.7 13.5 122.-7 97 129&2 266<.6 275 110 November 1.910 78.9 266 102,,7 135 12207 95 11505 245 264 105.6 December 2,067 85.4 296 114',.3 140 127 .• 3 85 116 275 .• 7 263 105 .. 2

Steel 10
• T.A.BLE I
Index of Indust~i~l Prcduction
(Av8raee 1936-1938 = 100)
I~let:;l
Products 20
Construction 10
Textiles Natural Artificial Fibers Fibers
16 4
•
Cement 10
Paper 5
Electricity 5
Production Production Production Proouction Production (millions
tlex (1000 M.T.) Index (lQQO M.T .. ) Index Index Index Index (1000 H.T.) Index (Metric Ton) Index .ci"·If':m). .. Index
b 259 100 110 100 100 100 100 250 100 16,000 100 436 100
.3 154 59 .. 4 85 77.3 60 80.6 209.1 50 20 523 120.0
.5 201 77 .. 5 108 98.2 90 89 298.3 192 76.8 17.480 109.3 486 111·.5
.4 228 88 125 113.6 65 119.2 4,17 .• 1 181 72.4 17,460 109 .. 1 646 148 .• 2
.9 209 80.7 117 106 .. 4 65 106.2 370.5 123 49.2 16,330 102.1 580 133..1
.8 229 8e.4 116 105,,5 90 115.3 361 .. 7 145 58.0 17,850 111.6 604 138·.5
.2 234 90.3 127 115.5 95 122.7 376.4 215 86 18,880 118.0 550 126.1 00 228 88~0 130 118D2 95 106.4 353..9 236 94.4 18,500 115.6 56Q 128 .. 4
13.0 2)2 89n6 122 11009 97 110.9 348.8 197 78.8 18.,900 118.1 550 126.1 6.9 243 93.8 130 118.2 90 104,,7 274 .• 6 250 100 17,600 110 559 128.2 ~.5 227 87c7 125 113.,6 87 9705 15808 233 93.2 17,000 106.3 559 128.2 2!O8 209 80.7 130 118.2 97 110.6 28705 222 88.8 19s600 122.5 574 131 .• 7 3 .. 6 2?9 107.7 135 122.7 97 12982 266 .. 6 275 110 21.,300 133.1 649 11.J.8.9 B.9 266 102 .. 7 135 122 .. 7 95 11505 245 264 105.6 21,200 132.5 646 148.2 ~.4 296 lILJ, .• ) 140 127 .• 3 85 116 275 .• 7 263 105 .• 2 23,090 144.} 698 160 .• 1
- continued
Overall Index
100
76.5 96.4
111..4 100· __ 3 108.3 115·.2 112..1 109~ • .J 10.7
98.3 108.7 119·.1 113 117 .. 6

fr:,
1.0J.,:n:~ I - pCl.[je 2
Production Production Procluc-(iion Production (1000 Iii. T.) Index (1000 M.T.) Index ( 1000_1"1. rr .. ) Inde:;,:- Index. Ir:oex Inclr::.!- (lOGe:. 1'1
1948: January 2,293 94.8 312 120·5 lll7 133.6 80 131.7 274.5 272 108.8 February 1,750 72.3 293 113,,1 145 131.8 75 116.1 226.4 255 102 March 2,298 95.0 327 126.3 155 140.9 90 121.7 265.4 270 108 April 2,317 95.7 337 130.1 167 151.8 97 ·120.6 282.0 292 116.8 May 2,069 851>5 306 118 0 1 171 155.5 97 '97 303.6 301 120.4 June 2,288 94,.5 2110 92'A7 148 13LJ·.5 98 103.8 350.2 291 116.4 July 1,985 82.0 317 122.4 140 127.3 98 95.3 3/J1: .8 27'1 108.4 August 2,180 90.1 351 135.5 130 118 .. 2 98 86a6 367.8 2.90 116 September 2,337 96.6 352 135~9 147 133c6. 98 101.6 359·5 325 130 October (rev.) 2,431 100.5 372 14).,6 147 133 .. 6 98 104.2 371.6 310 104 November (pro.) 2.338 96.6 352 13509 158 1431)6 97 901>9 338.2 25) 102 December (~rogr.)2,425 100.2 360 139 160 145.5 95 90 368.8 220 88
Source: Agence Economi.r._ue et Financiere.

• • ~},_"3I~ I - ~i?nce 2
?roduction Production l:-'roductiion Production ?roducticn (millions Overall
1000 i'1. T. 1000 i'i. T .. Inde:.:- I,~dey~ I ndr;x Inoex ( 100l_ fl. '1'.) Inclex (l"ieJ.;ric To..nl. Index of ILH1) I ndex_ ~n{J.~x
312 120·5 147 133.6 80 1)1 .. 7 274'.5 272 108.8 20,032 125.2 703 161.2 122.9 293 11J"1 1b-S 131.8 75 116 .. 1 226.4 255 102 17,000 106.3 661 151.6 110.5 327 126.3 155 1401>9 90 121.7 265.4 270 108 22,370 139.8 673 154.4 124.4 337 1)0.1 167 151.8 97 120.6 282.0 292 116.8 22,050 137.8 651 149.3 128.8 306 118 0 1 171 155.5 97 '97 308.6 301 120.4 19,000 118.8 614 1110.8 122.,6 2110 92 ... 7 148 13b..5 98 103.8 350.2 291 116.4 19.397 121.2 590 135.3 120 J17 122.4 140 127.3 98 95.3 34l:.8 271 108.4 15,090 94.3 600 137.6 115.4 351 135.5 130 118.2 98 86.6 367.8 :2.90 116 18,200 113.8 635 145.6 118.2 352 135,,9 14? 13J~6- 98 101.6 J59.5 32.5 130 19,000 118.8 648 148.8 126.4 372 14),,6 147 133,,6 98 104,.2 371.6 310 104 21 .. 000 131.3 697 159.9 129.5 352 13509 158 14306 97 90.,9 338.2 255 102 19,900 124.4 710 162.8 124.0 360 139 160 145.5 95 90 368.8 220 88 20,000 125 750 172 125.3
Fin8nciere.
\

•
•
TABLE II
Inland Yiaterw.:;l.Ys Tr3.i'fic Rail Traffic an-d':AntWe'"rpl/ort ·Traffic , .... ,. -,.....~.-. .--. (monthly averages or calendar months)
Railway Inland Antwerp I
Freiaht.Y Wa tervITaysY Port Trafficd! Ton Kilometers Ton Kilometers Unloadings L02.c1in r ·s
- (000,000) (OOC,OOO) (000 tons) (m')~:Z-J , ... Jv'. '(,0;,18 I
1937 519 244 1,193 1,177 1938 429 250 989 975 1946 391 146 743 242
1947 h89 168 1,331 520
1948 - January 557 166 1,845 595 Fetruary 467 163 1,27h 629 March 532 213 1,618 595 April 539 186 1,116 596 May 486 199 1,115 530 June h72 191 1,120 562 July L~60 178 1,030 51.~4
August 503 178 1,004 ,3d September ,00 930 633 October 522
1/ Societe Irationa1e des Chemj.ns de Fe~" Belges only. y Inland ~Nater1Na:rs traffic is divided between internal and internatior~al
traffic as follows:
Intern~l International
1938~!-1946 1947 1948 March
Trafflc Traffic ,thousand metric tons)
1,125 980
1,106 1,314
2,110 600 827
1,183
Total -3,235 1,580 1,933 2.,497
~}Rough estil;:ate of the IBRD Economic Depa.rtment transportation section.
Ocean traffic. Only goods passing through custo~s. the tonnage is gross weight.
Source: Bulletin de Statistlque.
Since January 1940

•
•
191..6 July December
1.947 January February Farch Al ril Lay June July Au@st September October november December
1948 January February l1arch April May June Jul:,r
TABLE III --.
Index of Department Stofe Sale~ ~..-..-..--"''''~~'~''-'''- ......
Average Daily Sales 1936-1938 = 100
Y Index of monthly sale s.
3.DSY 4131/
285 '477 344 371-356 300 312 321 373-398 L!.52 h99
350 357 423 h20 h17 3h6 397
Source: Bulletin de Statistique, J\.ugust 1948.

•
~ ~. •'
1938 1939 1944 1945 19L~6 1947 1948
TABLE IV _._._-
Part.ially Unemployed
n.a. n~a.
n"a. 29,077 i9,257 31,921
- Janl,lary ,36,962 February 63,G70 March 31,338 Ap:L'il 33,117 May 34,439 June )-+2,903 July 59,703 August 48 ')~,... ,~,.; (
September 43,168 October 4!.\., 763 November December (week end-
ing December ll) 60,300 (week end-
ing December 18) 60,000 (week end-
ing December 25) 76,000 (week end-
ing January 1, 1949) 132,000
Vvholly Unem121?¥ed Total.
. n.a. 17},913 n.a. 195,211 n.a. 24.1,296
115,502 14L~, 579 48,0.35 67,292 35,639 67,560 68,328 105,290 71,854 135,724 6h,113 95,451 61,562 94,679 59,606 94,045 61,8l4 104,717 69,571 129,27h 7h,292 122,549 81,065 124,,233 87,604 1)0 'J,"7 (_,-,"0
112,300
133,100 193,400
l83,800 2L.3,800
192~4oo 268,·400
185,000 317,.000
Y Unemployed registered wj.th the Unemployment Assistance Fund., Because the assistance fund has been expanded to cover a larger proportion of the total employed population, the statistics are not strictly comparable throughout the series.
Source: Rewe du Travail. Decen.ber figures from Agence Economique et Financiere.

•
•
T.,illI£ V
Indices of ~ri~ &ng~a~;es
v~ho1esale Retail :"a _~sl/ Prices Prices .v b'" -
1936-38 = 100 1936-38 = 100 1936-38 = 100 _. ____ .>J<o_~_
1937 108 lO4Y 1938 104 lO6~/ 1939 103 lILY'
339 .1.~Y, 1946 301 333~ 1947 36LI. 36L~ 36h. 7~/
1948 - January 400 366 February 42.1 387 11al'''ch 419 393 373 April h28 396 May 428 398 June 422 397 380 July 426 396 August 426 400 September 425 40h October 412 377 November 391.:. December 39$
1/ Average hourly earnings. Y December.
Sources: Wholesale prices: InDtitut de Recherches Lconomiques et Sociales Retail p:rices: Einistere des Affaires .cconomiciues. November and December figures from Agence hconomique et ~·ir:.anciere .. lIVages: National Bank of Belgium

•
•
TABI~
Belgi.an Honey Supply
(Billions of Belgian Francs)
.Depo~i.t)~~L(Gr~ss) _ .. Total
Currency National Other Postal'Check Money Blocked
(Gross) . Bank Banks ~ys~~._ Supply .. ~~2eL --.- ..... :------
1944 Septemby l06.l 4.1 43.1 10.9 164 .• 3
1944 October1 31.7 3.6 1$.4 6.7 ~704 1~).3
1945 December 76.9 3.h 34.7 18 e 5 131.h 78.1
1946 December 77.8 h.S 43~8 2502 147.9 66.0
1947 Unrch 79.6 c: ':) 43.4 23.8 11+9.1 60.2 ~ . .)
·June 79.9 5.0 4~ .• 1 2,5,8 1>1~9 58.0
September 82117 3.6 44 e O 26,1 1;;4.3 55.7 December 82.8 4.9 43.3 27!t8 155.1 52.8
1948 Jiarch 81.D 5.2 44.9 22.8 151,3 50.6 June 82.7 5.7 46.3 23.1 15SlJ7 44.3 September 86.7 5.0 44.4 2h,6 1,S.5
October 86.1 4.6 26.1 Novemter 85.7 26.0
11 October 6, 1944.
Note.: Figures for 1941~ are taken from a different source than the st1.bsequent figures and may not be comparable to the last digit.
Sources.: International Financial btatistics IMF Report RD 59.3, Belgian Monetary n~forms .•

•
•
"
TABLE.vII
Governmen.t, .I~l1.dge t~ 19h5":"1949 (Millions of Belgian Francs)
19,45 1946 i947 1948
Receipts
Ordinary 21;202~O 42;242.0 46:,395.0 -JJ' 6r' ,b, ;JO.O
Resulting from the war 46.0 }~,184.0 ShleO 2,060,0
Extraordinary 30.0 Ih,229.0 6,895.0 6,910.0
Total 21,278.0 60,655.0 53,831.0 65,620.0
Expenditures , -Ordinary 28,366.0 31,928.8 36,055.1 h1,566.2
Resulting from the war 26,242~4 M.45.2 2?,176,,8 19,845.3 } I
Total ordinary and re-suI ting from the war 54,609.4 69,974.0 61,230.9 61,411.5
Extraordina:ry 2,482.\ 27, 7}~9.1 24,609.1 17 736 6 , . . Total 57,090',5 97,723:.1 86,840.0 79,11+8.1
Balance
Excess of expenditures over reoeipts 35,812.5 37,068'.1 32,009.0 13,526:.1
Source: Budget des Recettes et des Depenses pour I' Exercice 19L,.9·, Expose General.
19h9
59 Lr:'7"~ , .,-1 ~.,.
951.1
6,353.1
66,762.1
47,692.1
12,426.1
60,118.2
11,L:66.0
71, 581.r. 2
4,822;.]

• • TJu3LE VIII
Evolution of the Public Deb~ (In millions of Belgian francs)
Total debt
Inte:-nnl nebt External excluding Currency Total inclucling
Consolidated I~ledium deqt currency reform currency reform
Direct Indirect term Sho rt- t. e rm 1./ rRform loan loa.n
1938 December 26.525 9,066 1,300 3.782 6,560 47,233 47,233
1939 December 26,21JO 8?948 700 (,887 5~936 49,711 4-9,711
1940' April 26,462 BJ 901 700 11,465 5~645 53,173 53,173
1944 ,t\llgu st 3},649 8,122 37,4)8 61,922 4,082 145.213 145~213
1945 Decet1ber 44,375 7,953 31,843 115,34-'-1. 6,156 20.5,671 205 1 671
1946 Decemb..:~ 43,489 7,854 27,869 110,210 11,.717 201,139 5e,822 254-,4·61
1947 December 42,64·6 11.818 27,189 121,549 11,001 214,203 43.984 258,187
1948 January 42,608 12,020 27,751 122,625 10,908 215,912- 43,617 259,.529
February l!-2,551 12,062 27,584 124,725 10, 74L~ 217 .. 666 431136 260,.802
March 4-2,491 12,055 27,062 126,553 13,377 221,538 42.573 264,051
A:pril 42,441 12.045 27,318 126,726 13,,392 221~922 42,005 263.927
'May 42,399 12,069 2·7,101 126,461 13,511 221,541 41,527 263.068
June 42,341 12,162 30,685 122,552 1},426 221,166 L!·1.055 262,221
July 42,305 12,219 30,806 124,294 13,389 223,013 40,560 263,573
August 42,24.6£1 12,219 31,l:!96 123,29~ 1},410 222,670 40 .. 084 262,754
September 78,881 12~277 31.406 76,89 1},lB7 212 t 647- 39,636 2-52,283
1.l Not including the debt to foreign governments resulting from the 1914-1918 \-,ar. gj. On September 13, 1948,· accumulated I-~.ofits of the National Bf!n.'k "18re surrendered. to the Government.
The proceeds were used by the GO'vernment partly to increase its su:'scription to the ban..1t t s capital and partly to reduce its debt to the Bank. At the same time 35 billion francs of short-term obligations still o~:!ed to the Bank ' •. rere funded into a long-term debt of the state (part of v!hich \",il1 be sloiYiy amortized out of the T·reasury share in future profits of the Ban.~) and the remaining 2,465 million short-term debt transformed into Treasury certificates in the Bank's portfolio.
Sou:re: Official figures.

Imuorts
Live animals Foodstuffs Rav! materials and semi-
manufactures Manufactured goods Gold and silver
Total
Exnorts
Live animals ]loodstuffs Raw Inaterials and semi-
manuf acture s Manufactured. products Gold and silver
Tcta1
• • TABLE IX
BelgiuIn-Lu.::~8JTlbourp: Foreip'n Trade by Qf'teo.;ories Accordin8; to the :3russels ~la.ssification (V~lues in millions of Be1eian francs)
1947 1938 1939 Value % Gf total Value % of total Value % of total
28 0.12 13 0.12 56) 0.66
4,677 20Q27 4·,006 20.22 19,74i') 23~O7
12,557 54 .• 43 10,7LI·6 54.24 34,019 39.76
5,336 23.13 4,630 2).37 30,621 35.79 422 2.05 406 2.05 616 0·22
23,069 100~OO 19,811 100.00 85~·559 100.00
67 0.31 53 .24 302 0.30 1,132 5·22 798 3.64 1,784 5.34
9,781 45.13 9,787 44.59 20.322 44.,71
10,.461 48.27 11,100 50.60 39,100 48,,52 211 1.02 203 .,9-1 Ih8 1.11
21,670 10OcOD 21~934 100 .. 00 61!655 100.00
Because of rounding, columns do not always add Ul) to totals.
19[!-8 Janunry-July Value ~ of total
182 0.36 12,497 24.52
21,963 43.10 16.030 31.46
284 o.c;6
50.95.3 lOOeOO
16 0.04 1,709 4.14
11,427 27.67 27,994 67.79
148 o. 36~
41,295 100.00
Source: Ministere des Affaires Economi~ues et des Classes Moyennes lnstitut National de Statistique.

• • TABLE :{
EXDort3 of the 391g:!-Luxembourg Eccnomic Union
(Values in millions of Belgian frencs)
I. Live animals and animal products II. Vegetable products
III. Fats and oils of all types1J IV. Food products, dri~~s, 1i~uids
vinegar and tobacco V. lJiineral products, i.e., iron ore
1I. Chemic81 and pharmaceutical products
VII. Leathers, furs and skins and products thereof
VIII. Rubber and rubber goods IX., Wood and cork 8nd wood and cork
products x:.. Paper and paper goods ~~ Textiles and textile products
Ready made clothes XII. Shues, hats and parasols and
articles de mode XILf .... \Yorks in stene and other minerals
Glass and glass1siTare XIV. Pearls, precio~s stones, precious
mete.1s and vJorks of same, money XV. Metals and metal ~nods
A-VI. i18.chines ~IJ.d apparatus, electrical material~ ~
XVII. Transport materials-"-I
VBlue
1,874 1,852
13
467 2.727
1,483
4,12
138
140 347
2,1~0
213
y 1,289
498
W 5,706
1.2.80 402
19'38 "". to t'f Total
8.7 8.5 0.1
2.2 12 0 6
6 .. 8
1.9 0.6
0.6 1 0 6 9.9 1,,0
5.9 2.3
26.3
5.9 1.9
Vsllle
1,274 2,298
8
11:'6 ...-.J
2,14-7
2,343
129 79
164 671
3,165 Z41
2! 2,685
941
1JJ 9.907
2,233 243
1946 ,,~
~0 of Tot~l
4.-3 7.7 *
11t2 7.2
7.9
0.4 0.3
0,,6 2.3
10.7 0.8
9.1 3.2
33.4
7.5 0.8
__ ..=.19!±2 Value % of Total
3,294 4,121
36
436 4.907
5,489
293 347
282 1,282 8,258 1,005
2/ 2,706 2,147
!Jj 19,763
4.726 946
5;3· . 607 0.-1-
0.7 7.9
8.9
0.5 0.6
0.5 2.1
13.4 1.6
4.4} 3.5)
32.1
7.7 1.5
- continued
194-8 January- Septembe r VR.llle <% of Total
h27 1,802
189
329 3,'392
5,079
390 311
246 671
10,086 }j
113 1,880
1,751 20,580
LL.,093 1,761
0.8 3.4 0.4
0.6 6.,3
9.5
0.7 0.6
0.5 1.·2
18."8
0.2 3.5
303 38.3
7.6 3.3

• • T}..J3LE X -- PHge 2
1)48 1~38 1946 ~ Janu8ry-September
Value X of Total Value % of Tot 81 VAlue ~ of Total Value % of Total
XVIII •. ' (Clocks: scientific and preci sion instruments
( lviusical il1strumegys XIX. Arms and munitions~ xx. rJii scellaneous (not elsov!here men
tioned) XXl. Objets dfart
Totals
10 2
256
411
21,670
Totals do not add because of rounding.
0.1 21 • 9
1.2 129
lc9 611 ------.~-
29,654
0.1 45 0.1) 84 . 0.2 * 26 * )
0.4 297 0.5 352 0.7
201 1,204 1.9 40 Of'l 13 *.
61,609 53,658
Note: The system of classification was changed slightly in 1948 after the Benelux Customs Union went into effect. obvious incongrui ti(;l s in clas sificat ion are noted belo\-l.-
11 It is uncertain v.lhether or not these classifications incIude precisely the same goods in 1948 and previous
2J JJ !±/ 5./ §j
*
years fI
Included under the heading ready made clothes. In 1948. reedy made clothes are divided between textile goods and shoest hats, etc. In 1938, 1946 and 1947 tIlere is no cla.ssification similar to this. Prior to 1948, railroad materials and trains Vlere included in the classificEtion machines and apparatus. 1948 these have been included uith other transport :naterials. Prior to 1948, t:his classification onlv includes arms.
Less than one-half of one-tenth percent.
In
SO\l.rces: Annuaire Statistir::.ue de la Belgir;..ue et duo Congo BeIge 1946, Bulletin de Statistir:;.ue, and Bulletin Hensuel du ConEaerce de 1 'Union Economi,-:.ue J3e1go-Luxembourgeoise avec les Pays 3trangers.- September 1948.

• • TABLE X (Continued)
I:r.rpol'ts of the 3el£:o-LU:,,8r:tbourg ?:conomic Union
(Values in millions of Belgian francs)
I.. Live animals and animal pro duct s II.. Vegetable products
III .• Fats and oils of all types'V 1V_ Food product s ... drinks" liq,uids,
vinegar~ tobacco V-. iviineral products, i .. e •• iron ore,
coal, etc. VI~ Chemical and pharmaceutical pro
ducts :v.Il.~ Leathers, furs and skins and goods
thereof VIII. Rubber and rubber goods
IX. Wood and cork and productr of vlood and cork
x.. Paper and paper goods XI. Textiles 2nd textile products
Ready made clothes XII ~ Shoes., hats and parasols)
articles de mode ) XIII. ~iorks in stone and other minerals.
pottery Glass and glassware
XIV.. Pearls, l?recious s-'Gones, precious metals 8.nd 'lrlorks of same; moneys
XV. Metals and metal goods
___ l.9.18 Value % of TotRl
2,745 5,842
17
1,149
4,952
820
162 72
781 591 698 175 Y
227 53
~ 2,402
11.9 2503 0.1
5.0
21.5
3.6
'0.7 0.3
3.4 2.5 3.0 0.3
1.0 002
10.4
1946 Value % of Total
6,479 8,858
'111
5,939
7,939
2,147
603 238
1,270 1,836 2,615 1,200
£/
331 117
!±J 4,225
12·.3 16 .. 9
0.,2
11.3
15.1
401
1.1 0.-5
2.4 305 5 .. 0 2.3
0.6 0 .. 2
8.0
1947 V.9.1ue % of Tot8..l
9,284 16,288
1 1"),., t:..(
7,363
13.4)6
3,193
915 594-
2,172 2,596 4,189 2,306
Ed
514 282
!±/ 7,564
10.9 19.0 0.1
8.6
15.7
3.7
1.1 0.7
2.5 3.0 4.9 2.7
o.~) 0.3)
8.8
- continued
1948 JanunrY-September Value % of Tot~l
5,.560 8.8q'5 1~119
3,744
10,443
3,026
1,115 484
1,78() 1,648 8,738
JJ. 250
648
5,788
8.5 13.-5 1.7
5.7
16.0
4.6
11,7 0.7
2.7 2.5
13.4
0.4
1.0
8.9

.I:V1 0 J.~~?-chines er;.cl ap i?ar3tus. electrical materialss...
XVII •. Transnort ~aterie~s2J XVIII. (Clocks: scientific and :pr~cision
instruments ._ _ (Musical ins~~mel1tt, AIX. Arms and mun]. tJ.ons QJ
XX. Miscellaneous (not else"There in-cluded)
.XXI. Objets dtart
Totals
• Value
1,231 722
120 20 19
272
23.069
Totals do not add because of rounding.
• TABI,m X (Continued) - page 2
1918 1246 9~ of Tot~l VBlue % of TotAl
5.3 1-1-,425 8.4 3.1 2,535 4.8
0.5 534 1 0 0 0.1 55 0.1 0.1 2 * 1.2 1.103 2.1
52,562
1948 _ 1247 J8nuary-Se~tember
VFl1ue ~ of Total Value % of Total
6.546 7.7 5,307 8.1 5,442 6.4 3,893 6.0
773 0.9) 768 1.2
85 0.1) 4 * 2ll *
1,854 2.2 294 * 22 0.4
85,527 65,)44
l~ote~ The system of classification ;:!as changed slightly in 1948 after the Benelux Customs Union ':Jent into effect. Obvious incongruities in classification are noted belo\.,.
11 Y 11 !±J 51 §j
•
It is uncer·tain 1t.Jhether or not these classifications include precisely the same goods in 1948. and previous years.
Incl-u.ded under the heading ready made clothes. In 1948, ready made clothes are d.ivided beti:Jeen textile goods and shoes, hats, etc. In: 1938, 1946 and 1947 there is nc classification similar to this. Pr.io~ to 1948,. railroad IDeterials and trains v!ere included in the c18ssifiC8tion ~achines and ap1?2rC'tus.. In 1948 .-
these have been included VJi th other transport materials. Erior to 1948. this classification only includes arms.
Less than one-half of one--tenth percent •
Sources: Annuaire Statisticue de la i3elgiClue et du Congo BeIge 1946 t Bulletin de Statisti(:.ue, and Bulletin Mensuel du Commerce de 1 'Union :.;;'conomi':118 Belgo-Luxembourgeoi se avec les Pays Etrangers. September 1948.

'rJ$1E X~
Belgia~ Gold ~~ Fore~gn ~):c.h&~~_Ho~~M..
(millions of U.S. dollars)
National Ban.1<: Treasury Short Tern:
End of --ForeIgn- Assets in Period Gold Exchang~_ Total Gold Total _:the .~.~ ~?_!.. __ -- ,.~.--
1937 765 765 63 633 1938 729 C) 738 44 782 ".
1939 714 2 716 17 733 159 19hL 732 1'1 7~-5 17 762 12h 19·4;; 716 84 800 17 817 185
• 1946 735 139 874 874 160 1947 597 291 868 688 125
1948 - January 593 311 90J.j. 90L~ 12h February 578 294 673 873 126 March 591 312 903 903 149 April 606 288 89L~ 89h 123 lJlay 615 287 ~~Ol 901 134 June 622 284 906 906 125 July 637 263 901 901 122 August 643 269 912 912 11h September 6h3 272 915 915 117 October 6h4 239 933 933 ... November ;~4 b ..... 297 931 931 • ••
• Source: Interna.tional Financial Statistics

•
•
TABLE XII ----.-. ... ,,-.-...,.
Total Interest and i~mortization Payments , ~xter~a~Deb~ of~Belgium
on
(Expressed in ~housands of U.S. dollars)
U.S. Canadian Swiss Swedish Dutch T Grand :!'~
Dollars Dollars Francs Kroner Florins S~~£~1-ng Tot.:-;.l I ..
1949 26,991 L,.,076 2,478 319 279 2,723 36,C66 1950 20,979 4,009 2, L~78 319 279 2,723 30,?37 19S;1 23,090 ~ 94'" 2,478 319 279 2,723 32,531 ..-, .-1952 23,217 3,875 2,478 319 279 2,723 32,691 195'3 18,711 3,808 2,L.78 319 279 2,723 28, ~13 1954 14,345 3,741 2,478 319 279 2,723 23,[;85 1955 lL~ . L~16 3,674 2,h78 319 279 2,723 23, Sa9 1956 14~913 3,607 2,LL7S 319 ?.79 2,723 2LI,319 1957 15,743 3,540 2,L78 319 279 2,723 ,...c 08" t:../ , t...
1958 16,419 3,Lt73 2,478 319 279 ?,723 ?S,691 1959 16,225 3,h60 2,478 319 279 2,723 2c:' l.Q4 -,J, ,'.1 1960 16,05'4 3,339 1,,23~ 319 279 2,723 23,:75.3 1961 15,880 3,272 319 279 1,627 21,377 1962 15,693 3,20.5 279 1,627 20,o04 1763 15,506 3,138 279 1,627 20,550 1964 15,320 3,071 279 1,627 20,297 1965 15,131 3,004 279 1,(;27 20,01..\.1 1966 11,944 2,937 279 1,627 16,787 1967 11,862 2,8ho 279 1,627 16,608 1968 11,781 2,803 279 1,627 16,490 1969 11,698 2,736 279 1,627 If),3LO 1970 11,616 2,669 279 1,627 16,191 1971 11,.533 2,602 279 1,627 16, oL~l 1972 11, l~.52 2,535 279 1,627 15, ~'93 1973 11,369 2,468 279 1,627 15,?4.3
Note: In addition to the ECA loan already g.cantej C';:h7 million), it heB been as sumed that furthe r loans of s:,40, ·.;;>35 and '1I;3!) milli.on v,-ould be granted in the remaining years of the ERP.
Source: IBRD"
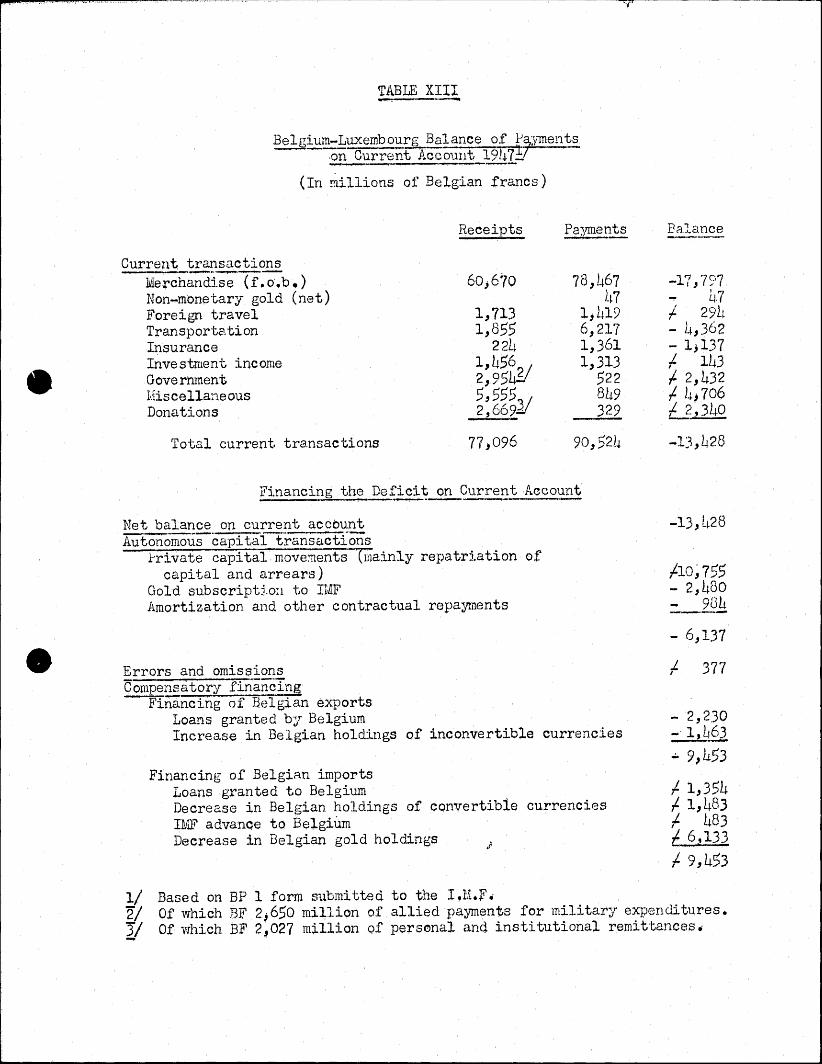
•
•
TABLE X!li
Belgium-Luxembo~rg Balance of }'7:ymel1t~ £.n Current ACf:!OUllt ~91+1!
(In ~illions of Belgian francs)
'"#'
Receipts Payments
Current transactions M~rchandise Tr. 0'. b. ) 60;6·70 78, L~67 Non-monet.ary gold (net) }.~7 Foreign travel 1,713 1,419 Transporte.tion 1,855 6,217 Insurance 224 1,361 Investment income 1,456 / 1,313 Government 2,954£ 522 klisce11aneous 5,555~/ 849 Donations 2,662.~ 329
Total current tra.nsactions 77,096 90,521+
Financing the Defici~ or:.....Current Acco~nt
Net balance on current account Autoriomo-uscapi tai'traDSact:Lons
rrivate capital move:nents (1l1ainly repatrj.ation of capital and arrears)
Gold subscriptto:l to TIviF Amortization and other contractual repayments
Errors and omissions Compensatory financing -"FInancing of Belgian exports
Loans granted by Belgium Increase in Belgian holdings of inconvertible currencies
Financing of Belgian imports Loans granted to Belgium Decrease in Belgian holdings of convertible currencies Ib~ advanGe to Belgium Decrease in Belgian gold holdings
Balance .....--_ .. _--
-17,797 ~ ~.7
t
f 29h - 4,362 - 1,137 I- 143 .j. 2,432 .j. 14-; 706 [1,340
-13,428
1-10;755 - 2,h80 _?~h
- 6,137
f. 377
- 2,2.30 - l,Lj63 --.-.--.:. 9, h53
.;. 1,354
.;. 1,h83
.;. 483
.;. 6,133
.j. 9,453
1/ Based on BP 1 form s1.lbmi tted to the I ,H.f. 2/ Of which BF 2.650 mi~lion of allied payments for military expenditures. II Of vn1ich BF 2~027 million of personal anq institutional remittances.
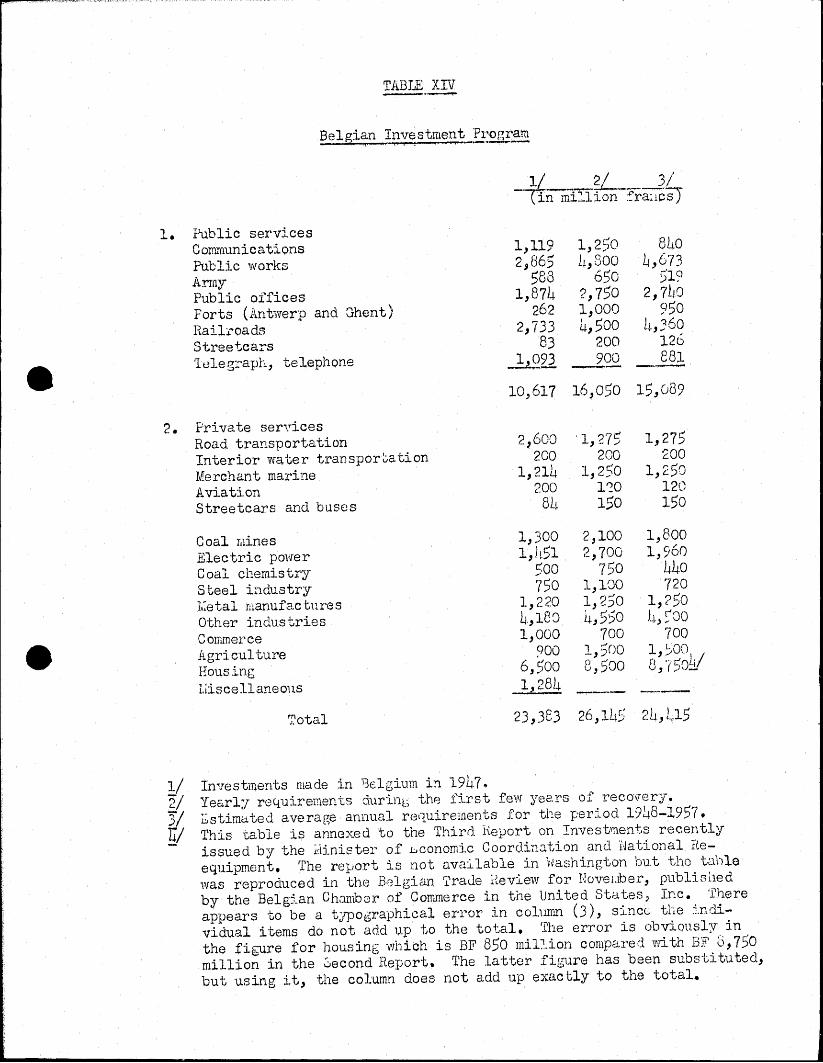
•
•
TABIE XIV
Be1gi~n Investment 'f):ogr~
1. Public services Communications 1,119 1,250 840 Public works 2~865 h,GOO ~,673 Army 588 650 )1? Public offices 1,874 2,750 2,7Lo Forts (Antwerp and Ghent) 262 1,000 950 Hail:c'oads 2,733 4,500 II ~60 r...,., ....
Streetcars 83 200 126 leleg:.n aph, telephone ..h293 --2.00 _e8~
10,,617 16,050 15,089
2. Private ser,\1'ices Road transportation 2~600 '1 ?7 C 1,275 ,- ./
Interior wa,:ter tl"anSpOr0a tion 200 200 200 Merchant marine 1,214 1,2)0 1,250 Aviati.on 200 1'20 12G Streetcars and busos 8L~ 150 150
Coal rllines 1,300 2,100 1,800 Electric power 1,h51 2,700 1,96() Coal chemistry Soo "150 440 Steel iadustry 750 1,lGO 720 Iv:e tal manufac ture s 1,220 1,250 1,?50 Other • 1 J.. • ~., 18C) 1.j.,550 l.~, ~QO lnc.uS : ... rl8S Commerce 1,000 700 700 Agriculture ?OO 1,SOO 1, ;/00
Hous.ing 6,500 8,500 n ";C:OLI/ v,I/\ _
I.liscellaneous _ 1, 28L. --- ----r;?otal 23,3f3 26, lL~5 24,L15
1/ Investments made in 13€lgium in 1947. ';),-1 Yec~rl:T r04uirements during the first few yecY's of recovery_ 3/ I;stimated average annual requirements for the perj.od 1948-19S7, Y This table is annexed to the 11hird lteport on Invest1uents recently
issued by the ~.jj.nister of L,conomic Coordi:a:::.tion and iJatio;'1al Heequipment. (The rel10rt is not available in v~ashington but tho t(1)le was reproduced in the Belgian r.i:raue i~eview for Nov6uber, published by the Belg:tan Chamber of Conrmerce in the United States, Inc. 'There appears to be a t':lPo~raphical error in col.umn (3), since tiLe :Lndividual items do not add up to the total. The error is obviously in the figqre for housing vrhich is BF 850 mil:'.ion compared 'wi th BF 0,750 million in the 08cond Report. The latter figure has been substituted, but llsing it, the column does not add up exactly to the total.