public disclosure authorized manufacturing- services nexus · 2018-06-05 · manufacturing-...
TRANSCRIPT

Ethiopia Economic Update
THE INESCAPABLE MANUFACTURING- SERVICES NEXUS:
Exploring the potential of distribution services
Pub
lic D
iscl
osur
e A
utho
rized
Pub
lic D
iscl
osur
e A
utho
rized
Pub
lic D
iscl
osur
e A
utho
rized
Pub
lic D
iscl
osur
e A
utho
rized


Acknowledgements
The report was prepared by a team consisting of Mesfin Girma
Bezawagaw (Senior Economist), Nora Dihel (Senior Economist), Michael
Geiger (Senior Economist) and Zerihun Getachew Kelbore (Research
Analyst)) with input from Claire Honore Hollweg (Economist), Esteban
Rojas, Gonzalo Varela (Senior Economist), Michael Jelenic (Consultant),
Koen Maaskant (Consultant), Jamie MacLeod (Consultant). Jean-Pierre
Chauffour reviewed the report. Tsebaot Bekele Habte (Team Assistant)
provided assistance with formatting.
Mathew Verghis (Practice Manager, Macroeconomics and Fiscal
Management) and Carolyn Turk (Country Director for Ethiopia, Sudan
and South Sudan) provided overall guidance. The team wishes to thank
peer reviewers Bill Battaile (Lead Economist), Paul Brenton (Lead Economist)
and Poonam Gupta (Lead Economist) for their constructive input. Additional
comments were received from Tom Bundervoet (Senior Economist) and
Richard Spencer (Program Leader). Comments from the Ministry of Finance
and Economic Cooperation are gratefully acknowledged.
The team would also like to express gratitude to Cybil Maradza (Consultant)
for the design and layout.
The World Bank team welcomes feedback on the Ethiopia Economic Update.
Please send comments to Nora Dihel ([email protected]) and Zerihun
Getachew Kelbore ([email protected]).
i

Table of Contents
Acknowledgements ..................................................................................................
List of Figures ............................................................................................................
List of Boxes .............................................................................................................
List of Tables ...............................................................................................................
Executive Summary ...................................................................................................
Recent Economic Developments and Outlook ............................................................
Economic Developments in FY2017 .............................................................................
Economic Prospects in FY2018 and Beyond ...............................................................
Services and Manufacturing Linkages: Exploring the Potential of Distribution Services ......
Introduction .............................................................................................................
Setting the Stage: Services in Ethiopia’s Economy .......................................................
Potential of Distribution Services ................................................................................
Recommendations for the Future of Distribution Services ...............................................
Annex A: Problem-Driven Political Economy Analysis ..................................................
References ..................................................................................................................
Economic Activity ........................................................................................
Monetary Sector ............................................................................................
Fiscal Sector ..................................................................................................
External Sector ............................................................................................
Financial Sector Indicators ...........................................................................
Economic Outlook: Selected Projections to 2019 ..........................................
Sectoral Contributions to Ethiopia’s Economy ................................................
Employment by Sector and Labor Productivity ...............................................
Services Value Added and Employment Shares in Ethiopia ............................
Shares of Services in Total Exports, 2005 and 2015 ......................................
Ethiopia’s Services Exports and Imports, 2013–15 27 ....................................
Traditional and Modern Services Exports and Imports versus GDP per Capita,
2013–15 ......................................................................................................
Services’ Export Share (Gross Value, Direct Value Added, and Total Value Added
Considering Forward Linkages) versus Level of Development, 2011 ..............
Composition of Services Value Added (Forward Linkages), 2011 ...................
Composition of Manufacturing Value Added (Backward Linkages), 2011 .......
11.11.2
22.12.22.32.4
Figure 1.1Figure 1.2Figure 1.3Figure 1.4Figure 1.5Figure 1.6
Figure 2.1Figure 2.2Figure 2.3Figure 2.4Figure 2.5Figure 2.6
Figure 2.7
Figure 2.8Figure 2.9
i
ii
iii
iii
iv
1
2
18
24
25
26
38
76
82
86
3
6
9
14
17
21
27
28
28
29
30
30
33
34
34
List of Figures
ii

The Promise of Devaluation and Relaxation of Foreign Exchange Controls ....
Take-Off in Electricity Exports ......................................................................
Ethiopia and the East Asian Model: Similarities and Differences .....................
Measuring Services Linkages ........................................................................
Players in Ethiopia’s Retail Grocery Business .................................................
ALLE Struggles for Relevance .......................................................................
The Bottom of the Pyramid Penalty ...............................................................
Typical Explicit Trade Barriers and Regulatory Obstacles Affecting ..................
Benefits of Contractual Arrangements ..........................................................
Dairy and the Fasting and Rainy Seasons in Ethiopia ....................................
Ethiopian Sesame Competitiveness through the Eyes of an Exporter ...............
Strategies for Reforming Distribution Services ...............................................
Distribution Services Political Economy Conceptual Framework ......................
Summary: Ethiopia Compared with Selected Indicators in East Asia ...............
Composition of Domestic Services Inputs in Manufacturing Production,
by Country, 2011 ..........................................................................................
Composition of Domestic Services Inputs in Manufacturing Exports,
by Country, 2011 ..........................................................................................
Composition of Services Value Added in Manufacturing,
by Sector in Ethiopia, 2011 ............................................................................
Composition of Services Value Added in Manufacturing Exports,
by Sector in Ethiopia, 2011 .............................................................................
Inputs into and from Productive Sectors in Ethiopia, Based on the World Bank
Export of Value Added Database for 2011 ........................................................
Figure 2. 15 Inputs into and from Productive Sectors in Ethiopia, Recalculated
Based on the Input-Output Table for Ethiopia for 2011 .................................
Role of Distribution in Value Chains .............................................................
Dairy Value Chain .........................................................................................
Supply Chain of Teff in Ethiopia ...................................................................
Teff Price Structure, by Quality, October to November 2012 ...........................
Supply Chain of Sesame in Ethiopia .............................................................
Yield of Sesame in Major Sesame-Growing Countries, 2007–13 ...................
Supply Chain of Textiles in Ethiopia ..............................................................
Box 1.1Box 1.2Box 1.3
Box 2.1Box 2.2Box 2.3Box 2.4Box 2.5Box 2.6Box 2.7Box 2.8Box 2.9
Box A.1
Table 1.1
Figure 2.10
Figure 2.11
Figure 2.12
Figure 2.13
Figure 2.14
Figure 2.15
Figure 2.16Figure 2.17Figure 2.18Figure 2.19Figure 2.20Figure 2.21Figure 2.22
12
19
22
32
39
40
42
43
53
59
71
79
83
23
35
36
36
37
38
38
49
56
63
66
68
70
73
List of Boxes
List of Tables
iii

ExecutiveSummary
iv

1. Ethiopia’s gross domestic product (GDP) growth is estimated to have rebounded to 10.9 percent in FY2017¹. According to official
statistics, Ethiopia’s annual rate of economic
growth, which averaged 10.3 percent over
2005/06–2015/16 (compared with the regional
average of 5.4 percent), slowed to 8 percent in
FY2016 due to drought-related lower agricultural
production. With agricultural recovery, gross
domestic product (GDP) growth rebounded in
FY2017. The pursuit of prudent fiscal policy – with
a fiscal deficit at 3.4 percent of GDP - should help
keep inflation under control, providing monetary
conditions remain tight in the aftermath of the
devaluation of the Birr in October 2017. Key
challenges relate to poor export performance
(Ethiopia’s growth has been driven by investment
followed by private consumption) and weak
trade balance, which reflect the lack of external
competitiveness and the vulnerability to terms-
of-trade shocks. The rising risk of external debt
distress may affect Ethiopia’s access to external
finance. These developments require continued
policy adjustment to crowd-in the private sector
and strengthen Ethiopia’s competitiveness.
2. How sustainable is Ethiopia’s growth model? To answer this question, part 1 of
this Economic Update, on recent economic
developments and outlook, discusses Ethiopia’s
growth strategy, emphasizing the sustainability of
the country’s investment-focused and export-led
growth model. Part 2 looks at the interlinkages
between manufacturing and services, with a
special focus on the role of distribution services²
in promoting Ethiopia’s export competitiveness
and eventually its structural transformation.³
World Bank estimated growth at 8.4 percent, while
the IMF estimated growth at 9 percent in 2016/17.
In the WTO Services Sectoral Classification List
(MTN.GNS/W/120), largely based on the United
Nations Provisional Central Product Classification,
the distribution sector is defined to include four
major services: commission agents’ services,
wholesale trade services, retailing services, and
franchising. Commission agents are distinguished
from the other categories in that they trade on
behalf of others, that is, they sell products that are
supplied and usually owned by others to retailers,
wholesalers, or other individuals. Wholesale
trade services consist in selling merchandise to
retailers; industrial, commercial, institutional,
or other professional business users; or other
wholesalers. Retailers sell goods for personal or
household consumption. Franchisers sell specific
rights and privileges, for instance, the right to use
a particular retail format or trademark, defined as
retail sales of motor vehicles and fuel (ISIC rev 3.1
G50), retail trade in all other goods, and repair of
personal and household goods (ISIC rev 3.1 G52)
through specialized and nonspecialized outlets
of all dimensions (traditional stores, department
stores, supermarkets, and hypermarkets). Hotels
and restaurants are excluded.
Traditional definitions of structural transformation
emphasize the reallocation of production factors
or resources between sectors. The traditional view
considers structural change to be fundamentally
dependent on modifications in the relative
importance of different sectors over time, as
measured by their share of output or employment.
More recent literature on structural transformation
stresses the positive role of productivity growth
within sectors through the reallocation of factors of
production between firms within sectors. Structural
transformation defined as movements of factors
of production between firms and reallocation of
resources from lower to higher productivity activities
within the same sector, means that improvements
and shifts in production within each sector are
an important element of development, and that
transitioning from an agricultural to manufacturing
is not the only avenue as traditional development
views suggest. It means instead increasingly
embracing higher value-added production or
more productive activities in the same sector or type
of commodity or transitioning from the informal
production to formal activities with the assistance
of more technology, services, and know-how as
well as better linkages to input and output markets.
¹
²
3
v

Part 1:Recent Economic Developments & Outcome
vi

Providing macroeconomic policies remain appropriately tight and efforts are made to strengthen external competitiveness, the economy is expected to move toward a more sustainable path.
3. Real GDP growth is estimated to have picked up to 10.9 percent in FY2017 (July 2016 to June 2017), mainly due to a recovery in agricultural production after last year’s drought. The crop harvest is estimated to have
increased by 7.9 percent during the FY2017
agricultural season (compared with a 2.4 percent
increase during FY2016) and to have generated
positive spillover effects on the industrial and
services sectors, which continue to account for
most of the growth from the supply side. On the
demand side, growth has remained driven by
government consumption and investment. The 15
percent devaluation of the Birr in October 2017
is expected to sustain exports in the medium term
and improve the external balance, providing the
exchange rate correction pass-through on inflation
is contained and structural bottlenecks to trade
are addressed.
4. Inflation in FY2017 remained in single digits, although end of year inflation increased by 1.3 percentage points as compared to FY2016. The relaxation of
monetary policy, measured by the growth of
reserve money prior to the devaluation of the
Birr in October 2017, has triggered inflationary
pressures that have been repressed under
allegedly consumer protection measures. Annual
inflation as measured by the Consumer Price index
(CPI) increased by 13.4 percent in January 2018
(as compared to January 2017). The monthly CPI
decreased by 0.4 percent between December
2017 and January 2018.
5. The federal government’s fiscal policy embarked on a moderately expansionary stance in FY2017. The increase in fiscal
revenue, mainly from nontax sources, is unlikely to
compensate for the increase in total expenditure.
The federal government’s fiscal deficit is estimated
to have increased to 2.9 percent of GDP in
FY2017.
6. Ethiopia’s export sector remains particularly small. Total goods and services
exports do not exceed 10 percent of GDP,
significantly below the 24 percent expected
from a country the size of Ethiopia at its level
of development. The improvement in the trade
balance was driven by a slowdown in imports
rather than an acceleration in exports. This export
underperformance is mainly due to structural and
competitiveness issues, including an overvalued
exchange rate.
Economic Developments in FY2017
vii
7. Given increased vulnerabilities due to export weaknesses and faster-than anticipated disbursements of non-concessional loans, Ethiopia’s external debt situation will become difficult in the medium term. Ethiopia’s risk of debt distress
was downgraded from “moderate” to “high” in the
2017 DSA following the significant and protracted
breach of two external debt burden thresholds.
8. The economic prospects for FY2018 and the medium term should remain stable, although less spectacular than during 2005/06–2015/16. Annual real GDP
growth is projected to hover around 8 percent in
FY2018 and the medium term. The government’s
macroeconomic policies are expected to remain
sound, with moderate fiscal deficits and prudent
monetary policy. Although the rate of inflation
should remain in the single digits, the inflation
differential with competitors may widen and need
to be corrected appropriately to preserve Ethiopia’s
external competitiveness. On the upside, foreign
direct investment inflows supported by incentives
and ongoing development of industrial parks are
expected to boost the manufacturing sector and
The deterioration in debt indicators was mainly
due to poor export performance, but there was a
significant improvement in debt policy over the year.
In July 2017, Bank Sr. Management approved the
decision of the NCBP committee to discontinue the
remedies applied to Ethiopia’s IDA17 allocations,
while retaining a $400 million ceiling on such
borrowing in FY18. Performance under the NCBP
ceiling will be reviewed in April 2018.
the country’s export capacity. On the downside,
the economy will remain vulnerable to the risk
of an overvalued exchange rate and limited
progress with structural adjust ments. The main
challenges to the economy are related to the
weak performance of the tradable sector, which
reflect the lack of external competitiveness and the
country’s vulnerability to terms-of-trade shocks.
A larger and stronger private sector would seem
to be the main response to strengthen Ethiopia’s
trade competitiveness and resilience to shocks.
The authorities are counting on the expansion
of the private sector, especially through foreign
investments in the industrial parks, to make
Ethiopia’s strong growth momentum more
sustainable.
Economic Prospects for FY2018 and beyond
viii

Part 2:Manufacturing
-Services Nexus: Exploring the Potential
of Distribution Services
ix

9. The focus section of this edition of the Economic Update deals with the interconnection between services and manufacturing performance. The report aims to
invigorate and deepen the discussion about the role
of services in Ethiopia’s exports, as directly tradable
activities and intermediate inputs to manufacturing
exports. At the government’s request, the focus is
placed on the analysis of one category of services—
distribution services—and in particular the role of
these services in the dairy, teff, sesame, and textiles
value chains. The broader context for this analysis is
the debate on growth and structural transformation
and ways to advance the government’s export
development agenda.
10. As in other countries, services matter for Ethiopia’s economic growth and development. The performance of the services
sector is an important indicator of the performance
of the economy as a whole and the export sector
in particular. Yet, many modern services remain
underdeveloped in Ethiopia. Services that are
considered strategic by nature are allowed to
operate only as strict public monopolies (for
example, the telecom, utility, and air and sea
transport sectors) or through limited domestic
private ownership (for example, the financial sector).
Other services sectors, such as professional services
or health services, are not valued to the extent of
their potential contributions to competitiveness and
value addition. They have not been considered a
strategic priority and have seen limited reform.
Traditional services, such as distribution services,
tend to operate in a heavily regulated environment
that prevents competition and innovation, including
by prohibiting the presence of foreign services
suppliers and investment. According to the World
Bank Services Trade Restrictiveness Database,
Ethiopia is completely (100 percent) closed in retail.
This is in contrast with most examined countries
including most restrictive countries such as India
and Indonesia, which despite harsh foreign equity
restrictions4 permit some foreign participation in
the sector.
11. With a contribution of around 14 percent to GDP5 in 2015/16, distribution services are an important driver of growth in Ethiopia. Distribution services also represent a
crucial link between suppliers and producers. With
improved efficiency and higher productivity due
to the emergence of larger supermarket chains
and a possible internationalization of distribution
in Ethiopia, the sector has great potential to
benefit producers and consumers and contribute
to increased food security and alleviation of
rural poverty. Modern distribution channels and
procurement systems that reduce transaction costs
and facilitate market exchanges can increase the
access of small farmers to high-value markets and
accelerate their transition from subsistence farming
to market participation. For consumers, organized
markets can provide substantial benefits, including
better quality products at affordable prices. So
far, however, modern distribution channels have
failed to capture a large portion of the retail
market in Ethiopia. Across the country, informality
still prevails; small-scale farmers have found
themselves marginalized by the distribution sector
and its new practices; and very poor households
often pay more per unit for basic products than
wealthier households.
12. Despite the growth of distribution services over the past decade, several factors jeopardize its potential to contribute more directly or indirectly to Ethiopia’s export performance. Yet, many factors tend
to impede the positive contribution of distribution
India imposes a FDI cap of 51 percent on multi brand retail trading while 100 percent FDI is allowed for single brand
product retail trading. Indonesia requires 100 percent local capital for small scale retailers.
This share compares favorably with neighbors in East Africa, where distribution services accounted for between 8 and 18
percent of GDP over the past decade.
4
5
x

services, including, among others, a high degree
of informality across the sector, poor access to
finance, explicit trade barriers that fragment
markets and supply chains, nontariff barriers
related to standards and rules of origin, domestic
regulatory measures governing market access
and producer conduct, talent shortages, poor
infrastructure, and limited market data.
13. The case studies on the role of distribution services in the dairy, teff, sesame, and textiles value chains show that although distribution services are
critical in the performance of each value chain, they are only one part of the story. Eliminating the obstacles to distribution services
could help link rural producers to markets for
inputs, facilitate the sale of raw milk, or reduce
post-harvest and storage losses. But other binding
constraints, such as limited access to finance or lack
of skills, would need to be addressed in parallel for
distribution services reforms to benefit consumers
and facilitate value chains climbing into higher
value-added activities (such as cheese or sesame
oil) and increase exports.
14. The case studies draw conclusions on the critical role of services in manufacturing value-addition of broader relevance and implications.
First, the services sectors suffer from being treated in isolation and not as part of an interconnected
chain of value addition, from production to final consumption. Yet, the case studies presented
in this report show that since supply chains are a series of linked international markets for
goods and services, with policies in one market having spillover effects in other markets along
the whole value chain, services should be considered at par with manufacturing, to achieve
the desired export performance. Policy formulation needs to deal with the goods and services
markets together, as there are significant links between the two sectors. Moreover, such links call
for modal neutrality—trade and regulatory policies that enable services firms to provide services
through all modes of supply without impeding a switch from one mode of supply to another.
Second, that many services are now tradable and can be a source of export-led growth and
export diversification has not sufficiently captured the attention of Ethiopian policy makers. This
may reflect that the development of modern services is a relatively recent phenomenon, and
also the assumption that the comparative advantage of a low-income country like Ethiopia
lies in agriculture and labor-intensive manufacturing. Although Ethiopia’s services exports are
currently dominated by traditional services such as transport or tourism, exports of modern
services, such as communication or business services, are beginning to emerge and their role
in export diversification and export earnings should not be neglected.
Third, there is a genuine concern among policy makers that the state of regulation and the
regulatory capacity of the administration are too weak to allow for the further liberalization
of services. And finally, there is a worry that opening services sectors that operate under a
monopoly would lead to declines in government revenue and potentially more outflow of
foreign exchange in the form profit repatriation.
xi

15. Although a wholesale services policy reform in Ethiopia’s current environment would be neither feasible nor desirable, there are several steps that could usefully be taken to increase economic efficiency and support the country’s development objectives. Countries throughout the region are
moving toward integrating their services markets.
There may be long-term costs to Ethiopia if it is
left behind in services, but also manufacturing
and processed agricultural products. Starting by
reforming nonstrategic sectors, such as distribution
services, could be a good entry point into the world
of services reforms.
16. The case of distribution services is illustrative of the opportunities for exports, benefits from greater services openness, and policy reforms and approaches that will be required for these to be realized. This sector can provide the basis for a broader discussion of services
trade policy reforms. Although the following list is not exhaustive, it provides some initial guidance for
reform in this important sector.
Raising awareness about the importance of distribution services for the formal and informal
sectors in Ethiopia is an important first step in designing a comprehensive reform strategy that
is linked with national development plans.
Addressing the concerns of the poorest households and facilitating the inclusion of smallholders
in modern distribution chains should be a priority in Ethiopia. Measures could include the
creation of organized market outlets for small-scale operators to encourage their graduation
from the informal sector, better access to financial services in the informal sector, and support
to traditional and informal operators to acquire market-relevant skills.
Taking steps to relax explicit trade barriers, eliminate regulatory obstacles, and address
informality issues. With distribution services closed to foreign participation, Ethiopia remains
behind all East African countries and other comparators in removing explicit trade barriers.
Opening up the sector to foreign competition, would benefit consumers and provide incentives
for the development of more competitive local suppliers, and would clearly raise welfare in
the country if liberalization was accompanied by strategies for easing adjustment of local
stores that might be undermined by the entry of modern retailers. Reforms should also focus
on developing the necessary regulatory frameworks, including rules and regulations affecting
the business environment, eliminating disproportionate entry requirements such as lengthy
registration procedures, multiple licenses, or inadequate zoning regulations. Price controls
represent a serious impediment to competition and quality and should be removed.
xii

Services matter greatly for Ethiopia’s industrial ambition
17. Guidance on the implementation of reforms could be provided by an in-depth political economy analysis that looks at the
local stakeholders and global operators, to help identify the feasible measures with the greatest benefits.
Addressing infrastructure constraints (such as roads, ports, and so forth). Steps must be taken
to address the infrastructure and insecurity concerns raised by the business community.
Addressing skills issues in the distribution sector. A strong distribution sector will require local
know-how and talent. Developing local training programs and putting in place apprenticeship
opportunities will be critical to achieving long-term success.
xiii

1 Recent Economic Developments &Outlook
1

Real Sector
1. Real GDP growth was estimated at 10.9 percent in FY20176 (July/June), mainly due to a recovery in agricultural production after last year’s drought (figure 1.1, panel
a). Increases in crop production and agricultural
recovery are expected to generate positive spillover
effects on the industrial and services sectors, which
continue to account for most of the growth from
the supply side. Growth has been driven by the
industrial sector with a 4.4 percent contribution to
growth, followed by the services sector contributing
4 percent, and agriculture contributing 2.5 percent.
Construction contributed 3.5 percent to the overall
GDP growth. On the demand side, growth remains
driven by government consumption and private
investment (figure 1.1, panel b).
2. The crop harvest was estimated to increase by 7.9 percent during FY2017. The harvest during the main agricultural season in FY2017 increased by 8.8 percent (compared with a 1.3 percent drop during the same season last year) (figure 1.1, panel c),
mainly due to productivity increases ranging from
5.5 percent to 8.3 percent in the production of teff,
wheat, maize, and sorghum (figure 1.1, panel d).
The belg season harvest dropped by 4.5 percent;
however, belg season crop harvests constitute only
6 percent of total harvest. Crop harvests from
commercial agriculture increased by 7.5 percent.
The negative impact of the current drought, which
has been affecting about 8.5 million people in the
southeastern part of the country, appears to be
minimal on overall GDP growth.
3. Several leading economic activity indicators point to strong growth in the industry and services sectors in FY2017. During FY2017, electricity generation increased
by 19 percent (year over year), and electricity sales
to industries grew by 21 percent, suggesting solid
manufacturing industry activity (figure 1.1, panel
e). On the services sector side, during the same
period, Ethiopian Airlines’ passenger traffic and
cargo services continued to grow, by 15.4 and
27.2 percent, respectively, following an expansion
of the network and improved capacity (figure 1.1,
panel f).
1.1 Economic Developments in FY2017
With agricultural recovery, gross domestic product (GDP) growth is expected to have reached 10.9
percent in FY2017. Inflation should remain in single digits, providing that monetary policy remains tight
in the aftermath of the recent devaluation. The fiscal deficit is projected to increase, but remain below
3 percent of GDP. Although the general government accounts are in balance, the federal government’s
fiscal policy has embarked on a moderately expansionary stance. Following an improved trade balance,
driven by imports rather than exports, the current account deficit declined to 8.2 percent of GDP in
F20Y17. Ethiopia’s export sector is particularly small, mainly due to structural and competitiveness issues,
including an overvalued exchange rate. The unchanged financial landscape of Ethiopia is characterized
by lending dominated by state-owned enterprises (SOEs); undercapitalization of the Commercial Bank
of Ethiopia, the largest SOE bank; low insurance penetration; limited development in the capital market;
and an increased number of bank branches in urban areas. Given increased vulnerabilities due to export
weaknesses and faster-than-anticipated disbursements of nonconcessional loans, Ethiopia’s external debt
risk situation will become difficult in the medium term.
World Bank estimated growth at 8.4 percent, while the IMF estimated growth at 9 percent in 2016/17.6
2

11.0
9.0
7.0
5.0
3.0
1.0
-1.0
20
15
10
5
0
-5
-102011/12
Agriculture Private Cons
Other industry Net exportOther services
Manufacturing Private Inv
Trade & hotel Public InvGDP
GDPConstruction
Public Cons
Transport & Communication
2012/13 2013/14 2014/15 2015/16 2016/17F 2011/12 2012/13 2013/14 2014/15 2015/16
2.2 3.1 0.9 2.5
0.0
3.5
1.3
2.0
2.3 2.60.5
0.7
0.9
1.1
0.6
0.7
0.0
0.8
-0.3
1.31.9
2.11.5
2.20.30.2
0.1
2.22.2
2.23.8
3.40.5
0.7
0.7
0.6 0.61.7
8.79.9 10.3 10.4
8.0
10.9
1.1 1.5 1.1
1.1
A
C
E
B
D
F
Figure 1.1 Economic Activity
Real GDP growth: Supply side (%)
Crop production growth (%)
Electricity production and sales growth (%)
Real GDP growth: Demand side (%)
Main season crop productivity growth (%)
Ethiopian Airlines activity growth (%)
1914941
-6
86420
-2
Teff MaizeCereal Oilseeds Wheat SorghumPulses Grains
2014/152011/12 2012/13 2013/14 2014/15 2015/16 2016/17 2016/172015/16
50403020100
-10-20
3525155
-5
50403020100-10
Household Sales CargoCommercial & street light
Industrial Sales PassengersProduction (RHA)
2011/12
2011/12
2010/11
2009/102014/15
2014/152012/13
2012/132015/16
2015/162013/14
2013/142016/17
2016/17
Sources Panel a and b: National Planning Commission (NPC); panels c and d: Central Statistical Agency (CSA);
panel e: Ethiopian Electric Power(EEP)/Ethiopian Electric Utility (EEU); panel f: Ethiopian Airlines.
3

Monetary Sector
4. Inflation in FY2017 remained in single digits, with annual average inflation at 7.1 percent, but with an uptick over recent months. Inflation rose to 13.6 percent in
November 2017, the highest since January 2016,
mainly because of food inflation. Food prices,
which constitute about 53 percent of the average
household consumption basket, are a major
driver of inflation. Food inflation has increased by
18.1 percent, the highest since September 2012
(figure 1.2, panel a). Following the post-drought
grain harvest of the main growing season, food
prices were initially stabilized, but picked up
since April 2017, driven by high demand for
cereals, fats and oils, and meat during the Easter
holiday celebration. In addition, the government
purchased large quantities of food items from the
domestic market to supply the drought-affected
areas. The recent devaluation of the Birr could
trigger further inflationary pressures in the coming
months. However, so far, the month on month food
inflation has shown a modest decline (0.4 percent
in November) after the devaluation.
5. Food prices are a major driver of inflation, but nonfood prices, which have declined moderately in FY2017 have started to increase starting August 2017. Commodities
with inflationary tendencies, such as meat, bread
and cereals, fruits, dairy products, nonalcoholic
beverages, and other food items, have recorded
an inflation rate of 10 percent or higher since July
2017 (figure 1.2, panel b). By contrast, nonfood
inflation recorded the lowest increases in more
than a decade, reaching 4.6 percent in April. The
relative slowdown in nonfood inflation in FY2017
is likely due to the lagged effects of declining
international prices since mid-2014 and tighter
monetary conditions over the past year. However,
nonfood inflation gradually increased since May
2017 and reached 8.6 percent in November 2017.
6. The relaxation of monetary policy, measured by the fast growth of reserve money, may have triggered inflationary pressures in the first quarter of FY18. The
National Bank of Ethiopia (NBE) targets reserve
money7 as the nominal anchor for monetary
policy; broad money8 is used as an intermediate
instrument. Reserve money growth decreased
slightly to 22.7 percent in June 2017 after an
increase of 30.2 percent in May 2017 (compared
with 16.3 and 19.9 percent growth, respectively,
during the same months of last year). The growth
in reserve money was mainly driven by increases
in NBE’s net foreign assets (128 percent) and net
credit to the government (27.2 percent) (figure 1.2,
panel c). The lagged effect of expansive monetary
policy has certainly contributed to the inflationary
situation of nonfood items over the first quarter of
FY18. The real deposit rate remained in negative
territory and the real lending rate tends toward
zero, following the rising overall inflation trend.
With strong demand for bank credit, the maximum
lending rate started to move upward, increasing
the spread from the minimum deposit rate since
last year’s third quarter (figure 1.2, panel d). In
October 2017, NBE increased interest rates on
deposits from 5 to 7 percent; however, real deposit
rates will remain negative.
7. Driven by increases in domestic credit, broad money growth remains in line with reserve money growth. Broad money grew by
Reserve money is defined as the sum of currency issued by the NBE (including the vault cash of commercial banks and
currency outside banking system) and balances of commercial banks on accounts with the NBE.
Central banks track the growth of “broad money” to help forecast inflation. The exact definition varies between countries,
but broad money usually includes short-duration deposits and short-term securities other than shares. These are less liquid
than currency or demand deposits (which make up “narrow money”) but can be encashed fairly quickly.
7
8
4

29 percent in June 2017(year-on-year), up from
20 percent in June 2016, about 10 percentage
points faster than the growth of nominal GDP.
Net domestic credit growth played a leading
role in broad money growth, while net claims
on government growth remained the main source
of credit increase (increasing by 79 percent in
June 2017). Credit to the private sector increased
by 48 percent in June 2017. Domestic credit
to SOEs moderated, increasing by 10 percent
(year-over-year) following a constraining
environment for external non-concessional
loans for public infrastructure investment (figure
1.2, panel e). The share of public enterprises
in total outstanding domestic credit declined to
52 percent from 60 percent in FY2016, while
the share of private sector credit increased by
5 percentage points to 35 percent at the end
of June 2017 (compared with June 2016). The
share of the net central government credit stock
in total domestic credit picked up to 14 percent
(figure 1.2, panel f) despite printing money to
finance the budget deficit (see figure 1.3, panel
b, in the next subsection).
8. The NBE appropriately tightened its monetary policy in the immediate aftermath of the devaluation. The NBE raised the floor
on time and savings deposits from 5 to 7 percent
and reduced the 2017/18 target growth of base
money. The NBE`s operational target for monetary
policy (growth of base money) was reduced from
22 percent to 16 percent to contain the pass-
through from the exchange rate into domestic
prices. Furthermore, the NBE introduced a limit of
16.5 percent on the FY18 outstanding credit growth
of commercial banks. The credit cap is applied to
firms in the non-export, non-manufacturing sectors.
Given the lagged effect of monetary policy, the
NBE would need to be particularly vigilant as the
relaxation of monetary policy in the first part of the
year – that is before the October devaluation – may
have created inflationary pressures that would need
to be reduced in the coming months.
5

20151050
43383328231383
-2-7
-12
11.010.510.09.59.08.58.07.5
403020100
-10
806040200-20-40
Jan-13
Apr-1
3Jul
-13Oc
t-13
Jan-14
Apr-1
4Jul
-14Oc
t-14
Jan-15
Apr-1
5Jul
-15Oc
t-15
Jan-16
Apr-1
6Jul
-16Oc
t-16
Jan-17
Apr-1
7Jul
-17Oc
t-17
Jun-13
Sep-1
3De
c-13
Mar-1
4Jun
-14Se
p-14
Dec-1
4Ma
r-15
Jun-15
Sep-1
5De
c-15
Mar-1
6Jun
-16Se
p-16
Dec-1
6Ma
r-17
Jun-17
Sep-1
7
Sep-1
0De
c-10
Mar-1
1Se
p-11
Dec-1
1Ma
r-12
Sep-1
2De
c-12
Mar-1
3Se
p-13
Dec-1
3Ma
r-14
Sep-1
4De
c-14
Mar-1
5Se
p-15
Dec-1
5Ma
r-16
Sep-1
6De
c-16
Mar-1
7Jun
-17
Sep-1
3De
c-13
Mar-1
4Jun
-14Se
p-14
Dec-1
4Ma
r-15
Jun-15
Sep-1
5De
c-15
Mar-1
6Jun
-16Se
p-16
Dec-1
6Ma
r-17
Jun-17
2013/14 2014/15 2015/16 2016/17
General
Reserve money
Bread & CerealsFruit
MeatVegetables
Milk, cheese & eggsOther foods (RHA)
Food
Inflation (y/y)
Non-Food
Broad money (M2)
A
C
B
D
Figure 1.2 Monetary Sector
Inflation (y/y, %)
Broad money, reserve money, and inflation (%, y/y)
Major food items inflation (y/y, %)
Interest rate premium (max – min interest rate) (%)
E FBroad money growth (M2, y/y, %) Composition of domestic credit stock (%)
85.0
35.0
-15.0
-65.0
10080604020
0
Net Foreign assetsOther items (net)
Net Domestic creditSOEs CG credit Private creditBroad money (M2)
Sep-1
1De
c-11
Mar-1
2Jun
-12Se
p-12
Dec-1
2Ma
r-13
Jun-13
Sep-1
3De
c-13
Mar-1
4Jun
-14Se
p-14
Dec-1
4Ma
r-15
Jun-15
Sep-1
5De
c-15
Mar-1
6Jun
-16Se
p-16
Dec-1
6Ma
r-17
Jun-17
2009
/10
2010
/11
2011/
12
2012/
13
2013/
14
2014/
15
2015/
16
2016
/17
29
32
40 37
21
42 52 58 62648
28 3010
6052
1435
9 93033
1137
Sources
Note
Panels a and b: CSA; panels c and d: CSA and National Bank of Ethiopia; panels e and f: National Bank of Ethiopia.
In panel f, monetary survey data are used, which exclude Development Bank of Ethiopia (DBE) in private credits.
CG = Central Government; SOEs = state-owned enterprises; y/y = year over year.
6

Fiscal Sector
9. The general government9 fiscal policy stance remained cautious in FY2017. The
general government fiscal deficit (excluding SOEs)
reached 3.4 percent in 2016/17, showing one
percentage point increase compared to 2015/16.
This may be due to an increase in additional spending
to finance drought affected areas. Although domestic
revenue (tax and non-tax) increased by 11 percent,
the increase was not sufficient to compensate for
higher total expenditure, which increased by 17
percent mainly driven by recurrent expenditure
up by 29 percent compared to the 2015/16 level.
The growth in capital expenditure moderated to 6
percent from 23 percent in FY2016, mainly due
to a decline in external assistance and slowdown
in additional external loan in capital expenditure.
External loans for capital expenditure increased
by 14 percent in FY2017, which is far below the
47 percent growth registered in FY2016. On the
financing side, the deficit was covered by domestic
and external borrowing (2.5 and 1.6 percent of
GDP, respectively), and through the repayment of
cash balances and residuals (totaling 1.0 percent of
GDP). A large portion of domestic financing relied
on borrowing from non-bank sources through the
sale of T-bills. Direct advances issued by the NBE to
the central treasury reached 1.5 percent of GDP in
2016/17 up from 1.1 percent of GDP in 2015/16
(Figure 1.3.2).
10. Revenue growth slowed in FY2017. Except
for domestic indirect taxes, growth in all revenue
components slowed down. Revenues and grants
increased by 10 percent in FY2017, mainly due to
an increase in tax and nontax revenues from SOE
state dividends and domestic indirect taxes. However,
collection from foreign trade taxes declined by 0.4
percentage point of GDP, potentially due to the
decline in imports of transport and industrial capital
goods. Similarly, direct taxes and domestic indirect
taxes in percent of GDP dropped by 0.15 and 0.16
percentage point, respectively, compared with the
same period last year.
11. Despite the salary increase initiated in the previous year and the support to drought-affected areas in FY2017 general government spending remained stable. Total
expenditures in percent of GDP in FY2017 stood at
18.4, unchanged as compared to FY2016. However,
recurrent expenditure in percent of GDP rose to
9.9 (showing a 1 percentage point increase from
FY2016) following the salary increases for public
servants and drought-related spending. On the other
hand, capital expenditure slowed down to 8.6 in
percent of GDP, from 9.4 in FY2016. Keeping the
balance between recurrent and capital budget is
important to meet the running cost of additional
capital expenditure of public sector projects, to fund
the operations of existing productive assets and to
ensure effective service delivery in general. Evidence
seems to point to underfunding of recurrent costs,
raising concerns of the sustainability of public sector
services (Public Expenditure Review 2015).
12. The federal government’s fiscal policy has embarked on a moderately expansionary stance. During FY2017, the fiscal deficit increased
by 0.7 percentage point of GDP, mainly due to
lower revenues in percent of GDP and increased
recurrent spending (figure 1.3, panel e). Total
federal government expenditures decreased by 0.2
percentage point of GDP. Capital expenditure in
percent of GDP decreased by 0.4, while recurrent
spending and regional transfers also increased by 0.2
and 0.3 percentage points respectively. The federal
government fiscal deficit that accumulated during
FY2017 (about 1.5 percent of GDP) was financed through external—mainly concessional—financing (1.6 percent of GDP) and domestic financing (2.3
The general government includes the fiscal operation of federal and regional governments excluding SOEs.9
7
percent of GDP) with large repayments of cash balances and residuals (1.2 percent of GDP).
13. The government approved a supplementary budget equivalent to 1.1 percent of GDP in mid-FY2017. Half of the supplementary budget was intended to finance the salary increment for civil servants that would be effective during the second half of the fiscal year. The remaining part of the additional budget was intended to finance the youth revolving fund and drought relief, and provide additional financing to the urban safety net program. About 56 percent of this additional budget was planned to be financed by surpluses from the Oil Stabilization Fund (determined by the domestic and international fuel price differential). Revenue mobilization from privatization receipts and additional proceeds from SOEs were also assumed to contribute to the supplementary budget.
14. The federal government approved the FY2018 budget with a deficit set at 3.5 percent of GDP. This compares with a 3.3 percent deficit in FY2017. Spending and revenues are expected to decline as a share of nominal GDP, with a steeper decline in revenues compared with spending, leading to a widening of the deficit. Federal revenues are
expected to decline from 11.6 to 10.6 percent of
GDP, due to lower tax revenues driven mainly by
drops in direct tax revenues and domestic indirect
taxes. Similarly, the spending budget falls from 14.9
to 14.1 percent of GDP, as a result of lower allocation
to the capital budget and decreased allocation to
Sustainable Development Goals support programs
at the local level. It is important to note that the
federal government’s budget excludes regional
budgets from own sources and may therefore not
give a full picture of the general government’s fiscal
activity.
15. SOEs play an important role in the government’s public investment program and need to be considered in the fiscal analysis. Although SOEs play a key role in
infrastructure development, the financing of public
projects by SOEs through domestic and external
loans has meant a buildup of external debt and
associated vulnerabilities. Among other indicators,
the public debt-to-GDP ratio increased from 36.3
percent in 2011/12 to 54.9 percent in 2016/17.
This is somewhat in line with the trend observed for
many commodity-exporting countries in Africa in
recent years following the global commodity price
depression. Most recently, the debt service-to-export
ratio, which indicates liquidity issues in the debt
profile, has increased rapidly, from 10.3 percent in
2013/14 to 19.6 percent at the end of June 2017;
it essentially doubled in two and a half years (figure
1.3, panel f).
Ethiopia’s macroeconomic policy stance has generated persistent Birr overvaluation, large external imbalances, foreign exchange shortages, and a higher risk of debt distress
8

A
E
C
B
F
D
Figure 1.3 Fiscal Sector
General government fiscal deficit (% of GDP)
Federal government fiscal operations (% of GDP)
General Government revenue (% of GDP)
Direct advance from NBE (% of GDP)
Debt stock-to-GDP and debt service ratio
General government spending (% of GDP)
20.018.016.014.012.010.08.06.04.02.0
-
Revenue & grants Total Expenditure
Primary deficit (RHA)
2009
/10
2010
/11
2009
/10
2010
/11
2011/
12
2011/
12
2012/
13
2012/
13
2013/
14
2013/
14
2014/
15
2014/
15
2015/
16
2015/
16
2016
/17
-1.2 -1.2-0.9
-1.6
-2.2 -2.0 -1.9
-2.9-1.6 -1.6
-1.2
-1.9-2.6 -2.4 -2.4
-3.4 0.3
1.1
0.6
1.00.8
1.5
1.1
1.6
1.2
0.8
0.4
0.0
15129630
201612840
2010/11 2010/112009/102011/12 2011/122012/13 2012/132013/14 2013/142014/15 2014/152015/16 2015/162016/17 2016/17
3.8 3.9 4.2 4.4 4.6 4.7 4.5 8.4 7.9 6.9 7.2 7.4 8.7 8.9 9.83.0 3.1 3.7 3.8 4.0 3.7 3.5
10.4 10.3 9.8 10.5 10.1 9.0 9.48.5
4.6 4.5 4.4 4.3 4.1 4.1 3.72.0 2.3 2.0 1.2 1.6 2.7 2.613.4 13.8 14.3 13.8 14.4 15.2 14.2 18.8 18.2 16.6 17.8 17.5 17.8 18.4 18.3
Direct tax Foreign trade tax
Non tax revenue
CapitalRecurrentDomestic indirect tax
Domestic Revenue
Fiscal balance incl. grants (RHA)
Total Expenditure
20
15
10
5
0
-5
60.0
50.0
40.0
30.0
20.0
10.0
0.0
25.0
20.0
15.0
10.0
5.0
0.0
2011/
12
2010
/11
2012/
13
2013/
14
2014/
15
2015/
16
Revenue & grant Expenditure Budget deficit 2016
/17
11
-3.0 -3.4
1411
1512
15
2014/15 2015/16 2016/17 External debtPublic debt
Ext. Debt service to export ratio (FHA)
Source
Note
Ministry of Finance and Economic Cooperation (MOFEC).
GDP = gross domestic product; NBE = National Bank of Ethiopia.
9

External Sector
16. Following an improved trade balance, driven by reduced imports rather than increasing exports, the current account deficit declined to 8.2 percent of GDP in FY2017. The current account deficit gap
(including official transfers) narrowed by 2.2
percentage points of GDP during FY2017, due
to a large drop in private transfers by about
41 percent compared with the same period in
the previous year. Following the improvement
in the goods and services trade balance, the
trade deficit narrowed by 3.6 percent of GDP
compared with FY2016, due to lower imports
(rather than higher export earnings) (figure
1.4, panel a). The current account deficit was
financed largely by foreign direct investment
(FDI) inflows, which increased by 38 percent;
external borrowing; as well as drawdown of the
foreign exchange reserve accumulations. Foreign
exchange reserves declined by about 6 percent
against the same period last year and reached
US$3.2 billion at the end of June 2017 (which
is 2.0 months of the following year’s imports)
(figure 1.4, panel b). The external sector continues
to be vulnerable to terms-of-trade shocks and
weakened external competitiveness, which need
to be carefully managed.
17. Private transfers, one of major sources of forex earnings, underperformed in FY2017. Private transfers10 declined by 8.6
percent, resulting in a loss of 1.4 percentage
points of GDP. The decline is related to the
reduction in nongovernmental organization
(NGO) relief transfers after the 2016 drought and
lower transfers due to the public unrest during the
first quarter of the fiscal year. Private individual
transfers dropped by 14.7 percent compared with
FY2016. Private transfers were a good financing
source for the current account deficit in the past,
but their contribution during the first nine months
of the fiscal year was lower than expected.
Private transfers include private individual transfers, NGO transfers, and estimated unofficial remittances.10
The trade deficit narrowed by 3.6% of GDP
10

18. Goods exports underperformed in FY2017. Exports of goods modestly increased by 1.4 percent during FY2017, driven by a 7.2 percent increase in the export volume index that was espoused by a price index increase of 2.2 percent (figure 1.4, panel c).
Among the major export products, the value of
coffee exports increased by 22 percent, due to
the price increase in arabica coffee, as well as a
rise in the volume of exports. At the same time,
pulse exports increased by 20.5 percent, due to
better prices and volumes compared with last year.
Flowers, oilseeds, live animals, and leather declined
by 3, 26.4, 54.2, and 1.1 percent, respectively,
due to declines in prices and volumes. Overall,
since 2010/11, Ethiopian exports as a percentage
of GDP have been on a declining path (figure
1.4, panel d). During FY2017, services exports
increased by 4 percent, primarily due to the better
performance of government services.11 Exports of
transportation services declined by 2.0 percent.
19. Ethiopia’s export sector is particularly small. Total goods and services exports do not exceed 10 percent of GDP, significantly below the 24 percent expected from countries at this level of development.12
This export underperformance is mainly due to
structural and competitiveness issues, such as
rigid labor and product markets including an
overvalued exchange rate. Challenges range from
supply issues and quality of products, to marketing
channels, branding, and so forth. The whole supply
chain of the major export products, from production
to final destination, needs to be examined.
20. Moreover, the contribution of services must be investigated thoroughly. Ethiopia is
working on developing the manufacturing sector as
a major source of export earnings. To realize this
vision, it is important to look at the link between
the manufacturing and services sectors, to enhance
and increase the leverage in both sectors. (Part 2
of the report provides more details on this topic.)
21. Ethiopia’s overvalued currency has manifested in persistent, large external imbalances, foreign exchange shortages, and overall slow pace of structural transformation. To support exports and
encourage the private sector, on October 10,
2017, NBE devalued the Birr by 15 percent and has
relaxed foreign exchange controls (see box 1.1).
Government services is a residual category covering all transactions by embassies, consulates, military units, and defense
agencies with residents of economies in which the embassies, etc. are located and all transactions with other economies.
Transactions in this category comprise those for goods and services (such as office supplies, furnishings, utilities, official
vehicles and the operation and maintenance thereof, and official entertainment) and personal expenditures incurred by
diplomats and consular staff and their dependents in the economies in which they are located. Also recorded in this category
are transactions by other official entities (such as aid missions and government tourist, information, and promotion offices)
located in economies abroad.
World Bank (2014b).
11
12
At less than 10% of GDP, Ethiopia’s export sector is particularly small for a country at this level of development
11

Box 1.1
The Promise of Devaluation and Relaxation of Foreign Exchange Controls
To support exports and encourage the private
sector, on October 10, 2017, the National
Bank of Ethiopia (NBE) devalued the Birr by
15 percent. Furthermore, foreign exchange
controls have been relaxed with the issuance
in October of two NBE directives on (i) external
loans and suppliers’ credit, and (ii) retention
and utilization of export earnings and inward
remittances. Under the first directive, any
domestic investor can now access an external
loan, if the investor generates foreign currency.
The debt-equity ratio to access a loan from
foreign sources has been revised to 60-40,
replacing the hitherto 50-50 ratio. Under
the second directive, exporters of goods and
services are authorized to retain 30 percent
of the proceeds of their exports indefinitely in
their forex account (replacing the previous 10
percent threshold).
Recent empirical analysis conducted by the
World Bank provides strong evidence that
a more competitive real exchange rate
would provide an environment that is more
conducive to manufacturing-led structural
transformation, sustained growth acceleration,
and improved external balance. For instance,
a 10 percent depreciation of the real effective
exchange rate would reduce the current
account deficit by about 2 percentage points
of gross domestic product (GDP) (through a
5 percent increase in exports and a 6 percent
decrease in imports) and increase real GDP
growth by more than 2 percentage points.
However, the devaluation would also raise
the cost of debt servicing and public foreign
currency debt stock denominated in local
currency. Moreover, the devaluation could
lead to inflation, as imports would become
more expensive, with possible adverse impacts
on the poor.
To limit the pass-through to inflation, any
devaluation needs to be accompanied by
appropriately tight monetary and fiscal
policies. In that context, the decision to
increase interest rates is appropriate and
timely. Looking forward, it is important
to continue to adjust the macroeconomic
stance, including foreign exchange, monetary,
and fiscal policy, for Ethiopia’s economic
conditions and ambitions. A one-off exchange
rate correction is unlikely to be sufficient to
redress the structural bottlenecks that hinder
exports. A comprehensive policy package
would help find the right balance between
the implementation of productivity-enhancing
structural reforms, including measures to
strengthen the business environment (for
example, trade logistics, access to finance
and land, burdensome customs regulations,
skills gaps, and so forth) and the flexibility
of the exchange regime. A measure of this
balance would be the capacity to build the
stock of foreign exchange reserves over the
medium term.
12
22. The exchange rate played an important role in explaining the low export earnings. A
competitive exchange rate encourages the supply
of goods for export and at the same time provides
better prices for international buyers of Ethiopian
products. NBE discontinued reporting on the
parallel market rate, but anecdotal evidence
suggests that the parallel market premium
ranged from 10 to 17 percent in FY2017. This
provides an indication of the appreciation of
the real effective exchange rate and shows that
domestic inflation is still higher than foreign
inflation and the rate of nominal depreciation.
23. Declines in goods imports—mainly driven by a slowdown in capital and intermediate goods imports—contributed to the improvement in the trade deficit
during FY2017. Imports of goods declined by
5.5 percent during FY2017, mainly driven by
a 15.5 percent decline in raw material imports
and a 12 percent reduction in imports of capital
goods. Consumer goods imports also declined,
by 7 percent. This could be the result of low
foreign exchange reserves and a constraining
environment for accessing non-concessional
borrowing. Capital goods imports. which are
associated with large public sector investment
activities and largely financed through external
loans, declined with low external disbursement
during the fiscal year. Fuel imports increased by
36 percent during this period (figure 1.4, panel
e). It is obvious that the total exports of goods
and services cannot cover the cost of consumer
goods and fuel imports. Services imports also
declined, by 1.4 percent, in FY2017.
Declines in goods imports contributed to the improvement in the trade deficit during FY2017
13

2.62.6
A
C
E
B
D
Figure 1.4 External Sector
External current account balance (% of GDP)
Growth in exports of goods (%)
Imports of goods and services (% of GDP)
Gross official foreign exchange reserves (US$ millions)
Exports of goods and services (% of GDP)
30
20
10
0
-10
-20
-30
4,5004,0003,5003,0002,5002,0001,5001,000
5000
3.5
3.0
2.5
2.0
1.5
1.0
2009
/10
2010
/11
2011/
12
2012/
13
2013/
14
2014/
15
2015/
16
2016
/17
Mar-1
0 Jul
-10
Nov-1
0 Ma
r-11
Jul-11
Nov-1
1Ma
r-12
Jul-12
Nov-1
2Ma
r-13
Jul-13
Nov-1
3Ma
r-14
Jul-14
Nov-1
4Ma
r-15
Jul-15
Nov-1
5Ma
r-16
Jul-16
Nov-1
6Ma
r-17
9.0 8.6 7.5 7.5 7.3 7.6 8.3 6.9
-0.7-0.2 -0.1 -1.2
6.4 5.84.1 3.2
3.23.4
3.94.0
2.52.4 4.2 4.8 8.22.3
Private transfersChange in reserves
Foreign Reserve (mill $)Official transfers LoansFDICAB/GDP Reserve in months of import (right axis)
-19.2
-4.0 -0.7-6.5 -5.3
-7.9 -11.5 -10.4 -8.2
-14.9-17.9 -16.4 -17.6 -21.0 -19.8 -16.2
-1.0
2.62.33.4
1.44.24.4 3.3
1.3
1.85.2
50403020100
-10-20
18.016.014.012.010.08.06.04.02.00.0
2009
/10
2009
/10
2004
/05
2010
/11
2010
/11
2005
/06
2011/
12
2011/
12
2006
/07
2012/
13
2012/
13
2007
/08
2013/
14
2013/
14
2008
/09
2008
/09
2014/
15
2014/
15
2015/
16
2015/
16
2016
/17
2016
/17
Value growth Service export Goods exportPrice growth Volume growth40.4
18.7 18.7 23.1
-1.0 -2.3 -8.6 -4.7 -9.3
38.4 37.1
14.85.6
6.0 6.8 8.1 6.5 6.0 5.7 4.8 4.1 4.1
4.56.7
8.67.3 6.5 5.9 4.6 4.0 3.6
40.030.020.010.00.0
Capital goods Consumer goods Immediate goods Service importsOthersFuel
2009/10 2010/11 2011/12 2012/13 2013/14 2014/15 2015/16 2016/17
9.6 8.6 6.8 7.5 8.7 10.7 9.4 7.5
8.4 7.2 8.2 7.2 6.7 7.0 7.3 6.14.4 5.2 4.9 4.5 4.6 3.2 1.9 2.3
4.8 4.4 5.0 4.0 4.3 4.3 4.2 3.4
0.4 0.4 0.7 0.8 0.4 0.4 0.3 0.4
5.1 5.7 6.1 4.8 4.4 4.8 4.7 4.2
Sources National Bank of Ethiopia and Ministry of Finance and Economic Cooperation (MOFEC)
-4.3
14
Financial Sector
24. The structure of the financial sector has barely changed over more than a decade and is dominated by state-owned financial institutions. The financial sector in Ethiopia
currently consists of 18 banks, 17 insurance
companies, 35 microfinance institutions, and five
capital goods finance companies. Banking is the
dominant subsector, accounting for 78 percent of
total financial sector assets, followed by insurance
companies, representing 15 percent (figure 1.5,
panel a). The two state-owned banks (Commercial
Bank of Ethiopia and Development Bank of Ethiopia)
account for 65.7 percent of total deposits, 62.4
percent of outstanding credit, 35.9 percent of total
branch networks, 64 percent of total banking sector
assets, and 48.9 percent of total banking sector
capital as of December 2016; the remaining 16
private banks cover the balance. The state-owned
insurance company accounts for 23 percent of the
total capital of the industry. Micro finance institutions,
which mainly serve the rural population, represent
only about 6 percent of the financial sector capital.
New additions to the financial sector are five capital
finance companies that started operation in the
past few years. There is no foreign bank or foreign
financial institution in Ethiopia. Currently, there are
35 micro finance institutions, with total capital of
US$419 million, a total network of 1,647 branches,
and total outstanding credit of US$1.2 billion as of
December 2016.
25. The domestic credit market is dominated by lending to SOEs—mainly to finance infrastructure investment—contributing to weak financial intermediation. Domestic credit
as a percentage of GDP increased from 28.3 percent
in 2014 to 32.1 in 2016, while private credit increased
from 8.7 to 11.7 percent. A large part of domestic
credit was credit for SOEs—17 percent between
2014 and 2016. However, with a policy preference
for financing SOEs at low cost, the credit market
tended to crowd out the private sector. The 2017
Doing Business report ranks Ethiopia at the 170th
place of 190 economies in ease of getting credit—
one of the lowest ranks in the world and two ranks
down from Ethiopia’s position in 2016. Enterprise
Survey 2015 also reveals that the proportion of
enterprise investment in Ethiopia financed by banks
is only 7.8 percent, while a large proportion (83.3
percent) of investment is self-financed—an indication
of financial disintermediation.
26. Although the aggregate capital adequacy ratio of the banking sector is good, the Commercial Bank of Ethiopia (state-owned and the largest bank in Ethiopia) seems highly undercapitalized. The Commercial Bank
of Ethiopia’s capital-to-assets ratio is about 3.5
percent, which is less than one-third of the private
banking sector average capital-to-assets ratio of
12 percent. In recognition of this, the government
has decided to raise the Commercial Bank of
Ethiopia’s capital by threefold to US$1.7 billion.
The fund will be financed by interest-free and tax-
free government bonds. The Ministry of Finance
and Economic Cooperation will issue the bonds on
behalf of the government. The bonds will mature in
10 years after a five-year grace period. However,
the banking system’s ratio of capital-to-risk-weighted
assets stood at 17 percent (double the minimum
requirement). The ratio of nonperforming loans to
total gross loans stands at 3 percent, which is well
below the 5 percent limit. The banking sector’s return
on equity (ROE) and return on assets (ROA) were
39.7 and 3.0 percent, respectively, in 2015, which
is much higher than Sub-Saharan Africa’s average
ROE of 14.9 percent and ROA of 1.7 percent. The
high profitability of Ethiopian banks vis-à-vis their
regional peers can be mainly attributed to low
overhead costs of 2.2 percent in 2014, less than
half compared with the Sub-Saharan Africa average
of 4.7 percent (figure 1.5, panel b).
27. Insurance penetration in Ethiopia is very low and products are concentrated in general insurance lines of business. In 2015,
the ratio of total insurance premiums to GDP was 1
15

percent, which is much lower than the Sub-Saharan
Africa average of 3.5 percent (figure 1.5.4). Most of
the insurance business in Ethiopia is targeted at the
corporate market and focused on general insurance.
The corporate focus implies that, to date, insurers
have had little experience in intermediating products
to individuals, and cost margins have not yet been
tested against the more cost-sensitive retail business.
Premiums from the retail sector are almost entirely
derived from motor insurance. As of December
2016, there were 17 insurance companies in
Ethiopia with 465 branches. About 54.4 percent of
the insurance branches were in Addis Ababa and 85
percent of the total branches were private.
28. Capital markets in Ethiopia mainly comprise Treasury bills (T-bills) and government bonds. T-bills are transacted
on a weekly basis and government bonds are
occasionally issued. The maturities of T-bills are 28,
91, 182, and 364 days; 91 and 364 days are the
most demanded terms (figure 1.5, panel d). The
total outstanding T-bills as of December 2016, was
US$2.9 billion. The Public Servants Social Security
Agency, Development Bank of Ethiopia, and Private
Organization Employees Social Security Agency
are the three major buyers of T-bills in Ethiopia.
Outstanding corporate bond holdings reached
US$9 billion as of December 2016, of which about
94 percent was held by two state-owned institutions:
Ethiopia Electric Power (85.4 percent) and Railways
Corporation (8.7 percent). The Commercial Bank of
Ethiopia is the sole purchaser of these bonds, making
the bank susceptible to the financial performance of
SOEs and single-borrower risk. Ethiopia has yet to
develop a secondary capital market.
29. Despite significant improvements in outreach led by the expansion of bank branches, penetration of formal financial institutions remains very limited in rural areas. The number of bank branches in Ethiopia
has more than tripled in the past five years, from
970 branches in 2011 to 3,187 branches in 2016
(figure 1.5, panel e). Access to banks remain
concentrated in the capital city and other urban
centers. Of the total nationwide, 34.4 percent of
branches and more than 50 percent of ATMs are in
Addis Ababa. However, there is a large untapped
market of borrowers and savers who are not using
formal financial services. According to Findex 2014,
48 percent of Ethiopian adults reported saving or
setting money aside, yet only 14 percent saved
formally at financial institutions. During the same
period, 44 percent of Ethiopian adults reported that
they borrowed money, but only 7 percent borrowed
from financial institutions. The Government of
Ethiopia has recognized financial inclusion as a
priority area in its Growth and Transformation Plan
(GTP II), and has approved the National Financial
Inclusion Strategy.
Financial repression may help contain inflation, but at a potential growing economic cost in terms of market distortion and resource misallocation
16

Public Insurance 837
A
Figure 1.5 Financial Sector Indicators
Capital share of the financial sector, 2015/16 (Birr, millions)
22,003
13,558
7,501
8,876
2,754Private Banks
CBE MFIs
DBEPrivate insurance
6050403020100
4.03.53.02.52.01.51.0
0.50.0
5.04.54.03.53.02.52.01.51.00.50.0
2010 2011 2012 2013 2014 2015 NIG ETH MZQANG ZAM BOTUGD GHA KENTAN MAL SSA
0.30.8 0.8 0.9 1.0 1.0 1.1
1.52.0
3.0 3.03.5
B CROE and ROA (%) Insurance premiums to GDP, 2015 (%)
ROE EthiopiaROE SSAROA (RHS) EthiopiaROA (RHS) SSA
3,5003,0002,5002,0001,5001,000
5000
2010 2012 20142011 2013 2015 2016
52%Corporate bonds
13%91 days
16%T-bills
0%182 days
29%Direct advance
0%28 days
3%Government bonds
3%364 days
D EComposition of the capital market, by instrument
Development of bank branches
Sources
Note
Panels a, e, and f: National Bank of Ethiopia; panels b, c, and d: National Bank of Ethiopia and African Insurance Barometer.
ANG = Angola; BOT = Botswana; ETH = Ethiopia; GDP = gross domestic product; GHA = Ghana; KEN =
Kenya; MAL = Malawi; MZO = Mozambique; NIG = Niger; ROA = return on assets; ROE = return on equity;
SSA = Sub-Saharan Africa; TAN = Tanzania; UGD = Uganda; ZAM = Zambia.
17

1.2 Economic Prospects in FY2018 and Beyond
Post-drought real GDP growth is expected to recover moderately in FY2018 and an average growth of 8
percent is expected in the medium term. The general government’s fiscal policy is expected to continue with
a moderate fiscal deficit that is consistent with macroeconomic stability. The government would pursue
robust monetary policy to maintain inflation in single digits in the aftermath of the recent devaluation. On
the upside, FDI inflows, supported by incentives and ongoing industrial parks development, are expected
to boost the manufacturing sector. On the downside, the economy will remain vulnerable to the weak
economic performance of key trading partners and rationing of foreign exchange. On balance, with
potential improvements in manufacturing and exports, GDP growth is projected to remain robust in the
medium term and stay around 8 percent annually. Poverty should decrease accordingly, although persistent
drought could result in poverty rates declining less than projected. The challenges to the economy are
related to exports performance, rising oil prices, overvalued exchange rate, and vulnerability to debt risks.
Positive economic growth is expected to continue to lower the poverty rate.
30. In FY2018, real GDP is expected to recover as agricultural performance improves. Following normal rainfall during the main growing
season, agricultural production continued to grow
in FY2017, recovering from a lower growth in
FY2016. The negative impact of the current drought
in pastoralist areas, although adversely affecting
livelihoods and livestock production, is expected to be
minimal, but could have significant poverty impacts.
On the upside, FDI inflows supported by incentives
and ongoing development of industrial parks, are
expected to boost the manufacturing sector. On the
downside, the economy will remain vulnerable to the
weak economic performance of key trading partners
and rationing of foreign exchange. On balance,
with potential improvements in manufacturing and
exports, GDP growth is projected to remain robust
in the medium term and continue to hover around
8 percent annually (figure 1.6).
31. To contain debt sustainability risks, external non-concessional borrowings and their related public investments are expected to slow in the coming years. Exports
are not projected to pick up in FY2018; however,
an improvement as compared to the last five year`s
trend could be expected. Notwithstanding the recent
15 percent nominal devaluation, the level of the real
exchange rate and pressure on foreign exchange
may continue to contain exports.
32. Exports could recover in the medium term, as large investment projects, such as the railway to the Port of Djibouti, large power dams (with potential for electricity exports), or industrial parks, are completed. The Addis Ababa–Djibouti Railway will improve
trade logistics and reduce the transportation cost
of moving goods in and out of the country. It will
take only 10 hours for the new railway to take
goods between Ethiopia and Djibouti, a significant
improvement over the three to four days by truck
currently. Further, the Hawassa Industrial Park
and the second phase of the Bole-Lemi Industrial
Park have started operations and are set to
increase manufacturing exports and contribute
to the diversification of exports. Investments in
hydropower, industrial parks, export processing
zones, and public policies to encourage FDI
and private investment in light manufacturing
industries are expected to support export growth
and diversification. The completion of power
transmission lines to neighboring countries (Kenya
and Sudan) and expansion in power generation
capacity are expected to increase electricity
exports, further boosting the diversification efforts
(box 1.2). A recent United Nations Conference
on Trade and Development (UNCTAD) report
shows that Ethiopia has recently enjoyed large
FDI inflows, ranking first in Sub-Saharan Africa,
with US$3.2 billion inflows in 2016.
18

Box 1.2
Take-Off in Electricity Exports
Ethiopia’s cost of supplying electricity is
among the lowest in Sub-Saharan Africa,
presenting unique export opportunities.
According to World Bank estimates, Ethiopia
will have more than 9,000 megawatts (MW)
of installed capacity by 2020 (estimated to be
the second highest installed capacity available
in the region). This would provide more than
25,000 gigawatt hours (GWh) of renewable
electricity that would be able to meet domestic
and export demand. Therefore, over the next
few years, Ethiopia is expected to become a
regional energy superpower and develop into
the cornerstone of the regional power market
and East African Power Pool (EAPP).
Electricity exports are set to double in 2019,
to US$250 million, and reach US$1 billion by
The acceleration in export revenues is due to a
combination of the significant growth in export
volumes and a relatively high export price.
Based on signed Power Purchase Agreements
(PPAs) between Ethiopia and Kenya, and
Ethiopia and Tanzania (others are being
planned and negotiated), the growth in exports
2023. Currently, Ethiopia’s power exports are
limited to Sudan and Djibouti (figure B1.2.1).
However, power transmission interconnection
to Kenya (financed by the World Bank and other
partners) is scheduled to be commissioned in
the first half of calendar year 2019 (tower and
stringing work is substantially advanced, and
the converter station is under construction).
With this interconnection to Kenya, capable
of more than 2,000 MW of transfer capacity,
exports will be expanded to Tanzania and
possibly other countries in the EAPP. Over
the medium term, additional connections to
Sudan and the Arab Republic of Egypt are
also planned. In addition, envisaged EAPP
interconnection to the Southern African Power
Pool could further open the market for Ethiopian
exports to Southern African countries.
is expected to rise 10-fold, from 1,443 GWh in
2016 to 14,657 GWh in 2023. Thus far, the
negotiated average price under the PPAs has
been US$0.07/kilowatt hour. Based on this, the
value of exports is expected to increase from
US$250 million in 2019 to US$1 billion in 2023
and US$1.2 billion in 2025 (table B1.2.1).
Figure B1.2.1 Ethiopia: Destination of Electricity Exports
20,000
15,000
10,000
5,000
02015
GWh
20212016 20222017 20232018 20242019 20252020
Djibouti Sudan Egypt/Sudan Kenya Tanzania
19

Value of exports (US$ millions)
Price (U.S dollar, kWh)¹
Volume (GWh)
101
0.07
1,443
523
0.07
7,471
101
0.07
1,443
811
0.07
11,586
101
0.07
1,443
872
0.07
12,457
1,118
0.07
15,971
1,026
0.07
14,657
1,210
0.07
17,286
250
0.07
3.571
Electricity Exports 2016 20202017 20212018 2022 20242019 2023 2025
Table B1.2.1 Ethiopia: Projections of Electricity Exports, 2016–25
Sources Ethiopian authorities and World Bank staff estimates.
¹ As per the Framework Agreement.
Projections are on a calendar year basis
33. Pressures on the financing of public investment projects may lead the government to relax its fiscal stance. Given the slow pace of
tax reforms, domestic revenue may be insufficient to
finance the infrastructure investments contemplated
in the national development plan, potentially
resulting in larger fiscal deficits. Crowding-in the
private sector to finance infrastructure (“the cascade”
or “maximizing finance for development”) could
usefully be explored to address the growing public
financial constraint. With limited improvements in
external competitiveness and the recent recovery in
oil prices, the current account balance is projected
to remain weak in the medium term. Furthermore,
monetary discipline will be required to preserve the
low-inflation environment experienced over the past
two years.
34. Ethiopia has received a large allocation of International Development Association (IDA) resources to enhance productivity in various social and economic sectors. With the record
high IDA 18 replenishment (for FY2018–FY2020),
Ethiopia’s IDA allocation increased by about 50
percent to reach US$4.8 billion. In addition, Ethiopia
has the potential to access more resources from
different IDA resource windows. These resources
are intended for investment in agriculture, urban
development, roads, energy, service delivery, and
human resource development such as education,
health care, and safety nets, and infrastructure
development. With the recently approved new
country partnership framework, the World Bank is
planning to frontload about two-thirds of the IDA
resources in FY2018, to maintain the continuity of
past investment programs, contribute to closing
the financing gap, and help address the foreign
exchange shortage. IDA resources are expected to
generate improvements in total factor productivity
and generate economic growth in the medium term.
35. The relatively low inflation environment experienced in the past two years may not last in the aftermath of the recent devaluation if monetary conditions are not tightened. Inflation can remain in single
digits, providing monetary policy remains tight.
However, the fast growth of reserve money
and recent devaluation of the Birr could trigger
inflationary pressures in the coming months. The
recent increase in deposit interest rates was a
welcome step in attempting to contain inflation.
The expected recovery in global commodity prices
is a further potential source of inflation of tradable
goods prices under loose monetary conditions.
36. Rising external imbalances and the worsening of the debt situation constitute major challenges to the economy. The lack
of external openness, rising international oil prices,
20

Source
Note
World Bank staff compilation, based on data from the Macro-Fiscal Forecasting Model.
GFCF = gross fixed capital formation; GDP = gross domestic product; GNFS = goods and non-factor services.
and an overvalued exchange rate (after the recent
devaluation) will continue to have adverse effects
on the competitiveness of the economy. The rising
risk of external debt sustainability may potentially
impact Ethiopia’s access to external finance. The
reserve position is low and declining. Weak growth
of major trading partners (such as China) could
affect short- to medium-term growth. Finally,
although the state of emergency was lifted in August
2017, political disruption associated with social
unrest could negatively affect growth through lower
FDI, tourism, and exports.
A B
Figure 1.6 Economic Outlook: Selected Projections to 2019
GDP growth: Supply side, 2009–19 (%) Determinants of potential output, 2001–19 (%)
12.0
10.0
8.0
6.0
4.0
2.0
0.0
2009
2010 2011
2012
2013
2014
2017
2015
2018
2019
2016
3.2 2.54.1
2.23.1 2.3 2.6
0.92.2 2.0 1.9
1.0
5.9
10.0 10.611.4
8.79.9
10.3 10.4
8.0 8.0 7.98.3
7.0
5.7
4.4
4.1 5.8 5.1
4.03.4 3.2 3.1
1.1
1.5
2.12.8
2.22.7
3.12.7 2.8 2.9
ServicesAgriculture Industry GDP af factor cost
30
25
20
15
10
5
0
Capital stock
Potential GDP
Working age populationTFP
2001
2002
2003
2004
2005
2006
2007
2008
2009
2010 2011
2012
2013
2014
2015
2016
2017
2018
2019
C DGDP growth: (Demand side, 2012–19 (%) Fiscal and external balances, 2001–19 (%)
2218141062
-2-6
-10
-1
-3
-5
-7
-9
-11
-132012 2013 2014 2015 2016 2017 2018 2019
Private consumption
Exports, GNFS
GFCF
Real GDP General Gov’t fiscal balance
Public consumption
Imports, GNFS Current Account deficit
2001
2002
2003
2004
2005
2006
2007
2008
2009
2010
2011
2012
2013
2014
2015
2016
2017
2018
2019
21

Box 1.3
Ethiopia and the East Asian Model: Similarities and Differences
A key component of the East Asian model
is the high level of investment coupled
with high domestic savings rates. Further,
sound macroeconomic management was
instrumental in East Asia, contributing to
stable savings rates. This was supported by
liberalization and structural reform of the
financial sector, which allowed private firms
to access credit markets. Private investment
far outpaced public investment in Korea.
China’s model involved very high public
investment rates; yet, private investment also
increased rapidly in China as the economy
developed. But even where the public sector
played a large role, such as in China or
Vietnam, a much more pronounced role of
competition and market forces paved the
way for efficiency gains in the economy. High
savings rates allowed investment rates to rise
and remain at high levels. In addition, FDI
played a key role in the success of the East
Asian model, with the exception of Korea,
which had its development episode in the
pre-globalized world.
Another crucial element of the East Asian
model is export-led growth, especially through
active industrial policies for manufacturing
development. The ability of governments to
pursue strategies and plans based on an
identification of their countries’ comparative
advantages was instrumental. To foster and
support their export promotion activities, many
East Asian economies implemented additional
competitive exchange rate policies. Emphasis
on human capital was another characteristic
of the East Asian model, especially in the
cases of China and Korea. Investment in
research and development (R&D) also played
an important role, especially after the initial
phase of development.
Although Ethiopia shows a certain similarity with
the East Asian model, important differences
(summarized in table B1.3) raise questions
about the replicability of the East Asian model
in Ethiopia.
Similarities
High savings and investment rates are similar to
the levels observed in East Asia, but, given very
high investment rates, the savings-investment
gap is particularly pronounced in Ethiopia.
Strong agricultural production growth preceded
the economic take-off.
The role of SOEs in the economy in Ethiopia is
somewhat similar to their role in China (and
Vietnam), but lacks the notion of competition
to enhance SOE performance. Likewise,
SOE investment in the East Asian model saw
declining importance over time.
Differences
In Ethiopia, manufacturing exports are very
low compared with any of the comparator
countries considered.
At the same time, Ethiopia’s real exchange rate
is overvalued, and this is markedly different
from the East Asian model.
Ethiopia lags in providing credit to the private
sector, especially compared with China or
Singapore.
Although Ethiopia’s public investment push has
precedent in China’s experience, Ethiopia has
not seen private investment picking up to the
extent seen in China.
22

Korea, Rep. (1960–70)
Hong Kong SAR, China (1960–70)
Thailand (1960–70)
Indonesia (1966–76)
Malaysia (1967–77)
Singapore (1967–77)
China (1982–92)
Vietnam (1991–2001)
Cambodia (1995–2005)
Ethiopia (2004–15)
7.99
3.47
6.87
4.19
8.65
4.50
8.62
3.36
5.70
7.96
9.13
22.96
18.06
16.09
26.80
24.74
35.63
18.93
5.00
19.27
N/A
N/A
N/A
N/A
25.83
28.63
37.63
25.18
11.18
32.11
19.39
25.59
20.18
16.60
22.64
35.56
36.33
25.36
16.57
36.11
N/A
N/A
N/A
N/A
3.20
5.65
0.89
6.62
4.96
2.18
58.09
93.54
2.83
1.45
10.12
35.14
57.79
44.29
96.88
8.06
+
-
+
-
-
-
-
-
+
+
16.46
N/A
13.82
N/A
25.23
49.13
73.78
22.73
6.33
20.38
Country GDP per capita growth
(annual %)
Savings(% of GDP)
Gros
s do
mest
ic
Gros
s na
tiona
l
Gros
s cap
ital
form
ation FD
I
Manu
fact
uring
(% of
expo
rts)
Real
exch
ange
ra
te*
Investment(% of GDP)
Exports
Credit to private sector
(% of GDP)
Table 1.1: Summary: Ethiopia Compared with Selected Indicators in East Asia
Note A growth period is identified with a landmark political event and/or the liberalization and opening of the economy
if this coincides with accelerated growth. The periods identified do not imply that countries were not able to grow
during more than 10 years. GDP per capita: Korea only available from 1961; Hong Kong SAR, China, only
available from 1966; Thailand only available from 1961. Gross domestic savings: data on Ethiopia only available
from 2011. Gross capital formation: Ethiopian savings are based on the 2011 National Accounts revision, which
increased savings rates due to methodological changes. Data are only available for 2011–14. FDI: for the Republic
of Korea; Hong Kong SAR, China; and Thailand, data are not available in the growth periods. Data for Malaysia
are only available from 1970. Data for Singapore are only available from 1970. Manufacturing exports data: for
China, only available from 1984; for Vietnam, from 1997; for Cambodia, from 2000; for Ethiopia, until 2014.
Real exchange rate data: data for Ethiopia are only available until 2011. Credit data: for Vietnam, not available
in 1994; for Ethiopia, only avaialble for 2014. GDP = gross domestic product; N/A = not available.
23

2Services & Manufacturing Linkages:
Exploring the Potential of Distribution Services
24

37. This Ethiopia Economic Update focuses on the connection between services and manufacturing, to help advance the government’s export development agenda. Although the importance of services for development
is widely recognized, the role of services, tradable
and non-tradable, in growth and structural
transformation is generally less understood.
Services not only offer promising opportunities
for export diversification, but also are key inputs
in the production of most goods, for export and
domestic consumption. Services imports are equally
important, as they can improve the availability and
quality of services through increased competition,
better technologies, and access to foreign capital.
This, in turn, can have a strong impact on the
domestic business environment and lead to
productivity increases through broader access to
essential services inputs.
38. A dynamic services sector is a necessary condition for manufacturing and agroprocessing to thrive. Access to quality
services as inputs to production is important for
manufacturing performance. Lack of quality services
as inputs can impede the emergence of a competitive
manufacturing sector, which matters for the quality
and value addition of goods. Manufacturing and
agroprocessing cannot be competitive without
accessing good quality and varied inputs from the
services sectors. At this stage, however, Ethiopia
seems to lack adequate access to necessary services
inputs, such as finance, electricity, and water, as
evidenced by several studies.13
39. The objective of this Economic Update is to invigorate and deepen the discussion about the role of services as tradable activities, and as intermediate inputs in Ethiopia. The
analysis is conducted in the context of the debate
on growth and structural transformation in Ethiopia.
World Bank (2015) shows that Ethiopia did not follow
the conventional path of economic development
through export-oriented industrialization, with
workers moving from agriculture to high-
productivity manufacturing. The analysis contrasted
this “premature deindustrialization,”14 characterized
by a shift of labor from agriculture to services, with
the potential of services becoming the new growth
escalator15 for Ethiopia. The report concluded that
rather than following one approach or another,
Ethiopia would need to move forward across
all sectors, focusing on agricultural productivity
improvements, manufacturing growth to support
the strategy of industrialization, and development of
services. At the government’s request, emphasis will
be placed on distribution services,16 with individual
case studies on the role of distribution services as
inputs in the dairy, teff, sesame, and textiles value
chains complementing the analysis.
2.1. Introduction
World Bank (2014a).
Rodrik (2015).
Ghani and O’Connel (2014).
In the WTO Services Sectoral Classification List (MTN.GNS/W/120), largely based on the United Nations Provisional
Central Product Classification, the distribution sector is defined to include four major services: commission agents’
services, wholesale trade services, retailing services, and franchising. Commission agents are distinguished from the other
categories in that they trade on behalf of others, that is, they sell products that are supplied and usually owned by others to
retailers, wholesalers, or other individuals. Wholesale trade services consist in selling merchandise to retailers; industrial,
commercial, institutional, or other professional business users; or other wholesalers. Retailers sell goods for personal or
household consumption. Franchisers sell specific rights and privileges, for instance, the right to use a particular retail
format or trademark, defined as retail sales of motor vehicles and fuel (ISIC rev 3.1 G50), retail trade in all other goods,
and repair of personal and household goods (ISIC rev 3.1 G52) through specialized and nonspecialized outlets of all
dimensions (traditional stores, department stores, supermarkets, and hypermarkets). Hotels and restaurants are excluded.
13
14
15
16
25

41. Services are a large and dynamic sector, but manufacturing remains a relatively small and stagnant part of Ethiopia’s economy.17 As shown in World Bank (2015),
“Ethiopia’s Great Run,” the services sector was one
of the driving forces behind the country’s growth
acceleration. Recent data confirm that services
continue to contribute considerably to economic
growth and structural change. Services remain
not only the largest sector in economic output,
accounting for 41 percent of GDP in 2016, they
also accounted for about 50 percent of economic
40. What is the role of services in Ethiopia’s structural transformation? How do distribution services contribute to Ethiopia’s growth and structural transformation? What are feasible reforms to accelerate their positive impact on the economy? To
answer these questions, the next section discusses
the importance of services for the country’s growth
and development, looking at the services content
of economic activity, services employment, services
trade and value added in exports, and the role
of services as intermediate inputs. The role of
growth over the past decade (figure 2.1). Over
the past years, Ethiopia’s output more than tripled
in real terms, taking over agriculture as the sector
contributing the most to GDP.18 Since 2005, the
sectoral drivers of growth have shifted further
toward services, and more recently, industry.
However, as noted in World Bank (2015), the
recent rise of industry is due to a construction
boom rather than being driven by a rise in the
manufacturing sector, which has been largely
stagnant at about 4 percent of GDP.
distribution services is highlighted in the analysis.
The following section presents a diagnostic of
distribution services markets in Ethiopia. In doing
so, the section pays special attention to their
poverty-reducing potential and the challenges
that impede the growth of the sector. Next, the
report highlights the role of distribution services
in value chains, with an emphasis on their role
as intermediate inputs and tasks in dairy, teff,
sesame, and textiles. The last section discusses
options for policy reforms.
2.2. Setting the Stage: Services in Ethiopia’s Economy
The analysis is based on latest available data: World Development Indicators and Balance of Payments Statistics published
in 2017, World Bank Value Added Database - latest version for 2011, Input-Output Table for Ethiopia - latest available
data for 2011.
Martins (2014).
17
18
Services offer promising direct and indirect opportunities for Ethiopia’s manufacturing development
26

A B
Figure 2.1 Sectoral Contributions to Ethiopia’s Economy
Sectoral share in GDP, 2005–16 Sectoral GDP growth contributions, 2005–16 (%)
60
50
40
30
20
10
0
14121086420
Share
of G
DP, %
GDP g
rowth
contr
ibutio
n by s
ector
2005
2006
2007
2008
2009
2010 2011
2012
2013
2014
2015
2016
2005
2006
2007
2008
2009
2010 2011
2012
2013
2014
2015
2016
Industry IndustryServices Services GDP GrowthAgriculture Agriculture
6 5 4 4 3 24
2 3 2 3 1
11 1 1 1 1
22
32 4 4
5 57 7 6
86
44 6 5 4
Sources World Development Indicators 2017, Macro Poverty Outlook, 2017.
42. Although the structure of output shifted from agriculture toward services, the corresponding employment shift was modest. Despite the shift of output from
agriculture to services, agriculture continued to
dominate employment, although its employment
share declined from 80.2 to 77.3 percent between
2005 and 2013. Although workers moved mainly
into services (1.8 percentage points), Ethiopia’s
services sector still absorbs only a small share of
the population (World Bank 2015). In high-income
countries, where services tend to explain the
largest share of GDP, compared with agriculture
and manufacturing, services employ 74 percent
of the workforce on average (40 percent in upper-
middle-income countries and 33 percent in lower-
middle-income countries) (Hollweg et al. 2005).
By contrast, in Ethiopia, in 2005 the services sector
employed only 14.7 percent of the workforce even
if it accounted for about 40 percent of value added,
and in 2013 it was estimated to employ about 20
percent of the workforce (figure 2.2, panel a).
This share lies significantly below the average for
countries at similar levels of development with a
similar share of services in GDP, and is lower than
all comparators.
43. Fast labor productivity growth in services may explain the gap between the composition of employment and output changes. Labor productivity in most
services grew much faster than in agriculture and
manufacturing (figure 2.2, panel b), pointing
once again to the dynamism of services. Labor
productivity levels are the highest in sectors such as
distribution (commerce), finance, utilities, mining,
and transport, and lowest in agriculture and
manufacturing. For instance, labor productivity in
distribution was twice as high as in manufacturing
and construction.
27

A
A
B
B
Figure 2.2 Employment by Sector and Labor Productivity
Figure 2.3 Services Value Added and Employment Shares in Ethiopia
Employment, by sector (%)
Value-added shares (%)
Labor productivity growth, 1999–2013 (%)
Employment shares (%)
Note SourceCHN for 2015, ETH for 2013, TZA for 2014,
UGA for 2013, KOR for 2016 and VNM for 2015
World Bank (2015).
44. Distribution (or commerce), other services, and the public sector are the most important services subsectors for services output and employment in Ethiopia. These
three sectors account jointly for 85 percent of
sector value added and 92 percent of services
jobs. Specifically, each sector accounts for
roughly a half, a quarter, and a fifth, respectively,
of value added and jobs in the services sector.
The remaining services sectors are transport
(10 percent of services output and 6 percent of
services jobs) and finance (5 percent of services
output and 2 percent of services jobs) (World
Bank 2015). Output shares have hardly changed
over time, although the employment shares have
increased in “other services” and public services
and declined in commerce (figure 2.3).
100
80
60
40
20
0
Other servicesPublic services
FinanceTransport
CommerceConstruction
UtilitiesManufacturing
MiningAgriculture
% of
total
emplo
ymen
t
Industry ServicesAgriculture
28
73 68 7244
5
29
76 7
23
25
4220 26 21 33
70
CHN ETH TZA UGA VNM KOR -10 -5 0 5 10
3.82.6
2.69.1
4.3
4.4
3.0-6.6
-0.7
-2.0
TransportOther services
FinanceCommercePublic services
1999 19992005 20052013 2013
100%
80%
60%
40%
20%
0%
100%
80%
60%
40%
20%
0%
TransportOther services
FinanceCommercePublic services
28

45. A striking feature of the Ethiopian services sector is its significant role as an exporting branch of the economy. Not only
did services exports account for more than 50
percent of Ethiopia’s total exports between 2005
and 2015 (figure 2.4), but the share of services
exports in the sector’s output (fluctuating between
17 and 26 percent over the past decade) was
comparable to the export-to- output ratio of
Ethiopia’s traditional export products. For example,
46. Services exports and imports are higher than expected from an average country at Ethiopia’s level of development. A cross-
country regression based on the International
Monetary Fund Balance of Payments Statistics
shows a positive picture, indicating that Ethiopia’s
services exports were slightly higher than expected
for an average country at its level of development
(figure 2.5, panel a). It is important to point out
that although exports of services are critical to
Taffesse and Ferede (2004) reveal that in 2000
the “other services” sector’s exports-to-output ratio
was marginally higher than that of the “traditional
agricultural exportables” sector, which includes
tea, flowers, fruits, and vegetables. Furthermore,
despite relatively underdeveloped infrastructure,
Ethiopia’s services trade has registered dynamic
growth rates over the past 10 years. Recent data
reveal a compound annual growth rate for services
exports of 16 percent over 2011–13.
the efficient functioning of an economy, services
imports are equally important. Imported services,
especially from developed countries, often
enhance the total factor productivity of domestic
firms. Ethiopia seems to be taking advantage of
cheaper and higher quality services from abroad.
Ethiopia’s services imports are again higher than
what would be expected for a country at its level
of development (figure 2.5, panel b).
100
80
60
40
20
0
100
80
60
40
20
0ETH ETHKEN KENKOR KORUGA UGARWA RWATZA TZAZMB ZMB
Share
of Ex
ports
2005
Share
of Ex
ports
2015
Goods GoodsServices Services
A B2005 2015
Figure 2.4 Shares of Services in Total Exports, 2005 and 2015
Source IMf BOP 2017.
29

47. Ethiopia’s exports and imports are concentrated heavily in traditional services activities; the country’s modern services exports remain among the lowest of its comparators (figure 2.6). “Modern services”
include communication, banking, insurance,
business, and remote access services; transcription
of medical records; call centers; and education.
These services differ from “traditional services,”
such as transport or travel, which demand face-
to-face interaction. In addition to being important
inputs into production, modern services exhibit
higher productivity and generate high-skilled and
better-paid jobs. However, many modern services
sectors have relatively low employment intensity
and require higher educational levels. Ethiopia’s
exports and imports of traditional services as a
share of GDP reached 7 percent in 2010–12,
significantly overperforming comparator countries
(except Tanzania and Kenya) and other countries
at a similar level of development. Instead, Ethiopia
significantly underperforms in modern services
exports and imports, which measured close to 2
percent of GDP in 2010–12.
A
A
B
B
Services exports
Exports of traditional services
Services imports
Exports of modern services
Figure 2.5 Ethiopia’s Services Exports and Imports, 2013–15
Figure 2.6 Traditional and Modern Services Exports and Imports versus GDP per Capita, 2013–15
60
50
40
30
20
10
0
100
80
60
40
20
0Expo
rts of
servi
ces a
s % of
GDP 2
013-2
015
Impo
rts of
servi
ces %
of G
DP 20
13-20
15Log GDP per capita (Current US$) 2013-2015 Log GDP per capita (Current US$) 2013-20156 8 10 12 6 8 10 12
30
20
10
0
40
30
20
10
0
Expo
rts of
tradit
ional
servi
ces %
of G
DP
2013-
2015
Expo
rts of
mod
ern se
rvice
s % of
GDP
20
13-20
15
Log GDP per capita (Current US$) 2013-2015 Log GDP per capita (Current US$) 2013-20156 8 10 12 6 8 10 12
30

C DImports of Traditional Services Imports of Modern Services
25
20
15
10
5
0
40
30
20
10
0Impo
rts of
tradit
ional
servi
ces %
of G
DP
2013-
2015
Impo
rts of
mod
ern se
rvice
s % of
GDP
20
13-20
15
Log GDP per capita (Current US$) 2013-2015 Log GDP per capita (Current US$) 2013-20156 8 10 12 6 8 10 12
Source WDI, 2017.
48. The expansion of Ethiopia’s services exports was mainly driven by transport and travel. Jointly, they accounted for 90 percent of
total services exports in 2012, up from 75 percent
in 2002. This is attributed to Ethiopian Airlines,
which is Ethiopia’s largest export earner (three
times as big as coffee) and accounts for 60 percent
of Ethiopia’s services sector (World Bank 2014).
Ethiopia’s services export structure is very similar
to that of Zambia or Kenya, with high shares of
transport and travel. It contrasts with that of Korea,
a substantially more developed economy, where,
even if transport is one of the largest subsectors,
modern services such as insurance play an
important role. Modern services exports have
been growing slower and inconsistently for some
sectors, including financial and other business
services.19 China and Korea, as well as Tanzania
and Uganda, have been successful in exporting
other business services.
49. Although important, the contributions of services to GDP and gross trade data ignore the links that services have with other sectors of the economy. Indicators
such as forward and backward linkages, gross
exports, direct value-added exports, and total
value-added exports can be used to assess the
role of services in the domestic economy and in
relation to international trade (box 2.1).
The category “other business services” includes merchanting and other trade-related services; operational leasing services;
and miscellaneous business, professional, and technical services (legal, advertising, consulting, accounting, R&D, and
so forth).
19
31
Box 2.1
Measuring Services Linkages
In addition to value added as a percentage
of GDP and employment per sector, more
sophisticated indicators, such as forward and
backward linkages, can be used to assess
interlinkages in an economy. The value added
of production for domestic and export markets
can be used to estimate how much value added
a country carries over from other sectors and
how much value added it brings forward into
other sectors.
Forward linkages indicate how much value
is carried by other sectors, that is, how
important each sector is as an intermediate
input for other sectors. This indicator treats the
sector as an upstream activity. Some studies
consider forward linkages as a measure of the
“upstreamness” of the industry (for example,
Antras et al. 2012).
Backward linkages show how much value
added a sector carries from other sectors,
that is, how much the sector embodies inputs
that it will further process. This indicator treats
the sector as a downstream activity. Some
researchers contend that backward linkages
measure the “length of global value chains”
(for example, Fally 2011).
Other measures that quantify the degree to which
the value added of services goes into downstream
exported sectors include the following:
Gross exports. Gross or total exports capture
the value added embodied in the production of
the exports as well as all domestic and imported
intermediate inputs. Gross measures of trade
statistics are registered in customs or balance
of payments, usually at the transaction value,
that is, the price paid or payable for the goods
and services. Transaction values measure the
gross value of goods and services.
Direct value added of exports. This is a sector’s
domestic value added embodied in its own
exports, measured as gross exports less
domestic and foreign inputs. The measure
captures the true sector-specific value added
of exports. It is increasingly important in
an environment where global production
is fragmented across production-sharing
networks. For example, a business process
outsourcing (BPO) service from India contains
telecommunication services, from local
providers and from foreign owners of satellites.
The delivery price of the BPO service accounts
for the cost of such inputs. The direct value of
exports nets out domestic and foreign inputs
and captures the true value added generated
in the BPO sector in India.
Total value added of exports. This measure
adds to the direct value added of exports the
portion of the value added of the inputs that
are produced domestically. To continue with
the BPO example, the measure captures the
value added of the BPO service plus the value
of the domestic satellites used as inputs in the
underlying telecommunication service (but
not the value of the foreign-owned satellite
input). The measure captures the full domestic
component of an exported service. This in turn
can be expressed in terms of forward and
backward linkages. Figure B2.1.1 explains
these concepts.
32

GROSSEXPORTS
Intermediate Inputs
Upstream costs of intermediate
inputs
Foreign value added of imported
intermediate inputs
Value added of intermediate
inputs
Domestic value added of
intermediate inputs (IDVA)
Direct value added of exports(DVAE)
Total value added of exports =DVAE + IDVA
Figure B2.1.1 Total Value Added of Exports
50. Ethiopia continues to outperform comparators when measuring services exports on a value-added basis (figure 2.7).
Ethiopia’s gross services exports as a share of
total exports are the highest when benchmarked
against peer countries (except Zambia). Ethiopia
also outperforms other countries at a similar level
of development in all three measures of services
export shares (the share of services in total exports
measured as gross, direct, or total value added).
The direct value added of Ethiopia’s services
exports continues to be one of the highest among
comparators (with the exception of Kenya).
Figure 2.7 Services’ Export Share (Gross Value, Direct Value Added, and
Total Value Added Considering Forward Linkages), 2011
80
60
40
20
0Ethiopia Vietnam Kenya TanzaniaChina Korea Uganda Rwanda Zambia
Direct TotalGross
Source World Bank Value Added Database.
33

51. In contrast with other comparators that have successfully generated a strong manufacturing export base, the structure of the services contribution to domestic production and exports is strikingly similar in Ethiopia. In general, the direct contribution of
services is more important for other comparator
countries’ GDP than for Ethiopia’s. In Ethiopia,
the direct contribution of services represents 48
percent of services’ total contribution to GDP,
compared with 59 percent in China, 68 percent
in Korea, and 78 percent in Vietnam. This suggests
that services in Ethiopia tend to be used more as
inputs than final consumption. The opposite is true
for exports, where services are exported directly
or by other services sectors. Services inputs into
manufacturing exported value added are much
more important in China, Korea, and Vietnam
than in Ethiopia (figure 2.8), while manufacturing
production and exports rely more heavily on
services in Ethiopia than in the other countries
(figure 2.9).
Source
Source
World Bank Export of Value Added Database.
World Bank Export of Value Added Database.
A
A
B
B
Percentage of GDP
Percentage of GDP
Percentage of exported value added
Percentage of exported value added
Figure 2.8 Composition of Services Value Added (Forward Linkages), 2011
Figure 2.9 Composition of Manufacturing Value Added (Backward Linkages), 2011
ETH ETHCHN CHNKEN KENKOR KORUGA UGARWA RWAVNM VNMTZA TZAZMB ZMB
100%
80%
60%
40%
20%
0%
100%
80%
60%
40%
20%
0%
Inputs into ervicesInputs into primary production
Inputs from ServicesInputs from Primary production
Inputs from ServicesInputs from Primary production
Inputs into ServicesInputs into Primary production
Inputs into ManufacturingDirect value added
Inputs from ManufacturingDirect value added
Inputs from ManufacturingDirect value added
Inputs into ManufacturingDirect value added
ETH ETHCHN CHNKEN KENKOR KORUGA UGARWA RWAVNM VNMTZA TZAZMB ZMB
100%
80%
60%
40%
20%
0%
100%
50%
0%
34
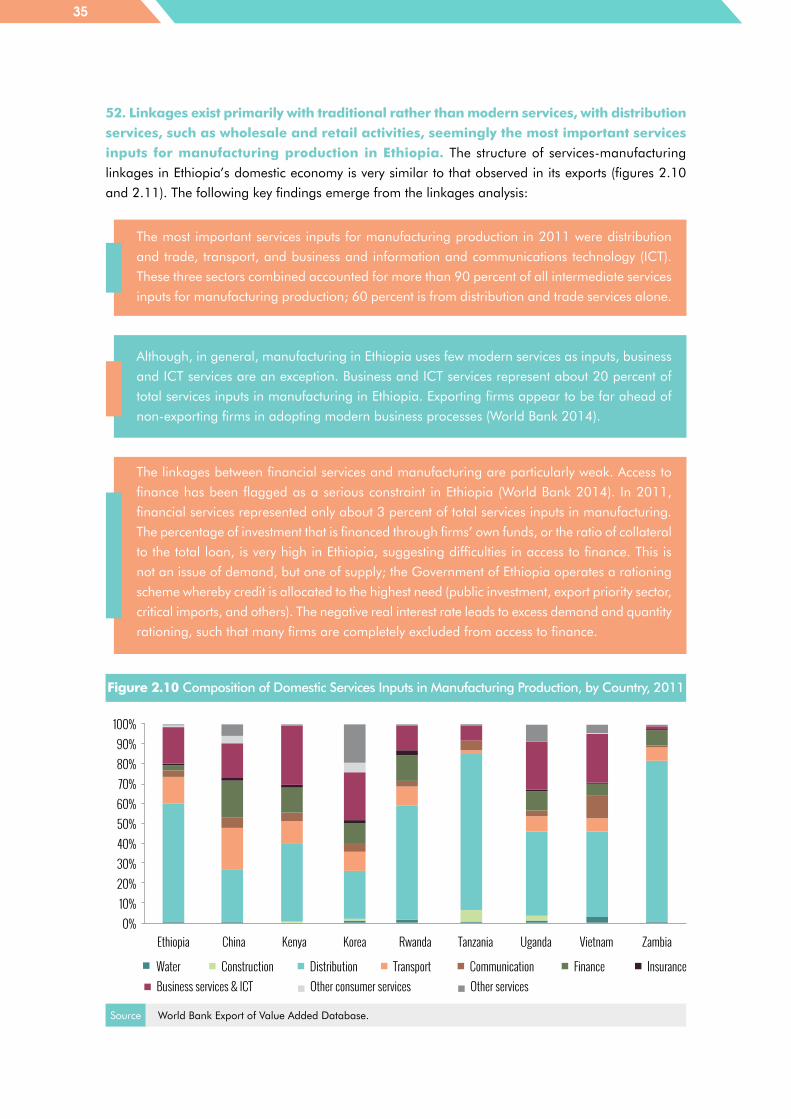
52. Linkages exist primarily with traditional rather than modern services, with distribution services, such as wholesale and retail activities, seemingly the most important services inputs for manufacturing production in Ethiopia. The structure of services-manufacturing
linkages in Ethiopia’s domestic economy is very similar to that observed in its exports (figures 2.10
and 2.11). The following key findings emerge from the linkages analysis:
The most important services inputs for manufacturing production in 2011 were distribution
and trade, transport, and business and information and communications technology (ICT).
These three sectors combined accounted for more than 90 percent of all intermediate services
inputs for manufacturing production; 60 percent is from distribution and trade services alone.
The linkages between financial services and manufacturing are particularly weak. Access to
finance has been flagged as a serious constraint in Ethiopia (World Bank 2014). In 2011,
financial services represented only about 3 percent of total services inputs in manufacturing.
The percentage of investment that is financed through firms’ own funds, or the ratio of collateral
to the total loan, is very high in Ethiopia, suggesting difficulties in access to finance. This is
not an issue of demand, but one of supply; the Government of Ethiopia operates a rationing
scheme whereby credit is allocated to the highest need (public investment, export priority sector,
critical imports, and others). The negative real interest rate leads to excess demand and quantity
rationing, such that many firms are completely excluded from access to finance.
Although, in general, manufacturing in Ethiopia uses few modern services as inputs, business
and ICT services are an exception. Business and ICT services represent about 20 percent of
total services inputs in manufacturing in Ethiopia. Exporting firms appear to be far ahead of
non-exporting firms in adopting modern business processes (World Bank 2014).
Figure 2.10 Composition of Domestic Services Inputs in Manufacturing Production, by Country, 2011
100%90%80%70%60%50%40%30%20%10%0%
Ethiopia China Kenya Korea Rwanda Tanzania Uganda Vietnam Zambia
Other servicesDistribution TransportConstructionWaterOther consumer servicesBusiness services & ICT
InsuranceFinanceCommunication
Source World Bank Export of Value Added Database.
35

Figure 2.11 Composition of Domestic Services Inputs in Manufacturing Exports, by Country, 2011
Figure 2.12 Composition of Services Value Added in
Manufacturing Production, by Sector in Ethiopia, 2011
Source
Source
World Bank Export of Value Added Database.
World Bank Export of Value Added Database.
100%90%80%70%60%50%40%30%20%10%0%
Ethiopia China Kenya Korea Rwanda Tanzania Uganda Vietnam Zambia
53. Distribution services are the most important input for 11 of 14 manufacturing sectors (figures 2.12 and 2.13). Key findings based
on a disaggregated analysis by manufacturing
sector reveal that distribution services continue
to be the most important services input for
nearly all of Ethiopia’s manufacturing activities
(except paper and publishing and beverages
and tobacco). When considering all inputs (not
just services), distribution services are the most
important input for 11 of 14 manufacturing
sectors, and in nine manufacturing sectors
distribution services contribute more value added
than the manufacturing sector directly contributes.
Other manufacturingMachinery
Transport equipmentMetal products
MetalsNon-metallic mineralsChemicals & plastics
Paper & publishingWood products
LeatherClothingTextiles
Beverage & tobaccoProcessed foods
0% 20% 40% 60% 80% 100%
Other services
Other services
Distribution
Distribution
Transport
Transport
Construction
Construction
Water
Water
Other consumer services
Other consumer services
Business services & ICT
Business services & ICT
Insurance
Insurance
Finance
Finance
Communication
Communication
36

54. Although they are useful in providing the big picture on the role of services, results based on global databases need to be assessed with care. In addition to giving
an overall picture about services linkages with the
economy, global databases, such as the World Bank
Value Added Database or UNCTAD EORA Global
Multi-Region Input-Output Database, are valuable
for making comparative assessments among
countries. However, often such databases are
constructed with many assumptions to generate the
missing information (for instance, extrapolating or
interpolating values for missing observations through
cross-entropy methods) and then employ balancing
conditions for the entire data set.20 This means that
the data can be far removed from what is happening
on the ground. This is a particularly important point
for African countries, including Ethiopia. Indeed, we
find substantive differences in the contributions of all
economic sectors as input providers or demanders
of inputs if we compare the latest national input-
output table for Ethiopia with the World Bank Value
Added Database (figures 2.14 and 2.15). Moreover,
the sectoral classification in the input-output table
is different from the one in the World Bank Value
Added Database, making comparisons difficult.21
55. Statistical discrepancies call for a cautious interpretation of the results. Nevertheless,
evidence from a variety of sources seems to suggest
that, for manufacturing to succeed, a different
approach toward services is needed. In part, the
structure of manufacturing may be one that does
not demand substantial modern services. Little value
added is taking place, suggesting that Ethiopia may be
in assembly activities that demand primarily traditional
services. But even in sectors where more domestic
value added is generated, such as food processing,
there seems to be insufficient use of essential services
such as financial, utility, and water supply services.
Insufficient services may be inhibiting manufacturing
from moving into domestic value-added activities.
Lenzen et al. (2013, 2012).
For example, distribution services do not feature in Ethiopia’s input-output table. It remains unclear how the shares in the
World Bank database were computed. To enable comparative assessments, the team has opted to use the World Bank
database for the analysis.
20
21
Figure 2.13 Composition of Services Value Added in Manufacturing Exports, by Sector in Ethiopia, 2011
Source World Bank Export of Value Added Database.
Other servicesDistribution TransportConstructionWaterOther consumer servicesBusiness services & ICT
InsuranceFinanceCommunication
Other manufacturingMachinery
Transport equipmentMetal products
MetalsNon-metallic mineralsChemicals & plastics
Paper & publishingWood products
LeatherClothingTextiles
Beverage & tobaccoProcessed foods
0% 20% 40% 60% 80% 100%
37

Firm-level diagnostics can shed further light on
important questions behind this result. For a better
understanding of the relationship between services
and the economy, analyses based on more recent
input-output tables as well as firm-level data would
be needed to complement the current examination.
Figure 2.14 Inputs into and from Productive Sectors in Ethiopia,
Based on the World Bank Export of Value Added Database for 2011
Figure 2.15 Inputs into and from Productive Sectors in Ethiopia,
Recalculated Based on the Input-Output Table for Ethiopia for 2011
ALL INTERMEDIATE INPUTS ALL INTERMEDIATE INPUTS
22% 7%4% 56%74% 37%from
agriculture, energy & minerals
to agriculture,
energy & minerals
from manufacturers
to manufacturers
from services
to services
ALL INTERMEDIATE INPUTS ALL INTERMEDIATE INPUTS
47.57% 11.38%14.07% 34.99%38.35% 53.61%from
agriculture, energy & minerals
to agriculture,
energy & minerals
from manufacturers
to manufacturers
from services
toservices
56. Distribution services have become a significant driver of growth in Ethiopia over the past decade. Distribution services contribute
about 15 percent of GDP and employ an important
part of the population (over 42 percent of the active
population in 2013, including a high proportion of
informal, unskilled, female, and part-time workers)
(World Development Indicators, National Labor
Force Survey). The recent growth of distribution
services has been propelled by strong economic
growth over the past decade, increasing population,
continued urbanization, higher incomes, and
political stability, leading to the emergence of
supermarkets and larger retail stores mainly in the
capital, Addis Ababa (USDA 2016).
2.3. Potential of Distribution Services
38
57. Distribution services have experienced emerging recognition in Ethiopia. For
example, GTP II covering 2016–20 states that
retail and wholesale are expected to be important
drivers for services sector growth during the plan
period. In addition, improvements in wholesale
and retail trade-related activities are expected to
boost the transport and storage sectors.
58. Indeed, as a crucial link between suppliers and producers, distribution services have great economic potential. With improved efficiency
and higher productivity, due to the emergence of
supermarket chains, the sector has great potential
to benefit producers and consumers and contribute
to increased food security and the alleviation of rural
poverty. From the perspective of producers, modern
distribution channels, procurement systems, and
buying centers can reduce transaction costs and
facilitate market exchanges, which increase the
access of small farmers to high-value markets and
accelerate the transition from subsistence farming to
market participation.
Retail
59. At this stage, Ethiopia’s retail sector is characterized by little to no formal shopping culture, with existing formal markets relying almost exclusively on basic
consumer packaged products and dry goods. Ethiopia’s retail market has limited market
saturation, but also low maturity. Supermarkets
sell few fresh products; rather, fresh products are
grown at home or acquired in informal markets.
Consumer spending is generally much lower
than in more mature, neighboring markets. For
buyers in these markets, price is the key factor (A.
T. Kearney 2014, 2015). Formal distributors in
Ethiopia tend to be supermarkets and small and
medium-size retailers. Modern retail stores have
direct procurement systems and buying centers.
Retail outlets, including supermarkets, tend to grow
by first focusing on urban areas and large cities,
mainly the capital city (box 2.2).
60. For consumers, the emergence of supermarket chains in Ethiopia is starting to transform the retail environment in the country. Many middle-class consumers already
benefit from a greater variety of goods at
affordable prices in modern retail outlets. The rise
of supermarkets and their operational efficiencies
is expected to lower prices further throughout
the food system, to the benefit of consumers.
This is especially likely for processed and semi-
processed goods, such as maize meals, wheat
flour, bread, oils, meat, fish, and dairy, which
typically make up more than 50 percent of these
stores’ sales (Minten and Reardon 2008).
Box 2.2
Players in Ethiopia’s Retail Grocery Business
Eight major supermarket chains, with a total of
21 stores, are open across Addis Ababa. The
major food retail stores—Shoa, Fantu, Safeway,
Friendship, Bambis, All-Mart, Novis, and Loyal—
supply a wide array of products, most of which
are imported foods and beverages. In addition
to these major players, there are many mid-size
and smaller stores that supply the market.
The United States, Europe, Turkey, the Arab
Republic of Egypt, and the United Arab Emirates
are among the top suppliers of food and
beverage products sold through Ethiopia’s retail
grocery sector. Most retailers tend to import from
a single country/region, mainly due to historical
reasons or personal connections. For example,
Novis and Bambis prefer to import most of their
food products from Europe. Shoa generally
sources from the United Arab Emirates. Fantu
imports a large portion of its food products from
the United States.
39

Wholesale
61. In the wholesale segment, we observe a high degree of duality between traditional and specialized wholesalers.22 Traditional
chains are still widely prevalent in Ethiopia. Farmers
and traders supply traditional wholesalers, who
then sell to individual retailers and processors.
But most modern retail stores have their own
direct procurement systems and buying centers.
Furthermore, state-owned enterprises are present
in Ethiopia’s wholesale market. However, Alle,
the state-owned and privately managed cash-
and-carry wholesaler, which the government set
up to create a competitive and market-oriented
business environment in the sector before
allowing competition from international players,
is struggling for relevance (box 2.3).
Box 2.3
ALLE Struggles for Relevance
In addition to direct imports, most retailers
purchase certain imported items from one
another or from one of the large importers/
distributors, such as Teji International Trading. The
main reasons for this sourcing practice are price,
capacity, and distribution rights. For example,
depending on the type of product, some retailers
may prefer to purchase some of their imported
The state-owned and privately managed
business enterprise Alle Bejimla was set up with
the primary objective to supply wholesale food
and other consumer goods and stabilize prices.
The government also expected that Alle would
inject a market-oriented and competitive business
environment into the wholesale consumer goods
supply, which is dominated by a few companies.
foods from local trading companies, which can
bring in a large single-product shipment (for
example, breakfast cereal) in multiple containers
with more competitive pricing. In addition, some
retailers, which are large enough to import, have
exclusive contracts with foreign suppliers and act
as the de facto distributor in the country, selling
certain products to other retailers and businesses.
With its expansion plans being impeded by
various challenges, including the provision of
land by government offices, Alle has managed
to open only six units across the country, of which
three are in the capital. Its plan was to have 36
outlets in three years, a minimum of 12 units
annually. Consumers are also yet to witness Alle’s
contribution to stabilizing food prices.
Source
Source
USDA (2016).
The Reporter, Ethiopia.
Tschirley et al. (2014) anticipate that this duality between traditional and modern distributors will be preserved over the
next 30 years in East Africa. Although they expect profound changes in the composition of what is consumed and at least
a tripling of the share of the modern sector, a large share will remain in the hands of the traditional sector.
22
40

Franchising
62. The franchising segment is small and mostly limited to foreign firms. In July 2016,
the Ethiopian Parliament approved a Commercial
Registration and Business License Proclamation
that allowed registration of franchises. Difficulties
in enforcing intellectual property rights, product
quality control issues, cumbersome banking
regulations, and limited access to foreign
exchange make franchising difficult. Despite these
challenges, several branded U.S. companies, such
as Pepsi-Cola, Sheraton, Hilton, Marriott, Radisson
Blu, and Ramada, have franchise operations
in Ethiopia. In May 2017, Pizza Hut signed a
franchise agreement with the Ethiopian Belayab
Food and Franchise Plc to open the first Pizza
Hut stores in Ethiopia. The first Pizza Hut store
is expected to start operation in the coming six
months. Electronic commerce is still in its infancy
in Ethiopia and is rarely used. The Government
of Ethiopia is preparing a draft national law to
govern e-commerce.
Informality
63. Informality prevails despite the emerging diffusion of modern retail stores. Despite the growth of the higher-end supermarket
segment, the number of traditional small stores
that sell local produce remains high in Ethiopia’s
retail market. In general, the distribution sector
includes a few large supermarkets, slightly more
large to medium-size wholesalers and retailers,
and a much greater number of independent
and often informal small retail shops and street
vendors. Such informal retailers can be found in
urban and rural areas, and are often the primary
enterprises engaging in distribution services
outside larger cities. Most businesses in the
informal sector are engaged in the retail of food
and basic retail household appliances, and are
single-shop sole proprietorships. An estimated
70-80 percent of sales in Ethiopia still go through
informal enterprises, with only about 20 percent
of sales going through formal outlets. Although
informal enterprises handle the large majority of
sales, turnover is low for most individual informal
enterprises and businesses tend to be very small.
Enterprises in the informal sector are more limited
in their operational capacities than businesses in
the formal sector. Lack of access to finance, uneven
cash flows, absence of management knowledge,
and highly fragmented and inefficient supply
chains are key constraints faced by enterprises
in the informal sector. Informal retailers are also
suboptimal from a governance perspective, since
it is difficult or impossible to collect taxes (value-
added tax, excise tax, import duties, and so forth)
from unregistered businesses without licenses.
64. Despite positive developments and optimistic expectations for the sector, modern distribution channels still fail to capture a large portion of the retail market in Ethiopia. The distribution sector in
Ethiopia has undergone several transformations
in the past decade, but the impact on poverty
reduction remains uncertain. Many middle-
class consumers benefit from a greater variety
of goods at affordable prices in modern retail
outlets. The modern procurement systems and
buying centers established by supermarkets have
also improved the lives of participating farmers.
However, very poor urban households at the
bottom of the income pyramid pay higher prices
for basic goods and services than do wealthier
consumers—in cash or in the effort they must
spend to obtain them—and they often receive
lower quality as well. Box 2.4 illustrates the
price penalty for sugar and teff affecting poor
consumers in Addis Ababa.
41

Box 2.4
The Bottom of the Pyramid Penalty
In informal settlements, retailers buy normal
goods from wholesalers or retail outlets and
break them down into smaller affordable
quantities. For instance, poorer consumers
cannot afford to buy the 2-kilogram packet of
sugar that retails at about Birr 56 (or US$2.4) in
most shops; however, they can afford to buy a
pack of 250 grams at Birr 10 (or US$0.4). This
makes goods affordable for poor households.
Some retailers in informal settlements have
weight scales. But by and large, the portions
are meted out without weighing them. Thus,
Although the smaller quantities are more
affordable to poor consumers, they are paying a
considerably higher unit price for these products.
Table B2.4.1 illustrates this point, where a 250-
gram pack of sugar retails at a 43 percent
premium, and a 250-gram pack of teff at a 25
percent premium. The poorest members of the
society pay more for their essential goods than
ordinary Ethiopians.
the packs found in these retail kiosks weigh
sometimes more, sometimes less.
Source Interviews in Addis Ababa, June 2017.
Figure B2.4.1 Price Comparison of Selected Products in Informal Settlements
Sugar
Teff
40
30
28
24
43
25
Commodity Kiosk price for units less than 250 grams (Birr/kg)
Supermarket price (Birr /kg)
Price differential for units less than 250 grams (%)
65. Moreover, given that the majority of the population depends on agriculture, small-scale farmers have sometimes found themselves marginalized by the distribution sector and its new practices. Given the high
fixed costs associated with participation in modern
chains, many small farmers and traders are not
able to participate in modern procurement systems
and continue to supply traditional wholesalers,
who then sell to individual retailers and processors.
As the supermarkets in the highest tier tighten their
demands for consistency in volume and quality,
small producers and undercapitalized brokers face
tougher competition from larger producers and
risk being squeezed out of the system altogether.
42

Constraints to Distribution Services
66. In the formal sector, explicit trade barriers and regulatory measures obstruct the entry and limit the operations of distributors. Typical barriers and regulations
affecting distribution services are listed in box
2.5. Formal trade barriers stop countries from
importing the necessary services to respond to
demands for affordable and quality services
and address the skills shortages and skills
mismatches that prevent farmers and small and
medium-size enterprises (SMEs) from accessing/
benefiting from modern distribution channels. In
addition to the explicit trade barriers that limit
the distributors’ ability to establish themselves in
other countries, several other regulatory issues
may explain the negative outcomes in the sector.
Box 2.5
Typical Explicit Trade Barriers and Regulatory Obstacles Affecting Distribution Services
Formal Trade Barriers Typical restrictions that affect trade in distribution services differ by mode of supply,a but typically
include the following for the relevant modes of supply (modes 1,3 and 4) for distribution services:
Mode 1
Restrictions on cross-border trade can have negative effects on distribution services,
especially those where supply chains cross from the territory of one country to that
of another. Such restrictions that could be particularly relevant to distribution services
include (i) restrictions on electronic sales, (ii) quotas or economic needs tests that restrict
the number of suppliers, or (iii) restrictions on payments and transfer of funds abroad.
Mode 3
Restrictions on commercial presence can have negative effects on distribution services,
especially where foreign chains are prevalent in domestic markets. Such restrictions that
could be particularly relevant to distribution services include (i) limitations on the numbers
of permitted suppliers, legal form (including joint venture requirements), foreign equity
capital limits, and discriminatory tax/fiscal measures; (ii) restrictions on the legal form of
distribution outlets; (iii) nationality requirements on staff, or restrictions on the recruitment
of foreign personnel; or (iv) different regulatory frameworks for foreign establishments
than those that apply to private outlets.
Mode 4
Restrictions on the presence of foreign persons can have negative effects on distribution
services. Such restrictions that could be particularly relevant to distribution services include
(i) burdensome immigration requirements, (ii) quotas on the number of service suppliers,
(iii) nationality or residence requirements, or (iv) labor market tests (for example, horizontal
43

Domestic Regulatory Barriers The typical regulatory measures in the distribution sector generally relate to market access and
conduct regulation:
a. Trade in services can take place through four modes: (i) cross-border trade (from the territory
of one Member into the territory of any other Member); (ii) consumption abroad (in the territory
of one Member to the service consumer of any other Member); (iii) commercial presence (by
a service supplier of one Member, through commercial presence, in the territory of any other
Member); or (iv) presence of natural persons (by a service supplier of one Member, through
the presence of natural persons of a Member in the territory of any other Member). See http://
www.wto.org/english/tratop_e/serv_e/gsintr_e.pdf.
measures or restrictions specific to the distribution sector that apply to staff traveling
across national borders to set up establishments to negotiate arrangements, or provide
instruction/training).
Market access. Typical regulations on market access include requirements for setting up
and opening a business, such as registration with the trade/regulatory bodies; regulations
on the establishment, extension, and location of commercial presence; regulations on
specific operations and products; the existence of local monopolies for some products;
and impediments to the establishment of large outlets.
Conduct regulation. In the distribution sector, the regulations on business practices may
have considerable effects on competition between services providers. The main sector-
specific measures captured under this category include regulations on prices, shop
opening hours, zoning regulations, seasonal sales periods, and the range of products
retailers or wholesalers may carry, as well as limitations on advertising and contracts
with suppliers. In addition, specific taxes may be applied only to large formal retailers,
or small retailers are exempted from certain taxes to protect small local incumbents.
67. Ethiopia’s Investment Code prohibits foreign investment in distribution. Several
international players, such as Walmart or
Nakumatt, the Kenyan supermarket chain, have
expressed interest in entering Ethiopia’s retail
market, but FDI restrictions as well as barriers
affecting all modes of supply will continue to
keep foreign retailers away. Foreign retailers in
low-income and emerging economies typically
offer consumers new products, improved product
standards and provide a market opportunity for
local suppliers of consumer goods, particularly
fresh food. OECD (2017) finds that hosting an
international retailer increases exports to the home
country of the retailer. The empirical findings are
backed by case studies documenting how retailers
engage with local suppliers of specific products,
providing incentives to comply with product and
44
process standards in export markets. In addition,
modern supermarket procurement systems,
often championed by foreign retailers, promote
healthier and safer production and processing
systems also locally. In many cases suppliers to
the local affiliate of the retailer over time become
regional and sometimes even global suppliers
to the retailer. Even when becoming a supplier
to a foreign-owned retailer does not lead to
exports, it may still open the entire domestic
market to the local farmer or food processing
plant, providing sufficient scale to invest in product
quality and modern technology. At this stage,
there are limited opportunities for foreign firms
in Ethiopia’s distribution sector: FDI restrictions
do not include fast-moving consumer goods,
and foreign companies can distribute and export
their specific products if they are manufactured
within the country. But foreign companies are
not allowed to engage in the distribution of any
imported goods. For example, the Heineken
brewery can distribute beer produced locally,
such as Heineken or Walia, but is not allowed to
distribute imported whisky.
68. In Ethiopia, new businesses, including all distributors, must register with the commercial registry, notify the authorities, and obtain licenses and permits to engage
in commercial activity. Fees depend on the
type of business permit required. Multiple
licenses are a significant challenge in distribution
services. The revised Commercial Registration and
Business Licensing Proclamation eliminates some
cumbersome and duplicative requirements, such
as the yearly renewal of business registrations
and the minimum capital requirements to set up
limited liability companies. The law removes the
requirement to obtain a “competency certificate”
except in technical sectors such as health and
environment. The Proclamation now allows
registration of franchises and holding companies.
69. The main restrictions affecting operations in the distribution sector are related to price regulation. Price controls
(maximum prices) exist in Ethiopia for essential
goods such as sugar, palm oil, bread wheat
flour, petroleum, and petroleum products.
Compounding this issue are the cartels that control
the prices and flow of certain goods, such as seeds
and fertilizers.
70. In addition to explicit trade barriers and regulatory obstacles, nontariff barriers hamper imports by modern retail chains in Ethiopia. Nearly all the processed and packaged
foods sold at major retail outlets are imported.
These products include breakfast cereals, candy,
cooking oils (such as soy, corn, sunflower, and
olive), rice, powdered milk, condiments (such as
mustard, ketchup, and salad dressing), pastas,
cookies and crackers, jams and jellies, and fruit
juices. The combination of import duties and taxes
on processed grocery food items is quite high, with
a cumulative tax burden of almost 65 percent.
45

Specific duties and taxes on processed food items
are as follows: import duty (30 percent); value-
added tax (15 percent), surtax (10 percent), and
withholding tax (3 percent). Furthermore, delays
due to bureaucracy and congestion at the ports
have a negative impact on the cost of importation
and stocking of appropriate inventory levels.
Measures concerning regulatory transparency
and administrative procedures are also a form
of nontariff barrier. These regulations involve
publication and communication of the regulatory
and licensing regimes, as well as administrative
procedures for allocating and renewing licenses.
Lengthy customs clearance affects cross-border
sourcing of retailers. Finally, excessive visa
processing time represents an additional cost,
especially when workers or managers need
to travel to provide their services, for training
purposes and so forth.
71. A poor business environment constrains the development of distribution services. Underpinning the smooth functioning of the
distribution sector are many enabling factors that
support the business environment for trade in
distribution services. These include the appropriate
framework conditions for doing business, which
imply, inter alia, rule of law, proper protection
of property rights and enforcement of contracts,
and a necessary degree of political and
macroeconomic stability. This also implies a
stable and secure environment in which to conduct
business and trade. In addition, the distribution
service supply chain relies on access to finance as
well as adequate physical and ICT infrastructure
to facilitate transactions at all stages in the supply
chain. Finally, smooth trade in distribution services
relies on appropriate human resource capacity
and skills at all stages of the value chain, as well
as the proper flow of information between actors.
72. Poor infrastructure affects distribution services. Due to poor road network conditions,
especially in rural areas, and traffic congestion
in the main cities, distributors are forced to make
early deliveries to avoid traffic jams and reduce
transportation costs. Cumbersome importation
processes due to bureaucracy and congestion at
the ports increase the price of imported goods
and complicate stocking and inventory planning.
Moreover, limited ICT infrastructure limits the
potential of e-transactions and e-government
procedures, particularly in customs clearance.
73. Limited human resources restrict the expansion of the distribution sector. The
distribution services supply chain may also be
affected by constraints on human resources,
which can be particularly acute with respect to
the availability of market-relevant skills such as
merchandising, category management, and just-
in-time inventory management. In addition to
the absence of formal training, a limited influx
of knowledge about best or good practice in the
sector can limit the growth of SMEs in the sector.
Talent shortages and limited training opportunities
46

impede the development of the distribution sector,
and the availability of market-relevant skills
remains an issue across the distribution sectors in
East Africa. Consequently, most formal distribution
businesses rely on training on the job. Further,
there is limited influx of knowledge on best or
good practice in the sector. Lack of access to
specialized training has led to slow growth and
late adoption of modern retailing techniques.
For example, many large supermarkets are
only beginning to understand the value of and
adopt modern retailing techniques such as
merchandising, category management, and just-
in-time inventory management.
Distribution Services in Value Chains
74. To illustrate more broadly the opportunities and challenges for producers and consumers in Ethiopia, the case studies explore the role of distribution services in the dairy, teff, sesame, and textiles value chains. These case studies (i) explore the role
of distribution services as intermediate inputs
and tasks in value chains in these sectors, and
(ii) show how distribution services affect structural
transformation defined from a new angle.
75. Although most definitions of structural transformation focus on sectoral changes,23 more recent literature broadens this view. It is in this context that the proposed analysis
aims to contribute to the debate, by focusing
on transformational productivity growth within
existing sectors. This more recent literature
considers structural change generated by the
movement of factors of production between
firms and reallocation of resources from lower
to higher productivity activities within the same
sector (see, for example, Hsieh and Klenow
(2009, 2012) and Page and Shimeles (2014)).
Indeed, in a world dominated by complex and
fragmented production processes, development
can be achieved by (i) functional upgrading, that
is, by moving to higher value-added tasks, and (ii)
process upgrading, that is, by specializing in the
tasks and activities of comparative advantage and
putting more technology, know-how, and auxiliary
services into such tasks that ultimately translate
into value addition and higher productivity.
76. This means that improvements and shifts in production within each sector are an important element of development, and transitioning from an agriculture to manufacturing is not the only avenue, as traditional development views suggest. It means instead increasingly embracing higher
value-added production or more productive
activities in the same sector or type of commodity,
or transitioning from informal production to
formal activities with the assistance of more
technology, services, and know-how as well as
better links to input and output markets. For the
case studies, this means looking at how services
(specifically distribution services) can facilitate the
Traditional definitions of structural change (or structural transformation) emphasize the “reallocation of production factors/
resources/economic activity across sectors,” and more specifically from low-productivity to high-productivity ones. For
example, Rodrik and McMillan (2011) explain that the countries that manage to pull out of poverty and get richer are
those that can diversify away from agriculture and other traditional products. As labor and other resources move from
agriculture into modern economic activities, overall productivity rises and incomes expand. More specifically, they describe
the two key dynamics in the process of structural transformation: the rise of new industries (that is, economic diversification)
and the movement of resources from traditional industries to these newer ones. As such, structural transformation entails
the rise of new, more productive activities and the movement of resources from less productive activities to these newer
ones, raising overall productivity. Similar views on structural transformation defined as “the shift of resources from low-
productivity to high-productivity uses” and “the reallocation of production factors (resources) across the broad agriculture,
manufacturing, and services sectors” are found in the early literature. See, for example, Lewis (1951), Kuznets (1955),
Chenery (1986), Kuznets (1966), Kongsamut et al. (2001), and Ngai and Pissarides (2007).
23
47

movement into higher value-added activities, such
as production and export of processed milk (ultra-
heat treated (UHT) processed milk), cheese, or
sesame oil.
77. Initial attempts to explore the role of services in changing the features of Global Value Chains (GVCs) evaluated the role of services as intermediate inputs. Over the past
decade, an extensive literature has documented
the cost and quality impacts of services inputs
on the competitiveness and growth performance
of the economy (see Francois and Hoekman
(2010) for a summary of key findings). The
Swedish National Board of Trade (2013, 2010)
considers the role of services in enabling GVCs:
the “servicification”24 of manufacturing, defined
as the increased use of services in manufacturing
in production processes and sales. It looks at
services as intermediate inputs, but also discusses
the role of services as tasks in value chains, and
their impact on upgrading and moving up the
value chain.25 Therefore, this analysis attempts to
clarify the role of distribution services (as inputs
and tasks) in the dairy, sesame, teff, and textiles
value chains.
78. To illustrate the role of distribution services in value chains and structural transformation, we depict a value chain in key food staples such as grains, such as teff, wheat, barley, corn, sorghum, and millet. The value chain shown in figure 2.16 is
based on fieldwork and interviews conducted in
Ethiopia in 2016–17. The results of the analysis
provide a snapshot of the steps through which
food staples move from producer to consumer,
as well as the key actors and institutions involved
along the way.
This is a term coined by the Swedish National Board of Trade. Earlier attempts to define the evolving role of services were
undertaken by Reisken et al. (2000), who introduced the “servicizing” concept; Bryson and Daniels (2010), who refer to
the “manuservice economy”; and Vandermerwe and Rada (1988), who introduced the “servitization” concept.
First, many examples illustrate how services act as “connectors,” play an important intermediation role, and generate
strong complementarities across all types of markets. For instance, Low (2013) describes how modern communication
and transport technologies have enhanced the tradability of services, leading to their incorporation into supply chains as
traded inputs and bundling into composite products, such as “business functions.” Kommerkollegium (2013), based on
evidence from the Organisation for Economic Co-operation and Development, identifies the business services sector as
a good example of the fragmentation of production, with an important role for enabling GVCs in goods and services.
Second, services tasks are important for upgrading and moving up the value chain. Saez et al. (2014) and Taglioni and
Winkler (2014) show that the complexity and transaction intensity of GVCs require high-quality intermediate inputs,
including services inputs, for effective coordination. Maglio et al. (2010), Demirkan et al. (2011), Allee (2008), and Low
(2013) complement this approach by considering the role of networks; technology; entrepreneurship; and intangible assets,
such as human knowledge, more efficient internal structures and processes, business relationships, trust, or reputation in
generating innovation and creating GVCs.
24
25
48
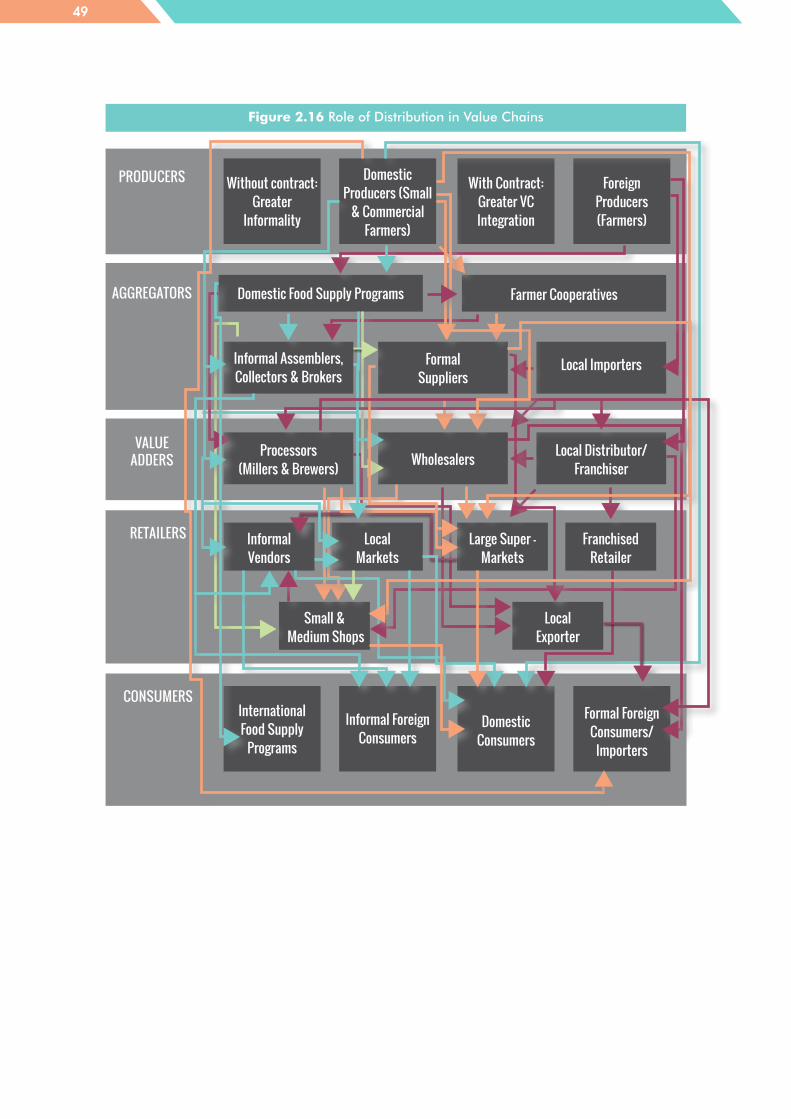
Figure 2.16 Role of Distribution in Value Chains
PRODUCERS
AGGREGATORS
RETAILERS
CONSUMERS
VALUEADDERS
Without contract: Greater
Informality
International Food Supply
Programs
Informal Assemblers, Collectors & Brokers
Processors (Millers & Brewers)
Informal Vendors
Large Super - Markets
Small & Medium Shops
Local Exporter
Domestic Food Supply Programs
Domestic Producers (Small
& Commercial Farmers)
Informal Foreign Consumers
FormalSuppliers
Wholesalers
Local Markets
Franchised Retailer
With Contract: Greater VC Integration
Domestic Consumers
Local Importers
Local Distributor/Franchiser
Foreign Producers (Farmers)
Formal Foreign Consumers/
Importers
Farmer Cooperatives
49

Key Actors and Activities
79. Although the distribution services value chain may differ slightly with respect to the particular food staple in question, there are enough similarities between these products that a “consolidated” value chain can be presented, as the one in figure 2.16. Actors and
institutions involved at each stage of the distribution
process include, inter alia, producers, aggregators,
bulkers, and accumulators, value adders, retailers
and franchisers, and consumers. Drawing on the
WTO’s definition26 of distribution services, and
based on interviews conducted in the region,
anecdotal evidence suggests that the actors and
institutions involved at each stage of the distribution
process include, inter alia, the following:
Producers
80. Producers tend to be households or SMEs. Most producers choose to farm as a business;
however, some households farm for subsistence and sell surplus crops if and when they are available.
Producers sell their crops to: (i) consumers directly at local markets; (ii) informal assemblers or
collectors, who on-sell crops to more formal aggregators, wholesalers, or processors; or (iii)
cooperatives, community-based organizations, or domestic food supply programs.
By eliminating information asymmetries, especially with respect to pricing, as well as other
market failures, the contractual arrangements can ensure more efficient market allocation
with less waste and better prices for consumers and producers. Importantly, those engaged in
contractual arrangements with farmers provide valuable inputs that producers use to plant,
grow, and harvest their crops. These include seeds, which can be procured locally or imported
from abroad, as well as the fertilizers and pesticides, which are used to grow the crops to
maturity. A final input that is often provided in the production of these food staples is the
Producers also sell to processors such as millers or brewers, wholesale buyers, or other more
formal suppliers for domestic and internal consumption. In these cases, producers often
operate under the auspices of prearranged contractual arrangements (described in box 2.6),
which are formal or informal in nature, and specify the terms and conditions on which crops
will be bought.
Providers of distribution services generally fall into four categories: retailers, wholesalers, franchisers, and commission
agents. Retailers in the formal and informal sectors sell goods for personal or household consumption. Wholesalers sell
merchandise to retailers or other businesses. Franchisers sell specific rights and privileges related to operating a branded
business, for example, the right to use a particular retail format or trademark. Finally, commission agents trade on behalf
of others in that they sell products that are supplied and usually owned by others to retailers and wholesalers.
26
50
The public sector may intervene through domestic food supply programs
availability of farm equipment, including basic tools such as hoes, slashers, and axes, as well
as more complex machines such as trucks, tractors, and water pumps. These inputs can come
from a variety of providers, including outgrower companies, farmer cooperatives, community-
based organizations, agro-dealers, NGOs, government, seed companies, or processors/buyers
with a contractual link to the producers.
81. Once crops are grown and harvested, they are sold to consumers, informal vendors, local markets, middlepersons, or informal brokers, assemblers, or collectors. The latter are small- or large-scale entities that can
collect and store crops for a period of time, and
who help to market and on-sell crops to larger
aggregators and wholesalers (photo 2.1). These
“middlepersons” and other traders and brokers can
play an important intermediating role by helping to
bridge the gap between small farmers in rural and
disconnected markets with buyers in other parts of
the country and abroad. However, the profit-driven
nature of these transactions necessarily drives up
the price of the staple crops and increases the gap
between producer and consumer prices.
82. Although most small farmers—particularly those who do not have prearranged contracts—sell their products directly to consumers at local markets, it is also common for them to sell items to more formal third-party suppliers, such as traders or brokers, on a contractual basis. Likewise,
farmers’ cooperative unions may buy directly from
producers. Such arrangements occur with or without
previously arranged contracting arrangements,
and provide an important intermediating role in
distributing crops domestically and internationally
(photo 2.2). Typically, cooperatives are formed
by a group of members, usually producers, who
subsequently store, market, and distribute crops
to wholesalers, millers, processors, and retailers.
Farmer cooperatives also provide credit to small
and mid-size farmers, as well as critical inputs such
as seeds, fertilizers, and harvesting equipment,
which many small members may not have.
83. Finally, the public sector may intervene through domestic food supply programs, such as the Ethiopian Grain Trade Enterprise or Ethiopia Commodity Exchange, or international programs such as the World Food Program. These NGOs help buy, market,
and manage strategic reserves, which can ensure
food security so that emergency needs are met and
the focus is on economic and social development
objectives. As necessary, such programs may supply
food staples for domestic markets, or look to sell
these crops abroad if demand and prices warrant.
Aggregators, Bulkers, and Accumulators
51

84. Processors and distributors, as well as wholesalers, often buy crops from middlepersons and aggregators, or directly from farmers with whom they have contractual arrangements (photo 2.3). These
entities vary in size, from local village hammermills,
to large-scale millers, food processors, breweries,
and animal feed manufacturers. Processors play
an integral role in transforming raw ingredients
into food or other useful products, which can be
marketed and sold to consumers. Key activities
involve grinding, mincing, milling, macerating,
liquefaction, emulsification, cooking, brewing,
pickling, pasteurizing, preserving, and canning
and packing food products.
85. Likewise, wholesale companies may add value through processing, packaging, and selling products in bulk, rather than directly to consumers. Wholesalers, processors,
and distributors often work together as channel
partners who sell to large and small retailers
and, subsequently, to consumers. Contractual
arrangements with producers can help these
processors and wholesalers to guarantee consistent
flow of supplies, proper economies of scale,
reduced transactions costs, and standardization
of products. Although processors and wholesalers
may supply food staples for domestic markets,
they also sell to regional or international markets
through international exporters and distributors.
Value Adders
Retailers and Franchisers
86. Retailers include vendors, local markets, small shops, and kiosks, which operate on a largely informal basis (photo 2.4). Likewise,
retailors often include more formally organized
operations, such as medium-size, privately owned
retail shops and large supermarket chains, which
may be franchises linked to larger wholesalers.
There is significant variability across countries
in East Africa. For instance, Ethiopia relies on
traditional central markets and small retailers
to provide these products. In other countries,
such as Kenya, there is the presence of foreign
supermarkets and large franchised retailers from
other countries in Africa, Europe, or South Asia.
52

Consumers
87. At the end of the supply chain are the individual consumers of these food products (photo 2.5). Poor households spend a
larger proportion of their food budgets on staples
in comparison with total food expenditures. End
consumers can also include informal foreign
consumers, who cross borders to buy crops at
foreign markets, as well as more formal foreign
consumers and importers. Finally, international
food supply programs, such as the World Food
Program can be important international consumers
of domestic crops, for onward distribution to
institutions such as hospitals, schools, and other
public agencies, which provide food to their clients.
Box 2.6
Benefits of Contractual Arrangements
A recent pilot study was conducted by the World
Bank’s Trade and Competitiveness Global
Practice on international value chains related to
food staples (maize, sorghum, and cassava) in
Ghana, Kenya, and Zambia (World Bank 2016).
A key finding was that farmers in these countries
often participate in contract schemes managed
by agroprocessors, buyers, cooperatives, or
community-based organizations, as well as
directly with processors and wholesalers. These
contracts can be formal or informal, and can
stipulate various terms of engagement between
the producer and buyer, including the following:
• Specific types and quantities of crops to grow
• Guidelines on quality standards that the
crops must meet to be purchased
• Price guarantees with respect to various crop
categories
• Inputs that producers should use, including
seeds and fertilizers
• Extension and post-harvest services, as well
as training provided by buyers.
As a result of these contractual arrangements,
whereby producers have a prearranged
market for their crops, perception surveys have
highlighted several benefits for producers,
including the following:
• Greater access to technology and inputs,
including seeds, fertilizers, irrigation, and
harvesting
• Larger output volume, higher yields, larger
plots, fewer crops lost, and fewer crops
consumed
• More transparent and guaranteed pricing in
line with current market prices
• Increased sales and greater revenues from
crop sales.
53

Relational Dynamics
88. From the supply chain analysis, several relational dynamics emerge on the roles played by key actors and institutions.
A first key observation is that supply chains for such staple crops are often nonlinear, and
instead involve a complex web of vertical and horizontal connections. For instance, farmers
may sell products to market vendors (retailers), which are then bought by brokers and resold
to processors. Subsequently, suppliers may buy back processed products and resell them to
small shop owners, and onward to consumers. The backward and forward linkages mean that
there is not one standard path through which staple crops are distributed, and suggest that
there are many opportunities for value addition, depending on the end use of the product.
Second, and relatedly, the supply chain presented above suggests that actors often take on
multiple roles and value-adding activities may take place across the value chain. For instance,
all actors may play a role, however big or small, in storing, processing, packaging, marketing,
wholesaling, and retailing products. As such, aggregators are not bound to merely transporting
crops, as they may also bundle them and market them to particular buyers and markets.
Likewise, brokers and suppliers may also separate, sterilize, sort, and package crops, above
and beyond the intermediating function they provide between producers and wholesalers.
A final observation that emerges from the supply chain analysis is that farmers “on contract”
with cooperatives, formal suppliers, wholesalers, processors, and large retailers have a greater
opportunity for their products to enter formal value chains, whereas those without contracts
are less likely to have entry points into national and international value chains. The intuition
behind this is that the actors who add the most value to staple crops are formal suppliers,
millers, and wholesalers. These actors are often responsible for transforming staple crops into
higher value-added goods, such as flour, cornflakes, and snack foods in the case of maize,
or porridge and beer in the case of sorghum. To create such higher value-added products,
processors and wholesalers often need crops of a certain quality standard at certain moments
in time and, as a result, engage in contractual relationships with producers or other suppliers.
By guaranteeing their sourcing via contracts, it is more likely that these higher value-added
products can enter regional and international export markets. Conversely, as suggested by
the value chain diagram in figure 2.16, it is more likely that producers without contracts will
see their crops bought by food supply programs or informal brokers, or sold directly at local
markets—making it much less likely that they will join regional and international value chains.
54
Commercial farms, which are usually government farms or privatized government farms, and
peri-urban and urban producers are located close to population centers. Commercial and peri-
urban/urban dairy farmers are the most important for the processing component of the sector, but
also sell directly to consumers. Both use more advanced and commercial feed inputs. Commercial
farms are also more likely to use more advanced cattle breeds through artificial insemination
and employ better animal health practices.
Rural dairy smallholders dominate milk production in Ethiopia, accounting for at least 95 percent of
milk production. The greatest portion of rural dairy smallholders are in the Ethiopian highlands, and
produce almost exclusively for domestic milk consumption and sale to immediate neighbors. Rural
smallholders tend to own between one and five cows. Rural dairy smallholders are too remote and do
not have access to cold chain logistics to connect to processors, which tend to locate near population
centers. However, excess milk is used for household processing into ghee, butter, and cheese.
Pastoral and agro-pastoral producers are found in most other rural areas, such as the Southern
Nations, Nationalities, and Peoples' Region. They depend on moving seasonally to follow natural
pasture, and produce for subsistence consumption or sale to immediate neighbors.
Case Studies: Dairy, Teff, Sesame, and Textiles
DAIRY
90. Household processors dominate the dairy market. There are around 32 processors
in Ethiopia, which can be grouped into large
processors and household processors. Large
processors are very few in number, and include
Sebeta Agro-Industry (Mama Dairy), Family Milk,
Etete Milk Processing Company, and Lame/Shola
Dairy, which was until recently government owned.
Operations tend to be quite vertically integrated,
with large processors having their own dairy
farms, collection centers, transport, and retail
shops, but also combining this with outsourcing
89. Ethiopia’s dairy production can be broken down into four main systems: (i) commercial
farms, (ii) peri-urban and urban, (iii) rural dairy smallholders, and (iv) pastoral and agro-pastoral.
55

through specialized firms. The sector appears to
be of interest to international investors, with Etete
Milk recently enjoying a large investment by private
equity firm 54 Capital, and Velocity Dairy, a very
large proposed Dutch investment almost coming
to fruition. There are also several slightly smaller
“medium-size” processors, such as the Elemtu
Integrated Milk Industrial Company, which operates
similarly, but with smaller operations and tending to
be less vertically integrated. Household processing
concerns the production of ghee, butter, and cheese,
mostly for subsistence purposes, with excesses sold
to immediate neighbors. The Ethiopian dairy value
chain map is depicted in figure 2.17.
Figure 2.17 Dairy Value Chain
Artificial insemination
private
Consumers - towns/urban centres/cities
Commercial farms(1%)
Large scale processors (10% of milk production)
(Pasteurizing and packaging milk, butter, cheese, cream & yoghurt)
Household processing (Raw milk --> Ghee butter, & cheese)
Milk transporters
Supermarkets(15%)
Feed:private
Household processed goods to immediate
neighbourhood
Peri-urban & urban farmers (4%)
Collection centers
Retail shops(71%)
Cooperatives
Direct sales Direct sales
Govt extension services: veterinary & artificial insemination (NAIC)
Raw milk to immediate neighbourhood
Pastoral, agro-pastoral & rural smallholders (95%)
(Sell excess produce)
Note Orange squares denote the informal sector, which comprises over 95 percent of the dairy value chain in Ethiopia.
INPUTS AND SERVICE
PROVIDERS
PRODUCERS
TRADERS, MIDDLEMEN & COOPERATIVES
DISTRIBUTORS/RETAILERS
CONSUMERS
PROCESSORS & MANUFACTURERS
56
Pastoral and agro-pastoral smallholders are usually far from main cities and towns. As such,
they lack access to commercially marketed feed and rely instead on opportunistic types of self-
produced feed. There is a lack of awareness of, and seeds for, high-value fodder crops, such as
elephant grass and alfalfa, which are widely used in the East African Community. These rural
producers also have limited access to concentrates for feed, due to logistical and price reasons,
and lack trust in commercial suppliers.
Urban and peri-urban producers use concentrates and agroindustrial byproduce, such as
sugarcane and oilcake, but without sufficient roughage, as they have very limited land resources
from which to draw. Without land resources, they cannot sufficiently produce their own feed.
Commercial feed is also expensive, and a lack of regulation erodes trust in its quality. Value-added
tax is charged on feed, which exacerbates its affordability. Furthermore, there are currently few
incentives behind the production of commercial feed, due to the small and disperse geography
of dairy producers. Overall, it is estimated that at most 5 percent of dairy producers might use
improved feed and concentrates, with at least 90 percent relying on their own self-produced feed.
Producer Challenges in the Dairy Sector
91. Access to quality feed is a major challenge affecting producers. The challenges affect
rural and pastoral/agro-pastoral, and urban/peri-urban producers differentially.
92. There is very limited provision of veterinary health services available to rural producers. Slightly better provision is available to
urban and peri-urban producers. In each case, the
quality of drugs and services is poorly regulated.
Commercial farms employ better private sector
veterinary services. Rural and urban smallholders
tend to rely on government veterinary extension
services. Artificial insemination (AI) services are of
very limited availability and, where they are available,
tend to be of poor quality and high cost. AI provision
interacts with market failures in the provision of
animal health and feed, as farmers will not invest in
expensive AI breeds if veterinary services and quality
feed are unavailable for livestock. Smallholder farms
usually rely on the public provision of AI (National
Artificial Insemination Center); medium and larger
farmers use private AI providers. There is a risk that
the public sector crowds out the development of
better private sector AI providers.
93. The overwhelming majority of milk production relies on low-capacity indigenous
breeds. This contrasts with Kenyan dairy production,
which has incorporated higher-yielding animals as
somewhat of a colonial legacy. In Ethiopia, about
3-5 percent of livestock are crossbreeds, and six
million of 13 million are in Kenya. However, the
Ethiopian varieties tend to produce naturally higher-
fat milk, facilitating a stronger household processing
industry for butter, ghee, and cheese.
94. The demand-side pull for dairy producers has considerably differential impacts, depending on producer location. This is a
result of very limited cold chain logistical services
for rural producers, and causes two very opposite,
but negative, impacts on the sector. Urban and peri-
urban producers face excess demand, enabling
producers to supply poor quality and adulterated
milk, with little incentive for quality upgrading. By
contrast, rural smallholder and pastoral producers
have very limited access to markets, and as such
lack a “pull” market to incentivize production
57

beyond subsistence consumption and the sale of
excess produce to immediate neighbors. Several
interviewees highlighted these demand issues,
emphasizing that any measures to boost milk
production in rural areas must be accompanied by
facilitating access to markets for a complementary
“pull” incentive. Important here is the lack of cold
chain logistics and chilled collection centers. In
addition to feed, animal health, and AI interventions,
farmers need a market for milk offtake.
95. The cross-cutting challenge for milk producers is access to affordable inputs, including access to quality feed, veterinary services, and AI services. To address such
challenges, one expert proposed an electronic
“voucher” system for buyers and sellers of inputs
and outputs to interact. The voucher system has
two benefits: (i) it can be used to help connect
distributors with buyers, and (ii) it can operate like
a savings and credit service, enabling access to
products when buyers and sellers are out of cash.
Such a system is reportedly being developed by
the Agricultural Transformation Agency in Ethiopia
for fertilizer, improved seed distribution, and grain
output marketing.
Processor Challenges in the Dairy Sector
96. The key processor challenges relate to the sufficient sourcing of quality raw milk.
When asked how they ensure that they always have
the quantities and qualities of required raw milk,
one processor tellingly answered “impossible.”
Processors in Addis Ababa highlight this issue, with
quality being among the top challenges. Lamenting
this, one processor stated that they had “tried to
introduce a premium for quality milk by rejecting
substandard milk, but farmers know that if I don’t
buy their milk another processor will, so there
is little incentive for farmers to improve quality.”
Furthermore, traditional household milk consumption
tends to be less concerned by adulterated milk, and
consumers just boil whatever milk they receive, and
as such compound the adverse quality incentives.
This traditional sector of the market accounts for 95
percent of the raw milk market.
97. Quality issues very much interact with, and are explained by, the other processor challenges, such as farm size, variable demand
and supply, adulteration of raw milk, underutilization
of dairy inputs, and lack of contractual arrangements
between processors and producers and the value of
cooperatives.
98. Farm size is a key constraint in Ethiopia’s dairy sector. Larger farms are better placed to
provide higher quality milk supplies to processors,
owing to greater use of quality private sector
veterinary services, improved feed, and superior
cattle breeds. However, the larger farms in Ethiopia
Eliminating obstacles to distribution services can link rural producers to markets for inputs, increase sales, and reduce post-harvest and storage losses
58

are very limited, accounting for an estimated only
1 percent of total milk production. As a result,
processors must augment their sources with milk
from medium- and small-scale producers.
99. Ethiopia’s fasting culture presents an unusual dairy challenge. During fasting days,
Orthodox Christians, representing around 45
percent of the Ethiopian population, practice fasting
and in doing so avoid the consumption of dairy and
meat products. As such, consumer demand for milk
oscillates considerably between the fasting and non-
fasting seasons. This causes a real challenge for
processors, who must modulate their production
and sourcing accordingly. In the words of one
processor, “I can buy very good quality milk during
fasting, but not at all after fasting.” Moreover, raw
milk production has its own seasonality. Production
101. In urban areas, demand for raw milk reportedly exceeds supply in most seasons. Producers and vendors can sell poor quality
milk to processors who have limited alternative
supplies. Resultantly, there is reportedly a high
level of adulteration in raw milk supplies, as
suppliers seek to bulk up their milk with water
is greatest during the rainy seasons, and becomes
relatively scarce during the dry seasons. Raw milk
prices reportedly rise as much 30 percent during
the dry seasons.
100. The compounding seasonality of production and demand presents a challenge along the value chain (box 2.7). Processors
recognize that producing powdered milk or ultra-
high temperature (UHT) processed milk could help
to smooth sourcing and demand variability, but first
requires higher quality milk supplies as well as new
machinery. The quality requirements are deemed
“very demanding” and importing the requisite
machinery would be prohibitively expensive for most
established processors. One processor suggested
that less than 10 percent of raw milk meets UHT
quality requirements.
and wheat powder. This filters down the value
chain, making it more difficult for processors to
meet milk quality standards.
102. Better contractual arrangements between farmers and processors, including support for input services, was identified
Box 2.7
Dairy Fasting and Rainy Seasons in Ethiopia
The main rainy season is from July to September,
with a short rainy season in March and April.
The main fasts are the Great Lent fast from
February 20 to April 15, Fast of the Prophets
from November 25 to January 6, Johan’s Fast
from February 6 to 9, Apostles Fast from June 5
to July 12, and Assumption of the Virgin Mariam
fast from August 7 to 12.
Rain
Fasting
Jan JunFeb JulMar AugApr Sep NovMay Oct Dec
59

as a means for improving quality. Most
dairy farmers underutilize input services and
products such as feed, AI, and veterinary services
for animal health. This cascades down the value
chain to affect the quality of the milk obtained
by processors. Usually large processors are
not involved in the provision of services. Their
arrangement is just to buy milk and they prefer
to specialize only in their own area of processing.
Useful lessons can be learned from the Kenyan
franchising arrangements in which improvements
to different parts of the value chain, such as input
suppliers, can be achieved through the franchising
of successful businesses. Franchising has enabled
successful business models, including those of
input suppliers, to expand their good business
methods and practices across Kenya. Although
this could be encouraged in Ethiopia, it would
depend on successful businesses desiring to
operate a franchising model.
103. Cooperatives were identified as being much better in supplying services, such as feed and veterinary drugs, to farmers. A
processor who highlighted that cooperatives are
better at supplying services indicated that he did
not fully understand why cooperatives were not
utilized more broadly in Ethiopia, but indicated
that he prefers, where possible, to work through
cooperatives to ensure that his farmers have
access to feed and veterinary drugs, as this helps
him achieve higher quality milk inputs.
104. Processors additionally face more general, cross-cutting business environment challenges. These include
electrical supply variability, in which fluctuating
voltage and cutoffs can damage equipment, lose
time, and add to generator expenses. Water supply
intermittency is another source of frustration. High
import duties add expenses for inputs that cannot
be sourced locally, including packaging, yogurt
machines, specialized packaging ink, flavorings,
and spare parts. Access to foreign currency for
imports remains a top concern—processors
sometimes have to wait six months for dollars.
105. Beyond this, there also appears to be a challenge with policy coordination. The government maintains a large footprint in
different parts of the industry, although it has
been privatizing operations in the past decade,
including Mama Dairy, the largest milk processor,
and several commercial farms. There is a need
for more coordination between the government
and processors during the formation of dairy
sector policy.
106. Any interventions that aim to improve dairy production in rural areas must be accompanied by strategies to link rural producers to markets for inputs and the sale of raw milk. This would also support processors in
accessing better quality raw milk supplies. Assisting
processors to make UHT and powdered milk could
help smooth the demand and supply fluctuations
associated with the rainy seasons and fasting
periods. However, this is unlikely to happen until
quality issues can be resolved. UHT and powdered
milk also have greater potential for regional exports
in the Horn of Africa.
Access to foreign currency for imports remains a top concern
60

Dairy: Conclusion and Recommendations
107. The single greatest challenge for dairy in Ethiopia is channeling milk production into commercial markets. Rural and pastoral
milk production, which accounts for over 95
percent of total milk production, is delinked from
markets for selling produce and purchasing inputs.
As such, there is little market “pull” for producers
to increase the quantity and quality of production.
This is compounded by the absence of cold chain
logistical services and transport infrastructure.
There is limited access to dairy production inputs,
such as feed, artificial insemination services,
and veterinary services. This is somewhat of a
collective action failure, as farmers will not invest
in expensive artificial insemination cattle breeds
without the market to export their produce or
inputs to support these breeds.
108. The principal challenge faced by processors is reportedly in sourcing quality milk supplies. Large commercial farms produce
milk of good quality; however, processors must
also rely on urban and peri-urban producers who
are less able to meet quality requirements. Since
there is reportedly excess demand for raw milk
near population centers, such producers have little
incentive to improve quality. Milk tends to become
adulterated up the value chain, as the household
market for raw milk is less averse to poorer quality,
and urban producers have little incentive to improve
quality. Issues with quality are compounded by
the seasonality of milk production and demand:
production increases in the rainy seasons and
demand fluctuates with fasting periods. Finally,
processors also face general business environment
challenges, including access to foreign currency,
high import tariffs, electricity and water supply
variability, and lack of consultations during policy
formation. Nevertheless, the sector appears to be
attracting international investors, who seem more
interested in expanding their own extension services
to producers. The sector has been characterized
by excessive government ownership in the past,
but privatization of processing and farming
operations has occurred in the past decade.
The government remains involved in the inputs
section of the value chain.
109. International investors in the dairy sector seem, ostensibly, cognizant of the upstream challenges and the benefits of addressing the market failures. One
international investor is setting up contractual
arrangements for cooperatives to access quality
feed and veterinary services, to be paid back
upon delivery of milk. Within this program, the
investor also aims to purchase a chilled tanker for
collecting milk and provide educational services.
110. Several processors recognized the potential for dairy exports within the Horn of Africa, and in particular Somalia, South Sudan, and Djibouti. This would only be
possible with the production of UHT or powdered
milk in Ethiopia, and remains a way off. Kenya
is also a highly competitive regional competitor.
UHT requires higher quality milk supplies, which
are largely unavailable in Ethiopia due to the poor
provision of upstream dairy inputs, including feed
quality, veterinary services, and animal health,
alongside midstream transportation issues and
the prevalence of milk adulteration risks before
supplies reach processors. The current value chain
lacks incentives for the improvement of quality:
there are no premiums between different qualities
of milk and no milk quality checks. This derives from
limited supplies in urban areas, where processors
are located, making processors “quality takers.”
As such, dairy demand in Somalia is met with
exports in dairy livestock directly. This contrasts
with the successful development of a regional
dairy market in the East African Community.
Here, dairy products are traded between Kenya,
Uganda, Rwanda, Tanzania, and Burundi. Within
this context, Uganda, for example, has increased
its East African Community dairy exports from
negligible amounts in 2006 to more than US$15
million in 2014.
61
111. The Ethiopian government favors a private sector–led transformation of the dairy sector, by introducing international investments and opening up investment opportunities. It would be useful to engage in
112. Teff, the main ingredient for injera, the daily staple food for more 50 million Ethiopians, is of vast importance for the consumption as well as production sides. Teff
is important for food security across the country,
as well as for the livelihoods of many smallholder
farmers. In Ethiopia, 6.3 million smallholder
farmers use 20 percent of the cultivated area
(2.7 million hectares in the country) to produce
teff (Minten et al. 2013a). These farmers can
be found across the country, in all its ecological
zones. The market is highly fragmented, with
many smallholder farmers, several layers of
policy collaboration between the public and private
sectors for better dissemination of the Ethiopian
Livestock Master Plan, which determines a clear
direction for collaboration between the public and
private sectors and discusses investment plans.
traders, many processors, and a large, mostly
urban population as the consumer market.
113. An important feature of teff is the different quality types that are produced: traditionally, the distinction has been made between red, mixed, and white. Red is of
the lowest quality, and white teff is of the highest
quality. More recently, an additional distinction
has been introduced: magna teff (“super white”),
which is of even higher quality than white teff
(Minten et al. 2013a). The supply chain for teff in
Ethiopia is depicted in figure 2.18.
TEFF
62

Figure 2.18 Supply Chain of Teff in Ethiopia
INPUTS AND SERVICE
PROVIDERS
PRODUCERS
PROCESSORS & MANUFACTURERS
DISTRIBUTORS & RETAILERS
DISTRIBUTORS & RETAILERS
TRADERS, MIDDLEMEN & COOPERATIVES
Extension services
Restaurants
Domestic consumers
Smallholder farmers
Collectors
Local market
Mills
Market in Addis Ababa (Mesalemia)
Traders
Seed enterprises
Retail shops
Own seeds
Injera exporters
Foreign consumers
Commercial farmers
Teff exporters
Traders (redistributing towards other regions)
Cooperatives
Domestic, formal and informal sector Domestic, formal sector Foreign-oriented sector
63

Inputs
Producers
Trade
The smallholders who produce teff have access to several inputs, most importantly seeds and fertilizer. In addition, several extension services
are available. As reported by Minten et
al. (2013a), the use of modern inputs
(improved seeds, chemical fertilizer,
herbicides, and pesticides) has increased
significantly over the past decade.
Teff is predominantly produced by smallholder farmers (6.3 million throughout the country; Minten et al. 2013a). Many of these
farmers own some land and often rent
additional land. They use injera as
their main dish (for breakfast, lunch,
and dinner) and therefore a significant
part of the harvest is not sold (for
most of the interviewed farmers, self-
Before teff reaches its destination at processing mills, several layers of traders, middlepersons, and cooperatives form a key component of the teff supply chain. Farmers have essentially three
channels through which they can sell
their teff: directly at a local market,
to collectors/traders, or through a
cooperative.28 In many cases, there is
a collector who buys teff directly from a
farmer at the farm. This collector sells
to a larger aggregator, who in turn sells
to another aggregator. This process
might be repeated several times before
it reaches the local market. Many
consumers or processors (mills) buy
Although some farmers use the best
seeds from their previous harvest, some
of the interviewed farmers indicated
that they buy seeds from commercial
seed companies. If a farmer decides
to get seeds from a commercial seed
company, the farmer is obliged to sell all
the harvested teff back to the company.
consumption of teff is in the range of
10 to 30 percent).27
In addi t ion, the Agricul tural
Transformation Agency has granted 48
commercial farmers licenses to grow
teff, with a goal to export it (Secorun
2016). However, this project is still in a
pilot phase and therefore not expected to
affect the teff market in the near future.
their teff directly from the local market.
However, some traders buy from the
local market (or from farmers directly)
to transport it to a larger urban center,
in particular Mesalemia market in
Addis Ababa. This is the key distribution
center for teff in the capital city. Every
day, trucks full of teff arrive and the
teff is sold to traders at Mesalemia.
Over the past year in particular, some
redistribution toward other regions has
occurred: in that case, private agents
or government agencies buy full trucks
of teff that can be brought to other
regions. Government agencies use this
strategy to address the emergency in
several regions.
Minten et al. (2013b) find that for a sample of 1,200 farmers the average self-consumption of teff is 64 percent, possibly
indicating that the farmers we spoke with sell relatively a lot of their production.
This excludes a possible fourth channel: selling back to commercial seed enterprises in case they bought seeds from such
a company.
27
28
64

Processing
Distributors
Consumers
To process teff for injera production, it needs to be grinded at a mill. Many small mills exist, mostly
in urban areas. These mills provide a
service and grind the teff bought by
consumers or buy teff directly and sell
the grinded teff. The major challenge
for mills concerns electricity: the high
cost for the electricity input “socket” that
Many consumers buy their teff directly from mills and bake injera at home. However, there is
an increasing demand for ready-made
injera. This injera is sold in certain
Nearly all injera in Ethiopia is consumed domestically. Since
the government banned teff exports
a few years ago, there are almost
no exports. Although there are some
is required for the machinery,29 lack of
a steady supply of electricity, and high
cost of electricity. However, although
such concerns might lower competition
over time, from observation and other
research (Minten et al., 2013), we
can conclude that there has been an
increase in the number of mills and
competition is therefore growing.
cereal shops. In addition, major clients
are restaurants that buy teff from mills
or injera from cereal shops. Finally, a
handful of injera exporters sell to several
European and American markets.
legal exports to Israel (for its Ethiopian
Jewish population), there are also some
informal exports, especially to Eritrea,
Sudan, and the Republic of Yemen.
Key Challenges in the Supply Chain for Teff
114. The key challenge in the teff supply chain is increasing the usage of modern inputs, especially improved seeds. Although
important progress has been achieved in
increasing the usage of fertilizer, herbicides,
pesticides, and improved seeds, a lot remains to
be done. Interviews with farmers indicate clearly
that the quality of seeds is key for a farmer’s
market power, in qualitative and quantitative
terms. As described by Minten et al. (2013c), a
clear demand among farmers for improved seeds
is present: only three years after the introduction
of the new quncho seed, almost a third of their
sample was already using this type of teff seeds.
Although there seems to be a clear demand,
there has been little investment in improved seed
varieties: only around 20 varieties have been
introduced since the 1950s (Fufa et al. 2011). In
addition, consumers’ increased demand for higher
quality teff further underscores the importance of
enabling farmers to satisfy this demand.
Some of the mill owners whom we interviewed indicated that such an input socket can cost in the range of Br 200,000 to
Br 250,000 (±US$8,500 to ±US$11,000). In addition, it can take several years before the socket is installed.
29
65

115. High fragmentation and many layers of collectors and traders. Is there a potential
role for cooperatives? Many layers are present
between the smallholder farmers who produce and
the mills that process teff. Although intermediary
agents play a key role in distribution, they also
take a markup. Many argue that cooperatives
could play a key role in reducing the number of
layers in distribution, but this needs to be carefully
considered with the evidence at hand. Some argue
that the number of layers is not so high (Minten et
al. 2013b). In addition, the markup is relatively
small compared with the farmgate price, as can be
seen in figure 2.19. Across the different qualities of
teff, the markup range is roughly 16 to 24 percent
of the final price. This seems to be confirmed by
our interviews: many of the farmers do not feel
that there are too many layers between them and
the market.30 Although our evidence is anecdotal,
the farmers and mill owners indicated a similar
price structure.31 In addition, the number of layers
has been decreasing over time, which shows that
cooperatives are not necessarily needed to reduce
the number of layers.
Beyond this key challenge, several issues are specific to the distribution services:
Figure 2.19 Teff Price Structure, by Quality, October to November 2012
1800.0
1600.0
1400.0
1200.0
1000.0
800.0
600.0
400.0
200.0
0.0Magna White Mix Red
Milling and clearing
Urban retail
Urban wholsesale
Rural market/town
Farmgate
Birr/q
uintal
Source Minten et al. 2013b.
Of course, many indicated that they would like to a larger share of the market price, but a feeling of unfairness does not
exist among the interviewed farmers.
The price range for farmers depends significantly on the time sold and the quality of the teff. The interviewed farmers
around Debre Zeit, who generally sell high-quality teff, indicated a price in the range of Br 1,670 to Br 2,330 per quintile.
The price at mills at the time of the interviews was around Br 2,200 per quintile. The price range of farmers might be
slightly exaggerated upward. Taking Br 1,670 as the lowest price for farmers, this still gives a price markup of 24 percent,
which is in line with the findings of Minten et al. (2013b).
30
31
116. Cooperatives can help farmers smooth across time. Many farmers indicated that the key
difficulty for them is to sell their harvest as late
as possible. Most teff is harvested in December,
and prices are high between June and September,
especially toward September when seeds are in
66
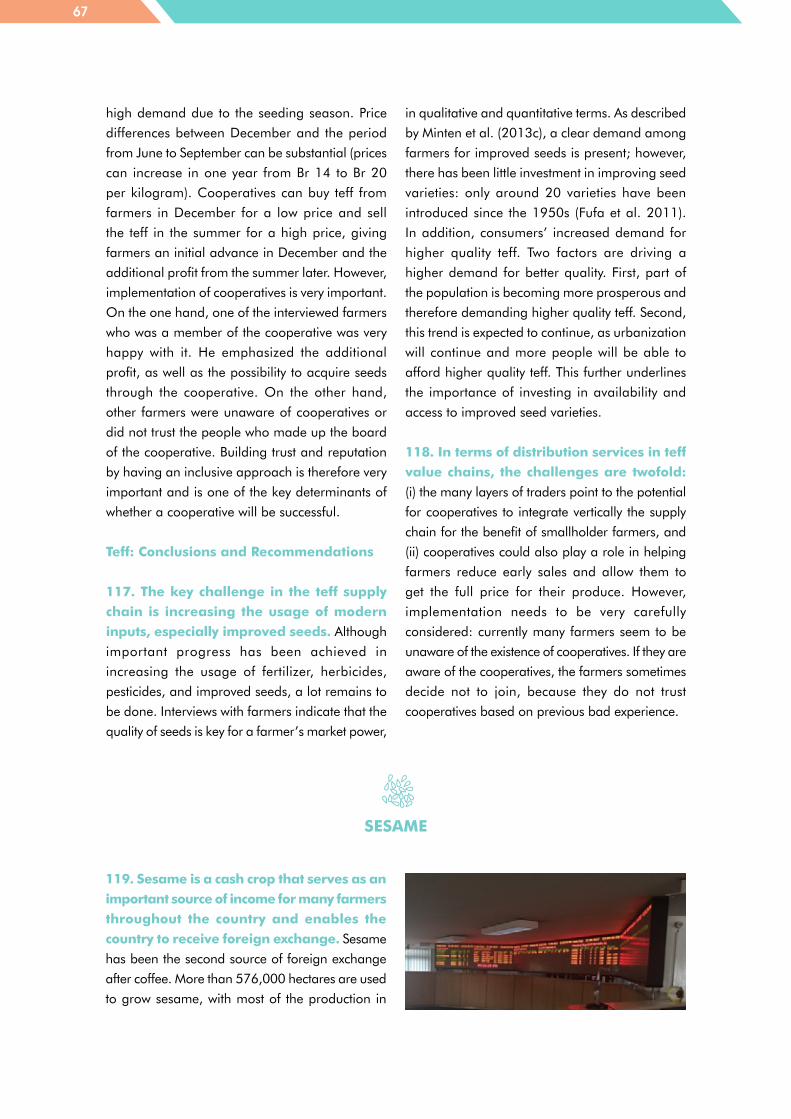
high demand due to the seeding season. Price
differences between December and the period
from June to September can be substantial (prices
can increase in one year from Br 14 to Br 20
per kilogram). Cooperatives can buy teff from
farmers in December for a low price and sell
the teff in the summer for a high price, giving
farmers an initial advance in December and the
additional profit from the summer later. However,
implementation of cooperatives is very important.
On the one hand, one of the interviewed farmers
who was a member of the cooperative was very
happy with it. He emphasized the additional
profit, as well as the possibility to acquire seeds
through the cooperative. On the other hand,
other farmers were unaware of cooperatives or
did not trust the people who made up the board
of the cooperative. Building trust and reputation
by having an inclusive approach is therefore very
important and is one of the key determinants of
whether a cooperative will be successful.
Teff: Conclusions and Recommendations
117. The key challenge in the teff supply chain is increasing the usage of modern inputs, especially improved seeds. Although
important progress has been achieved in
increasing the usage of fertilizer, herbicides,
pesticides, and improved seeds, a lot remains to
be done. Interviews with farmers indicate that the
quality of seeds is key for a farmer’s market power,
119. Sesame is a cash crop that serves as an important source of income for many farmers throughout the country and enables the country to receive foreign exchange. Sesame
has been the second source of foreign exchange
after coffee. More than 576,000 hectares are used
to grow sesame, with most of the production in
in qualitative and quantitative terms. As described
by Minten et al. (2013c), a clear demand among
farmers for improved seeds is present; however,
there has been little investment in improving seed
varieties: only around 20 varieties have been
introduced since the 1950s (Fufa et al. 2011).
In addition, consumers’ increased demand for
higher quality teff. Two factors are driving a
higher demand for better quality. First, part of
the population is becoming more prosperous and
therefore demanding higher quality teff. Second,
this trend is expected to continue, as urbanization
will continue and more people will be able to
afford higher quality teff. This further underlines
the importance of investing in availability and
access to improved seed varieties.
118. In terms of distribution services in teff value chains, the challenges are twofold: (i) the many layers of traders point to the potential
for cooperatives to integrate vertically the supply
chain for the benefit of smallholder farmers, and
(ii) cooperatives could also play a role in helping
farmers reduce early sales and allow them to
get the full price for their produce. However,
implementation needs to be very carefully
considered: currently many farmers seem to be
unaware of the existence of cooperatives. If they are
aware of the cooperatives, the farmers sometimes
decide not to join, because they do not trust
cooperatives based on previous bad experience.
SESAME
67

Tigray (41 percent) and Amhara (40 percent),
and to a lesser extent in Oromia (10 percent)
and Beningshangul-Gumuz (9 percent). More
recently, production has started in the Southern
Nations, Nationalities, and Peoples' Region and
Afar (Ministry of Agriculture et al. 2015).
120. Different types and qualities of sesame are produced in Ethiopia, each named
after the region in which it is produced. The best quality is from Humera, characterized
by its good aroma, taste, and high oil content.
The other common types are the Wollega (which
also has a high oil content and is used mainly for
crushing) and Gondar types (Ayana 2015).32 The
supply chain for sesame in Ethiopia is depicted
in figure 2.20.
Exporters indicated that these standards are known among importers in the specific markets for Ethiopian sesame.
Following a literature review and interviews, it seems that there are no formal international standards concerning sesame:
every market demands particular characteristics for optimal processing. For example, since Japanese processors produce
high-quality sesame oil, they require high-quality sesame: among other things, they demand a particular color, moisture
percentage, and acid value (USAID 2010).
32
Figure 2.20 Supply Chain of Sesame in Ethiopia
INPUTS AND SERVICE
PROVIDERS
PRODUCERS
CONSUMERS
TRADERS, MIDDLEMEN & COOPERATIVES
PROCESSORS & MANUFACTURERS
DISTRIBUTORS & RETAILERS
Extension services
Smallholder farmers (50%)
Cooperatives
Suppliers
Processors
Exporters
Ethiopian Commodity Exchange (95%)
Foreign consumers
Seeds
Domestic consumers (<10%)
Investors (50%)
Collectors
68

Inputs
Producers
Exporters
Consumers
Processing
Trade
Sesame farmers have access to several inputs, in particular, seeds and extension services. Most seeds are taken from the previous
harvest or imported from Sudan. In
There is roughly a 50-50 split in production between smallholder farmers and investor farmers. Since harvesting sesame is a labor-
intensive activity and the production
occurs in areas that are not densely
populated, one of the key challenges
Most exporters buy their sesame from ECX and need to be a member of ECX to do so. Before
exporting sesame, these exporters
Nearly all the Ethiopian sesame is exported (estimates are at least 90 percent). There is a small domestic
Very little processing is done by firms in the Ethiopian sesame sector. There are a few, mostly foreign-
owned firms that have recently started
Some farmers are organized in cooperatives, but the majority sells their sesame to collectors. Collectors aggregate several times and
sell it to a supplier. To be able to sell
sesame at the Ethiopian Commodity
Exchange (ECX), suppliers need to be a
member of ECX. These suppliers often
have warehouses and bring sesame
in bulk to ECX warehouses. At the
warehouses, the sesame is cleaned and
graded. Most of the investment farmers
terms of modern inputs, the Centre
for Development Innovation (2013)
notes that there is still a low adoption
of fertilizer.
that smallholders face is finding skilled
labor for a reasonable price. During the
short harvest period, they often have to
pay a high premium for labor to be
able to harvest all the sesame (Ministry
of Agriculture et al. 2015).
process the sesame as well to have the
produce qualified for exports. This mostly
concerns cleaning and packaging.
market, but most of the refined oil
consumed in Ethiopia is imported, mostly
from Southeast Asia (Ayana 2015).
processing. For a more elaborate
discussion on this, see the subsection
on Developments in the Supply Chain.
supply to ECX or bypass ECX and sell
directly to exporters. Although some
bypassing occurs, ±95 percent of all
sesame is traded through ECX.
ECX is trying to achieve further vertical
integration of the supply chain by
organizing farmers into farmer
cooperatives, but currently only a small
group of the farmers are members of
a cooperative.
69

Key Challenges in the Sesame Supply Chain
Although there is a wide range of challenges in
the sesame sector,33 two stand out:
121. Relatively low and decreasing sesame yield. Although sesame yield in Ethiopia is
roughly at the global average, two trends stand
out. First, China’s yield is currently double the
yield registered in Ethiopia, indicating that major
improvement in yield might be possible. Second,
Ethiopia’s yield has been decreasing over the
past years, while other (African) competitors have
increased their yield and are overtaking or have
overtaken Ethiopia (figure 2.21). The challenges
underlying the low yield include the lack of skilled
labor and the resulting use of unskilled seasonal
labor, lack of adoption of seed varieties, as well
as soil degradation and increase in diseases and
insect pests because of monocropping (Ministry
of Agriculture et al. 2015).
Figure 2.21 Yield of Sesame in Major Sesame-Growing Countries, 2007–13
1514131211
10987654321
0
Yield
(q/ha
)
2007 2008 2009 2010 2011 2012 2013
World
China
India
Myanmar
Sudan (former)
Ethiopia
Uganda
Tanzania
Mozambique
Sources Ministry of Agriculture et al. 2015; FAOSTAT 2015.
For an overview of all the challenges across the supply chain in sesame, see the chapters on “Systemic Bottleneck” chapters
in Ministry of Agriculture et al. (2015).
33
122. Recent global sesame price volatility and the inability of the Ethiopian sesame sector to adjust compound the sector’s challenges. Throughout conversations with sesame exporters,
the most common issue that was raised was the
decrease in international sesame prices over the
past years and its volatility (box 2.8.). Sesame
exporters are currently selling sesame at a loss,
mostly to obtain access to foreign exchange to
finance their importing business. Exporters argue
that farmers have become used to historically high
prices and are not willing to adjust prices down.
A failure to do so will eventually lead to exporters
quitting the sesame business, further weakening
Ethiopia’s international trading position in sesame.
70

Box 2.8
Ethiopian Sesame Competitiveness through the Eyes of an Exporter
One of the interviewed exporters explained
the international sesame pricing issue in the
following way: “For one metric ton of sesame,
we are currently paying Br 25,000 at ECX. In
addition, we pay Br 5,000 for cleaning and
processing costs at ECX, leading to a total price
of Br 30,000/metric ton. Thus, the total cost is
approximately US$1,300/metric ton. Since the
international sesame price is US$1,050/metric
ton, we lose US$250 on each metric ton.”
Challenges in the Distribution of Sesame
123. High post-harvest and storage losses. Post-harvest, over 30 percent of the
sesame is lost throughout the marketing
process (Centre for Development Innovation
2013). This loss happens during the stacking
and threshing, transportation (from and to
different warehouses), and storage (due to
increases in pest damages). In addition, quality
is often affected by handling and storage
methods (Ministry of Agriculture et al. 2015).
For illustration purposes, in the example in
figure B.5, the total loss is approximately 20
percent. With an estimated loss of over 30
percent due to marketing problems, this means
that the Ethiopian sesame exporting business
would become a profitable business again if
the sector could eliminate all the post-harvest
and storage losses.
124. Lack of support for exporters in case of default of foreign buyers. In an effort
to improve price information availability in the
sesame supply chain in Ethiopia, ECX publishes
the prices of sesame online every day, on 108
physical price screens throughout the country, and
through a phone number. Thus, farmers have more
accurate knowledge about the price and therefore
get more value for their produce. However,
some foreign buyers use this improvement in
information negatively: they will check the price of
Ethiopian sesame when their shipment arrives and
might default on the shipment if the price is much
higher than the most recent price. Since shipment
takes significant time, this price difference can be
substantial. Although the improvement in price
information is a major achievement of ECX, it is
important that export firms receive legal support
from the government to enforce contracts with
foreign buyers to counter such problems.
Sesame: Conclusions and Recommendations
125. Some firms, mostly foreign, have started to experiment with processing sesame in Ethiopia. However, there is much
more potential for this and it is key for the
sesame sector in Ethiopia to increase value
addition domestically and make the industry
internationally competitive. Adding significant
value is also a major opportunity to obtain more
foreign currency. A wide range of processing
possibilities are available for sesame: (i) edible
oil, (ii) confectionary biscuit and bakery, (iii)
tahini, (iv) halva, (v) sesame flour and seed
sprouts, and (vi) pharmaceutical ingredients
(Ayana 2015). Although some of this processing
will lead to only little value addition, some has
the potential to double the value of sesame
(Ministry of Agriculture et al. 2015). However,
it is important that clear quality standards
need to be developed, since certain types of
71
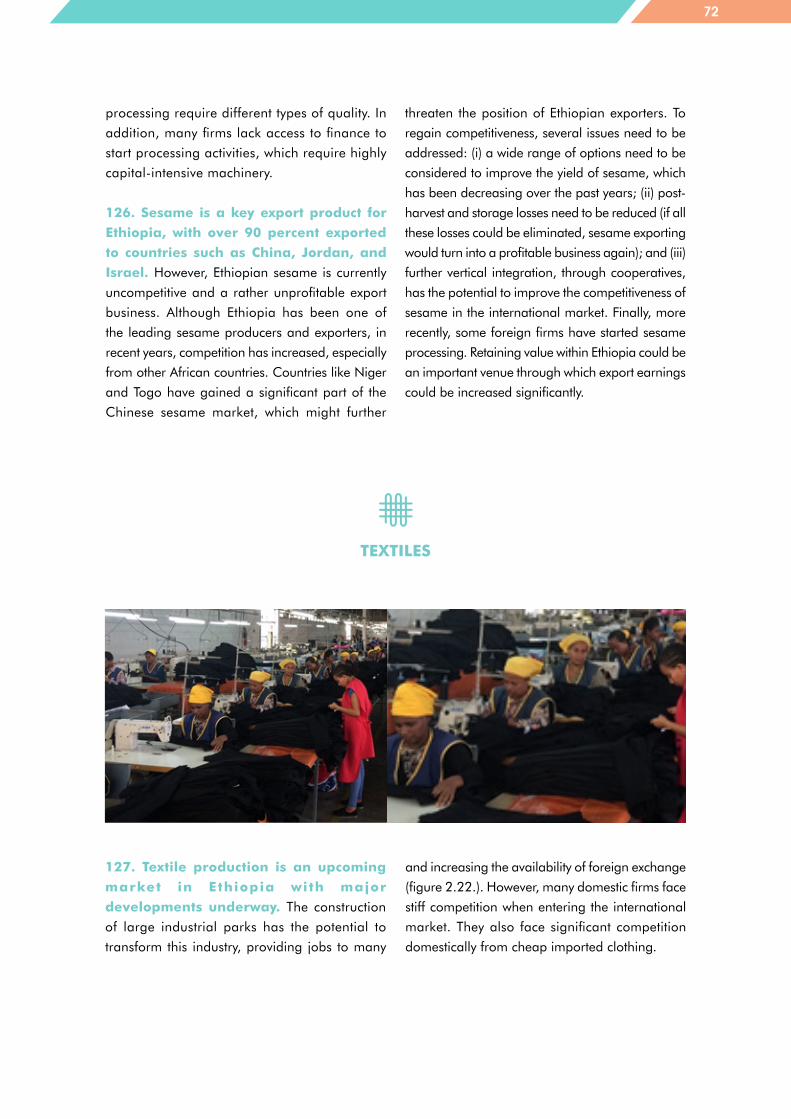
processing require different types of quality. In
addition, many firms lack access to finance to
start processing activities, which require highly
capital-intensive machinery.
126. Sesame is a key export product for Ethiopia, with over 90 percent exported to countries such as China, Jordan, and Israel. However, Ethiopian sesame is currently
uncompetitive and a rather unprofitable export
business. Although Ethiopia has been one of
the leading sesame producers and exporters, in
recent years, competition has increased, especially
from other African countries. Countries like Niger
and Togo have gained a significant part of the
Chinese sesame market, which might further
threaten the position of Ethiopian exporters. To
regain competitiveness, several issues need to be
addressed: (i) a wide range of options need to be
considered to improve the yield of sesame, which
has been decreasing over the past years; (ii) post-
harvest and storage losses need to be reduced (if all
these losses could be eliminated, sesame exporting
would turn into a profitable business again); and (iii)
further vertical integration, through cooperatives,
has the potential to improve the competitiveness of
sesame in the international market. Finally, more
recently, some foreign firms have started sesame
processing. Retaining value within Ethiopia could be
an important venue through which export earnings
could be increased significantly.
127. Textile production is an upcoming market in Ethiopia with major developments underway. The construction
of large industrial parks has the potential to
transform this industry, providing jobs to many
and increasing the availability of foreign exchange
(figure 2.22.). However, many domestic firms face
stiff competition when entering the international
market. They also face significant competition
domestically from cheap imported clothing.
TEXTILES
72

Figure 2.22 Supply Chain of Textiles in Ethiopia
INPUTS
PRODUCERS
CONSUMERS
DISTRIBUTORS & RETAILERS
TRADERS, MIDDLEMEN & COOPERATIVES
Domestic inputs
Small scale home production
Wholesalers in Addis Ababa
Retailshops
Domestic consumers
Foreign inputs
Major factories
Wholsalers to other regions
Factory-owned retail shops
Corporate domestic consumers
Foreign wholesalers
Foreign retail shops
Foreign consumers
Inputs
Producers
Traders
Although some textile factories use
domestic inputs, the vast majority of inputs come from abroad, in particular, from China, India,
In addition to some small-scale home production (mostly by women), most of the formal production is dominated by tens of textile factories. These factories
Factor ies general ly have wholesalers in Addis Ababa or abroad. Most of these factories do
not own their own retail shop: only the
biggest, established firms own retail
and Pakistan. A major problem is
the delay in shipment and the quality
of these inputs.
differ significantly in the destination of
their products: many of the Ethiopian-
owned factories focus on the domestic
market, and some of the foreign-owned
are more focused on exports.
shops. Many firms also supply directly
to larger corporate firms (for example,
other factories that need clothing for
their workers). Some of the smaller
firms supply directly to retail shops.
73

Distributors
Consumers
Most retail shops are small and can be found anywhere and in any form. Some of the retail shops in
Beyond the domestic and foreign consumer markets, factories also produce directly for corporate
Wholesalers in Addis redistribute some
of their clothing toward other regions
the city center of Addis have a prime
location; others in Merkato are small
and approach informality.
customers. The extent to which a
factory can export depends strongly on
the quality produced.
via other wholesalers. This redistribution
mostly happens in Merkato.
Key Challenges in the Supply Chain
128. International competitiveness is highly affected by the low quality of inputs, the time it takes for inputs to arrive, and the high cost of inputs due to the import tax. Firms obtain most of their inputs
from abroad (China, India, and Pakistan). The
key problem is that these inputs are often of low
quality, making it difficult for Ethiopian clothing to
compete on the international stage. In addition,
it often takes several months for these inputs to
arrive, due to transport and customs. Although
there is little to gain in reducing sea transport time,
it is expected that the revived Djibouti Railway
will improve land transportation time. However,
to make full use of the advantage of the railway
improvement, the delays in customs clearance
need to be addressed. Since it takes three to four
months for inputs to arrive after ordering, firms
often have little negotiating power in case the
quality is low: they simply have to produce the
clothing with the given inputs.
129. To a certain extent, the high price of inputs is due to the high import tax. High import taxes reduce the potential for major
exports, as Ethiopian textiles will not be able to
become internationally competitive. Reducing or
completely removing these import taxes could
strengthen the Ethiopian textile industry, by
increasing exports and enabling textiles to be a
potential source of additional foreign exchange.
130. Challenges related to finance, infrastructure, and technical knowledge are particularly pronounced in the textile sector. Although these issues affect many
industries, it is important to highlight them, since
these are some of the key binding constraints
in the textile sector. In terms of finance, many
firms fail to obtain loans from private banks or
the Development Bank of Ethiopia. If they can
obtain such loans, they are at extremely high
rates. Although progress has been made in
improving technical knowledge, most notably
through the expansion of textile technical and
vocational education and training and related
special degrees at Bahir Dar University, firms
still have difficulty finding qualified people at all
levels. Infrastructure issues, especially related to
electricity, severely affect the ability of factories
to produce and deliver orders on time: a failure
to do so leads to bad relations with wholesalers,
something that could have severe consequences,
especially for foreign wholesalers.
74

Challenges in the Distribution of Textiles
131. Lack of quality and a perception about low quality lead to distribution issues. Many
firms fail to export because of the failure to adhere
to international standards. In addition, some firms
might be able to produce high-quality clothing but
lack awareness about the international standards
for exports.
132. A missing link is that many firms would like to export but fail to establish contacts with foreign buyers. Beyond quality, some firms
that believe the quality of their clothing meets
international standards fail to find international
markets. There needs to be more interaction
between textile producers and potential foreign
buyers. However, to a certain extent, the failure
to find international markets might be intertwined
with the quality problem.
Textiles: Conclusions and Recommendations
133. The key development within the textile sector is the development of major industrial parks, such as Hawassa Industrial Park, where major international brands have started or will start operation. Although many of these industrial parks are
government-owned, some have been developed
by the private sector. As indicated by Weldesilassie
et al. (2017, 123), three industrial parks are
currently fully operational, two have finalized
construction and are ready for operations,
five are under construction, and 11 more are
planned. In addition, since the publication of this
report, several parks have started operation or
are (almost) ready for operation. Firms in these
industrial parks have a mandate to produce only
for export.
134. However, the industrial parks are not perceived as an opportunity to support knowledge transfer. Although the Ethiopian
Textile and Garments and Manufacturing
Association has organized knowledge- and
experience-sharing events, there has been little
cooperation between firms from industrial parks
and domestic firms.
135. Textiles production is expanding rapidly in Ethiopia, mostly due to the active government policy on the opening of several industrial parks. In domestic
production, however, a major quality problem
prevents the industry from expanding domestically
and abroad. Nearly all inputs are imported, which
are often expensive (partially because of a high
import tax), of low quality, and arrive after a long
period. Since firms have no other options, these
expensive, low quality inputs must be used, which
drives the firms out of the international market. The
resulting low quality of Ethiopian textile products
makes it difficult for Ethiopian firms to find a
foreign market: the “missing link.” Domestically,
this problem perpetuates a low-quality perception,
also hampering domestic growth. Although
industrial parks, such as Hawassa Industrial Park,
are not perceived as a threat to the domestic
industry, due to its export-oriented approach, they
could provide an opportunity for knowledge and
experience sharing.
Summary
136. These case studies show that although distribution services have an important role to play in each value chain, they are only one part of the story. Although
eliminating obstacles to distribution services can
help link rural producers to markets for inputs
and the sale of raw milk, or reduce post-harvest
and storage losses, binding constraints such as
limited access to finance or lack of skills would
need to complement reforms in the distribution
sector to reduce the prices paid by consumers for
these products, facilitate the movement into higher
value-added activities (such as cheese or sesame
oil), and increase exports.
75

137. The analysis reveals that services matter for Ethiopia’s economic growth and development, but performance needs to improve for the sector to become truly transformational. Many modern services remain
underdeveloped in Ethiopia. Although the strategic
services are excessively controlled (for example,
services that are considered to be of strategic
importance are allowed to operate only as strict
public monopolies—for example, telecom, power,
and air transport—or through limited domestic
private ownership—for example, the financial
sector), other so-believed wasteful services, such
as professional services or health services, are
neglected, resulting in almost no policy discourse
on the role of the services sector in determining
the national competitiveness and limited reform.
Traditional services such as distribution services also
witness high regulations and prohibit the presence
of foreign services suppliers and investment.
2.4. Recommendations for the Future of Distribution Services
First, “services” are treated in isolation and not as part of an interconnected chain of value addition
from production to final consumption. Yet, the case studies presented in this report show that since
supply chains are a series of linked international markets for goods and services, with policies
in one market provoking ripple effects in the markets along the whole value chain (Low 2013),
participation in international value chains has important implications for policy interventions. Policy
formulation needs to treat goods and services together, as there are significant links between the
two sectors. Moreover, such links call for modal neutrality—trade and regulatory policies that
enable services firms to provide services through all modes of supply without impeding a switch
from one mode of supply to another. Furthermore, regulatory coherence, simplicity, and efficiency
need to be maximized to enable countries and firms to become competitive at the task level.
Finally, since there has been a recent increase in the importance of value chains organized at
the regional, rather than global, level in driving GVC participation and upgrading in a handful
of industries (Staritz, Gereffi, and Cattaneo 2011), addressing integration at the regional level
is critical.
Second, that many services are now tradable and can be a source of export-led growth and export
diversification has not yet been part of the policy discourse—because it is a recent phenomenon
and because of the assumption that the comparative advantage of a low-income country like
Ethiopia lies in agriculture and labor-intensive manufacturing. Although Ethiopia’s services exports
are currently dominated by traditional services, exports of modern services such as communication
or business services are beginning to emerge, and their role in export diversification and earnings
should not be neglected.
138. The disconnect between the reality on the ground and the ambivalent policy stance arises from various sources.
76

Third, there is a genuine concern among policy makers that the state of regulation and the
regulatory capacity of the government are relatively weak to support further liberalization of
services. And finally, there is a worry that opening services sectors that operate under a monopoly
would lead to declines in revenue and more outflow of foreign exchange in the form of profit
repatriation—putting further pressure on the beleaguered exchange rate.
Raising awareness about the importance of distribution services for the formal and informal sectors
in Ethiopia is an important first step in designing a comprehensive reform strategy that is linked
with national development plans. The sector urgently requires a broad development strategy
and recognition as a key economic driver to facilitate its growth to the next level. The importance
of a formal distribution sector that contributes heavily to economic growth and is currently the
second leading (formal) employer has been acknowledged in Ethiopia. Steps must be taken to
raise awareness about the importance of the sector in a consistent way on the basis of detailed
economic performance analyses and benchmarking exercises, while incorporating the informal
sector into the landscape of distribution services. The large size of the informal sector underscores
the importance of distribution strategies that can efficiently reach households at the bottom of
the income pyramid and integrate small-scale farmers into the distribution system. Economic
policies should address the root causes of informality, which can be a significant barrier for foreign
operators to enter the distribution market in Ethiopia.
Taking steps to relax explicit trade barriers, eliminate regulatory obstacles, and address informality
issues. With distribution services closed to foreign participation, Ethiopia remains behind all East
African countries and other comparators in removing explicit trade barriers. Box 2.7 provides a
summary of experiences with the liberalization of distribution services, which may provide some
guidance for possible reform in Ethiopia. Furthermore, the lack of regulation, onerous regulation,
and unequal enforcement of regulation pose serious problems to competition and affect formal
firms, including foreign operators, in the distribution sector. Reforms should focus on developing
the necessary regulatory frameworks for distribution services, including rules and regulations
affecting the business environment, eliminating disproportionate entry requirements such as
139. Although wholesale policy reform in services is not feasible, several steps can be taken to increase efficiency and attune services policy to be more supportive of development. Countries throughout the region
are moving toward integrating their services
markets, and there may be long-term costs to
Ethiopia if left behind in services, with negative
consequences for manufacturing and processed
agricultural products. Starting with nonstrategic
sectors, such as distribution services, could be a
good entry point into the world of services reforms.
The case of distribution services can be illustrative
of the opportunities for exports and the benefits
from greater services openness and the policy
reforms and approaches that will be required for
these to be realized. This sector can provide the
base for a broader discussion of services trade
policy reforms. The following list is not exhaustive,
but it provides some initial reform guidance for
this important sector.
77

Addressing the concerns of the poorest households and facilitating the inclusion of smallholders
in modern distribution chains should be a priority in Ethiopia. The majority of the population
and a significant percentage of the income remain at the base of the pyramid. Possible policy
actions to meet the needs of the poorest households and expand their access to basic products
at affordable prices include the following:
Facilitate the creation of organized market outlets for small-scale operators, to encourage their
graduation from the informal sector.
Facilitate access to financial services in the informal sector. Several case studies in Africa show
that increased access to credit by micro and small enterprises has contributed to the growth in
the distribution sector, particularly in the informal segment.
Provide support to traditional and informal operators to acquire market-relevant skills. For
example, training courses focusing on basic hygiene standards, merchandising, sampling, or
promotion techniques offered in the slums could improve the skills of retailers in wet markets,
kiosk sellers, or hawkers. There are several examples of innovative solutions to localized
conditions, relying on consumer behavior and private-public partnerships with commercial
potential (see box 2.9 for an example).
Encourage horizontal coordination—such as farmer associations and cooperatives—to increase
the bargaining power of small farmers, allow for economies of scale, and lower marketing and
negotiation costs. Given the mixed experience with such associations, a case-by-case approach
is warranted that emphasizes soft skills and contextualized management structures.
Increase the participation of small farmers in modern chains by exploiting the widespread duality
between traditional distribution chains and modern procurement systems. Rather than bypassing
traditional wholesale systems and increasing the gap between traditional domestic markets and
the formal processing sector, encourage the upgrading of traditional wholesale systems to support
the interaction between the modern and traditional systems. The focus should be on improving
basic safety standards, increasing the traceability of products, and reducing spoilage rates in the
traditional markets. This can improve the structure of wholesale markets and enable upstream
linkages with producers and downstream linkages with retailers and processors.
lengthy registration procedures, multiple licenses, or inadequate zoning regulations. Price controls
represent a serious impediment to competition and should be removed.
Distribution services can be a good entry point into the world of services reforms
78

Addressing skills issues in the distribution sector. A strong distribution sector will require local
know-how and talent. At first, companies will need to bridge the gap by using a mix of local and
international employees. In parallel, investments in developing and retaining local talent are
required. Developing local training programs and putting in place apprenticeship opportunities
will be critical for achieving long-term success.
Addressing infrastructure constraints (for example, roads, ports, and so forth). Steps must be
taken to address the infrastructure and insecurity concerns raised by the business community.
The removal of nontariff barriers that hamper the imports of distributors should be on the policy
agenda of all East African governments.
Box 2.9
Strategies for Reforming Distribution Services
Strategies for reforming distribution services
range from full liberalization to a more gradual
approach. In many developing countries,
reform strategies started by gradually
expanding market access to foreign firms. As
a first step, foreign distributors are allowed to
accommodate customers at the higher end of
the market. The second step entails allowing
foreign firms to enter the wholesale market. In
other countries, domestic retailers dominate
the market and foreign suppliers cater to the
needs of the high-income percentiles of the
population (UNCTAD 2005b).
Countries also attempt to relax restrictions and
regulations governing distribution services and
foreign direct investment (FDI) to benefit from
technological diffusion and raise the efficiency
of these services. Developing and developed
country experiences show that reforming
distribution services concentrates mainly on
increasing competition in local markets through
the elimination of anti-competitive barriers
that affect the performance of distributors in
local markets and hinder their expansion. FDI
is a major tool that can promote competition
among distribution firms in domestic and
international markets. Hence, reform measures
should mainly concentrate on reducing the
constraints on the establishment of domestic
and international firms and their operations
(Baily 1993).
Liberalization also means promoting trade in
services in line with General Agreement on
Trade in Services (GATS) rules and making
commitments for more reforms. Several
developing countries promote liberalization
of trade in distribution services as part of their
GATS commitments. Moreover, they commit
to fulfilling their commitments gradually over
a specified period. Under GATS, World Trade
Organization members identified their policies
that have a negative impact on distribution
services and made specific commitments
to eliminate or at least relax some of them,
as part of their efforts to promote trade
liberalization. Several other restrictions
imposed on these services, for specific social
objectives, remain outside the scope of GATS.
These restrictions include zoning restrictions,
licensing requirements, limits on store size and
79

opening hours, and investment hurdles and
other requirements on foreigners wanting to
trade in the domestic distribution sector. Ideally,
these restrictions would be removed through
unilateral reform or tackled as part of regional
regulatory cooperation.
Countries usually complement reform efforts
with improvements in the business climate
and support of small and medium-size
enterprises. Reform measures also concentrate
on improving supply chains and logistics that
are closely related to distribution services.
Moreover, improving logistics, especially those
related to agriculture and food products, is
one of the priorities of the reform agenda of
distribution services in many countries. These
reform measures allow consumers to have
a wider range of choices of better quality
products at much more affordable prices.
140. Guidance on the implementation of reforms can be provided by an in-depth political economy analysis that looks at structural, institutional, stakeholder, sectoral, and global drivers.34 For instance,
in the case of distribution services, key institutional
drivers relate to the role of informality in the market
as well as more formal institutions/regulations.
Endemic informality may dis-incentivize SMEs
from formalizing, and hence participating in
value chains, as they would face high regulatory
compliance costs and lose competitive advantage
to informal producers.
141. Stakeholder drivers would encompass the full array of actors and regulators across the value chain, including farmers/producers, wholesalers, retailers, agents, and so forth. It will be necessary to examine
the preferences and interests of various economic
actors—such as distribution outlets, farmers,
consumers, regulators, and policy makers—and
their key role in pushing or shaping the reform
process, by shedding some light on the economic
opportunities generated by reform and regional
integration and the cost of maintaining the status
quo. A key stakeholder issue is the limited and
asymmetrical information at every stage in the
distribution service supply chain. For instance, small
producers who do not operate on contracts often
have limited information on weather, crop pricing,
or other relevant information. Likewise, distributors
are often unable to gather information on their
market share and performance, which creates
challenges for developing marketing strategies
and new products, as well as forecasting and
strategic planning. Rent seeking and elite capture
may lead to the perpetuation of uncompetitive
practices (for example, price controls, domestic
ownership requirements, and so forth) that seek
to limit foreign firms entering the market, and
hence the potential to participate in value chains.
142. In terms of sectoral drivers, various issues will likely arise across the retail versus wholesale sectors. Modes of trade
can have a large impact on political economy
problems that emerge and the types of reforms that
are pursued. Moreover, additional sectoral issues
may emerge as “countries’ willingness to make
commitments in services are often inhibited by the
horizontal fragmentation of power either between
branches of government (executive vs. legislative)
or within them (trade ministries vs. other ministries
or agencies), and in some countries the problem is
further exacerbated by the vertical fragmentation
See Annex A for details on the political economy analysis. 34
80

of power (national governments vs. subnational
units of government)” (OECD 2012). Given this
dynamic, a critical issue is the difference in the
levels of regulations between product categories
and sectors. Divergent sectoral regulations (for
example, market access, conduct regulations,
standards, and so forth) may result in barriers for
certain types of products to enter value chains.
For instance, food staples (including maize, sugar,
and cooking oil) and petroleum products can be
subject to price controls at the discretion of the
government, whereas the prices of other classes
of products are unregulated. Although price
controls are designed to prevent wide fluctuations,
they can give rise to a variety of problems and
perverse consequences. For instance, powerful
producers or trade associations may lobby for
a certain price control to remain in place, long
after its usefulness as a social protection has
ended, which may increase producer rents but
hurt consumers, particularly the poor, who are
highly dependent on food staples. Likewise, some
sectors are subject to greater conduct regulations,
such as pharmaceuticals and alcohol producers.
Although quality, labeling, packaging, and
advertising restrictions may serve a public interest,
they may also result in an unfair advantage to
these producers in comparison with other products
and sectors of the economy.
143. Several global/international drivers can have a particular impact on the domestic political economy of distribution services, including (i) foreign investment, which
can provide evidence on the intentions and interests
of external investors and firms—especially those
facing external competition—which affect how
they lobby governments; (ii) international legal
measures and sanctions, which can impact trade,
financial, and travel restrictions; (iii) reputational
pressures on stakeholders, which can relate to
the influence that international organizations,
Regional Economic Communities, or international
business groups have on trade in distribution
services; and (iv) external skills and ideas, which
relate to international practices and ideologies on
doing business.
144. Taken together, these drivers can provide a useful framework to conceptualize the political economy of distribution services reform and help identify feasible measures with the greatest benefits.
81

AProblem-Driven Political
Economy Analysis
Annex
82

Building on the regulatory analysis on distribution services, this annex addresses the larger political economy of reform in the sector. Although there are many political
economy methodologies available, a particularly
useful framework is offered by using a “problem-
driven” governance and political economy
approach, developed by the World Bank (Fritz et
al. 2009) (box C.1). At the core of this approach
is a focus on a particular problem, opportunity,
or vulnerability that needs to be addressed. Such
a methodology allows for a better understanding
of specific issues and challenges, rather than
developing broad overviews, to generate useful
findings and implications (Fritz et al. 2009).
A problem-driven approach can be especially useful in understanding the
underlying political economy determinants and constraints to the distribution services sector. Given the nature of the sector and the
potential transformative effects it can have on
the regional and national economies of the
member states, it is essential to tease out the
key drivers that contribute to the development,
regulation, and future prospects of distribution
services. Accordingly, this analysis is not about
identifying one major bottleneck, but rather
understanding the political economy decisions of
a myriad of challenges and frictions, and perhaps
suggesting which dimensions could be addressed.
Such an approach will provide insight not only
into challenges that result in necessary reforms
not gaining traction, but also into potential
opportunities that may unlock key road blocks in
the reform process.
Box A.1Distribution Services Political Economy Conceptual Framework35
• Structural drivers. Structural drivers are
factors that are beyond the control of the
government and reflect deeper features of
the respective countries, such as resource
endowments, geographic position, levels
of development, or population dynamics,
which may affect a country’s institutional
setup. Such issues may additionally
stem from the types of colonialization
and decolonialization that a country
experienced, as well as other historical
processes that have shaped the political,
social, and cultural institutions that affect
actors’ incentives. In many cases, these
issues cannot be changed in the short-
to-medium run, and define a country’s
status quo situation. At the same time,
structural issues can have a large impact
on the opportunities that a country has
with respect to its bargaining position,
as well as with respect to the exogenous
risk that it faces in a global system. For
example, structural issues may make an
economy more exposed to commodity
price shocks, currency fluctuations, or
other macroeconomic fragilities.
This political economy framework for conceptualizing trade in distribution services is based on governance, regional
integration, trade, and political economy literature: • Problem-Driven Governance and Political Economy Analysis (Fritz,
Kaiser, & Levy, 2009); • Arguing a Political Economy Approach to Regional Integration (Byiers, Vanheukelom, & de
Roquefeuil (2013); International Drivers of Corruption: A Tool for Analysis (OECD 2012)
35
83
• Institutional drivers. Institutional drivers,
which can be seen as the “rules of the
game,” are a combination of the formal
laws and regulations, as well as less
formalized customs and institutions.
Understanding the formal and informal
institutions is essential, as they provide
a clearer picture about the context in
which actors operate, but also identify
“levers of change” in existing systems.
At the institutional level, mapping can be
a valuable instrument in understanding
• Stakeholder drivers. Actor/stakeholder
drivers involve analyzing the divergent
interests of government agencies,
political parties, nongovernmental
organizations, business associations,
traditional associations, and producers
and traders of certain products, as well
as external actors such as donors, foreign
investors, and international organizations.
At the stakeholder level, mapping can
provide vital information on the various
types of parties involved—whether they
• Sectoral drivers. As noted by Byiers et al.
(2013), a sectoral approach is necessary
for several reasons. First, different sectors
have differing levels of political salience
and visibility at the national level and,
accordingly, will incentivize politicians or
service providers in different ways. Second,
depending on information asymmetries,
more visible policies make it easier to
structural political economy factors.
Such an exercise includes analysis of
informal institutions, such as kinship
structures, traditions, and social norms,
as well as formally codified institutions,
such as laws, regulations, and agencies.
Importantly, as noted by Fritz et al.
(2009), it is necessary to understand the
relationship between formal and informal
institutions and ascertain whether they
have complementary, accommodating,
substituting, or competing relationships.
are individuals or specific groups. such
as government officials of a ministry,
agency, civil society organization, business
association, or political party. Once key
stakeholders are identified, the problem-
driven literature suggests that they can be
categorized in several ways to understand
their interests as demand-side versus
supply-side actors, reform champions
versus reform opponents, or winners
versus losers from certain reforms.
attribute credit or blame. Third, the balance
of power between policy makers and other
actors is important, as monopoly services
can reduce state incentives for oversight
and improved performance. Last, sector
services that are frequent, predictable, or
area-based may make it easier for citizens
or other groups to mobilize collectively
(Byiers et al. 2013, 12).
84
• Global drivers. Certain global dynamics or
processes may shape domestic institutional
and political incentives, which may have
positive or negative impacts on domestic
institutions and governance arrangements
(Byiers et al. 2013, 12). In particular, the
Organisation for Economic Co-operation
and Development approaches these drivers
based on the effects they have on corruption
and governance at the state level. These
effects could include (i) sources of rents
and unearned incomes, (ii) opportunities
and constraints to conceal and move
illicit assets, (iii) foreign investment, (iv)
global and regional security threats and
responses, (v) international legal measures
and sanctions against domestic elites, (vi)
reputation pressures on political elites from
regional and international actors, and (vii)
external ideas and skills (OECD 2012).
Importantly, these issues should take into
account not only current exigencies, but
also their potential to affect governance
in the future.
Taken together, the drivers present a unique and customized framework to conceptualize the political economy issues of distribution services. The conceptual framework addresses a
range of governance, trade, regional integration, and political economy concepts.
85

References
A. T. Kearney. 2008. “Emerging Opportunities for Global Retailers: The A.T. Kearney 2008 Global
Retail Development Index.” A. T. Kearney, Chicago, IL.
African Development Bank and Organisation for Economic Co-operation and Development. 2015.
African Economic Outlook 2015. http://www.africaneconomicoutlook.org/outlook/.
Arkell, Julian, and Michael D. Johnson. 2005. “Final Report for the Distribution Services Survey.”
Organisation for Economic Co-operation and Development, Paris.
BIS (Bank for International Settlements). 2009. “Household Debt: Implications for Monetary Policy and
Financial Stability.” BIS Paper No. 46. BIS, Basel, Switzerland.
Bertrand, Marianne, and Francis Kramarz. 2002. “Does Entry Regulation Hinder Job Creation? Evidence
from the French Retail Industry.” Quarterly Journal of Economics 107 (4): 1369–1413.
Boylaud, O. 2000. “Regulatory Reform in Road Freight and Retail Distribution.” Economics Department
Working Paper No. 255. Organisation for Economic Co-operation and Development, Paris.
Boylaud, O., and G. Nicoletti. 2001. “Regulatory Reform in Retail Distribution.” Economic Studies No.
32. Organisation for Economic Co-operation and Development, Paris.
Bradford, Scott. 2005. “The Welfare Effects of Distribution Regulations in OECD Countries.” Economic
Inquiry 43 (4): 785–811.
Bradford, Scott, and Alexandre Gohin. 2006. “Modeling Distribution Services and Assessing their
Welfare Effects in a General Equilibrium Framework.” Review of Development Economics 10 (1): 87–102.
Byiers, B., J. Vanheukelom, and Q. de Roquefeuil. 2013. “Arguing a Political Economy Approach to
Regional Integration.”
Carree, M. A., and J. Nijkamps. 2001. “Deregulation in Retailing: The Dutch Experience.” Journal of
Economics and Business 53: 225–35.
Chandra, Vandana, I. Osorio-Rodarte, and C. A. Primo Braga. 2009. "Korea and the BICs (Brazil,
India and China): Catching Up Experiences." European Centre For International Political Economy
Deloitte. 2008. “Global Powers of Retailing.” Deloitte Consulting, Petaluma, CA.
Dinh, Hinh T., et al., eds. 2012. Light Manufacturing in Africa: Targeted Policies to Enhance Private
Investment and Create Jobs. Washington, DC: World Bank.
86

Dries, L. et al. 2004. “The Rapid Rise of Supermarkets in Central and Eastern Europe: Implications for
the Agrifood Sector and Rural Development. Development Policy Review 22 (5): 525–56.
Euromonitor. 2006. “World Retail Data and Statistics 2007/2008.” Euromonitor International, London.
François, Joseph, and Ian Woonton. 2007. “Market Structure and Market Access.” Policy Research
Working Paper 4151, World Bank, Washington, DC.
Fritz, V., K. Kaiser, and B. Levy. 2009. Problem-Driven Governance and Political Economy Analysis:
Good Practice Framework. Washington, DC: World Bank.
Geiger, Michae,; and Lars Christian Moller. 2013. Ethiopia: Second Economic Update: Laying the
Foundation for Achieving Middle Income Status. Washington, DC: World Bank Group.
Gicho, Richard. 2010. “Distribution Services in East Africa (Kenya Report).” World Bank, Washington, DC.
Growth Commission. 2008. The Growth Report: Strategies for Sustained Growth and Inclusive
Development. Washington, DC: World Bank.
Hoffmaister, Alexander W. 2006. “Barriers to Retail Competition and Prices: Evidence from Spain.”
IMF Working Paper, WP/06/231. International Monetary Fund, Washington, DC.
IMF. 2014. The Federal Democratic Republic of Ethiopia: Selected Issues and Statistical Appendix.
Washington, DC: International Monetary Fund.
Joseph, Matthew, N. Soundararajan, M. Gupta, and S. Sahu. 2008. “Impact of Organized Retailing
on the Unorganized Sector.” Indian Council for Research on International Economic Relations.
Kalirajan, Kaleeswaran. 2000. “Restrictions on Trade in Distribution Services.” Staff Research Paper.
Australian Productivity Commission, Melbourne.
Kalish, Ira, and Rob Gregory. 2011. “Hidden Heroes: The Next Generation of Retail Markets.” Deloitte
Consulting, Petaluma, CA.
Kim Hyun Chul, Itoh, M., Wenping Luo, G. McGuire, W. Moon, and N. Shimoi. 2003. “The Costs and
Benefits of Distribution Services Trade Liberalization: China, Japan and Korea.” Asia-Pacific Economic
Cooperation, Singapore.
Kiringai, Jane Wangui, Michael Tobias Geiger, Mesfin Girma Bezawagaw, and Leif Jensen. 2016.
Ethiopia Public Expenditure Review. Washington, DC: World Bank Group.
Lin, Justin Yifu, Fang Cai, and Zhou Li. 1998. "Competition, Policy Burdens, and State-Owned Enterprise
Reform." American Economic Review 88 (2): 422–27.
Martins, P. 2014. “Structural Change in Ethiopia: An Employment Perspective.” Policy Research Working
Paper 6749, World Bank, Washington, DC.
87

Minten, B., and T. Reardon. 2008. “Food Prices, Quality, and Quality’s Pricing in Supermarkets versus
Traditional Markets in Developing Countries.” Review of Agricultural Economics 30 (3): 480–90.
Minten, B., S. Tamru, E. Engida, and T. Kuma. 2013. “Ethiopia’s Value Chains on the Move: The Case
of Teff.” ESSP Working Paper 52. International Food Policy Research Institute, Washington, DC.
Moriarty, Mike, et al. 2014. “Seizing Africa’s Retail Opportunities.” A. T. Kearney, Chicago, IL.
Mukherjee, A., and N. Patel. 2005. “Foreign Direct Investment in Retail Sector: India.” Indian Council
for Research on International Economic Relations.
Neven, David, and Thomas Reardon. 2003. “The Rapid Rise of Kenyan Supermarkets: Impact on
the Fruits and Vegetables Supply System.” FAO technical workshop paper. Food and Agriculture
Organization, Rome.
Nordås, Hildegunn Kyvik, Massimo Geloso Grosso, and Enrico Pinali. 2008. “Market Structure in the
Distribution Sector and Merchandise Trade.” OECD Trade Policy Working Paper No. 68. Organisation
for Economic Co-operation and Development, Paris.
Nyoro, James K., Joshua Ariga, and Isaac K. Ngugi. 2006. “Kenya.” In Regoverning Markets: A Place
for Small-Scale Producers in Modern Agrifood Chains? edited by Bill Vorley, Andrew Fearen, and Derek
Ray. London: International Institute for Environment and Development.
OECD (Organisation for Economic Co-operation and Development). 2008. OECD Science, Technology
and Industry Outlook 2008. Paris: OECD.
———. 2012. International Drivers of Corruption: A Tool for Analysis. Paris: OECD
Pellegrini, L. 2000. “Regulations and the Retail Trade.” In Regulatory Reform and Competitiveness in
Europe: Vertical Issues,” edited by G. Galli and J. Pelkmans. Northhampton, MA: Edward Elgar.
Pilat, D. 1997. “Regulation and Performance in the Distribution Sector.” Economics Department Working
Paper No. 180. Organisation for Economic Co-operation and Development, Paris.
Planet Retail. 2013. Retail sales data, http://www1.planetretail.net/.
Radelet, Steven, and Jeffrey D. Sachs. 1998. "Shipping costs, manufactured exports, and economic
growth.". Presented at the Annual Meeting of the American Economics Association, Chicago.
Reardon, T., C. P. Timmer, C. B. Barrett, and J. Berdegué. 2003. “The Rise of Supermarkets in Africa,
Asia, and Latin America.” American Journal of Agricultural Economics 85 (5): 1140–46.
Reardon, T., P. Timmer, and J. Berdegué. 2004. “The Rapid Rise of Supermarkets in Developing
Countries: Induced Organizational, Institutional and Technological Change in Agrifood Systems.”
88
Electronic Journal of Agricultural and Developmental Economics 1 (2): 168–83.
Reardon, T., D. Tschirley, B. Minten, S. Haggblade, C. P. Timmer, and S. Liverpool-Tasie. 2013. “The
Emerging ‘Quiet Revolution’ in African Agrifood Systems.” Brief for Harnessing Innovation for African
Agriculture and Food Systems. African Union Conference, Addis Ababa, Ethiopia.
Research Solutions Africa. 2016. “International Value Chains Pilot Study Report.” World Bank internal
document.
Roy, Martin. 2008. “Out of Stock or Just in Time? Doha and Liberalization of Distribution Services.”
In Opening Markets for Trade in Services; Countries and Sectors in Bilateral and WTO Negotiations,
edited by Juan A. Marchetti and Martin Roy. World Trade Organization and Cambridge University Press.
Roy, Martin, Juan Marchetti, and Hoe Lim. 2008. “The Race Towards Preferential Trade Agreements in
Services: How Much Market Access Is Really Achieved?” iIn GATS and the Regulation of International
Trade in Services, edited by Marion Panizzon, Nicole Pohl, and Pierre Sauvé. Cambridge University Press.
Rugamba, Henry. 2010. “Survey Work and Analysis on Distribution Services in Rwanda.” World Bank,
Washington, DC.
Scheltema, Nico, et al. 2014. “Evolving Skill Needs in the Food System of East and Southern Africa:
Results from Agribusiness Company Interviews.” Working Paper No. 11. Capacity Development for
Modernizing African Food Systems (MAFS). Michigan State University, East Lansing, MI.
Shirley, Mary M. 1989. “Improving Public Enterprise Performance: Lessons from South Korea.” Policy,
Planning and Research Department Working Papers 312, World Bank, Washington, DC.
Shirley, Mary. 1996. “Bureaucrats in Business: The Economics and Politics of Government Ownership.”
DECnotes No. 5, World Bank, Washington, DC.
Sitko, Nicholas, and T. S. Jayne. 2014. “Demystifying the Role of Grain Assemblers in the Rural Maize
Markets of Eastern and Southern Africa.” Working Paper No. 84 Indaba Agricultural Policy Research
Institute, Lusaka, Zambia.
Traill, W. Bruce. 2006. “The Rapid Rise of Supermarkets?” Development Policy Review 24 (2): 163–74.
Tschirley, D., T. Reardon, M. Dolislager, and J. Snyder. 2014. “The Rise of a Middle Class in East and
Southern Africa: Implications for Food System Transformation.” WIDER Working Paper 2014/119.
World Institute for Development Economics Research, Helsinki, Finland.
USAID (U.S. Agency for International Development). 2013. “Regional Trade in Fresh Fruits and
Vegetables.” USAID, Washington, DC.
van de Walle, Dominique, and Dorothyjean Cratty. 2003. “Is the Emerging On-farm Market Economy
the Route out of Poverty in Vietnam?” Economics of Transition 12 (2): 237–74.
89

VanGrasstek, C. 2011. “The Political Economy of Services in Regional Trade Agreements.” OECD Trade
Policy Papers, No. 112. Organisation for Economic Co-operation and Development, Paris. http://
dx.doi.org/10.1787/5kgdst6lc344-en.
World Bank 2008. The Growth Report: Strategies for Sustained Growth and Inclusive Development.
Washington, DC: World Bank.
———. 2010. “Africa’s Trade in Services and the Opportunities and Risks of Economic Partnership
Agreements.” Africa Trade Policy Notes No. 6, World Bank, Washington, DC.
———. 2011. “Beyond the Nakumat Generation: Distribution Services in East Africa.” Africa Trade
Policy Notes #26, World Bank, Washington, DC.
———. 2012. Africa Can Help Feed Africa. Washington, DC: World Bank.
———. 2013. China 2030: Building a Modern, Harmonious, and Creative Society. Washington, DC:
World Bank.
———. 2014. “Ethiopia Economic Update III: Strengthening Export Performance through Improved
Competitiveness.” World Bank, Washington, DC.
World Bank Group and World Trade Organization. 2015. The Role of Trade in Ending Poverty. Geneva:
World Trade Organization:.
Yusuf, Shahid. 2001. "The East Asian Miracle at the Millennium." In Rethinking the East Asian Miracle.
90
