public debt and productivity: the difficult quest for ... · wp/06/235 public debt and...
TRANSCRIPT
WP/06/235
Public Debt and Productivity: The Difficult Quest for Growth in Jamaica
Rodolphe Blavy

© 2006 International Monetary Fund WP/06/235
IMF Working Paper Western Hemisphere Department
Public Debt and Productivity: The Difficult Quest for Growth in Jamaica
Prepared by Rodolphe Blavy1
Authorized for distribution by Sanjaya Panth
October 2006
Abstract
This Working Paper should not be reported as representing the views of the IMF. The views expressed in this Working Paper are those of the author(s) and do not necessarily represent those of the IMF or IMF policy. Working Papers describe research in progress by the author(s) and are published to elicit comments and to further debate. The paper analyzes Jamaica’s experience of low growth despite consistently high investment. Cross-country analysis provides evidence of a significant and negative relationship between total public debt and productivity growth. Looking at the specific channels through which high debt affects productivity growth and the allocation of resources in Jamaica, the study finds that high public debt has been associated with macroeconomic uncertainty and an output structure that relied excessively on a few maturing sectors with limited scope for productivity growth. Furthermore, public investment has been crowded out by debt service, further adversely affecting productivity growth. JEL Classification Numbers: F21, F34, F43, O11, O40, O47, O54
Keywords:
Jamaica, growth, external debt, public debt, growth accounting, productivity
Author’s E-Mail Address: [email protected]
1I would like to thank Ratna Sahay, Sanjaya Panth, David Robinson, Shaun Roache, Maple Kongsamut, Rafael Romeu, Goohoon Kwon, Jim Walsh and the participants of seminars in WHD and the Central Bank of Jamaica for their valuable comments and suggestions; Hiro Atsuta for research assistance; and Xiomara Jordan and Andrea Aquino for editorial assistance. All remaining errors are my responsibility.
- 2 -
Contents Page I. Introduction ........................................................................................................................3 II. The Paradox: Low Growth and High Investment ..............................................................4
A. Stylized Facts ...........................................................................................................4 B. Constraints to Growth ..............................................................................................4 C. Declining Productivity .............................................................................................7
III. The Mismeasurement Story ...............................................................................................8
A. Is GDP Growth Underestimated? ............................................................................8 B. Is Productive Investment Overestimated? .............................................................10 C. Implications of Mismeasurement ...........................................................................12
IV. Low Productivity: Does the Level of Debt Matter? ........................................................13 A. The Effects of Debt on Growth and Productivity ..................................................13 A. Cross-Country Evidence ........................................................................................15 C. Data, Methodology, and Model Specification........................................................15
V. High Debt and Declining Productivity: The Case of Jamaica .........................................18
A. Sectoral Evidence...................................................................................................18 B. Low Public Investment and Low Productivity.......................................................21
VI. Taking Stock: Summary and Conclusions.......................................................................23 Figures 1. Selected Growth Trends, 1980–2004.................................................................................5 2. Emerging Economies: Debt, Growth and Productivity, 1990–2000 (averages)..............16 3. Emerging Economies: Composition of Investment and Growth, 1990–2000..................22 Tables 1. Jamaica and Latin America: Sources of Growth, 1960–2000 ...........................................8 2. Correcting GDP Growth for the Informal Economy (in constant prices), 1991–2000....10 3. Composition of Fixed Capital Formation by Type of Capital Goods at Current Prices, 1994–2004............................................................................................................11 4. Nonlinear Effects of Public Debt on Productivity, 1990–2000 .......................................18 References................................................................................................................................24
- 3 -
I. INTRODUCTION
Jamaica has experienced persistently low growth despite high rates of investment. Real GDP grew, on average, by 1.6 percent a year from 1980 to 2004, while investment rose from 15 percent of GDP to 33 percent over the same period. Understanding this puzzle of high investment and low growth is key to addressing the obstacles to lifting economic growth, improving debt sustainability, and alleviating poverty.
The study finds that Jamaica’s ‘high investment-low growth’ experience appears, in some part, to be due to measurement problems. Specifically, official estimates of growth may be underestimated because the informal economy, which has grown rapidly, is not being picked up in the statistics. Secondly, the capital stock appears overestimated.
However, the mismeasurement only partially helps resolve the high investment-low growth phenomenon and the paper considers whether high public debt, through its adverse impact on productivity, may help explain the rest of the puzzle. The paper’s central hypothesis revolves around the idea that high debt adversely affects investment and productivity by (i) distorting the allocation of investment toward less productive areas; and (ii) reducing the scope for public sector investment, which often has a special complementary role in increasing the effectiveness of private investment.
In exploring its arguments, the study expands on the existing literature on the link between debt and growth.
• First, total public debt, both external and domestic, is used as the key explanatory variable in this study, while others that have looked at the issue of debt and growth have used only external debt. Using a cross-country database, the paper presents evidence of a significant and negative relationship between total public debt and productivity. Specifically, it is found that a doubling of total public debt leads to a reduction in productivity growth of about 1.5 percentage points.
• Second, the paper attempts to flesh out the specific channels through which high levels of debt affect productivity and the allocation of resources. It argues that in the case of Jamaica, high public debt has been associated with macroeconomic uncertainty and an output structure that relied excessively on a few maturing sectors—tourism and mining—while the manufacturing sector declined steadily and the informal economy increased substantially. At the same time, public investment has been crowded out by debt service, further adversely affecting productivity.
The remainder of the paper is organized into five sections. Section II summarizes the key stylized facts. Section III addresses the issue of mismeasurement. Section IV estimates, based on cross-country data, the impact of public debt on productivity, and Section V looks at sectoral evidence from Jamaica for the high debt-low productivity growth hypothesis laid out in the paper. Section VI takes stock and concludes.
- 4 -
II. THE PARADOX: LOW GROWTH AND HIGH INVESTMENT
A. Stylized Facts
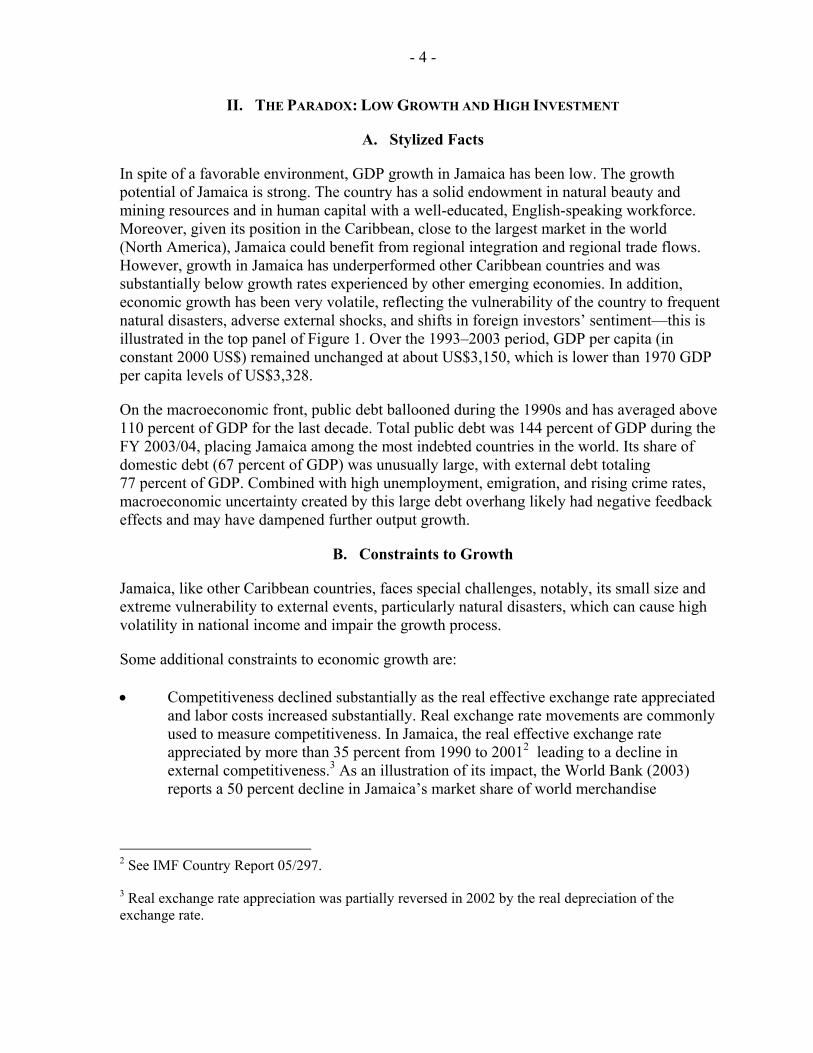
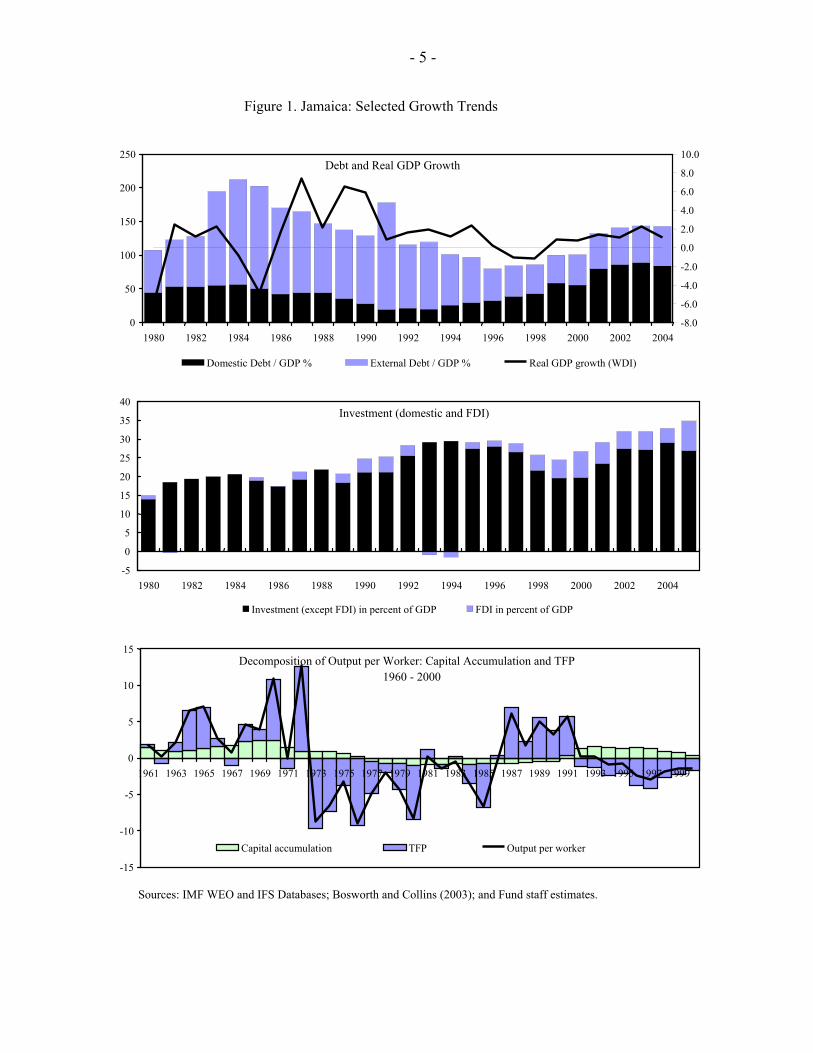
In spite of a favorable environment, GDP growth in Jamaica has been low. The growth potential of Jamaica is strong. The country has a solid endowment in natural beauty and mining resources and in human capital with a well-educated, English-speaking workforce. Moreover, given its position in the Caribbean, close to the largest market in the world (North America), Jamaica could benefit from regional integration and regional trade flows. However, growth in Jamaica has underperformed other Caribbean countries and was substantially below growth rates experienced by other emerging economies. In addition, economic growth has been very volatile, reflecting the vulnerability of the country to frequent natural disasters, adverse external shocks, and shifts in foreign investors’ sentiment—this is illustrated in the top panel of Figure 1. Over the 1993–2003 period, GDP per capita (in constant 2000 US$) remained unchanged at about US$3,150, which is lower than 1970 GDP per capita levels of US$3,328.
On the macroeconomic front, public debt ballooned during the 1990s and has averaged above 110 percent of GDP for the last decade. Total public debt was 144 percent of GDP during the FY 2003/04, placing Jamaica among the most indebted countries in the world. Its share of domestic debt (67 percent of GDP) was unusually large, with external debt totaling 77 percent of GDP. Combined with high unemployment, emigration, and rising crime rates, macroeconomic uncertainty created by this large debt overhang likely had negative feedback effects and may have dampened further output growth.
B. Constraints to Growth
Jamaica, like other Caribbean countries, faces special challenges, notably, its small size and extreme vulnerability to external events, particularly natural disasters, which can cause high volatility in national income and impair the growth process.
Some additional constraints to economic growth are: • Competitiveness declined substantially as the real effective exchange rate appreciated
and labor costs increased substantially. Real exchange rate movements are commonly used to measure competitiveness. In Jamaica, the real effective exchange rate appreciated by more than 35 percent from 1990 to 20012 leading to a decline in external competitiveness.3 As an illustration of its impact, the World Bank (2003) reports a 50 percent decline in Jamaica’s market share of world merchandise
2 See IMF Country Report 05/297.
3 Real exchange rate appreciation was partially reversed in 2002 by the real depreciation of the exchange rate.
- 5 -
Figure 1. Jamaica: Selected Growth Trends
Sources: IMF WEO and IFS Databases; Bosworth and Collins (2003); and Fund staff estimates.
Debt and Real GDP Growth
0
50
100
150
200
250
1980 1982 1984 1986 1988 1990 1992 1994 1996 1998 2000 2002 2004-8.0
-6.0
-4.0
-2.0
0.0
2.0
4.0
6.0
8.0
10.0
Domestic Debt / GDP % External Debt / GDP % Real GDP growth (WDI)
Investment (domestic and FDI)
-5 0 5
10 15 20 25 30 35 40
1980 1982 1984 1986 1988 1990 1992 1994 1996 1998 2000 2002 2004
Investment (except FDI) in percent of GDP FDI in percent of GDP
Decomposition of Output per Worker: Capital Accumulation and TFP 1960 - 2000
-15
-10
-5
0
5
10
15
1961 1963 1965 1967 1969 1971 1973 1975 1977 1979 1981 1983 1985 1987 1989 1991 1993 1995 1997 1999
Capital accumulation TFP Output per worker
- 6 -
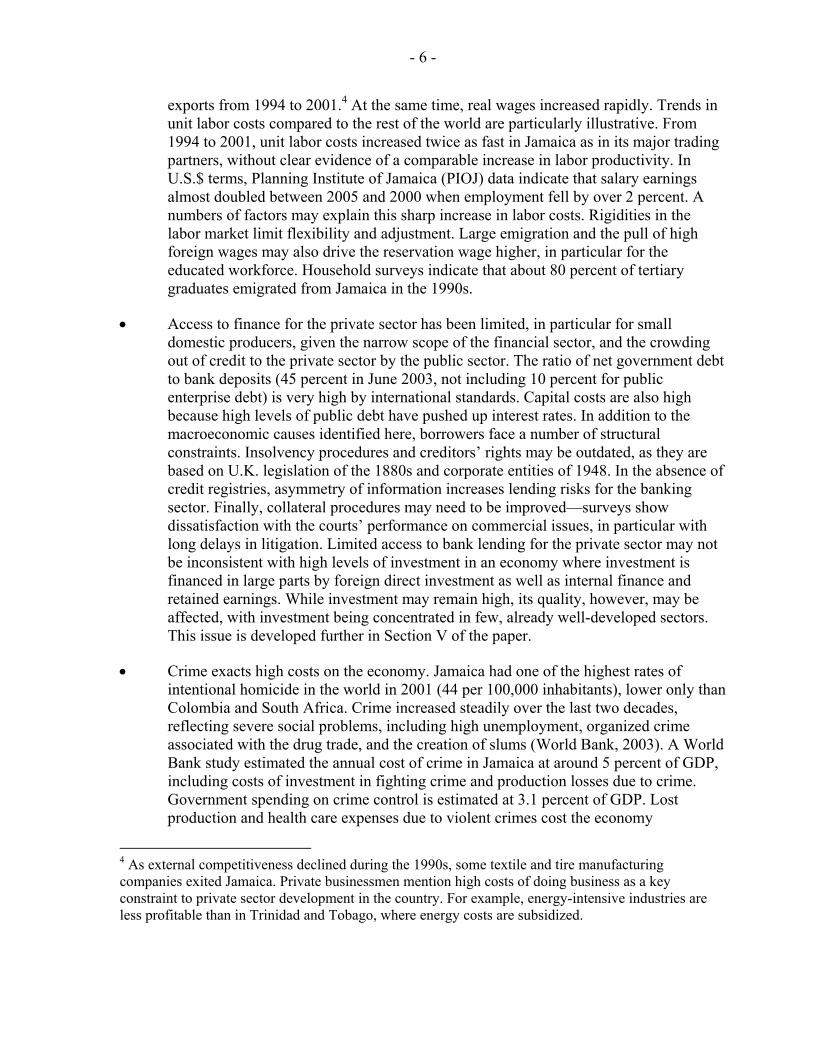
exports from 1994 to 2001.4 At the same time, real wages increased rapidly. Trends in unit labor costs compared to the rest of the world are particularly illustrative. From 1994 to 2001, unit labor costs increased twice as fast in Jamaica as in its major trading partners, without clear evidence of a comparable increase in labor productivity. In U.S.$ terms, Planning Institute of Jamaica (PIOJ) data indicate that salary earnings almost doubled between 2005 and 2000 when employment fell by over 2 percent. A numbers of factors may explain this sharp increase in labor costs. Rigidities in the labor market limit flexibility and adjustment. Large emigration and the pull of high foreign wages may also drive the reservation wage higher, in particular for the educated workforce. Household surveys indicate that about 80 percent of tertiary graduates emigrated from Jamaica in the 1990s.
• Access to finance for the private sector has been limited, in particular for small domestic producers, given the narrow scope of the financial sector, and the crowding out of credit to the private sector by the public sector. The ratio of net government debt to bank deposits (45 percent in June 2003, not including 10 percent for public enterprise debt) is very high by international standards. Capital costs are also high because high levels of public debt have pushed up interest rates. In addition to the macroeconomic causes identified here, borrowers face a number of structural constraints. Insolvency procedures and creditors’ rights may be outdated, as they are based on U.K. legislation of the 1880s and corporate entities of 1948. In the absence of credit registries, asymmetry of information increases lending risks for the banking sector. Finally, collateral procedures may need to be improved—surveys show dissatisfaction with the courts’ performance on commercial issues, in particular with long delays in litigation. Limited access to bank lending for the private sector may not be inconsistent with high levels of investment in an economy where investment is financed in large parts by foreign direct investment as well as internal finance and retained earnings. While investment may remain high, its quality, however, may be affected, with investment being concentrated in few, already well-developed sectors. This issue is developed further in Section V of the paper.
• Crime exacts high costs on the economy. Jamaica had one of the highest rates of intentional homicide in the world in 2001 (44 per 100,000 inhabitants), lower only than Colombia and South Africa. Crime increased steadily over the last two decades, reflecting severe social problems, including high unemployment, organized crime associated with the drug trade, and the creation of slums (World Bank, 2003). A World Bank study estimated the annual cost of crime in Jamaica at around 5 percent of GDP, including costs of investment in fighting crime and production losses due to crime. Government spending on crime control is estimated at 3.1 percent of GDP. Lost production and health care expenses due to violent crimes cost the economy
4 As external competitiveness declined during the 1990s, some textile and tire manufacturing companies exited Jamaica. Private businessmen mention high costs of doing business as a key constraint to private sector development in the country. For example, energy-intensive industries are less profitable than in Trinidad and Tobago, where energy costs are subsidized.
- 7 -
0.6 percent of GDP. Finally, private expenditure on security is estimated by the World Bank at 1.3 percent. The impact of crime may be even more pervasive. Crime limits business expansion and investments to improve productivity. It also adversely affects productive activities by limiting night shifts and longer opening times, and provides an incentive for firms to relocate outside of Jamaica.5
While those constraints are important challenges for the Jamaican economy, a further decomposition of the growth process is needed to fully understand the ‘high investment-low growth’ puzzle.
C. Declining Productivity
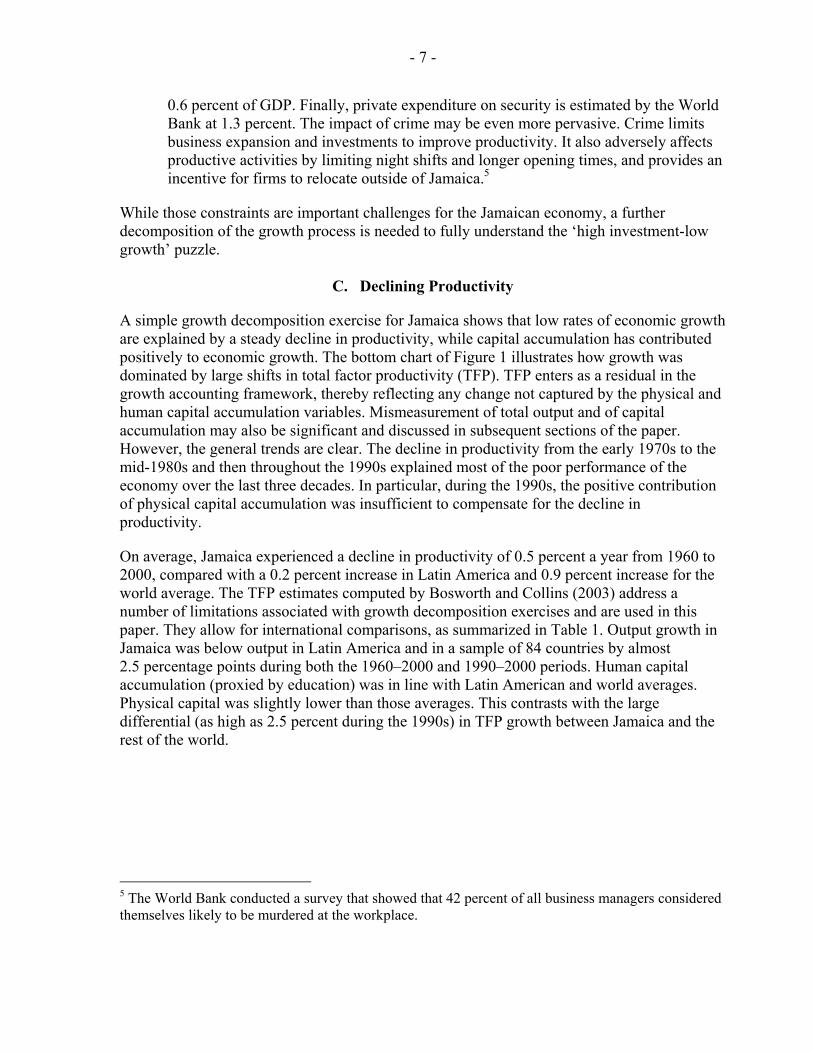
A simple growth decomposition exercise for Jamaica shows that low rates of economic growth are explained by a steady decline in productivity, while capital accumulation has contributed positively to economic growth. The bottom chart of Figure 1 illustrates how growth was dominated by large shifts in total factor productivity (TFP). TFP enters as a residual in the growth accounting framework, thereby reflecting any change not captured by the physical and human capital accumulation variables. Mismeasurement of total output and of capital accumulation may also be significant and discussed in subsequent sections of the paper. However, the general trends are clear. The decline in productivity from the early 1970s to the mid-1980s and then throughout the 1990s explained most of the poor performance of the economy over the last three decades. In particular, during the 1990s, the positive contribution of physical capital accumulation was insufficient to compensate for the decline in productivity.
On average, Jamaica experienced a decline in productivity of 0.5 percent a year from 1960 to 2000, compared with a 0.2 percent increase in Latin America and 0.9 percent increase for the world average. The TFP estimates computed by Bosworth and Collins (2003) address a number of limitations associated with growth decomposition exercises and are used in this paper. They allow for international comparisons, as summarized in Table 1. Output growth in Jamaica was below output in Latin America and in a sample of 84 countries by almost 2.5 percentage points during both the 1960–2000 and 1990–2000 periods. Human capital accumulation (proxied by education) was in line with Latin American and world averages. Physical capital was slightly lower than those averages. This contrasts with the large differential (as high as 2.5 percent during the 1990s) in TFP growth between Jamaica and the rest of the world.
5 The World Bank conducted a survey that showed that 42 percent of all business managers considered themselves likely to be murdered at the workplace.
- 8 -
III. THE MISMEASUREMENT STORY
Measurement problems are often cited to explain the measured underperformance of the Jamaican economy. They may also explain the “high investment-low growth” puzzle. On the one hand, actual GDP growth may be substantially higher than measured. There is evidence that the informal economy is large and has been growing faster than the rest of the economy. On the other hand, investment figures may not reflect fully changes in the capital stock. In particular, low capacity utilization, damages due to hurricanes, nonproductive investment may all point towards lower-than-measured capital stocks.
A. Is GDP Growth Underestimated?
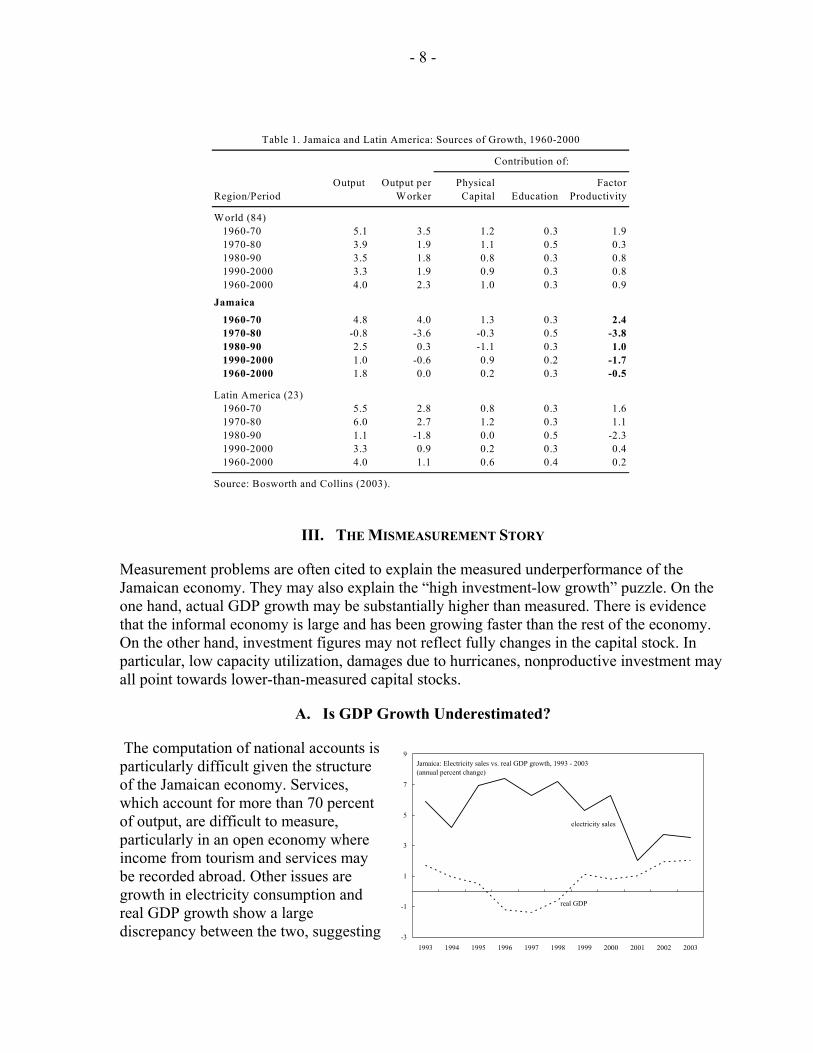
The computation of national accounts is particularly difficult given the structure of the Jamaican economy. Services, which account for more than 70 percent of output, are difficult to measure, particularly in an open economy where income from tourism and services may be recorded abroad. Other issues are growth in electricity consumption and real GDP growth show a large discrepancy between the two, suggesting
Jamaica: Electricity sales vs. real GDP growth, 1993 - 2003(annual percent change)
electricity sales
real GDP
-3
-1
1
3
5
7
9
1993 1994 1995 1996 1997 1998 1999 2000 2001 2002 2003
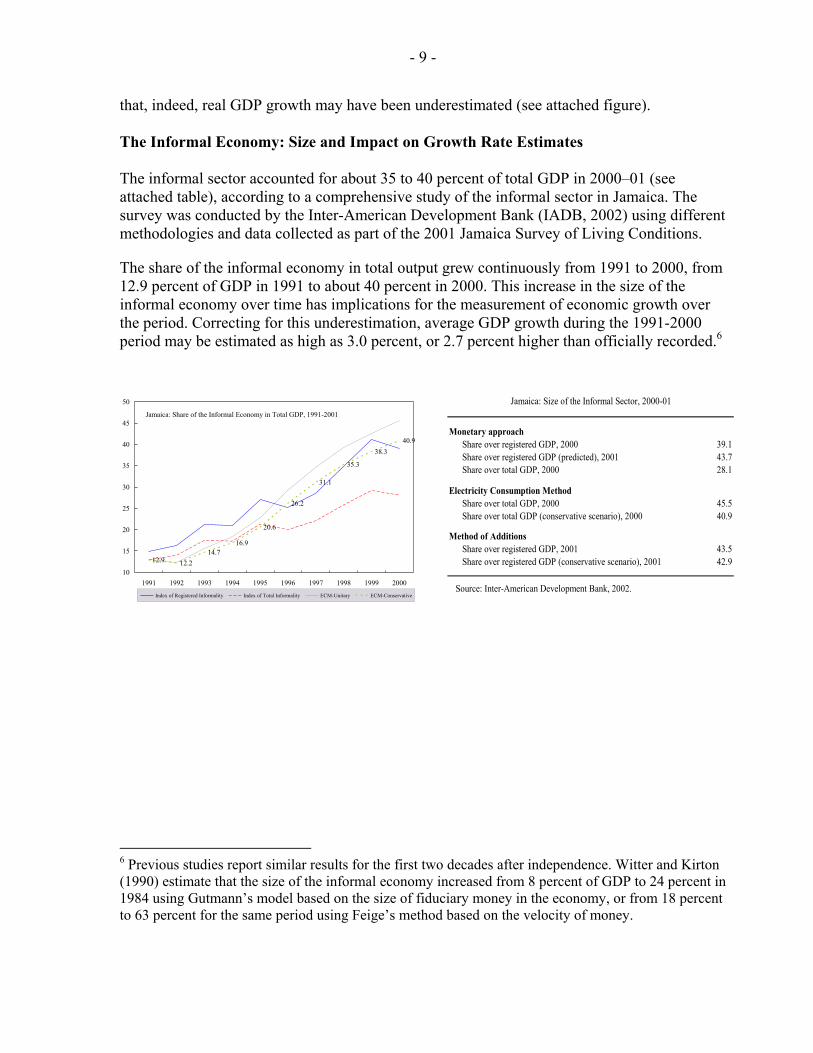
Output Output per Physical FactorRegion/Period Worker Capital Education Productivity
World (84)1960-70 5.1 3.5 1.2 0.3 1.91970-80 3.9 1.9 1.1 0.5 0.31980-90 3.5 1.8 0.8 0.3 0.81990-2000 3.3 1.9 0.9 0.3 0.81960-2000 4.0 2.3 1.0 0.3 0.9
Jamaica
1960-70 4.8 4.0 1.3 0.3 2.4 1970-80 -0.8 -3.6 -0.3 0.5 -3.8 1980-90 2.5 0.3 -1.1 0.3 1.0 1990-2000 1.0 -0.6 0.9 0.2 -1.7
1960-2000 1.8 0.0 0.2 0.3 -0.5
Latin America (23) 1960-70 5.5 2.8 0.8 0.3 1.6 1970-80 6.0 2.7 1.2 0.3 1.1 1980-90 1.1 -1.8 0.0 0.5 -2.3 1990-2000 3.3 0.9 0.2 0.3 0.4 1960-2000 4.0 1.1 0.6 0.4 0.2
Source: Bosworth and Collins (2003).
Contribution of:
Table 1. Jamaica and Latin America: Sources of Growth, 1960-2000
- 9 -
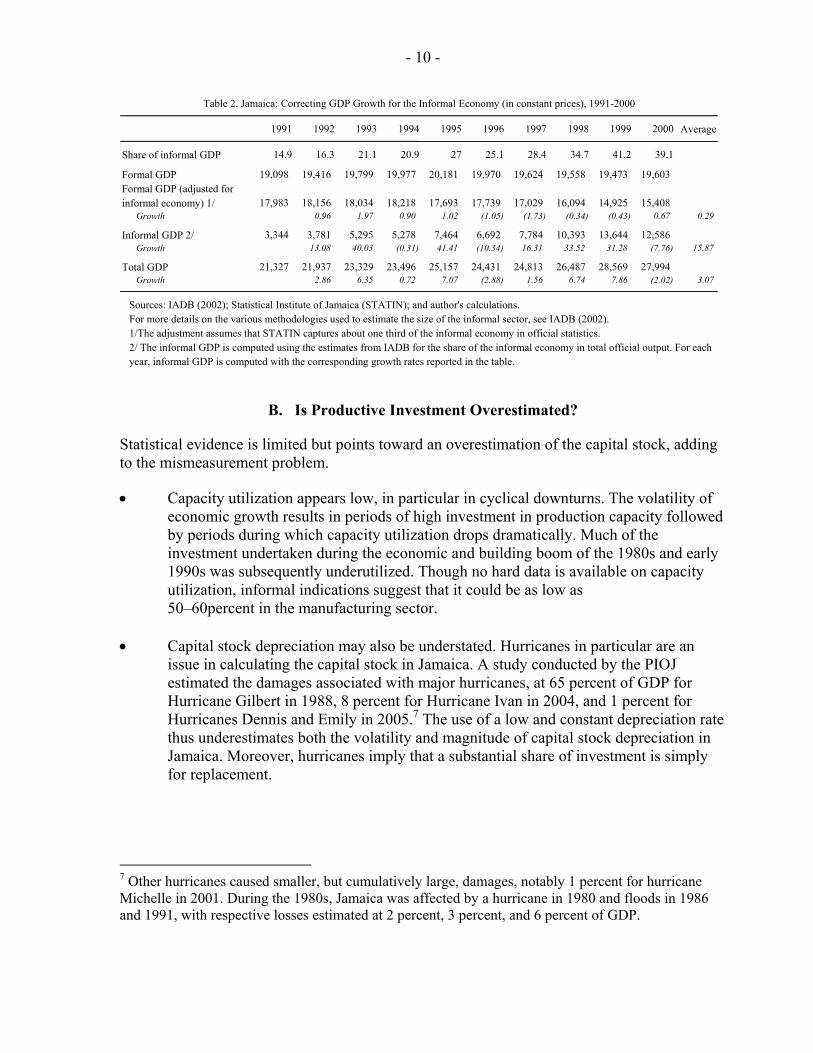
that, indeed, real GDP growth may have been underestimated (see attached figure). The Informal Economy: Size and Impact on Growth Rate Estimates The informal sector accounted for about 35 to 40 percent of total GDP in 2000–01 (see attached table), according to a comprehensive study of the informal sector in Jamaica. The survey was conducted by the Inter-American Development Bank (IADB, 2002) using different methodologies and data collected as part of the 2001 Jamaica Survey of Living Conditions.
The share of the informal economy in total output grew continuously from 1991 to 2000, from 12.9 percent of GDP in 1991 to about 40 percent in 2000. This increase in the size of the informal economy over time has implications for the measurement of economic growth over the period. Correcting for this underestimation, average GDP growth during the 1991-2000 period may be estimated as high as 3.0 percent, or 2.7 percent higher than officially recorded.6
Jamaica: Share of the Informal Economy in Total GDP, 1991-2001
12.9 12.214.7
16.9
20.6
26.2
31.1
35.3
38.340.9
10
15
20
25
30
35
40
45
50
1991 1992 1993 1994 1995 1996 1997 1998 1999 2000
Index of Registered Informality Index of Total Informality ECM-Unitary ECM-Conservative
6 Previous studies report similar results for the first two decades after independence. Witter and Kirton (1990) estimate that the size of the informal economy increased from 8 percent of GDP to 24 percent in 1984 using Gutmann’s model based on the size of fiduciary money in the economy, or from 18 percent to 63 percent for the same period using Feige’s method based on the velocity of money.
Monetary approachShare over registered GDP, 2000 39.1Share over registered GDP (predicted), 2001 43.7Share over total GDP, 2000 28.1
Electricity Consumption MethodShare over total GDP, 2000 45.5Share over total GDP (conservative scenario), 2000 40.9
Method of AdditionsShare over registered GDP, 2001 43.5Share over registered GDP (conservative scenario), 2001 42.9
Source: Inter-American Development Bank, 2002.
Jamaica: Size of the Informal Sector, 2000-01
- 10 -
B. Is Productive Investment Overestimated?
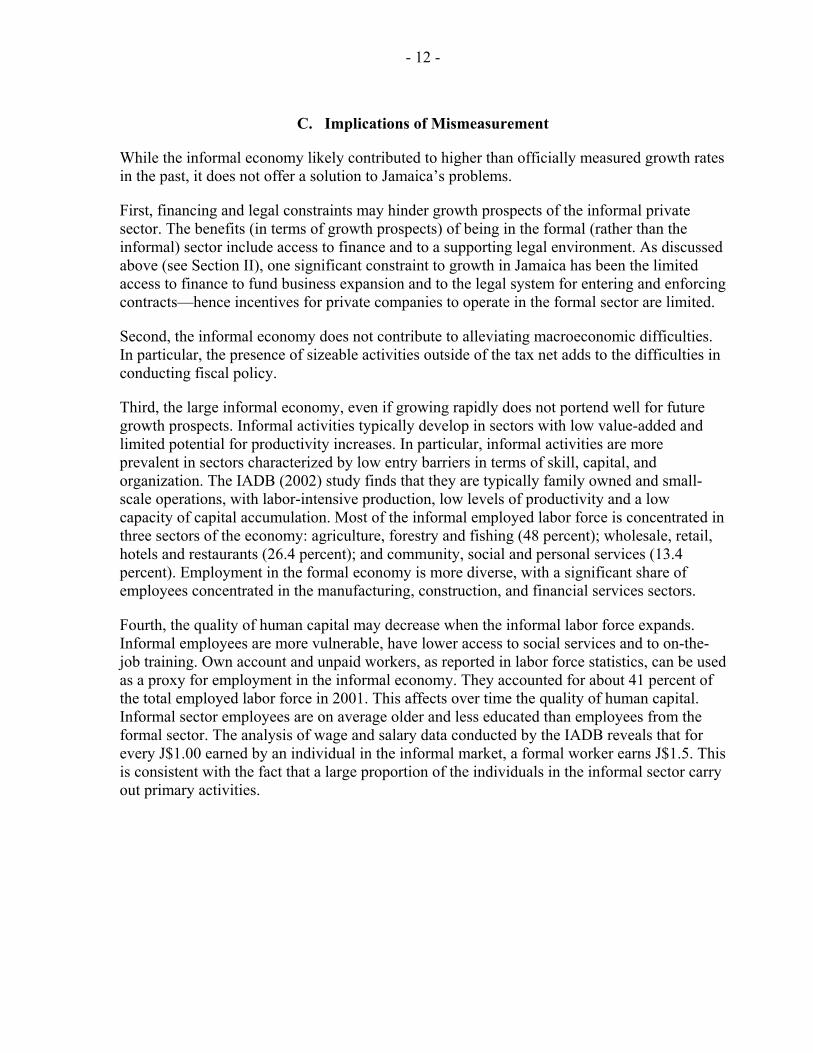
Statistical evidence is limited but points toward an overestimation of the capital stock, adding to the mismeasurement problem.
• Capacity utilization appears low, in particular in cyclical downturns. The volatility of economic growth results in periods of high investment in production capacity followed by periods during which capacity utilization drops dramatically. Much of the investment undertaken during the economic and building boom of the 1980s and early 1990s was subsequently underutilized. Though no hard data is available on capacity utilization, informal indications suggest that it could be as low as 50–60percent in the manufacturing sector.
• Capital stock depreciation may also be understated. Hurricanes in particular are an
issue in calculating the capital stock in Jamaica. A study conducted by the PIOJ estimated the damages associated with major hurricanes, at 65 percent of GDP for Hurricane Gilbert in 1988, 8 percent for Hurricane Ivan in 2004, and 1 percent for Hurricanes Dennis and Emily in 2005.7 The use of a low and constant depreciation rate thus underestimates both the volatility and magnitude of capital stock depreciation in Jamaica. Moreover, hurricanes imply that a substantial share of investment is simply for replacement.
7 Other hurricanes caused smaller, but cumulatively large, damages, notably 1 percent for hurricane Michelle in 2001. During the 1980s, Jamaica was affected by a hurricane in 1980 and floods in 1986 and 1991, with respective losses estimated at 2 percent, 3 percent, and 6 percent of GDP.
1991 1992 1993 1994 1995 1996 1997 1998 1999 2000 Average
Share of informal GDP 14.9 16.3 21.1 20.9 27 25.1 28.4 34.7 41.2 39.1
Formal GDP 19,098 19,416 19,799 19,977 20,181 19,970 19,624 19,558 19,473 19,603 Formal GDP (adjusted for informal economy) 1/ 17,983 18,156 18,034 18,218 17,693 17,739 17,029 16,094 14,925 15,408
Growth 0.96 1.97
0.90
1.02
(1.05) (1.73) (0.34) (0.43) 0.67
0.29
Informal GDP 2/ 3,344 3,781 5,295 5,278 7,464 6,692 7,784 10,393 13,644 12,586 Growth 13.08
40.03 (0.31)
41.41 (10.34)
16.31
33.52
31.28 (7.76) 15.87
Total GDP 21,327 21,937 23,329 23,496 25,157 24,431 24,813 26,487 28,569 27,994 Growth 2.86
6.35
0.72
7.07 (2.88)
1.56
6.74
7.86 (2.02) 3.07
Sources: IADB (2002); Statistical Institute of Jamaica (STATIN); and author's calculations.For more details on the various methodologies used to estimate the size of the informal sector, see IADB (2002). 1/The adjustment assumes that STATIN captures about one third of the informal economy in official statistics. 2/ The informal GDP is computed using the estimates from IADB for the share of the informal economy in total official output. For each year, informal GDP is computed with the corresponding growth rates reported in the table.
Table 2. Jamaica: Correcting GDP Growth for the Informal Economy (in constant prices), 1991-2000

- 11 -
• High investment may also reflect a substitution of capital for labor due to high real wages and labor rigidities, rather than an expansion in production capacities. In particular, imported machinery and equipment became relatively less expensive after the real exchange rate appreciation experienced in the 1990s.
• Finally, crime-prevention-related investment contributed weakly to increases in production capacities. While crime reduction may yield high long term returns, its immediate impact on economic growth is limited. A World Bank (2004) study estimated expenditure on security as high as 4.4 percent of GDP (3.1 percent incurred by the public sector, and 1.3 percent by the private sector).
The composition of fixed capital formation by type of capital goods, presented in Table 3, reinforces the mixed investment picture. First, building construction accounted for more than 40 percent of total investment in 2004, of which a large share is related to the boom in residential housing.8 The boom in residential construction results from high remittances, replacement investment after weather-related destruction, and the appetite for real assets in an uncertain macroeconomic environment. Second, industrial machinery and equipment, and large transport equipment experienced a steady decline from 1995 to 2004—corresponding to the steady decline of industrial production capacity. This contrasts with a steep increase in “other machinery and capital goods,” which possibly reflects the trend increase in the informal economy, investment in crime prevention, and replacement investment.
8 The breakdown of construction data between residential and nonresidential is not currently available.
1995 1996 1997 1998 1999 2000 2001 2002 2003 2004
Construction 49.7 42.6 41.3 45.2 49.7 43.8 40.3 36.3 43.4 44.0 Building construction 45.6 39.2 37.3 40.6 44.2 39.6 36.1 33.0 39.8 40.3 Other construction (inc. land improvement) 4.1 3.3 4.0 4.6 5.5 4.2 4.1 3.3 3.6 3.7
Transport equipment 12.4 14.2 22.3 16.3 13.8 13.5 15.4 15.4 12.0 7.1 Motor cars 2.1 2.4 2.6 2.7 2.3 2.1 1.8 1.8 1.5 1.4 Trucks and buses 7.1 7.5 7.0 9.0 7.8 8.0 8.4 7.8 6.5 2.4 Other transport equipment 3.2 4.3 12.8 4.6 3.7 3.3 5.1 5.8 4.0 3.3
Other machinery and equipment 37.9 43.2 36.4 38.4 36.5 42.7 44.4 48.3 44.5 48.8 Agricultural machinery and equipment 1.2 1.0 0.9 0.8 0.8 1.4 0.7 0.8 0.7 0.7 Industrial machinery and equipment 12.7 16.1 10.6 11.2 8.7 9.2 9.1 10.4 9.8 9.7 Other machinery and other capital goods 24.0 26.1 24.9 26.4 27.0 32.1 34.6 37.1 34.0 38.4
Total 100.0 100.0 100.0 100.0 100.0 100.0 100.0 100.0 100.0 100.0
Source: Statistical Institute of Jamaica.
Table 3. Jamaica: Composition of Fixed Capital Formation by Type of Capital Goods at Current Prices, 1994-2004
- 12 -
C. Implications of Mismeasurement
While the informal economy likely contributed to higher than officially measured growth rates in the past, it does not offer a solution to Jamaica’s problems.
First, financing and legal constraints may hinder growth prospects of the informal private sector. The benefits (in terms of growth prospects) of being in the formal (rather than the informal) sector include access to finance and to a supporting legal environment. As discussed above (see Section II), one significant constraint to growth in Jamaica has been the limited access to finance to fund business expansion and to the legal system for entering and enforcing contracts—hence incentives for private companies to operate in the formal sector are limited.
Second, the informal economy does not contribute to alleviating macroeconomic difficulties. In particular, the presence of sizeable activities outside of the tax net adds to the difficulties in conducting fiscal policy.
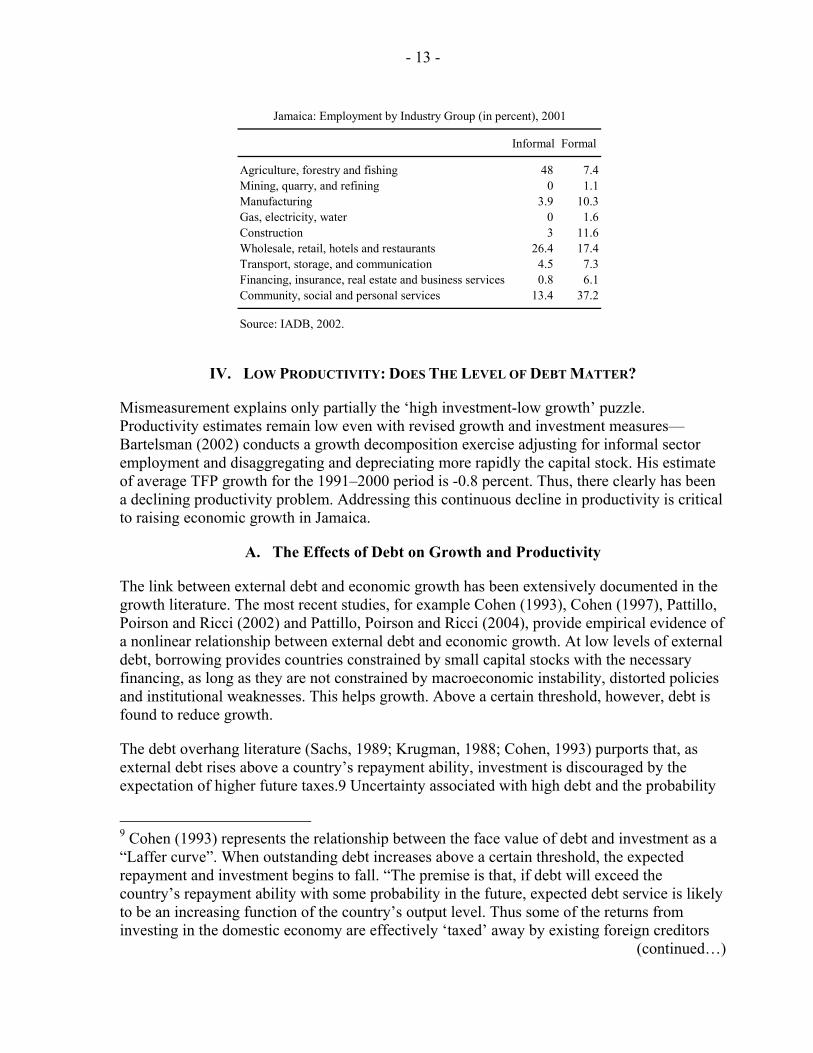
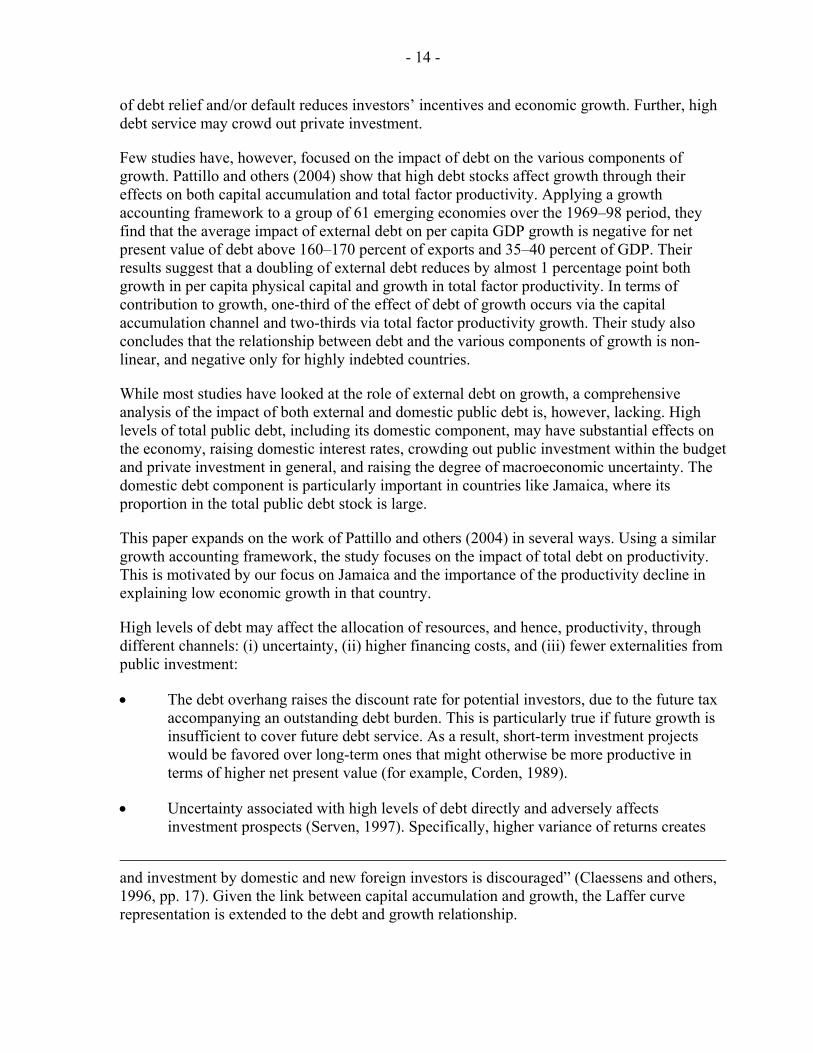
Third, the large informal economy, even if growing rapidly does not portend well for future growth prospects. Informal activities typically develop in sectors with low value-added and limited potential for productivity increases. In particular, informal activities are more prevalent in sectors characterized by low entry barriers in terms of skill, capital, and organization. The IADB (2002) study finds that they are typically family owned and small-scale operations, with labor-intensive production, low levels of productivity and a low capacity of capital accumulation. Most of the informal employed labor force is concentrated in three sectors of the economy: agriculture, forestry and fishing (48 percent); wholesale, retail, hotels and restaurants (26.4 percent); and community, social and personal services (13.4 percent). Employment in the formal economy is more diverse, with a significant share of employees concentrated in the manufacturing, construction, and financial services sectors.
Fourth, the quality of human capital may decrease when the informal labor force expands. Informal employees are more vulnerable, have lower access to social services and to on-the-job training. Own account and unpaid workers, as reported in labor force statistics, can be used as a proxy for employment in the informal economy. They accounted for about 41 percent of the total employed labor force in 2001. This affects over time the quality of human capital. Informal sector employees are on average older and less educated than employees from the formal sector. The analysis of wage and salary data conducted by the IADB reveals that for every J$1.00 earned by an individual in the informal market, a formal worker earns J$1.5. This is consistent with the fact that a large proportion of the individuals in the informal sector carry out primary activities.
- 13 -
IV. LOW PRODUCTIVITY: DOES THE LEVEL OF DEBT MATTER?
Mismeasurement explains only partially the ‘high investment-low growth’ puzzle. Productivity estimates remain low even with revised growth and investment measures—Bartelsman (2002) conducts a growth decomposition exercise adjusting for informal sector employment and disaggregating and depreciating more rapidly the capital stock. His estimate of average TFP growth for the 1991–2000 period is -0.8 percent. Thus, there clearly has been a declining productivity problem. Addressing this continuous decline in productivity is critical to raising economic growth in Jamaica.
A. The Effects of Debt on Growth and Productivity
The link between external debt and economic growth has been extensively documented in the growth literature. The most recent studies, for example Cohen (1993), Cohen (1997), Pattillo, Poirson and Ricci (2002) and Pattillo, Poirson and Ricci (2004), provide empirical evidence of a nonlinear relationship between external debt and economic growth. At low levels of external debt, borrowing provides countries constrained by small capital stocks with the necessary financing, as long as they are not constrained by macroeconomic instability, distorted policies and institutional weaknesses. This helps growth. Above a certain threshold, however, debt is found to reduce growth.
The debt overhang literature (Sachs, 1989; Krugman, 1988; Cohen, 1993) purports that, as external debt rises above a country’s repayment ability, investment is discouraged by the expectation of higher future taxes.9 Uncertainty associated with high debt and the probability
9 Cohen (1993) represents the relationship between the face value of debt and investment as a “Laffer curve”. When outstanding debt increases above a certain threshold, the expected repayment and investment begins to fall. “The premise is that, if debt will exceed the country’s repayment ability with some probability in the future, expected debt service is likely to be an increasing function of the country’s output level. Thus some of the returns from investing in the domestic economy are effectively ‘taxed’ away by existing foreign creditors
(continued…)
Informal Formal
Agriculture, forestry and fishing 48 7.4Mining, quarry, and refining 0 1.1Manufacturing 3.9 10.3Gas, electricity, water 0 1.6Construction 3 11.6Wholesale, retail, hotels and restaurants 26.4 17.4Transport, storage, and communication 4.5 7.3Financing, insurance, real estate and business services 0.8 6.1Community, social and personal services 13.4 37.2
Source: IADB, 2002.
Jamaica: Employment by Industry Group (in percent), 2001
- 14 -
of debt relief and/or default reduces investors’ incentives and economic growth. Further, high debt service may crowd out private investment.
Few studies have, however, focused on the impact of debt on the various components of growth. Pattillo and others (2004) show that high debt stocks affect growth through their effects on both capital accumulation and total factor productivity. Applying a growth accounting framework to a group of 61 emerging economies over the 1969–98 period, they find that the average impact of external debt on per capita GDP growth is negative for net present value of debt above 160–170 percent of exports and 35–40 percent of GDP. Their results suggest that a doubling of external debt reduces by almost 1 percentage point both growth in per capita physical capital and growth in total factor productivity. In terms of contribution to growth, one-third of the effect of debt of growth occurs via the capital accumulation channel and two-thirds via total factor productivity growth. Their study also concludes that the relationship between debt and the various components of growth is non-linear, and negative only for highly indebted countries.
While most studies have looked at the role of external debt on growth, a comprehensive analysis of the impact of both external and domestic public debt is, however, lacking. High levels of total public debt, including its domestic component, may have substantial effects on the economy, raising domestic interest rates, crowding out public investment within the budget and private investment in general, and raising the degree of macroeconomic uncertainty. The domestic debt component is particularly important in countries like Jamaica, where its proportion in the total public debt stock is large.
This paper expands on the work of Pattillo and others (2004) in several ways. Using a similar growth accounting framework, the study focuses on the impact of total debt on productivity. This is motivated by our focus on Jamaica and the importance of the productivity decline in explaining low economic growth in that country.
High levels of debt may affect the allocation of resources, and hence, productivity, through different channels: (i) uncertainty, (ii) higher financing costs, and (iii) fewer externalities from public investment:
• The debt overhang raises the discount rate for potential investors, due to the future tax accompanying an outstanding debt burden. This is particularly true if future growth is insufficient to cover future debt service. As a result, short-term investment projects would be favored over long-term ones that might otherwise be more productive in terms of higher net present value (for example, Corden, 1989).
• Uncertainty associated with high levels of debt directly and adversely affects investment prospects (Serven, 1997). Specifically, higher variance of returns creates
and investment by domestic and new foreign investors is discouraged” (Claessens and others, 1996, pp. 17). Given the link between capital accumulation and growth, the Laffer curve representation is extended to the debt and growth relationship.
- 15 -
incentives to postpone longer-term investments in favor of short-run projects, even if they are less efficient, in the hope that the uncertainty will be resolved before the irretrievable long-term investment has to be undertaken. Uncertainty affects any activity that involves incurring costs up-front for the sake of increased output in the future. Such activities include investment in human capital (education and health), and in technology acquisition, all with strong long-term effects on growth (Claessens and others, 1996). Misallocated resources and less efficient investment projects could thus contribute to slower productivity growth (Claessens, and others, 1993).
• The liquidity constraint, when binding, may also skew investments toward projects with fast returns. For example, even with no uncertainty, investments that would generate better pay-offs in the future may need to be postponed indefinitely in favor of ones that will yield lower returns but sooner. In other words, perfunctory maintenance, or small investments yielding fast returns may be preferred so that funds will be at hand for the repayment of loans.
• The high debt burden may also absorb a significant portion of public resources, and reduce the overall level of public capital expenditure. A fall in productivity of private investment may ensue because of lost externalities from certain types of public investment (such as physical infrastructure).
• Governments may be less willing to undertake difficult and costly policy reforms if it is perceived that the future benefit in terms of higher output will accrue partly to creditors (foreign and domestic). The poorer policy environment affects the efficiency of investment and productivity (Clements, Bhattacharya and Nguyen, 2003; Pattillo, Poirson and Ricci, 2004).
B. Cross-Country Evidence
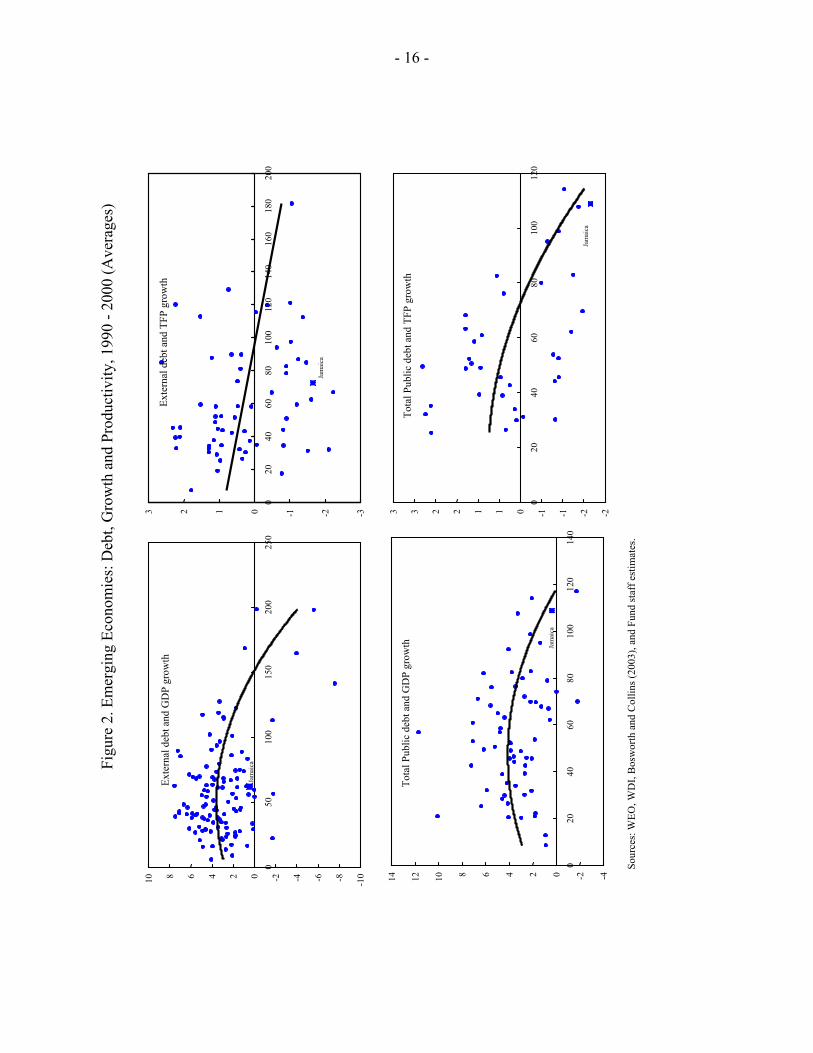
Total debt, rather than external debt alone, is the relevant variable for Jamaica. Jamaica appears to be an outlier when only the external debt-growth relationship is examined—its growth experience has underperformed significantly countries with similar levels of external debt. Including domestic debt in the analysis removes this apparent underperformance (see Figure 2, left-hand side bottom chart). Jamaica, with an average total public debt of 109 percent and an average real GDP growth rate of 0.4 percent, is shown close to the fitting line for the overall sample. An examination of the relationship between debt levels and productivity (the left-hand side bottom chart of Figure 1) tends to confirm this empirical result (see Figure 2, right-hand side charts). Again, the relevant variable for Jamaica is not the level of external debt but rather total public debt.
C. Data, Methodology, and Model Specification
The study expands on previous research by assessing the impact of public debt on growth and productivity. The model specification follows closely the one proposed by Pattillo (2004). The model uses a spline function to test for a non-linear relationship between debt and growth, and between productivity and growth. The external debt variables are replaced by the total public sector debt stock variable.
- 16 -
Figu
re 2
. Em
ergi
ng E
cono
mie
s: D
ebt,
Gro
wth
and
Pro
duct
ivity
, 199
0 - 2
000
(Ave
rage
s)
Sour
ces:
WEO
, WD
I, B
osw
orth
and
Col
lins (
2003
), an
d Fu
nd st
aff e
stim
ates
.
Exte
rnal
deb
t and
GD
P gr
owth
-10 -8-6-4-20 2 4 6 8 10 0
50
100
150
200
250
Jam
aica
Tota
l Pub
lic d
ebt a
nd G
DP
grow
th
-4
-2 0 2 4 6 8 10
12
14 0
20
4060
8010
012
014
0
Jam
aica
Exte
rnal
deb
t and
TFP
gro
wth
-3-2-10123
020
4060
8010
012
014
016
018
020
0
Jam
aica
Tota
l Pub
lic d
ebt a
nd T
FP g
row
th
-2-2-1-10112233
020
40
6080
100
120
Jam
aica

-17 -
We estimate the panel model with total factor productivity as the dependent variable and total public debt as the explanatory variable. We also control for the initial level of development (lagged income per capita), the investment rate, human capital, and the initial level of debt (all in logs); and fiscal balance.10
The relationship between debt and productivity is estimated using the spline function:
( )* ,itit it it it it ity X D D D Zα β γ χ ε= + + + − + (1)
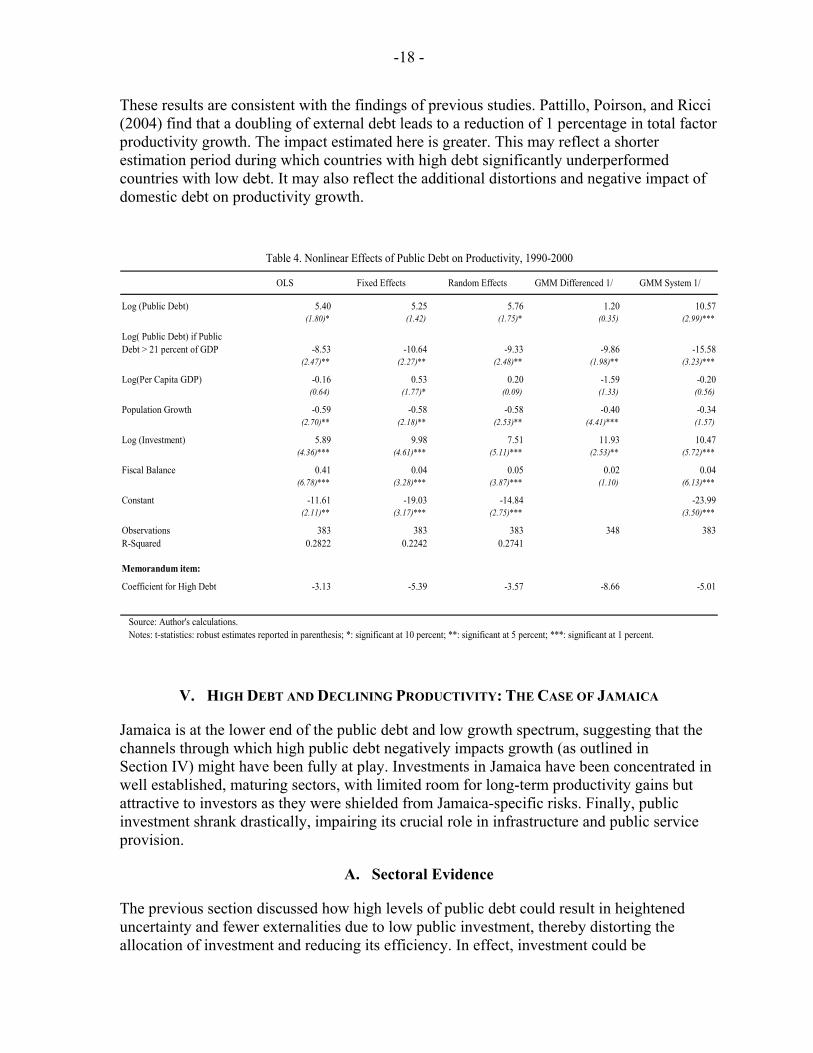
where ity is the log difference in TFP (or GDP), itX is the set of control variables, itD is the logarithm of debt variable, and *D is a pre-determined debt threshold. Z is a dummy variable that takes value 1 if debt is superior to *D and 0 otherwise, allowing to have a structural break in the impact of debt on the dependent variable at the level of the debt threshold. The public debt threshold is at 21 percent of GDP.11 It is determined by estimating the model with different values for *D and retaining the value that yields the highest R-squared. The results support a nonlinear relationship between productivity and total public debt. The coefficient on the public debt term is positive and generally significant, suggesting that low levels of debt are positively associated with productivity. The coefficient for the “above- threshold” debt is negative and significant at the 5 percent level with all estimation methods, confirming the presence of a structural break in the public debt coefficients.12 The total effect of high debt is significantly negative. A doubling of total public debt is associated with an average reduction in productivity growth of about 1.5 percentage point. This result is robust across estimation methodologies.
10 The initial set of control variables also included secondary school enrollment rates, openness (defined as exports plus imports over GDP), and exogenous shocks (as measured by changes in the terms of trade). However, these variables were not statistically significant and are not included in the results presented here.
11 Pattillo, Poirson, and Ricci (2004) identify a debt threshold of similar magnitude, at 18 percent of GDP for external debt only. The inclusion of domestic public debt raises the debt threshold, as should be expected.
12 To confirm the nonlinearity of the relationship between public debt and TFP growth, results on a linear model were estimated. Though the direction of the relationship is similar, the estimated coefficients for the debt variables are on average smaller than those estimated with the spline function. This would be expected in the presence of nonlinearity.
-18 -
These results are consistent with the findings of previous studies. Pattillo, Poirson, and Ricci (2004) find that a doubling of external debt leads to a reduction of 1 percentage in total factor productivity growth. The impact estimated here is greater. This may reflect a shorter estimation period during which countries with high debt significantly underperformed countries with low debt. It may also reflect the additional distortions and negative impact of domestic debt on productivity growth.
OLS Fixed Effects Random Effects GMM Differenced 1/ GMM System 1/
Log (Public Debt) 5.40 5.25 5.76 1.20 10.57(1.80)* (1.42) (1.75)* (0.35) (2.99)***
Log( Public Debt) if Public Debt > 21 percent of GDP -8.53 -10.64 -9.33 -9.86 -15.58
(2.47)** (2.27)** (2.48)** (1.98)** (3.23)***
Log(Per Capita GDP) -0.16 0.53 0.20 -1.59 -0.20(0.64) (1.77)* (0.09) (1.33) (0.56)
Population Growth -0.59 -0.58 -0.58 -0.40 -0.34(2.70)** (2.18)** (2.53)** (4.41)*** (1.57)
Log (Investment) 5.89 9.98 7.51 11.93 10.47(4.36)*** (4.61)*** (5.11)*** (2.53)** (5.72)***
Fiscal Balance 0.41 0.04 0.05 0.02 0.04(6.78)*** (3.28)*** (3.87)*** (1.10) (6.13)***
Constant -11.61 -19.03 -14.84 -23.99(2.11)** (3.17)*** (2.75)*** (3.50)***
Observations 383 383 383 348 383R-Squared 0.2822 0.2242 0.2741
Memorandum item:
Coefficient for High Debt -3.13 -5.39 -3.57 -8.66 -5.01
Source: Author's calculations.Notes: t-statistics: robust estimates reported in parenthesis; *: significant at 10 percent; **: significant at 5 percent; ***: significant at 1 percent.
Table 4. Nonlinear Effects of Public Debt on Productivity, 1990-2000
V. HIGH DEBT AND DECLINING PRODUCTIVITY: THE CASE OF JAMAICA
Jamaica is at the lower end of the public debt and low growth spectrum, suggesting that the channels through which high public debt negatively impacts growth (as outlined in Section IV) might have been fully at play. Investments in Jamaica have been concentrated in well established, maturing sectors, with limited room for long-term productivity gains but attractive to investors as they were shielded from Jamaica-specific risks. Finally, public investment shrank drastically, impairing its crucial role in infrastructure and public service provision.
A. Sectoral Evidence
The previous section discussed how high levels of public debt could result in heightened uncertainty and fewer externalities due to low public investment, thereby distorting the allocation of investment and reducing its efficiency. In effect, investment could be
-19 -
concentrated in sectors which provide safe and rapid returns, to the expense of diversification and/or development of new, higher-yielding economic sectors with greater risk and longer-term returns. Such an economic environment would thus result in increased and continued concentration of economic activities and investment in a few maturing sectors—where productivity gains are limited and growth low.
Tentative sectoral evidence is presented to advance the hypotheses regarding the channels through which high debt is likely to have affected both investment and productivity. The exercise is partial for two main reasons. First, it is difficult to isolate the specific impact of public debt among a wider range of factors that affect economic development. For example, the concentration of economic activity in a few sectors may result from explicit policy choices; it could also be the consequence of lack of diversification in a small island economy. Second, sectoral data is very sparse. At best, the analysis may provide general trends and broad stylized facts. Improvements in data collection, in particular a breakdown of investment and productivity by sector, are needed for a better understanding of the mechanisms at play.
Nevertheless, available evidence suggests that economic growth has been characterized by the continued concentration of the formal economy in a limited number of sectors—the “enclave” tourism and mining industries—and the fast growth of the informal sector. The manufacturing sector declined dramatically, notably due to the exit of some textile and tire manufacturing companies. Growth was positive in a limited number of sectors including nontradable sectors such as communications and power, and location- and natural-resource based activities, such as transport, mining, and tourism. The latter two sectors centered on (tourism and bauxite) are shielded to a large extent from Jamaica-specific risks, given that they are natural resource-based and have earnings in foreign exchange.
Sectoral data for the 1990s confirm that economic diversification diminished in the 1990s. The share of services in total output increased substantially, led by tourism, while the manufacturing sector shrank.13 This trend is consistent over a set of economic indicators:
• The share of tourism in total GDP increased substantially during the 1990s. While the share of manufacturing declined from 21 percent of GDP in 1990 to 16 percent in 2000, the share of tourism (reflecting part of a broader increase in services) increased from 2.1 percent in 1990 to 9.2 percent in 2000. Construction declined slightly and the share of other sectors remained broadly constant.
13 The departure of the textile and tire manufacturing industries at the end of the 1990s were the most salient examples of the manufacturing decline.
- 20 -
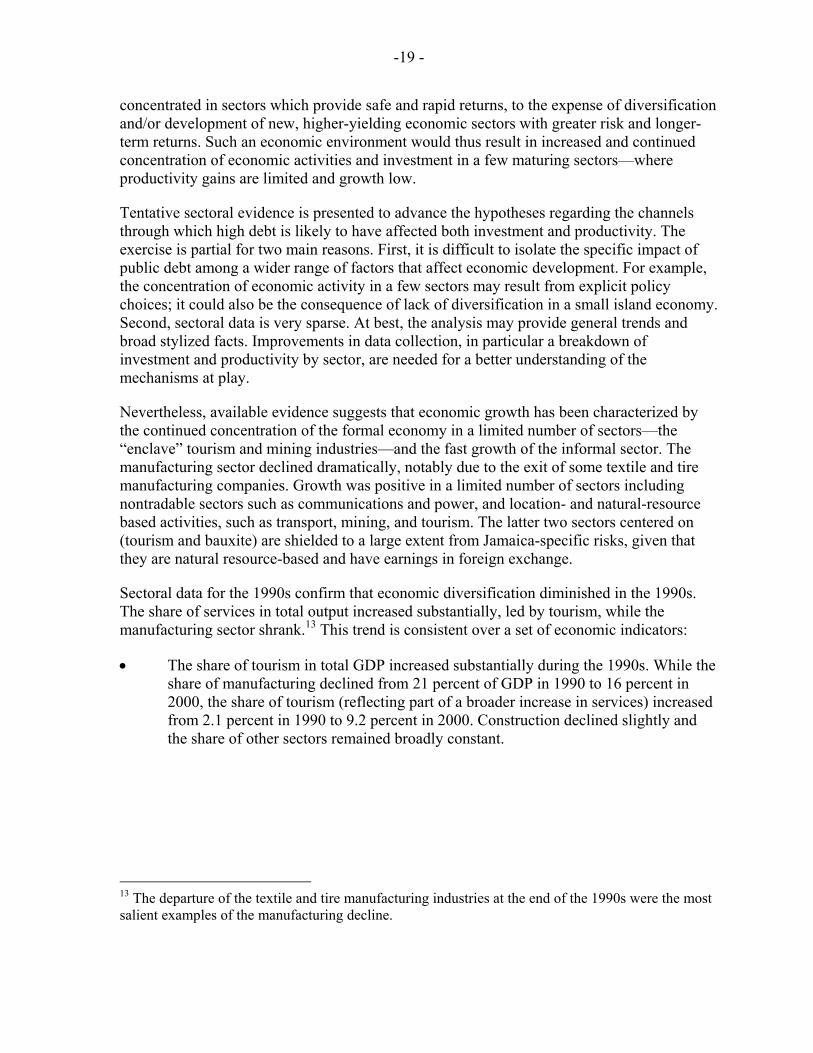
• Contributions to growth reflect the same trends, with most of the growth during the 1990s coming from the tourism and mining sectors. The mining and tourism sectors, and more broadly the service industry, contributed positively, albeit weakly, to economic growth. Their average contributions during the 1990s were 0.7 and 2.6 percentage points of GDP, respectively. The contributions of the manufacturing and construction sectors were large and negative, at -2.2 and -1.4 percentage points on average, respectively, over the same period.
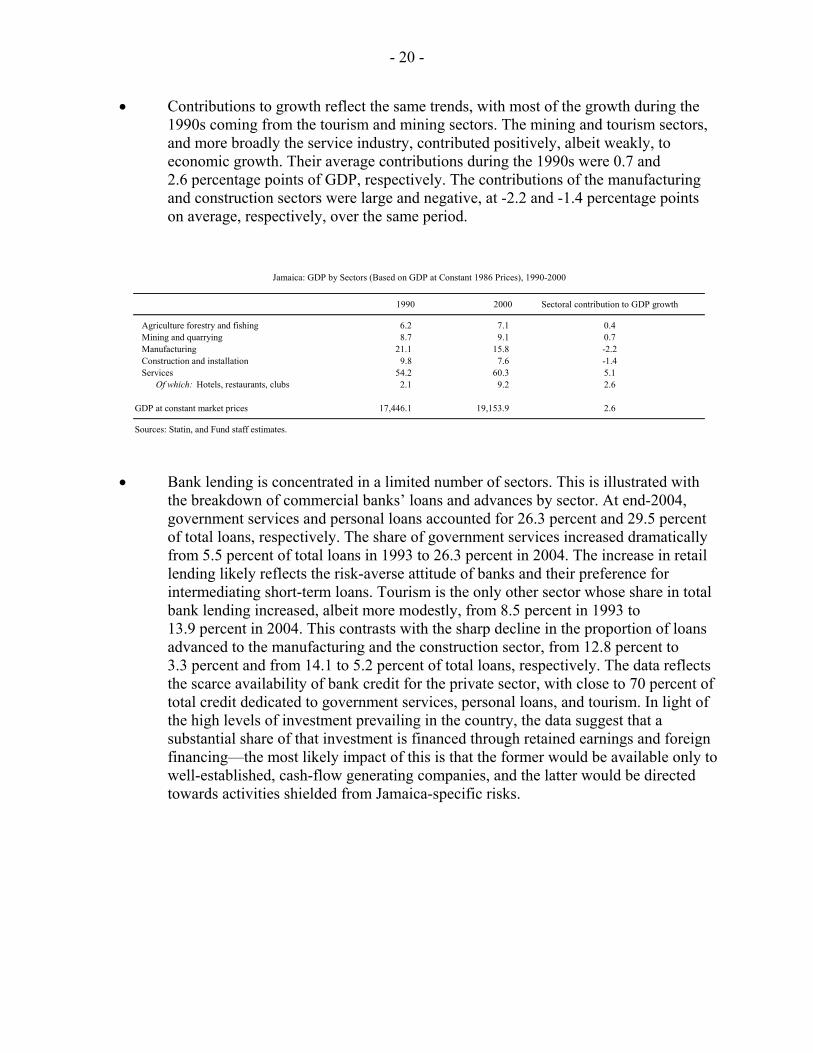
• Bank lending is concentrated in a limited number of sectors. This is illustrated with the breakdown of commercial banks’ loans and advances by sector. At end-2004, government services and personal loans accounted for 26.3 percent and 29.5 percent of total loans, respectively. The share of government services increased dramatically from 5.5 percent of total loans in 1993 to 26.3 percent in 2004. The increase in retail lending likely reflects the risk-averse attitude of banks and their preference for intermediating short-term loans. Tourism is the only other sector whose share in total bank lending increased, albeit more modestly, from 8.5 percent in 1993 to 13.9 percent in 2004. This contrasts with the sharp decline in the proportion of loans advanced to the manufacturing and the construction sector, from 12.8 percent to 3.3 percent and from 14.1 to 5.2 percent of total loans, respectively. The data reflects the scarce availability of bank credit for the private sector, with close to 70 percent of total credit dedicated to government services, personal loans, and tourism. In light of the high levels of investment prevailing in the country, the data suggest that a substantial share of that investment is financed through retained earnings and foreign financing—the most likely impact of this is that the former would be available only to well-established, cash-flow generating companies, and the latter would be directed towards activities shielded from Jamaica-specific risks.
1990 2000 Sectoral contribution to GDP growth
Agriculture forestry and fishing 6.2 7.1 0.4 Mining and quarrying 8.7 9.1 0.7 Manufacturing 21.1 15.8 -2.2 Construction and installation 9.8 7.6 -1.4 Services 54.2 60.3 5.1 Of which: Hotels, restaurants, clubs 2.1 9.2 2.6
GDP at constant market prices 17,446.1 19,153.9 2.6
Sources: Statin, and Fund staff estimates.
Jamaica: GDP by Sectors (Based on GDP at Constant 1986 Prices), 1990-2000
- 21 -
1993 1995 2000 2004
Agriculture 6.0 4.1 3.8 1.1Mining 0.5 0.8 0.2 0.2Manufacturing 12.8 13.3 7.5 3.3Construction & Land Development 14.1 12.2 5.0 5.2Tourism 8.5 8.4 11.7 13.9Government Services 5.5 7.3 16.5 26.3Personal 17.2 19.4 26.9 29.5Other 35.5 34.6 28.3 20.6
Source: Bank of Jamaica.
Jamaica: Commercial Banks - Analysis of loans and advances, 1993 - 2004(in percent of total loans)
B. Low Public Investment and Low Productivity
In addition to the channels reviewed above, high levels of public debt affect productivity and economic growth by constraining public investment. The experience of Jamaica is consistent with cross-country evidence of a strong association between public debt levels and public investment, and between public investment and economic growth.
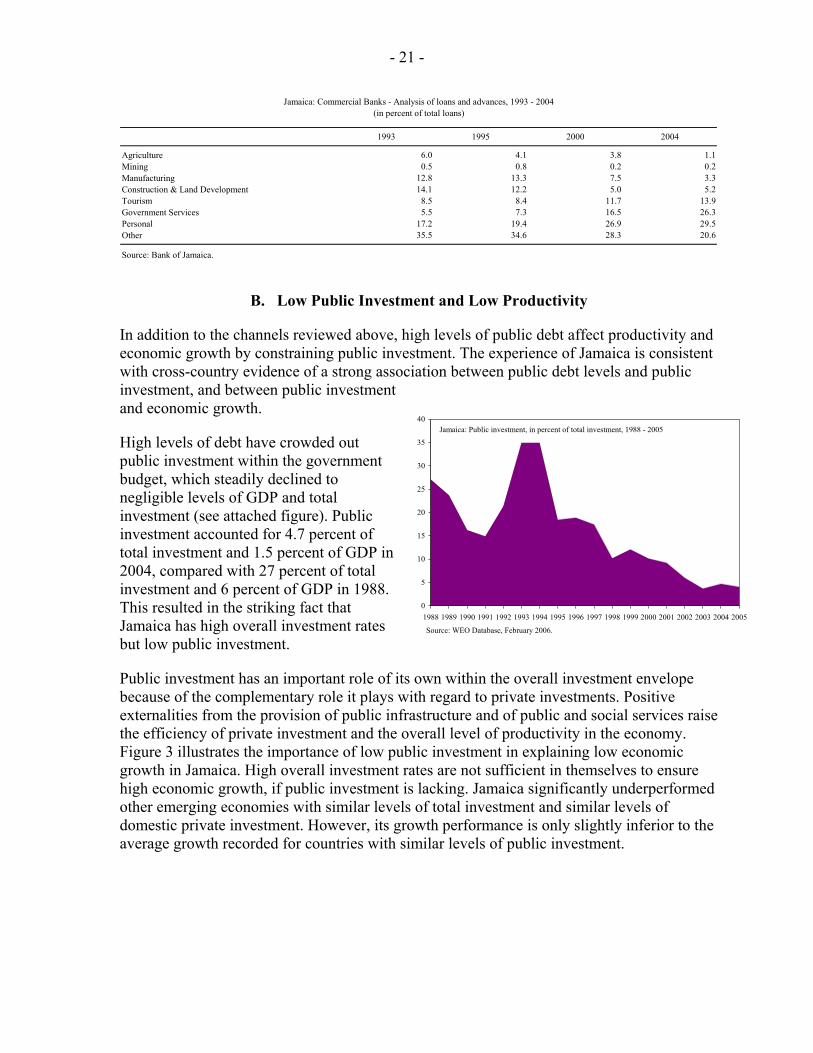
High levels of debt have crowded out public investment within the government budget, which steadily declined to negligible levels of GDP and total investment (see attached figure). Public investment accounted for 4.7 percent of total investment and 1.5 percent of GDP in 2004, compared with 27 percent of total investment and 6 percent of GDP in 1988. This resulted in the striking fact that Jamaica has high overall investment rates but low public investment.
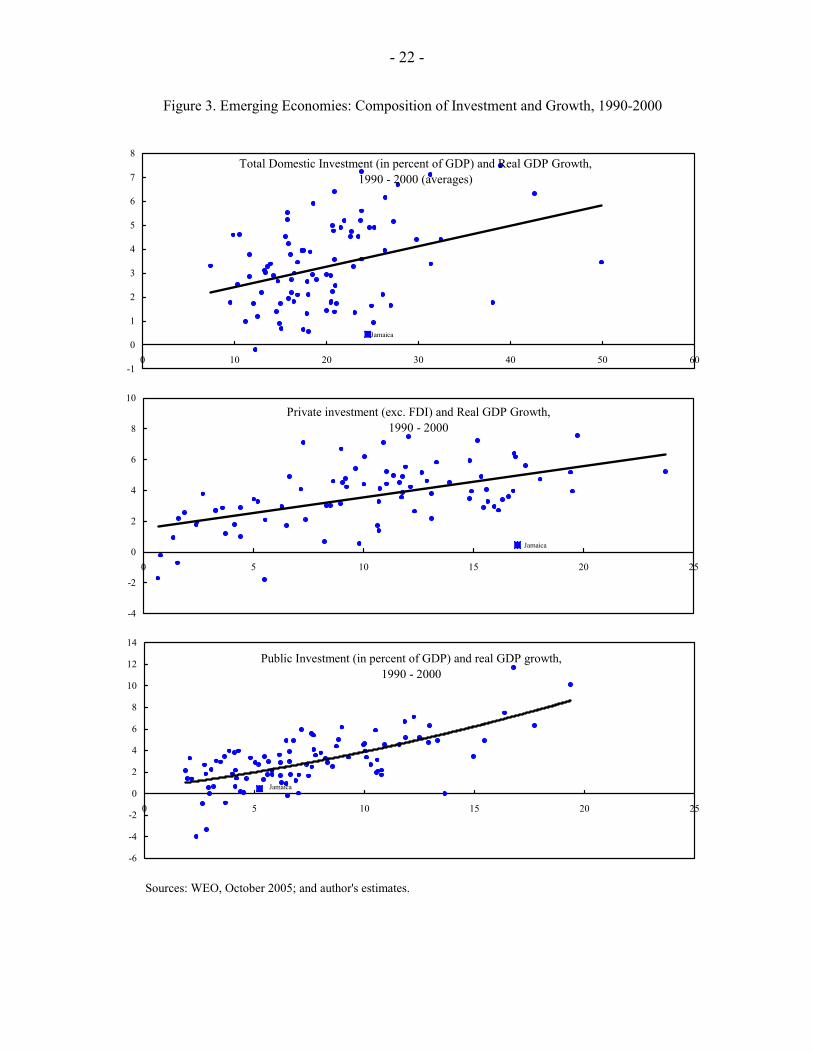
Public investment has an important role of its own within the overall investment envelope because of the complementary role it plays with regard to private investments. Positive externalities from the provision of public infrastructure and of public and social services raise the efficiency of private investment and the overall level of productivity in the economy. Figure 3 illustrates the importance of low public investment in explaining low economic growth in Jamaica. High overall investment rates are not sufficient in themselves to ensure high economic growth, if public investment is lacking. Jamaica significantly underperformed other emerging economies with similar levels of total investment and similar levels of domestic private investment. However, its growth performance is only slightly inferior to the average growth recorded for countries with similar levels of public investment.
Jamaica: Public investment, in percent of total investment, 1988 - 2005
0
5
10
15
20
25
30
35
40
1988 1989 1990 1991 1992 1993 1994 1995 1996 1997 1998 1999 2000 2001 2002 2003 2004 2005
Source: WEO Database, February 2006.
- 22 -
Figure 3. Emerging Economies: Composition of Investment and Growth, 1990-2000
Sources: WEO, October 2005; and author's estimates.
Total Domestic Investment (in percent of GDP) and Real GDP Growth, 1990 - 2000 (averages)
-1
0
1
2
3
4
5
6
7
8
0 10 20 30 40 50 60
Jamaica
Private investment (exc. FDI) and Real GDP Growth, 1990 - 2000
-4
-2
0
2
4
6
8
10
0 5 10 15 20 25
Jamaica
Public Investment (in percent of GDP) and real GDP growth, 1990 - 2000
-6
-4
-2
0
2
4
6
8
10
12
14
0 5 10 15 20 25
Jamaica

- 23 -
VI. TAKING STOCK: SUMMARY AND CONCLUSIONS
Jamaica’s ‘high investment-low growth’ puzzle is, in part, due to measurement problems although it should be noted that similar problems are likely to exist in other countries. There is some evidence that official Jamaican GDP estimates may understate actual economic growth. In particular, the share of the informal economy in total output is likely to have grown substantially over the 1990s. Investment figures may also overestimate productive investments in Jamaica. In particular, capital depreciation may be understated—for example, hurricane-related damage may not be fully accounted for. Further, there is some indication that considerable investment goes to nonproductive activities, such as crime prevention and residential housing. At the same time, it is important to note that similar problems with the data are not entirely uncommon. Hence the implications for assessing Jamaica’s growth experience in the international context are not clear.
Regardless of the informal sector, productivity remains a key constraint to medium-term growth prospects in Jamaica and high levels of public debt appear to be important in this regard. Using panel data analysis for a sample of 35 emerging economies, low productivity is shown to be robustly associated with high levels of public debt. In particular, a doubling in total public debt is estimated to result in a 1.5 percentage point reduction in productivity growth. High levels of public debt distort the allocation of capital, by increasing uncertainty and leading to fewer externalities from public investment.
Economic growth in Jamaica has been characterized by the continued concentration of the formal economy in a limited number of sectors, which is consistent with a pattern of debt affecting productivity and growth. The growing “enclave” tourism and mining industries are shielded from many Jamaica-specific risks and rewards. Furthermore, activity appears to be growing quickly in the informal sector, which is also out of reach of the state and hence somewhat immune to developments in the formal sector. These trends carry substantial risks for the sustainable development of the country, in particular: (i) lack of diversification, which increases the vulnerability of the economy to exogenous shocks; (ii) the further growth of “economic enclaves” with little spillovers and externalities to the rest of the economy; and (iii) the growth of sectors characterized by low productivity, notably the informal economy.
Declining and low levels of productivity in the context of high overall investment levels suggest that the challenge for Jamaica is to increase the productivity of investment. Addressing the debt burden and ensuring macroeconomic stability are paramount to raising growth in the country. Moreover, a good investment climate is needed to channel investments into productive sectors and nontraditional areas. The provision of an adequate physical and social infrastructure network by the state complements a sound regulatory framework to attract, retain, and increase the efficiency and productivity of private investment.
- 24 -
REFERENCES
Arellano, M., and S. Bond, 1991, “Some Tests of Specification for Panel Data: Monte Carlo Evidence and An Application to Employment Equations,” Review of Economic Studies, Vol. 58, No. 2, pp. 277–97.
Bartelsman, E., 2002, “Productivity Growth in Jamaica 1991–2000, An Exploratory
Analysis,” (unpublished background paper; Washington: World Bank). Bosworth, B., and S. Collins, 2003, “The Empirics of Growth: An Update” (unpublished;
Washington: Brookings Institution). Clements, B., R. Bhattacharya, and T. Quoc Nguyen, 2003, “External Debt, Public
Investment, and Growth in Low-Income Countries,” IMF Working Paper 03/249 (Washington: International Monetary Fund).
Cohen, D., 1993, “Low Investment and Large LDC Debt in the 1980s,” American Economic
Review, Vol. 52 (February), pp. 437–49. ———, 1997, “Growth and External Debt: A New Perspective on the African and Latin
American Tragedies,” Centre for Economic Policy Research Discussion Paper, No. 1753, pp. 1–17.
Corden, W. M., 1989, “Debt Relief and Adjustment Incentives,” in Analytical Issues in Debt,
ed. by Frenkel, J., M. Dooley and P. Wickham (Washington: International Monetary Fund).
Inter-American Development Bank/Grade, 2002, “Informal Sector Study for Jamaica,”
(unpublished; Washington). Fosu, A., 1999, “The External Debt Burden and Economic Growth in the 1980s: Evidence
from Sub-Saharan Africa,” Canadian Journal of Development Studies, Vol. XX, No. 2, pp. 307–18.
Krugman, P., 1988, “Financing versus Forgiving a Debt Overhang,” Journal of Development
Economics, Vol. 29, pp. 253–68. Loayza, N., C. Calderon, and P. Fajnzylber, 2005, “Economic Growth in Latin America and
the Caribbean: Stylized Facts, Explanations, and Forecasts” (Washington: World Bank).
Pattillo, C., Poirson, H., and L. Ricci, 2002, “External Debt and Growth,” IMF Working
Paper 02/69 (Washington: International Monetary Fund). ———, 2004, “What Are the Channels Through which External Debt Affects Growth,” IMF
Working Paper 04/15, (Washington: International Monetary Fund).
- 25 -
Planning Institute of Jamaica, 2004, “Macro-Socio-Economic and Environmental Assessment of the Damage Done by Hurricane Ivan” (unpublished; Kingston).
———, 2005, “Assessment of the Socio-Economic and Environmental Assessment of
Hurricanes Dennis and Emily on Jamaica” (unpublished; Kingston). Sachs, J., 1989, “The Debt Overhang of Developing Countries,” in Debt Stabilization and
Development: Essays in Memory of Carlos Diaz Alejandro, ed. by A. G. Calvo and others (Basil Blackwell: Oxford), pp. 80–102.
Servén, L., 1997, “Uncertainty, Unstability, and Irreversible Investment: Theory, Evidence,
and Lessons from Africa,” World Bank Policy Research Working Paper, No. 1722. World Bank, 2003, “Jamaica: The Road to Sustained Growth,” Country Economic
Memorandum (Washington: World Bank).