public debt and economic growth in advanced … · checherita-westphal, hughes hallett, and rother...
TRANSCRIPT

© Swiss Society of Economics and Statistics 2013, Vol. 149 (2) 175–204
a This paper was prepared for a special issue of the Swiss Journal of Economics and Statistics. We would like to thank the editor, Professor Klaus Neusser, for inviting us to write the paper and participants at the conference “The Swiss Debt Brake – Ten Years On” at the Gerzensee Study Center for helpful comments and suggestions. The usual caveats apply.
b Ugo Panizza, The Graduate Institute, Geneva. E-mail: [email protected] Andrea F. Presbitero, Università Politecnica delle Marche (Italy) and MoFiR. E-mail:
[email protected] For another recent survey with a different slant, see Reinhart, Reinhart, and Rogoff (2012).
Public Debt and Economic Growth in Advanced Economies: A Surveya
Ugo Panizzab and Andrea F. Presbiteroc
JEL-Classification:: F33, F34, F35, O11Keywords: Government Debt, Growth, OECD countries
There is no simple relationship between debt and growth […] There are many factors that matter for a country’s growth and debt performance. Moreover, there is no single threshold for debt ratios that can delineate the “bad” from the “good”.
(International Monetary Fund, 2012, p. 9)
1. Introduction
This paper surveys the recent literature on the links between public debt and eco-nomic growth in advanced economies.1 The paper also discusses several practical and conceptual issues related to the definition and measurement of public debt.We start with an overview of various theoretical models that link debt to eco-nomic growth. The literature shows that debt has a negative impact on growth through a standard crowding out effect, but back-of-the envelope calculations indicate that this effect is quantitatively small. While uncertainty and policy credibility may amplify the negative effect of crowding out, hysteresis can lead to a situation in which expansionary fiscal policies have positive effect on long-run growth. It is also hard to find full-fledged theoretical models that predict non-monotonicity or threshold effects in the relationship between public debt and economic growth.
176 Panizza /Presbitero
Swiss Journal of Economics and Statistics, 2013, Vol. 149 (2)
2 See the IMF website at: http://www.imf.org/external/pubs/ft/survey/so/2013/NEW010813A.htm.
When we survey the empirical literature, we start with empirical models that analyze the bivariate relationship between debt and growth and show that smooth threshold regression methods yield non-linearities which are much more complex than those found in models that use exogenous thresholds. Moreover, the pres-ence and level of debt thresholds do not appear to be robust to small changes in country coverage and data frequency. Next, we show that the presence of a nega-tive correlation between debt and economic growth is robust to controlling for a host of covariates (including country and time fixed effects) which are correlated with both debt and growth. However, causality is hard to establish and, in our reading of the empirical evidence, there is no paper that can make a strong case for a causal relationship going from public debt to economic growth. Finally, we look at the existence of thresholds in a multivariate setting and, again, we find that that the evidence for such thresholds is weaker than previously thought.
Our reading of the empirical literature is thus in line with the IMF statement in the opening quotation, which, instead, seems to contradict the IMF summary of a 2013 AEA session on sovereign debt crisis, according to which “Policymak-ers in advanced economies will have to resolve the problem of high government debt or they may face low growth prospects”.2
Our finding that there is no evidence of a causal negative relationship going from debt to economic growth does not mean that debt does not matter, and that countries should run profligate fiscal policies. First, saying that there is no evidence that debt is bad for growth is different from saying that there is evi-dence that debt does not matter for growth. Second, we think that the relation-ship between debt and growth is heterogeneous across countries and time periods and that future research should focus on these sources of heterogeneity.
2. Public Debt and Economic Growth: The Theory
We start with a short survey of what economic theory tells us about the rela-tionship between public debt and economic growth. Throughout our discus-sion, we will assume that government expenditure in goods and services is fixed and we examine what happens if the government decides to temporarily reduce taxes and finance its expenditures by issuing debt. We will also assume that Ricardian Equivalence does not hold and that public debt can affect real
Public Debt and Economic Growth in Advanced Economies 177
Swiss Journal of Economics and Statistics, 2013, Vol. 149 (2)
3 Ricardian Equivalence would require the following assumptions: lump-sum taxes; constant population composed of forward looking individuals characterized by intergeneration altru-ism; and perfect capital markets (Barro, 1974).
4 Elmendorf and Mankiw’s (1999) back-of-the-envelope calculations are based on US data, the results are likely to be similar if we were to concentrate on other OECD countries.
variables.3 According to the “conventional view of public debt” (Elmendorf and Mankiw, 1999), in the short-run output is demand-determined and fiscal deficits (or higher public debts) have a positive effect on disposable income, aggregate demand, and overall output. This positive short-run effect of budget deficits (and higher debt) is likely to be large when the output is far from capac-ity. According to Elmendorf and Mankiw (1999), things are different in the long-run. If Ricardian Equivalence does not hold, the decrease in public sav-ings brought about by a higher budget deficit will not be fully compensated by an increase in private savings. As a consequence, national savings will decrease, resulting in lower total investment, either at home or abroad. Lower investment at home will have a negative effect on GDP, as it will lead to a smaller capital stock, higher interest rates, lower labor productivity and wages. Lower foreign investment (or higher foreign inflows), instead, will have a negative effect on for-eign capital income and will thus lower the country’s future GNP. This negative effect of an increase in public debt on future GDP (or GNP) can be amplified by the presence of distortionary taxes.
According to Elmendorf and Mankiw’s (1999) back-of-the-envelope cal-culations, each additional dollar of government debt reduces steady-state gross output by about 10 cents (9 cents are due to the lower capital stock and one cent to future tax distortion).4 If we assume that annual real GDP growth is 3 per-cent and convergence speed is 2 percent, we find that this change in steady-state output has a fairly small growth effect. In particular, our calculations indicate that increasing debt by 100 per cent of GDP would reduce annual GDP growth by approximately 20 basis points in the first twenty years.
The negative effect of public debt could be much larger if high public debt increases uncertainty or leads to expectations of future confiscation, possibly through inflation and financial repression (see Cochrane 2011a, 2011b for a discussion of these issues). In this case, higher debt could have a negative effect even in the short-run.
The conventional split between the short and long-run effects of debt disre-gards the fact that protracted recessions may reduce future potential output (as they increase the number of discouraged workers, with the associated loss of skills, and have a negative effect on organizational capital and investment on new

178 Panizza /Presbitero
Swiss Journal of Economics and Statistics, 2013, Vol. 149 (2)
5 For a criticism to DeLong and Summers’ (2012) views, see Ramey (2012).6 Note that here, and below, we deviate from our initial assumption that government expendi-
ture is fixed and we will relate debt to the financing of public investment.
activities). In this case, running fiscal deficits (and increasing debt) may have a positive effect on output in both the short and long-run. In fact, DeLong and Summers (2012) argue that, in a low interest rate environment, expansionary fiscal policy is likely to be self-financing.5 There is, in fact, evidence that reces-sions have a permanent effect on the level of future GDP (Cerra and Saxena, 2008). DeLong and Summers (2012) mention that the US Congressional Budget Office recognizes this fact and reduces its estimates of future potential output when output falls below potential for at least one year.
A large number of empirical papers find that the relationship between debt and growth is non-linear and characterized by the presence of a threshold above which debt starts having a negative effect on economic growth (for a detailed survey see Section 3 of this paper). While non-linearities and threshold effects could arise from the presence of debt overhang (Krugman, 1988; Sachs, 1989), it is not clear whether a debt overhang argument could be easily applied to advanced economies in which the majority of debt-holders are resident (and therefore there is not an external transfer problem).
Checherita-Westphal, Hughes Hallett, and Rother (2012) develop a theoretical model in which, over the business cycle, debt can only be issued to finance public investment and the optimal level of public debt is determined by the public to private capital ratio that maximizes economic growth.6 With such a set-up, they show that the level of debt that maximizes economic growth is a function of the output elasticity of the capital stock. Checherita-Westphal, Hughes Hallett, and Rother (2012) use the model to estimate optimal debt ratios for various subsamples of OECD countries and find values that range between 43 and 63 percent of GDP. However, Greiner (2012) shows that the results of Checherita-Westphal, Hughes Hallett, and Rother (2012) are driven by their assumption that the deficit is equal to public investment at each point in time. According to Greiner (2012), in such a set-up, debt is completely irrelevant and the non-linear relationship between debt and growth is given by the growth-maximizing tax rate. He then shows that allowing for a more gen-eral debt policy leads to a monotone and negative relationship between public debt and steady-state growth. Greiner (2011; 2013) also argues that the effect of debt on growth depends on the presence of rigidities in the economy. In par-ticular, Greiner (2011) shows that, in a model with no rigidities and elastic
Public Debt and Economic Growth in Advanced Economies 179
Swiss Journal of Economics and Statistics, 2013, Vol. 149 (2)
labor supply, public debt has a negative effect on labor supply, investment, and economic growth. In the presence of wage rigidities and unemployment, instead, public debt has no effect on the allocation of resources and can even have a posi-tive effect if it is used to finance productive investment.
Greiner (2012) concludes that there is no well-specified model that can gen-erate an inverted U-shaped relationship between debt and growth. Non-line-arities may arise if there is a tipping point above which public debt suddenly become unsustainable (Ghosh et al., 2012, provide a formal model). However, we are not aware of any theoretical model that includes such tipping points in a growth framework.
It is also possible that high levels of debt pose constraints on a country’s abil-ity to conduct countercyclical policies, and thus increase output volatility and reduce economic growth (for the relationship between volatility and growth, see Ramey and Ramey, 1995). However, the relationship between debt and the abil-ity of conduct countercyclical policies is more likely to depend on the composi-tion of public debt than on the level of public debt (Hausmann and Panizza, 2011; De Grauwe, 2011). This suggests that countries with different debt struc-tures and monetary arrangements are likely to start facing problems at very dif-ferent levels of debt.
Summing up, simple back-of the envelope calculations suggest that debt may have a negative effect on growth, but the effect is likely to be small. More sophis-ticated models yield uncertain results on the relationship between debt and growth and show that the link between debt and growth depends on many cycli-cal and structural factors. These considerations suggest that trying to estimate a single debt coefficient that holds for all countries and all periods may be mis-sion impossible.
3. Public Debt and Economic Growth: The Empirics
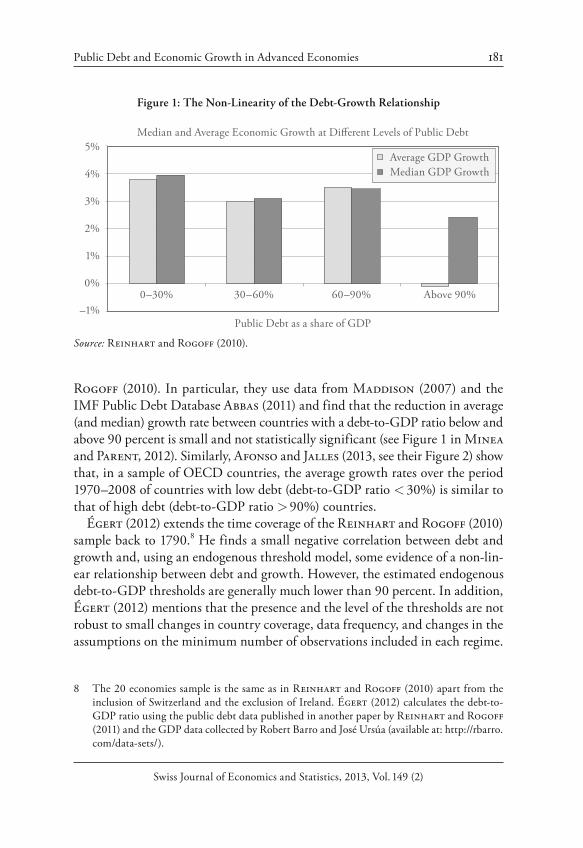
A good starting point for discussing the relationship between public debt and economic growth in advanced economies is Reinhart and Rogoff’s (2010) finding that high levels of debt are negatively correlated with economic growth, but that there is no link between debt and growth when public debt is below 90 percent of GDP. Reinhart and Rogoff (2010) illustrate this threshold effect by collecting annual data on debt and output growth for 20 advanced econo-mies over 1946–2009 and splitting their sample into four groups: (i) country-years for which public debt is below 30 percent of GDP (443 observations); (ii) country-years for which public debt is between 30 and 60 percent of GDP (442

180 Panizza /Presbitero
Swiss Journal of Economics and Statistics, 2013, Vol. 149 (2)
observations); (iii) country-years for which public debt is between 60 and 90 per-cent of GDP (199 observations); and (iv) country-years for which public debt is above 90 percent of GDP (96 observations). Next, they compute median and average GDP growth for each group and show that there are no large differences among the first three groups, but that average and median GDP growth are substantially lower in the fourth group. In particular, Reinhart and Rogoff (2010) show that in the high debt group median growth is approximately 1 per-centage point lower and average growth is nearly 4 percentage points lower than in other groups (see Figure 1).
Reinhart and Rogoff’s (2010) influential paper sparked a new literature aimed at assessing whether their findings were robust to allowing for non-arbi-trary debt brackets, to controlling for other variables in a proper regression set-up, and to instrumenting public debt to assess its causal effect on economic growth. In this section, we review this new empirical literature.7
3.1 Endogenous Thresholds
Instead of comparing growth across a set of pre-established brackets, Minea and Parent (2012) study the relationship between debt and growth by using the Panel Smooth Threshold Regressions model originally proposed by González, Teräsvirta, and van Dijk (2005). Using this approach, that allows for a gradual change in the regression coefficient when moving from one regime to the other, Minea and Parent (2012) find that public debt is negatively associated with growth when the debt-to-GDP ratio is above 90 percent and below 115 percent. However, they also find that the correlation between debt and growth becomes positive when debt surpasses 115 percent of GDP. While Minea and Parent’s (2012) results should not be interpreted as an argument for fiscal profligacy, they suggest the existence of complex non-linearities, which may not be captured by models that use a set of exogenous thresholds.
Minea and Parent (2012) also note that, since Reinhart and Rogoff (2010) found that differences in median growth are much smaller than differences in average growth, researchers should be careful in examining the role of outliers and check whether their results are robust to using different sources of data. They illustrate the importance of these robustness tests by showing that alternative data sources yield results which are somewhat different from those of Reinhart and
7 This article was written before the release of Herndon et al.’s (2013) critique to Reinhart and Rogoff (2010). We briefly discuss how our article relates to this debate in Panizza and Presbitero (2013).
Public Debt and Economic Growth in Advanced Economies 181
Swiss Journal of Economics and Statistics, 2013, Vol. 149 (2)
8 The 20 economies sample is the same as in Reinhart and Rogoff (2010) apart from the inclusion of Switzerland and the exclusion of Ireland. Égert (2012) calculates the debt-to-GDP ratio using the public debt data published in another paper by Reinhart and Rogoff (2011) and the GDP data collected by Robert Barro and José Ursúa (available at: http://rbarro.com/data-sets/).
Rogoff (2010). In particular, they use data from Maddison (2007) and the IMF Public Debt Database Abbas (2011) and find that the reduction in average (and median) growth rate between countries with a debt-to-GDP ratio below and above 90 percent is small and not statistically significant (see Figure 1 in Minea and Parent, 2012). Similarly, Afonso and Jalles (2013, see their Figure 2) show that, in a sample of OECD countries, the average growth rates over the period 1970–2008 of countries with low debt (debt-to-GDP ratio < 30%) is similar to that of high debt (debt-to-GDP ratio > 90%) countries.
Égert (2012) extends the time coverage of the Reinhart and Rogoff (2010) sample back to 1790.8 He finds a small negative correlation between debt and growth and, using an endogenous threshold model, some evidence of a non-lin-ear relationship between debt and growth. However, the estimated endogenous debt-to-GDP thresholds are generally much lower than 90 percent. In addition, Égert (2012) mentions that the presence and the level of the thresholds are not robust to small changes in country coverage, data frequency, and changes in the assumptions on the minimum number of observations included in each regime.
Figure 1: The Non-Linearity of the Debt-Growth Relationship
5%
4%
3%
2%
1%
0%
–1%0–30% 30–60% 60–90% Above 90%
Public Debt as a share of GDP
Median and Average Economic Growth at Different Levels of Public Debt
Average GDP GrowthMedian GDP Growth
Source: Reinhart and Rogoff (2010).

182 Panizza /Presbitero
Swiss Journal of Economics and Statistics, 2013, Vol. 149 (2)
9 While the set of controls varies across studies, it often includes population growth, the ratio of investment over GDP, and a measure of the stock of human capital, as predicted by the augmented Solow model (Mankiw, Romer, and Weil, 1992).
10 Their X matrix includes: national gross savings (as a share of GDP), population growth, average number of years of secondary education, trade openness, inflation, age dependency ratio (the ratio between people younger than 15 or older than 64 and people in the 15–64 age range), a banking crisis dummy, and the ratio of liquid liabilities to GDP.
3.2 Controlling for Possible Covariates of Debt and Growth
In the presence of variables that are correlated with both debt and growth, the simple correlations discussed above may suffer from an omitted variable bias. Starting with Kumar and Woo (2010), Cecchetti, Mohanty, and Zampolli (2012), and Checherita-Westphal and Rother (2012), the literature has tried to address this issue by estimating alternative versions of the following dynamic growth model:
, ( ) , , , ,( )i t t n i t n i t n i t n t i i tGROWTH ln GDP DEBTα β γ τ η ε− − − − −= + + + + +X (1)
In Equation (1), per-capita GDP growth (GROWTH) of country i over period t−n and t (with n ranging between 1 and 5) is regressed on the initial level of per capita GDP, the ratio of public debt over GDP (DEBT ), and a set of controls X.9
To estimate Equation (1), researchers need to choose the length of the growth episode (n). There are several tradeoffs involved in this choice. While n = 1 (i.e., using annual GDP growth) maximizes the number of observations, this strat-egy may lead to estimates that are fully driven by business cycle fluctuations and suffer from serious endogeneity (as debt is only lagged by one year with respect to economic growth). To mitigate these problems, n is usually set equal to 5, with the objective of estimating the correlation between the current level of debt (and the other explanatory variables) and the 5-year forward GDP growth rate. However, this strategy greatly reduces the number of observations (which can be problematic in short panels) and introduces some arbitrariness about the choice of the first and last usable observations. An alternative is to use 5-year overlap-ping growth episodes, at the cost of introducing autocorrelation in the model.
Cecchetti, Mohanty, and Zampolli (2012) estimate Equation (1) using 5-year overlapping growth episodes for a sample of 18 OECD countries over the period 1980–2006.10 In their baseline estimations, they find that a 10 percent-age point increase in the debt-to-GDP ratio is associated with an 18 basis points decrease in subsequent GDP growth. This is a large effect, about one order of

Public Debt and Economic Growth in Advanced Economies 183
Swiss Journal of Economics and Statistics, 2013, Vol. 149 (2)
magnitude larger than what we obtained using the back-of-the envelope calcu-lations of Elmendorf and Mankiw (1999).
This result is robust to controlling for outliers and to specifications that include different sets of controls variables. However, Cecchetti, Mohanty, and Zam-polli (2012) find that the public debt variable is not statistically significant in regressions that do not include time or country fixed effects.
After having established the presence of a negative correlation between debt and growth, Cecchetti, Mohanty, and Zampolli (2012) check for the exist-ence of non-linearities. They find that standard regressions or group comparisons do not show evidence of a threshold effect. Nevertheless, they suggest that more sophisticated econometric techniques yield results which are consistent with the presence of such effect. Section 3.4 below discusses this exercise in detail.
3.3 Endogeneity
While there is evidence that public debt is negatively correlated with economic growth, the presence of such a correlation does not necessarily imply that debt reduces growth. The link between public debt and economic growth could be driven by the fact that it is low economic growth that leads to high levels of debt (Reinhart, Reinhart, and Rogoff, 2012). Alternatively, the observed corre-lation between debt and growth could be due to a third factor that has a joint effect on these two variables.
In Panizza and Presbitero (2012), we describe the endogeneity problem and asses the likely direction of the bias by using a simple bivariate model in which growth (G) is a function of debt (D):
,G a bD u= + + (2)
and debt is a function of growth:
.D m kG v= + + (3)
The OLS estimator of b is then given by:
2 2
2 2 2ˆ ,v u
v u
b kb
kσ σ
σ σ
+=
+

184 Panizza /Presbitero
Swiss Journal of Economics and Statistics, 2013, Vol. 149 (2)
11 Expectations of a slowdown may trigger counter-cyclical expansionary fiscal policy, resulting in a higher public debt-to-GDP ratio at time t. This would be correlated with lower growth in period (t + 1; t + n) even if public debt has no causal impact on growth in the future. Things may be different when n is sufficiently large. Kourtellos, Stengos, and Tan (2012), for instance, suggest that focusing on 10-year growth further mitigates endogeneity concerns. This strategy, however, is not feasible when the cross-sectional dimension of the data set is small (i.e., when focusing on advanced economies).
12 Other papers that use GMM techniques to estimate the causal relationship between public debt and economic growth include Padoan, Sila, and van den Noord (2012) and Checherita-Westphal and Rother (2012).
13 The difference and system GMM estimators can suffer from weak instrument problems Bun and Windmeijer (2010). Moreover, the system GMM estimator assumes that the instruments
and the bias of the OLS estimates is:
2 2 2
(1 )( ˆ) .
/v u
k bkE b b
kσ σ
−− =
+ (4)
Equation (4) shows that OLS estimations are unbiased if k = 0 (i.e., debt is not endogenous). Given that stability requires that bk < 1, if k < 0 (as it is likely to be), OLS estimates are negatively biased.
Using lagged debt mitigates, but does not resolve, the endogeneity problem.11 Assessing the presence of a causal relationship between debt and growth requires finding an instrumental variable that has a direct effect on debt but no direct (or indirect, except for the one going thought debt) effect on economic growth.
One possible approach consists of using internal instruments (i.e., lagged values of the explanatory variables), as in the difference and system GMM estimators develop in Arellano and Bond (1991) and Blundell, Richard, and Ste-phen Bond (1998). Kumar and Woo (2010) study the relationship between debt and growth in a group of 30 advanced and emerging market economies over the period 1970–2007. They experiment with different estimations techniques and argue that the system GMM estimator allows them to address endogeneity. Their results are consistent with those of Cecchetti, Mohanty, and Zampolli (2012), as they imply that a 10 percentage point increase in the initial debt-to-GDP ratio is associated with a slowdown in annual real per capita GDP growth of approximately 20 basis points.12
These results should be interpreted with some caution. The difference and system GMM estimators were developed for micro data and are poorly suited for macroeconomic datasets with a relatively small number of cross-sectional units (Bond, 2002).13 Moreover, system GMM estimations of the relationship
Public Debt and Economic Growth in Advanced Economies 185
Swiss Journal of Economics and Statistics, 2013, Vol. 149 (2)
are strong, without properly testing this assumption. Using many lags does not solve the weak instrument problem, which may lead to spurious results (Bazzi and Clemens, 2013). In fact, instrument proliferation (i.e. the use of many lags), especially when endogenous explanatory variables are highly persistent (as in the case of debt ratios), can undermine the validity of internal instruments in the system estimator (Roodman, 2009).
14 See also Tables 2 and 3 of Checherita-Westphal and Rother (2012).
between debt and growth are similar to those obtained with standard OLS regres-sions (for instance, compare columns 2 and 4 and 5 and 7 of Table 1 of Kumar and Woo, 2010).14 In fact, the system GMM coefficients are larger (in absolute value) than the OLS coefficients. There are two possible interpretations for this result: either public debt is not endogenous, or the system GMM estimator does not solve the endogeneity problem.
An alternative strategy for identifying the causal effect of public debt on growth consists of using external instruments. We are aware of two papers that use an external instrument for public debt.
Checherita-Westphal and Rother (2012) focus on 12 euro-area countries over the period 1970–2008 and instrument the debt-to-GDP ratio of country i at time t with the average debt-to-GDP ratio in the other 11 countries at time t. With this strategy, the authors find a non-linear hump-shaped relationship between debt and growth. Their estimations suggest that growth reaches a maxi-mum when the debt-to-GDP ratio is around 90–100 percent.
There are two problems with the instrument used by Checherita-Westphal and Rother (2012). The first relates to the fact that the instrument is only valid if: “there is no strong relationship between debt levels in other euro area coun-tries and the per-capita GDP growth rate in one specific country” (Checherita-Westphal and Rother, 2012, p. 1398). This assumption is hard to defend. If it is true that debt in country j has a negative effect on growth in country j, claim-ing that debt levels in other euro-area countries have no effect on growth in the excluded country is equivalent to saying that GDP growth in the euro area (cal-culated by excluding a specific country from the group) has no effect on GDP growth of the excluded country. Defending such an assumption is even harder at time of crisis, when there is overwhelming evidence of large cross-country spillo-ver effects (De Santis, 2012).
Second, as in the GMM estimations discussed above, the instrumental variable approach of Checherita-Westphal and Rother (2012) yields results which are very close to those of the OLS regressions. Again, this may either mean that debt is not endogenous, or that the instrument is not appropriate.
186 Panizza /Presbitero
Swiss Journal of Economics and Statistics, 2013, Vol. 149 (2)
In Panizza and Presbitero (2012), we use the same specification of Cecch-etti, Mohanty, and Zampolli (2012) but instrument public debt with the val-uation effects brought about by the interaction between foreign currency debt and movements in the exchange rate. In the paper, we show that the instrument is relevant (as demonstrated by a strong first-stage correlation and a battery of weak instrument tests) but, as our model is exactly identified, we cannot test the validity of our exclusion restriction. However, we discuss in detail the conditions under which the exclusion restriction is likely to be valid. We suggest that, besides public debt, our instrument may affect economic growth through two additional channels. First, valuation effects are correlated with the share of foreign currency debt, which, in turn, could hinder economic growth through financial and mac-roeconomic instability (Bordo, Meissner, and Stuckler, 2010; Hausmann and Panizza, 2011). Second, the valuation effect is a (debt-weighed) effective exchange rate, which, in turn, is likely to be correlated with the trade-weighted effective exchange rate and economic growth (Rodrik, 2008). We conclude that our exclusion restriction is valid as long as we augment the model with the share of foreign currency debt and the real effective exchange rate.
In our paper, we show that the negative correlation between debt and GDP growth vanishes in the instrumental variable regressions. We point out that our findings are consistent with theoretical considerations suggesting that OLS esti-mates are negatively biased. In the paper, we ran a large number of robustness tests and discuss a series of possible problems with our identification strategy. While not all readers will be convinced of our results, we hope that, as mini-mum, our paper will serve as cautionary tale, and stimulate more research aimed at identifying the causal effect of public debt on growth.
3.4 Non-Linearities
We now move to papers that use multivariate regressions to assess the presence of a non-linear relationship between debt and growth. Before going into details, it is worth noting that most of the papers surveyed in this subsection suffer from the endogeneity problems discussed above.
The simplest way to test for non-linearities consists of including a quadratic term in the growth regression. Checherita-Westphal and Rother (2012) follow this approach and examine the relationship between public debt and growth in 12 euro area countries. Using a quadratic specification, estimated by fixed effects, system GMM, and two stages least squares, they find that the relationship between debt and growth can be described as an inverted U, and that the marginal effect of debt becomes negative when the debt-to-GDP ratio

Public Debt and Economic Growth in Advanced Economies 187
Swiss Journal of Economics and Statistics, 2013, Vol. 149 (2)
15 The authors suggest that the hump-shaped relationship between debt and growth is robust to fitting a more general polynomial functional forms. However, Égert (2012, see his Figure 5) provides contrasting evidence: the estimation of a quadratic specification (without additional control variables) on a sample of 20 advanced economies over the period 1946–2009 shows the presence of a U-shaped curve, so that the relationship between debt and growth is increas-ing above the 90 percent debt-to-GDP threshold.
16 While more f lexible than a quadratic specification, the spline regression is also arbitrary, because the number and the cutoff of the knots are often chosen on the ground of some (a-the-oretical) prior and/or in order to maximize the fit of the model.
is between 90 and 105 percent.15 This approach, however, is sensitive to extreme values and a hump-shaped relationship may be driven by few observations. Unfor-tunately, the paper does not show whether semi-parametric estimations support the quadratic relationship imposed by the authors or check if the presence of a U-shaped relationship is supported by the Sasabuchi-Lind-Mehlum test (Lind and Mehlum, 2010).
An alternative approach consists of fitting a spline regression, allowing for one or more knots (Marsh and Cormier, 2002).16 Kumar and Woo (2010) follow this methodology and explore the presence of non-linearities in their sample of advanced and emerging economies by estimating the following model:
, 4 1 , 4 30
2 , 4 30 90 3 , 4
90 , 4 ,
, ( 4) ( )i t i t
i t i t
i t t i i t
GROWTHi t t ln GDP DEBT DDEBT D DEBT
D X
α β
β β
γ τ η ε
− −
− − −
−
− − = + ×
+ × +
× + + + + (5)
where all variables are the same as in Equation (1) and, D30 is a dummy that takes a value of one when DEBT < 30, D30–90 is a dummy takes a value of one when 30 < DEBT < 90, and D90 is a dummy takes a value of one when DEBT > 90.
After estimating Equation (5) with different panel estimators, Kumar and Woo (2010, p. 21) conclude that they find “evidence of nonlinearity, with only high (above 90 percent of GDP) levels of debt having a significant negative effect on growth”. It is hard to interpret the results of Kumar and Woo as evi-dence of non-linearities in the relationship between debt and growth. Consider, for instance, their system GMM estimations of column 4, Table 5: β2 and β3 are identical (they are both equal to –0.18), the only difference is that β3 is margin-ally significant (with a t-statistics of 1.78, corresponding to a p-value of 0.08) and β2 insignificant (with a t-statistics of 1.24, corresponding to a p-value of 0.22). It

188 Panizza /Presbitero
Swiss Journal of Economics and Statistics, 2013, Vol. 149 (2)
17 The results of the OLS regressions (column 2 of Table 5) are even more damning for the non-linearity hypothesis, as both β2 and β3 are statistically significant and | β2 | > | β3 |.
18 For instance, in the three regimes model, he finds that the correlation between debt and GDP growth is –0.038 when DEBT < 90%, –0.029 when 60% < DEBT < 90%, and –0.021 when DEBT > 90%.
19 Padoan, Sila, and van den Noord (2012) conduct a similar experiment using an unbal-anced sample of 28 OECD economies and find debt thresholds close to 90 percent. Afonso and Jalles (2013) also follow a similar strategy and estimate a threshold close to 60 percent in a large sample of developed and developing countries.
is thus clear that a formal t-test of β2 = β3 will not reject the null of equality, and thus reject the presence a non-linear effect of debt on growth.17
Égert (2012) estimates a simplified version of Equation (5) (he does not include X and τt ) on a sample of advanced economies, allowing for two (with a threshold at 90 percent), three (with thresholds at 30 and 90 percent), and four (with thresh-olds at 30, 60, and 90 percent) regimes. His estimations for 20 advanced econo-mies over the period 1946–2009 find a negative and statistically significant corre-lation between debt and growth, but do not find any significant threshold effect. In fact, Égert’s (2012) results suggest that the negative correlation between debt and growth decreases (in absolute value) when the debt-to-GDP ratio increases.18
Panel threshold regression (PTR) models (Hansen, 1999, 2000) allow estimat-ing exogenous thresholds, rather than fixing them at arbitrary values. Cecchetti, Mohanty, and Zampolli (2012) define DΨ as a dummy variable that takes a value of one when the debt-to-GDP ratio is below Ψ and estimate the following threshold regression for Ψ ∈ (50, 120):
,, 1, 6 , , , 1 ,
,
,2 , ,
,
(1 )
i ti t t i t i t i t i t
i t
i ti t i t i t
i t
DebtGROWTH y X D D
GDP
DebtD
GDP
α γ ϕ β
β μ τ ε
+ +
⎛ ⎞⎟⎜ ⎟′= + + Ψ + Ψ⎜ ⎟⎜ ⎟⎟⎜⎝ ⎠⎛ ⎞⎟⎜ ⎟+ − Ψ + + +⎜ ⎟⎜ ⎟⎟⎜⎝ ⎠
(6)
Next, they use Hansen’s (1999) likelihood ratio (LR) statistics to show that Ψ = 96 maximizes the fit of Equation (6). They find than when the debt-to-GDP ratio is below 96 percent, a ten percentage point increase in the debt-to-GDP ratio is correlated with a 7 basis point decrease in GDP growth (and the coefficient is not statistically significant) and when the debt-to-GDP ratio is above 96 percent a ten percentage point increase in the debt-to-GDP ratio is correlated with a 14 basis point decrease in GDP growth (and the coefficient is statistically significant).19

Public Debt and Economic Growth in Advanced Economies 189
Swiss Journal of Economics and Statistics, 2013, Vol. 149 (2)
Although these results are consistent with the presence of a threshold at around 90 percent of GDP, there are some issues with interpreting these findings as evi-dence for the existence of a non-linear relationship between debt and growth. The first problem has to do with the fact that Hansen’s derivations assume a static model with iid errors, and it is not clear whether the results apply to a dynamic model with heteroscedastic errors.
The second problem has to do with the fact that Hansen’s LR statistics cannot be used to test for the existence of a threshold. It can only be used to build a con-fidence interval around a threshold, under the assumption that such a threshold does exist (Hansen, 1999, p. 351). Testing for the presence of a threshold requires a more complicate procedure, and the papers surveyed above do not report this test.
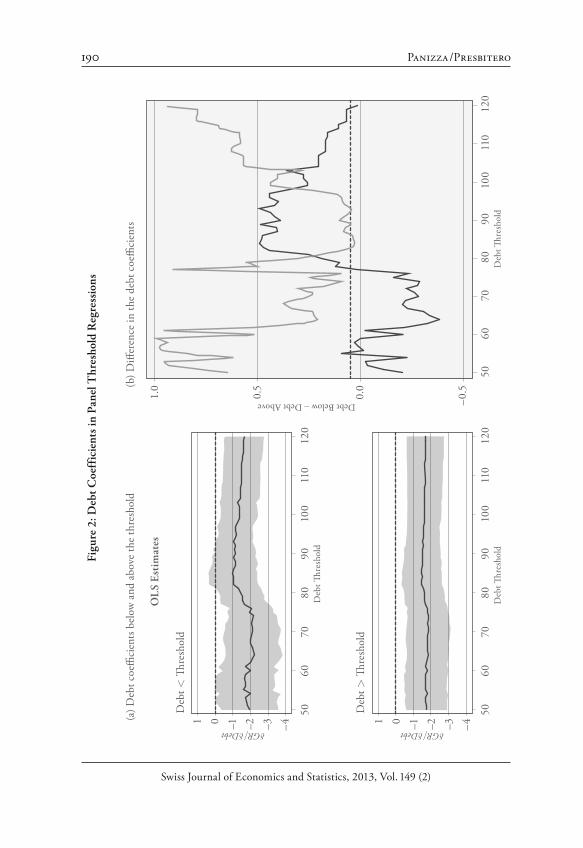
Finally, if non-linearities do exist they might be more complicated than what could be described by a simple one-threshold model. In Panizza and Presbit-ero (2012), we estimate and describe the coefficients of β1 and β2 for all for Ø ∈ (50, 120). We find that the point estimates are fairly stable (and often statis-tically significant), but that the difference between the two coefficients is rarely statistically significant. Moreover, we show that at very high levels of debt the difference between β1 and β2 converges to zero (see Figure 2). This puzzling result (which is, however, consistent with the findings of Minea and Parent, 2012, and Égert, 2012) casts some doubts on the validity of Equation (6).
Égert (2012) casts further doubts on the presence of a 90 percent threshold. When he looks at non-overlapping multi-year growth episodes for his sample of 20 advanced economies spanning the period 1946–2009, he finds unstable results that generally suggest that the correlation between debt and growth decreases when countries move from intermediate to high debt regimes.
As discussed above, standard PTR techniques assume a static model with spherical errors (Hansen, 1999), two conditions which are not met by the dynamic growth model of Equation (6). Baum, Checherita-Westphal, and Rother (2012) address this issue by identifying their thresholds with a method which is appropriate for dynamic panels (Caner and Hansen, 2004), and then use these thresholds in a set of standard system GMM regressions. By applying this methodology to 12 euro-area countries over the period 1990–2010, they find a positive correlation between debt and growth when the debt-to-GDP ratio is below 67 percent, no significant correlation when debt is between 67 and 95 per-cent of GDP, and a negative correlation when debt surpasses 95 percent of GDP. According to the authors, the negative correlation between debt and growth is related to the specificity of the 2008–2010 financial crisis.
Kourtellos, Stengos, and Tan (2012) use the structural threshold regres-sion model developed by Kourtellos, Stengos, and Tan (2011) to estimate
190 Panizza /Presbitero
Swiss Journal of Economics and Statistics, 2013, Vol. 149 (2)
Fig
ure
2:
Deb
t C
oef
fici
ents
in
Pan
el T
hre
shol
d R
egre
ssio
ns
GRDebt
5060
7080
9010
011
012
0D
ebt Th
resh
old
Deb
t Th
resh
old
GRDebt
5060
7080
9010
011
012
0D
ebt Th
resh
old
Deb
t Th
resh
old
OL
S E
stim
ates
Debt Below – Debt Above
5060
7080
9010
011
012
0D
ebt Th
resh
old
1.0
0.5
0.0
–0.5
1 0 –1 –2 –3 –4 1 0 –1 –2 –3 –4
(a)
Deb
t coe
ffici
ents
bel
ow a
nd a
bove
the
thr
esho
ld(b
) D
iffer
ence
in t
he d
ebt c
oeffi
cien
ts
Public Debt and Economic Growth in Advanced Economies 191
Swiss Journal of Economics and Statistics, 2013, Vol. 149 (2)
20 This estimation technique allows for endogenous thresholds and regime specific heterosce-dasticity.
21 Looking exclusively at a debt threshold is a peculiarity of the recent studies that focus on public debt in advanced economies. The development literature shows that there are non-linearities in the relationship between external debt and growth that depend on the level of institutional quality (Cordella, Ricci, and Ruiz-Arranz, 2010; Presbitero, 2012).
an augmented Solow growth model for a sample of 82 countries over three non-overlapping 10-year growth episodes.20 One main contribution of Kourtellos, Stengos, and Tan (2012) is to investigate other threshold variables besides the debt-to-GDP ratio. In this way, they overcome one conceptual problem of the literature that tests the hypothesis of the presence of a debt threshold against the alternative of no threshold. Kourtellos, Stengos, and Tan (2012) correctly point out that the effect of public debt on economic growth could be influ-enced by variables such as trade openness or institutional quality, and that not accounting for parameter heterogeneity may lead to spurious results.21 Kourtel-los, Stengos, and Tan (2012) find that the main source of heterogeneity in the debt-growth relationship is the quality of institutions. Specifically, they show that the association between public debt and growth depends on democracy and that higher public debt is correlated with lower growth in the low-democracy regime. The correlation between debt and growth, instead, is not statistically significant in the high-democracy regime.
Notes to Figure 2: In panel (a), the solid lines plot the debt coefficients β1 and β2 of Equation (6) at different thresholds and the gray areas are within the 95% confidence intervals. In panel (b), the black line plots
| | .GROWTH GROWTH
Debt Threshold Debt ThresholdDebt Debt
⎛ ⎞ ⎛ ⎞∂ ∂⎟ ⎟⎜ ⎜< − >⎟ ⎟⎜ ⎜⎟ ⎟⎜ ⎜⎝ ⎠ ⎝ ⎠∂ ∂
Since (∂ GROWTH / ∂ Debt) is always negative, a positive value indicates that the negative effect of debt on growth is larger above the threshold. The gray line plots the p-value for the null hypoth-esis that
| | 0.GROWTH GROWTH
Debt Threshold Debt ThresholdDebt Debt
⎛ ⎞ ⎛ ⎞∂ ∂⎟ ⎟⎜ ⎜< − > =⎟ ⎟⎜ ⎜⎟ ⎟⎜ ⎜⎝ ⎠ ⎝ ⎠∂ ∂
The horizontal line is at 0.05. Therefore, whenever the dotted line is above the horizontal line the difference between coefficients is not different from zero at the 5 percent confidence level.Source: Panizza and Presbitero (2012, Figures 11 and 12).

192 Panizza /Presbitero
Swiss Journal of Economics and Statistics, 2013, Vol. 149 (2)
Kourtellos, Stengos, and Tan’s (2012) finding that public debt is not a good variable for sample-splitting casts further doubts on the presence of a 90 per-cent debt threshold. Moreover, all advanced economies included in their sample belong to the high-democracy regime. Therefore, the results of Kourtellos, Stengos, and Tan (2012) suggest that there is no statistically significant rela-tionship between debt and growth in advanced economies.
3.5 What Can the Data Say?
Summing up, we think that the case for a debt threshold still needs to be made. The negative relationship between debt and growth and the classic 90 percent threshold are not robust across samples, specifications, and estimation techniques. In particular, there is evidence that the effect of debt depends on the quality of institutions and that its negative effect is confined to non-democratic developing countries (Kourtellos, Stengos, and Tan, 2012). This finding is consistent with the lack of evidence of a causal impact of debt on growth in OECD econo-mies (Panizza and Presbitero, 2012).
Heterogeneity is important and the aggregate non-linear relationship between debt and subsequent growth may be the result of very diverse country-specific patterns. Figure 3 uses data for 16 OECD countries over the period 1982–2008 to plot the aggregate and country-specific quadratic fits obtained by regressing GROWTHt−(t−5) over DEBTt−5. The aggregate data produce an inverted-U curve (the thick line) and a 90 percent threshold. However, the country-specific regres-sions yield different results. Interestingly, in many countries the relationship between debt and growth is U-shaped and, in some cases, we observe a positive relationship between debt and growth.
Figure 3 suggests that the sample may not be poolable and that researchers should not try to identify common threshold effects across countries. This points to a fallacy of the conventional interpretation of the presence of a debt threshold, which is generally used to argue that if a country raises it public debt-to-GDP ratio above 90 percent, GDP growth will decline. Eberhardt and Presbitero (2013) make a similar argument by studying a larger sample of advanced and developing countries, and showing that there is no evidence of a debt threshold within countries.

Public Debt and Economic Growth in Advanced Economies 193
Swiss Journal of Economics and Statistics, 2013, Vol. 149 (2)
4. Which is the Right Measure of Public Debt?
One issue that is rarely discussed in the empirical literature on the relationship between public debt and economic growth relates to the definition of debt itself. In particular, should researchers focus on gross or net debt? Should they con-centrate on explicit debt, or also consider the government’s implicit liabilities? Should standard measures of public debt also include the expected value of the government’s contingent liabilities? These are difficult questions for which we do not have clear answers.
Gross government debt measures the stock of outstanding government debt and net government debt is the difference between gross debt and the financial
Figure 3: The Non-Linearity of the Debt-Growth Relationship
0
1
2
3
4
5-ye
ar fo
rwar
d av
erag
e gr
owth
rat
e
30 60 90 120 150 180Public debt-to-GDP ratio
Notes: Calculations based on a sample of 16 OECD countries, for which there are non-miss-ing annual observations on the public debt-to-GDP ratio and the 5-year average forward GDP growth rate. Data and variables are from Panizza and Presbitero (2012). The thin lines rep-resent the quadratic fit of country-specific yearly data; the thick line represents the quadratic fit of the whole data points. The vertical line has been drawn in correspondence to the 90 percent debt-to-GDP threshold.

194 Panizza /Presbitero
Swiss Journal of Economics and Statistics, 2013, Vol. 149 (2)
22 This is the case for the countries with negative net debt in Table 1.23 EUROSTAT defines net government debt as the government’s “financial liabilities minus all
financial assets; financial assets of the general government sector have a corresponding lia-bility outside that sector; it is, however, at the government’s discretion whether to list mon-etary gold and special drawing rights, financial assets for which there is no counterpart liabil-ity, as financial assets” (see http://epp.eurostat.ec.europa.eu/statistics_explained/index.php/Glossary:Public_debt).
24 To see the conceptual problems involved in moving from gross to net debt consider the fol-lowing example: country A, B, and C have the same economic size and the same level of gross debt (say, 100 percent of GDP). The government of country A does not have any financial or real asset. The government of country B does not have any financial asset but owns a profit-able toll highway. The net present value of the highway’s future profits is equal to 10 percent of country’s B GDP. The government of country C used to have a profitable highway, but it sold it and used the privatization revenues (which amounted to ten percent of the country’s GDP) to buy liquid financial assets. According to conventional accounting, country A and B have a net debt equal to 100 percent of GDP and country C has net debt of 90 percent of GDP. This does not seem to make much sense because, in terms of net present value, the governments of countries B and C have exactly the same wealth. This line of reasoning leads to the conclusion that when countries compute their net debt they should subtract from their gross debt all of their assets. However, this would be an incredibly difficult exercise, full of arbitrary choices,
assets held by the government. The difference between gross and net debt can be very large. Table 1 shows that at the end of 2012, average gross debt in OECD countries was close to 110 percent of the group’s GDP, but net debt was almost 40 percentage points lower than gross debt. The table includes 8 countries for which the difference between gross and net debt is greater than 50 percent of GDP and two countries for which the difference is greater than 100 percent of GDP. Moreover, the table shows that there are 5 OECD countries with positive gross debt but negative net debt (in these countries the government’s financial assets are larger than the government’s liabilities).
Large differences between net and gross debt are sometimes due to the fact that the government holds a large fraction of its own debt. For instance, some US government debt is held in the US Social Security Trust Fund. Therefore, US sta-tistical sources often mention a measure of debt (“debt held by the public”) that nets out these cross-holdings, and it is thus similar to a concept of net debt. In other cases, large difference between gross and net debt are linked to the accu-mulation of international reserves or sovereign wealth funds.22
While net debt may seem the best measure government indebtedness, calcu-lating net debt requires a precise evaluation of the government’s assets and lia-bility. This is a difficult exercise, full of practical and conceptual challenges.23 As a consequence, while the definition of gross debt is fairly homogenous across country, each country has its own definition of net debt.24

Public Debt and Economic Growth in Advanced Economies 195
Swiss Journal of Economics and Statistics, 2013, Vol. 149 (2)
as most government assets do not have a market value. Also notice that restricting the netting to assets that generate a direct positive cash flow (and could thus be evaluated on the basis of the net present value of this future cash flow) would also be wrong as assets that do not gener-ate cash flow may have an effect of output growth and future tax revenues.
Table 1: General Government Debt as Percent of GDP in 2012
Gross debt Net debt Difference
Australia 29.3 7.9 21.4
Austria 83.1 47.9 35.2
Belgium 103.2 82.5 20.6
Canada 85.8 34.9 51.0
Denmark 61.0 7.3 53.7
Finland 62.3 –51.4 113.7
France 105.1 66.4 38.7
Germany 87.6 50.3 37.3
Greece 181.3 145.7 35.6
Iceland 124.7 48.7 76.0
Ireland 123.2 79.9 43.3
Italy 127.0 98.1 28.9
Japan 214.3 134.3 80.0
Luxembourg 29.8 –40.8 70.7
Netherlands 82.5 42.6 39.9
New Zealand 51.3 14.7 36.6
Norway 44.7 –165.3 210.0
Portugal 125.6 82.5 43.0
Spain 93.8 58.0 35.7
Sweden 48.6 –19.9 68.5
Switzerland 39.5 –3.1 42.6
United Kingdom 105.3 73.0 32.3
United States 109.8 86.5 23.3
Euro area 100.6 63.3 37.4
Total OECD 108.7 69.6 39.1
Source: OECD estimates
196 Panizza /Presbitero
Swiss Journal of Economics and Statistics, 2013, Vol. 149 (2)
25 Campos, Jaimovich, and Panizza (2006) show that sudden debt explosions are often caused by factors that are completely unrelated to fiscal policy.
Even netting cross-holdings of public sector bonds by separate public entities, and between national and sub-national governments is not a simple exercise. For instance, Cowan et al. (2006) show that social security reforms can have very large effects on debt ratios even when they have no effect whatsoever on govern-ment net assets.
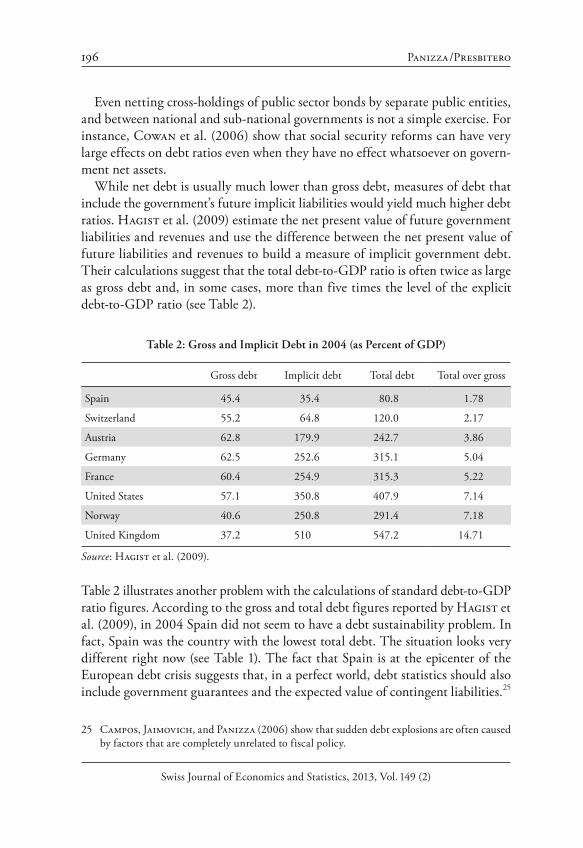
While net debt is usually much lower than gross debt, measures of debt that include the government’s future implicit liabilities would yield much higher debt ratios. Hagist et al. (2009) estimate the net present value of future government liabilities and revenues and use the difference between the net present value of future liabilities and revenues to build a measure of implicit government debt. Their calculations suggest that the total debt-to-GDP ratio is often twice as large as gross debt and, in some cases, more than five times the level of the explicit debt-to-GDP ratio (see Table 2).
Table 2: Gross and Implicit Debt in 2004 (as Percent of GDP)
Gross debt Implicit debt Total debt Total over gross
Spain 45.4 35.4 80.8 1.78
Switzerland 55.2 64.8 120.0 2.17
Austria 62.8 179.9 242.7 3.86
Germany 62.5 252.6 315.1 5.04
France 60.4 254.9 315.3 5.22
United States 57.1 350.8 407.9 7.14
Norway 40.6 250.8 291.4 7.18
United Kingdom 37.2 510 547.2 14.71
Source: Hagist et al. (2009).
Table 2 illustrates another problem with the calculations of standard debt-to-GDP ratio figures. According to the gross and total debt figures reported by Hagist et al. (2009), in 2004 Spain did not seem to have a debt sustainability problem. In fact, Spain was the country with the lowest total debt. The situation looks very different right now (see Table 1). The fact that Spain is at the epicenter of the European debt crisis suggests that, in a perfect world, debt statistics should also include government guarantees and the expected value of contingent liabilities.25
Public Debt and Economic Growth in Advanced Economies 197
Swiss Journal of Economics and Statistics, 2013, Vol. 149 (2)
26 One reason for focusing on gross debt has to with the fact that the government needs to refi-nance all of its debt. Large refinancing needs may erode investors’ confidence and ignite a vicious circle which could ultimately lead to a debt crisis.
Another issue relates to valuation effects. Dippelsman, Dziobek, and Gutiér-rez Mangas (2012, p. 15) ask the following question: “Did Greece’s debt rise by approximately 10 percent between 2009 and 2010 or did it fall by 10 percent?” Next, they show that both answers are true, as the face value of Greek debt was increasing while its market value was decreasing. What figure should researchers use? This is a very important question, especially when countries issue securities below or above par (consider the case of a country that only issues long-dated zero-coupon bonds).
Finally, there is the issue of institutional coverage. Should we focus on central government debt or on general government debt, including debt issued by local governments? Dippelsman, Dziobek, and Gutiérrez Mangas (2012) conduct an exercise for Canada and show that, depending on the level of aggregation, in 2010 the Canadian debt-to-GDP ratio ranged between 38 and 104 percent. This is an enormous range. Dippelsman, Dziobek, and Gutiérrez Mangas (2012) suggest that headline indicators should focus on the broader concept of gross debt (the concept that, in the case of Canada, finds that debt is 104 per-cent of GDP). However, very few countries report the data necessary to compute this broad measure of debt.
Since net debt is hard to compute and rarely comparable across countries, most papers that study the relationship between debt and growth use gross debt, even if this measure of debt is not a good indicator of the government’s financial situ-ation.26 Moreover, even data on gross debt are not strictly comparable, as defini-tions of government vary across countries. Finally, it is now recognized that vul-nerabilities depend on both debt levels and debt composition (see, for instance, Inter-American Development Bank, 2006), and, unfortunately, it is very hard to find cross-country data on the composition of public debt in advanced and developing economies.
198 Panizza /Presbitero
Swiss Journal of Economics and Statistics, 2013, Vol. 149 (2)
5. Conclusions
The global recession and the European sovereign debt crisis have stimulated an intense debate about the effectiveness of fiscal policy and the consequences of rising government debt. Some economists and commentators suggest that this is the right time to apply the lessons learned during the great depression and that countries should not shy away from expansionary fiscal policy (see, among others, Krugman, 2011; DeLong and Summers, 2012). Other economists argue that high levels of public debt have a negative effect on economic growth and that fiscal consolidation is necessary to anchor expectations and restore confidence (Cochrane, 2011b). This latter view, which is distilled in the IMF summary of a 2013 AEA session on sovereign debt mentioned in the introduction, is in line with a series of empirical papers that found a negative association between debt accumulation and economic growth.
In this paper, we survey the theoretical and empirical literature that studies the relationship between public debt and economic growth in advanced econo-mies. We conclude that the case for a causal effect running from high debt to low growth still needs to be made. Apart from causality issues, we also show that the evidence of a common debt threshold above which growth collapses is far from being robust.
Our findings should not be interpreted as suggesting that debt accumulation is not a relevant policy issue or that high debt levels are not a serious problem. First of all, stating that there is no evidence that debt has an effect on economic growth is different from stating that there is evidence that debt has no effect on economic growth. Second, there are different ways through which a large public debt may harm the economy. In Panizza and Presbitero (2012), we suggest that a fully solvent government with a high level of debt may decide to put in place restrictive fiscal policies to reduce the probability that a sudden change in investors sentiments would push the country towards a bad equilibrium. These policies, in turn, may reduce growth (Jaramillo and Cottarelli, 2012; Per-otti, 2012), especially if implemented during a recession. In this case, it would be true that debt reduces growth, but only because high levels of debt lead to con-tractionary policies. While such an interpretation would justify long-term poli-cies aimed at reducing debt levels, it also implies that countries should not imple-ment restrictive policies in the middle of a crisis (DeLong and Summers, 2012).
In our view, future research on the links between public debt and economic growth should focus on cross-country heterogeneity and on the mechanisms and transmission channels through which public debt may hinder economic growth. Addressing the latter point would require a unified theory aimed at explaining

Public Debt and Economic Growth in Advanced Economies 199
Swiss Journal of Economics and Statistics, 2013, Vol. 149 (2)
27 The average maturity and the relative share of domestic and foreign holders may influence refinancing risk (Arslanalp and Tsuda, 2012) and the overall perceived sustainability of debt, affecting interest rates and, ultimately, GDP growth. So far, analysis in this direction has been constrained by lack of detailed data on debt structure. However, data availability is now improving (see, for instance, Mauro et al. (2013) and the International Financial Insti-tutions are working towards building comprehensive dataset on debt levels and structure (see, for instance, the Public Sector Debt Statistics (PSD) database, jointly developed by the World Bank and the International Monetary Fund, at: http://go.worldbank.org/9PIAZORON0).
under what conditions and through which mechanisms debt may reduce eco-nomic growth.
The relationship between debt and growth is characterized by large cross country heterogeneity (Figure 3) and may also vary over time within countries. The way in which debt affects growth may depend on institutional quality, on the dimension of the public sector, on how and why debt has been accumulated, and on the structure and composition of public debt (Inter-American Devel-opment Bank, 2006).27
Cross-country heterogeneity may lead to large biases in the estimated relation-ship between debt and growth. New panel time series econometric techniques allow moving beyond simple interactive effects and sample splitting and deal-ing explicitly with a variety of issues related to unobserved heterogeneity and cross-section dependence. Eberhardt and Presbitero (2013) apply these tech-niques to estimate the relationship between debt and growth in a large sample of advanced and developing countries. By disentangle short-run and long-run effects and allowing for the presence of non-linearities and asymmetric effects of public debt on growth, Eberhardt and Presbitero’s (2012) findings cast several doubts on the pooled model approach used by the majority of the papers that study the empirical relationship between debt and growth.
References
Abbas, S. M. Ali, Nazim Belhocine, Asmaa A. El-Ganainy, and Mark A. Horton (2011), “Historical Patterns and Dynamics of Public Debt – Evi-dence from a New Database”, IMF Economic Review, 59(4), pp. 717–742.
Afonso, Antonio, and Joao Tovar Jalles (2013), “Growth and Productivity: The Role of Government Debt”, International Review of Economics & Finance, 25, pp. 384–407.

200 Panizza /Presbitero
Swiss Journal of Economics and Statistics, 2013, Vol. 149 (2)
Arellano, Manuel, and Stephen Bond (1991), “Some Tests of Specification for Panel Data: Monte Carlo Evidence and an Application to Employment Equations”, Review of Economic Studies, 58(2), pp. 277–297.
Arslanalp, Serkan, and Takahiro Tsuda (2012), “Tracking Global Demand for Advanced Economy Sovereign Debt”, IMF Working Papers 12/284, Inter-national Monetary Fund.
Barro, Robert J. (1974), “Are Government Bonds Net Wealth?”, Journal of Political Economy, 82(6), pp. 1095–1117.
Baum, Anja, Cristina Checherita-Westphal, and Philipp Rother (2012), “Debt and Growth: New Evidence for the Euro Area”, Journal of International Money and Finance, 32, pp. 809–821.
Bazzi, Samuel, and Michael Clemens (2013), “Blunt Instruments: Avoiding Common Pitfalls in Identifying the Causes of Economic Growth”, American Economic Journal: Macroeconomics, 5(2), pp. 152–186.
Blundell, Richard, and Stephen Bond (1998), “Initial Conditions and Moment Restrictions in Dynamic Panel Data Models”, Journal of Economet-rics, 87(1), pp. 115–143.
Bond, Stephen Roy (2002), “Dynamic Panel Data Models: A Guide to Micro Data Methods and Practice”, Portuguese Economic Journal, 1, pp. 141–162.
Bordo, Michael D., Christopher M. Meissner, and David Stuckler (2010), “Foreign Currency Debt, Financial Crises and Economic Growth: A Long-Run View”, Journal of International Money and Finance, 29(4), pp. 642–665.
Bun, Maurice J. G., and Frank Windmeijer (2010), “The Weak Instrument Problem of the System GMM Estimator in Dynamic Panel Data Models”, Econometrics Journal, 13(1), pp. 95–126.
Campos, Camila F. S., Dany Jaimovich, and Ugo Panizza (2006), “The Unex-plained Part of Public Debt”, Emerging Markets Review, 7(3), pp. 228–243.
Caner, Mehmet, and Bruce E. Hansen (2004), “Instrumental Variable Esti-mation of a Threshold Model”, Econometric Theory, 20(05), pp. 813–843.
Cecchetti, Stephen, Madhusudan Mohanty, and Fabrizio Zampolli (2012), “Achieving Growth Amid Fiscal Imbalances: The Real Effects of Debt”, in: Achieving Maximum Long-Run Growth – A Symposium Sponsored by The Federal Reserve Bank of Kansas City, Federal Reserve Bank of Kansas City.
Cerra, Valerie, and Sweta Chaman Saxena (2008), “Growth Dynamics: The Myth of Economic Recovery”, American Economic Review, 98(1), pp. 439–457.
Checherita-Westphal, Cristina, and Philipp Rother (2012), “The Impact of High Government Debt on Economic Growth and Its Channels: An Empirical Investigation for the Euro Area”, European Economic Review, 56(7), pp. 1392–1405.

Public Debt and Economic Growth in Advanced Economies 201
Swiss Journal of Economics and Statistics, 2013, Vol. 149 (2)
Checherita-Westphal, C., A. Hughes Hallett, and P. Rother (2012), “Fiscal Sustainability using Growth-Maximising Debt Targets”, Working Paper Series 1472, European Central Bank.
Cochrane, John H. (2011a), “Inf lation and Debt”, National Affairs, (9), pp. 56–78.
Cochrane, John H. (2011b), “Understanding Policy in the Great Recession: Some Unpleasant Fiscal Arithmetic”, European Economic Review, 55(1), pp. 2–30.
Cordella, Tito, Luca Antonio Ricci, and Marta Ruiz-Arranz (2010), “Debt Overhang or Debt Irrelevance?”, IMF Staff Papers, 57(1), pp. 1–24.
Cowan, Kevin, Eduardo Levy Yeyati, Ugo Panizza, and Federico Sturzen-egger (2006), “Sovereign Debt in the Americas: New Data and Stylized Facts”, RES Working Papers 4480, Inter-American Development Bank, Research Department.
DeLong, Bradford J., and Lawrence H Summers (2012), “Fiscal Policy in a Depressed Economy”, Brookings Papers on Economic Activity, Spring.
De Grauwe, Paul (2011), “The Governance of a Fragile Eurozone”, Working Document 346, CEPS, May.
De Santis, Roberto A. (2012), “The Euro Area Sovereign Debt Crisis: Safe Haven, Credit Rating Agencies and the Spread of the Fever From Greece, Ireland and Portugal”, Working Paper Series 1419, European Central Bank.
Dippelsman, Robert, Claudia Dziobek, and Carlos A. Gutiérrez Mangas (2012), “What Lies Beneath: The Statistical Definition of Public Sector Debt. An Overview of the Coverage of Public Sector Debt for 61 Countries”, IMF Staff Discussion Note 12/09, International Monetary Fund.
Eberhardt, Markus, and Andrea F. Presbitero (2013), “This Time They’re Different: Heterogeneity and Nonlinearity in the Relationship between Debt and Growth”, mimeo.
Égert, Balázs (2012), “Public Debt, Economic Growth and Nonlinear Effects: Myth or Reality?”, OECD Economics Department Working Papers 993, OECD Publishing, October.
Elmendorf, Douglas W., and Gregory N. Mankiw (1999), “Government Debt”, in J. B. Taylor and M. Woodford (eds), Handbook of Macroeconomics, volume 1 of Handbook of Macroeconomics, pp. 1615–1669. Elsevier.
Ghosh, Atish R., Jun I. Kim, Enrique G. Mendoza, Jonathan D. Ostry, and Mahvash S. Qureshi (2012), “Fiscal Fatigue, Fiscal Space and Debt Sustainability in Advanced Economies”, Economic Journal, forthcoming.
González, Andrés, Timo Teräsvirta, and Dick van Dijk (2005), “Panel Smooth Transition Regression Models”, Working Paper Series in Economics and Finance 604, Stockholm School of Economics, August.
202 Panizza /Presbitero
Swiss Journal of Economics and Statistics, 2013, Vol. 149 (2)
Greiner, Alfred (2011), “Economic Growth, Public Debt and Welfare: Comparing Three Budgetary Rules”, German Economic Review, 12(2), pp. 205–222.
Greiner, Alfred (2012), “Debt and Growth: Is There a Non-Monotonic Rela-tion?”, Working Papers in Economics and Management 04-2012, Bielefeld University.
Greiner, Alfred (2013), “Sustainable Public Debt and Economic Growth under Wage Rigidity”, Metroeconomica, 64(2), pp. 272–292.
Hagist, Christian, Stefan Moog, Bernd Raffelhüschen, and Johannes Vatter (2009), “Public Debt and Demography – An International Compari-son Using Generational Accounting”, CESifo DICE Report, 7(4), pp. 29–36.
Hansen, Bruce E. (1999), “Threshold Effects in Non-Dynamic Panels: Esti-mation, Testing, and Inference”, Journal of Econometrics, 93(2), pp. 345–368.
Hansen, Bruce E. (2000), “Sample Splitting and Threshold Estimation”, Econo-metrica, 68(3). pp. 575–604.
Hausmann, Ricardo, and Ugo Panizza (2011), “Redemption or Abstinence? Original Sin, Currency Mismatches and Counter Cyclical Policies in the New Millennium”, Journal of Globalization and Development, 2(1), p. 4.
Herndon, Thomas, Michael Ash, and Robert Pollin (2013), “Does High Public Debt Consistently Stifle Economic Growth? A Critique of Reinhart and Rogoff”, PERI working paper no. 322, April.
Inter-American Development Bank (2006), Living with Debt: How to Limit the Risks of Sovereign Finance. Harvard University Press, Cambridge, MA, 2006.
Jaramillo, Laura, and Carlo Cottarelli (2012), “Walking Hand in Hand: Fiscal Policy and Growth in Advanced Economies”, IMF Working Papers 12/137, International Monetary Fund.
Kourtellos, Andros, Thanasis Stengos, and Chih Ming Tan (2012), “Structural Threshold Regression”, University of Cyprus Working Papers in Economics 13-2011, University of Cyprus Department of Economics.
Kourtellos, Andros, Thanasis Stengos, and Chih Ming Tan (2012), “The Effect of Public Debt on Growth in Multiple Regimes”, Social Ser-vice Research Network, http://ssrn.com/abstract=2099957 or http://dx.doi.org/10.2139/ssrn.2099957.
Krugman, Paul (1988), “Financing vs. Forgiving a Debt Overhang”, Journal of Development Economics, 29(3). pp. 253–268.
Krugman, Paul (2011), “Self-Defeating Austerity”, New York Times, July 7.Kumar, Manmohan S., and Jaejoon Woo (2010), “Public Debt and Growth”,
IMF Working Papers 10/174, International Monetary Fund, July.
Public Debt and Economic Growth in Advanced Economies 203
Swiss Journal of Economics and Statistics, 2013, Vol. 149 (2)
Lind, Jo Thori, and Halvor Mehlum (2010), “With or Without U? The Appropriate Test for a U-Shaped Relationship”, Oxford Bulletin of Economics and Statistics, 72(1), pp. 109–118.
Maddison, Angus (2007), The World Economy Volume 1: A Millennial Perspec-tive Volume 2: Historical Statistics. Academic Foundation.
Mankiw, N. Gregory, David Romer, and David N. Weil (1992), “A Contri-bution to the Empirics of Economic Growth”, The Quarterly Journal of Eco-nomics, 107(2), pp. 407–437.
Marsh, Lawrence C., and David R Cormier (2002), Spline Regression Models, Quantitative Applications in the Social Sciences, Sage Publications, Thou-sand Oaks.
Mauro, Paolo, Rafael Romeu, Ariel Binder, and Asad Zaman (2013), “A Modern History of Fiscal Prudence and Profligacy”, IMF Working Papers 13/5, International Monetary Fund.
Minea, Alexandru, and Antoine Parent (2012), “Is High Public Debt Always Harmful to Economic Growth? Reinhart and Rogoff and Some Complex Nonlinearities”, Working Papers 8, Association Francaise de Cliometrie.
Padoan, Pier Carlo, Urban Sila, and Paul van den Noord (2012), “Avoid-ing Debt Traps: Financial Backstops and Structural Reforms”, OECD Eco-nomics Department Working Papers 976, OECD Publishing.
Panizza, Ugo, and Andrea Filippo Presbitero (2012), “Public Debt and Economic Growth: Is There a Causal Effect?”, Mo.Fi.R. Working Papers 65.
Panizza, Ugo, and Andrea Filippo Presbitero (2013), “Public Debt and Eco-nomic Growth, One More Time”, VoxEU.org, available at: http://www.voxeu.org/article/public-debt-and-economic-growth-one-more-time.
Perotti, Roberto (2012), “The ‘Austerity Myth’: Gain without Pain?”, in: Fiscal Policy after the Financial Crisis, NBER Chapters. National Bureau of Economic Research, Inc.
Presbitero, Andrea F. (2012), “Total Public Debt and Growth in Developing Countries”, European Journal of Development Research, 24(4), pp. 606–626.
Ramey, Garey, and Valerie A Ramey (1995), “Cross-Country Evidence on the Link between Volatility and Growth”, American Economic Review, 85(5): pp. 1138–1151.
Ramey, Valerie A. (2012), “Discussion of Fiscal Policy in a Depressed Economy by B. J. DeLong, and L. H. Summers”, Brookings Papers on Economic Activity.
Reinhart, Carmen M., Vincent R. Reinhart, and Kenneth S. Rogoff (2012), “Public Debt Overhangs: Advanced-Economy Episodes since 1800”, Journal of Economic Perspectives, 26(3), pp. 69–86.
204 Panizza /Presbitero
Swiss Journal of Economics and Statistics, 2013, Vol. 149 (2)
Reinhart, Carmen M., and Kenneth S. Rogoff (2010), “Growth in a Time of Debt”, American Economic Review, 100(2), pp. 573–578.
Reinhart, Carmen M., and Kenneth S. Rogoff (2011), “From Financial Crash to Debt Crisis”, American Economic Review, 101(5), pp. 1676–1706.
Rodrik, Dani (2008), “The Real Exchange Rate and Economic Growth”, Brook-ings Papers on Economic Activity, 39(2 (Fall)), pp. 365–439.
Roodman, David (2009), “A Note on the Theme of too Many Instruments”, Oxford Bulletin of Economics and Statistics, 71(1), pp. 135–158.
Sachs, Jeffrey D. (1989), “The Debt Overhang of Developing Countries”, in: Guillermo A. Calvo, Ronald Findlay, Pentti Kouri, and Jorge Braga de Macedo (eds.), Debt, Stabilization and Development. Basil Blackwell, Oxford.
SUMMARY
This paper surveys the recent literature on the links between public debt and economic growth in advanced economies. We find that theoretical models yield ambiguous results. Whether high levels of public debt have a negative effect on long-run growth is thus an empirical question. While many papers have found a negative correlation between debt and growth, our reading of the empirical literature is that there is no paper that can make a strong case for a causal rela-tionship going from debt to economic growth. We also find that the presence of thresholds and, more in general, of a non-monotone relationship between debt and growth is not robust to small changes in data coverage and empirical tech-niques. We conclude with a discussion of the challenges involved in measuring and defining public debt and some suggestions for future research which, in our view, should emphasize cross-country heterogeneity.