public and environmental health microbiology …547418/uq547418_oa.pdf · public and environmental...
TRANSCRIPT

Cross-Comparison of HumanWastewater-Associated MolecularMarkers in Relation to Fecal IndicatorBacteria and Enteric Viruses inRecreational Beach Waters
B. Hughes,a,b D. J. Beale,b P. G. Dennis,a S. Cook,b W. Ahmedb
School of Agriculture and Food Sciences, The University of Queensland, St. Lucia, Queensland, Australiaa;CSIRO Land and Water, Ecosciences Precinct, Brisbane, Queensland, Australiab
ABSTRACT Detection of human wastewater contamination in recreational waters is ofcritical importance to regulators due to the risks posed to public health. To identify suchrisks, human wastewater-associated microbial source tracking (MST) markers have beendeveloped. At present, however, a greater understanding of the suitability of thesemarkers for the detection of diluted human wastewater in environmental waters is nec-essary to predict risk. Here, we compared the process limit of detection (PLOD) and pro-cess limit of quantification (PLOQ) of six human wastewater-associated MST markers(Bacteroides HF183 [HF183], Escherichia coli H8 [EC H8], Methanobrevibacter smithii nifH,human adenovirus [HAdV], human polyomavirus [HPyV], and pepper mild mottle virus[PMMoV]) in relation to a fecal indicator bacterium (FIB), Enterococcus sp. 23S rRNA (ENT23S), and three enteric viruses (human adenovirus serotypes 40/41 [HAdV 40/41], humannorovirus [HNoV], and human enterovirus [EV]) in beach water samples seeded with rawand secondary-treated wastewater. Among the six MST markers tested, HF183 was themost sensitive measure of human fecal pollution and was quantifiable up to dilutions of10�6 and 10�4 for beach water samples seeded with raw and secondary-treated waste-water, respectively. Other markers and enteric viruses were detected at various dilutions(10�1 to 10�5). These MST markers, FIB, and enteric viruses were then quantified inbeach water (n � 12) and sand samples (n � 12) from South East Queensland (SEQ),Australia, to estimate the levels of human fecal pollution. Of the 12 sites examined,beach water and sand samples from several sites had quantifiable concentrations ofHF183 and PMMoV markers. Overall, our results indicate that while HF183 is the mostsensitive measure of human fecal pollution, it should be used in conjunction with a con-ferring viral marker to avoid overestimating the risk of gastrointestinal illness.
IMPORTANCE MST is an effective tool to help utilities and regulators improve recre-ational water quality around the globe. Human fecal pollution poses significant pub-lic health risks compared to animal fecal pollution. Several human wastewater-associated markers have been developed and used for MST field studies. However, ahead-to-head comparison in terms of their performance to detect diluted human fe-cal pollution in recreational water is lacking. In this study, we cross-compared theperformance of six human wastewater-associated markers in relation to FIB and en-teric viruses in beach water samples seeded with raw and secondary-treated waste-water. The results of this study will provide guidance to regulators and utilities onthe appropriate application of MST markers for tracking the sources of human fecalpollution in environmental waters and confer human health risks.
KEYWORDS microbial source tracking, human wastewater, fecal indicator bacteria,beach water, enteric viruses
Received 5 January 2017 Accepted 25January 2017
Accepted manuscript posted online 3February 2017
Citation Hughes B, Beale DJ, Dennis PG, CookS, Ahmed W. 2017. Cross-comparison ofhuman wastewater-associated molecularmarkers in relation to fecal indicator bacteriaand enteric viruses in recreational beachwaters. Appl Environ Microbiol 83:e00028-17.https://doi.org/10.1128/AEM.00028-17.
Editor Donald W. Schaffner, Rutgers, The StateUniversity of New Jersey
Copyright © 2017 American Society forMicrobiology. All Rights Reserved.
Address correspondence to W. Ahmed,[email protected].
PUBLIC AND ENVIRONMENTALHEALTH MICROBIOLOGY
crossm
April 2017 Volume 83 Issue 8 e00028-17 aem.asm.org 1Applied and Environmental Microbiology
on June 14, 2017 by UQ
Libraryhttp://aem
.asm.org/
Dow
nloaded from

Recreational water bodies polluted with raw and inadequately treated wastewatercan pose a significant risk to human health due to the presence of enteric
pathogens (1–3). Accidental ingestion or inhalation of such polluted waters can causea variety of enteric and nonenteric illnesses in swimmers and other recreational waterusers (4). Raw and treated wastewater can be released into the waterways fromdefective wastewater treatment plants (WWTPs) (5), broken sewage pipes, malfunc-tioning septic systems (6), stormwater runoff (7), and during extreme weather events,such as flooding (8). Outbreaks of gastroenteritis in Australia from recreational waterexposure are far more common than those attributed to drinking water. In Australia, 42reported gastroenteritis outbreaks linked to recreational water use were reportedbetween 2001 and 2007, compared to 10 outbreaks that were linked to drinking waterconsumption (9). Therefore, the microbiological quality of recreational waters is ofconcern to water quality regulators and health departments.
Direct monitoring of pathogens in recreational waters can provide valuable infor-mation on the potential health risks. However, pathogen distribution and abundancecan be highly varied due to source and receiving waters, making the direct monitoringapproach impractical and uneconomical. Escherichia coli and Enterococcus spp. havepreviously been used as fecal indicator bacteria (FIB), and based on their concentra-tions, guideline values have been developed by the water quality regulators to assessthe human health risk. However, a shortcoming of this form of monitoring is thatconcentrations of FIB above the guideline values do not always indicate the presenceof pathogens (10, 11). Another significant shortcoming of FIB monitoring is that theirpresence in a waterbody does not provide information about whether they originatedfrom animal or human feces, thus greatly hindering remediation efforts (12).
The advent of microbial source tracking (MST) tools has led to the development ofmore efficient water quality monitoring programs (1, 3, 7, 11). MST tools have the abilityto rapidly quantify the host-associated genes (known as molecular markers) found inbacteria, protozoa, and viruses from the feces of various animal species, includinghumans. Commonly used human wastewater-associated markers include the Bacte-roides HF183 (HF183) (12), the nifH marker from Methanobrevibacter smithii (13), and therecently developed E. coli H8 (EC H8) markers (14, 15). Viral markers have also receivedsignificant attention due to their high host association. These viral markers includehuman adenovirus (HAdV), human polyomavirus (HPyV), and a plant virus, the peppermild mottle virus (PMMoV) (11, 16, 17). Host prevalence and host specificity are oftenconsidered the two most important performance characteristics of MST markers. Non-specific (found in nontarget hosts) and nonprevalent (rare) markers tend to yieldfalse-positive or -negative results in field studies (18). Several studies have determinedthe host prevalence and specificity of the HF183 (19), EC H8 (14), nifH (20), HAdV (21),HPyV (22), and PMMoV (17) markers by analyzing fecal and wastewater samples fromvarious animals. The high host prevalence and specificity values of the aforementionedmarkers support their potential for human fecal pollution tracking. Limited information,however, is available on the assay process limit of detection (PLOD) or process limit ofquantification (PLOQ) for these markers to detect human wastewater pollution inrecreational waters. The PLOD and PLOQ determine the smallest volume of wastewaterthat can be reliably detected and quantified, respectively, after the sample is subjectedto filtration, DNA/RNA extraction, and quantitative PCR (qPCR) analysis. The PLODassessment of the HF183 (3) and PMMoV markers (23) has been undertaken in theUnited States. However, a comparative study investigating the PLOD and PLOQ of themultiple markers simultaneously in relation to FIB and enteric viruses has not yet beenreported.
In this study, we cross-compared the PLOD and PLOQ of six human wastewater-associated MST markers (EC H8, HF183, nifH, HAdV, HPyV, and PMMoV) in beach watersamples seeded with raw and secondary-treated wastewater using qPCR assays. Inaddition, the PLOD and PLOQ values of FIB (Enterococcus sp. 23S rRNA [ENT 23S]) andenteric viruses (HAdV 40/41, human norovirus [HNoV)] genotype II [GII], and enterovirus[EV]) were also determined in parallel to MST markers. This was done to identify the
Hughes et al. Applied and Environmental Microbiology
April 2017 Volume 83 Issue 8 e00028-17 aem.asm.org 2
on June 14, 2017 by UQ
Libraryhttp://aem
.asm.org/
Dow
nloaded from
most suitable marker(s) of human fecal pollution and their occurrence in relation to FIBand enteric viruses in a scenario where beach water samples are amended with variousamount of fresh raw and secondary-treated wastewater. We also determined to whatextent these FIB, MST markers, and enteric viruses are present in ambient recreationalbeach water and sand samples from South East Queensland (SEQ), Australia, to under-stand the health risks associated with human fecal pollution.
RESULTSqPCR performance characteristics. The qPCR standards had a linear range of
quantification from 3 �106 to 3 copies per 3 �l of DNA extracts. The amplificationefficiencies, correlation coefficients, and slope were determined by analyzing thestandards. The amplification efficiencies ranged from 81.2 to 119%. The correlationcoefficient (r2) ranged from 0.921 to 1.00. The slope ranged from �2.931 to �3.872. TheqPCR performance characteristic ranges were within the prescribed Minimum Informa-tion for Publication of Quantitative Real-Time PCR Experiments (MIQE) guidelines (24).The qPCR performance characteristics for the individual assays are shown in Table S2.
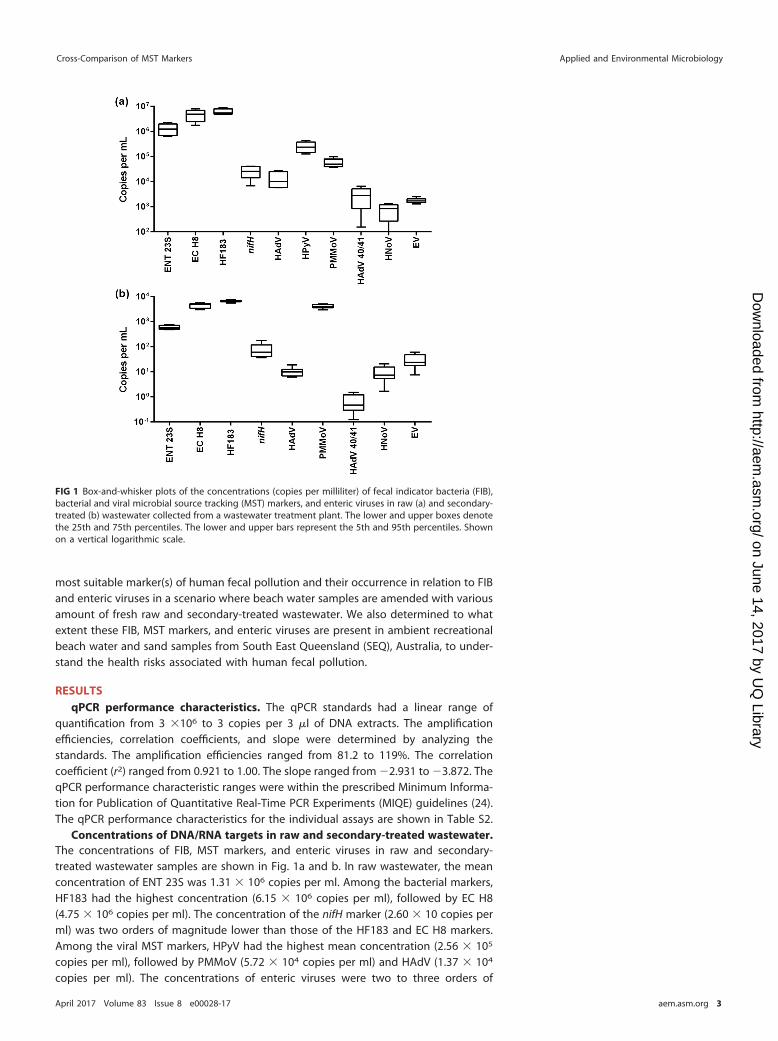
Concentrations of DNA/RNA targets in raw and secondary-treated wastewater.The concentrations of FIB, MST markers, and enteric viruses in raw and secondary-treated wastewater samples are shown in Fig. 1a and b. In raw wastewater, the meanconcentration of ENT 23S was 1.31 � 106 copies per ml. Among the bacterial markers,HF183 had the highest concentration (6.15 � 106 copies per ml), followed by EC H8(4.75 � 106 copies per ml). The concentration of the nifH marker (2.60 � 10 copies perml) was two orders of magnitude lower than those of the HF183 and EC H8 markers.Among the viral MST markers, HPyV had the highest mean concentration (2.56 � 105
copies per ml), followed by PMMoV (5.72 � 104 copies per ml) and HAdV (1.37 � 104
copies per ml). The concentrations of enteric viruses were two to three orders of
FIG 1 Box-and-whisker plots of the concentrations (copies per milliliter) of fecal indicator bacteria (FIB),bacterial and viral microbial source tracking (MST) markers, and enteric viruses in raw (a) and secondary-treated (b) wastewater collected from a wastewater treatment plant. The lower and upper boxes denotethe 25th and 75th percentiles. The lower and upper bars represent the 5th and 95th percentiles. Shownon a vertical logarithmic scale.
Cross-Comparison of MST Markers Applied and Environmental Microbiology
April 2017 Volume 83 Issue 8 e00028-17 aem.asm.org 3
on June 14, 2017 by UQ
Libraryhttp://aem
.asm.org/
Dow
nloaded from

magnitude lower than those of the FIB and MST markers. Among the three entericviruses tested, HAdV 40/41 (2.99 � 103 copies per ml) had the highest concentration,followed by EV (1.79 � 103 copies per ml) and HNoV (9.66 � 102 copies per ml).
The ENT 23S concentration was 5.90 � 102 copies per ml in secondary-treatedwastewater. Similarly to raw wastewater, the HF183 had the highest mean concentra-tion (6.53 � 103 copies per ml), followed by EC H8 (4.32 � 103 copies per ml). The nifHmarker concentration in secondary-treated wastewater (7.89 � 101 copies per ml)was again two orders of magnitude lower than those of the HF183 and EC H8markers. In contrast to raw wastewater, PMMoV had the highest mean concentra-tion (4.11 � 103 copies per ml), followed by HAdV (1.04 � 101 copies per ml) in thesecondary-treated wastewater. Notably, the HPyV marker was below the PLOD insecondary-treated wastewater and therefore is not shown in Fig. 1b. Dissimilar tothe concentration levels of enteric viruses in raw wastewater, HAdV 40/41 (0.70copies per ml) had the lowest concentration, followed by HNoV (9.62 copies per ml)and EV (2.95 � 101 copies per ml).
The Kruskal-Wallis one-way analysis of variance (ANOVA) was undertaken to deter-mine if there are any significant differences in the target concentrations in raw andsecondary-treated wastewater samples. Dunn’s multiple comparisons posttest indi-cated that the concentrations of ENT 23S in raw wastewater were significantly differentfrom those of EC H8 and HF183 (P � 0.05). The concentrations of the EC H8 and theHF183 markers were significantly different (both P � 0.05) from those of other markersand enteric viruses. The concentrations of ENT 23S in secondary-treated wastewaterwere significantly different from those of the EC H8, HF183, and PMMoV markers. EC H8concentrations were significantly different from all other targets except PMMoV. TheHF183 concentration in secondary-treated wastewater was significantly different fromthose of the other targets. The concentrations of PMMoV were significantly differentfrom the concentrations of nifH, HAdV, HAdV 40/41, HNoV, and EV.
Correlations among DNA/RNA targets in raw and secondary-treated wastewa-ter. In raw wastewater, there was a highly strong correlation (r � 0.7; P � 0.05) amongENT 23S, EC H8, HF183, nifH, HAdV, HPyV, PMMoV, and HAdV 40/41. However, HPyV (r �
0.68; P � 0.05) and PMMoV (r � 0.60; P � 0.05) moderately correlated with the bacterialMST marker nifH. EV moderately or poorly correlated with other targets, while HNoVshowed mostly negative correlations with all other DNA and RNA targets tested in thisstudy, except EC H8 (Fig. 2a). In secondary-treated wastewater, the abundance of FIB,MST markers, and enteric viruses did not show strong correlations like those with rawwastewater (Fig. 2b). Only five positive strong correlations were observed between ENT23S and nifH (r � 0.93; P � 0.05), ENT 23S and HNoV (r � 0.71; P � 0.05), EC H8 andPMMoV (r � 0.87; P � 0.05), HF183 and HNoV (r � 0.94; P � 0.05), and nifH and HNoV(r � 0.89). Moderate correlations were observed between ENT 23S and HAdV (r � 0.52;P � 0.05), HF183 and nifH (r � 0.43; P � 0.05), HAdV and nifH (r � 0.67; P � 0.05), andHAdV 40/41 and EV (r � 0.45; P � 0.05). The remaining pairwise correlations amongDNA and RNA targets were either poor or negative (Fig. 2b). Since the concentration ofthe HPyV marker was below the PLOD in secondary-treated wastewater, this markerwas excluded from the correlation analysis.
PLOD and PLOQ of DNA/RNA targets in serially diluted samples of filteredbeach water seeded with raw wastewater. Thirty percent of the beach water samplesseeded with raw wastewater had PCR inhibitors. A 10-fold serial dilution relieved PCRinhibition. The PLOD, PLOQ, and concentrations of all DNA and RNA targets in seriallydiluted filtered beach water samples seeded with raw wastewater are shown in Table1. The concentration of ENT 23S was 3.2 � 101 copies per 3 �l of DNA at the dilutionlevel of 10�5. Among the MST markers, HF183 was quantifiable (5.2 � 101 copies per3 �l of DNA) at the dilution level of 10�6. EC H8 was the second most sensitive markerand was quantifiable (1.0 � 102 copies per 3 �l of DNA) at the dilution level of 10�4.HPyV and PMMoV were quantifiable at the dilution level of 10�3, while the HAdV andnifH markers were quantifiable at the dilution 10�2. HAdV 40/41 and EV were quanti-fiable up to a dilution level of 10�2. HNoV were detected, but the level was below the
Hughes et al. Applied and Environmental Microbiology
April 2017 Volume 83 Issue 8 e00028-17 aem.asm.org 4
on June 14, 2017 by UQ
Libraryhttp://aem
.asm.org/
Dow
nloaded from

FIG 2 Correlations (Spearman’s rank correlation) among fecal indicator bacteria, microbial sourcetracking (MST) markers, and enteric viruses in raw wastewater (a) and secondary-treated wastewater (b).The Spearman’s r values are presented in the box. Green boxes represent positive and red boxesrepresent negative correlations.
Cross-Comparison of MST Markers Applied and Environmental Microbiology
April 2017 Volume 83 Issue 8 e00028-17 aem.asm.org 5
on June 14, 2017 by UQ
Libraryhttp://aem
.asm.org/
Dow
nloaded from

TAB
LE1
Con
cent
ratio
nsof
feca
lin
dica
tor
bac
teria
,bac
teria
lan
dvi
ral
mic
rob
ial
sour
cetr
acki
ngm
arke
rs,a
nden
teric
viru
ses
per
3�
lof
DN
A/R
NA
extr
acte
dfr
omb
each
wat
ersa
mp
les
seed
edw
ithra
ww
aste
wat
er
Dilu
tion
and
corr
esp
ond
ing
amt
ofra
ww
aste
wat
erin
tob
each
wat
ersa
mp
les
Con
cn(m
ean
�SD
)(p
er3
�l
ofD
NA
/RN
A)
ina :
ENT
23S
(FIB
)
Bac
teri
alor
vira
lM
STm
arke
rEn
teri
cvi
rus
ECH
8H
F183
nifH
HA
dV
HPy
VPM
MoV
HA
dV
40/4
1H
NoV
EV
3m
l3.
3�
105
�1.
3�
105
4.2
�10
5�
5.2
�10
41.
0�
106
�1.
1�
105
2.7
�10
3�
8.3
�10
22.
0�
103
�3.
7�
102
4.4
�10
4�
5.8
�10
32.
6�
103
�2.
8�
102
3.1
�10
2�
1.7
�10
2�
PLO
Q5.
7�
102
�2.
6�
102
10�
1(3
00�
l)6.
1�
104
�1.
3�
104
4.3
�10
4�
9.8
�10
32.
2�
105
�6.
0�
104
3.5
�10
2�
6.0
�10
12.
3�
102
�1.
5�
102
7.5
�10
3�
6.8
�10
36.
0�
102
�1.
6�
102
9.4
�10
1�
4.1
�10
1�
PLO
D7.
0�
101
�3.
1�
101
10�
2(3
0�
l)2.
8�
103
�2.
3�
103
1.6
�10
3�
1.1
�10
31.
1�
104
�7.
4�
103
1.3
�10
1�
1.2
�10
11.
1�
101
�9.
9�
100
8.0
�10
2�
3.2
�10
11.
4�
102
�5.
2�
101
�PL
OD
�PL
OD
�PL
OD
10�
3(3
�l)
5.7
�10
2�
3.7
�10
23.
8�
102
�9.
3�
101
2.9
�10
3�
8.1
�10
2�
PLO
D�
PLO
D9.
1�
101
�1.
4�
101
4.9
�10
1�
2.4
�10
1�
PLO
D�
PLO
D�
PLO
D10
�4
(300
nl)
1.3
�10
2�
4.4
�10
11.
0�
102
�4.
3�
101
6.7
�10
2�
3.3
�10
2�
PLO
D�
PLO
D�
PLO
D�
PLO
D�
PLO
D�
PLO
D�
PLO
D10
�5
(30
nl)
3.2
�10
1�
1.5
�10
1�
PLO
D2.
9�
102
�2.
1�
102
�PL
OD
�PL
OD
�PL
OD
�PL
OD
�PL
OD
�PL
OD
�PL
OD
10�
6(3
nl)
�PL
OD
�PL
OD
5.2
�10
1�
7.9
�10
1�
PLO
D�
PLO
D�
PLO
D�
PLO
D�
PLO
D�
PLO
D�
PLO
D
aFI
B,fe
cal
indi
cato
rb
acte
ria;M
ST,m
icro
bia
lso
urce
trac
king
;PLO
Q,p
roce
sslim
itof
quan
tifica
tion;
PLO
D,p
roce
sslim
itof
dete
ctio
n.
Hughes et al. Applied and Environmental Microbiology
April 2017 Volume 83 Issue 8 e00028-17 aem.asm.org 6
on June 14, 2017 by UQ
Libraryhttp://aem
.asm.org/
Dow
nloaded from

PLOQ when 3 ml of raw wastewater was seeded into the beach water sample and couldnot be detected at the dilution level of 10�1.
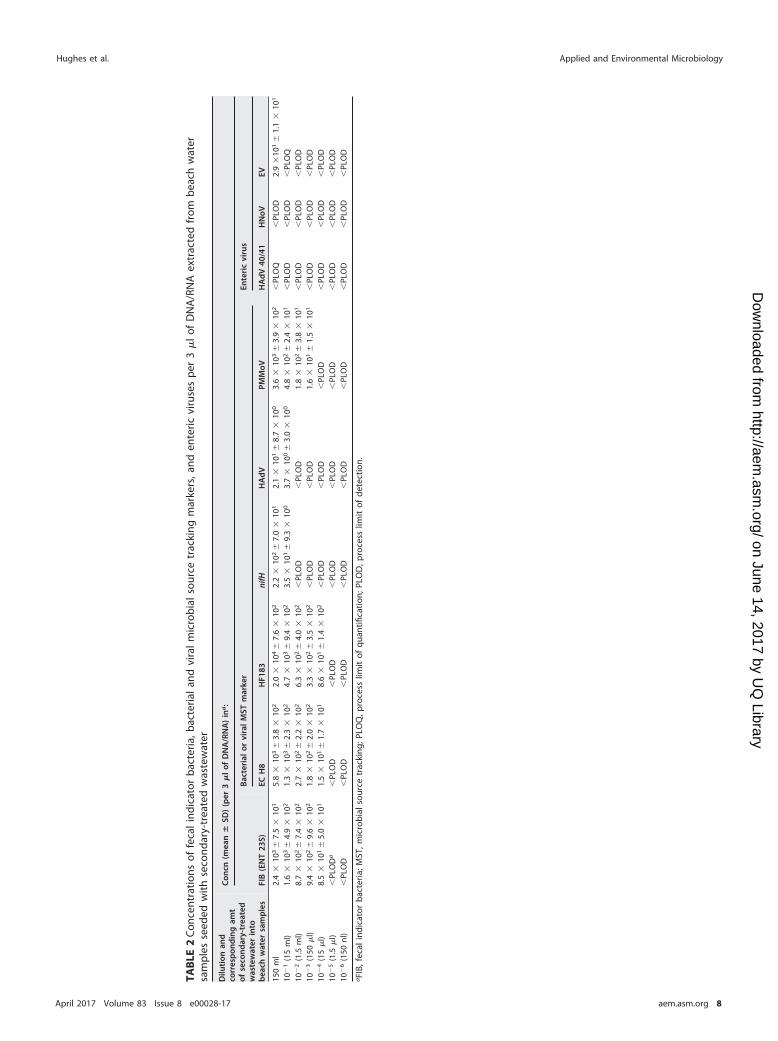
PLOD and PLOQ of DNA/RNA targets in serially diluted samples of filteredbeach water seeded with secondary-treated wastewater. In all, 37.5% of the beachwater samples seeded with secondary-treated wastewater had PCR inhibitors. A 10-foldserial dilution relieved PCR inhibition. The PLOD, PLOQ, and concentrations of all DNAand RNA targets in serially diluted filtered beach water samples seeded with secondary-treated wastewater are shown in Table 2. ENT 23S was quantifiable (8.5 � 101 copiesper 3 �l of DNA) up to a dilution level of 10�4. Among the MST markers, both EC H8(1.5 � 101 copies per 3 �l of DNA) and HF183 (8.6 � 101 copies per 3 �l of DNA) werequantifiable up to a dilution level of 10�4. PMMoV was quantifiable (1.6 � 101 copiesper 3 �l of DNA) to dilution level of 10�3. The HAdV and nifH markers were quantifiableup to a dilution level of 10�1. Human enteric virus and HAdV 40/41 were detectable butnonquantifiable in 150 ml of seeded secondary-treated wastewater. HNoV was belowthe PLOD and EV was quantifiable in a 150-ml seeded secondary-treated wastewatersample. However, at dilution 10�1, it fell below the PLOQ, and at dilution 10�2, it wasbelow the PLOD.
Concentrations of culturable FIB in recreational beach water samples in SEQ.The E. coli and Enterococcus species concentrations in recreational beach water samplesare shown in Fig. 3. At each site except Paradise Point and Southport, the Enterococcusspecies concentrations exceeded the Australian and New Zealand Environment andConservation Council (ANZECC) guidelines (�35 CFU per 100 ml for primary recre-ational water). The highest concentration (165 CFU per 100 ml) of Enterococcus spp. wasfound at Deception Bay. For E. coli, each site except Jabiru Island (151 CFU per 100 ml)had a concentration below the recommended ANZECC guideline (�150 CFU per 100ml). Using Spearman’s rank correlation, it was determined that the E. coli and Entero-coccus species concentrations were significantly correlated with each other in thesesites (P � 0.05).
MST markers and enteric viruses in beach water and sand samples in SEQ. In all,41.6% of the 24 beach water (n � 12) and sand (n � 12) samples had PCR inhibition.A 10-fold serial dilution was made for these samples to relieve PCR inhibition. Alluninhibited and serially diluted samples were used in analysis. The prevalence andconcentrations of FIB, MST markers, and enteric viruses in the 12 recreational beachsites from SEQ are shown in Table 3. ENT 23S was detected in 91.6% (11 of 12) of therecreational water samples. The highest concentration of ENT 23S, at 3.8 � 103 per 100ml of water, was found at Deception Bay. Fifty percent of the beach water samples hadquantifiable concentrations of the HF183 marker, and the concentration ranged from1.8 � 103 to 1.3 � 102 copies per 100 ml of water. PMMoV was quantifiable in 33.3%of the water samples, and the concentrations ranged from 3.6 � 103 to 8.6 � 103 copiesper 100 ml of water. HAdV was detected (1 of 3 qPCR replicates was positive) in thewater sample from Pandanus Beach. However, the level of HAdV in this sample wasbelow the PLOQ. EV was detected at one site (Southport), but it was below the PLOQ.The MST markers EC H8, nifH, HPyV, and enteric viruses HAdV 40/41 and HNoV couldnot be detected in any of the recreational water samples. For the sand samples, ENT 23Swas detected and quantifiable in 83.3% of the sites. HF183 was detected and quanti-fiable at 33 and 25% of the sand samples, respectively. HAdV was not detected in sandsamples. PMMoV and EV were not tested for in the sand samples.
DISCUSSION
Human wastewater is known to contain �100 pathogenic viruses, some with theability to cause disease and illness in humans at extremely low dosages (25). Thus, thepollution of recreational water with human wastewater poses a more significant risk tohumans than animal fecal wastewater (26). This has led to the development of MSTtools which utilize molecular markers to inform targeted solutions to minimize fecalpollution in water. Only a few studies compared or determined the PLOD (defined asthe smallest volume of wastewater that could be subjected to the complete sample
Cross-Comparison of MST Markers Applied and Environmental Microbiology
April 2017 Volume 83 Issue 8 e00028-17 aem.asm.org 7
on June 14, 2017 by UQ
Libraryhttp://aem
.asm.org/
Dow
nloaded from
TAB
LE2
Con
cent
ratio
nsof
feca
lin
dica
tor
bac
teria
,bac
teria
lan
dvi
ral
mic
rob
ial
sour
cetr
acki
ngm
arke
rs,a
nden
teric
viru
ses
per
3�
lof
DN
A/R
NA
extr
acte
dfr
omb
each
wat
ersa
mp
les
seed
edw
ithse
cond
ary-
trea
ted
was
tew
ater
Dilu
tion
and
corr
esp
ond
ing
amt
ofse
con
dar
y-tr
eate
dw
aste
wat
erin
tob
each
wat
ersa
mp
les
Con
cn(m
ean
�SD
)(p
er3
�l
ofD
NA
/RN
A)
ina
:
FIB
(EN
T23
S)
Bac
teri
alor
vira
lM
STm
arke
rEn
teri
cvi
rus
ECH
8H
F183
nifH
HA
dV
PMM
oVH
Ad
V40
/41
HN
oVEV
150
ml
2.4
�10
3�
7.5
�10
15.
8�
103
�3.
8�
102
2.0
�10
4�
7.6
�10
22.
2�
102
�7.
0�
101
2.1
�10
1�
8.7
�10
03.
6�
103
�3.
9�
102
�PL
OQ
�PL
OD
2.9
�10
1�
1.1
�10
1
10�
1(1
5m
l)1.
6�
103
�4.
9�
102
1.3
�10
3�
2.3
�10
24.
7�
103
�9.
4�
102
3.5
�10
1�
9.3
�10
03.
7�
100
�3.
0�
100
4.8
�10
2�
2.4
�10
1�
PLO
D�
PLO
D�
PLO
Q10
�2
(1.5
ml)
8.7
�10
2�
7.4
�10
22.
7�
102
�2.
2�
102
6.3
�10
2�
4.0
�10
2�
PLO
D�
PLO
D1.
8�
102
�3.
8�
101
�PL
OD
�PL
OD
�PL
OD
10�
3(1
50�
l)9.
4�
102
�9.
6�
102
1.8
�10
2�
2.0
�10
23.
3�
102
�3.
5�
102
�PL
OD
�PL
OD
1.6
�10
1�
1.5
�10
1�
PLO
D�
PLO
D�
PLO
D10
�4
(15
�l)
8.5
�10
1�
5.0
�10
11.
5�
101
�1.
7�
101
8.6
�10
1�
1.4
�10
2�
PLO
D�
PLO
D�
PLO
D�
PLO
D�
PLO
D�
PLO
D10
�5
(1.5
�l)
�PL
OD
a�
PLO
D�
PLO
D�
PLO
D�
PLO
D�
PLO
D�
PLO
D�
PLO
D�
PLO
D10
�6
(150
nl)
�PL
OD
�PL
OD
�PL
OD
�PL
OD
�PL
OD
�PL
OD
�PL
OD
�PL
OD
�PL
OD
aFI
B,fe
cal
indi
cato
rb
acte
ria;M
ST,m
icro
bia
lso
urce
trac
king
;PLO
Q,p
roce
sslim
itof
quan
tifica
tion;
PLO
D,p
roce
sslim
itof
dete
ctio
n.
Hughes et al. Applied and Environmental Microbiology
April 2017 Volume 83 Issue 8 e00028-17 aem.asm.org 8
on June 14, 2017 by UQ
Libraryhttp://aem
.asm.org/
Dow
nloaded from

preparation process, including dilution, filtration, and DNA/RNA extraction, and still bereliably detected in qPCR) of molecular markers to detect human wastewater inenvironmental water samples. For example, Ahmed et al. (27) compared the PLODvalues of the HF183, Enterococcus faecium, HAdV esp, and HPyV in fresh and seawatersamples in Australia. While in Florida, USA, Staley et al. (3) determined the PLOD valuesfor HF183 and HPyV in various types of surface water samples. Despite experimentaldifferences, both studies found HF183 to be the most sensitive marker of human fecalpollution. The potential of PMMoV as a human wastewater marker has also beenreported in a recent study, when its PLOD in coastal waters was investigated bySymonds et al. (23). The limited data highlight the knowledge gap that this study aimedto address by undertaking a large-scale cross comparison of the PLOD/PLOQ values forsix human-wastewater-associated MST markers in relation to FIB and enteric viruses inbeach water samples seeded with fresh raw and secondary-treated wastewater.
Before the seeding experiment, the concentrations of all DNA and RNA targets weremeasured in raw and secondary wastewater samples using qPCR assays. The HF183concentrations were the highest among all targets in both raw and secondary-treatedwastewater. The mean concentrations of the HF183 obtained in this study were similarto the mean concentrations of HF183 found in human wastewater around the globe(12). Limited information is available on the concentration of the EC H8 marker inhuman wastewater. However, in a previous study, we reported that approximately 50%of E. coli isolates in human wastewater carried the EC H8 marker (14). Despite a lack ofcomparative information, the results from this study indicated that the concentrationsof EC H8 in raw wastewater could be quite high, being only slightly less than theconcentration of the HF183. These high levels indicated that EC H8 may be a suitablemarker for tracking human wastewater pollution in environmental waters.
The concentrations of HAdV and HPyV in raw and secondary-treated wastewaterwere similar to those reported in other published studies (28–31). Some researchers
FIG 3 Concentrations of Escherichia coli and Enterococcus spp. in water samples collected from 12recreational beaches in South East Queensland, Australia. The dashed line represents guideline value (35CFU per 100 ml) for Enterococcus spp. and the solid line represents the guideline value (150 CFU per 100ml) for E. coli.
Cross-Comparison of MST Markers Applied and Environmental Microbiology
April 2017 Volume 83 Issue 8 e00028-17 aem.asm.org 9
on June 14, 2017 by UQ
Libraryhttp://aem
.asm.org/
Dow
nloaded from

reported that PMMoV has the potential to be an overly sensitive marker, due to its highconcentrations in human wastewater (17, 32, 33). While this presents an advantage forthe PMMoV as a sensitive marker, its presence may also overestimate risk (23). A studyby Rosario et al. (17) determined the average concentrations of PMMoV at a FloridaKeys WWTP over a 2-week period and found that levels ranged from 8.04 � 105 to1.9 � 106 copies per ml in raw wastewater and 2.02 � 104 to 1.01 � 106 copies per mlin treated wastewater. The levels of PMMoV found in this study were 1 to 2 orders ofmagnitude lower in raw wastewater and 1 to 3 orders of magnitude lower in secondary-treated wastewater than those reported by Rosario et al. (17), thus indicating thatPMMoV may not be overly sensitive, as others have previously reported. HNoV can beexcreted in high quantities from infected individuals and has been detected at con-centrations of 200 copies per ml in raw wastewater (34). The result from this study(9.62 � 102 copies per ml of raw wastewater) was similar to that of the Hewitt andcolleagues study in New Zealand (34). The concentrations of HAdV 40/41 and EV in rawand secondary-treated wastewater were found to be similar to those previously re-ported (35–37).
The FIB, MST markers, and the enteric virus HAdV 40/41 had strong positivecorrelations in raw wastewater but largely weak correlations in secondary-treatedwastewater samples. Similar correlations between MST markers in raw wastewater havebeen reported among ENT 23S, HF183, HAdV, and HPyV (38). The lack of correlationwith secondary-treated wastewater is likely due to low and varied target concentrationsas a result of the treatment process.
In the raw wastewater seeding experiment, the PLOD of the HF183 marker wasremarkably low and was quantifiable to a dilution level of 10�6. Staley et al. (3) reportedsimilar results, with the quantification of HF183 to a dilution level of 10�6 in 500-mlambient water samples seeded with 5 ml of raw wastewater. EC H8 was the secondmost sensitive marker in terms of PLOD and was quantifiable at a dilution level of 10�5.Among the viral markers, PMMoV had the lowest PLOD and was quantifiable at a
TABLE 3 Prevalence and concentrations of ENT 23S, HF183, and enteric viruses in environmental water and sand samples collected from12 recreational beaches in South East Queensland, Australia
Sampling site Matrix
No. of positive samples/no. of samples tested (concn per 100 ml of water or per g of sand [wet wt])a
FIB (ENT 23S)
Bacterial or viral MST markerEnteric virus(EV)HF183 HAdV PMMoV
Breakwater Park Water 3/3 (1.2 � 103 � 6.5 � 102) �PLOD �PLOD 1/3 (�PLOQ) �PLODSand 3/3 (7.5 � 103 � 2.2 � 102) 2/3 (3.6 � 102) �PLOD NT NT
Bribie Island Water 2/3 (8.7 � 101) 2/3 (2.8 � 102) �PLOD �PLOD �PLODSand 3/3 (1.2 � 102 � 1.8 � 102) 1/3 (2.9 � 103) �PLOD NT NT
Deception Bay Water 3/3 (3.8 � 103 � 7.3 � 102) �PLOD �PLOD 1/3 (3.6 � 103) �PLODSand 3/3 (1.1 � 102 � 3.2 � 102) 3/3 (�PLOQ) �PLOD NT NT
Godwin Beach Water 1/3 (1.4 � 102) �PLOD �PLOD 1/3 (5.6 � 103) �PLODSand 3/3 (8.5 � 103 � 6.3 � 102) �PLOD �PLOD NT NT
Jabiru Island Water 3/3 (4.7 � 102 � 3.2 � 102) 3/3 (2.5 � 102 � 1.9 �102) �PLOD �PLOD �PLODSand 3/3 (3.7 � 103 � 4.5 � 102) �PLOD �PLOD NT NT
Labrador Water 1/3 (4.1 � 101) 1/3 (1.8 �103) �PLOD �PLOD �PLODSand 3/3 (4.4 � 103 � 2.4 � 102) �PLOD �PLOD NT NT
Pandanus Beach Water 2/3 (2.2 � 102) �PLOD 1/3 (�PLOQ) �PLOD �PLODSand 3/3 (2.1 � 104 � 1.0 � 104) �PLOD �PLOD NT NT
Paradise Point Water 2/3 (1.8 � 102) 2/3 (1.7 � 103) �PLOD �PLOD �PLODSand �PLODa �PLOD �PLOD NT NT
Sandstone Point Water 3/3 (3.3 � 102 � 1.8 � 102) �PLOD �PLOD �PLOD �PLODSand 2/3 (2.5 � 102) 1/3 (4.1 � 103) �PLOD NT NT
Scarborough Water 3/3 (3.3 � 102 � 9.5 � 101) 2/3 (2.5 � 102) �PLOD 1/3 (8.6 � 103) �PLODSand 3/3 (6.3 � 102 � 2.4 � 102) �PLOD �PLOD NT NT
Shorncliffe Water 2/3 (2.3 � 102) �PLOD �PLOD 2/3 (5.7 � 103) �PLODSand 3/3 (2.7 � 103 � 3.9 � 102) �PLOD �PLOD NT NT
Southport Water �PLOD 1/3 (1.3 � 102) �PLOD �PLOD 1/3 (�PLOQ)Sand 3/3 (8.1 � 103 � 2.0 � 103) �PLOD �PLOD NT NT
aFIB, fecal indicator bacteria; MST, microbial source tracking; PLOD, process limit of detection; PLOQ, process limit of quantification; NT, not tested.
Hughes et al. Applied and Environmental Microbiology
April 2017 Volume 83 Issue 8 e00028-17 aem.asm.org 10
on June 14, 2017 by UQ
Libraryhttp://aem
.asm.org/
Dow
nloaded from
dilution level of 10�3. PMMoV was three orders of magnitude less sensitive than theHF183 marker. A similar level of PMMoV detection (10�2) was reported in a recent studyin Florida, USA (23).
Due to the decreased concentration of targets in secondary-treated wastewater, thedetection and quantification of FIB and MST markers were not seen in the higherdilution levels, and the enteric viruses were not detectable in any diluted samples.Similarly to the raw wastewater, the HF183, EC H8, and PMMoV markers were detectedat dilution levels of 10�5, 10�5, and 10�3, respectively. The detection of FIB, MSTmarkers, and enteric viruses in these samples to such a high dilution level confirms thatpollution of recreational waters with secondary-treated wastewater may still representa risk to humans.
Overall, HF183, EC H8, and PMMoV were detected at high dilution levels (10�3 to10�6), but their presence at these dilutions was not directly indicative of human healthrisks because enteric viruses were not observed at a dilution level of �10�2. From theseresults, it can be assumed that while high concentrations of bacterial markers, such asHF183 and EC H8, in environmental waters can be indicative of human wastewaterpollution, their presence alone cannot be assumed to confer risk. When these markersare used alone, quantitative data must be reported to identify the magnitude of thepollution. We recommend that the HF183 or EC H8 marker be used for initial waste-water detection, followed by further testing with more specific viral MST markers, suchas PMMoV, HAdV, or HPyV, in decreasing order of preference. In this study, wedetermined the PLOD/PLOQ of targets in serially diluted beach water samples seededwith raw and secondary-treated wastewater. This may not be representative of a trueenvironmental sample that contains various background microflora. Therefore, theresults presented in this study should be interpreted with care, as it is possible that thePLOD/PLOQ of targets may be less sensitive for true environmental samples.
The application of enteric viruses for wastewater pollution monitoring could greatlyimprove the efficiency of monitoring procedures because risks could be directlyestimated based on viral concentrations. However, due to the vast abundance ofhuman enteric viruses, using only a few enteric viruses alone to confer risk is inadvis-able. Therefore, the use of multiple MST markers for wastewater detection, if possible,is still the preferred method for application to a real-world setting.
In this study, environmental water and sand samples from 12 recreational beacheswere collected and analyzed for the presence of the 10 DNA and RNA targets. Six of the12 sites had quantifiable concentrations of the HF183 marker, most likely due to theirproximity to stormwater drains. Four of the 12 sites also had quantifiable concentra-tions of PMMoV, highlighting the fact that stormwater drains may indeed be theprimary sources of human fecal pollution in these sites. The Scarborough site waspositive for two MST markers (HF183 and PMMoV), strongly suggesting the presence ofhuman wastewater pollution.
The three enteric viruses tested in this study (HAdV 40/41, HNoV, and EV) were notdetected above the PLOD at any of the sites. However, the presence of other entericviruses (not tested in this study) cannot be ruled out (25). Therefore, it is suggested thatfurther water quality monitoring of these sites and an exploratory quantitative micro-bial risk assessment (QMRA) should be performed to assess the risks associated with theuse of these recreational waters (3, 23). To expand on previous studies that have alsodetected MST markers in sands and sediments in the United States (39, 40), 12 sandsamples were analyzed for the presence of ENT 23S and five DNA markers. ENT 23S wasquantified in 83% of the sand samples, and HF183 was quantified at three sites. Theseresults indicated that SEQ recreational beach sands could harbor MST markers and bepotential reservoirs for enteric pathogens. Based on the results, we recommend thatthe microbiological quality of beach sand also needs to be monitored in SEQ. Thiswould allow for the establishment of guidelines to assess public health risks and wouldbe useful for implementing beach sanitation programs for beachgoers.
Several points uncovered in this study require further investigation. First, themajority of wastewater in Australia undergoes complete treatment, including chlorina-
Cross-Comparison of MST Markers Applied and Environmental Microbiology
April 2017 Volume 83 Issue 8 e00028-17 aem.asm.org 11
on June 14, 2017 by UQ
Libraryhttp://aem
.asm.org/
Dow
nloaded from

tion, before being released into the environment. As a result, the concentrations of MSTmarkers and enteric viruses are likely to be low, except in scenarios where treatmentplants fail due to extreme weather events (flooding), broken pipes, or illegal discharges.However, the concentration of MST markers in fully treated wastewater should beinvestigated to ensure that pathogen levels at wastewater outfalls do not presenthuman health risks. Second, sand samples from SEQ should be analyzed for thepresence of enteric viruses to better understand the associated risks. Last, this studywas conducted using fresh wastewater, which means the PLOD/PLOQ analysis of theMST markers and enteric viruses is based on the target concentrations that would likelyto be present immediately following a recent contamination event. However, as waterquality assessments are not always undertaken immediately following pollution events,the concentrations of MST markers in aged wastewater samples should also be inves-tigated. In addition, comparative inactivation studies of FIB, MST markers, and entericviruses in the water column and beach sands should be undertaken.
MATERIALS AND METHODSWastewater sampling and analysis. Composite fresh raw and secondary-treated wastewater
samples were collected from the primary influent and secondary settling tank of a wastewater treatmentplant (WWTP), respectively. The WWTP serves a population of approximately 250,000 people. Thetreatment process consists of primary treatment, a secondary treatment (activated sludge process), UVdisinfection, and chlorination prior to discharge in the Brisbane River. The secondary-treated wastewatersamples used in this study were collected before UV disinfection and chlorination. The wastewatersamples were collected at 8:00 a.m. and transported to the laboratory on ice. Upon arrival, the sampleswere stored at 4°C and processed within 3 h of collection.
To quantify the background concentrations of DNA targets (ENT 23S, HF183, EC H8, nifH, HAdV, HAdV40/41, and HPyV), triplicate 10-ml raw wastewater and 25-ml secondary-treated wastewater sampleswere filtered through negatively charged 47 mm, 0.45-�m-pore-size HA membranes (HAWP04700; MerckMillipore, Tokyo, Japan). For RNA targets (PMMoV, HNoV, and EV), triplicate 100-ml raw wastewater and250-ml secondary-treated wastewater samples were also filtered through negatively charged 47-mm,0.45-�m-pore-size HA membranes.
Beach water sampling for seeding experiments. For seeding experiments, beach water sampleswere collected from a recreational beach located in Redcliffe in SEQ. To the best of our knowledge, basedon a sanitary survey, these sites were not exposed to point or nonpoint sources of fecal pollution.Triplicate water samples from three sites (not shown in Fig. 4) were collected at a water depth ofapproximately 25 cm. Water samples were collected in sterile 10-liter containers and transported to thelaboratory. The samples were filtered through negatively charged 90-mm, 0.45-�m-pore-size HA mem-branes (HAWP09000; Merck Millipore, Tokyo, Japan). Following the filtration step, 100 ml of each watersample was filtered through 0.45-�m nitrocellulose membranes (Advantec, Tokyo, Japan), placed onChromocult coliform agar and enterococci agar (Merck, KGaA, Germany), and incubated at 37°C for 24h. No colonies were observed on the agar plates, indicating that the beach water samples collected forseeding experiment did not contain any FIB after filtration. To confirm the absence of background MSTmarkers that may affect the PLOD and PLOQ assessments, the samples (1 liter) were screened for HF183and HAdV. HF183 and HAdV were concentrated using a previously described method (11). First, the pHof each filtered beach water sample was lowered to 3.5 using 2.0 N HCl and then filtered throughnegatively charged 90 mm, 0.45-�m-pore-size HA membranes. The HF183 and HAdV qPCR assays wereperformed in a 20-�l reaction volume using 10 �l of SsoFast EvaGreen supermix (Bio-Rad Laboratories,CA, USA) (HF183) or 10 �l of SsoAdvanced universal probes supermix (Bio-Rad) (HAdV), 300 nM eachprimer (HF183), 200 nM each primer and probe (HAdV), and 3 �l of template DNA. The samples werenegative for HF183 and HAdV.
Wastewater seeding experiment. For DNA targets, 3 ml of raw wastewater was seeded into 297 mlof the filtered beach water samples collected from sites A to C. Similarly, 150 ml of secondary-treatedwastewater was seeded into 150 ml of the filtered beach water samples collected from sites A to C. Ahigher volume of secondary-treated wastewater was added to compensate for low target concentrationsin secondary-treated wastewater due to activated sludge process. Tenfold serial dilutions (10�1 to 10�6)were then made for all seeded samples. The pH of each sample was adjusted to 3.5 with 2.0 N HCl beforebeing filtered through negatively charged 47-mm, 0.45-�m-pore-size HA membranes.
For RNA targets, 3 ml of raw wastewater was seeded into 297 ml of the filtered beach water samplescollected from site A only. Similarly, 150 ml of secondary-treated wastewater was seeded into 150 ml ofthe filtered beach water samples collected from site A only. Tenfold serial dilutions (10�1 to 10�6) werethen made, followed by adjustment of the pH of each seeded sample to 3.5 with 2.0 N HCl. The sampleswere filtered through negatively charged 47-mm, 0.45-�m-pore-size HA membranes (HAWP04700; MerckMillipore, Tokyo, Japan).
qPCR standards. Standard curves for the nifH, HPyV, HAdV 40/41, PMMoV, HNoV, and EV qPCR assayswere constructed using synthesized plasmid DNA (pIDTSMART with ampicillin resistance [Integrated DNATechnologies, Coralville, IA, USA]). qPCR standards for ENT 23S and EC H8 were prepared from thegenomic DNA of Enterococcus faecalis ATCC 19433 and E. coli ATCC 23226. qPCR standards for HF183 and
Hughes et al. Applied and Environmental Microbiology
April 2017 Volume 83 Issue 8 e00028-17 aem.asm.org 12
on June 14, 2017 by UQ
Libraryhttp://aem
.asm.org/
Dow
nloaded from
HAdV were prepared from the plasmid DNA. The purified genomic or plasmid DNA was serially dilutedto create a standard ranging from 1 � 106 to 1 copy per �l of DNA. A 3-�l template from each serialdilution was used to prepare a standard curve for each qPCR assay. For each standard, the genomiccopies were plotted against the cycle number at which the fluorescence signal increased above thequantification cycle (Cq) value. The amplification efficiency (E) was determined by analysis of thestandards and was estimated from the slope of the standard curve to be E � 10�1/slope.
qPCR analysis. The primers and probes are shown in Table S1. Each qPCR amplification wasperformed separately for each target. EC H8 and HF183 qPCR amplifications were performed in a20-�l reaction mixture using 10 �l of SsoFast EvaGreen supermix (Bio-Rad Laboratories, CA, USA),400 nM each primer (EC H8 assay), 300 nM each primer (HF183 assay), and 3 �l of template DNA.To separate the specific products from the nonspecific products, including primer dimers, amelting-curve analysis was performed for EC H8 and HF183 assays. During melting-curve analysis,the temperature was increased from 65 to 95°C at 0.5°C increments. Melting-curve analysis showeda distinct peak at a temperature of 78.5°C � 0.5°C for HF183 and 92.0 � 0.5°C for EC H8, indicatingpositive and correct amplifications.
ENT 23S, nifH, HAdV, HPyV, and HAdV 40/41 qPCR assays were performed in 20-�l reaction mixturesusing 10 �l of SsoAdvanced universal probes supermix (Bio-Rad Laboratories, CA, USA), 500 nM eachprimer and 400 nM probe (ENT 23S), 800 nM each primer and 240 nM probe (nifH), 200 nM each primerand 200 nM probe (HAdV), 240 nM each primer and 160 nM probe (HPyV), 400 nM each primer and 100nM probe (HAdV 40/41), and 3 �l of template DNA (Table S1).
For RNA targets (PMMoV, HNoV, and EV), cDNA was synthesized using the SuperScript III first-strandsynthesis reverse transcriptase kit (Invitrogen, Carlsbad, CA, USA), according to the manufacturer’sinstructions. Six microliters of extracted RNA was used to generate cDNA. PMMoV, HNoV, and EV qPCRassays were performed in 20-�l reaction mixtures using 10 �l of SsoAdvanced universal probes supermix(Bio-Rad Laboratories, CA, USA), 200 nM each primer and 80 nM probe (PMMoV), 250 nM each primer and100 nM probe (HNoV), 300 nM forward primer, 900 nM reverse primer, and 125 nM probe (EV) and 3 �lof template cDNA (Table S1).
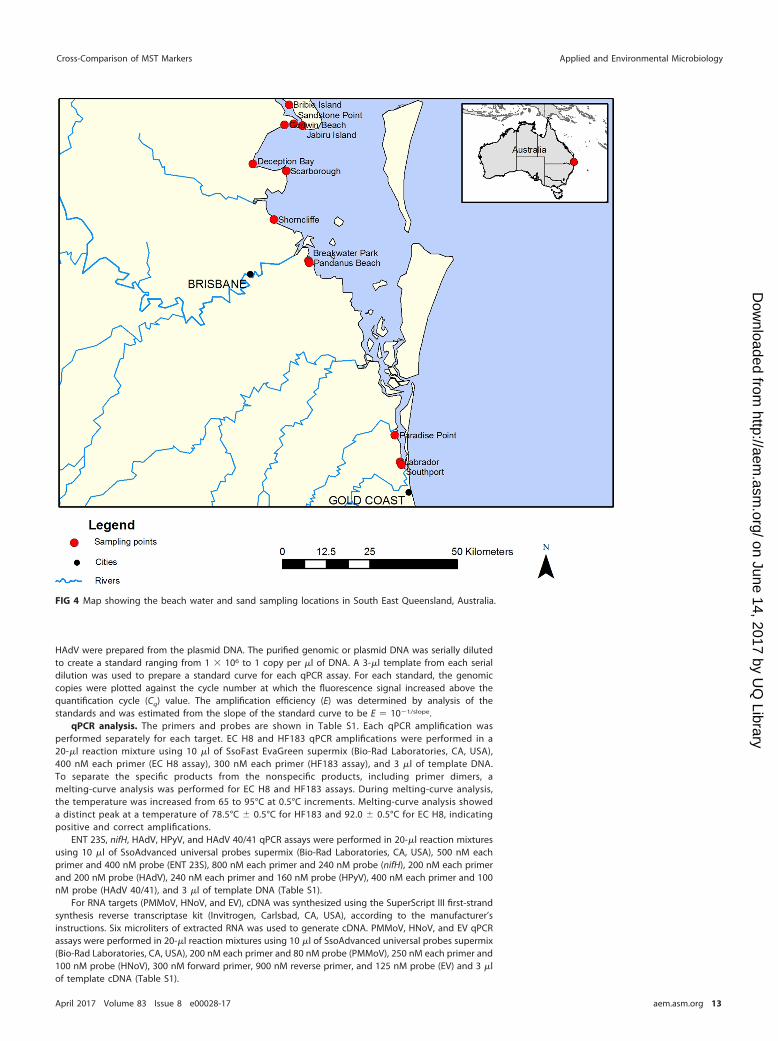
FIG 4 Map showing the beach water and sand sampling locations in South East Queensland, Australia.
Cross-Comparison of MST Markers Applied and Environmental Microbiology
April 2017 Volume 83 Issue 8 e00028-17 aem.asm.org 13
on June 14, 2017 by UQ
Libraryhttp://aem
.asm.org/
Dow
nloaded from

Limit of detection and quantification. To determine whether a sample was positive, negative, orquantifiable, defined criteria were established. The qPCR assay limit of detection (ALOD) was definedas the number of copies that could be detected in 2 out of 3 qPCR assays, while the assay limit ofquantification (ALOQ) was the number of copies that could be quantified in 2 out of 3 qPCR assays.The process limit of detection (PLOD) was defined as the smallest volume of wastewater that couldbe subjected to the complete sample preparation process, including dilution, filtration, and DNA/RNA extraction and still be reliably detected/quantified (PLOQ) in 2 out of 3 qPCR reactions (23).
Recreational beach water and sand sampling. A field study was undertaken to determine theextent of human wastewater pollution in 12 recreational beaches along the SEQ coast (Fig. 4). Thenorthernmost site was located on Bribie Island, while the southernmost site was located in Southport onthe Gold Coast. All sites were public beach areas known to be popular with bathers and recreationalwater users. Stormwater pipes were identified as a major source of human fecal pollution in these sites(Table S3). At each recreational beach, a 10-liter water sample was collected in a sterile container at anapproximate water depth of 25 cm. In addition, beach sand cores were collected by manually insertinga clear plastic tube (internal diameter, 2 cm) below the water surface, 10 cm into the sand. All water andsand samples were immediately transported to the laboratory and processed within 4 to 6 h aftercollection.
The concentrations of culturable E. coli and Enterococcus spp. in the water samples were deter-mined using culture-based methods, as described earlier. For the quantification of DNA and RNAtargets, the pH of the recreational water sample was lowered to 3.5 using 2.0 N HCl. For DNA targets,1.8 liters of each sample was then filtered through negatively charged 90-mm, 0.45-�m-pore-size HAmembranes. For the RNA targets, 800 ml of each water sample was filtered through negativelycharged 90-mm, 0.45-�m-pore-size HA membranes. Sand cores were only tested for the DNA targets.Five grams of sand from the top layer of each sand core (approximately 1 to 5 cm depth) was usedto extract DNA.
DNA extraction and PCR inhibition analysis. DNA samples were extracted from the membranesusing the Mo Bio PowerWater DNA isolation kit (Mo Bio Laboratories, Carlsbad, CA, USA). RNA sampleswere extracted using the Mo Bio PowerWater RNA isolation kit. All DNA and RNA samples were storedat �80°C. An experiment was conducted to determine the effect of potential PCR inhibitory substanceson the quantitative detection of DNA and RNA targets in (i) wastewater, (ii) wastewater-seeded beachwater samples, and (iii) beach water and sand samples using a Sketa22 real-time assay (41). Samples witha 2-Cq delay were considered to have PCR inhibitors.
Quality control. All equipment used for collection, filtration, and sample storage was sterilized bybleaching and autoclaving prior to use. During water sampling, container blanks carrying sterile distilledwater were taken to each site and left open during the collection procedures. These samples wereprocessed in an identical manner to all other samples to confirm the absence of contamination. Duringthe DNA and RNA extraction activities, reagent blanks were run and analyzed for each extractionprocedure. During qPCR analysis, all DNA and RNA samples were run in triplicate with three negativecontrols (sterile water) on 96-well plates using the CFX 96 thermocycler (Bio-Rad Laboratories, CA, USA).
Statistical analysis. The concentrations of DNA and RNA targets in raw and secondary-treatedwastewater samples were not normally distributed (as determined by a Kolmogorov-Smirnov test).Therefore, the nonparametric Kruskal-Wallis one-way analysis of variance (ANOVA) with Dunn’s posttestwas performed to determine if there were any significant differences in FIB, MST marker, and enteric virusconcentrations in raw and secondary-treated wastewater. The nonparametric Spearman’s rank correla-tion with a two-tailed test was used to establish the relationship among targets in raw and secondary-treated wastewater samples. In general, when r was �0.7, the targets were considered to have a strongpositive correlation, an r of �0.4 but �0.7 was a moderate correlation, and an r of �0.2 but �0.4 wasa weak correlation. GraphPad Prism 6 was used for statistical analysis (GraphPad Software, Inc.).Spearman’s rank correlation was also performed to determine the correlation between culturable E. coliand Enterococcus species concentrations in recreational water samples. All statistical analyses wereevaluated at an � value of 0.05.
SUPPLEMENTAL MATERIAL
Supplemental material for this article may be found at https://doi.org/10.1128/AEM.00028-17.
SUPPLEMENTAL FILE 1, PDF file, 0.2 MB.
ACKNOWLEDGMENTSWe gratefully acknowledge funding from CSIRO and the School of Agriculture and
Food Sciences, The University of Queensland.
REFERENCES1. Chase E, Hunting J, Staley C, Harwood V. 2012. Microbial source tracking
to identify human and ruminant sources of faecal pollution in an ephem-eral Florida river. J Appl Microbiol 113:1396 –1406. https://doi.org/10.1111/jam.12007.
2. Graczyk TK, Sunderland D, Tamang L, Lucy FE, Breysse PN. 2007. Bather
density and levels of Cryptosporidium, Giardia, and pathogenic mi-crosporidian spores in recreational bathing water. Parasitol Res 101:1729 –1731. https://doi.org/10.1007/s00436-007-0734-1.
3. Staley C, Gordon K, Schoen M, Harwood V. 2012. Performance of twoquantitative PCR methods for microbial source tracking of human sew-
Hughes et al. Applied and Environmental Microbiology
April 2017 Volume 83 Issue 8 e00028-17 aem.asm.org 14
on June 14, 2017 by UQ
Libraryhttp://aem
.asm.org/
Dow
nloaded from

age and implications for microbial risk assessment in recreational waters.Appl Environ Microbiol 78:7317–7326. https://doi.org/10.1128/AEM.01430-12.
4. Petri WA, Jr, Miller M, Binder HJ, Levine MM, Dillingham R, Guerrant RL.2008. Enteric infections, diarrhea, and their impact on function anddevelopment. J Clin Invest 118:1277–1290. https://doi.org/10.1172/JCI34005.
5. Wolf L, Held I, Eiswirth M, Hötzl H. 2004. Impact of leaky sewers ongroundwater quality. Clean 32:361–373. https://doi.org/10.1002/aheh.200400538.
6. Sowah RA, Habteselassie MY, Radcliffe DE, Bauske E, Risse M. 2017.Isolating the impact of septic systems on fecal pollution in streams ofsuburban watersheds in Georgia, United States. Water Res 108:330 –338.https://doi.org/10.1016/j.watres.2016.11.007.
7. Sidhu JPS, Ahmed W, Gernjak W, Aryal R, McCarthy D, Palmer A, KoloteloP, Toze S. 2013. Sewage pollution in urban stormwater runoff as evidentfrom the widespread presence of multiple microbial and chemicalsource tracking markers. Sci Total Environ 463:488 – 496. https://doi.org/10.1016/j.scitotenv.2013.06.020.
8. Cann KF, Thomas DR, Salmon RL, Wyn-Jones AP, Kay D. 2012. Extremewater-related weather events and waterborne disease. Epidemiol Infect141:671– 686. https://doi.org/10.1017/S0950268812001653.
9. Dale K, Kirk M, Sinclair M, Hall R, Leder K. 2010. Reported waterborneoutbreaks of gastrointestinal disease in Australia are predominantlyassociated with recreational exposure. Aust N Z Public Health 34:527–530. https://doi.org/10.1111/j.1753-6405.2010.00602.x.
10. Harwood V, Levine A, Scott T, Chivukula V, Lukasik J, Farrah SR, Rose JB.2005. Validity of the indicator organism paradigm for pathogen reduc-tion in reclaimed water and public health protection. Appl EnvironMicrobiol 71:3163–3170. https://doi.org/10.1128/AEM.71.6.3163-3170.2005.
11. McQuaig S, Griffith J, Harwood VJ. 2012. Association of fecal indicatorbacteria with human viruses and microbial source tracking markers atcoastal beaches impacted by nonpoint source pollution. Appl EnvironMicrobiol 78:6423– 6432. https://doi.org/10.1128/AEM.00024-12.
12. Ahmed W, Hughes B, Harwood V. 2016. Current status of marker genesof Bacteroides and related taxa for identifying sewage pollution inenvironmental waters. Water 8:231. https://doi.org/10.3390/w8060231.
13. Ufnar JA, Wang SY, Christiansen J, Yampara-Iquise H, Carson C, EllenderRD. 2006. Detection of the nifH gene of Methanobrevibacter smithii: apotential tool to identify sewage pollution in recreational waters. J ApplMicrobiol 101:44 –52. https://doi.org/10.1111/j.1365-2672.2006.02989.x.
14. Ahmed W, Triplett C, Gomi R, Gyawali P, Hodgers L, Toze S. 2015.Assessment of genetic markers for tracking the sources of human waste-water associated Escherichia coli in environmental waters. Environ SciTechnol 49:9341–9346. https://doi.org/10.1021/acs.est.5b02163.
15. Gomi R, Matsuda T, Matsui Y, Yoneda M. 2014. Fecal source tracking inwater by next-generation sequencing technologies using host-specificEscherichia coli genetic markers. Environ Sci Technol 48:9616 –9623.https://doi.org/10.1021/es501944c.
16. Rusiñol M, Fernandez-Cassi X, Hundesa A, Vieira C, Kern A, Eriksson I,Ziros P, Kay D, Miagostovich M, vargha M, Allard A, Vantarakis A,Wyn-Jones P, Bofill-Mas S, Girones R. 2014. Application of human andanimal viral microbial source tracking tools in fresh and marine watersfrom five different geographical areas. Water Res 59:119 –129. https://doi.org/10.1016/j.watres.2014.04.013.
17. Rosario K, Symonds E, Sinigalliano C, Stewart J, Breitbart M. 2009. Peppermild mottle virus as an indicator of fecal pollution. Appl Environ Micro-biol 75:7261–7267. https://doi.org/10.1128/AEM.00410-09.
18. Stoeckel DM, Harwood VJ. 2007. Performance, design, and analysis inmicrobial source tracking studies. Appl Environ Microbiol 73:2405–2415.https://doi.org/10.1128/AEM.02473-06.
19. Odagiri M, Schriewer A, Hanley K, Wuertz S, Misra P, Panigrahi P, JenkinsMW. 2015. Validation of Bacteroidales quantitative PCR assays targetinghuman and animal fecal contamination in the public and domesticdomains in India. Sci Total Environ 502:462– 470. https://doi.org/10.1016/j.scitotenv.2014.09.040.
20. Ahmed W, Sidhu J, Toze S. 2012. Evaluation of the nifH gene marker ofMethanobrevibacter smithii for the detection of sewage pollution inenvironmental waters in Southeast Queensland, Australia. Environ SciTechnol 46:543–550. https://doi.org/10.1021/es203372u.
21. Hundesa A, Maluquer de Motes C, Albinana-Gimenez N, Rodriguez-Manzano J, Bofill-Mas S, Suñen E, Rosina-Girones R. 2009. Developmentof a qPCR assay for the quantification of porcine adenoviruses as an MST
tool for swine fecal contamination in the environment. J Virol Methods158:130 –135. https://doi.org/10.1016/j.jviromet.2009.02.006.
22. Kirs M, Caffaro-Filho RA, Wong M, Harwood VJ, Moravcik P, Fujioka RS.2016. Human-associated Bacteroides spp. and human polyomaviruses asmicrobial source tracking markers in Hawaii. Appl Environ Microbiol82:6757– 6767. https://doi.org/10.1128/AEM.01959-16.
23. Symonds E, Sinigalliano C, Gidley M, Ahmed W, McQuaig-Ulrich S, BreitbartM. 2016. Faecal pollution along the southeastern coast of Florida andinsight into the use of pepper mild mottle virus as an indicator. J ApplMicrobiol 121:1469–1481. https://doi.org/10.1111/jam.13252.
24. Bustin SA, Benes V, Garson JA, Hellemans J, Huggett J, Kubista M, MuellerR, Nolan T, Pfaffl MW, Shipley GL, Vandesompele J, Wittwer CT. 2009. TheMIQE guidelines: minimum information for publication of quantitativereal-time PCR experiments. Clin Chem 55:611– 622. https://doi.org/10.1373/clinchem.2008.112797.
25. Fong TT, Lipp EK. 2005. Enteric viruses of humans and animals in aquaticenvironments: health risks, detection, and potential water quality as-sessment tools. Microbiol Mol Biol Rev 69:357–371. https://doi.org/10.1128/MMBR.69.2.357-371.2005.
26. Soller JA, Bartrand T, Ashbolt NJ, Ravenscroft J, Wade TJ. 2010. Estimat-ing the primary etiologic agents in recreational freshwaters impacted byhuman sources of faecal contamination. Water Res 44:4736 – 4747.https://doi.org/10.1016/j.watres.2010.07.064.
27. Ahmed W, Goonetilleke A, Powell D, Chauhan K, Gardner T. 2009.Comparison of molecular markers to detect fresh sewage in environ-mental waters. Water Res 40:4908 – 4917. https://doi.org/10.1016/j.watres.2009.09.047.
28. Albinana-Gimenez N, Clemente-Casares P, Bofill-Mas S, Hundesa A, RibasF, Girones R. 2006. Distribution of human polyomaviruses, adenoviruses,and hepatitis E virus in the environment and in a drinking-water treat-ment plant. Environ Sci Technol 40:7416 –7422. https://doi.org/10.1021/es060343i.
29. Fong T, Phanikumar M, Xagoraraki I, Rose J. 2009. Quantitative detectionof human adenoviruses in wastewater and combined sewer overflowsinfluencing a Michigan river. Appl Environ Microbiol 76:715–723. https://doi.org/10.1128/AEM.01316-09.
30. Haramoto E, Kitajima M, Katayama H, Ohgaki S. 2010. Real-time PCRdetection of adenoviruses, polyomaviruses, and torque teno viruses inriver water in Japan. Water Res 44:1747–1752. https://doi.org/10.1016/j.watres.2009.11.043.
31. McQuaig S, Scott T, Lukasik J, Paul J, Harwood V. 2009. Quantification ofhuman polyomaviruses JC virus and BK virus by TaqMan quantitativePCR and comparison to other water quality indicators in water and fecalsamples. Appl Environ Microbiol 75:3379 –3388. https://doi.org/10.1128/AEM.02302-08.
32. Hamza IA, Jurzik L, Uberla K, Wilhelm M. 2011. Evaluation of pepper mildmottle virus, human picobirnavirus and torque teno virus as indicatorsof fecal contamination in river water. Water Res 45:1358 –1368. https://doi.org/10.1016/j.watres.2010.10.021.
33. Kuroda K, Nakada N, Hanamoto S, Inaba M, Katayama H, Do AT, Nga TTV,Oguma K, Hayashi T, Takizawa S. 2015. Pepper mild mottle virus as anindicator and a tracer of fecal pollution in water environments: compar-ative evaluation with wastewater-tracer pharmaceuticals in Hanoi, Viet-nam. Sci Total Environ 506 –507:287–298. https://doi.org/10.1016/j.scitotenv.2014.11.021.
34. Hewitt J, Greening GE, Leonard M, Lewis GD. 2013. Evaluation of humanadenovirus and human polyomavirus as indicators of human sewagecontamination in the aquatic environment. Water Res 47:6750 – 6761.https://doi.org/10.1016/j.watres.2013.09.001.
35. Haramoto E, Katayama H, Oguma K, Ohgaki S. 2007. Quantitative anal-ysis of human enteric adenoviruses in aquatic environments. J ApplMicrobiol 103:2153–2159. https://doi.org/10.1111/j.1365-2672.2007.03453.x.
36. Prado T, Silva DM, Guilayn WC, Rose TL, Gaspar AM, Miagostovich MP.2011. Quantification and molecular characterization of enteric virusesdetected in effluents from two hospital wastewater treatment plants.Water Res 45:1287–1297. https://doi.org/10.1016/j.watres.2010.10.012.
37. Belguith K, Hassen A, Aouni M. 2006. Comparative study of four extrac-tion methods for enterovirus recovery from wastewater and sewagesludge. Bioresour Technol 97:414 – 419. https://doi.org/10.1016/j.biortech.2005.03.022.
38. Ahmed W, Sidhu J, Smith K, Beale D, Gyawali P, Toze S. 2015. Distribu-tions of fecal markers in wastewater from different climatic zones for
Cross-Comparison of MST Markers Applied and Environmental Microbiology
April 2017 Volume 83 Issue 8 e00028-17 aem.asm.org 15
on June 14, 2017 by UQ
Libraryhttp://aem
.asm.org/
Dow
nloaded from

human fecal pollution tracking in Australian surface waters. Appl Envi-ron Microbiol 82:1316 –1323. https://doi.org/10.1128/AEM.03765-15.
39. Eichmiller JJ, Hicks RE, Sadowsky MJ. 2013. Distribution of geneticmarkers of fecal pollution on a freshwater sandy shoreline in proximityto wastewater effluent. Environ Sci Technol 47:3395–3402. https://doi.org/10.1021/es305116c.
40. Shah AH, Abdelzaher AM, Phillips M, Hernandez R, Solo-Gabriele HM,Kish J, Scorzetti G, Fell JW, Diaz MR, Scott TM, Lukasik J, Harwood VJ,McQuaig S, Sinigalliano CD, Gidley ML, Wanless D, Ager A, Lui J, Stewart
JR, Plano LRW, Fleming LE. 2011. Indicator microbes correlate withpathogenic bacteria, yeasts and helminthes in sand at a subtropicalrecreational beach site. J Appl Microbiol 110:1571–1583. https://doi.org/10.1111/j.1365-2672.2011.05013.x.
41. Haugland RA, Siefring SC, Wymer LJ, Brenner KP, Dufour AP. 2005.Comparison of Enterococcus measurements in freshwater at two recre-ational beaches by quantitative polymerase chain reaction and mem-brane filter culture analysis. Water Res 39:559 –568. https://doi.org/10.1016/j.watres.2004.11.011.
Hughes et al. Applied and Environmental Microbiology
April 2017 Volume 83 Issue 8 e00028-17 aem.asm.org 16
on June 14, 2017 by UQ
Libraryhttp://aem
.asm.org/
Dow
nloaded from