public action for public goods - harvard business … files/07-061.pdf1 introduction public goods in...
TRANSCRIPT
07-061
Copyright © 2006 by Abhijit Banerjee, Lakshmi Iyer, and Rohini Somanathan
Working papers are in draft form. This working paper is distributed for purposes of comment and discussion only. It may not be reproduced without permission of the copyright holder. Copies of working papers are available from the author.
Public Action for Public Goods Abhijit Banerjee Lakshmi Iyer Rohini Somanathan
Public Action for Public Goods
Abhijit Banerjee, Lakshmi Iyer and Rohini Somanathan∗
September 2006
Abstract
This paper focuses on the relationship between public action and access to public goods. It begins
by developing a simple model of collective action which is intended to capture the various mechanisms
that are discussed in the theoretical literature on collective action. We argue that several of these
intuitive theoretical arguments rely on special additional assumptions that are often not made clear.
We then review the empirical work based on the predictions of these models of collective action. While
the available evidence is generally consistent with these theories, there is a dearth of quality evidence.
Moreover, a large part of the variation in access to public goods seems to have nothing to do with the
“bottom-up” forces highlighted in these models and instead reflect more “top-down” interventions. We
conclude with a discussion of some of the historical evidence on top-down interventions.
Keywords: Public goods, collective action
JEL codes: H41, 012
∗Department of Economics, MIT ([email protected]), Harvard Business School ([email protected]) and Delhi School of Eco-
nomics ([email protected])
1
1 Introduction
Public goods in poor rural communities are remarkably scarce. Basic health and education have long been
regarded as fundamental rights, yet constitutional and political commitments towards them remain largely
unmet. Over a quarter of adults in developing countries are illiterate, at least a quarter of all children are
not immunized, twenty percent of the population is without access to clean water and more than half live
without adequate sanitation.1
Within this picture of overall inadequacy there is considerable variation both across countries and inside
national boundaries. Table 1 contains figures for access to public goods and associated outcomes for a small
set of countries for which secondary data are readily available at the sub-national level.2 Even keeping in
mind the difficulties of cross-country comparisons of this type arising from the way regions and public goods
are defined, these numbers are striking. In Nepal, access to schools is ten times better in the best districts
compared to the worst. For Kenyan provinces, this ratio is 8:1; it is more than 2:1 for both Indian states
and Russian regions and slightly over 1.5:1 for Chinese provinces. In contrast, regional differences are small
in Mexico and Thailand and negligible in Vietnam.
While it is true that the largest gaps in access are typically found in the poorest countries, it is not clear
how we are to explain the considerable variation that remains after we take account of differences in income
levels. For example, public goods do not seem to arrive in any particular order as countries get richer. Nor
do different types of public goods generally move together. Health and education services are especially
scarce and unequal in South Asia but this is less true of other types of physical infrastructure such as roads,
electricity and transport facilities.3 Vietnam has sizable gaps in physical infrastructure, but equal access to
health and education. Economic reforms and prosperity have been accompanied by considerable convergence
in access to education in India but by growing inequalities in China.4
Physical access to facilities is of course just one aspect of provision. Recent surveys show that existing
facilities are often dysfunctional: A study in which enumerators made surprise visits to primary schools and
health clinics in Bangladesh, Ecuador, India, Indonesia, Peru, and Uganda concluded, “Averaging across the
countries, about 19 percent of teachers and 35 percent of health workers were absent”. Even when physically
present, many of these providers were not working: In India, only half of primary school teachers present1UNDP, Human Development Report 2005, Tables 1, 6, and 7, pages 222-243.2Data sources are described in the notes accompanying Table 1. We present data at the largest sub-national level for which
they are customarily reported.3United Nations, Asia-Pacific Human Development Report, 2006.4Zhang and Kanbur (2003) show sharp increases in the Gini coefficient of illiteracy rates for Chinese provinces after 1985
even though corresponding changes in income inequality across provinces were relatively small. In contrast, school availability
during the nineties increased fastest in the backward states of Central and East India (Office of the Registrar General of India,
2001).
2
were actually teaching when the enumerators arrived (Chaudhury et al, 2004). In a survey of a hundred
hamlets in the Indian state of Rajasthan, enumerators found that most hamlets had a government health
sub-center, but repeated visits revealed that some of these are almost never open, while others are open most
of the time (Banerjee, Deaton and Duflo, 2004). These measures of public good quality are often correlated
with physical access.5 In such cases, regional disparities are likely to be even larger than those suggested by
the distribution of facilities.
It seems implausible these very large differences in access to education, better hygiene, health and longevity
could be entirely explained by differences in what people want. The National Election Survey in India,
carried out by the Centre for the Study of Developing Societies in 1996, asks 10000 voters an open-ended
question: “What are the three main problems people like you face today?” Poverty was the most popular
response and was ranked first by about a quarter of all respondents, but public goods came in a close second.
Nearly a fifth of all respondents listed problems associated with different types of public amenities (education,
drinking water, electricity, transport and communication) as their “main problem”.6 Voting behavior also
seems to reflect these preferences: there are numerous instances of incumbent politicians being voted out of
office when their tenure is associated with poorly functioning public services.7
Motivated by observations like these, a recent literature has focused on collective action by communities
in providing public goods. In this approach, the distribution of public goods is determined by what we
call bottom-up processes in which communities compete, in various ways, to lay claim to limited public
resources. In section 2, we lay out a framework within which the theoretical research in this area can be
understood and outline conditions under which these models provide clear predictions for the relationship
between community characteristics and the strength of collective action. We also discuss the many cases
where the theory is ambiguous.
Section 3 surveys the empirical research related to these models of collective action. The broad patterns seem
consistent with the view that collective action is an important part of the story of why access varies so much.
However, an exclusive focus on these bottom-up mechanisms leaves important questions unanswered and a
great deal of the observed variation in public goods unexplained. In particular, one observes many instances
where the biggest expansions of public goods were in areas that have historically been both economically and
politically weak. For example, allocations for elementary schools in Indonesia in the 1970s and programs to
augment school resources in India in the 1980s, were both concentrated in regions with the worst educational5The Probe Team (1999), chapter 4 documents this for public schools in India.6See Center for the Study of Developing Societies (1996) for survey questionnaires. Tabulated data for this question were
provided to us by their Data Unit.7The incumbent Congress Party in the Indian state of Madhya Pradesh was defeated in the Assembly elections in 2003 and
the landslide victory of the Bharatiya Janata Party is often attributed to their mantra of “bijli, sadak, pani” (electricity, roads
and water). A majority of voters surveyed in Madhya Pradesh at that time felt that there had been a deterioration in the
quality of public infrastructure during the term of the incumbent government. (The Hindu, 2003).
3

outcomes and the expansions in education in Europe, North America and Japan in the early twentieth century
were often targeted towards the most marginal members of these societies.8 During the colonial era in India,
the autonomously ruled princely states of Cochin and Travancore invested heavily in education and health
in the absence of any political imperatives, and the unusually high social outcomes in the present-day Kerala
state are, in part, “an example of princely autonomy having widespread, long-term effects”.9
We conclude that the distribution of public goods is the outcome of interactions between the forces of collec-
tive action and various top-down processes. These other processes may relate to changes in the technology
of providing public goods, to the compulsions of the state, or the private objectives of its agents. What they
have in common is that they are largely unrelated to what is happening on the ground in the specific area
where the public goods get supplied. We end the chapter with a few historically significant examples of these
types of interventions.
2 Understanding Collective Action
The premise of this approach is that an individual’s benefit from a public good depends on the group he is
a part of, but his costs of participating in group activities are privately incurred.
The early literature in this area discusses the provision of schools and other facilities that are financed
by local taxes, or community resources such as water bodies and forest lands that are created, and often
maintained and monitored, by voluntary contributions of labor. More recently, the focus has shifted to the
role of political competition in explaining public good provision. Public infrastructure in poor countries is
usually centrally financed and individual communities compete in various ways to claim resources from the
state. Community action in such cases includes writing to state officials, entertaining them, making private
contributions for the good and a range of other influence activities.
The basic structure of both these models is similar. Individuals acting non-cooperatively choose effort
levels based on the costs and returns from such investments. In the case of local provision, group benefits
depend directly on the public goods technology. Under central financing, they are the result of some more
complex political process. Either way, since returns depend on the collective behavior of different groups,
the equilibrium allocation of public goods will be determined by the distribution of group characteristics.
We refer to research in both these traditions but use the language of political competition in presenting the8Lindert (2004), chapter 5 and Benavot and Riddle (1988) present cross-national figures for primary school enrollments in
the late nineteenth and early twentieth centuries. Goldin (1998) documents the rapid expansion in secondary school enrollment
rates in North America in the inter-war period. Sen (2001) briefly describes the spectacular growth in literacy in Japan during
the first decade of the twentieth century.9Jeffrey (1993), p. 56.
4
theoretical results of this section.
We start by summarizing the basic logic of a collective action-public goods problem in a simple model and
then proceed to various extensions. Suppose that there are m groups in society with n1,..., nm members.
Think of these as m, perhaps spatially distinct, homogeneous communities. We will subsequently introduce
subgroups to capture within-community heterogeneity. Groups compete to extract public goods from the
state; we are interested in how the nature of this competition and the ultimate allocation of public goods
varies with group characteristics: their political visibility, their tastes, their size, their potential benefits from
public goods, and other social factors that influence their ability to act together.
Denote by aij the effort put in by member i of group j. We will sometimes use Aj to denote total effort by
members of group j and A for the aggregate effort of all groups. Benefits from the public good for member i
of group j are denoted by bij(nj). The dependence on nj allows for possible congestion effects which might
reduce the per-member value of the public good as a group gets larger.
The probability that group j will succeed in extracting the public good from the state depends on the effort
expended by the group, as well as the total effort expended by all other groups in society. This probability
is given by
fj(m∑
k=1
nk∑i=1
aik,
nj∑i=1
aij).
We assume that this probability is increasing in the second argument and decreasing in the first (f1j <
0, f2j > 0) and that f1j + f2j > 0. These conditions imply that the probability of receiving the good always
increases when a group puts in more effort, keeping constant everyone else’s effort. We also assume that
f11j > 0 and f22j < 0 for all j. We do not impose the assumption that∑
fj = 1 and thereby allow aggregate
provision to respond to aggregate effort. In particular, we also allow for the possibility that none of the
groups may get the good.
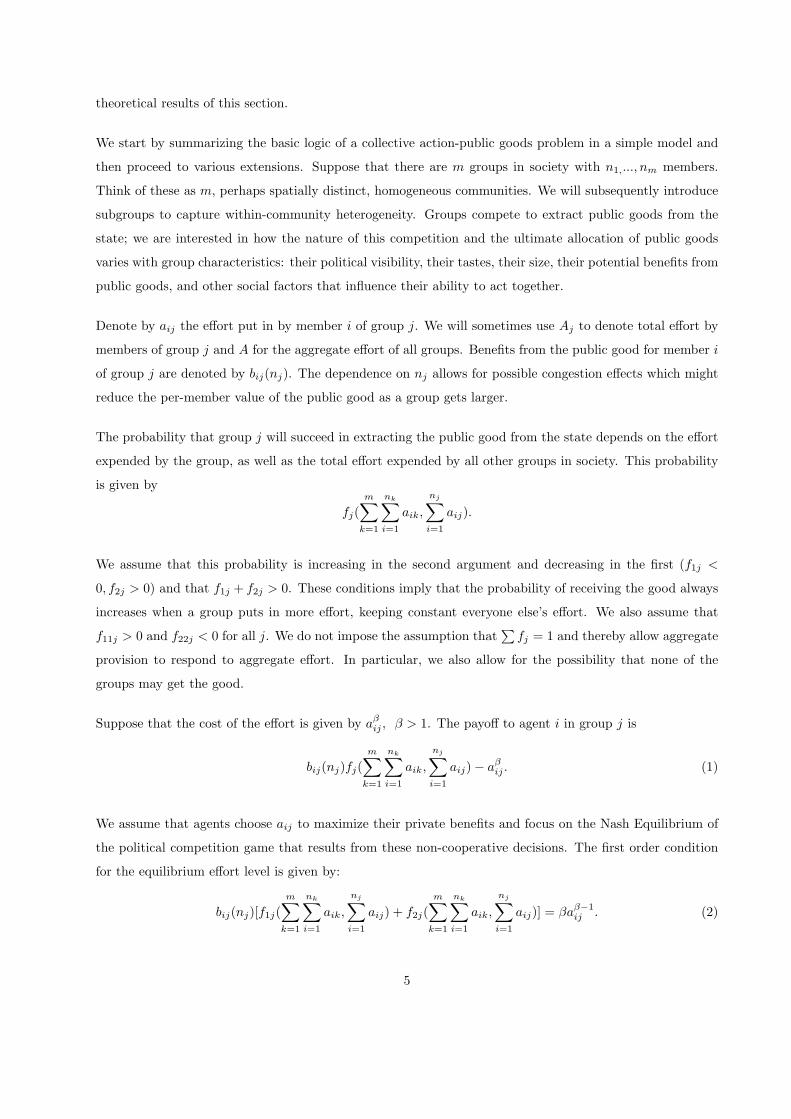
Suppose that the cost of the effort is given by aβij , β > 1. The payoff to agent i in group j is
bij(nj)fj(m∑
k=1
nk∑i=1
aik,
nj∑i=1
aij)− aβij . (1)
We assume that agents choose aij to maximize their private benefits and focus on the Nash Equilibrium of
the political competition game that results from these non-cooperative decisions. The first order condition
for the equilibrium effort level is given by:
bij(nj)[f1j(m∑
k=1
nk∑i=1
aik,
nj∑i=1
aij) + f2j(m∑
k=1
nk∑i=1
aik,
nj∑i=1
aij)] = βaβ−1ij . (2)
5
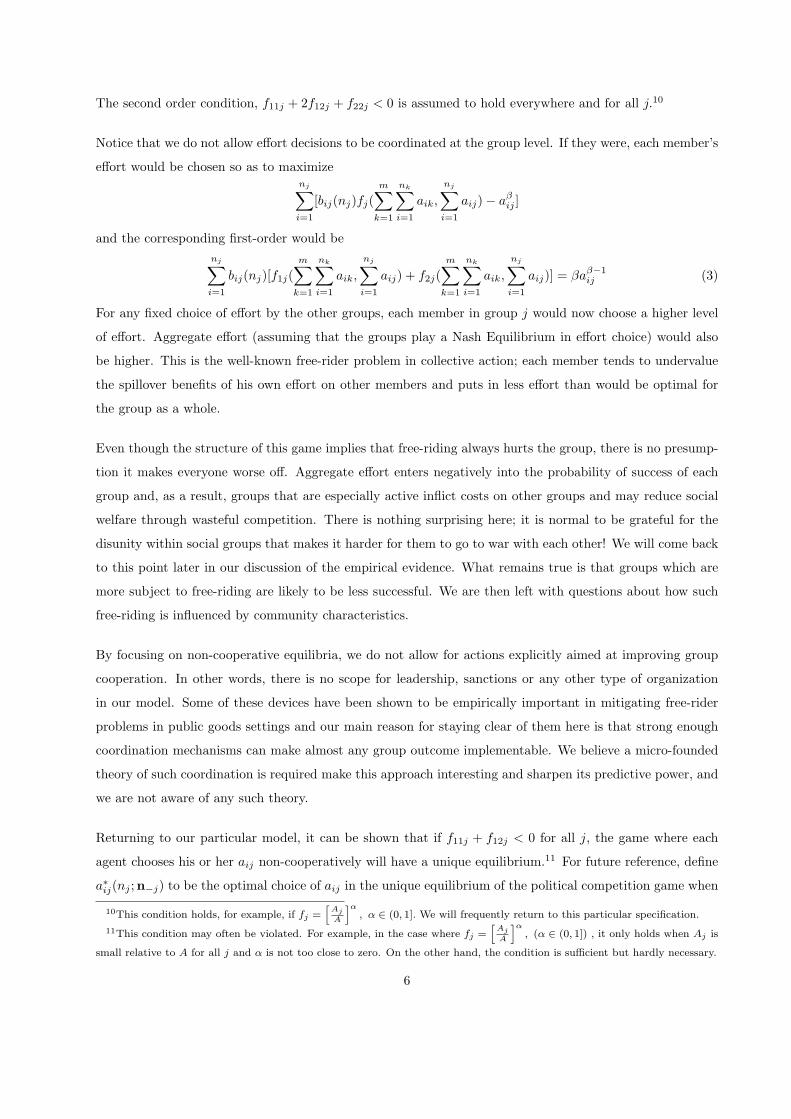
The second order condition, f11j + 2f12j + f22j < 0 is assumed to hold everywhere and for all j.10
Notice that we do not allow effort decisions to be coordinated at the group level. If they were, each member’s
effort would be chosen so as to maximizenj∑i=1
[bij(nj)fj(m∑
k=1
nk∑i=1
aik,
nj∑i=1
aij)− aβij ]
and the corresponding first-order would benj∑i=1
bij(nj)[f1j(m∑
k=1
nk∑i=1
aik,
nj∑i=1
aij) + f2j(m∑
k=1
nk∑i=1
aik,
nj∑i=1
aij)] = βaβ−1ij (3)
For any fixed choice of effort by the other groups, each member in group j would now choose a higher level
of effort. Aggregate effort (assuming that the groups play a Nash Equilibrium in effort choice) would also
be higher. This is the well-known free-rider problem in collective action; each member tends to undervalue
the spillover benefits of his own effort on other members and puts in less effort than would be optimal for
the group as a whole.
Even though the structure of this game implies that free-riding always hurts the group, there is no presump-
tion it makes everyone worse off. Aggregate effort enters negatively into the probability of success of each
group and, as a result, groups that are especially active inflict costs on other groups and may reduce social
welfare through wasteful competition. There is nothing surprising here; it is normal to be grateful for the
disunity within social groups that makes it harder for them to go to war with each other! We will come back
to this point later in our discussion of the empirical evidence. What remains true is that groups which are
more subject to free-riding are likely to be less successful. We are then left with questions about how such
free-riding is influenced by community characteristics.
By focusing on non-cooperative equilibria, we do not allow for actions explicitly aimed at improving group
cooperation. In other words, there is no scope for leadership, sanctions or any other type of organization
in our model. Some of these devices have been shown to be empirically important in mitigating free-rider
problems in public goods settings and our main reason for staying clear of them here is that strong enough
coordination mechanisms can make almost any group outcome implementable. We believe a micro-founded
theory of such coordination is required make this approach interesting and sharpen its predictive power, and
we are not aware of any such theory.
Returning to our particular model, it can be shown that if f11j + f12j < 0 for all j, the game where each
agent chooses his or her aij non-cooperatively will have a unique equilibrium.11 For future reference, define
a∗ij(nj ;n−j) to be the optimal choice of aij in the unique equilibrium of the political competition game when
10This condition holds, for example, if fj =h
Aj
A
iα, α ∈ (0, 1]. We will frequently return to this particular specification.
11This condition may often be violated. For example, in the case where fj =h
Aj
A
iα, (α ∈ (0, 1]) , it only holds when Aj is
small relative to A for all j and α is not too close to zero. On the other hand, the condition is sufficient but hardly necessary.
6

there are nj people in group j and n−j people in the other groups,12 and let the corresponding payoff be
U∗ij(nj ;n−j).
The uniqueness of the equilibrium (which makes it easier to think about the comparative statics), is something
of an artifact of the way we set up the game. The simple and plausible modification of the model considered
below introduces the possibility of multiple equilibria even when f11j + f12j < 0.
Suppose it was possible to buy the “public” good on the market at a price p, yielding a net payoff of bij−p to
the buyer.13 There would now be a trade-off between paying what is presumably a higher price and getting
the good for sure, and the gamble of trying to get it from the public system. If bij(nj) = bj for all j, the
solution to the first order condition (2) takes the form aij = aj and can be rewritten as
bj [f1j(m∑
k=1
Ak, Aj) + f2j(m∑
k=1
Ak, Aj)] = β(Aj
nj)β−1 (4)
where Aj = njaj .
Now suppose some members of group j defect to the market so that nj goes down but n−j remains the
same. The right hand of equation (4) is declining in nj and the left hand side is declining in Aj (by the
second order condition for individual maximization) so with no change in the behavior of other groups, the
fall in nj must be accompanied by a fall in Aj to restore equality in (4). This however corresponds to a
change in the aggregate effort level A and causes other groups to increase their effort given our assumption
that f11k + f12k < 0 for any group k. Both the fall in Aj and the rise in A−j will make group j worse off,
the former because the group was putting in too little effort to start with (as a result of free riding) and the
latter because it is less likely to succeed in receiving public goods when its share of total effort declines.
If the corresponding decline in the utility of the nj members remaining in group j is large enough, we may
have bj − p > U∗j (nj ;n−j). Now everyone else in group j would also want to defect, leading to a new
equilibrium with group j entirely in the private market. A sufficient condition for there being two equilibria
is
U∗j (nj ;n−j) > bj − p
U∗j (0;n−j) < bj − p
for some nj > 0.14
The multiplicity here is entirely natural and captures the idea that there is no point in trying to get things12n−j represents the vector (n1,..., nj−1, nj+1,..., nm).13Such “exit” from the public market is plausible for certain services such as education, individual medical care and electricity.
It is likely to be much more costly for services such as roads, public health or law and order.14There is a third, “unstable” equilibrium in between these two, in which all the members of group j are indifferent between
trying to get the good through collective action and purchasing it from the market.
7
from the public system if all your compatriots have deserted you.
For the rest of this section we will ignore the possibility of such multiplicity in order to better focus on the
comparative statics questions. We discuss, in turn, the various characteristics of communities that determine
their ability to collectively invest in activities that bring them public goods.
2.1 Power or Influence
For a variety of historical, sociological and economic reasons, certain groups hold power within society that
is disproportionate to their size. Obvious examples are whites in South Africa in the Apartheid years, high
castes in India through most of its history, large landowners in Brazil, capitalists of the robber baron years
in the United States and party apparatchiks in China in the recent past. Group membership is sometimes by
birth and sometimes circumstance. The existence of such groups is often associated with autocratic regimes,
although democracy per se does not rule out their salience. Those that control economic or social hierarchies
often influence the functioning of democratic institutions in their favor.
In terms of our model, an increase in power is captured by a shift in the fj(., .) function. As long as this
shift is not accompanied by a sharp fall in the productivity of effort, we would expect a higher probability
of success for more powerful groups. This is easy to see in the case where fj(., .) = θjf(., .), and effort costs
are independent of θ.
The institutional histories of nation-states are dotted with instances of dramatically changed power equations
that allow a careful study of how such power influences public goods. For instance, the extension of the
franchise in the West was clearly aimed at reallocating power towards the working classes and resulted in
dramatic changes in the composition of government spending. In India, the reservation of seats in local
and national legislatures for women and selected minorities was also intended to shift the balance of power
in those specific directions. Our discussion of the evidence on public goods allocations suggests that these
institutional changes often had important effects.
2.2 Tastes
Tastes for public goods in our model are captured by the parameters bij . To rank groups by their preference
for a public good would involve comparisons of the distributions of these benefits across groups. In the
special case where all members of a group enjoy the same benefit, groups with higher values of bj would put
in more effort and face a higher probability of receiving the public good. In the more general case where
there is within-group inequality in benefits, we could define group j as placing a higher value on the public
8
good than another group k if benefits for all members of group j are higher than those for members of group
k. This is perhaps overly restrictive and would in general provide only a partial ordering of group preferences
but would once again generate the positive association between higher benefits from public goods and their
greater availability.
The notion that differences in preferences can be used to explain the distribution of public goods has a
long and hallowed tradition in public economics, going back to the work of Tiebout (1956). At the core of
this approach is the idea that geographical differentiation in tastes emerges as an equilibrium outcome of
a sorting process in which households select residential areas based on the public goods they offer. With
well-functioning housing and credit markets those that care most about public goods get the best provision.
The important insight of the Tiebout approach was that for local public goods, as for private goods, there
was a “mechanism to force the consumer-voter to state his true preferences”.15 It also showed that, under
certain conditions, the equilibrium allocation of public goods is efficient. Models of this type have been
widely used to explain the response of local government budgets to the demographic characteristics of city
populations. Subsequent work in this tradition has however shown that the link between preferences and
public good allocations can be fairly tenuous. Benabou (1993) allows for spillover effects in the benefits from
public goods. He shows that these can result in variations in quality across neighborhoods even with no
individual heterogeneity and that such variations are often inefficient. Such spillovers are certainly important
in many practical cases. They allow, for example, the possibility that a school will function better if the
average child in it is highly motivated.
Much of the recent literature on public goods in developing countries has ignored household mobility and
has focused instead on the processes of collective decision-making that translate the characteristics of given
communities into policy choices. This seems to be the better choice since, for most developing countries,
residential mobility is very limited. While 40% of the U.S. population reside in a state which is different
from the one in which they were born,16 it is unusual for entire families in developing countries to relocate
from one community to another; this would involve leaving social networks that have been central to their
lives for many generations and may also be difficult because land markets tend to be dysfunctional. Stark
differences in public good access in many poor countries have not been accompanied by much permanent
migration.15Tiebout (1956), p. 417.16U.S. Census (2000).
9

2.3 Group Size
The question of how the size of a group affects its political leverage is an old and controversial one. Problems
of free-riding are of course more serious in larger groups. As Olson (1965) argued in a very influential essay,
“the larger the group, the less it will be able to favor its common interests.” On the other hand, in our earlier
discussion of the multiple equilibrium issue we showed that total group effort (and hence its probability of
getting the good) is increasing in group size, echoing a point made by Esteban and Ray (2004). The effect
of group size on access to public goods is theoretically ambiguous because it is the collective effort of each
group that determines access to the public good and may be easier for a bigger group to deliver the same
total collective effort–each member has to do less.
In the special case when bij(nj) = bj for all i in group j, and
fj(m∑
k=1
nk∑i=1
aik,
nj∑i=1
aij) = θ
nj∑i=1
aij
m∑k=1
nk∑i=1
aik
α
(5)
where θ is some positive constant, it is easy to check that total equilibrium effort as a fraction of first-best
effort for the group goes to zero as the group size becomes very large. However, such free-riding is not enough
to outweigh the natural advantage of larger groups.
The free-rider problem becomes much more serious when the benefits per head go down as the group gets
larger. The assumption of constant benefits is a reasonable description of the situation when the group is
trying to get a school or a health center or a road. It is much less so when the group wants a well or an
irrigation canal, where the total off-take is limited and crowding more likely. In such cases benefits might
take the form
bij(nj) = b0 +b1
nj.
Assuming the form of the f function given in (5), a group member will now maximize
θ(b0 +b1
nj)
nj∑i=1
aij
m∑k=1
nk∑i=1
aik
α
− aβij ,
from which it follows that in equilibrium
αθ(b0 +b1
nj)nβ−1
j = β (A)α (Aj)β−α
[1− Aj
A
]−1
.
The right hand side of this equation is increasing in Aj . Therefore, comparing two groups in this equilibrium,
the bigger group is more likely to get the good if and only if the left hand side is increasing in nj . But
increasing nj increases congestion on the one hand (thereby reducing benefits to each member) and raises
10

the ability of the group to put in more effort on the other. As long as β < 2, the net effect can go either
way. In particular if β < 2 and the purely public component b0 = 0, smaller groups will do better, while if
b1 = 0, ( no congestion effects), bigger groups will do better.
2.4 The Distribution of Group Benefits
Olson (1965) argued that groups could be more effective in articulating their demands if most of the benefits
from public goods are captured by a small number of group members because the strong stake of these
members would encourage them to invest in group activities. In our model, this is just one possibility. In
general, group inequality has ambiguous effects and can increase or decrease collective effort depending on
the shape of the effort cost function.
To show this, assume that f is given by (5), β < 2 and the total benefit that the group can get from the
public good is fixed at b1. We know from the above discussion that this is the case where the Olson group-size
effect dominates and smaller groups do better in the absence of within-group inequality.
We now allow for the possibility that members of the same community receive different shares of total
benefits: Schools benefit those with young children, roads are most useful to those who commute out of the
village, and benefits from irrigation water may be proportional to the amount of land owned.
Denote by γij the share of the benefits going to member i in group j. Sonj∑i=1
γij = 1. Each group member
chooses an action that maximizes
γijb1θ
nj∑i=1
aij
m∑k=1
nk∑i=1
aik
α
− aβij
and effort as a function of γij is therefore given by
aij = (γij)1
β−1 [αb1θ
Aαβ(Aj)α−1(1− Aj
A)]
1β−1
It follows that in equilibrium
Aj =nj∑i=1
aij =[αb1θ(Aj)α−1
Aαβ(1− Aj
A)] 1
β−1[
nj∑i=1
γ1
β−1ij
]or
Aj[αb1θ(Aj)α−1
Aαβ (1− Aj
A )] 1
β−1=
[nj∑i=1
γ1
β−1ij
].
The left hand side of this expression is increasing in Aj so group effort and hence the equilibrium probability
of success is increasing in[
nj∑i=1
γ1
β−1ij
]. As long as β < 2, this expression is convex in γ and success is most
likely when group benefits are concentrated with γij = 0 or 1. This is the Olson case.
11
When β > 2,nj∑i=1
γ1
β−1ij becomes concave in γij and diluted benefits are an advantage because costs are rising
steeply. Spreading total benefits across many group members elicits higher aggregate group effort in this
case.
Khwaja (2004) proposes an interesting combination of these two cases where the convexity of individual cost
functions decreases after a certain threshold because large farmers use hired labor rather than their own
at the margin. This can result in a U-shaped relationship between inequality and total effort : Effort falls
when we first move away from equal benefits because the cost of effort function is convex, but eventually
the person who gets the greater share of the benefits will start employing outside labor. Further increases in
inequality beyond this point actually increase total effort. Bardhan, Ghatak and Karaivanov (2005) consider
a cost function that permits corner optima. They focus on equilibria where some people put in zero effort
but enjoy the public good nonetheless. The effects of increased inequality in the sharing of benefits now
depends on whether those with positive contributions lose with the increase in inequality or whether it just
hurts those who were putting in zero effort.
The effects of unequal benefits are further complicated if we introduce the possibility of exiting from the
system into the private market, along the lines suggested at the beginning of this section. If those with
the highest benefits are the ones most likely to exit from the system, inequality increases the likelihood of
exit. Since this reduces the probability that those who stay behind get the public good, a small increase in
inequality may cause the entire group to switch to the market.17
2.5 Cohesion
It seems intuitive that more cohesive groups will be able to organize themselves more effectively to secure the
public goods they want. There are several reasons why this might be the case. Individuals in a community
might want different types of goods, but only one of these goods can be provided in equilibrium (Alesina,
Baqir and Easterly, 1999). Alternatively, people may be socially minded, but such altruism may only extend
to those whom they consider similar to themselves (Vigdor, 2004 ). If this fraction is large, each person
would invest in the collective effort whereas if perceived differences among individuals are large, they may
all shirk even if they all have the same preferences for the public good.
Miguel and Gugerty (2005) suggest an alternative reason why the lack of cohesion may influence provision
even if there is no disagreement about the ideal public good. They envision a scenario where free-riding
is observable but not necessarily contractible. For instance, villagers can identify those who attend village17We are assuming here that the exit by some does not increase the absolute amount of benefits that would go to those who
remain, if they were to get the public good.
12

meetings but it is just too costly to exclude non-attendees from using public goods. In such settings, social
networks may be important in sanctioning those who free-ride and it may be easier to impose these sanctions
when everyone is a part of the same social network.
Each of these models shares the prediction that a community consisting of n equal-sized sub-groups will be
better at getting the public goods they want than one with n + 1 groups. There are however good reasons
why this may not always be the case. To see why, consider a simple extension of our previous model in
which group j consists of njq equal-sized sub-groups, s1, . . . , sk. Suppose that the public good has a purely
public component b0 as well as a sub-group-specific component b1 which reaches only one of the sub-groups.
The probability that sub-group sk will get the sub-group specific component, conditional on the public good
being built in the village is assumed to be given by∑i∈sk
aij
nj∑i=1
aij
.
An example would be a road that connects the village to the highway. All the groups in the village want the
road (this is the b0) but only one of them will have it start in their neighborhood (the value of a road in the
neighborhood is b1). A member i of sub-group sk will maximize
θ
b0 + b1
∑i∈sk
aij
nj∑i=1
aij
nj∑i=1
aij
m∑k=1
nk∑i=1
aij
α
− aβij .
At the optimum
αθ
b0 + b1
∑i∈sk
aij
Aj
(Aj
A
)α−1 (A−Aj
A2
)+ θb1
Aj −∑
i∈sk
aij
A2j
(Aj
A
)α
= βaβ−1ij
which can be rewritten asα
b0 + b1
∑i∈sk
aij
Aj
(1− Aj
A
)+ b1
1−
∑i∈sk
aij
Aj
(Aj)α−1 =β
θaβ−1
ij Aα.
Using the fact that everyone in group j faces the same problem and will make the same choice, we get
α(b0 + b11
njq)(
1− Aj
A
)+ b1
(1− 1
njq
)=
β
θ(Aj)β−α(nj)β−1Aα
or
αb0
(1− Aj
A
)+ b1
(1− 1
njq
[1− α(1− Aj
A)])
=β
θ(Aj)β−α(nj)β−1Aα. (6)
It is clear that increasing njq, keeping nj fixed, makes the group more divided, and raises the left hand
side of the above expression. On the other hand, increasing Aj increases the right hand side but lowers the
13
left hand side. It follows that if we compare two groups with the same nj , the group with the higher njq
will put in greater effort. Heterogeneity helps! This apparently surprising result is a direct implication of
Olson group size effect. Making the group smaller reduces the collective action problem for that group, and
therefore the aggregate of many such tiny groups does better than a conglomerate of few larger groups. In
the special case when α = 1 and Aj
A ≈ 0, the fact that others are working does not make you want to work
less, and there is no Olson group size effect. Hence, as is evident from equation (6), sub-dividing the group
neither helps nor hurts.
Esteban and Ray (1999) consider a variant of this set-up in which groups can impose a certain effort level on
their members. Heterogeneity in this case can be shown to dampen collective action. Let ξj be the share of
group j in the entire population. Let aj be the action chosen by everyone in group j. Assuming that β = 2
and b0 = 0 (the purely public component is absent), the choice of aj will maximize
b1
ξjajm∑
k=1
ξkak
− a2j .
The first order condition for this maximization can be written in the form
b1ξ2j [1− ξjaj
C] = 2Cajξj
where C =m∑
k=1
ξkak. Adding across the groups gives us
b1
m∑k=1
ξ2k[1− ξkak
C] = 2C2.
In an equilibrium with m equal and identical groups we must have ξjaj
C = 1m . We can now rewrite the above
expression as
b11m
[1− 1m
] = 2C2. (7)
Effort C is clearly decreasing in m for m > 2. Bigger groups in this case have a bigger stake in the success
of their group and since there is no free-riding, get their groups to put in more effort.
These results on heterogeneity and collective action should be interpreted with caution. One can certainly
think of settings where, intuitively, it seems more precarious to have two large and more or less equal-sized
groups that are opposed to each other than a hundred tiny squabbling groups.18 As discussed earlier, group
activities in a game of political competition could be quite wasteful. This is seen in Esteban and Ray (1999).
They use a model very similar to the one above with the key difference that more effort directly reduces the
quality of the public good. Effort is interpreted as more lobbying, and lobbying is assumed to reduce the net18As Voltaire once said “If there were one religion . . . , its despotism would be terrible; if there were only two, they would
destroy each other; but there are 30, and therefore they live in peace and happiness.”
14
resources spent on the public good. An example of such lobbying would be to allow the bureaucrat to steal
some part of the resources that could otherwise go into the public good as long as he builds the public good
that the group desires. Social divisions could therefore result in better public goods-obviously no divisions
is ideal but two equal-sized groups is the worst possible outcome.
Before we discuss the empirical evidence on public good allocations, it is useful to reflect briefly on some
plausible empirical hypotheses that emerge from the theoretical analysis in this section. In the absence of
coordinated behavior by individuals, we always get under-provision of effort from the perspective of the group
but the extent (and even the presence) of social under-provision depends on the nature of collective action. If
most group activities take the form of lobbying for relatively fixed aggregate allocations, group characteristics
that reduce collective action could be welfare-improving and would have little effect on the overall availability
of public goods. In contrast, in countries with rapidly expanding economies and government budgets,
aggregate allocations may be quite responsive to the effort citizens put in to extracting public goods from the
state, and free-riding is more likely to lead to overall under-provision. We’ve seen that allocations of public
goods depend in a relatively straightforward manner on group preferences and group influence. Group size,
within-group inequality in benefits and group fragmentation have more nuanced predictions and their net
effects are hard to sign without additional information on the structure of individual costs of investing in
group activity and the benefits from public goods. Careful empirical studies are therefore especially useful
in understanding the nature of these effects.
3 Evidence on Public Good Provision
Testing theories with nuanced predictions is always a challenge. In our setting, there are three main obstacles
to overcome in empirical work. The most important problem is that public action is almost never directly
observed except in experimental settings that are designed for this purpose. We review some of these
studies in section 3.3. Other observational studies must therefore search for empirical patterns between
the availability of public goods and the characteristics of communities that influence collective action. The
problem with this approach is that many of the community characteristics which influence collective action
can also directly influence the ease with which public goods can be supplied. For example, large villages
are often located close to urban areas and this proximity may make it easier and cheaper to provide them
with public goods (e.g. roads, communication and power lines are closer to existing networks, bus services
involve relatively short diversions from major routes, it is cheaper to transport school and medical supplies).
To identify the group-size effect on public goods that operates through collective action, we would need to
separate these two effects.
Second, public good quality varies enormously, but these quality differences are notoriously difficult to
15

measure. Third, community characteristics may respond to the availability of public goods, as in the Tiebout
framework, which makes it hard to identify the causal effects of community characteristics. These problems
are now well-recognized in the empirical literature on public goods and empirical strategies have tried to
address them with varying degrees of success. Unfortunately, except in a few specific instances, identifying
causal effects remains difficult and much of what we believe is based on suggestive correlations that are
woven into a plausible story.
3.1 Empirical Methods
The typical empirical relationship that is estimated in this literature takes the form
yjkt = f(pjt,xjt). (8)
The dependent variable yjkt is a measure of access or quality of public good k in community j at time
t, pjt is a set of population characteristics of the community in year t and xjt is a vector representing
various geographical and historical features of the area in which the community is located. The population
characteristics pjt are of principal interest because they are directly related to the various mechanisms in
the theoretical models of collective action. These typically include the shares of various population groups in
the community (to capture the effects of different preferences or power), measures of social heterogeneity (to
capture social cohesion), and measures of income or asset inequality (to capture economic heterogeneity as
well as the distribution of benefits from public goods). The variables xjt might include population density,
village size, terrain, climate and other features of an area which might influence the demand for different
public goods and the costs of providing them.
In this context, we should note that there is no universally accepted measure of the cohesion of a given
group or population. It is most common to represent social heterogeneity by the index of ethnolinguistic
fragmentation,
hf = 1−n∑
i=1
ξ2i (9)
where ξi refers to the population share of the ith group. This is a measure that is maximized when there is
a large number of very small groups.
An alternative is to use the measure of polarization proposed by Esteban and Ray (1994) which captures the
idea that two big groups may have a harder time working together than many small groups. Their measure
takes the form
hp = An∑
i=1
∑j 6=i
ξ1+αi ξj δij , α ≥ 0
16

where δij denotes the social distance between group i and group j. Assuming that δij is a constant (nor-
malized to 1) for i not equal to j (and δii is zero) this is the same as
hp = An∑
i=1
ξ1+αi (1− ξi).
Notice that for the case where all the ξi = 1m and α = 1, this expression is exactly the one on the left hand
side of equation (7) derived in the previous section. There is therefore at least one model for which an index
of polarization corresponds exactly to a measure of (the lack of) social cohesion. In fact, as pointed out
by Montalvo and Reynal-Querol (2005), there is a close relationship between this specific class of models of
public action and the specific measure of polarization where α = 1, that goes beyond the special case of
equal group sizes.
Different measures work well in different settings: Using data for 138 countries between 1960-1999, Mon-
talvo and Reynal-Querol (2005) find that polarization measures are important predictors of civil wars while
fractionalization measures have no statistically significant effect. In contrast, Alesina et al (2003) find that
fractionalization performs better than polarization in explaining long-run growth across countries and that
the explanatory power of fractionalization measures improves significantly when coarse classifications of eth-
nic divisions are replaced by finer ones. However, it is not clear that either of these measures is particularly
effective in capturing the many aspects of social distance that are relevant to collective action: the fact that
one works better than the other in certain cases might be largely fortuitous.
3.2 The Role of Group Characteristics
3.2.1 Group Tastes and Group Influence
Group preferences are not directly observable and evidence linking public goods to preferences is therefore
fairly limited. Group influence on the other hand can be more easily linked to legislative and institutional
changes, and the literature here is therefore more substantial. In fact, as we will see below, changes in group
influence, and the resulting changes in the composition of public goods, can often reveal information about
differences in preferences across groups.
One approach to testing whether the availability of public goods responds to group preferences is to identify
variables that determine the economic returns to public goods and examine whether the availability of these
goods responds to changes in these returns. Foster and Rosenzweig (2000) use data from a panel of 245
villages in India and find that between 1971 and 1982, secondary school enrollments and school construction
both responded to the rapid growth in agricultural yields. These investments in schooling were greatest in
areas with a high fraction of landed relative to landless households. They argue that technological changes
17

and the corresponding rise in yields made education more valuable and that the investments in public
schools are therefore responses to the increased demand for schooling. They link the land distribution to
public goods by emphasizing that it is the landed who make decisions on technology adoption and benefit
most from schooling during a period of rapid technological change. The demand for schooling among the
landless may actually fall as the withdrawal of children of landed households from the labor market increases
agricultural wages and therefore the opportunity costs of sending children to school rather than to work.
Their story is plausible, but the data are also consistent with other explanations. For instance, schools (and
other public goods) expanded rapidly through the Indian countryside in the 1970s as part of the government’s
Minimum Needs Program, and it may be that the political leverage of the landed relative to the landless
allowed them to appropriate a large share of these newly provided public goods. To be more convincing, one
would have to show that it was precisely those public goods that farmers would want in times of substantial
technological change that became more widely available to them and that the structural changes in the
economy that accompanied technological change did not commensurately raise the returns to education for
the landless.
Cultural norms and religious beliefs can sometimes provide us with information on group preferences. In the
caste-based social hierarchy of rural India, Brahmans are the elite priestly caste. Banerjee and Somanathan
(2006) use data for Indian parliamentary constituencies and find that in the early 1970s, the population
share of Brahmans in a constituency is positively correlated with access to primary, middle and secondary
schools, to post offices and to piped water. These are precisely the goods we would expect them to value
given their traditional role as the repositories of written knowledge and the norms of ritual purity which
prevent them sharing wells and other common water sources. Brahman concentrations are not associated
with more of other public goods such as electricity connections, health centers, roads or transport services.
Preferences for this latter set of goods is more likely to be similar across the different castes.
Some studies have used exogenous changes in the political voice of particular groups to understand both
the nature of a social group’s preferences and their effects on public good provision. The idea is that these
political shocks translate into demand shocks for public goods. An interesting example of this approach is
Acemoglu, Johnson and Robinson (2001), who observe that the early mortality rates of European settlers
had a strong influence on settlement patterns in the European Colonies of the 18th and 19th centuries.
Places where the early settlers did relatively well attracted more Europeans settlers and as a result, these
areas ended up with institutions and public goods which the Europeans demanded.
Another case of a change in political voice followed the 73rd Amendment to the Indian Constitution (passed
in 1992), which reserved a certain fraction of the positions of the heads of village governments for women.
The villages which are reserved are chosen at random at each election. Chattopadhyay and Duflo (2004) use
this policy change as a natural experiment to examine the impact of a change in political power distribution.
18

They find that political reservation for women in local government results in greater provision of goods which
women value, such as drinking water and roads.
Changing political voice may not be a simple matter of passing appropriate legislation, as shown by the
experiences of the Scheduled Tribes and the Scheduled Castes in India.19 Both groups have long been
recognized as disadvantaged, and affirmative action policies were put in place to increase their representation
in politics and within the bureaucracy. Pande(2003) finds that reserving electoral constituencies for Scheduled
Caste candidates results in higher job quotas and greater welfare spending for that group while similar policies
for the Scheduled Tribes do not seem to lead to the same benefits. Similarly, Banerjee and Somanathan
(2006) find that, between 1971 and 1991, areas with higher Scheduled Castes populations experienced a
rapid expansion in public goods while those with high concentrations of Scheduled Tribes continued to lag
behind. We should note that the Scheduled Castes began to mobilize effectively in the 1970s and that a
major political party representing their interests came to power in the North Indian state of Uttar Pradesh
in the 1980s. Scheduled Tribes on the other hand remained isolated, both geographically and politically.20
While one cannot rule out the possibility that these relationships might be driven by omitted variables
(perhaps Scheduled Tribes live in remote areas or in low population density areas and these are just harder
to reach with public goods), patterns of provision do appear to mirror changing political equations.
3.2.2 Distribution of benefits
In general it is not easy to separate the effects of inequality in the distribution of benefits from that of
inequality in the underlying asset distribution, for the simple reason that inequality of benefits is often a
result of inequality in assets. Khwaja (2002) tries to deal with this by separately measuring assets and
benefits. Even after controlling for inequality in the land distribution, inequality in benefits has a significant
U-shaped effect. Increases in inequality at low levels of inequality hurts the maintenance of public projects,
but further increases at higher levels of inequality actually lead to greater maintenance. As noted in the
theory section, Khwaja also suggests a reason for why he finds a U-shaped relationship.
Foster and Rosenzweig (1995) provide an interesting example of the Olson effect, though in a context that is
slightly removed from our main concern here. They are interested in the fact that farmers often free-ride off
the experiences of other farmers with new agricultural technologies i.e. knowledge about new agricultural
technologies is a public good.21 Since those who have the most land have the biggest stake in experimentation,19The Scheduled Castes have historically been at the bottom of the Hindu caste hierarchy and the Scheduled Tribes in India
are groups outside the Hindu caste system.20Chandra (2004) documents the rise of the Scheduled Castes in Indian politics and speculates on reasons for the poor
mobilization of the Scheduled Tribes.21The chapter by Munshi in this Handbook surveys several other instances where the public good in question is information
about new technologies.
19
big farmers will experiment the most and as a result a small farmer who lives next to a big farmer will
experiment less than a small farmer who is next to another small farmer. Using data from the introduction
of high-yielding varieties (HYV) of cereals in India, they find that those who have more assets do adopt
HYV sooner, but those whose neighbors have more assets adopt late.
3.2.3 Cohesion
Much of the empirical work on public good provision focuses on the relationship with social and economic
heterogeneity. Alesina, Baqir and Easterly (1999) pioneered this literature by analyzing data on public ex-
penditures from a cross-section of US cities in 1990. They regress the share of expenditures on specific public
goods on per capita income, city size, average educational attainments, income inequality, age structure and
a measure of ethnic fragmentation (based on a five-way classification of ethnicities). They find that more
fragmented cities spend proportionally less on schooling, roads and trash pickups but more on health and
police, even after controlling for the population shares of specific ethnic groups and whether the city is
majority African-American.
The empirical work is subject to three caveats which are common to most other papers on this topic. First,
it is not clear how one should interpret the welfare implications of these results. Can we be sure that
heterogenous communities are not simply substituting other, equally useful, public goods for the ones that
they are under-supplying? It is not clear, for instance, that the increased spending on health and police is
less useful than spending on schools or roads. Second, do the results indicate that there is less collective
action when there are more groups (as Alesina et al believe), or is it the case that multiple groups actually
generate more collective action, but that the collective action is wasteful (as Esteban and Ray suggest)?
Finally, and perhaps most importantly, it is not clear how one would establish the exogeneity of the hetero-
geneity measure. A number of factors that can affect heterogeneity (such as urbanization, being in a border
area, being near a major road or waterway, being next to a region where there was a war and therefore a
large exodus) can also directly influence other economic outcomes, including the demand for and the supply
of public goods. There is also the possibility of reverse causality: the poor, for example, may converge to an
area which is effective in delivering public goods for the poor, making the area much more homogenous than
it would be otherwise. Given that the measures of heterogeneity are usually more or less contemporaneous
with the measures of public good availability, this is likely to be a serious problem, especially in high mobility
environments.
Alesina et al (1999) try to address the endogeneity issue by using community fixed effects, but once they
include fixed effects as well as all their controls, the effect of heterogeneity becomes insignificant or even
positive. However, their results get some support from a companion paper: one natural implication of the
20
view that heterogeneity makes it harder to provide public goods is that people will want to separate into
smaller jurisdictions. The constraint is that there are increasing returns to scale in urban agglomerations,
which makes it costly to have very tiny jurisdictions. Over the 20th century the number of jurisdictions
(school districts) in the United States has decreased by a factor of 12. Alesina, Baqir and Hoxby (2004)
find that this process of consolidation was significantly slower in areas where racial heterogeneity increased:
Areas where racial heterogeneity went up by 2 standard deviations between 1960 and 1990 lost 6 fewer
jurisdictions over the same period. They find similar results for ethnic heterogeneity among Whites as well.
People do indeed seem to prefer to live with people like themselves. If there are returns to scale in the
production of public goods, as seems plausible based on the overall tendency of communities to consolidate,
this is compelling evidence that heterogeneity hurts.
Several subsequent papers have looked at the same question in a developing country context. Overall, the
results indicate a negative relationship between heterogeneity measures and access to public goods, but it is
not fully clear whether these results can be interpreted in a causal sense.
Banerjee and Somanathan (2006) limit the substitution problem mentioned above by looking at actual levels
of public goods (where a particular community can do better along all dimensions) rather than expenditure
shares, where some substitution is inevitable. They also look at several different public goods, including
various types of schools, health facilities, water sources, power sources and communication and transport
facilities. They construct a fractionalization index of social heterogeneity using population shares of non-
Hindu religions (Muslims, Christians, Sikhs, Jains, Parsis), as well as 185 distinct Hindu caste groups. Their
data show that Indian society is extremely fragmented: the measure of caste and religious heterogeneity
has a mean of 0.9 in 1971, compared to the mean value of 0.26 for U.S. cities reported by Alesina, Baqir
and Easterly (1999). They also control for economic inequality, geographic variables (temperature, rainfall,
barren land, being on the coast, average village size, number of villages), state fixed effects and a measure
of political competition in the constituency. Of the fifteen different public goods considered in 1971, they
find that the social heterogeneity measure has a significant negative effect in six cases and positive in two.
The coefficient on the Gini index of land ownership is positive in eight of the 15 cases and never negative,
perhaps reflecting the advantage of concentrating benefits. The social heterogeneity results become much
weaker when they run the same regression in differences, using data from 1971 and 1991, while the effect of
inequality becomes negative. Unfortunately it is not clear whether this reflects a real change in the effect
of heterogeneity, the fact that the data on changes tends to be dominated by measurement error (since
social heterogeneity changes very slowly over time), or the presence of omitted variables in the cross-section
regression.
Miguel and Gugerty (2005) look at the effect of ethnic heterogeneity on school spending in Western Kenya.
In Kenya, a significant part of school expenses are financed by parents through their Harambee contributions.
21
When Miguel and Gugerty regress school spending on school level heterogeneity, they find an insignificant
or slightly positive effect of heterogeneity. However, school heterogeneity is likely to be endogenous since
mobility between schools is fairly easy, and good schools are likely to be chosen by parents from all social
groups who are committed to education. When they use the regional ethnic composition to instrument for
school level heterogeneity, they find a negative effect of heterogeneity on school outcomes. Going from a
perfectly homogenous school to one with the average level of diversity reduces school spending by 20%, and
also significantly reduces the number of desks and textbooks per pupil. They also find that wells are better
maintained in the more homogenous areas. However it is not clear that using region-level heterogeneity to
instrument for school level heterogeneity solves all the identification problems: after all, a region that is more
open to outside influences may be both more heterogenous and more serious about education.
There are a number of other interesting papers that look at the correlation between heterogeneity and public
good outcomes without really trying to establish a causal relationship. Khwaja (2002) looks at the effect
of village-level social heterogeneity (based on religious and political differences as well as clan divisions)
on the maintenance of public infrastructure in that village, using data he collected from rural Baltistan in
north Pakistan. He finds that more heterogeneity is associated with significantly worse outcomes. Baland
and Platteau (1998) and Dayton-Johnson (2000) find a negative relationship between social or economic
heterogeneity and maintenance of the commons, while Somanathan, Prabhakar and Mehta (2005) find no
relationship. Baland, Bardhan, Das, Mookherjee and Sarkar (2003) look at firewood collection in Nepal and
find that social heterogeneity increases firewood collection (implying worse maintenance of the commons)
but economic inequality reduces collection, perhaps because the benefits are more concentrated, as discussed
above.
Banerjee, Mookherjee, Munshi and Ray (2001) try to identify a causal relation using a more theory-driven
approach. They model a very specific public good setting: the productivity of a sugar farmers’ cooperative,
which jointly runs a sugar crusher. They begin from the observation that the productivity of the cooperative
depends on paying prices to the sugar growers that are rewarding enough. On the other hand, a cooperative
that pays lower-than-optimal prices makes profits, which can be skimmed by the farmers who control the
cooperative. When small farmers are in an overwhelming majority, they make sure that this does not happen
and high prices are maintained. When the large farmers dominate, low prices are much more likely unless
large farmers are so numerous that the distortion caused by the low price starts hurting large farmers more
than they can gain by capturing the profits. Hence cooperatives with a very low or a very high share of
large farmers will have high prices. Banerjee et al test for this U-shaped relationship using data from sugar
cooperatives in the state of Maharashtra in India and find that there is indeed such a relationship between
the share of small farmers in the area around the cooperative and the price of sugar. They include fixed
effects for the area around the sugar cooperative in all their regressions, to control for possible omitted
variables. More compellingly, they also show that the participation of the larger farmers in the area moves
22
in the opposite direction to the price of sugar-cane while the participation of the smaller farmers mirrors the
price: if the movements in the price were driven by unobserved differences in productivity, one would have
expected the participation of the small and the large farmers to co-move.
An alternative way to deal with the endogeneity problem is to focus on the effect of specific shocks that
radically altered the social structure. Engerman and Sokoloff (2000, 2002) observe that among the European
colonies in the Americas, the ones where the climate was suitable for the cultivation of sugar (e.g. Brazil,
Haiti) or where there was considerable scope for extractive industries (e.g. Mexico, Peru), ended up with
much less egalitarian institutions than the ones where there were no such possibilities (e.g. United States,
Canada). This is because the presence of these highly profitable but labor intensive industries made it very
important for these economies to have a large and docile labor supply, which was ensured by either importing
slaves or enslaving the local population. This created a society with high inequality and consequently much
less cohesion. In particular, Engerman and Sokoloff argue, the elites controlling the state were not particularly
interested in investing in education for the masses, since educating the masses was likely to make labor more
expensive. This resulted in much lower literacy rates in the sugar/extractive colonies than in the United
States and Canada, for example.
In a similar vein, Banerjee and Iyer (2005) focuses on the long-term impact of being assigned a particular
land revenue collection system by the British colonial rulers in India. They distinguish between a landlord-
based system, where the landlord was assigned the primary responsibility for collecting land revenue from
that area and a non-landlord system where the taxes were effectively collected directly from the peasant.
They argue that the landlord-based system introduced a class of powerful intermediaries between the rulers
and the ruled, and this class was perceived (probably rightly) to be exploitative by the peasant population,
who consequently harbored strong negative sentiments against them. While the landlord-based system was
abolished (along with all land revenue collection systems) in the early 1950s, this history of class conflict
made rural society in the ex-landlord areas less cohesive and therefore less effective in getting public goods.
Using district-level data from the 1981 Indian census, they find that formerly landlord-controlled areas indeed
lag behind in the provision of schools and health centers, and consequently have lower literacy rates and
higher infant mortality rates. Some indication of the different social climate is provided by the fact that
rates of violent crimes (such as murders) are much higher in ex-landlord areas. The potential endogeneity
of the land revenue system is dealt with by exploiting changes in British land revenue policy over the 19th
century to construct instrumental variables estimates.22
The impact of historical landlord control persists in the 1991 census data: Banerjee, Iyer and Somanathan
(2005) extend the analysis to a wider range of 25 different public goods, and they also control for caste and
22Specifically, Banerjee and Iyer (2005) use the fact of being conquered by the British in the period 1820-1856 as an instrument
for being non-landlord. The paper contains detailed discussions of the validity of this instrument.
23

religious fractionalization and a dummy for being directly ruled by the British in the past. As in Banerjee
and Somanathan (2006), they include a wide range of geographic and population characteristics as controls.
The OLS estimates of the non-landlord effect are positive and significant for 13 of the 25 goods and negative
and significant for three. In related work, Pandey (2005) compares one landlord area (Oudh) with the area
surrounding it (which was non-landlord) and finds that while both areas have the same level of access to
primary schools in 2002, teacher attendance is 17% higher in the non-landlord area schools and teacher
activity is 32% higher.
Overall, these results suggest that where heterogeneity is highly salient because of historical circumstances,
it can be a major constraint on public action, but necessarily otherwise.
3.3 Public Goods Experiments
There have been a large number of laboratory experiments on Voluntary Contribution Mechanisms. In the
simplest experiment of this type, subjects are divided into groups and given a fixed endowment of tokens.
They are asked to choose the fraction of their endowment that they would like to contribute to a group project
or public good. The group members decide, simultaneously and independently, on their contributions The
experimenter totals group contributions, doubles them (or multiplies them by some other constant) and
divides this amount between the subjects in each group. Each member’s payoff consists of an equal share of
the group return plus the amount the member decided not to invest in the project. These experiments are
typically set up such that the first-best outcome involves some level of positive contributions by all members
and Nash equilibria are characterized by under-provision of the public good.
A survey of the results from such experiments is found in Ledyard(1995). A common finding in this literature
is that subjects generally contribute more to the public good than predicted by Nash-equilibrium strategies.
In one-shot trials, contributions are usually positive and total to about 40%-60% of the socially optimal level.
With repeated trials, most studies find that contributions tend to decline towards Nash-equilibrium levels.
These results are similar in flavor to those obtained from experiments on ultimatum bargaining games. There
has been some debate about whether the positive contributions reflect altruism and cooperative behavior or
whether they are just mistakes made by agents who would like to maximize their own payoff but do not fully
understand the structure of the game. To distinguish between these possibilities, experiments have been set
up to ensure that both the Nash equilibrium outcome and the social optimum are interior so that mistakes
can be made in both directions (by contributing both too little and too much), while altruism would always
result in contributing too much. The results obtained suggest that a sizable fraction of subjects do seem
to behave selfishly but a sizeable fraction does not, which raises questions about the modeling of collective
action in the theoretical literature summarized above.
24

The effects of group size on public goods has also been studied in an experimental setting. Issac and Walker
(1988) perform experiments with groups of two different sizes and find that larger groups exhibit more
free-riding, but mainly because marginal returns fall as the group size increases. To isolate the “ pure
numbers-in-the-group” effect from the effect of declining marginal returns, they increase the return from
investing in the public good for larger groups in a manner that keeps the marginal return roughly constant.
They find that most of the group-size effect can be attributed to differences in marginal returns from the
group activity. Once this is controlled for, individuals in larger groups do not to contribute less.
A variety of approaches have been used to test the role of inequality or heterogeneity within the group
on public goods. Cardenas, Stranlund and Willis (2002) conduct experiments in rural Colombia in which
subjects allocate a fixed time endowment between collecting firewood and a market activity. To examine the
role of heterogeneity, they contrast the results of two treatments: One in which the return from the private
activity is the same across agents and another where the return is unequal. They find that public goods levels
are higher (firewood extraction lower) when returns are unequal. This happens because increases in private
returns lead to lower extraction levels, while decreases do not increase extraction very much (theoretically,
this could go either way as shown in Section 2.4). Anderson, Mellor and Milyo (2004) introduce heterogeneity
into the voluntary contributions game by varying the distribution of payments for participation rather than
changing payoffs within the game. In experiments with college students, they find that heterogeneous show-
up costs lower public good contributions but this happens primarily when the distribution of these costs
is publicly observed. Their results suggest that the some of the effects of heterogeneity on public goods
may stem from psychological effects of heterogeneity on perceived status. Cardenas (2003) also finds that
awareness of payoff asymmetries lower contributions in heterogeneous groups.
Of special interest in the class of public goods experiments are those which estimate the importance of
group monitoring and communication on the size of contributions. Monitoring in these games means that
group members are informed about the value of total group contributions between successive trials of the
experiment. Communication refers to allowing subjects a few minutes to converse before they decide on
contributions. There are usually no restrictions on the nature of this conversation and subjects can use this
to coordinate their actions or just to get to know each other. This communication is strictly cheap talk in
the sense that it is not allowed to directly influence payoffs. Cason and Khan (1999) design an experiment
to compare the effects of communication and monitoring in voluntary contribution games. In the perfect
monitoring case, subjects are informed about total contributions after each round, while in the imperfect
monitoring case, this information is available after every six rounds. Their results on communication are
particularly striking: They find that in the absence of communication, contributions with both types of
monitoring are fairly similar and decline over time. In the presence of communication, overall contributions
are much higher (about 80% of the tokens were invested in the group activity as opposed to a high of 40%
in the no-communication case) and did not decline in later rounds. Monitoring thus improved contributions
25

only when it was combined with communication. The favorable effect of communication on contributions in
public goods experiments is observed quite generally under many different experimental designs (Ostrom,
2000).
The communication effects described above can be used to justify measures of heterogeneity such as the
ethnolinguistic fractionalization index. If it is true that most communication takes place within groups, and
that communication favorably influences contributions to group activity, then we would expect an index that
is correlated with the frequency of within-group interactions to explain the provision of public goods. On
the other hand, the groups in these experimental settings consist of strangers and communication is limited
to a brief conversation. If group identities are contextual and can be so quickly created, it is quite possible
that the social classifications that we often observe in census and survey data are not the most appropriate
ones. It is also possible that, even in the absence of mobile populations, the distribution of groups, or at
least group identities, may itself depend on the process by which public goods are provided.
3.4 The Welfare Costs of Public Good Misallocation
The empirical research that we have discussed in Section 3.2 attempts to isolate the causes of variation in
the availability of public goods. It demonstrates that the uneven political leverage of social groups and their
various other characteristics can skew the allocation of public goods in favor of some groups and against
others. In this section we briefly discuss some recent approaches to measuring the aggregate welfare costs
associated with this misallocation of public facilities.
There has been a very rapidly expanding computer science literature on facility location that deals with
spatial optimization problems. A common problem in this class is one in which there is a given (arbitrary)
distribution of the population across a finite set of locations and a fixed number of facilities are to be
allocated to a subset of these locations. In a typical developing country, we can think of the locations
as villages and facilities as centrally financed public goods (schools, health centers, post offices). Suppose
that social welfare is decreasing in the aggregate distance travelled by the population. For small numbers
of citizens and facilities, the total number of possible spatial configurations of facilities remains small and
one can simply compute the allocation of facilities that minimizes distance travelled. A measure of the
cost of misallocation is then the difference between the distance travelled under the actual and the optimal
allocations. As the number of villages increases, the number of computations involved increases exponentially
and this optimization problem becomes intractable. A variety of optimization algorithms have been recently
developed which provide approximate solutions. The difference between the actual distance travelled and
the distance corresponding to the algorithmic solution is then a lower bound on the welfare cost of public
good misallocation.
26

Athreya and Somanathan (2006) adapt an algorithm in the facility location literature and apply it to the
allocation of post offices in a region of South India. Between 1981 and 1991, there was a 23% increase in
the number of villages with post office facilities in the area studied. They find that aggregate travel costs
corresponding to the observed allocation of post offices in 1991 are 21% higher than the costs associated with
the (near)-optimal allocation of the additional post-offices. Rahman and Smith (1999) study the location of
Health and Family Welfare Centres in an administrative region of Bangladesh, and find that relocating a set
of seven centres can reduce the mean distance travelled by 43%. These papers, in themselves, do not offer
any clues to the reasons for misallocation. Given however, that they both deal with fairly small geographical
areas (an administrative block in South India and a Bangladeshi thana, each with less than a quarter of a
million people), the social composition of villages does not vary very much. Bureaucratic mistakes could
thus be a large part of the explanation, given the difficulty in computing optimal allocations.
The types of problems that have been studied so far in this literature are still fairly specific and little is
known about the optimality of available algorithms when applied to non-linear travel costs and multi-period
settings. The field is however expanding rapidly. As spatial data becomes widely available this approach
can be very valuable in improving the delivery of public goods.
4 Some Top-down Interventions
Much of the evidence summarized in the previous section points to the importance of local population
characteristics in determining access to public goods. There are two major caveats to this set of results. The
first is that population variables, even when they exhibit systematic effects on the availability of public goods
and on associated outcomes, leave much of the observed variation in these variables unexplained. The World
Development Report 2006, for instance, reports significant differences in educational attainment between
urban and rural populations and between males and females; yet, the share of inequality attributable to
location and gender on average is only 6% and 2% respectively. Among the papers cited in the previous
section, the explanatory variables in Miguel and Gugerty (2005) account for less than 25% of the variation in
school funding across schools and those in Banerjee and Iyer (2005) account for about 30% of the variation in
public good outcomes. This bring us to the second caveat: If local population characteristics were the only
determinants of public good access, then we would be less likely to see rapid changes in public good access,
since many of these characteristics (religion, caste, ethnicity) change very slowly over time. However, we do
see extremely rapid progress made by several countries on many public good measures and such progress
often involves the convergence of under-provided areas with those that have been historically advantaged.
In this section, we discuss the role of top-down interventions in bringing about these changes.
Many of the major expansions in public schooling have taken place under colonial or autocratic regimes. In
27

the last quarter of the 19th century and the first quarter of the 20th century, large parts of the presently
developing world were ruled by colonial powers. One might expect the compulsions of these powers to be
roughly similar with regard to the provision of public goods, yet the differences in provision across the
different types of colonies are very large. In 1930, the mean primary enrollment rates for British colonies
was 35%, the corresponding figure for French colonies was about half of this (Benavot and Riddle, 1988).
Dutch colonies were somewhere in between, and Belgian and Portuguese colonies had the worst outcomes.
More recently, in Indonesia, in the five years between 1973-74 and 1978-79, more than 61,000 primary schools
were built under the Sekolah Dakar INPRES program; this more than doubled the number of schools in the
country (Duflo, 2001). While the autocratic Suharto regime probably had a specific political purpose behind
this intervention, the fact that it was based on a rule that explicitly targeted under-served areas and that
this rule was largely followed, suggests that there was very little local influence on the decision to build the
schools.
The erstwhile princely states of India provide us with interesting cases where autocratic rulers seem to
provide public goods even when there are limited political incentives to do so. These princely states were
parts of India that had accepted the overall suzerainty of the British and, in return, were allowed to retain
a large measure of internal autonomy. The presence of the British army guaranteed that the power of these
rulers was unchallenged within their domains, and they could afford to ignore the wishes of their people.23
Despite the fact that they were under very little pressure to deliver, some of the rulers did invest heavily
in public goods and the high social outcomes observed in some areas today are, to a large extent, a legacy
of these investments. The Travancore state in present-day Kerala is particularly well-known for its long
tradition of enlightened rulers. In 1817, the Regent Gauri Parvathi Bai declared, “The state should defray
the entire cost of the education of its people in order that there might be no backwardness in the spread
of enlightenment among them, that by diffusion of education they might become better subjects and public
servants and that the reputation of the state might be enhanced thereby.” This remarkable announcement
was said to be heavily influenced by the diwan (prime minister) James Munro, and it set an important
precedent for state action in education. In particular, the reign of Swati Tirunal (1829-1847) was regarded
as a “golden age” for the state. An English school was opened in Trivandrum in 1834, and schools were
established in each district as well. His successors were all committed rulers who continued the process of
reforms in various branches of the government; Mulam Tirunal Rama Varma (1885-1924) introduced an
Education Code, opened the schools to children of untouchable communities and even set up a Popular
Assembly consisting of elected representatives of the people. The contribution of the Travancore rulers to
education in the state went far beyond expanding enrollments. The Travancore Administrative Report of 190123British administrative intervention in these kingdoms was limited to posting a British Political Agent or a British Resident
in these states. The Resident’s reports of misrule could result in a ruler being deposed by the British and another being set up
in his place. This was relatively rare.
28

records 809 students in the Maharaja’s High School of whom 800 had received vaccinations. The students
came from both the priestly Brahman caste and the lower castes and from a wide range of occupational
groups. This was quite remarkable given the numerous accounts of bitter caste conflicts in the State at that
time.
We see a similar pattern in nearby Cochin, where Munro again acted as diwan. In both Travancore and
Cochin, he reorganized the administration of the states along the lines of the system in British India and
played a large role in eradicating corruption. He was also instrumental in setting up vernacular schools
in every village of Cochin state. Future diwans of Cochin continued on the path of progressive reforms,
introducing western medicine and English schools, and expanding access to education for all sections of
society. We should note that while some public investments might be motivated by the desire to expand the
tax base, it is unclear that setting up an English school was such a case at that time. After all, the British
colonial state, never shy to make investments that expanded the tax base, set up the first English school in
British Malabar (northern region of modern Kerala state) only in 1848.
Another dynamic ruler was Sayajirao III of Baroda in present-day Gujarat state, who declared that education
was “absolutely necessary for the realization of my ambitions and wishes for the future of my people.” The
state ordered that schools be provided in all villages which could produce 16 children willing to attend;
Sayajirao was also the first to introduce compulsory education in certain areas in 1892. It took the British
more than twenty years to introduce a similar law in the neighboring Central Provinces.
In more recent times, the Indian state has made important commitments to public good provision. These
commitments first appeared in the late 1960s. In 1968, the ruling Congress Party brought out the National
Policy on Education, which made a commitment to universal primary education. The Minimum Needs
Program of 1974-75 set down explicit norms about access to public goods in rural areas: a primary school
and safe water within a mile of every village, paved roads to villages with populations over 1000, electricity
to at least 40 percent of villages in every state, and a multi-tiered health system. Indira Gandhi made the
removal of poverty (Garibi Hatao) the cornerstone of her successful election campaign in 1971. This rhetoric
was accompanied by concrete results. Between 1971 and 1991, the fraction of villages with primary schools
went up by about a third and those with high schools doubled. The fraction of villages with electricity
almost quadrupled, the fraction with phone connections went up by a factor of six and those with piped
water increased nine-fold. This increase was also specifically targeted at bringing about equality of access.
Banerjee and Somanathan (2006) find that for 12 out of 15 public goods, higher access in 1971 is associated
with significantly slower growth in the subsequent period. This is by no means a mechanical effect of access
being close to complete: half the goods were available in less than 5 percent of Indian villages in 1971 and
in less than 10 percent of villages in 1991.
29

There have been a variety of other nationally mandated programs which have been shown to improve health
and educational outcomes in India over the last two decades. In education, Operation Blackboard (starting in
1987) and Lok Jumbish (started in 1992), significantly increased the availability of teachers and infrastructure
in areas with poor educational outcomes.24 The program of Integrated Child Development Services (ICDS),
introduced in 1975, is a good example of how top-down interventions interact with local characteristics. The
program, funded by the government and various donor agencies, expanded very rapidly in the 1990s and
now covers over 7 million mothers and 34 million children below the age of 6.25 Although the program is
envisioned to have universal coverage, current coverage still varies widely across states and more importantly,
survey evidence shows that the functioning of ICDS units and workers is strongly driven by the degree of
involvement of mothers in the program.26
Top-down interventions do not need to be initiated by governments or political actors. For instance, an
NGO is one of the biggest suppliers of primary schooling in Bangladesh: BRAC’s Non-Formal Primary
Education Program (which covers the same competencies as the government schools) had grown from 22
one-room schools in 1985 to 49,000 schools in 2004, accounting for about 11% of the primary school children
in Bangladesh.27 BRAC also has large health-care and microfinance programs, and has recently expanded
its activities into Afghanistan and Sri Lanka. Singh (2006) describes how a group of committed bureaucrats
created the innovative Lok Jumbish program in Rajasthan, with the goal of promoting primary schooling.
A recent innovation in top-down interventions is the trend towards explicit experimentation, as a way to
find ways to improve the effectiveness of public good delivery. A number of them focus on corruption
and governence issues. In one such experiment, conducted on behalf of the Indonesian government, Olken
(2005) finds that corruption in road construction in Indonesia was substantially reduced (and road quality
improved) when an auditing program was introduced. Duflo and Hanna (2005) describe another experiment,
conducted on behalf of an NGO in India, which shows that using cameras to monitor teacher attendance
reduces absenteeism and improves test scores in rural primary schools. Other experiments look at the benefits
of providing additional resources: for example, Glewwe, Kremer and Moulin (1997) and Glewwe et al (2004)
find that providing more textbooks or flip charts to schools in Kenya at best improves the test scores of the
top quintile of students, without much improvement in the overall level of learning.
Finally, Miguel (2004) argues that one way in which a top-down actor can influence the allocation of public
goods is by manipulating the conditions under which the bottom-up processes operate. He describes the
contrast between Kenya and Tanzania, which shared many common characteristics during the colonial period.24Chin (2005) contains an evaluation study of Operation Blackboard and Singh (2006) discusses the Lok Jumbish program.25http://www.unicef.org/india/nutrition−1556.htm26State coverage figures are available at http://wcd.nic.in. Dreze (2006) contains data from the FOCUS survey of ICDS units
and participating households across seven Indian states.27http://www.brac.net/history.htm
30
After independence, the Kenyan leadership played up tribal loyalties for political reasons and little effort was
put into building a Kenyan identity; in contrast, the Tanzanian leadership put a lot of emphasis on creating
a single Tanzanian identity. This seems to have implications for public good provision: in the Busia region
of Kenya, ethnic heterogeneity at the local level is negatively correlated with the quality of public goods
(mainly schools), while in the nearby Meatu region of Tanzania, they are slightly positively correlated.
Taken together, these examples make a number of useful points. First, it seems clear that an agency with
sufficient political will, be it a dictatorial state or a local NGO, can improve access to public goods, irrespec-
tive of local conditions. Second, there might be important interactions between top-down and bottom-up
process that are not captured in the current literature. In the case of Kerala, after the initial set of initiatives
led by the local kings, the next stage in the expansion of access to public schools was actually much more
bottom up—the result of lower caste social movements in the late nineteenth and early twentieth centuries
(Singh, 2006 and Ramachandran, 1997). These movements might have been launched in response to the
original top-down interventions that made access to education a salient issue, but they took the process
much further. The fact that Gujarat, which started out as the other early leader in education in India (see
the discussion of Baroda state above), is now much like the average Indian state, while Kerala is almost at
100% literacy, may be a result of differences between them at this later, bottom-up, stage.
5 Conclusion
We began this chapter by documenting the enormous spatial variation that is commonly observed in the
availability of public goods. We proceeded to survey the now substantial literature that links this variation
to the characteristics of groups and the ability of their members to act collectively to promote group inter-
ests. Theoretical approaches in this area explain the under-provision of public goods in terms of individual
incentives to free-ride in group endeavors and, since group characteristics influence these incentives, they also
predict variations in access. Empirical research on group characteristics and public good provision finds that
while these characteristics do matter, the social composition of communities is able to explain only a fraction
of the total variation in provision. The experimental evidence is also not entirely conclusive: Experiments
on voluntary contribution mechanisms find that group contributions are generally below socially optimum
levels but often above those corresponding to Nash equilibrium strategies. Moreover, these experiments find
that communication between members can be important in achieving group cooperation, even if it is not
directly linked to payoffs. This suggests that group identities can be created by communication, something
our models currently do not allow.
More generally, the research on group characteristics and collective action surveyed here suggests that there
are many missing pieces to the public goods puzzle. Access to many basic public goods is likely to converge
31

in the coming years. Some areas that have had historically poor access are currently in the midst of major
economic expansions accompanied by rapid increases in public good coverage. As this happens, we will
need to shift our attention to quality differences, where both the theoretical and empirical literature is in its
infancy. There are several challenges to delivering quality rather than access. First, quality is much harder
to evaluate than access–anyone can see that there is no school building in the neighborhood, but judging
whether the children are learning as much they should, can be quite a challenge. This makes it harder
both to demand quality and to deliver it. Second, the incentives of the government bureaucrats may be
very different in delivering access versus quality. For instance, they may favor school construction and even
hiring new teachers for venal personal reasons (such as corruption or being able to give contracts to favored
parties), but they clearly have no financial stake in getting the teachers to work.
Another major deficiency in this literature is the absence of a body of knowledge on the technology of deliv-
ering public services. Even in the absence of political competition and rent-seeking by different communities,
the efficient allocation of public goods requires the ability to compute optimal allocations and provide bu-
reaucrats the incentives to implement them. This is not a trivial exercise. The field of spatial optimization
techniques has been expanding rapidly and shows that optimal allocations can, at best, be computed quite
approximately. We still know relatively little about the extent to which misallocation results from these
types of information gaps. This is likely to be a fruitful area of future research.
The problem of providing the right incentives to government agents is related to the question of the ap-
propriate level of political and administrative decentralization.28 This has been actively debated, yet the
current research offers little guidance. For example, the World Development Report on Making Services
work for the Poor (World Bank, 2004), comes out in favor of giving local communities greater control over
the delivery of public goods as a way of improving quality. While those who consume the public goods
are presumably the ones with the greatest stake in making sure that they work well, the effectiveness of
local control is clearly a function of the ability of the community to act together as well as their ability to
exercise effective control over the providers of public services. This may depend on a range of community
characteristics, as we saw in the first part of this paper, but also on whether decentralized monitors have
the information necessary to evaluate public services. Can a patient really judge whether he is getting the
right medicines? Will remote village level governments know whether building contractors are using the
stated materials, or whether teachers are properly covering the grade-appropriate course syllabus? The field
experiment by Olken (2005) suggests that the task of monitoring may indeed be quite difficult for the village
community: While centralized auditing reduces corruption in his data, greater monitoring by villagers has
no detectable impact on the level of corruption.
The optimal level of decentralization may also depend on project design: perhaps decentralized delivery28Oates(1999) provides a review of the literature on the vertical structure of the public sector.
32
works well only with simple project designs, as Khwaja (2002) seems to suggest. Moreover, even if one opts
for decentralization, there are many more decisions that have to be taken. For instance, is it enough to give
the local community the right to hire and fire the teacher? Or do they also need information about how well
the teacher is doing (from standardized tests, for example)? If allowing them to hire and fire is politically
infeasible, is it still worth giving them information about the teacher’s performance? If, instead, we opt for
centralization, so that hiring and firing teachers is in the hands of some higher level government, how can
we make sure that the government finds out when the teacher is absent, or when the money for books is
stolen before it reaches the school? The recent empirical work mentioned at the end of the previous section
has made a start in answering these important policy questions, but there is clearly much more work to be
done.
References
Acemoglu, Daron, Simon Johnson, and James A. Robinson (2001) ‘The colonial origins of comparative
development: An empirical investigation.’ American Economic Review 91(5), 1369–1401
Alesina, Alberto, Arnaud Devleeschauwer, William Easterly, Sergio Kurlat, and Romain Wacziarg (2003)
‘Fractionalization.’ Journal of Economic Growth 8, 155–194
Alesina, Alberto, Reza Baqir, and Caroline Hoxby (2004) ‘Political jurisdisctions in heterogenous communi-
ties.’ Journal of Political Economy 112, 348–396
Alesina, Alberto, Reza Baqir, and William Easterly (1999) ‘Public goods and ethnic divisions.’ Quarterly
Journal of Economics 114(4), 1243–1284
Anderson, Lisa, Jennifer Mellor, and Jeffrey Milyo (2004) ‘Inequality and public good provision: An experi-
mental analysis.’ Working paper
Athreya, Siva, and Rohini Somanathan (2006) ‘Quantifying spatial misallocation in centrally provided public
goods.’ Working Paper
Baland, Jean Marie, and Jean Phillipe Platteau (1998) ‘Wealth inequality and efficiency on the commons
part II: The regulated case.’ Oxford Economic Papers 50, 1–22
Baland, Jean-Marie, and Jean Phillipe Platteau (2006) ‘Collective action on the commons: the role of in-
equality.’ In Inequality, Cooperation, and Environmental Sustainability, ed. Jean-Marie Baland, Pranab
Bardhan, and Samuel Bowles (Princeton University Press)
Baland, Jean Marie, Pranab Bardhan, Sanghamitra Das, Dilip Mookherjee, and Rinki Sarkar (2003) ‘The
environmental impact of poverty: Evidence from firewood collection in rural Nepal.’ Working paper
33

Banerjee, Abhijit, and Lakshmi Iyer (2005) ‘History, institutions and economic performance: The legacy of
colonial land tenure systems in India.’ American Economic Review 95(4), 1190–1213
Banerjee, Abhijit, and Rohini Somanathan (2006) ‘The political economy of public goods: Some evidence
from India.’ Journal of Development Economics, forthcoming
Banerjee, Abhijit, Angus Deaton, and Esther Duflo (2004) ‘Wealth, health, and health services in rural
Rajasthan.’ American Economic Review 94(2), 326–330
Banerjee, Abhijit, Dilip Mookherjee, Kaivan Munshi, and Debraj Ray (2001) ‘Inequality, control rights and
rent seeking: Sugar cooperatives in Maharashtra.’ Journal of Political Economy 109(1), 138–190
Banerjee, Abhijit, Lakshmi Iyer, and Rohini Somanathan (2005) ‘History, social divisions and public goods
in rural India.’ Journal of the European Economic Association 3(2-3), 639–647
Bardhan, Pranab (2002) ‘Decentralization of governance and development.’ Journal of Economic Perspectives
16(4), 185–205
(2005) Scarcity, conflicts and cooperation: Essays in political and institutional economics of development
(Cambridge: MIT Press)
Bardhan, Pranab, and Dilip Mookherjee (2000) ‘Capture and governance at local and national levels.’ Amer-
ican Economic Review 90(2), 135–139
(2006a) ‘Corruption and decentralization of infrastructure delivery in developing countries.’ Economic
Journal 116, 101–127
(2006b) ‘Decentralization, corruption and government accountability: an overview.’ In Handbook of
Economic Corruption, ed. Susan Rose-Ackerman (Edward Elgar Publishing)
Bardhan, Pranab, and Jeff Dayton-Johnson (2002) ‘Inequality and conservation on the local commons: a
theoretical exercise.’ Economic Journal 112, 577–602
Bardhan, Pranab, Maitreesh Ghatak, and Alexander Karaivanov (2006) ‘Wealth inequality and collective
action.’ Working paper
Benabou, Roland (1993) ‘Workings of a city.’ Quarterly Journal of Economics 108(3), 619–652
Benavot, Aaron, and Phyllis Riddle (1988) ‘The expansion of primary education 1870-1940: Trends and
issues.’ Sociology of Education 61(3), 191–210
Cardenas, Juan Camilo (2003) ‘Real wealth and experimental cooperation.’ Journal of Development Eco-
nomics 70(2), 263–289
34
Cardenas, Juan Camilo, John Stanlund, and Cleve Willis (2002) ‘Economic inequality and burden-sharing
in the provision of local environmental quality.’ Ecological Economics 40(3), 379–395
Cason, Timothy N., and Feisal U. Khan (1999) ‘A laboratory study of voluntary public goods provision with
imperfect monitoring and communication.’ Journal of Development Economics 58, 533–552
Center for the Study of Developing Societies (1996) National Election Studies (New Delhi:
http://www.lokniti.org/dataunit.htm)
Chandra, Kanchan (2004) Why Ethnic Parties Succeed: Patronage and Ethnic Head Counts in India (Cam-
bridge University Press)
Chattopadhyay, Raghbendra, and Esther Duflo (2004) ‘Women as policy makers: Evidence from a random-
ized policy experiment in India.’ Econometrica 72(5), 1409–1443
Chaudhury, Nazmul, Jeffrey Hammer, Michael Kremer, and F. Hasley Rogers (2004) ‘Teacher and health
care provider absenteeism: a multi-country study.’ Working paper
Chin, Aimee (2005) ‘Can redistributing teachers across schools raise educational attainment? Evidence from
Operation Blackboard in India.’ Journal of Development Economics 78, 384–405
Dayton-Johnson, J. (2000) ‘The determinants of collective action on the local commons: a model with
evidence from Mexico.’ Journal of Development Economics 62(1), 181–208
Dreze, Jean (2006) ‘Universalisation with quality: ICDS in a rights perspective.’ Economic and Political
Weekly pp. 3706–3715
Duflo, Esther (2001) ‘Schooling and labor market consequences of school construction in Indonesia: Evidence
from an unusual policy experiment.’ American Economic Review 91(4), 795–813
Duflo, Esther, and Rema Hanna (2005) ‘Monitoring works: Getting teachers to come to school.’ Working
paper, MIT
Engerman, Stanley L., and Kenneth L. Sokoloff (2000) ‘Institutions, factor endowments, and paths of devel-
opment in the New World.’ Journal of Economic Perspectives 14(3), 217–232
(2002) ‘Factor endowments, inequality, and paths of institutional and economic development among
New World economies.’ NBER Working Paper 9259
Esteban, Joan, and Debraj Ray (1999) ‘Conflict and distribution.’ Journal of Economic Theory 87, 379–415
(2004) ‘Inequality, lobbying and collective action.’ working paper
Foster, Andrew, and Mark Rosenzweig (1995) ‘Learning by doing and learning from others: Human capital
and technical change in agriculture.’ Journal of Political Economy 103(6), 1176–1209
35
(2000) ‘Technological change and the distribution of schooling: evidence from Green-Revolution India.’
Working paper
Glewwe, Paul, Michael Kremer, and Sylvie Moulin (1997) ‘Textbooks and test scores: evidence from a
prospective evaluation in Kenya.’ Working Paper
Glewwe, Paul, Michael Kremer, Sylvie Moulin, and Eric Zitzewitz (2004) ‘Retrospective vs. prospective anal-
yses of school inputs: The case of flip charts in Kenya.’ Journal of Development Economics 74(1), 251–
268
Goldin, Claudia (1998) ‘America’s graduation from high school: The evolution and spread of secondary
schooling in the twentieth century.’ Journal of Economic History 58, 345–374
Instituto Brasiliero de Geografia e Estatistica (2004) Sintese de Indicadores Sociais (Rio de Janeiro)
Issac, Mark R., and James M. Walker (1988) ‘Group size effects in public goods provision: The voluntary
contributions mechanism.’ Quarterly Journal of Economics 103(1), 179–199
Jeffrey, Robin (1993) Politics, Women and Well Being: How Kerala Became “a Model” (New Delhi: Oxford
University Press)
Khwaja, Asim Ijaz (2002) ‘Can good projects succeed in bad communities? collective action in public good
provision.’ Working paper
(2004) ‘Is increasing community participation always a good thing?’ Journal of the European Economic
Association 2(2-3), 427–436
Ledyard, J. (1995) ‘Public goods: A survey of experimental research.’ In The Handbook of Experimental
Economics, ed. J.H. Kagel and A. Roth (Princeton University Press) pp. 205–356
Lindert, Peter (2004) Growing Public (Cambridge: Cambridge University Press)
Miguel, Edward (2004) ‘Tribe or nation? Nation-building and public goods in Kenya versus Tanzania.’ World
Politics 56(3), 327–362
Miguel, Edward, and Mary Kay Gugerty (2005) ‘Ethnic diversity, social sanctions and public goods in
Kenya.’ Journal of Public Economics 89(11-12), 2325–2368
Ministry of Agriculture and Rural Development (2002) Statistics of Agriculture and Rural Development
1996-2000 (Hanoi: Agricultural Publishing House)
Montalvo, Jose G., and Marta Reynal-Querol (2005) ‘Ethnic polarization, potential conflict and civil wars.’
American Economic Review 95(3), 796–816
Oates, Wallace E. (1999) ‘An essay on fiscal federalism.’ Journal of Economic Literature 37, 1120–1149
36
Office of the Registrar General of India (2001) Census of India 2001: Village Directory Data (Electronic
Data Files, New Delhi)
Olken, Benjamin (2005) ‘Monitoring corruption: Evidence from a field experiment in Indonesia.’ Working
paper
Olson, Mancur (1965) The Logic of Collective Action: Public Goods and the Theory of Groups (Cambridge,
MA: Harvard University Press)
Ostrom, Elinor (2000) ‘Collective action and the evolution of social norms.’ Journal of Economic Perspectives
14(3), 137–158
Pande, Rohini (2003) ‘Minority representation and policy choices: the significance of legislator identity.’
American Economic Review 93(4), 1132–1151
Pandey, Priyanka (2005) ‘Service delivery and capture in public schools: How does history matter and can
mandated political representation reverse the effects of history?’ Working paper
PROBE Team (1999) Public Report on Basic Education in India (New Delhi: Oxford University Press)
Rahman, S.U., and D.K. Smith (1999) ‘Deployment of rural health facilities in a developing country.’ The
Journal of the Operational Research Society 50(9), 892–902
Ramachandran, V.K. (1997) ‘On Kerala’s development achievements.’ In Indian Development: Selected
Regional Perspectives, ed. Jean Dreze and Amartya Sen (Oxford University Press) pp. 205–356
Sen, Amartya (2001) ‘Economic development and capability expansion in historical perspective.’ Pacific
Economic Review 6(2), 179–191
Singh, Prerana (2006) ‘Understanding Rajasthan’s educational achievements in the 1990s or the tale of two
projects.’ Working paper
Somanathan, E., R. Prabhakar, and B.S. Mehta (2006) ‘Collective action for forest conservation: Does
heterogeneity matter?’ In Inequality, Cooperation, and Environmental Sustainability, ed. Jean-Marie
Baland, Pranab Bardhan, and Samuel Bowles (Princeton University Press)
State of Travancore (1901) Travancore Administrative Report
Svensson, Jakob, and M. Bjorkman (2006) ‘Power to the people: Evidence from a randomized experiment
of a community based monitoring project in Uganda.’ Working paper, IIES
The Hindu (2003) ‘Behind the election outcomes.’ Editorial, December 13
Tiebout, Charles M. (1956) ‘A pure theory of local expenditures.’ Journal of Political Economy 64(5), 416–
424
37

UNDP (2003a) Bulgaria National Human Development Report. Rural Regions: Overcoming Development
Disparities (UNDP Bulgaria)
(2003b) Pakistan National Human Development Report: Poverty, Growth and Governance (Oxford
University Press)
(2003c) South Africa Human Development Report. The Challenge of Sustainable Development: Unlock-
ing People’s Creativity (Oxford University Press)
(2003d) Thailand Human Development Report 2003
(2004a) Human Development Report Russian Federation: Towards a Knowledge-Based Society (Moscow:
VES MIR Publishers)
(2004b) Informe sobre Desarrollo Humano Mexico 2004
(2005) Human Development Report 2005: International cooperation at a crossroads: Aid, trade and
security in an unequal world (New York: United Nations Development Programme)
(2006) Asia-Pacific Human Development Report: Trade on Human Terms (MacMillan India)
UNDP, and Institute for Development Studies University of Nairobi (2004) Third Kenya Human Development
Report: Participatory Governance for Human Development
UNDP, and the Institute for National Planning (2004) Egypt Human Development Report: Choosing Decen-
tralization for Good Governance (Egypt: Commercial Press)
UNDP, and the Stockholm Environment Institute (2002) China Human Development Report: Making Green
Development a Choice (Oxford University Press)
UNDP, BPS-Statistics Indonesia, and BAPPENAS (2004) Indonesia Human Development Report 2004. The
Economics of Democracy: Financing Human Development in Indonesia
U.S.Census (2000) ‘Table PHC-T-38: State of Residence in 2000 by State of Birth in 2000’
Vigdor, J.L. (2004) ‘Community composition and collective action: Analyzing initial mail response to the
2000 census.’ Review of Economics and Statistics 86(1), 303–312
World Bank (2004) World Development Report 2004: Making Services Work for Poor People (Washington
DC: World Bank and Oxford University Press)
(2006) World Development Report 2006: Equity and Development (Washington DC: World Bank and
Oxford University Press)
Zhang, Xiaobo, and Ravi Kanbur (2003) ‘Spatial inequality in education and health care in China.’ Working
paper
38