public accounts 2003-2004: volume 1 consolidated … · financial statement discussion and analysis...
TRANSCRIPT

PRINTED UNDER AUTHORITY OF THE HOUSE OF ASSEMBLY
Province of Newfoundland and Labrador
Public Accounts
Volume I
Consolidated SummaryFinancial Statements
For The Year Ended31 March 2004

This Page Intentionally Left Blank.

Table of Contents
Page No.
INTRODUCTION 1
UNDERSTANDING THE FINANCIAL HEALTH OF THE PROVINCE OFNEWFOUNDLAND AND LABRADOR 3
STATEMENT OF RESPONSIBILITY 29
AUDITOR'S REPORT 31
STATEMENTS:
Consolidated Statement of Financial Position . . . . . . . . . . . . . . . . . . . . . . . . . . . . . . . . . . . . . . 32Consolidated Statement of Change in Net Debt . . . . . . . . . . . . . . . . . . . . . . . . . . . . . . . . . . . . . 33Consolidated Statement of Operations . . . . . . . . . . . . . . . . . . . . . . . . . . . . . . . . . . . . . . . . . . . . 34Consolidated Statement of Change in Accumulated Deficit . . . . . . . . . . . . . . . . . . . . . . . . . . . . 35Consolidated Statement of Cash Flows . . . . . . . . . . . . . . . . . . . . . . . . . . . . . . . . . . . . . . . . . . . . 36Notes to the Consolidated Financial Statements . . . . . . . . . . . . . . . . . . . . . . . . . . . . . . . . . . . . . 37
SCHEDULES:
Receivables - Schedule 1 . . . . . . . . . . . . . . . . . . . . . . . . . . . . . . . . . . . . . . . . . . . . . . . . . . . . . . 49Loans, Advances and Investments - Schedule 2 . . . . . . . . . . . . . . . . . . . . . . . . . . . . . . . . . . . . . 50Equity in Government Business Enterprises - Schedule 3 . . . . . . . . . . . . . . . . . . . . . . . . . . . . . 51Net Income of Government Business Enterprises - Schedule 4 . . . . . . . . . . . . . . . . . . . . . . . . . 52Payables, Accrued and Other Liabilities - Schedule 5 . . . . . . . . . . . . . . . . . . . . . . . . . . . . . . . . 53Borrowings - Schedule 6 . . . . . . . . . . . . . . . . . . . . . . . . . . . . . . . . . . . . . . . . . . . . . . . . . . . . . . . 54Guaranteed Debt - Schedule 7 . . . . . . . . . . . . . . . . . . . . . . . . . . . . . . . . . . . . . . . . . . . . . . . . . . 56Trust Accounts - Schedule 8 . . . . . . . . . . . . . . . . . . . . . . . . . . . . . . . . . . . . . . . . . . . . . . . . . . . . 57Tangible Capital Assets - Schedule 9 . . . . . . . . . . . . . . . . . . . . . . . . . . . . . . . . . . . . . . . . . . . . . 58Revenue - Schedule 10 . . . . . . . . . . . . . . . . . . . . . . . . . . . . . . . . . . . . . . . . . . . . . . . . . . . . . . . . 60Expenses by Department - Schedule 11 . . . . . . . . . . . . . . . . . . . . . . . . . . . . . . . . . . . . . . . . . . . 61Expenses by Object - Schedule 12 . . . . . . . . . . . . . . . . . . . . . . . . . . . . . . . . . . . . . . . . . . . . . . . 62Reconciliation of Cash Results to Consolidated Accrual Results - Schedule 13 . . . . . . . . . . . . 63Government Reporting Entity - Schedule 14 . . . . . . . . . . . . . . . . . . . . . . . . . . . . . . . . . . . . . . . 65

This Page Intentionally Left Blank.

1
INTRODUCTION
Volume I of the Public Accounts presents the consolidated summary financial statements of the Province ofNewfoundland and Labrador. These statements are preceded by a report which discusses and analyzes theinformation contained within the summary financial statements. The report, entitled Understanding theFinancial Health of the Province of Newfoundland and Labrador, provides a narrative review of thefinancial performance of the Province along with illustrations of key figures and relationships. This financialstatement discussion and analysis, in conjunction with the consolidated summary financial statements,enhances users’ understanding of the Province’s financial position and the changes in its financial position.
The consolidated summary financial statements combine the financial statements of the ConsolidatedRevenue Fund with the financial statements of various Crown Corporations, Boards and Authorities, asapproved by Treasury Board, which are controlled by the Government of Newfoundland and Labrador.These organizations are accountable for the administration of their financial affairs and resources either toa Minister of the Government or directly to the Legislature.
These statements are prepared on the accrual basis of accounting in accordance with the Public SectorAccounting Board (PSAB) standards of the Canadian Institute of Chartered Accountants (CICA), and asoutlined in the significant accounting policies of the Province. They are prepared by the Comptroller Generaland are audited by the Auditor General, who presents an annual report to the House of Assembly on theresults of his audit. Budget figures, where available, are provided on several Statements for comparisonpurposes.
The Public Accounts for the year ended 31 March 2004 consists of three other volumes:
Volume II – Consolidated Revenue Fund Financial Statements presents the financial position ofthe Fund and the results of its activities.
Volume III – Consolidated Revenue Fund Supplementary Statements and Schedules presentsthe unaudited summary statements, detailed departmental statements, schedules and notes of the Fund andare prepared on a basis consistent with the Estimates of the Province.
Volume IV – Financial Statements of Crown Corporations, Boards and Authorities presents areproduction of the available financial statements of the Crown Corporations, Boards and Authorities.
The Public Accounts of the Province are tabled in the House of Assembly in accordance with Section 60 ofthe Financial Administration Act.
Internet Address
The Public Accounts are available on the Internet at:http:/www.gov.nl.ca/ComptrollerGeneral/publications.htm

This Page Intentionally Left Blank.

UNDERSTANDING THE FINANCIAL HEALTH OF THE PROVINCE OFNEWFOUNDLAND AND LABRADOR
FINANCIAL STATEMENT DISCUSSION AND ANALYSIS REPORT
The Consolidated Summary Financial Statements of the Province include the financial results of the variousdepartments of Government that comprise the Consolidated Revenue Fund and various Crown corporations,boards and authorities which are controlled by and are accountable to the Government of Newfoundland andLabrador. These financial statements are prepared on the accrual basis of accounting in accordance with thePublic Sector Accounting Board standards of the Canadian Institute of Chartered Accountants, who set theaccounting standards for Canadian senior Governments.
Providing financial accountability to Newfoundlanders and Labradorians as to the financial health of theProvince is a responsibility of Government and as Minister of Finance and President of Treasury Board, I amproviding this report for the first time to the people of the Province as part of the Public Accounts of theProvince. The inclusion of Financial Statement Discussion and Analysis with the Public Accounts is apractice recommended by the Public Sector Accounting Board.
This year the format of the Public Accounts follows the new standards issued by the Public Sector AccountingBoard and includes Tangible Capital Assets of the Province (buildings, marine vessels, heavy equipment, etc.)as non-financial assets, amortized over their useful lives. There are other changes as noted in the followingreport and the Public Accounts.
The financial indicators used in this report assess the overall financial health at 31 March 2004 summarizedunder the headings of sustainability, flexibility and vulnerability as identified in a research report of theCanadian Institute of Chartered Accountants. In addition, other financial information including comparativeinformation for the preceding four years is included.
The Province has significant fiscal challenges ahead and Government is committed to improving the financialstate of the Province in the ensuing years, focusing initially on its significant cash deficiency. Theinformation in this report will provide useful benchmarks as Government moves its agenda forward.Understanding the financial terminology is not always easy for the non-financial professional. A glossaryof terms has been included in an effort to reduce confusion.
Government is committed to being open, transparent and accountable to the people of the Province ofNewfoundland and Labrador.
LOYOLA SULLIVANMINISTER OF FINANCE AND PRESIDENT OF TREASURY BOARD
15 October 2004

This Page Intentionally Left Blank.

UNDERSTANDING THE FINANCIAL HEALTH OF THE PROVINCE OF NEWFOUNDLAND AND LABRADOR5
The Public Accounts Volumes
The Public Accounts consists of four volumes. These include:
Volume I: Consolidated Summary Financial Statements
• These are the combined audited financial statements of the Consolidated Revenue Fund (alldepartments) and government organizations (including Health and School Boards) which arecontrolled by and therefore accountable to Government.
• They present the consolidated financial position of the Province on an accrual basis, inaccordance with the accounting standards established for governments by the CanadianInstitute of Chartered Accountants (CICA).
Volume II: Consolidated Revenue Fund (CRF) Financial Statements
• These are the audited financial statements of the Consolidated Revenue Fund (alldepartments) on an accrual basis.
Volume III: Consolidated Revenue Fund (CRF) Supplementary Statements and Schedules
• They present the revenues and expenditures, and the resulting annual surplus/deficit, of theConsolidated Revenue Fund on a cash basis.
Volume IV: Financial Statements of Crown Corporations, Boards and Authorities
• They comprise reproductions of the audited financial statements of each Governmentorganization (Crown corporations, boards and authorities).
• The Auditor General issued an unqualified audit opinion on the financial statements for 2003-04.
• The Public Accounts (excluding Volume IV) can be found on the Government’s website at:www.gov.nl.ca/ComptrollerGeneral/Publications.htm
• Copies of all volumes of the Public Accounts can be obtained at the Queen’s Printer, ConfederationBuilding.
• In addition to the volumes of the Public Accounts, a Highlights and Analysis booklet is producedfor the Consolidated Summary Financial Statements. This booklet may also be obtained from theabove noted website or from the Queen’s Printer.
Changes to the Financial Statements
Effective for the 2003-04 Public Accounts, the Province’s financial statements (Volumes I and II) have beenprepared in accordance with the new government reporting format as prescribed by new Public SectorAccounting Standards issued by the Canadian Institute of Chartered Accountants. A summary of the majorchanges from 2002-03 are as follows:
• Tangible Capital Assets are now capitalized on the Statement of Financial Position with the cost ofsuch assets amortized over the useful life of the asset. Previously, tangible capital assets wererecorded entirely as expenditures upon acquisition.

UNDERSTANDING THE FINANCIAL HEALTH OF THE PROVINCE OF NEWFOUNDLAND AND LABRADOR6
• Statement of Operations replaces the former Statement of Revenue and Expenditure and reflects theamortization expense associated with tangible capital assets. Budget figures are also included forcomparison.
• Statement of Change in Net Debt replaces the former Statement of Net Debt and includes Budgetfigures for comparison.
• Statement of Cash Flows replaces the former Statement of Changes in Financial Position.
• Introduction of a new Statement of Change in Accumulated Deficit.
The most significant impact of this change is the initial recording of tangible capital assets (representing anon-financial asset) on the Statement of Financial Position, as opposed to simply disclosing the balance ofsuch assets as a schedule to the financial statements for information purposes only. Non-financial assets donot normally provide resources to discharge liabilities but rather contribute to the delivery of governmentprograms and services.
The annual surplus/deficit (as calculated and disclosed on the new Statement of Operations) now reflects theamortization expense associated with the use of tangible capital assets. Costs of acquisitions and constructionof tangible capital assets are no longer charged directly against annual surplus/deficit, but are reflected in thetangible capital assets balance as recorded on the Statement of Financial Position.
The new government reporting format has been applied to restate the figures for 2002-03 to facilitatecomparability.
Glossary of Terms
To assist in understanding the discussion and analysis to follow in this report, definitions of the various termsused are provided below:
Accrual Basis: A method of accounting whereby revenues are recorded when earned/due andexpenses are recorded when liabilities are incurred.
Accumulated Deficit: The excess of liabilities over financial and non-financial assets. It is theaccumulated annual accrual deficits (surpluses) to the date of the financialstatements.
Annual Deficit: The excess of annual expenses over annual revenues. See the ConsolidatedStatement of Operations, Volume I.
Cash Basis: A method of accounting whereby revenues are recorded when received andexpenditures are recorded when paid.
Financial Assets: Assets that could be used to discharge existing liabilities or finance future operationsand are not for consumption in the normal course of operations. (e.g., cash andreceivables.)
GDP: Gross domestic product, at market prices, of the Province.

UNDERSTANDING THE FINANCIAL HEALTH OF THE PROVINCE OF NEWFOUNDLAND AND LABRADOR7
Group Health and Life The liability, as determined by an actuary, associated with Government’s share ofInsurance Retirement health and life insurance premiums to be paid on behalf of retirees. See the Benefits: Consolidated Statement of Financial Position, Volume I.
Net Borrowings: The total borrowings (debentures, treasury bills, etc.) less sinking funds. SeeSchedule 6, Volume I.
Net Debt: The excess of liabilities over financial assets.
Non-Financial Assets: Acquired, constructed or developed assets that do not normally provide resourcesto discharge existing liabilities, but instead are normally employed to delivergovernment services, which, in the normal course of operations, may be consumedand are not for sale. (e.g., tangible capital assets, prepaid expenses and inventoriesof supplies.)
Province’s The cost of servicing the public debt, including pension interest expense and otherInterest Cost: debt related expenses.
Tangible Capital Non-financial assets which are held for use in the production or supply of goods andAssets: services, have useful economic lives extending beyond an accounting period and
have been acquired to be used on a continuing basis.
Unfunded Pension The total pension obligation less pension assets as determined by an actuary, asLiability: well as unamortized actuarial experience gains/losses. See the Consolidated
Statement of Financial Position, Volume I.
Financial Summary
For the fiscal year ended 31 March 2004, the Public Accounts reported the following financial results:
• Volume I: Consolidated Summary (accrual) Deficit - $913.6 million;Net Debt - $11.5 billion; andAccumulated Deficit - $9.3 billion.
• Volume II: CRF (accrual) Deficit - $670.2 million; Net Debt - $11.2 billion; andAccumulated Deficit - $10.0 billion
• Volume III: CRF (cash) Deficit - $134.7 million; comprised of a Current Account cash surplusof $8.0 million offset by a Capital Account cash deficit of $142.7 million.
This report will focus on the consolidated summary financial statements (i.e., Volume I).
Cash Result Compared to Consolidated Accrual Result
The difference in the cash deficit as compared to the consolidated accrual annual deficit was $778.9 million($913.6 million less $134.7 million). This change consisted of year end accrual adjustments for the CRF andthe adjusted annual results of government organizations. For example: • $391.7 million adjustment for interest on accrued retirement benefits;

UNDERSTANDING THE FINANCIAL HEALTH OF THE PROVINCE OF NEWFOUNDLAND AND LABRADOR8
• $31.3 million for other adjustments to accrued retirement costs;
• $243.4 million in net adjustments for the accrual deficits of government organizations;
• $26.4 million adjustment for bad debt expenses;
• $27.7 million adjustment relating to the amortization of tangible capital assets net of acquisitions andadjustments for the CRF;
• $31.5 million adjustment for amortization of foreign exchange gains/losses on debenture debt; and
• $26.9 million in net adjustments for other miscellaneous accruals of the CRF.
Consolidated Accrual Result Compared to Original Budget (Accrual)
The difference between the budgeted annual accrual deficit of $666.0 million as per the 2003-04 Estimatesand the actual accrual deficit of $913.6 million was $247.6 million. This difference occurred primarily dueto the following:
• Total revenue was $128.0 million less than originally budgeted. Some of the significant factorsattributing to this difference in revenue included:
• An increase in taxation revenue of $94.9 million mainly due to revenues received from the OffshoreRevenue Fund and higher than expected personal income tax and sales tax arising from adjustmentsto the amounts received for both the current and prior years. In addition, an increase in corporateincome tax revenue, mainly due to the offshore sector, was also experienced.
• A decrease in federal revenues of $152.9 million mainly due to a decrease in Equalization andCanada Health and Social Transfers resulting from the incorporation of revised population data, fromthe 2001 census, into federal estimates.
• A decrease in the net income of Newfoundland and Labrador Liquor Corporation and Newfoundlandand Labrador Hydro of $104.9 million. This lower than expected net income was primarily the resultof a write-down of capital assets in the amount of $130.9 million by Newfoundland and LabradorHydro. Excluding the minority interest, the net impact was $118.6 million on net income.
• Total expenses were $119.6 million greater than originally budgeted. Some of the significant factorswhich account for this change included:
• An increase in expenses related to group health and life insurance retirement benefits in the amountof $72.5 million. This increase was the result of a new actuarial valuation of group health and lifeinsurance retirement benefits. Such results were not available for the 2003-04 Estimates.
• An increase in pension interest expense and accrued pension costs in the amount of $55.4 millionoccurred due to new actuarial valuations and revised projections associated with the various pensionplans.
• A decrease in debt related expenses in the amount of $29.4 million also occurred primarily due to achange in the foreign exchange rate, as well as a higher than expected accrued interest expenseresulting from differences between the amount and timing of the issuance of new debt.

UNDERSTANDING THE FINANCIAL HEALTH OF THE PROVINCE OF NEWFOUNDLAND AND LABRADOR9
• Another factor attributing to the increase in expenses included higher than estimated expenses relatedto the acquisition and amortization of tangible capital assets in the amount of $17.2 million.
Financial Position - 31 March 2004
• Net debt of $11.48 billion is comprised of:
($ billion)
Unfunded Pension Liability 3.75
Borrowings (net of sinking funds) 6.78
Group Health and Life Insurance Retirement Benefits 1.06
Other Liabilities 1.29
Less: Total Financial Assets (1.40)
Net Debt 11.48
• Accumulated deficit of $9.30 billion is comprised of:
($ billion)
Net Debt 11.48
Less: Tangible Capital Assets (2.13)
Less: Other Non-financial Assets (0.05)
Accumulated Deficit 9.30
Key Indicators
• Key indicators included in this document are applied to Volume I, as this volume contains the financialinformation for the entire government reporting entity and thus provides a complete picture of theProvince’s financial condition at 31 March 2004.
• Primarily the common key indicators included herein, were identified in a research report issued by theCanadian Institute of Chartered Accountants entitled Indicators of Government Financial Condition.These indicators, which are used in assessing a government’s financial health in the context of the overalleconomic and financial environment, can be summarized under the headings of sustainability, flexibility,and vulnerability.
• While there are no established benchmarks for these indicators, one can assess the Province’s financialcondition through a comparison of previous years’ indicators.
• Gross Domestic Product (GDP) and population figures were obtained from Newfoundland and LabradorStatistics Agency. Figures used were the latest non-forecasted information available as of 31 March2004.

UNDERSTANDING THE FINANCIAL HEALTH OF THE PROVINCE OF NEWFOUNDLAND AND LABRADOR10
22.65 23.60 23.28 23.8825.41
0
7
14
21
28
35
2000 2001 2002 2003 2004
Perc
enta
geFlexibility:
Flexibility refers to the degree to which a government can respond to rising commitments by either expandingits revenues or increasing its debt. Indicators of flexibility include:
a) Province’s Interest Cost as a Percentage of Revenues
• This ratio measures the extent to which past borrowings may impact the Province’s ability toprovide for the economic and social needs of its citizens.
• The graph below indicates that the Province’s interest cost as a percentage of revenues hasincreased over the last five years. As a result, more revenues are used to meet the Province’sinterest costs, thus leaving less revenues available for program spending.
• The average of this ratio over the past five years is 23.76%. The increasing trend to this ratioindicates that interest costs remain a significant expense incurred by the Province since itrepresents approximately one-quarter of all revenues.
b) Provincial Revenues as a Percentage of GDP
• The purpose of this indicator is to show the extent to which a government is taking income outof the economy in its jurisdiction, through both taxation and user charges.
• The following graph indicates that provincial revenues as a percentage of GDP have decreasedover the last five years. This suggests that the Province is taking less income out of the economy(as a percentage) through taxation and user fees than it did in previous years.
• The average of this ratio over the past five years is 16.39%.

UNDERSTANDING THE FINANCIAL HEALTH OF THE PROVINCE OF NEWFOUNDLAND AND LABRADOR11
18.70
16.41 16.8315.16 14.86
0
5
10
15
20
25
30
2000 2001 2002 2003 2004
Perc
enta
ge
Sustainability:
Sustainability refers to the degree to which a government can meet its existing program commitments andcreditor requirements without increasing the debt burden on the economy. Indicators of sustainabilityinclude:
a) Net Debt (liabilities less financial assets) as a Percentage of GDP
• This ratio measures the level of debt that the Province carries as a percentage of its GDP.
• As indicated in the following graph, net debt as a percentage of GDP has decreased over the lastfive years. This relationship implies that the rate of economic growth is greater than the rate ofgrowth in debt. The lower this ratio, the more room Government has to manoeuver in makingfiscal choices.
• The average of this ratio over the past five years is 63.60%.

UNDERSTANDING THE FINANCIAL HEALTH OF THE PROVINCE OF NEWFOUNDLAND AND LABRADOR12
66.3860.86 62.92 64.12 63.71
0
15
30
45
60
75
2000 2001 2002 2003 2004
Perc
enta
ge
2 .212.52
3.30
3.89
5.07
0
1
2
3
4
5
6
2000 2001 2002 2003 2004
Perc
enta
ge
b) Annual Deficit as a Percentage of GDP
• This ratio measures the difference between revenues and expenses expressed as a percentage ofGDP.
• As indicated in the graph below, the annual deficit as a percentage of GDP has increased overthe last five years. Despite an increase in GDP over this period, the Province’s annual deficitsas a percentage of GDP continue to rise. If this trend continues, the Province will face everincreasing difficulty in meeting its financial obligations.
• The average of this ratio over the past five years is 3.40%.
UNDERSTANDING THE FINANCIAL HEALTH OF THE PROVINCE OF NEWFOUNDLAND AND LABRADOR13
33.4630.84
28.53
23.79
18.06
0
8
16
24
32
40
2000 2001 2002 2003 2004
Perc
enta
geVulnerability:
Vulnerability refers to the degree to which a government is dependent on, and therefore vulnerable to, sourcesof funding outside of its control or influence. Indicators of vulnerability include:
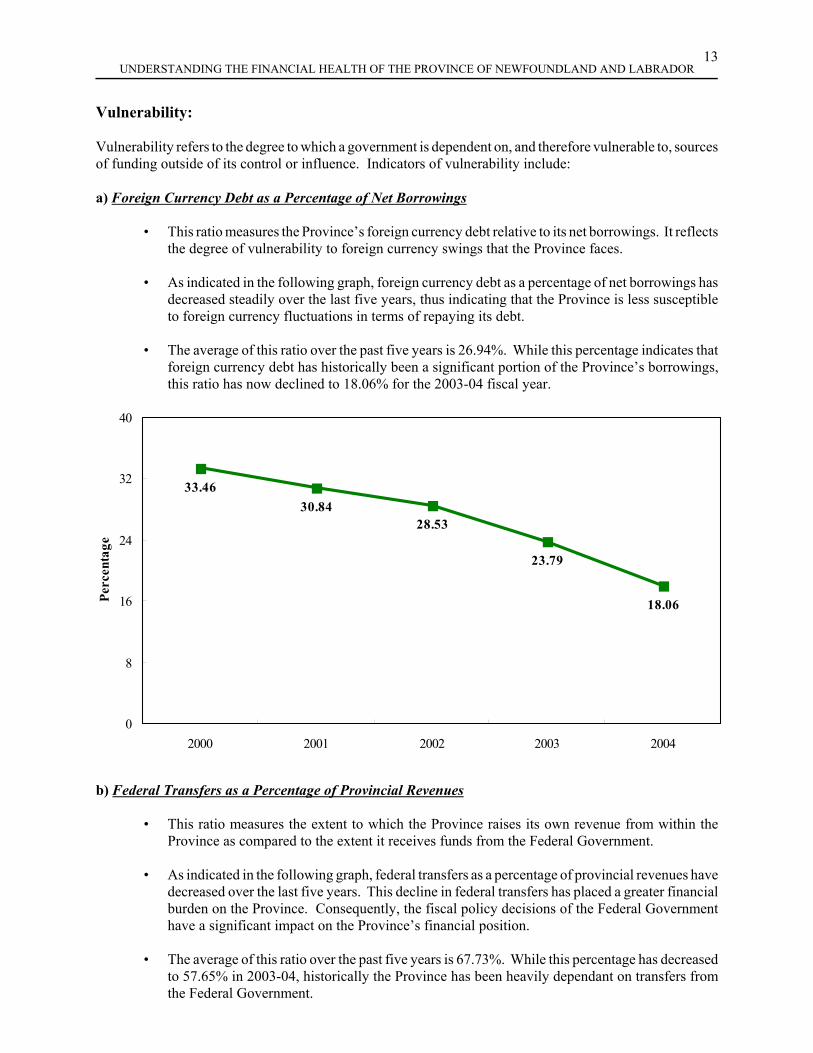
a) Foreign Currency Debt as a Percentage of Net Borrowings
• This ratio measures the Province’s foreign currency debt relative to its net borrowings. It reflectsthe degree of vulnerability to foreign currency swings that the Province faces.
• As indicated in the following graph, foreign currency debt as a percentage of net borrowings hasdecreased steadily over the last five years, thus indicating that the Province is less susceptibleto foreign currency fluctuations in terms of repaying its debt.
• The average of this ratio over the past five years is 26.94%. While this percentage indicates thatforeign currency debt has historically been a significant portion of the Province’s borrowings,this ratio has now declined to 18.06% for the 2003-04 fiscal year.
b) Federal Transfers as a Percentage of Provincial Revenues
• This ratio measures the extent to which the Province raises its own revenue from within theProvince as compared to the extent it receives funds from the Federal Government.
• As indicated in the following graph, federal transfers as a percentage of provincial revenues havedecreased over the last five years. This decline in federal transfers has placed a greater financialburden on the Province. Consequently, the fiscal policy decisions of the Federal Governmenthave a significant impact on the Province’s financial position.
• The average of this ratio over the past five years is 67.73%. While this percentage has decreasedto 57.65% in 2003-04, historically the Province has been heavily dependant on transfers fromthe Federal Government.

UNDERSTANDING THE FINANCIAL HEALTH OF THE PROVINCE OF NEWFOUNDLAND AND LABRADOR14
71.1277.25
69.3363.31
57.65
0
20
40
60
80
100
2000 2001 2002 2003 2004
Perc
enta
ge
Other - Federal0.4%
Investment5.8%
Other Provincial Tax9.0%
Corporate Income Tax
3.3%
Gasoline Tax3.2%
Sales Tax14.8%
Personal Income Tax17.4%
Other - Provincial9.3%
Net Income of Gov't Bus. Ent.
0.6%
Equalization22.3%
CHST9.3%
Fed.-Prov. Cost-Shared4.6%
Financial Highlights
Revenues:
For the fiscal year ended 31 March 2004, total revenue amounted to $4.22 billion. Of this amount, 36.6%came from Federal Government sources, while 63.4% was the result of provincial revenue sources. Detailson these sources of revenue, including five-year historical comparisons, are provided below.
a) Revenues by Source - 31 March 2004

UNDERSTANDING THE FINANCIAL HEALTH OF THE PROVINCE OF NEWFOUNDLAND AND LABRADOR15
$0
$500
$1,000
$1,500
$2,000
$2,500
Mill
ions
Govt. ofCanada
Taxation Investments Fines & fees Other Net inc. ofgovt. bus. ent.
2000 2001 2002 2003 2004
($000)Provincial:
Personal Income Tax 733,217Sales Tax 625,148Gasoline Tax 135,937Corporate Income Tax 139,575Other Provincial Tax 380,125Investment 243,219Other - Provincial 393,511Net Income of Gov’t Business Enterprises 25,438Total: Provincial 2,676,170
Federal:Equalization 938,983CHST 393,668Cost-shared 192,820Other - Federal 17,297Total: Federal 1,542,768
TOTAL 4,218,938
b) Revenues by Source - 5 Year Comparison
UNDERSTANDING THE FINANCIAL HEALTH OF THE PROVINCE OF NEWFOUNDLAND AND LABRADOR16
$2,279 $2,275 $2,390 $2,511$2,676
$1,620 $1,757 $1,657 $1,589 $1,543
$3,899 $4,032 $4,100 $4,219$4,046
$0
$900
$1,800
$2,700
$3,600
$4,500
2000 2001 2002 2003 2004
Mill
ions
Provincial Federal Total
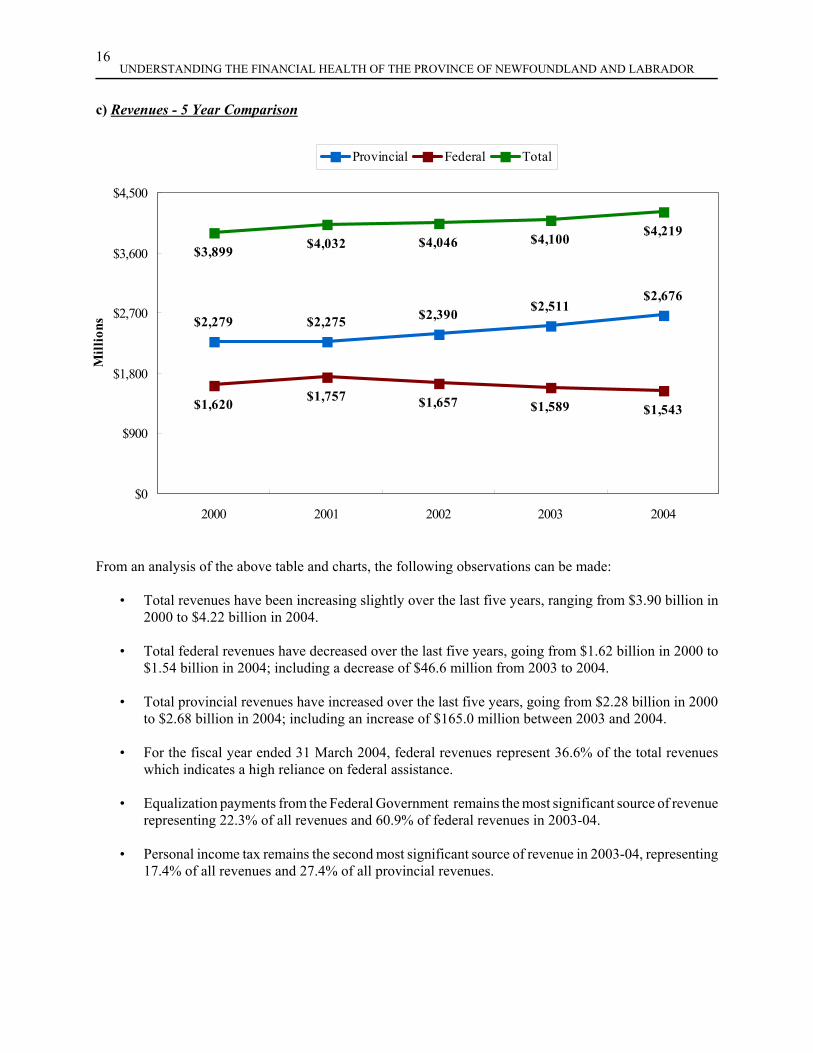
c) Revenues - 5 Year Comparison
From an analysis of the above table and charts, the following observations can be made:
• Total revenues have been increasing slightly over the last five years, ranging from $3.90 billion in2000 to $4.22 billion in 2004.
• Total federal revenues have decreased over the last five years, going from $1.62 billion in 2000 to$1.54 billion in 2004; including a decrease of $46.6 million from 2003 to 2004.
• Total provincial revenues have increased over the last five years, going from $2.28 billion in 2000to $2.68 billion in 2004; including an increase of $165.0 million between 2003 and 2004.
• For the fiscal year ended 31 March 2004, federal revenues represent 36.6% of the total revenueswhich indicates a high reliance on federal assistance.
• Equalization payments from the Federal Government remains the most significant source of revenuerepresenting 22.3% of all revenues and 60.9% of federal revenues in 2003-04.
• Personal income tax remains the second most significant source of revenue in 2003-04, representing17.4% of all revenues and 27.4% of all provincial revenues.

UNDERSTANDING THE FINANCIAL HEALTH OF THE PROVINCE OF NEWFOUNDLAND AND LABRADOR17
Professional Services5%
Amortization and Loss on Sale
3% Salaries and Employee Benefits
38%
Operating Costs13%
Other2%
Grants and Subsidies18%
Debt Expenses21%
Expenses:
For the fiscal year ended 31 March 2004, total expenses amounted to $5.13 billion. Provided below aredetails on the nature of these expenses, the allocation of the expenses to each sector of Government and afive-year historical comparison. The illustrations in (a) and (b) have been presented on an expense basis dueto the implementation of a change in accounting policy in fiscal 2003-04.
a) Expenses by Category - 31 March 2004
($000)Expenses:
Salaries and Employee Benefits 1,943,528Debt Expenses 1,071,987Grants and Subsidies 939,761Operating Costs 665,819Professional Services 255,226Amortization and Loss on Sale re: Tangible Capital Assets 163,659Information Technology 25,299Other 67,260
TOTAL 5,132,539

UNDERSTANDING THE FINANCIAL HEALTH OF THE PROVINCE OF NEWFOUNDLAND AND LABRADOR18
General Government Sector29%
Social Sector68%
Resource Sector3%
b) Expenses by Sector - 31 March 2004
($000)Sector:
Social 3,476,248General Government 1,473,309Resource 182,982
TOTAL 5,132,539
c) Expenses by Major Category - 5 Year Comparison
In accordance with PSAB standards, the change in accounting policy from the expenditure to the expensebasis has been applied retroactively with the restatement of the 2002-03 comparative figures presented in theconsolidated summary financial statements. However, for the fiscal years from 1999-2000 to 2001-02 in thefollowing five-year comparisons, the noted amounts have not been restated as the information necessary tomake the appropriate adjustments was not readily available. The amounts for these fiscal years are presentedon an expenditure basis as originally reported in the Public Accounts for each of the respective years.
In the following graph, the Other category represents capital property acquisitions, as well as amortizationand loss on sale relating to tangible capital assets. However, as a result of the accounting policy change beingapplied to the 2002-03 and the 2003-04 fiscal years only, this category does not include amortization expenseand loss on sale relating to tangible capital assets for fiscal years prior to 2002-03.

UNDERSTANDING THE FINANCIAL HEALTH OF THE PROVINCE OF NEWFOUNDLAND AND LABRADOR19
$0
$200
$400
$600
$800
$1,000
$1,200
$1,400
$1,600
$1,800
$2,000M
illio
ns
Grants/ subsidies
Debt expenses
Salaries Oper. costs
Prof. services
Other Valuation allow.
Info. tech.
2000 2001 2002 2003 2004
$1,256 $1,314 $1,307 $1,400 $1,473
$146 $165 $179 $194 $183
$2,766 $2,903 $3,028 $3,150$3,476
$4,168$4,382 $4,514
$4,744$5,132
$0
$900
$1,800
$2,700
$3,600
$4,500
$5,400
2000 2001 2002 2003 2004
Mill
ions
General Sector Resource Sector Social Sector Total
d) Expenses by Sector - 5 Year Comparison
From an analysis of the above tables and charts, we can make the following observations:
• Total expenses have increased steadily over the last five years - from $4.17 billion in 2000 to $5.13billion in 2004.

UNDERSTANDING THE FINANCIAL HEALTH OF THE PROVINCE OF NEWFOUNDLAND AND LABRADOR20
Net Debt$11.48
Non-FinancialAssets$2.18
FinancialAssets$1.40
Liabilities$12.88
AccumulatedDeficit$9.30
$0
$3
$6
$9
$12
$15
Bill
ions
• Salaries and employee benefits expense has increased steadily over the past five years - from $1.45billion in 2000 to $1.94 billion in 2004; an increase of $490.0 million.
• Debt expenses have been fairly stable from 2000 to 2004. The majority of this expense relates to theConsolidated Revenue Fund for interest on debt, foreign exchange amortization/losses and intereston the unfunded pension liability.
• Expenses for the Social Sector which includes health, education and social services were $3.48billion in 2004, accounting for 68% of the total expenses for the year.
• Salaries/benefits and debt expenses represent 59% of total expenses for the year ended 31 March2004.
Financial Position Highlights
As a result of the new reporting format discussed earlier in this report, there have been a number of changesto the Consolidated Statement of Financial Position. While the traditional reporting of net debt (financialassets less liabilities) has remained, this statement now includes the reporting of non-financial assets,consisting mostly of tangible capital assets, and an accumulated deficit figure as depicted below.
Net Debt and Net Borrowings:
For the fiscal year ended 31 March 2004, net debt totaled $11.48 billion which included net borrowings of$6.78 billion. As indicated below, these figures have increased on a per capita basis over the past five years.

UNDERSTANDING THE FINANCIAL HEALTH OF THE PROVINCE OF NEWFOUNDLAND AND LABRADOR21
$15,162$15,978
$17,112
$20,436$22,142
$0
$5,000
$10,000
$15,000
$20,000
$25,000
2000 2001 2002 2003 2004
$10,684$11,552
$12,371 $12,665 $13,074
$0
$3,000
$6,000
$9,000
$12,000
$15,000
2000 2001 2002 2003 2004
a) Net Debt per Capita
Net debt per capita indicates the average amount of provincial net debt owing by each citizen of the Provinceand is calculated by dividing the net debt of the Province by the Province’s population. Each citizen’s shareof the provincial debt increased from $20,436 to $22,142 between 2003 and 2004 as a result of an increasein the net debt combined with a slight decrease in the population.
b) Net Borrowings per Capita

UNDERSTANDING THE FINANCIAL HEALTH OF THE PROVINCE OF NEWFOUNDLAND AND LABRADOR22
$5,699$6,100
$6,457 $6,579 $6,777
$0
$2,000
$4,000
$6,000
$8,000
2000 2001 2002 2003 2004
Mill
ions
Net borrowings per capita indicates the average amount of provincial debt owing by each citizen of theProvince and is calculated by dividing the net debenture and other debt (net of sinking funds) of the Provinceby the population of the Province. Each citizen’s share of the provincial debt increased from $12,665 to$13,074 between 2003 and 2004 primarily as a result of an increase in the debt combined with a slightdecrease in the population.
c) Net Borrowings - 5 Year Comparison
Net borrowings of the Province increased from $6.58 billion in 2003 to $6.78 billion in 2004. Borrowingsof the CRF represented 86.7% of the total borrowings in 2004.
Non-Financial Assets:
For the fiscal year ended 31 March 2004, non-financial assets totaled $2.18 billion. Of this amount, $2.13billion related to tangible capital assets. Due to the change in accounting policy as noted previously, the2003-04 Public Accounts now include the capitalization and amortization of these tangible capital assets overtheir estimated useful lives. Previously, such assets were recorded entirely as expenditures in the year theywere acquired. As a result of moving from the expenditure basis to the expense basis in relation to tangiblecapital assets, the impact on the annual deficit for 2003-04 has been an increase of $2.95 million (decreaseof $45.23 million for 2002-03).
The illustrations below highlight the composition of the net book value of the tangible capital assets alongwith a comparison to the prior years’ net book value.

UNDERSTANDING THE FINANCIAL HEALTH OF THE PROVINCE OF NEWFOUNDLAND AND LABRADOR23
$1,080$1,114
$28 $23
$172 $166
$671 $653
$8 $11
$172 $159
$0
$200
$400
$600
$800
$1,000
$1,200
Mill
ions
Buildings Marine Vessels& Aircraft
Equip. &Machinery
Infrastructure Comp.Software
WIP
2003 2004
a) Tangible Capital Assets by Asset Category
Net Book Value Percentage
($mil)
Asset Categories:
Buildings 1,113.9 52.4%
Marine Vessels & Aircraft 23.3 1.1%
Equipment & Machinery 165.8 7.8%
Infrastructure 652.8 30.7%
Computer Software 11.1 0.5%
Work-in-Progress (WIP) 159.4 7.5%
TOTAL 2,126.3 100%
From an analysis of the above, we can make the following observations:
• The net book value of tangible capital assets has remained fairly stable from 2003 to 2004, decreasingby $2.9 million.
• Buildings represent 52.4% of the total net book value of tangible capital assets for the year ended 31March 2004.

UNDERSTANDING THE FINANCIAL HEALTH OF THE PROVINCE OF NEWFOUNDLAND AND LABRADOR24
$8,439
$9,301
$0
$2,000
$4,000
$6,000
$8,000
$10,000
Mill
ions
2003 2004
$16,246
$17,944
$0
$4,000
$8,000
$12,000
$16,000
$20,000
2003 2004
Accumulated Deficit:
For the fiscal year ended 31 March 2004, the accumulated deficit amounted to $9.30 billion. This valuerepresents the accumulated annual deficits/surpluses as at 31 March 2004. The analysis provided belowhighlights the change in accumulated deficit from 2003 to 2004, as well as provide analysis on accumulateddeficit on a per capita basis.
a) Accumulated Deficit from 2003 to 2004
The accumulated deficit of the Province increased from $8.44 billion in 2003 to $9.30 billion in 2004.
b) Accumulated Deficit per Capita

UNDERSTANDING THE FINANCIAL HEALTH OF THE PROVINCE OF NEWFOUNDLAND AND LABRADOR25
Accumulated deficit per capita indicates the average amount of provincial accumulated deficit owing by eachcitizen of the Province and is calculated by dividing the accumulated deficit of the Province by the populationof the Province. Each citizen’s share of the provincial accumulated deficit increased from $16,246 to $17,944between 2003 and 2004 as a result of an increase in the accumulated deficit combined with a slight decreasein the population.
Improving Financial Performance
The preceding analysis has highlighted the fact that the Province’s financial health is continuing to decline.In fact, the annual deficit alone has increased dramatically by $269.2 million over the previous fiscal year.The Province cannot afford to continue on such a pace. The Government has identified these financialdifficulties and is committed to improving the Province’s financial situation. Through the implementationof its fiscal policies, the Government continues to strive towards increasing the Province’s revenue streams,while at the same time tightening the rein on government spending. These policies, along with effectiveprogram management to provide essential services to the public, are key components to ensuring theimprovement of the Province’s financial performance through debt and deficit reductions.

This Page Intentionally Left Blank.