pub economics of insurance · 2019-12-12 · insurance encompasses reinsurance. although the...
TRANSCRIPT

Swiss Reinsurance CompanyMythenquai 50/60P.O. Box CH-8022 ZurichSwitzerlandTelephone +41 43 285 2121Fax +41 43 285 [email protected]
Swiss Re publications can also be downloaded fromwww.swissre.com
The economics of insuranceHow insurers create value for shareholders
Technical Publishing
68672pb US_Eco-Insurance 14.06.2002 14:49 Uhr Seite U1

The economics of insuranceHow insurers create value for shareholders
68672pb Eco-Insurance 14.06.2002 14:16 Uhr Seite 1

Contents
2 Swiss Re: The economics of insurance
Foreword 3
1 Introduction 41.1 Why economic value? 51.2 Document structure 6
2 How insurers create value for shareholders 72.1 Insurers are liability-driven financial intermediaries 72.2 Value creation in insurance companies 82.3 Cost of capital for insurers 92.4 Replicating portfolio 102.5 Products with systematic risk 112.6 Replication and mismatch risk 112.7 Frictional capital costs 13
3 Economic value of liabilities 153.1 A simple example 153.2 Section appendix: incorporating all frictional items 18
4 Performance measurement 224.1 A simple example revisited 224.2 Treasury function and transfer pricing 234.3 Performance attribution analysis 264.4 Target setting 264.5 Incentive compensation 274.6 Section appendix: incorporating all frictional items 30
5 Managing risk and capital 325.1 Drivers of the cost of taking risk 325.2 Risk and capital management: main issues 345.3 Amount of capital required 355.4 Type of capital required 395.5 Investing capital 40
Appendix: Literature 43
68672pb Eco-Insurance 14.06.2002 14:16 Uhr Seite 2
Foreword
The greatest shareholder value is generated by those insurers who identifyand capitalise on the best business opportunities and have optimum oper-ating efficiency. There are three important prerequisites for accomplishingthese goals. First, a good understanding of the value creation process allows aclear identification of competitive advantages and an unambiguous allocationof responsibilities to specific functions within the organisation. Second, aframework for measuring value creation is indispensable in that it enablesquantification and allocation of performance. And third, a consistent incentivesystem is needed to align the interests of management with the value creationgoal.
Implementing a value measurement framework will also foster a better under-standing of the value proposition for insurance or reinsurance – that the costof taking risk is lower for the insuring entity than for the client. Understandingthat value proposition allows employees to better identify value-creating solu-tions for both their clients and their own companies.
This publication provides this type of framework for understanding andmeasuring value creation based on a careful analysis of the fundamentaleconomic principles underlying insurance business. In particular, this frame-work emphasises the importance of accounting for the cost of holding riskcapital. It also shows that it is not the investment management activities of aninsurance company, but their business origination skills and efficient capitalcost management that ultimately enable them to create sustainable value fortheir shareholders.
Although this publication is founded on a detailed economic study, it specifi-cally caters to practitioners. Examples that clearly demonstrate how to applythe framework in practice are provided, making it invaluable for insurancemanagement seeking to improve long-term profitability.
3 Swiss Re: The economics of insurance
Bruno PorroChief Risk OfficerSwiss Re
John H. FitzpatrickChief Financial OfficerSwiss Re
68672pb Eco-Insurance 14.06.2002 14:16 Uhr Seite 3

1 Introduction
During the 1990s, many insurance1 markets worldwide experienced majorchanges. Until then, tight regulation had kept competition low and profit mar-gins high. A strong focus on volume was all that was needed to manage aninsurance company. The high profit margins did the rest. In such an environ-ment, it is not surprising that managers were primarily assessed on marketshare. However, due to the combined effects of deregulation and globalisa-tion, competition has intensified, bringing margins down. Competition hascome not only from within the industry; the boundaries between banking andinsurance have become increasingly blurred. Moreover, value awareness hasincreased across the entire economy, so that policyholders tend to focus lesson long-standing relationships than on obtaining the best value for money.
As a result, volume alone has become an inappropriate driver of value. It hasprompted insurers to sell covers at lower prices and to be less cautious inunderwriting in order to protect and increase market share. In fact, pricesdropped so low that the industry was effectively writing losses in economicterms. In its issue of 16 January 1999, The Economist describes the insur-ance industry as “an industry in dire straits”. Risks were being underwritten athalf the price of only a few years earlier. The seriousness of the situation waspartially masked by cosmetic accounting practices, such as the release ofreserves accumulated in the past. However, reserves are not inexhaustible,and the true economic state of affairs has already started to show through: theindustry has been selling its products at prices below production cost, therebyoften destroying shareholder value.
In a changing environment, guiding principles need to be revisited. For theinsurance industry, this means that to return to past levels of profitability, it isnecessary once again to reflect on the underlying mechanism of value cre-ation. Rules of thumb, such as maximisation of market share, frequently breakdown when conditions change. To address this need, this publication focuseson the value creation process in insurance. Having a clear idea of how value iscreated and how it can be measured is a necessary first step in managing forvalue. An economic value measure allows products to be priced with built-invalue creation targets. Also, though not easy to implement, it makes it possibleto relate management incentive systems to value creation, thus better aligningthe interests of employees with those of shareholders. Moreover, an economicvalue measure allows strategic capital and risk management decisions to beassessed in terms of their ability to enhance company value.
1 In this publication, the generic terminsurance encompasses reinsurance. Althoughthe analysis is framed in terms of a shareholdercompany, it applies equally well to mutuals.
4 Swiss Re: The economics of insurance
68672pb Eco-Insurance 14.06.2002 14:16 Uhr Seite 4

“Traditional measures such as EPS(Earnings per Share), are easily influencedby accounting practices, and do notincorporate risk or the time value of money.Furthermore, in our opinion they do nothelp investors to understand the intricateprocess of value creation. Value destroyinggrowth can be simultaneously achievedwith EPS growth.”
Credit Suisse First BostonAugust 1997
1.1 Why economic value?Managers are ultimately judged on their ability to create value for the ownersof the companies they manage. This is the case today, and always has been inthe past. In current years, however, the topic has been the subject of renewedattention.
The discussions that have resulted from this increased attention focus less onwhether value should be measured at all than on how it should be measured.Both the insurance industry and, more generally, the financial services indus-try until recently relied heavily on accounting methods to determine the valueof assets and liabilities. However, there is a growing discomfort with thesemeasures since, as is now widely recognised, they fail to reflect the true eco-nomic state of companies.
From an economic perspective, assets should be valued at market values andliability cash flows according to best estimates taking into account the timevalue of money in an appropriate manner. Ignoring this principle will concealimportant economic information. First, artificial valuation principles will maskthe true level of value created by a company, a primary concern for share-holders. For example, property and casualty liabilities are frequently valued atnominal values, ignoring the impact of interest rates. Second, artificial valua-tion methods may mislead managers about the risk associated with key sensi-tivities. For instance, using artificial discount rates may obscure the fact thatinsurance liabilities are potentially exposed to considerable interest rate risk.Also, many accounting valuation rules value assets and liabilities conserva-tively, which amounts to building hidden reserves. This is an open invitation toone of the most widely used cosmetic accounting techniques: smoothingresults by appropriately timing the release of hidden reserves with the effectthat emerging profits no longer reflect current performance. Other accountingrules, such as US GAAP, deliberately aim to smooth the emergence of profitsin order to limit the scope for manipulating reserving levels. However, smooth-ing distorts the volatility and true economic condition of the underlying busi-ness. It may temporarily disguise underlying difficulties and prevent correctiveaction from being taken while it is still possible. Yet another drawback ofaccounting measures is that the underlying valuation principles can vary indetail across different countries, and even different product lines, making itvirtually impossible to compare performance.
While these shortcomings may not be critical in a highly profitable and stableindustry, they have become more pressing as competition and volatility haveincreased. These changes have reduced the tolerance for error in financialdecision making. Moreover, more sophisticated measures of value are nowrequired to properly assess the more complex products that insurers offer.
5 Swiss Re: The economics of insurance
68672pb Eco-Insurance 14.06.2002 14:16 Uhr Seite 5

These issues have not gone unnoticed by the accounting profession. Inparticular the International Accounting Standards Board is in the process ofdeveloping a new standard for insurers based on economic valuationprinciples2.
Also from the actuarial side or from consulting firms drawing on standardbanking practice, there has been no lack of attempts to overcome thesedeficiencies. In the life insurance industry, the embedded value method3
attempts to provide an economic view. However, though embedded valuesaddress the greatest problem of uncovering hidden reserves, it is not based on economic principles (see Section 4). On the non-life side RAROC4, orvariations thereof, have also been proposed as a possible way out of theaccounting trap. These methods are more or less straightforward extrapola-tions from standard corporate finance. However, the standard corporatefinance toolkit, which was developed mainly to deal with industrial compa-nies, does not translate well to insurance companies. As a consequence, thesealternative methods are equally unsuited for insurers.
The inadequacy of the standard corporate finance toolkit is due to the peculi-arities of the insurance business, a topic that has been the subject of muchattention in recent years5. The special role of capital as a cushion againstunexpected losses, as well as the many inefficiencies associated with holdingthis capital within an insurance company – regulatory, fiscal and other fric-tions – demand a more careful analysis. An important part of our considera-tions will be devoted to elaborating this point.
1.2 Document structureThis publication defines economic value in the context of insurance and pro-vides a practical framework for measuring and managing value creation.Section 2 describes the value creation process for insurers. Using the analogyof a leveraged investment fund, it defines the cost of capital for an insurer.This shows that insurers create value chiefly though business origination andefficient capital cost management rather than through their investment activi-ties.
For the practitioner, sections 3 and 4 provide a workable framework for measuring economic value. This framework is illustrated by way of an example.Section 3 describes how to measure the economic value of insurance liabili-ties. Section 4 shows how to construct an economic balance sheet andincome statement. This chapter also highlights the three core functions withinan insurance company: business origination, capital and risk management,and asset management. In particular, it describes how the performance foreach of the three functions should be measured. A comparison with RAROCand the Embedded Value method is provided.
Section 5 considers how the framework can be used in business steering,stressing the importance of managing frictional capital costs.
A list of selected references is provided for the interested reader.
2 See the Insurance Accounting StandardsBoard’s Insurance Issues Papers available attheir web page (www.iasc.org.uk).3 The embedded value method estimates thevalue of excess reserves by discounting theexpected future statutory profits from businessin force.4 RAROC stands for Risk Adjusted Return onCapital. This type of measure adjusts thereturns of an insurer or bank for risk and puts itin relation to capital employed.5 See Froot and Stein, 1998, Merton, 1993,and Merton and Perold, 1999.
6 Swiss Re: The economics of insurance
68672pb Eco-Insurance 14.06.2002 14:16 Uhr Seite 6

2 How insurers create value for shareholders
Shareholders of insurance companies provide risk capital that is invested ontheir behalf in financial assets. In so doing, shareholders relinquish directcontrol over the management of this capital and expose it to insurance risk.Moreover, due to the regulatory and tax environments of insurers, they are at a competitive disadvantage when investing this capital. Issuing insurance contracts only creates value after shareholders have been compensated for the resulting frictional costs. However, these distinctive costs which are characteristic for financial intermediaries are generally overlooked by tradi-tional accounting practice and standard corporate finance theory.
2.1 Insurers are liability-driven financial intermediaries In contrast to industrial companies, insurers do not generally leverage them-selves as a means of financing attractive business opportunities. Instead, theydo this because it is an integral part of their business operations. Insurers borrow money (premiums) by issuing debt in the form of insurance policiesthat pay the lender (policyholder) financial compensation if a pre-specifieduncertain event occurs. The payments the insurer agrees to make are oftenuncertain concerning their size and timing.
To ‘produce’ insurance contracts, insurers rely on diversification and financialmarkets. By pooling contracts that are not perfectly correlated, aggregatelosses become more predictable. By investing part of the premiums theyreceive in financial assets, insurers are able to generate the future cash flowsneeded to pay expected claims. Thus, insurers are liability-driven financialintermediaries: they originate financial contracts, ie insurance policies, anduse financial markets to bridge the gap between today’s premiums and tomor-row’s claims.
A second distinctive feature of insurers is that they hold risk capital. Whilepooling reduces uncertainty, unexpected losses may still arise, potentiallyjeopardising the insurer’s ability to meet its obligations. This is a concern forpolicyholders and regulators, especially since insurance is usually purchasedto transfer unwanted risk. Moreover, unlike bondholders who can readilyreduce their credit risk exposure by holding a well-diversified portfolio ofbonds with different issuers, policyholders generally cannot mitigate insurerdefault risk in any cost-efficient way. For this reason, policyholders usuallyaccumulate their credit exposure with one or a few insurers and are thusparticularly sensitive to the financial strength of the insurer, where financialstrength is determined by rating agencies and regulators. Insurers recognisethis need for security by holding risk capital, which provides a cushion againstunexpected losses.
7 Swiss Re: The economics of insurance
68672pb Eco-Insurance 14.06.2002 14:16 Uhr Seite 7

2.2 Value creation in insurance companiesThe balance sheet of an insurance company essentially shows investments infinancial assets balanced by insurance liabilities and the risk capital providedby shareholders. Thus, an insurance company resembles a leveraged invest-ment fund in which debt is raised through the sale of insurance policies ratherthan via capital markets6. However, two important features separate insurancecompanies from investment funds: their competitive disadvantage in investingand their competitive advantage in raising funds.
On the investment side, insurance companies compare unfavourably to aninvestment fund. They are more opaque and operate in a much less beneficialtax and regulatory environment than investment funds. For example, in con-trast to investment funds, insurance company shareholders in most marketsare liable to pay tax twice on the investment return on their risk capital. Thesereturns are first taxed when they flow through the insurer's taxable earningsand then again as part of shareholder's taxable income when distributed asdividends. This makes it difficult for insurers to create value through investing.
Conversely, insurers have the ability to create value by borrowing in the muchless efficient insurance market, rather than in capital markets. The insurancemarket’s inefficiency allows insurers to raise funds by selling policies for morethan their economic cost, ie what it costs to ‘produce’ them. In so doing, theycreate value.
So why are policyholders willing to pay more than what it costs to producethe cover they buy? In principle, individuals could enter a pooling arrangementindependent of an insurance company. However, risk-pooling arrangementsare costly and insurance contracts have been found to provide an efficientmeans of lowering these costs. As long as it is cheaper to buy the cover froman insurer, policyholders will be willing to pay a premium above the produc-tion costs of a cover.
“When world stock markets took a summerplunge, insurance shares dived twice as far. When equities recovered in the autumn,insurers also rose faster than the market.This amplification of movements helps to explain two things. First, why investors in insurance are biting their nails thesedays as Wall Street, once again, is lookingdangerously overvalued. And second, how shareholders really think of insurance companies: as little more than highly leveraged investment trusts.”
The Economist January 1999
8 Swiss Re: The economics of insurance
“Insurance is regarded as a cheap source of raising funds for investment. The underwriting result is similar to paying aninterest rate for the use of the funds.”
Merrill LynchJune 2000
Market valueof assets
Economicvalueof liabilities
Economicnet worth
Franchisevalue
Market valueof thecompany
The value of the company to its shareholders has a tangible component(economic net worth) and an intangible component (franchise value) whichrepresents the present value of economic profitsfrom future business.
6 A leveraged investment fund is an invest-ment fund which finances the purchase offinancial assets partly by fund-holders’ capitaland partly by debt (leverage).
68672pb Eco-Insurance 14.06.2002 14:16 Uhr Seite 8

7 Economic net worth denotes the marketvalue of assets less the the economic value ofliabilities (debt).
The ability of insurers to create value is reflected in their franchise value. Ifinsurers were only able to sell insurance at its economic value, their marketcapitalisation would be equivalent to their economic net worth7. However,insurance companies generally trade at a premium over economic net worth.This premium, or franchise value, reflects the present value of investors’expectations regarding the value created by future business. It is a reminderthat shareholders expect insurers to create value.
2.3 Cost of capital for insurersUp to this point, the value creation process has been discussed in generalterms. The following subsections address the more technical aspects of valuecreation. Section 3 then shows, by way of example, how they can be applied.
Following the analogy of the previous section, an insurer's opportunity cost ofcapital is the return that shareholders could otherwise achieve by investingtheir risk capital directly themselves plus additional compensation for variousfrictional costs that are specific to insurers. This provides the benchmark forvalue creation in insurance.
The return that they would have otherwise achieved by investing in a lever-aged fund is called the base cost of capital. It represents the return thatinvestors demand for the financial market risk that their capital is exposed toand depends on the investment strategy of the insurer. For example, for a UKinsurer that closely matched its insurance liabilities and used the FTSE 100index as a benchmark for excess capital, the base cost of capital would beequal to the return on the FTSE 100 index. This may be surprising at first.However, if a substantial part of the return on capital is obtained by investingthis capital in financial assets, why should this return component differ fromthe return of a regular investment fund?
Thus the base cost of capital is equal to the benchmark return on the invest-ment portfolio less the return required to support the insurance liabilities,known as the replicating portfolio return. This return is comparable to the costof debt for a leveraged investment fund.
This would be the end of the story were it not for the fact that investing capitalin financial markets through an insurance company gives rise to frictionalcosts which do not arise when investing the same capital more directlythrough an investment fund. These costs include compensation for lack oftransparency and control, for the additional costs related to potential financialdistress, for regulatory restrictions, and for any additional tax on investmentincome. These costs are discussed in further detail below.
Therefore insurers can create value in only two ways: first, by issuing insur-ance contracts that more than cover the associated ‘production’ costs, includ-ing frictional capital costs. Secondly, by achieving an investment result thatbeats the benchmark implicit in the base cost of capital on a risk-adjustedbasis.
9 Swiss Re: The economics of insurance
“There are really two kinds of businesswithin each of these divisions: insuringrisks and investing the cash from pre-miums until claims are paid. Insurancecompanies have traditionally not separatedvalue creation into these two parts. Yet,with advanced portfolio performance tech-niques it is possible to determine whetherthe investment management side of thebusiness is creating or destroying value.”
T. Copeland, T. Koller, J. MurrinMcKinsey & Company, Inc.2000
68672pb Eco-Insurance 14.06.2002 14:16 Uhr Seite 9

Economicnet worth
2.4 Replicating portfolioHaving provided an overview of the value creation process, the following sub-sections provide further details on the key concepts, namely the replicatingportfolio and frictional capital costs.
The replicating, or hedge, portfolio is used to determine the cost of the liabilitycash flows and the investment return required to support the insurance liabili-ties. It is simply defined as the portfolio that best matches8 the correspondingliability cash flows. For example, in the case of pure insurance risks, the liabil-ity cash flow can be replicated using risk-free fixed-income instruments withappropriate maturities. The market value of the replicating portfolio is thenused to determine the value of the liability cash flows.
Replicating portfolios are routinely used in finance to value cash flows that arenot actively traded. If non-traded assets were not valued relative to tradedones, investors would arbitrage the difference by essentially purchasing thecheaper cash flow and selling the more expensive one. This principle is knownas the no-arbitrage principle. It ensures that clients are not able to arbitragethe insurer and that value reflects the market, or shareholder, view.
Therefore, the replicating portfolio provides the cash flows needed to meetexpected future claims payments, to cover expenses, and to service capitalcosts, thus ‘producing’ the liability.
Investing in the replicating portfolio will not eliminate all risk, as it is not possi-ble to match insurance risk by replication. In principle, this risk component hasno economic cost because it is non-systematic, ie it can be diversified awayby shareholders. However, when insurance risk is held on the balance sheet ofan insurer, it gives rise to frictional costs, which are considered in Section 2.7.
8 This means that the financial market risk of the net position – replicating portfolio lessliability – is minimised.
10 Swiss Re: The economics of insurance
Economicnet worth
=
=
+
+
Insurance company Leveraged investment fund Insurance operation
Cost of capital Base cost of capital Frictional capital costs
Market valueof assets
Economicvalueof liabilities
Market valueof assets
Replicating portfolio
Replicating portfolio
Economicvalueof liabilities
68672pb Eco-Insurance 14.06.2002 14:16 Uhr Seite 10

9 Capital Asset Pricing Model
2.5 Products with systematic riskSo far, the focus has been on pure insurance risk products. The only systematicrisk that these products have is interest rate risk, which can be hedged byholding a matching fixed-income portfolio. However insurance liabilities canand do have many types of systematic risk, both explicit and implicit. For exam-ple, some life insurance products have a savings component with a return thatis linked to the performance of the insurer’s portfolio, subject to a guaranteedminimum rate of return. From the insurer’s perspective, this is equivalent toissuing a call option on its asset portfolio. The inflation risk embedded in manyforms of insurance is also implicit systematic risk, since inflation is highly corre-lated with financial markets.
Although less tractable, products with a systematic risk component can be‘produced’ in a similar manner. A replicating portfolio can be set up to hedgethe systematic risk embedded in insurance liabilities. Standard derivativepricing techniques and factor models, such as the CAPM9 can typically beused to construct these portfolios. The remaining risk is largely diversifiableand can be dealt with by pooling and holding risk capital.
Systematic risk is frequently not given specific attention in insurance valua-tion, possibly because the calculations are relatively complex. However, thispractice is dangerous because valuation is particularly sensitive to systematicrisk. Shareholders demand a significant premium for bearing this type of risk,as it cannot be diversified.
2.6 Replication and mismatch riskIt may not always be possible to find a portfolio of traded instruments thatreplicates the expected liability cash flows. For example, the cash flows fromcertain life insurance or long-tail business may extend beyond the horizon ofavailable fixed income investments. This replication risk is the consequence ofthe strategic decision to be active in the insurance market for this type ofproduct. It should be reflected in the frictional capital costs allocated to thisproduct.
Replication risk is very different in nature from the risk of mismatching.By investing in the replicating portfolio, the insurer can hedge most of itsexposure to systematic risk. This makes it clear that taking systematic risk isan active choice of the insurer, not an unavoidable consequence of doingbusiness. The issue of whether or not to mismatch assets and liabilities will be further discussed in Section 5.
Option to default and value of liquidityFor convenience, the replicating portfolio is constructed using default-free and liquidmarket instruments. In practice, however, insurers could default on their liabilities, andit may be possible in principle to replicate the liability payments using less liquid instru-ments. These intangible factors reduce the value of the economic liabilities and thereturn required by shareholders. These technical aspects are considered in this section.Readers not interested in technical details can skip this section.
11 Swiss Re: The economics of insurance
68672pb Eco-Insurance 14.06.2002 14:16 Uhr Seite 11

The insurer’s option to defaultAs with standard debt instruments, insurers have the option to default on their liabilitiesin the event of insolvency. Following bankruptcy, policyholders may not receive the full payment entitled to them. This option is an asset to the insurer and thus lowers thevalue of liability cash flows. As a result, the economic value of liability cash flows corre-sponds to their replication value less the value of the default option.
The fact that the option to default is an asset to the insurer does not imply that theinsurer has any interest in defaulting. By defaulting, the insurer generally stands to losesubstantial franchise value.
Excess liquidity and valueSo far, the economic value of insurance liabilities has been described as the value of areplicating portfolio less the value of the insurer’s default option, where the replicatingportfolio has been taken to be default-free and liquid. Another component that may alsodecrease the value of liabilities is related to the predictability of their timing and amount.
Insurance cash flows are typically uncertain regarding both amount and timing. Due to diversification, however, a pool of contracts often displays a high degree of pre-dictability both in timing and amount. This suggests that replication could actually be achieved by using illiquid assets. This is because the replicating portfolio would inprinciple not need to be adjusted over time. Instead, it could be held to maturity10.
Illiquid assets tend to sell at a discount with respect to their liquid counterparts, ie thereis a premium for liquidity. Therefore, using illiquid instruments to replicate could in prin-ciple lower the production costs of liabilities or, equivalently, the cost of borrowingthrough insurance.
Unfortunately, illiquid instruments such as corporate bonds usually carry additional risks,such as default, subordination and call risk, which make them unsuitable for replication:they would not result in a portfolio that best matches the financial market risk sensitivityof the liability cash flows. These additional risks also make it difficult to quantify the liq-uidity premium. As a result, there are widely differing views on its size.
10 This condition would typically exclude lifeinsurance contracts with surrender guaranteesor natural catastrophe coverage.
12 Swiss Re: The economics of insurance
=
=
+
+
Insurance company Leveraged investment fund Insurance operations
Cost of capital Base cost of capitalFrictional capital costsDefault optionLiquidity value
Market valueof assets
Economicvalueof liabilities
Market valueof assets
“Insurance managers are constantly studying their liabilities to determine theimportance of liquidity and the degreeto which they can take the risk of owningless liquid assets – that is where returnsare highest.”
Peter BernsteinRiskJune 2001
Defaultoption
Economicvalueof liabilities
Economicnet worth
Tangiblenet worth
Liquidityvalue
Replicating portfolio
Replicating portfolio
68672pb Eco-Insurance 14.06.2002 14:16 Uhr Seite 12
13 Swiss Re: The economics of insurance
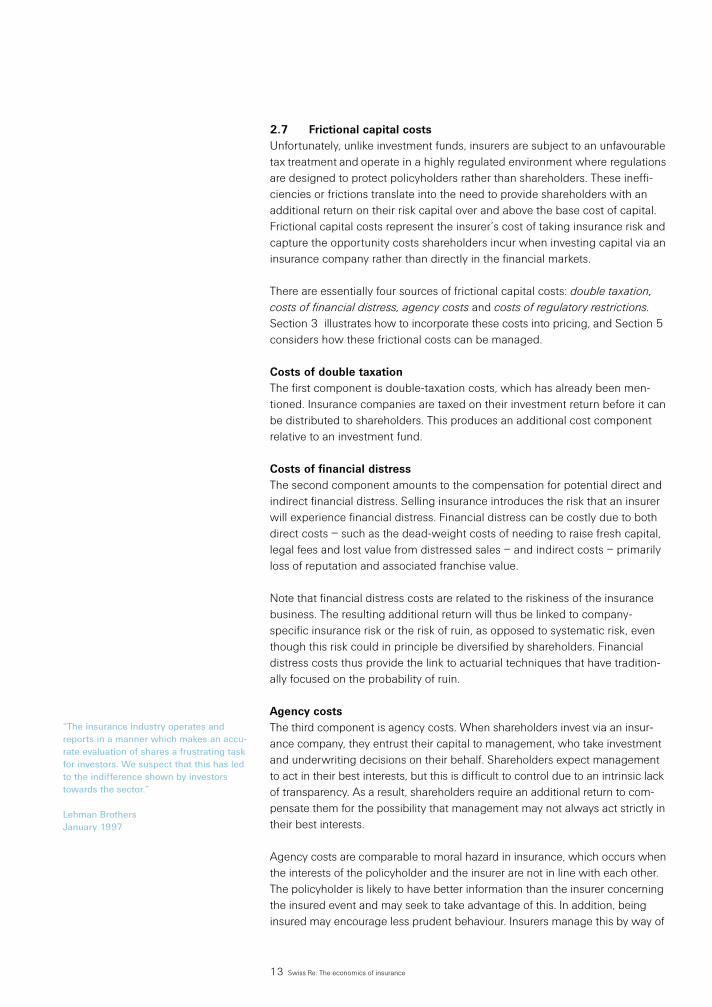
2.7 Frictional capital costsUnfortunately, unlike investment funds, insurers are subject to an unfavourabletax treatment and operate in a highly regulated environment where regulationsare designed to protect policyholders rather than shareholders. These ineffi-ciencies or frictions translate into the need to provide shareholders with anadditional return on their risk capital over and above the base cost of capital.Frictional capital costs represent the insurer’s cost of taking insurance risk andcapture the opportunity costs shareholders incur when investing capital via aninsurance company rather than directly in the financial markets.
There are essentially four sources of frictional capital costs: double taxation,costs of financial distress, agency costs and costs of regulatory restrictions.Section 3 illustrates how to incorporate these costs into pricing, and Section 5considers how these frictional costs can be managed.
Costs of double taxationThe first component is double-taxation costs, which has already been men-tioned. Insurance companies are taxed on their investment return before it canbe distributed to shareholders. This produces an additional cost componentrelative to an investment fund.
Costs of financial distress The second component amounts to the compensation for potential direct andindirect financial distress. Selling insurance introduces the risk that an insurerwill experience financial distress. Financial distress can be costly due to bothdirect costs – such as the dead-weight costs of needing to raise fresh capital,legal fees and lost value from distressed sales – and indirect costs – primarilyloss of reputation and associated franchise value.
Note that financial distress costs are related to the riskiness of the insurancebusiness. The resulting additional return will thus be linked to company-specific insurance risk or the risk of ruin, as opposed to systematic risk, eventhough this risk could in principle be diversified by shareholders. Financialdistress costs thus provide the link to actuarial techniques that have tradition-ally focused on the probability of ruin.
Agency costsThe third component is agency costs. When shareholders invest via an insur-ance company, they entrust their capital to management, who take investmentand underwriting decisions on their behalf. Shareholders expect managementto act in their best interests, but this is difficult to control due to an intrinsic lackof transparency. As a result, shareholders require an additional return to com-pensate them for the possibility that management may not always act strictly intheir best interests.
Agency costs are comparable to moral hazard in insurance, which occurs whenthe interests of the policyholder and the insurer are not in line with each other.The policyholder is likely to have better information than the insurer concerningthe insured event and may seek to take advantage of this. In addition, beinginsured may encourage less prudent behaviour. Insurers manage this by way of
“The insurance industry operates andreports in a manner which makes an accu-rate evaluation of shares a frustrating taskfor investors. We suspect that this has ledto the indifference shown by investorstowards the sector.”
Lehman BrothersJanuary 1997
68672pb Eco-Insurance 14.06.2002 14:16 Uhr Seite 13

careful contract design and by including the expected cost in premium rates.Similarly, shareholders require additional compensation for having given upcontrol over their investments and for not being able to closely monitor thedecisions taken on their behalf.
Cost of regulatory restrictionsThe fourth and last component of frictional capital are regulatory capital coststhat arise due to regulatory restrictions that may require insurers to hold mini-mum levels of capital to support specific blocks of business11. These restric-tions may take the form of either conservative reserving standards or minimumcapital requirements. They create additional potential costs for shareholders,because this capital is not readily available to support other lines of business. It can only be physically accessed by selling the underlying business, whichgenerally gives rise to additional costs that are heightened by the lack of a liquid market in insurance liabilities.
As discussed in Section 4, the cost of regulatory restrictions is the focus of theembedded value method.
Cost of capital and the CAPMInsurers often confuse the return that shareholders demand on capital, ie the cost ofcapital, with the cost of taking risk. The return that investors demand for the use oftheir capital is composed of the base cost of capital – ie the return that investors couldhave obtained by investing those funds in financial markets directly – plus frictionalcapital costs – ie the extra return to compensate them for the fact that insurers areinvesting their capital through an insurance company to support risk taking in theinsurance markets. Not making this distinction creates difficulties in determining valuecreated by underwriting activities. This is because the benchmark for underwriting isgiven by the frictional costs and not by the full cost of capital. In addition, as returns onfinancial markets are volatile, the full cost of capital is a noisy and unreliable measureof value creation from the insurance side of the business.
An exclusive focus on the total cost of capital can be even more misleading if the costof capital is measured using the CAPM, which was developed with industrial compa-nies in mind and focuses on the systematic risk a company takes. Insurance companiestake most of their systematic risk on the investment side. Whatever systematic risk isembedded in insurance liabilities can be hedged by offsetting positions on the assetside, so systematic risk is not the most important driver of the cost of taking insurancerisk. The more important drivers, frictional capital costs, are not explicitly captured byCAPM. This will inevitably lead to wrong conclusions regarding the cost of taking riskfor insurers. In addition, CAPM provides no, or misleading, guidance to insurers on howto manage their cost of taking risk.
Focusing on the cost of taking risk – as reflected by frictional capital costs – ratherthan on the total cost of capital gives insurers a better measure of value creation andalso provides greater transparency as to how risk and capital management decisionscan minimise this cost.
“Financial institutions are required to holdcapital for regulatory reasons, the earningsof which can never meet shareholder’srequired return, due to the incurred tax bur-den. A shareholder has the option to investthat capital within a more favourable fiscalenvironment.”
SchrodersNovember 1998
14 Swiss Re: The economics of insurance
11 Depending on the circumstances, ratingagency restrictions may be tracked in a waysimilar to regulatory restrictions.
68672pb Eco-Insurance 14.06.2002 14:16 Uhr Seite 14

3 Economic value of liabilities
12 Risk capital is defined as the amount ofcapital necessary to support the risk to whichthe company is exposed.13 The assumptions used reflect the specificcosts to the entity, rather than industry averageconditions. For example, they reflect the actualexpense structure of the insurer issuing thecontract rather than the expense structure of atypical insurer. Non-entity-specific assumptionshave been recommended where the objectiveis to determine the ‘exit’ value of the contract,regardless of who currently owns it. This isanalogous to the issue in accounting ofwhether to value property according to itscurrent use, eg a bowling alley, or its optimalpotential use, say a parking lot. However, ourobjective is to determine the value of thecontract to the company that issued it: we askhow much it costs them to produce the liability.14 In practice, the discount rates should reflectthe current term structure of interest rates.
The economic value of insurance liabilities is calculated as the present valueof all expected future cash flows, including the cost of risk. In this calculation,the present value should be determined using a replicating portfolio to ensurethat it incorporates current financial market information and accounts for thesystematic risk characteristics of the cash flow. The cost of taking insurancerisk is captured by the frictional costs of holding risk capital. This section illus-trates this calculation by way of example.
3.1 A simple exampleAs discussed in Section 2, the economic value of liabilities is determined bytheir replication value, including frictional costs, less an allowance for theinsurer’s option to default and any liquidity value of the contract.
This is best illustrated by way of a simple example that will also be used inSection 4 on performance measurement. The example focuses on the valua-tion of a pure insurance risk contract with cash flows payable over two yearsas shown in the table below.
15 Swiss Re: The economics of insurance
Time 0 1 2
Premiums 55 50 0
Claims 0 30 70
Expenses 5 1 1
Risk capital12 20 15 0
For simplicity, we start by considering frictional risk capital costs only. This issufficient to illustrate the principle. In the appendix to this section, wedescribe how to integrate the other key components, namely the option todefault and the liquidity value, taxes on investment income, and regulatorycapital costs.
The figures in the above table represent expected values, and all future cashflows are assumed to be paid at the end of each year13. Hence at inception thiscontract generates a premium of 55 and incurs initial expenses of 5. The riskcapital needed to support the contract amounts to 20 during the first and 15during the second year. Risk capital costs are assumed to be paid at the end ofeach year and amount to 2.5% of risk capital at the start of each year. The firststep in determining the value added by this hypothetical contract is to deter-mine the net cash flow payable, which is made up of claims and expenses lesspremiums. This cash flow pattern is shown in the table below. Frictional capitalcosts then need to be added and the resulting cash flow discounted.
Since the contract covers pure insurance risk only, the cash flows can bereplicated using fixed-income instruments of appropriate maturities. Thus thevalue of the replicating portfolio can be derived by discounting the expectedliability cash flows at risk-free rates of appropriate maturities. In this example,we use 5% per annum for the maturities of both one and two years14.
68672pb Eco-Insurance 14.06.2002 14:16 Uhr Seite 15

The discounted values are also illustrated in the table below which shows thatthe economic liabilities that need to be established at inception are 47.12.Since the company received an initial payment of 50 after expenses, we canconclude that this contract generates an economic value of 2.88.
16 Swiss Re: The economics of insurance
Time 0 1 2
Net cash payments 50.00 19.00 – 71.00
Risk capital cost 0.00 – 0.50 – 0.38
Net cash flow after frictional costs 50.00 18.50 – 71.38
Economic liabilities 47.12 67.98 0.00
Hence the replicating portfolio in this example has a market value of 47.12,consisting of zero coupon bonds of two years’ duration with a market value of64.74 and a short position, or borrowing, in one-year zero coupons with amarket value of -17.62.
This example can also be illustrated in the format of an income statement asshown below, where investment return is simply the return of the replicatingportfolio. Note that the economic view recognises all anticipated profit at thestart of the contract.
Income statement 0 1 2
Premiums 55.00 50.00 0.00
Investment return 0.00 2.36 3.40
Claims 0.00 – 30.00 – 70.00
Expenses – 5.00 – 1.00 – 1.00
Change in economic liabilities – 47.12 – 20.86 67.98
Result 2.88 0.50 0.38
Risk charge 0.00 – 0.50 – 0.38
Economic profit 2.88 0.00 0.00
As mentioned earlier, insurers create value for shareholders by borrowing frompolicyholders at below-market interest rates. To highlight this point, the eco-nomic profit generated in this example can be expressed in terms of the costof borrowing. The cost of borrowing is given by the internal rate of returnbased on the net cash flow. In this example, the internal rate of return is 2.4%.Since the equivalent market yield available to investors is 5%, the insurancecontract generates a spread of 2.6%. In other words, this contract providesthe insurer with funds at a borrowing rate of 2.6% below market rates. Notethat, when performing this calculation, it is important to include frictional capi-tal costs in the net cash flow and to use the replicating portfolio to determinethe equivalent market rate. Moreover, it is often mathematically impossible tocalculate an internal rate of return for insurance cash-flow patterns. For thesereasons, we recommend that contracts should be assessed using economicprofit rather than borrowing spreads.
68672pb Eco-Insurance 14.06.2002 14:16 Uhr Seite 16

17 Swiss Re: The economics of insurance
As noted earlier, for the more technically interested reader, the appendix tothis section extends this example by incorporating the default option and liq-uidity value, double tax, and regulatory capital costs.
Quantifying frictional capital costsThe quantification of capital costs is difficult in any valuation framework and requires a great deal of professional judgement. While this publication does not offer a recipefor quantifying capital costs, this section provides a rough guide as to how these costsmay be determined.
Double taxation costs will depend on the tax jurisdiction and on how the assets aremanaged. As a rule, tax rates on investment income are readily available and may varydepending on the type of asset held or the type of income generated. As these rulesare usually explicit, this generally does not present any difficulties in valuation. How-ever, additional assumptions, such as the frequency with which capital gains arerealised, may well be necessary.
Financial distress costs will largely depend on the risk profile of the company – ie onthe likelihood of financial distress – and on the value of its intangible assets or fran-chise value. Studies of industrial companies have revealed that financial distress, asopposed to bankruptcy, results in costs of around 10–20% of market value. Thesecosts are likely to be higher in the insurance industry due to the credit-sensitive natureof policyholders. An upper range for these costs is the franchise value of the company.
Agency costs depend on factors that are hard to measure, such as reputation andtransparency. Nevertheless, they can be estimated by considering market compara-bles. For instance, spreads on cat bonds, which are unfamiliar and thus opaque toinvestors, can be considered as representing some type of agency charge. Also, thediscounts typically applied by analysts to companies with excess capital on theirbalance sheets can be interpreted as being largely an agency charge. Based on thesetypes of comparison, estimates of their size range between 5 and 200 basis points of capital held.
Regulatory restrictions are akin to liquidity restrictions, which have numerous marketcomparables. These include securities that are issued with trading restrictions, spreadson private placements, or the spread on off-the-run treasuries. Depending on thenature of the restrictions and the composition of the portfolio, estimates for these costsrange between 0 and 200 basis points.
The default option and liquidity value can be quantified by considering the spread onthe standard debt issued by the insurer, or like insurers. This spread typically representsan upper bound because policyholders usually rank above debt holders in the event of default. If the underlying liabilities are considered to be liquid in the sense describedpreviously, then this spread should be further reduced by the liquidity premium implicitin corporate debt. This liquidity premium can be quantified using the same marketcomparables as those used for the regulatory restrictions.
68672pb Eco-Insurance 14.06.2002 14:16 Uhr Seite 17

3.2 Section appendix: Incorporating all frictional itemsFor completeness, this appendix briefly describes how to include the value of the option to default and liquidity value, taxes on investment income, andregulatory capital costs.
Default option and liquidity valueFor valuation purposes, the option to default and liquidity value can be incor-porated into the calculation of the liability value by increasing the discountrate applied to the net cash flows. For example, if the spread due to defaultand liquidity is 50 basis points then, as shown in the table below, the eco-nomic value of the liabilities at inception is reduced by 0.53 to 46.59. Thisincreases the economic profit to 3.41.
Note that this does not imply that the replicating portfolio earns this additionalreturn. As discussed previously, the replicating portfolio best matches the liability cash flows and is constructed using default-free and liquid instruments.The additional return of 50 basis points reduces the frictional capital costs; thereplicating portfolio does not earn it.
18 Swiss Re: The economics of insurance
Time 0 1 2
Net cash flow after
frictional costs 50.00 18.50 – 71.38
Economic liabilities 46.59 67.65 0.00
Including double taxation costsThe example of Section 3 can be further extended to incorporate tax, includ-ing double taxation costs, assuming a tax rate of 35%. In addition, assumethat the total assets held to back the contract are given in the table below.
Time 0 1 2
Regulatory and tax reserves 100 70 0
Risk capital 20 15 0
Total assets 120 85 0
As illustrated in the box on page 19, double tax costs can be determined byassuming that the assets held earn a risk-free rate of return. As a result, theexpected risk-free investment return is 5% of 120, or 6, in the first year and5% of 85, or 4.25, in the second year. These returns can then be incorporatedinto the tax calculation as shown in the income statement below.
68672pb Eco-Insurance 14.06.2002 14:16 Uhr Seite 18

19 Swiss Re: The economics of insurance
Including this in the original net cash flow and discounting, allowing for thedefault option and liquidity value, results in an initial economic liability value of65.86 and a corresponding economic profit of 1.64. This is shown in thetable below.
Income statement 0 1 2
Premiums 55.00 50.00 0.00
Total investment return
(risk-free) 0.00 6.00 4.25
Claims 0.00 – 30.00 – 70.00
Expenses – 5.00 – 1.00 – 1.00
Change in regulatory reserves – 100.00 30.00 70.00
Tax result – 50.00 55.00 3.25
Tax 17.50 – 19.25 – 1.14
Time 0 1 2
Net cash flow after
frictional costs 50.00 18.50 – 71.38
Tax 17.50 – 19.25 – 1.14
Net cash flow after tax 67.50 – 0.75 – 72.51
Economic liabilities 65.86 68.73 0.00
Valuing tax on investment incomeTax on investment income provides a good example of how replication can be used forvaluation purposes. It is particularly useful because it shows how common intuitionand practice can lead to misleading results.
The future tax payment is equal to the investment return earned on the capital investedmultiplied by the appropriate tax rate. For example, if the capital invested is 100, thereturn 10%, and the tax rate 35%, then the tax payment would be 3.5.
To replicate this payment, we can use the following strategy: First, invest an amountequal to the tax rate times the capital in the same asset category as the underlyingcapital. In this example this would mean investing 35, which would be worth 38.5 atyear-end.
Second, borrow by issuing a zero coupon bond with a face value equal to the tax ratetimes the capital. In this example, the bond would pay 35 at year-end.
Hence the year-end total cash flow on this portfolio would be 38.5 less 35, whichequals the tax payment of 3.5. Note that the year-end value of this portfolio is alwaysequal to the tax payment, no matter what return is earned on the underlying assets. Asa result, it replicates the tax payment.
The present value of this replicating portfolio is equal to the capital invested of 35 lessthe amount borrowed. As the tax will be due with virtual certainty, the borrowing shouldbe discounted at risk-free rates. Hence the amount borrowed would cost 33.33, assum-ing a 5% risk-free rate. Therefore the total cost of the replicating portfolio is 1.67.
68672pb Eco-Insurance 14.06.2002 14:16 Uhr Seite 19

Another way of looking at this is that the tax payment could be valued using risk-freerates of return. In other words, value the tax payment assuming that the capital isinvested in risk-free instruments. In this example, this would be given by 35% of 5discounted at 5%, or 1.67.
20 Swiss Re: The economics of insurance
Income statement 0 1 2
Premiums 55.00 50.00 0.00
Investment return 0.00 3.31 3.44
Claims 0.00 – 30.00 – 70.00
Expenses – 5.00 – 1.00 – 1.00
Change in economic liabilities – 66.27 – 2.51 68.77
Before-tax result – 16.27 19.81 1.21
Tax 17.50 – 18.31 – 0.85
After-tax result 1.23 1.50 0.36
Default option and liquidity value 0.00 0.33 0.34
Double taxation 0.00 – 0.94 – 0.28
Risk capital cost 0.00 – 0.50 – 0.38
Regulatory capital cost 0.00 – 0.39 – 0.04
Capital costs 0.00 – 1.50 – 0.36
Economic profit 1.23 0.00 0.00
Regulatory capital costsThe calculation of regulatory capital costs is complicated because these costsdepend on the size of the economic liabilities but at the same time are part ofeconomic liabilities. This creates a circular calculation. Nevertheless, this canbe overcome relatively easily.
The following income statements and balance sheets show the calculationassuming regulatory costs of 1%. Regulatory costs are assumed to be paid at the end of the interval based on the restricted capital at the start of theinterval. This calculation assumes that the minimum regulatory capital require-ments are 5 at inception and 3 at time one. The regulatory reserves weregiven in the previous section.
The balance sheet shows the full breakdown of the liability value. Note thatthe above regulatory capital costs are simply equal to the restricted capital atthe start of the interval multiplied by the 1% liquidity charge.
68672pb Eco-Insurance 14.06.2002 14:16 Uhr Seite 20
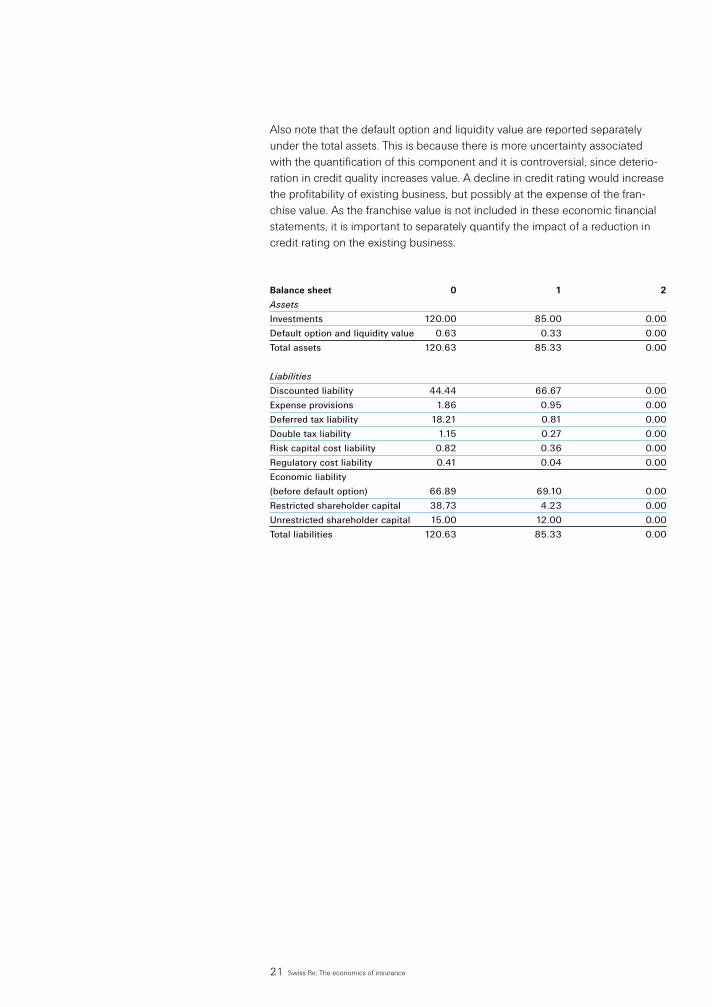
Also note that the default option and liquidity value are reported separatelyunder the total assets. This is because there is more uncertainty associatedwith the quantification of this component and it is controversial, since deterio-ration in credit quality increases value. A decline in credit rating would increasethe profitability of existing business, but possibly at the expense of the fran-chise value. As the franchise value is not included in these economic financialstatements, it is important to separately quantify the impact of a reduction incredit rating on the existing business.
21 Swiss Re: The economics of insurance
Balance sheet 0 1 2
Assets
Investments 120.00 85.00 0.00
Default option and liquidity value 0.63 0.33 0.00
Total assets 120.63 85.33 0.00
Liabilities
Discounted liability 44.44 66.67 0.00
Expense provisions 1.86 0.95 0.00
Deferred tax liability 18.21 0.81 0.00
Double tax liability 1.15 0.27 0.00
Risk capital cost liability 0.82 0.36 0.00
Regulatory cost liability 0.41 0.04 0.00
Economic liability
(before default option) 66.89 69.10 0.00
Restricted shareholder capital 38.73 4.23 0.00
Unrestricted shareholder capital 15.00 12.00 0.00
Total liabilities 120.63 85.33 0.00
68672pb Eco-Insurance 14.06.2002 14:16 Uhr Seite 21

4 Performance measurement
The previous sections have illustrated the importance of economic value andthe way in which economic value is determined. This section shows, by wayof example, how to structure an insurance company’s financial statements tofacilitate performance measurement on an economic basis.
Performance measurement is a key component in value management. Histori-cal performance should feed back into compensation arrangements, riskmanagement, and future pricing assumptions (see Section 5). Monitoring theeconomic value of the company is also essential for managing capital andcapacity levels and is important for shareholder communication. Therefore, akey ingredient in managing value is a set of financial statements that a) determine the economic capital of an insurer and the return achieved onthat economic capital and b) explain the drivers of historical performance.
The underlying method used in performance measurement should be thesame as that used in valuation or pricing. As a result, economic performancemeasurement is based on the same underlying principles as those discussedin previous chapters. These include the use of expected value assumptions,the use of replicating portfolios, and the incorporation of frictional capitalcosts. Moreover, economic performance measurement should recognise allanticipated profit at the inception of the contract.
4.1 A simple example revisitedIn Section 3, we demonstrated the basic structure of the economic incomestatement and balance sheet for a single contract. In this section, we willextend that example to include deviations from expected cash flows as well asthe investment returns earned on actual investments held. We also show howthe economic result can be attributed to the various functions within the com-pany. Before doing this, we will recapitulate the example in Section 3.
The expected cash flows at inception are shown in the table below:
22 Swiss Re: The economics of insurance
Time 0 1 2
Premiums 55 50 0
Claims 0 30 70
Expenses 5 1 1
Risk capital 20 15 0
Again, starting with the simplest case of zero tax and regulatory capital costs,providing that everything develops as expected and under the assumptionthat interest rates do not change, the value of the contract at the end of thefirst interval is as follows:
Time 1
Discounted liability 66.67
Expense provisions 0.95
Risk capital cost liability 0.36
Economic liability 67.98
68672pb Eco-Insurance 14.06.2002 14:16 Uhr Seite 22

23 Swiss Re: The economics of insurance
Now suppose that the one-year interest rate at the end of the first year is 6%,rather than 5% as expected, and all other assumptions remain the same. Thenthe value of this contract is shown in the table below. The economic liabilityhas reduced from the original expectation because the expected future cashflows are now discounted at a higher interest rate.
Time 1
Discounted liability 66.04
Expense provisions 0.94
Risk capital cost liability 0.35
Economic liability 67.33
In addition to the change in interest rates, assume that the actual claims andexpenses paid at the end of the first year are 25 and 2, respectively, ratherthan 30 and 1 as expected. The corresponding economic income statementis shown below.
Income statement Time 1
Premiums 50.00
Investment return
(replicating portfolio) 1.71
Claims – 25.00
Expenses – 2.00
Change in economic liabilities – 20.21
Result 4.50
Risk charge – 0.50
Economic profit 4.00
Note that the investment return has reduced from 2.36 in the projectedincome statement calculated at inception to 1.71. This reflects the valuereduction of the replicating portfolio due to the increase in interest rates. Note,however, that the change in economic liabilities is now – 20.21, compared tothe expected value of – 20.86 at time zero. The replicating portfolio thereforeimmunises the result from changes in interest rates.
The economic profit of 4 results from claims being 5 lower than expected andexpenses being 1 higher than expected. The change in interest rates has noimpact on the economic result.
4.2 Treasury function and transfer pricingThe income statement in the previous section is based solely on the replicatingportfolio. However, insurers generally do not invest in the replicating portfolioand the overall financial statements should reflect the performance of the actual investment portfolio held. Furthermore, they should distinguishbetween earnings generated by underwriting activities and earnings generatedby investment activities. This is achieved by introducing a treasury function.
68672pb Eco-Insurance 14.06.2002 14:16 Uhr Seite 23

The treasury function is used to properly allocate investment returns andcapital costs between the underwriting and investment activities within aninsurer. This need not necessarily be an explicit function within the organisa-tion, but it is always implicit. It is used to split the overall financial statementsinto investment, treasury, and underwriting components using the replicatingportfolio and a Strategic Asset Allocation (SAA) benchmark portfolio, asshown in the graph below4.
24 Swiss Re: The economics of insurance
The process underlying this approach can be summarised as follows.
As the underwriting function specialises in insurance risk, it minimises itsexposure to financial market risk by purchasing the replicating portfolio fromthe treasury. This ensures that the underwriting performance is not influencedby investment decisions. The underwriting function is supported by share-holder capital held in the treasury balance sheet. The cost of providing thissupport is represented by the frictional capital costs paid.
The treasury function determines the level of financial risk that the companyshould take for strategic reasons by specifying the SAA benchmark for theinvestment function. As a result, the treasury balance sheet is comprised ofassets represented by a loan to the investment function of the SAA portfolioand liabilities represented by borrowing from the underwriting function of thereplicating portfolio. Therefore, the treasury function isolates the impact of thestrategic asset-liability mismatching decision. The shareholder capital, orequity, in the company resides in the treasury balance sheet. Note that byspecifying the SAA, the treasury function tacitly determines the base cost ofcapital.
Assets SAAportfolio
SAAportfolio
Equity
Equity
Liability
LiabilityAssets
Investments B-S
TAA and stock selection
Treasury B-S
Economic B-S
Overall risk tolerance
Underwriting B-S
Insurance, replication risk
15 For simplicity, this graph excludes thedefault option and liquidity value components. The impact of these components is illustratedin the graph in Section 2.
Replicatingportfolio
Replicatingportfolio
68672pb Eco-Insurance 14.06.2002 14:16 Uhr Seite 24

25 Swiss Re: The economics of insurance
The investment function uses the SAA as a benchmark, but has discretion,within limits, on tactical asset allocation and stock selection. The investmentbalance sheet includes the actual investment portfolio as the asset and theSAA benchmark as the liability. The investment balance sheet separately iden-tifies the impact of investment decisions.
The above separation implies a corresponding separation of the income state-ment. This can be illustrated by extending the above example. Assume thatthe insurer in this example holds total assets of 120 at inception that earn areturn of 10%, compared with a return of 9% on the SAA benchmark for asimilar level of market risk. Then the investment function adds value of 1% ofassets or 1.2 and the overall income statement is structured as shown below.
Income statement Total Insurance Investment Treasury
Premiums 50.00 50.00
Investment return 12.00 1.71 12.00 – 1.71
Claims – 25.00 – 25.00
Expenses – 2.00 – 2.00
Change in liabilities – 20.21 – 20.21
Result 14.79 4.50 12.00 – 1.71
Base cost of capital – 9.09 0.00 – 10.80 1.71
Risk capital cost – 0.50 – 0.50
Capital costs – 9.59 – 0.50 – 10.80 1.71
Economic profit 5.20 4.00 1.20 0.00
The insurance function receives the return on the replicating portfolio from thetreasury function. The investment function receives the total investment returnand is charged with the return on the SAA benchmark. The treasury functionis not a profit centre; it is merely used to transfer payments between theinvestment and insurance functions. It pays out the return on the replicatingportfolio to the insurance function, subsequently receives the return on theSAA benchmark 10.80, and is charged with the overall base cost of capital – 9.09 (1.71 in aggregate).
Note that, in this example, the expenses of the investment function have beenincluded in the insurance function’s expenses. This is because the insurancefunction is assumed to pay a fee to the investment function that preciselymatches their expenses. In practice, these fees and expenses may be explic-itly reported to assess whether the additional expenses associated with activemanagement are justified by additional returns.
The appendix to this section shows how to include the option to default andthe value of liquidity, double taxation costs and regulatory capital costs.
68672pb Eco-Insurance 14.06.2002 14:16 Uhr Seite 25

4.3 Performance attribution analysisWhile the economic income statement records the overall result, it is generallyinsufficient to fully explain it. This difficulty is exacerbated if multiple businesslines, with contracts having different inception dates, are consolidated togetherin a single statement. To address this, a performance attribution analysis isrequired.
A performance attribution analysis is designed to explain the overall result interms of the key drivers of value. On the insurance side, the minimum require-ment for an attribution analysis is to split the overall result by main line ofbusiness and into the contribution from new business and from existing busi-ness. This could be extended by splitting the performance of existing businessby year of inception. For the new business, the result should be comparedwith the initial profit targets set. For the existing business, the expected resultis zero and any deviations should be explained. For example, by identifyingthe impact of any changes to the reserving assumptions or by identifying theimpact of experience being different from each key assumption. As the impor-tance of these factors vary by product and market, it is not possible to producea generalised insurance attribution analysis.
On the investment side, an attribution analysis would split the investmenteconomic profit into the key factors driving investment performance, includingasset allocation, currency selection, stock selection, or sector selection. Thisinformation is essential for understanding the result so that appropriate man-agement action can be taken where necessary.
4.4 Target settingAs discussed previously, shareholders typically expect insurers to earn aneconomic profit, and this expectation is implicitly reflected in the company’sfranchise value. Only if shareholder profit expectations are exceeded will theshare price increase. As a result, for incentive compensation and in communi-cating with shareholders, it is important for managers to set economic profittargets.
The franchise value of an insurer provides an overall yardstick for value cre-ation, but it says nothing about when this economic profit is expected to ariseor which units are expected to deliver it. It is possible to estimate the annualprofit expectations by multiplying the franchise value by a suitable discountrate, which reflects current long-term interest rates and a systematic risk pre-mium associated with realising future new business sales. This approachassumes that the franchise value reflects a constant profit stream paid inperpetuity. However, there is no mechanistic way of setting profit targets for individual business units.
The targets for individual business units should be based on a range of con-siderations relating to the current and likely future competitive state of thelocal insurance market. This is, and always has been, one of the key tasks ofmanagement: to judge the level of profit that maximises long-term value.These targets should be benchmarked against other companies operating insimilar circumstances, if possible. They should also be added up and com-
26 Swiss Re: The economics of insurance
68672pb Eco-Insurance 14.06.2002 14:16 Uhr Seite 26

27 Swiss Re: The economics of insurance
pared with the overall target implicit in the franchise value. This comparisonprovides management with an indication of the extent to which the market isover or undervaluing the company. This information is invaluable for investorrelations and capital planning.
4.5 Incentive compensationHaving an incentive compensation system linked to economic profit is not onlyan essential part of encouraging value creation, but is also vital for risk man-agement. The primary cause of financial fiascos is usually a misalignment ofincentives.
However, effective incentive systems need to be carefully constructed and donot simply entail including economic profit in bonus calculations. Incentivecompensation should be unambiguously linked to economic value creation. In addition, senior management must be seen to be fully committed to valuemanagement, and employees need to be well informed about the value meas-ure. The value measure must be accepted as being fair.
Implementing economic value-based incentives in insurance is further compli-cated by the nature of the insurance business. Insurers make risk-takingdecisions on an ex ante basis – ie before risks are realised. An ideal incentivesystem would reward decision makers for making the right decision ex anterather than reward them for being fortunate or penalise them for being unfor-tunate. In most cases, however, the performance of business units andmanagers can be measured only on an ex post basis – ie after risk is realised. An ex ante system would also be difficult to justify to shareholders, and wouldprobably result in increased agency costs.
Implementing an incentive system for insurers is also complicated because it should be based on the full downside of the risk as well as on the fullupside. Giving managers who create economic profits on an ex post basis abonus, but not penalising those managers who produce negative economicprofits, gives managers a free put option. They can maximise the value of thisoption by maximising the amount of risk taken. But this behaviour leads topoor operating efficiency and puts the solvency of the firm at risk.
Including the full downside of risks in an incentive system can be problematic,particularly for low-frequency, high-severity risks. One solution is to implementa deferral system where bonuses are initially paid into a trust and only paidout to employees after a number of years. Negative bonuses can then beoffset against any positive balance in the bonus trust. In effect, the deferralsystem averages out the riskiness of economic profit. It also encouragesemployee retention if the trust is not paid out when the employee leaves thefirm. However, the amount of smoothing that can be accomplished with adeferral system is limited, since incentives lose their impact when the payoutis extended far into the future. This is a particular difficulty for long-tail busi-ness, such as casualty and some life lines of business where even a five-yeardeferral system is relatively short.
68672pb Eco-Insurance 14.06.2002 14:16 Uhr Seite 27

It is reasonable to base incentives on total economic profit for executives whoare responsible for a diversified portfolio of risks. However, for line managersat a lower level, the portion of total compensation tied to economic profit islimited by the riskiness of the underlying business. For high-risk business,which produces either losses or extreme profits, it would be unacceptable tobase compensation entirely on economic profit.
For employees below the line management level, incentives based upon theeconomic profit produced by their business units are less effective. This isbecause the impact of an individual on the performance of the group is diluted.A more effective incentive system at this level would identify the drivers ofprofit that an individual can impact and then link compensation to those driversonly. For example, in companies where the underwriting function is separatefrom the marketing function, it is advisable to implement a two-stage incentivesystem. Underwriters calculate the economic value of insurance contracts. This economic value is used as a benchmark to measure the performance ofthe marketing unit. Marketing staff are rewarded for selling insurance abovethis economic value. Underwriters are rewarded for producing ex ante riskprices that are in line with their ex post costs. In this incentive system, it isimportant that the incentives for underwriters be symmetric – ie they arepenalised when the ex post cost is either higher or lower than their ex anteprice. In practice, this implies a high baseline bonus that is subsequentlyreduced to the extent that the price was higher or lower than cost.
Comparison with other value measures
Embedded ValueThe embedded value method is most popular with British life insurance companies. Itcalculates the value of existing business, termed in-force value, as the discountedfuture statutory profits that are expected to emerge on this business. The risk discountrate used in this calculation is intended to represent the insurer’s overall cost of capitaland is typically around 3% above risk-free rates. The embedded value is then given bythe sum of the in-force value and the market value of the statutory shareholder capital.The reason given for basing the embedded value calculation on statutory accounts isthat they determine when the capital is available for distribution.
The embedded value method is a special case of the economic framework describedin this publication. It can be derived by using expected earned rates on the backingassets rather than spot forward yields, by setting the risk capital costs to zero, and bysetting the regulatory capital cost to the difference between the risk discount rate andthe expected earned rate. This indicates that the embedded value method is not basedon economic principles for the following reasons:
Firstly, using the embedded value method, value is based on the composition of thebacking assets rather than on the risk characteristics of the cash flows being valued.This is because the projected statutory profits are calculated incorporating expectedinvestment returns. For example, the projected investment cash flows on corporatebonds are assumed to be the future coupons multiplied by the probability that thebond is not in default. As spreads on corporate bonds are typically greater than theircorresponding default probabilities, the embedded value method generally places ahigher in-force value on business backed by corporate rather than government bonds.
28 Swiss Re: The economics of insurance
68672pb Eco-Insurance 14.06.2002 14:16 Uhr Seite 28

29 Swiss Re: The economics of insurance
The embedded value method creates a bias towards high-yield investments that is notjustified from an economic perspective. The value of the liabilities should be independ-ent of the composition of the backing assets.
As a result, the embedded value method fails to respect a fundamental principle offinancial economics: that the cost of capital should depend on the use of funding5 andshould only depend on the source of funding to the extent that the source of fundingaffects frictional costs, such as tax and costs of financial distress. Whether a project isfunded by equity or debt should be largely irrelevant to its value. In so doing, theembedded value method does not properly account for the difference between non-diversifiable, or systematic, versus diversifiable risk.
Secondly, the embedded value method levies frictional capital costs solely on the basis of regulatory restrictions. It does not explicitly allow for frictional risk capital costs.Thus, in the extreme, if two lines of business were written in different territories, theone line being virtually risk-free but requiring high regulatory reserves, the other beingrisky but only requiring low levels of regulatory reserves. Then the embedded valuemethod would penalise the former line regardless of the level of risk inherent in theother line.
Thirdly, under the embedded value method, the level of the regulatory capital charge ishighest for business backed by the lowest yielding assets. This would typically meanthat the least risky business would be allocated the highest frictional capital costs.
Lastly, as the embedded value method is based on expected cash flows it does noteasily accommodate options and guarantees. The economic method properly allowsfor these by valuing them based on a corresponding replicating portfolio. Valuing theseoptions based on expected cash flows is likely to understate their value.
RAROCRAROC, or risk-adjusted return on capital, is a performance measure that is typicallydefined as discounted economic profit divided by risk capital. There are many differentvariations to the name and calculation of this measure. It is not inconsistent with theeconomic framework outlined in this publication and can be a useful steering measureif capital were a scarce resource.
If capital were plentiful, then the only criteria for accepting business should be whethereconomic profit is positive. Conversely, if capital were scarce, then it should be allo-cated to the projects that are expected to earn the greatest economic profit relative tothe capital invested. This relationship is quantified by the RAROC measure and isequivalent to allocating profit targets based on risk capital.
The difficulties with RAROC measures tend to arise because of the measures of profitor capital that are sometimes used. In many cases, capital costs are not included in theeconomic profit measure. Instead, they are incorporated in a RAROC hurdle rate. This isproblematic because this approach implicitly assumes that all capital costs are propor-tionate to economic capital. However, this is generally not the case for regulatory andtax costs.
Another problem with the application of RAROC hurdle rates lies in the way the hurdlerate is calculated. In many cases, the hurdle rate is measured using the CAPM model.As stressed previously, the capital costs incurred as a result of writing insurance risksare primarily frictional capital costs. Capital cost measures based upon CAPM largelyignore these costs, stressing instead the base cost of capital that is primarily incurredon the investment side of the business.
16 This is a consequence of the Modigliani and Miller propositions.
68672pb Eco-Insurance 14.06.2002 14:16 Uhr Seite 29

Some versions of RAROC also consider capital utilisation only in the initial year. Thistends to overstate the profitability of longer-term contracts. Properly constructed,RAROC measures should include the discounted risk capital over the duration of thecontract, rather than just initial risk capital.
Some RAROC measures also discount expected returns at the expected earned investment rate. This approach has similar problems to the embedded value method. It does not properly value systematic risk and it is biased towards higher yielding backing assets. It is important that the replicating portfolio replicates the systematicrisk in the corresponding cash flows. Note that risk capital generally does not properlyaccount for systematic risk because it is measured relative to the insurer’s insolvency,rather than market, risk.
If misinterpreted, RAROC can also create incentives to take excessive investment risk.When a company takes more investment risk, the amount of economic capital allo-cated to investment risk rises and the amount allocated to insurance risks generallyfalls. As a result, RAROC results for insurance units will tend to rise as insurers increasetheir investment risk. However, this does not necessarily imply that the profitability ofthe company has increased.
4.6 Section appendix: Incorporating all frictional itemsTo make the above example more realistic, tax, company default risk, andregulatory restrictions on capital should also be included. This is illustrated inthe financial statements shown below. These statements are based on theoriginal assumptions and further assume that statutory reserves are equal toundiscounted expected future claims and that in addition regulators requireminimum capital of 5 at inception and 3 at time 1.
A tax rate of 35% has been used, where tax is payable on the statutory resultand is initially due at inception.
The allowance for the insurer’s default option and liquidity value is assumed to be an additional spread of 50 basis points. The impact of this spread hasbeen included in the base cost of capital for the insurance operations in theincome statement and under the assets in the balance sheet. As mentionedpreviously, this enables the impact of a change in credit rating to be isolatedand excluded if necessary.
The income statement shows that the insurance operations achieved an eco-nomic profit of 2.60 after tax, which is simply the pre-tax profit of 4 less tax at 35%. The investment operation achieved an economic profit of 0.78, whichis the pre-tax outperformance of 1.20 less tax at 35%. The overall economicprofit is equal to 3.38.
30 Swiss Re: The economics of insurance
68672pb Eco-Insurance 14.06.2002 14:16 Uhr Seite 30

31 Swiss Re: The economics of insurance
Note that the investment return allocated to the insurance function is consider-ably higher than in the previous example. This largely reflects the return on theportfolio that replicates the double taxation payment. As in the original simpli-fied example, this illustrates that the insurance function result is immunisedfrom changes in investment conditions.
In addition, the line item double taxation does not add any additional costs tothe insurer overall because tax on investment income is already included in the tax line item. The double taxation line item is used to re-allocate the taxincurred on the SAA benchmark to the insurance and treasury functions.
The balance sheet shows that the total economic shareholder capital is 16.59.Of this total, 4.59 cannot be realised without infringing the regulatory restric-tions and 12 can be realised without restriction. It also shows the full breakdownof the economic liabilities, including the default option and liquidity value.
Income statement Total Insurance Investment Treasury
Premiums 50.00 50.00
Investment return 12.00 4.63 12.00 – 4.63
Claims – 25.00 – 25.00
Expenses – 2.00 – 2.00
Change in liabilities – 2.14 – 2.14
Before-tax result 32.86 25.48 12.00 – 4.63
Tax – 22.75 – 19.71 – 4.20 1.16
After-tax result 10.11 5.77 7.80 – 3.47
Base cost of capital – 5.84 0.33 – 10.80 4.63
Double taxation 0.00 – 2.62 3.78 – 1.16
Risk charge – 0.50 – 0.50
Regulatory charge – 0.39 – 0.39
Capital costs – 6.73 – 3.18 – 7.02 3.47
Economic profit 3.38 2.60 0.78 0.00
Balance sheet
Assets
Investments 85.00
Default option and liquidity value 0.32
Total assets 85.32
Liabilities
Discounted liability 66.04
Expense provisions 0.94
Deferred tax liability 1.03
Double tax liability 0.33
Risk capital cost liability 0.35
Regulatory cost liability 0.04
Economic liability (before default option) 68.73
Restricted shareholder capital 4.59
Unrestricted shareholder capital 12.00
Total liabilities 85.32
68672pb Eco-Insurance 14.06.2002 14:16 Uhr Seite 31
5 Managing risk and capital
Measuring the economic value of insurance contracts renders transparent the costs of producing insurance and thus reveals the actions insurers cantake to manage these costs. Of particular importance is managing the cost of taking risk, which is determined by frictional capital costs. These are often a significant component in providing insurance coverage. However, they areoften managed inefficiently or even ignored.
Insurers have many opportunities to manage capital costs. For example,diversification and hedging are tools that can be used to lower the amount ofcapital a company needs to support insurance risks. Holding tax-efficientinvestments, such as equities that allow tax deferral on capital gains, reducesthe cost of holding capital. Risk transfer to financial and reinsurance marketscan also be used effectively whenever the cost of taking risk is higher than thecost of transferring risk.
The assessment of most risk and capital management strategies is compli-cated by the fact that they inevitably involve a trade-off between risk andreturn. For instance, investing in equities can save on tax expenses and resultin higher investment returns, but can also involve taking more risk and there-fore increase capital costs. As a result, the ability to quantify the risk-returntrade-off on company value is a critical ingredient for effective risk and capitalmanagement.
5.1 Drivers of the cost of taking riskThe goal of risk and capital management should be to enhance operatingefficiency by minimising the costs of taking risk. This requires a deep under-standing of the drivers of capital costs as well as the tools that insurers haveat their disposal to influence those drivers. The sources of these costs werediscussed in previous sections. Here, we emphasise the drivers of those costs.
Base cost of capitalThe base cost of capital is the benchmark return on the asset portfolio less thereturn on the replicating portfolio. As a result, the base cost of capital dependson the insurer’s investment strategy. An insurer who invests his capital con-servatively will have a lower base cost than one who pursues an aggressiveinvestment strategy.
However, the base cost of capital does not directly impact value creation oroperating efficiency. This is because shareholders do not benefit from a strat-egy that only changes the base cost of capital. In principle, they could unwindchanges to the base cost of capital by making corresponding changes to theirown portfolios. For example, if an insurer switched from equities to bonds,then shareholders could in principle nullify the impact of this by selling equiv-alent bonds and purchasing equivalent equities in their own portfolios. Share-holders would only benefit indirectly to the extent that the investment strategyreduces operating and frictional costs. Though it obviously has an importantimpact on the earnings of the company, the base cost of capital per se is not a driver of value creation. It just represents the appropriate reward for the levelof financial market risks to which shareholders’ capital is exposed and there-fore merely provides a minimum benchmark for asset management.
32 Swiss Re: The economics of insurance
68672pb Eco-Insurance 14.06.2002 14:16 Uhr Seite 32
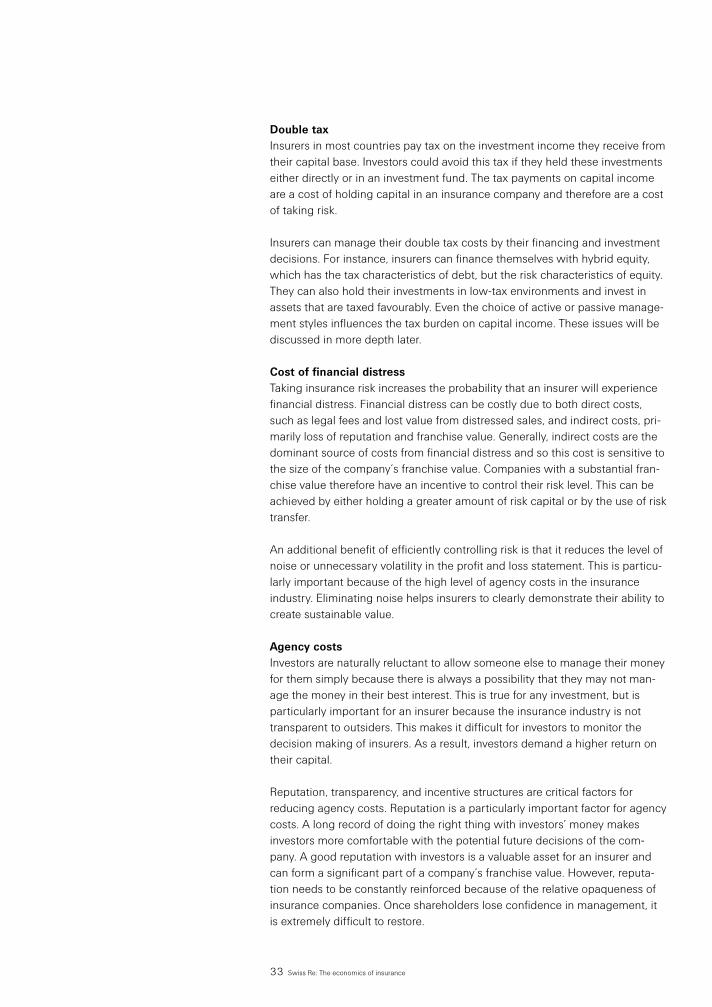
Double taxInsurers in most countries pay tax on the investment income they receive fromtheir capital base. Investors could avoid this tax if they held these investmentseither directly or in an investment fund. The tax payments on capital incomeare a cost of holding capital in an insurance company and therefore are a costof taking risk.
Insurers can manage their double tax costs by their financing and investmentdecisions. For instance, insurers can finance themselves with hybrid equity,which has the tax characteristics of debt, but the risk characteristics of equity.They can also hold their investments in low-tax environments and invest inassets that are taxed favourably. Even the choice of active or passive manage-ment styles influences the tax burden on capital income. These issues will bediscussed in more depth later.
Cost of financial distressTaking insurance risk increases the probability that an insurer will experiencefinancial distress. Financial distress can be costly due to both direct costs,such as legal fees and lost value from distressed sales, and indirect costs, pri-marily loss of reputation and franchise value. Generally, indirect costs are thedominant source of costs from financial distress and so this cost is sensitive tothe size of the company’s franchise value. Companies with a substantial fran-chise value therefore have an incentive to control their risk level. This can beachieved by either holding a greater amount of risk capital or by the use of risktransfer.
An additional benefit of efficiently controlling risk is that it reduces the level ofnoise or unnecessary volatility in the profit and loss statement. This is particu-larly important because of the high level of agency costs in the insuranceindustry. Eliminating noise helps insurers to clearly demonstrate their ability tocreate sustainable value.
Agency costsInvestors are naturally reluctant to allow someone else to manage their moneyfor them simply because there is always a possibility that they may not man-age the money in their best interest. This is true for any investment, but isparticularly important for an insurer because the insurance industry is nottransparent to outsiders. This makes it difficult for investors to monitor thedecision making of insurers. As a result, investors demand a higher return ontheir capital.
Reputation, transparency, and incentive structures are critical factors forreducing agency costs. Reputation is a particularly important factor for agencycosts. A long record of doing the right thing with investors’ money makesinvestors more comfortable with the potential future decisions of the com-pany. A good reputation with investors is a valuable asset for an insurer andcan form a significant part of a company’s franchise value. However, reputa-tion needs to be constantly reinforced because of the relative opaqueness ofinsurance companies. Once shareholders lose confidence in management, itis extremely difficult to restore.
33 Swiss Re: The economics of insurance
68672pb Eco-Insurance 14.06.2002 14:16 Uhr Seite 33

Transparency is improved by better and more timely, rather than more volumi-nous, reporting. There are limits to the amount of information that investors canefficiently process and producing this information is costly. Moreover, clientconfidentiality and competitor pressures limit the type of information that canbe disclosed. As far as the relevance of the information disclosed is concerned,accounting profit and loss statements are notoriously bad indicators of valuecreation for insurance companies, as investors are well aware. Insurers have along history of using numerous accounting mechanisms to smooth profits. Thismay be advantageous in the short-term, but in the long run makes investorsdistrustful and is likely to be counterproductive. As a result, many companiesare now reporting their internal measures of value creation to shareholders inan effort to improve transparency.
Agency costs can be further reduced if these internal measures are linked toincentive compensation: this obviously assumes that the measures are validand accepted by shareholders. This better aligns the interests of managerswith the interests of shareholders.
The scale of a company also impacts the transparency it can achieve becauselarge companies are more likely to get press coverage and be followed byfinancial analysts. Financial analysts spend a great deal of time sortingthrough accounting statements trying to get a better picture of shareholdervalue creation that they then pass on to shareholders.
Lastly, the life cycle of the company is an important determinant of agencycosts. Young companies have typically not had a chance to establish a reputa-tion. Because they are generally small, it is also harder for them to get theirmessage across and so transparency suffers. This creates a considerablebarrier to entry in the insurance market.
Regulatory capital costsRegulators impose restrictions on the level of capital held to support insurancebusiness. These restrictions result in potential liquidity costs because this capi-tal is not readily available to support other lines of business.
The primary driver of this cost is the regulatory environment the business iswritten in. To a limited extent, insurers can exercise control over this cost byefficient risk transfer.
5.2 Risk and capital management: main issuesThe process of risk and capital management can be broken down into threebasic decisions:
How much capital to hold? How much capital does the company need to operateefficiently? What can be done to manage regulatory and rating agency require-ments? How can the company be steered to improve diversification? Can the com-pany operate more efficiently by transferring risk to financial or reinsurance markets?
What type of capital? Is equity the only option? How to invest capital? Shouldthe company mismatch assets and liabilities? How much market risk should it take?
34 Swiss Re: The economics of insurance
68672pb Eco-Insurance 14.06.2002 14:16 Uhr Seite 34

35 Swiss Re: The economics of insurance
All these decisions are critical factors in determining the cost of taking risk, andcompanies that properly manage them will have a competitive advantage.However, making the right management decisions is not always easy, since itgenerally involves multiple trade-offs. For example, investing in equities ratherthan bonds can lower the tax burden on investment income, but can alsoincrease the amount of capital the company needs to hold. Or, all else remain-ing equal, holding more capital reduces the cost of financial distress butincreases double taxation costs. Having a framework for measuring the impactof risk and capital management decisions on the cost of taking risk is thereforean invaluable decision-making tool.
An integrated approach to risk and capital managementMost risk and capital management decisions must also be made centrally. The cost of taking risk depends on the risk and capital structure of the entirefirm, not on single operating units or lines of business. Allowing business units to make unilateral decisions on issues, such as reinsurance programs or capitalisation, can result in one business unit offsetting the decisions of otherbusiness units. This will result in higher overall costs.
As a result, the traditional separation of risk and capital management decisionsinto virtually isolated treasury, risk management, and investment managementfunctions is likely to result in inefficient risk and capital management.
5.3 Amount of capital requiredFrom an economic perspective, the right amount of capital is determined bybalancing benefits against costs. Although holding as little capital as possiblewill certainly lower double tax, agency costs, and increase the value of theoption to default on existing liabilities, it will also keep away profitable clients,who are credit-sensitive, and puts the franchise value of the firm at risk.Conversely, holding too much capital will increase frictional capital costs to a point where, in spite of the increased financial strength, policyholders will not be willing to pay the higher premiums needed to cover them. Theseconsiderations need to be carefully weighed up to determine the optimalamount of capital that maximises company value.
As shown in the graph below, this depends critically on the size of the insurer’sfranchise value. If an insurer has little franchise value, then it can extract valuefor shareholders by minimising the amount of capital held. This increases thevalue of the shareholders’ option to default on the existing insurance liabilities.However, this relationship is well understood by regulators who generally pre-vent this strategy from being pursued.
In the more normal situation where an insurer has a substantial franchise value,the level at which policyholders are prepared to pay the highest margins largelydetermines the optimal level of capital. This is a complex decision and requires athorough understanding of the preferences of the target client market. This deci-sion is frequently driven by rating agency requirements, which creates the needto efficiently manage the level of capital required to secure a particular rating.
68672pb Eco-Insurance 14.06.2002 14:16 Uhr Seite 35
Other important considerations in determining the optimal level of capital havealready been discussed: they include the value of the default option and thelevel of frictional capital costs. Holding more capital reduces financial distresscosts and decreases the value of the default option, but increases double taxcosts, and agency costs. In principle, a model of all these costs should beconstructed to determine the optimal level of capital.
36 Swiss Re: The economics of insurance
Optimalcapitalization
Fran
chis
e va
lue
Capital
Capital coststoo high
Franchise valueat risk
Put option
Insurers have two tools at their disposal for managing their overall level of riskand consequently the amount of capital they need to hold: diversification andrisk transfer.
DiversificationBy pooling independent risks, insurers can reduce the riskiness of their balancesheet. Effectively managing diversification, however, can be a challenge.
When market units price and write business, they need to know ahead of timehow the risk they are underwriting diversifies with the other risks on thecompany’s books. Risks that diversify well are less costly for the company tounderwrite than risks that do not. If risks were written one at a time, thiswould not be difficult to measure. However, market units within an insurer allwrite business simultaneously, so that a capital and capacity planning cycle isnecessary.
At the beginning of this cycle, risk and capital managers, together with marketunits, must decide how much of a particular risk will be underwritten in thecourse of the planning cycle. A capital plan must also be developed to supportthose risks, whether the risks will be kept on the books of the insurer andbacked with capital or transferred via financial or reinsurance markets. Basedupon this plan, the expected cost of taking various risks may be determinedand these costs may be included in actuarial pricing.
68672pb Eco-Insurance 14.06.2002 14:16 Uhr Seite 36

37 Swiss Re: The economics of insurance
Insurers will inevitably deviate from the plan as market conditions change,which will impact the cost of taking risk. For performance measurement pur-poses, it is not appropriate to change the level of frictional costs for marketunits if they have no control over these deviations. However, when a marketunit deviates from the plan – eg by writing more, or less, business thanexpected – that market unit should bear the full costs of the deviation.
The time horizon of the capital and capacity planning process should be longenough to allow market units to implement a business plan, and short enoughto keep the company sufficiently flexible to react to changing market condi-tions and opportunities.
Risk transferRisk transfer can be used effectively as a capital substitute whenever the costof transferring risk is lower than the cost of keeping that risk on the company’sbooks. Risk can be transferred either to financial markets or to reinsurancemarkets.
Risks can be transferred to financial markets by hedging or securitization,depending on the type of risk. Systematic risk embedded in insurance liabili-ties, for example interest rate risk, can be hedged by taking offsetting posi-tions on the asset side of the balance sheet. In many cases, the offsettingposition is a simple long position. For more complex risks, however, the offset-ting position may involve derivatives, for instance in the case of life contractswith a guaranteed minimum return. Insurers have the option of purchasingthose derivatives from derivative houses or else constructing those derivativesthemselves through the use of dynamic hedging. The choice should be basedupon both transaction costs and on whether the company wishes to avoidpotential dynamic hedging risk.
Securitization can also be used to transfer insurance risks to financial markets.The value proposition for securitization is clear. Due to their immense size,financial markets have enormous potential for diversifying risk, which enablesthem to hold that risk without incurring the potential costs associated withfinancial distress. Packaging insurance risks together with capital to supportthe risk into a security and then floating that security on financial markets alsogets that capital out of the double-tax insurance environment.
Agency costs, however, pose a formidable barrier to the realisation of securiti-zation’s potential. Insurers will always know their portfolio of risks better thanoutside investors, especially those not familiar with insurance risks. Conse-quently, there is always the adverse selection risk that insurers will try totransfer only unfavourable risks, keeping favourable risks on their books. Thesizeable risk premiums that the market currently demands for insurancesecuritizations clearly demonstrates that investors are not yet comfortableinvesting in and managing insurance risks directly. Apparently, they prefer totake those risks indirectly by holding shares in insurance companies, therebyallowing insurers to manage insurance risks for them and avoiding moralhazard problems. Despite the clear advantages of securitization, this market
68672pb Eco-Insurance 14.06.2002 14:16 Uhr Seite 37

will not take off until a dedicated class of insurance-risk investment managersdevelops.
Insurers can also reduce their cost of taking risk through the use of reinsur-ance. The value proposition for reinsurance is well developed. Professionalreinsurers are specialised in obtaining a low cost of taking risk. They generallyare well diversified and have large capital bases, good access to capitalmarkets, and expertise in carrier management to minimise tax and regulatoryburdens.
Direct insurers can, of course, obtain all of those characteristics themselvesand some global insurers have already done so. The ability to transfer risk toreinsurers and leverage their low cost of taking risk, however, enables compa-nies to maintain a focus on geographic regions and lines of business wherethey create the most value, without putting themselves at a disadvantage interms of their cost of taking risk.
Risk transfer in reinsurance markets does involve costs, however. Transactioncosts are high and moral hazard and adverse selection problems reduce theefficiency of the reinsurance market. However, new reinsurance structures aretargeted at reducing moral hazard and adverse selection problems and allowinsurers to transfer only the risks that are most costly for them to keep. Betteruse of information technology is also reducing transactions costs and resultingin a more competitive market.
Signalling capitalSignalling capital refers to capital in excess of economic capital that insurersmust hold in order to satisfy external requirements, such as regulatory or ratingagency requirements.
Regulators and rating agencies must apply simple and universally applicablecapital requirements. In addition, they prefer to err on the conservative side.As a result, it is sometimes the case that regulators and rating agenciesrequire more capital than is economically justified. Insurers can manage theamount of signalling capital by choosing to transfer risks where externalrequirements are onerous. Reinsurance and accounting structures also existthat reshape risks into a more regulatory and rating agency-friendly form.
38 Swiss Re: The economics of insurance
68672pb Eco-Insurance 14.06.2002 14:16 Uhr Seite 38

39 Swiss Re: The economics of insurance
5.4 Type of capital requiredInsurers hold capital to increase their ability to pay their insurance liabilitieseven under adverse circumstances. Insurers have an increasing number ofchoices for how they finance that capital. All of these choices vary in terms ofboth the cost of holding that capital and the security they provide. As a result,the optimal capital structure will be a trade-off between the amount of capitalthe company must hold and the frictional costs of holding that capital.
EquityEquity is the safest form of capital since shareholders cannot demand dividendpayments, nor can they demand repayment of their capital. However, becauseof disadvantaged tax treatment, it is also the most expensive form of capital.Corporate profits, which accrue to share investors, are taxed whereas interestpayments, which accrue to bond investors, are treated as expenses and are taxdeductible.
DebtSenior debt finance cannot be used to support insurance risks since in the caseof default, senior debt is repaid first. Debt that is subordinated to insuranceliabilities could in theory be used to support risk taking. However, in practice, it is seldom used, for a number of reasons. To support risk taking, the subordi-nated debt must be longer in duration than insurance liabilities. In practicalterms, this means that subordinated debt must be continually recalled andnew, longer-duration debt issued. In general, regulators and rating agenciesalso do not treat this debt as risk-bearing capital.
Hybrid debt and equityNew classes of debt and equity have been developed in recent years. Thesenew forms of finance are collectively referred to as hybrid and they blur thetraditional line between equity and debt. In general, though, the objective ofthese new structures is to get the tax treatment of debt and the risk character-istics of equity.
There is a wide range of hybrid structures. Which structure an insurer useswill depend on the tax and regulatory environment. In general, though, thereare limits to how much hybrid debt or equity an insurer can use. Few of these structures are true perpetual sources of capital. They will eventually beredeemed, so they do not provide the same level of security as equity capital.
Contingent capitalInsurers also have the option of arranging for contingent capital – contractu-ally obligated investments that trigger under pre-defined conditions. Theadvantage of this sort of financing is that the capital is kept off balance sheetand so is not subject to taxation. By using contingent capital, however, theinsurer exposes itself to credit risk of the contingent capital provider. Regula-tors therefore often limit the amount of contingent capital an insurer may useto support risk taking.
68672pb Eco-Insurance 14.06.2002 14:16 Uhr Seite 39

5.5 Investing capitalThe third key issue of risk and capital management is concerned with deter-mining the optimal investment strategy.
Market riskDue to an historical focus on reporting accounting profits, insurers have ofteninvested in high-yield products. The value proposition for yield, however, isunclear since to get a higher yield, the insurer must normally take additionalrisk and will incur additional frictional costs as a result.
The market risk that an insurer takes is passed directly on to shareholders whocould have invested in these instruments directly. Insurers can therefore onlycreate value by taking market risk if investors prefer to have an insurer managethese investments for them despite the fact that they will be surrenderingcontrol of these investments which, in addition, will be held in a regulated andtaxed vehicle. As this is not likely to be the case, this suggests that insurersshould focus on their core competency of originating and managing insurancerisk by hedging market risk as far as possible. However, another considerationto be taken into account is that other frictional costs may create incentives forinsurers to take investment risks.
Tax on investment incomeIn many cases, the biggest capital cost an insurer incurs is the tax payment on capital income. However, there are many opportunities for an insurer tomanage this cost through the choice of investments and management style.
Tax codes can differ greatly from jurisdiction to jurisdiction. However, in mostcountries capital gains are taxed preferentially to investment income. Thenominal tax rate on capital gains is often lower. In some countries capitalgains are not taxed at all. Capital gains also carry the benefit of deferral sincethey are only taxed at realisation. By postponing the realisation of capitalgains, insurers can gain the time value of money on their deferred taxes.
The amount gained by deferral of capital gains depends on how long capitalgains are deferred and on the prevailing interest rate. The graph below showsthe effective tax rate on capital gains as a percentage of the nominal tax ratefor varying realisation rates and interest rates. If an insurer is very aggressiveabout postponing the realisation of gains, the tax rate can be reduced sub-stantially. For instance, if the insurer realises just 10% of unrealised gains eachyear – an average investment horizon of just under 10 years – the effectivetax rate drops to two thirds of the nominal tax rate. Reducing the realisationrate to 5% – average investment horizon of 15 years – cuts the effective taxrate to about half the nominal tax rate.
40 Swiss Re: The economics of insurance
68672pb Eco-Insurance 14.06.2002 14:16 Uhr Seite 40

41 Swiss Re: The economics of insurance
Favourable tax treatment of capital gains does create an incentive for insurersto invest in equities. However, investing in equities generally means takingmore market risk and this creates additional frictional capital costs which willoffset some, if not all, of the gains from lower tax rates.
LiquidityAnother frictional consideration in determining an insurer’s optimal investmentstrategy is liquidity. Insurance is a cash-rich industry. The cash flow in frompremiums and investment income is often significantly greater than the cashflow out from claims and expenses. In addition, insurers usually keep largeamounts of liquid assets on their balance sheet. As a result, many insurershave more liquidity than they need to support their business.
Insurers can extract value from this excess liquidity by investing in illiquidinvestments, such as corporate bonds, private equity, and restricted publicequity. These assets return a higher yield to compensate investors for theirilliquidity.
It is important to note that though nobody denies the existence of a liquiditypremium in asset returns, opinions vary widely as to its order of magnitude.The difficulty in establishing the size of the liquidity premium is mainly due to the fact that illiquid instruments usually also carry other risk, such as creditrisk, making it difficult to objectively attribute the spread over governmentbonds to any particular factor.
The additional market risk contained in illiquid investments also needs to be covered by risk capital. The fact that it is impossible to capture the liquiditypremium without incurring other risk means that the premium needs to beweighed against the frictional costs implied by the additional risk taken.
4%
Capital gains realization rate(% of total unrealized gains)
100% 80% 60% 40% 20% 0%
100%
80%
60%
40%
20%
0%
Effe
ctiv
e ta
x ra
te(%
of n
omin
al r
ate)
5%
6%
Interest rate
68672pb Eco-Insurance 14.06.2002 14:16 Uhr Seite 41

Mean variance optimisationIt is also important to manage the diversification of investments in such a waythat the investment risk taken by the company is efficient in the sense that, fora given level of market risk, the chosen portfolio yields the highest expectedreturn. Otherwise, the company will be taking unnecessary investment risk.This efficient portfolio can be identified using a Markowitz mean variance typeapproach. It is important, though, that this analysis is done net of liabilitiesand net of taxes.
In general, because of regulatory and rating agency restrictions, it will not bepossible to be on the “efficient frontier”, so companies must strive for the bestpossible portfolio.
42 Swiss Re: The economics of insurance
68672pb Eco-Insurance 14.06.2002 14:16 Uhr Seite 42

43 Swiss Re: The economics of insurance
References
Amihud, Y. and H. Mendelson, 1991, Liquidity, asset prices and finan-cial policy. Financial Analysts Journal, November/December: 56–66.
Andrade, G., and S.N. Kaplan, 1998, How costly is financial (not eco-nomic) distress? Evidence from highly leveraged transactions thatbecame distressed, Journal of Finance, 53: 1443–1493.
Babbel, D.F., and K.B. Staking, 1989, The market reward for insurersthat practice asset/liability management, Financial Institutions Research,Goldman Sachs.
Babbel, D.F., and C. Merrill, 1998, Economic valuation models forinsurers, North American Actuarial Journal, 2(3): 1–15.
Babbel, D.F., 1999, Components of insurance firm value, and the pres-ent value of liabilities, in: Babbel, D.F., and F.J. Fabozzi, Investmentmanagement for insurers, (New Hope, PA: Frank. J. Fabozzi Associates):51–60.
Babbel, D.F., R. Stricker, and I. T. Vanderhoof, 1999, A performancemeasurement system for insurers, in: Babbel, D.F., and F.J. Fabozzi,Investment management for insurers, (New Hope, PA: Frank. J. FabozziAssociates): 61-76.
Babbel, D.F., and C. Merrill, 1999, Toward a unified valuation model forinsurers, in: Changes in the life insurance industry: efficiency, technologyand risk management, (Norwell, MA: Kluwer)
Babbel, D.F. and C. Merill, 2002, Fair value of liabilities. The financialeconomics perspective, North American Actuarial Journal, forthcoming
Chew, D.H., ed., 1999, The new corporate finance: where theory meetspractice, Second Edition (Boston: Irwin McGraw-Hill)
Derrig, R.A., and K. Ostaszewski, 1997, Managing the tax liability of aproperty-liability insurance company, The Journal of Risk and Insurance,64(4): 673–694.
Froot, K.A., and J.C. Stein, 1998, Risk management, capital budgetingand capital structure policy for financial institutions: an integratedapproach, Journal of Financial Economics, 47: 55–82.
Froot, K.A., 1999, The financing of catastrophe risk, (Chicago: TheUniversity of Chicago Press).
Harrington, S. and G. Niehaus, Risk Management and Insurance, 1999,Boston: McGraw-Hill
Harrington, S., and G. Niehaus, 1999, On the tax cost of equity finance:the strange case of catastrophe insurance, Working Paper, Darla MooreSchool of Business, University of South Carolina.
IASC, 1999, An issues paper issued for comment by the steeringcommittee on insurance (London: International Accounting StandardsCommittee)
Jensen, M.C., 1986, Agency costs of free cash flow, corporate finance,and takeovers, American Economic Review, 76: 323–329.
Merton, R.C., 1993, Operations and regulation in financial intermedia-tion: a functional perspective, in Englund, P., ed., Operation and regula-tion of financial markets (Stockholm: The Economic Council): 17–67.
Merton, R.C., and A.F. Perold, 1999, Theory of risk capital in financialfirms, in: Chew, D.H. ed., The new corporate finance: where theory meetspractice, Second Edition. (Boston: Irwin McGraw-Hill): 505–521.
Miller, M.H., 1999, The Modigliani-Miller propositions after thirty years,in Chew, D.H., ed., The new corporate finance: where theory meetspractice, Second Edition (Boston: Irwin McGraw-Hill)
Perold, A.F., 1998, Capital allocation in financial firms. Working Paper98-072, Harvard Business School.
Pratt, S.P., 1998, Cost of capital: estimation and applications, (NewYork: John Wiley & Sons)
Senbet, L.W., and J.K. Seward, 1995, Financial distress, bankruptcyand reorganisation, in Jarrow, R et al. eds., Handbooks in OR & MS,Volume 9. Elsevier Science.
68672pb Eco-Insurance 14.06.2002 14:16 Uhr Seite 43

Swiss Re publishingSwiss Re’s Technical Publishing seriescomprises the subcategories of Property,Casualty, Engineering and Industry, Avia-tion and Marine, and General. The Generalcategory includes a wide range of rein-surance-related topics, for example:
The economics of insurance: How insurerscreate value for shareholders (2001);Late claims reserves in reinsurance (2001);Non-proportional reinsurance accounting(2000);The run-off phenomenon (1998);An introduction to reinsurance (1996)
To order or download any additionalpublications, please refer to the contactson the back cover of this brochure.
© 2001Swiss Reinsurance Company, Zurich
Title: The economics of insuranceHow insurers create value for shareholders(2nd edition)
Authors: John Hancock, Paul Huber, Pablo Koch
Graphic design:Galizinski Gestaltung, Zurich
Editing and production:UC, Technical Communications,Chief Underwriting Office
Photograph:Cover: Image Bank, Zurich
Order no.: 207_01310_en
Property & Casualty, 4/02, 2000 en
John HancockGroup Risk ManagementJohn is Deputy Head of the QuantitativeRisk Management Methods group withinSwiss Re’s Group Risk Managementunit. Prior to joining Swiss Re in 1998,John worked for the World Bank andRFA, a consultant to the banking indus-try on credit risk management issues.John holds Ph.D. and BA degrees fromthe University of Pennsylvania, where he specialized in finance, and an MA ineconomics from Georgetown University.
Paul HuberFinancial ManagementPaul is a financial officer in Swiss Re’sFinancial Management and InvestorRelations unit. Specialising in Life &Health and valuation related topics, hehas been engaged in a number of stra-tegic projects, including acquisitions,pricing, securitization and strategicasset allocation. Prior to joining SwissRe in 1998, Paul worked for the fundmanager Gartmore and for the lifeassurer Old Mutual. He holds a Ph.D. in actuarial science from the City Uni-versity in London and a B.Sc. from theUniversity of the Witwatersrand, SouthAfrica. He is a Fellow of the Institute of Actuaries.
Pablo KochGroup Risk ManagementPablo is Head of Quantitative RiskManagement Methods with Swiss Re’sGroup Risk Management unit. Beforejoining Swiss Re in 2000, he worked forJ.P. Morgan in Zurich and held severalrisk management related positionswithin the Winterthur Insurance Group.Pablo holds a Ph.D. in Mathematics fromthe University of Zurich. Previously, hehas published on mathematical, optiontheoretical and insurance topics.
68672pb Eco-Insurance 14.06.2002 14:16 Uhr Seite 44