pt delta dunia makmur tbk. · secured leasing facility for new equipment longer & robust...
TRANSCRIPT
PT Delta Dunia Makmur Tbk.
FY 2016 Results
March 2017
General overview
2
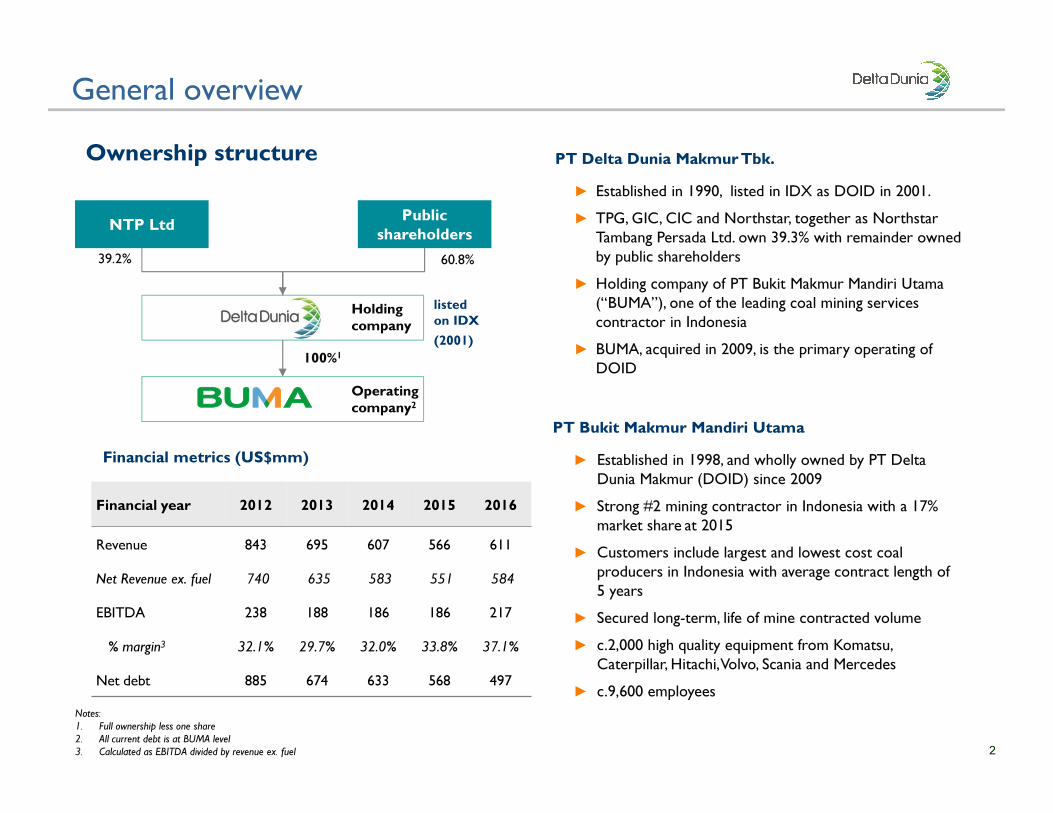
Ownership structureOwnership structure
listed
on IDX
(2001)
100%1
NTP Ltd
60.8%
Public
shareholders
Holding
company
Operating
company2
39.2%
PT Bukit Makmur Mandiri UtamaPT Bukit Makmur Mandiri Utama
► Established in 1998, and wholly owned by PT Delta
Dunia Makmur (DOID) since 2009
► Strong #2 mining contractor in Indonesia with a 17%
market share at 2015
► Customers include largest and lowest cost coal
producers in Indonesia with average contract length of
5 years
► Secured long-term, life of mine contracted volume
► c.2,000 high quality equipment from Komatsu,
Caterpillar, Hitachi, Volvo, Scania and Mercedes
► c.9,600 employees
PT Delta Dunia Makmur Tbk.PT Delta Dunia Makmur Tbk.
► Established in 1990, listed in IDX as DOID in 2001.
► TPG, GIC, CIC and Northstar, together as Northstar
Tambang Persada Ltd. own 39.3% with remainder owned
by public shareholders
► Holding company of PT Bukit Makmur Mandiri Utama
(“BUMA”), one of the leading coal mining services
contractor in Indonesia
► BUMA, acquired in 2009, is the primary operating of
DOID
Financial metrics (US$mm) Financial metrics (US$mm)
Financial year 2012 2013 2014 2015 2016
Revenue 843 695 607 566 611
Net Revenue ex. fuel 740 635 583 551 584
EBITDA 238 188 186 186 217
% margin3 32.1% 29.7% 32.0% 33.8% 37.1%
Net debt 885 674 633 568 497
Notes:
1. Full ownership less one share
2. All current debt is at BUMA level
3. Calculated as EBITDA divided by revenue ex. fuel
3
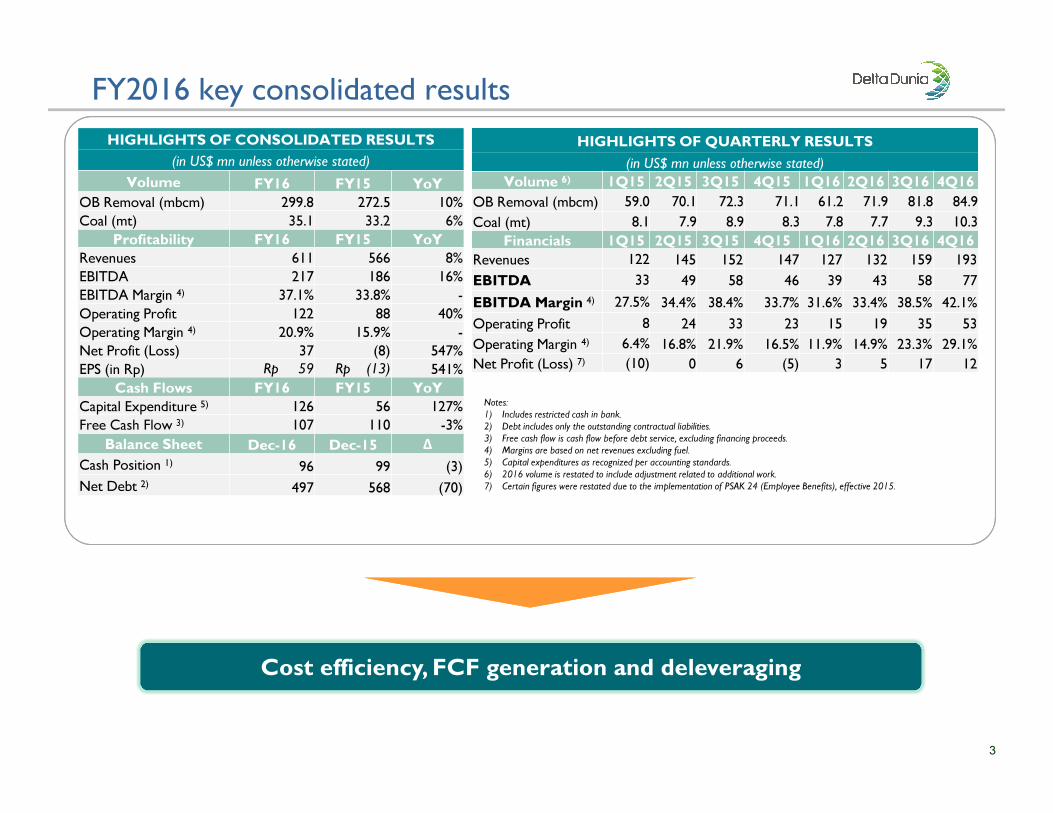
FY2016 key consolidated results
Notes:
1) Includes restricted cash in bank.
2) Debt includes only the outstanding contractual liabilities.
3) Free cash flow is cash flow before debt service, excluding financing proceeds.
4) Margins are based on net revenues excluding fuel.
5) Capital expenditures as recognized per accounting standards.
6) 2016 volume is restated to include adjustment related to additional work.
7) Certain figures were restated due to the implementation of PSAK 24 (Employee Benefits), effective 2015.
HIGHLIGHTS OF CONSOLIDATED RESULTS
(in US$ mn unless otherwise stated)
Volume FY16 FY15 YoY
OB Removal (mbcm) 299.8 272.5 10%
Coal (mt) 35.1 33.2 6%
Profitability FY16 FY15 YoY
Revenues 611 566 8%
EBITDA 217 186 16%
EBITDA Margin 4) 37.1% 33.8% -
Operating Profit 122 88 40%
Operating Margin 4) 20.9% 15.9% -
Net Profit (Loss) 37 (8) 547%
EPS (in Rp) Rp 59 Rp (13) 541%
Cash Flows FY16 FY15 YoY
Capital Expenditure 5) 126 56 127%
Free Cash Flow 3) 107 110 -3%
Balance Sheet Dec-16 Dec-15 ∆
Cash Position 1) 96 99 (3)
Net Debt 2) 497 568 (70)
HIGHLIGHTS OF QUARTERLY RESULTS
(in US$ mn unless otherwise stated)
Volume 6) 1Q15 2Q15 3Q15 4Q15 1Q16 2Q16 3Q16 4Q16
OB Removal (mbcm) 59.0 70.1 72.3 71.1 61.2 71.9 81.8 84.9
Coal (mt) 8.1 7.9 8.9 8.3 7.8 7.7 9.3 10.3
Financials 1Q15 2Q15 3Q15 4Q15 1Q16 2Q16 3Q16 4Q16
Revenues 122 145 152 147 127 132 159 193
EBITDA 33 49 58 46 39 43 58 77
EBITDA Margin 4) 27.5% 34.4% 38.4% 33.7% 31.6% 33.4% 38.5% 42.1%
Operating Profit 8 24 33 23 15 19 35 53
Operating Margin 4) 6.4% 16.8% 21.9% 16.5% 11.9% 14.9% 23.3% 29.1%
Net Profit (Loss) 7) (10) 0 6 (5) 3 5 17 12
Cost efficiency, FCF generation and deleveragingCost efficiency, FCF generation and deleveraging
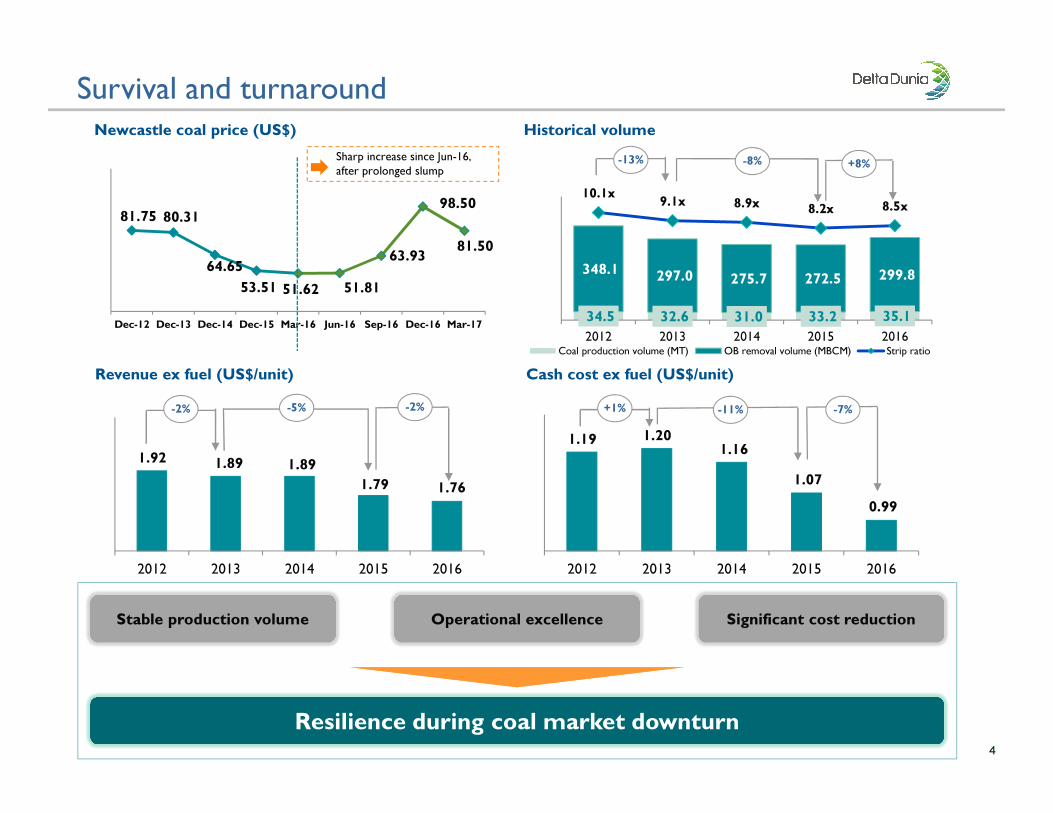
Survival and turnaround
4
Newcastle coal price (US$)Newcastle coal price (US$) Historical volumeHistorical volume
Revenue ex fuel (US$/unit) Revenue ex fuel (US$/unit) Cash cost ex fuel (US$/unit)Cash cost ex fuel (US$/unit)
81.75 80.31
64.65
53.51 51.62 51.81
63.93
98.50
81.50
Dec-12 Dec-13 Dec-14 Dec-15 Mar-16 Jun-16 Sep-16 Dec-16 Mar-1734.5 32.6 31.0 33.2 35.1
348.1 297.0 275.7 272.5 299.8
10.1x9.1x 8.9x 8.2x 8.5x
2012 2013 2014 2015 2016Coal production volume (MT) OB removal volume (MBCM) Strip ratio
1.92 1.89 1.89
1.79 1.76
2012 2013 2014 2015 2016
1.19 1.20 1.16
1.07
0.99
2012 2013 2014 2015 2016
Resilience during coal market downturnResilience during coal market downturn
Stable production volumeStable production volume Operational excellenceOperational excellence Significant cost reductionSignificant cost reduction
Sharp increase since Jun-16,
after prolonged slump
-11%+1%
-13% -8%
-5%-2%
+8%
-2% -7%
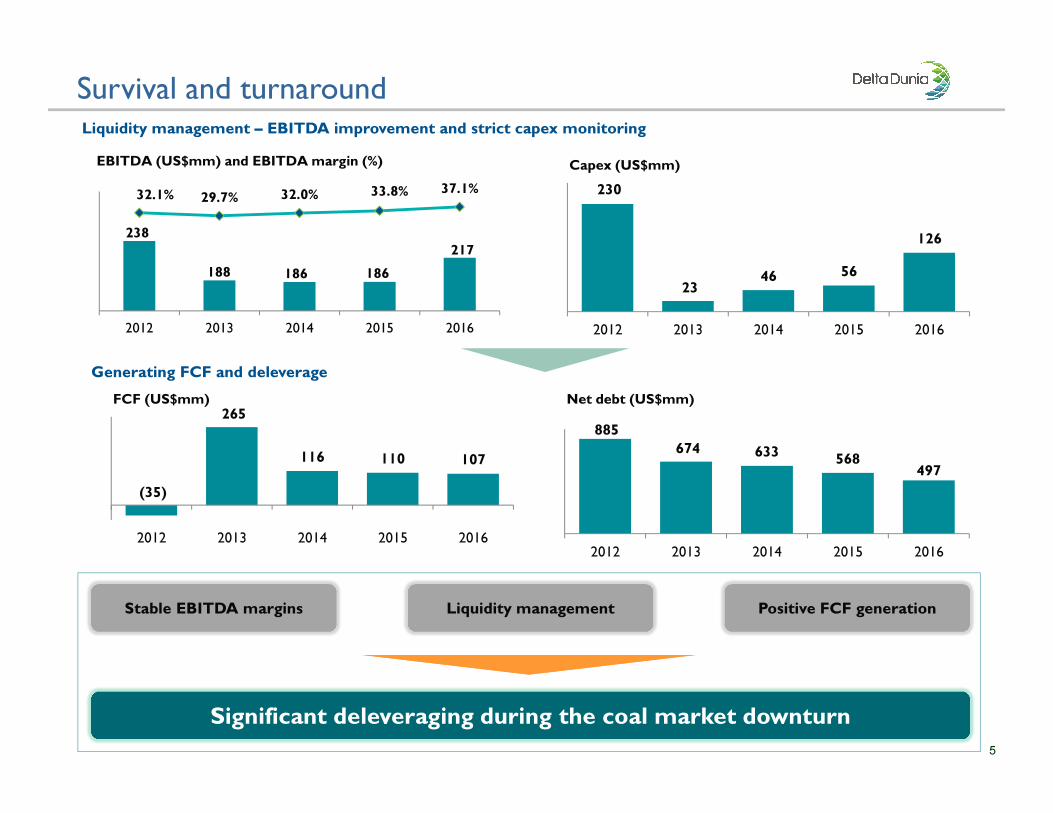
Survival and turnaround
5
885
674 633568
497
2012 2013 2014 2015 2016
Net debt (US$mm)
Liquidity management – EBITDA improvement and strict capex monitoringLiquidity management – EBITDA improvement and strict capex monitoring
(35)
265
116 110 107
2012 2013 2014 2015 2016
FCF (US$mm)
238
188 186 186
217
32.1% 29.7% 32.0% 33.8% 37.1%
-50.0%
-30.0%
-10.0%
10.0%
30.0%
50.0%
150
170
190
210
230
250
270
290
2012 2013 2014 2015 2016
EBITDA (US$mm) and EBITDA margin (%)
230
2346 56
126
2012 2013 2014 2015 2016
Capex (US$mm)
Generating FCF and deleverageGenerating FCF and deleverage
Significant deleveraging during the coal market downturnSignificant deleveraging during the coal market downturn
Stable EBITDA marginsStable EBITDA margins Liquidity managementLiquidity management Positive FCF generationPositive FCF generation
6
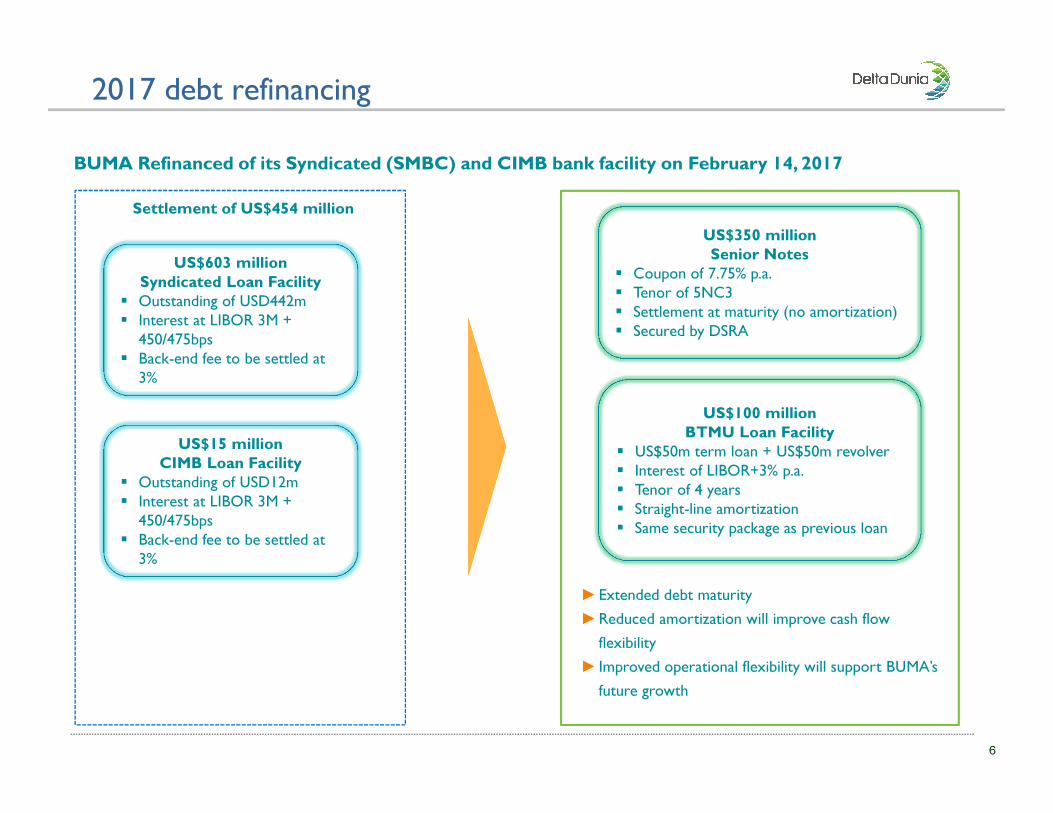
2017 debt refinancing
BUMA Refinanced of its Syndicated (SMBC) and CIMB bank facility on February 14, 2017
US$603 million
Syndicated Loan Facility
� Outstanding of USD442m
� Interest at LIBOR 3M +
450/475bps
� Back-end fee to be settled at
3%
US$15 million
CIMB Loan Facility
� Outstanding of USD12m
� Interest at LIBOR 3M +
450/475bps
� Back-end fee to be settled at
3%
Settlement of US$454 million
US$350 million
Senior Notes
� Coupon of 7.75% p.a.
� Tenor of 5NC3
� Settlement at maturity (no amortization)
� Secured by DSRA
US$100 million
BTMU Loan Facility
� US$50m term loan + US$50m revolver
� Interest of LIBOR+3% p.a.
� Tenor of 4 years
� Straight-line amortization
� Same security package as previous loan
►Extended debt maturity
►Reduced amortization will improve cash flow
flexibility
► Improved operational flexibility will support BUMA’s
future growth
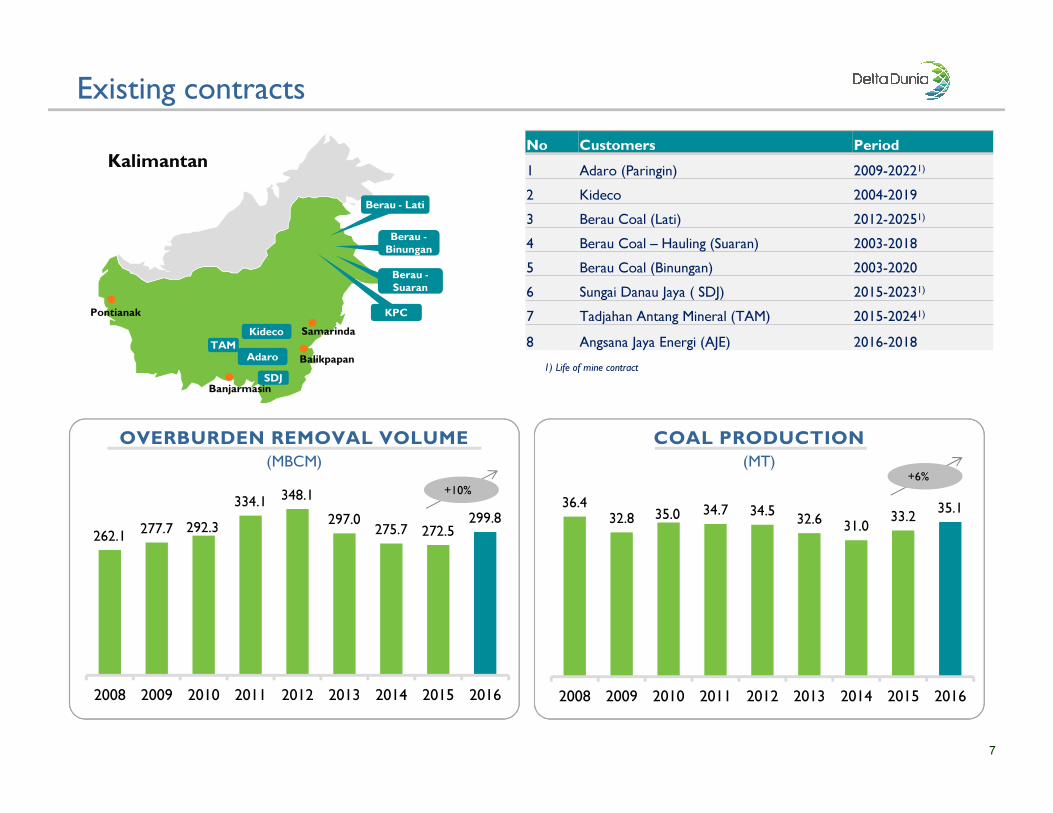
262.1277.7 292.3
334.1 348.1
297.0275.7 272.5
299.8
2008 2009 2010 2011 2012 2013 2014 2015 2016
+10%
Existing contracts
No Customers Period
1 Adaro (Paringin) 2009-20221)
2 Kideco 2004-2019
3 Berau Coal (Lati) 2012-20251)
4 Berau Coal – Hauling (Suaran) 2003-2018
5 Berau Coal (Binungan) 2003-2020
6 Sungai Danau Jaya ( SDJ) 2015-20231)
7 Tadjahan Antang Mineral (TAM) 2015-20241)
8 Angsana Jaya Energi (AJE) 2016-2018
Kalimantan
Kideco
Adaro
Berau - Lati
Berau -
Binungan
Berau -
Suaran
Balikpapan
KPC
Samarinda
Banjarmasin
Pontianak
7
OVERBURDEN REMOVAL VOLUME
(MBCM)
36.432.8 35.0 34.7 34.5
32.631.0
33.235.1
2008 2009 2010 2011 2012 2013 2014 2015 2016
COAL PRODUCTION
(MT)
TAM
SDJ1) Life of mine contract
+6%
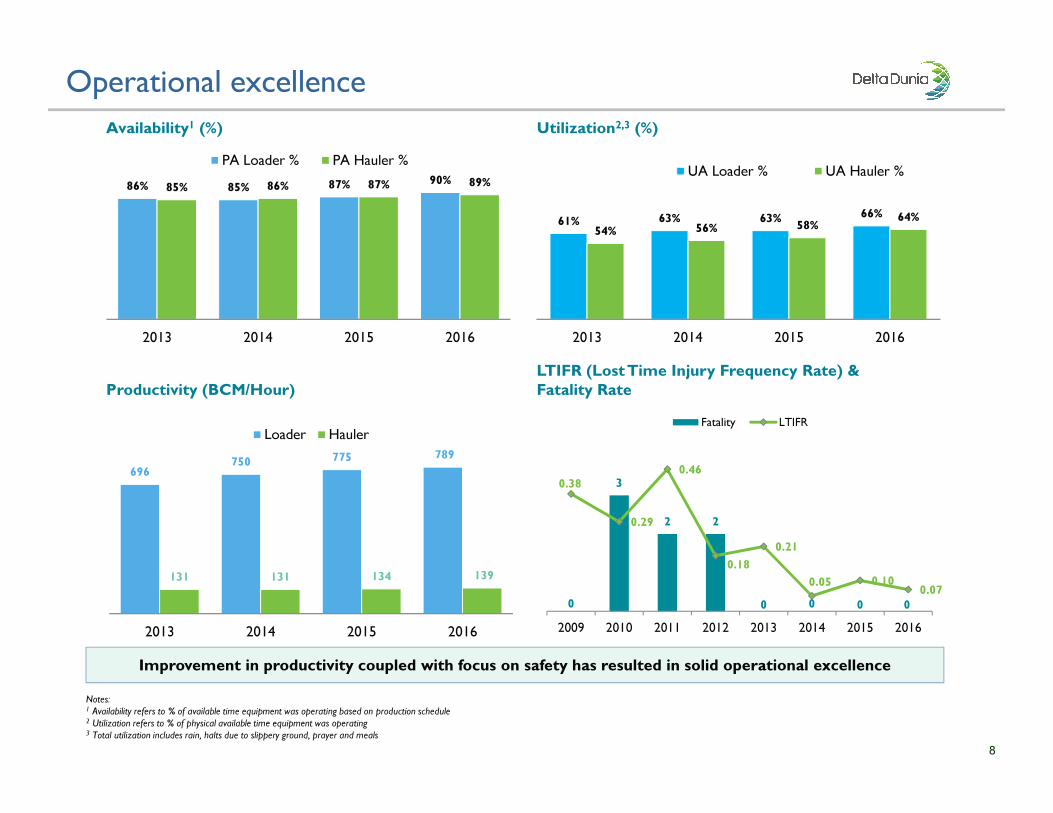
Operational excellence
8
Availability1 (%)Availability1 (%)
86% 85% 87% 90%85% 86% 87% 89%
2013 2014 2015 2016
PA Loader % PA Hauler %
Productivity (BCM/Hour)Productivity (BCM/Hour)
696 750 775 789
131 131 134 139
2013 2014 2015 2016
Loader Hauler
LTIFR (Lost Time Injury Frequency Rate) &
Fatality Rate
LTIFR (Lost Time Injury Frequency Rate) &
Fatality Rate
Utilization2,3 (%)Utilization2,3 (%)
61% 63% 63% 66%
54% 56% 58%64%
2013 2014 2015 2016
UA Loader % UA Hauler %
Improvement in productivity coupled with focus on safety has resulted in solid operational excellence
Notes:1 Availability refers to % of available time equipment was operating based on production schedule2 Utilization refers to % of physical available time equipment was operating3 Total utilization includes rain, halts due to slippery ground, prayer and meals
0
3
2 2
0 0 0 0
0.38
0.29
0.46
0.18
0.21
0.05 0.100.07
2009 2010 2011 2012 2013 2014 2015 2016
Fatality LTIFR
Sustainable low cost
9
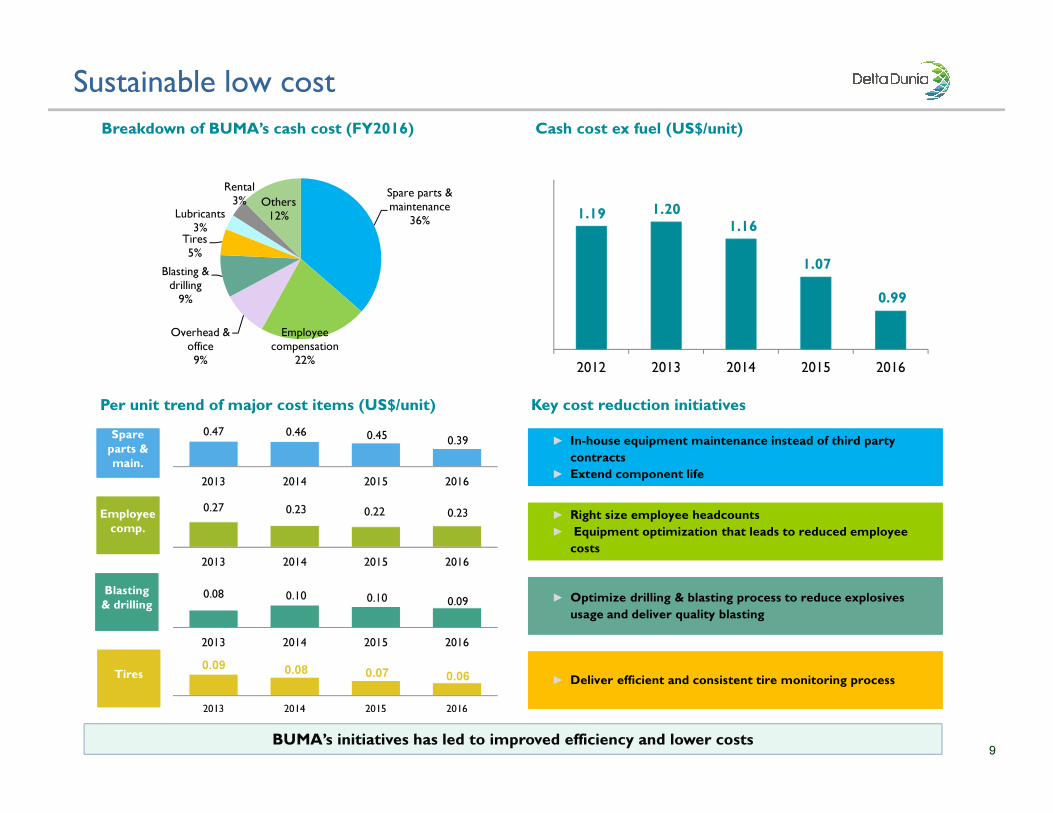
Breakdown of BUMA’s cash cost (FY2016)Breakdown of BUMA’s cash cost (FY2016)
Spare parts &
maintenance
36%
Employee
compensation
22%
Overhead &
office
9%
Blasting &
drilling
9%
Tires
5%
Lubricants
3%
Rental
3% Others
12%
0.08 0.10 0.10 0.09
2013 2014 2015 2016
Per unit trend of major cost items (US$/unit)Per unit trend of major cost items (US$/unit)
0.47 0.46 0.45 0.39
2013 2014 2015 2016
Spare
parts &
main.
Spare
parts &
main.
0.27 0.23 0.22 0.23
2013 2014 2015 2016
Employee
comp.
Employee
comp.
TiresTires
► In-house equipment maintenance instead of third party
contracts
► Extend component life
► In-house equipment maintenance instead of third party
contracts
► Extend component life
Key cost reduction initiativesKey cost reduction initiatives
► Deliver efficient and consistent tire monitoring process► Deliver efficient and consistent tire monitoring process
► Optimize drilling & blasting process to reduce explosives
usage and deliver quality blasting
► Optimize drilling & blasting process to reduce explosives
usage and deliver quality blasting
Blasting
& drilling
Blasting
& drilling
0.09 0.08 0.07 0.06
2013 2014 2015 2016
► Right size employee headcounts
► Equipment optimization that leads to reduced employee
costs
► Right size employee headcounts
► Equipment optimization that leads to reduced employee
costs
Cash cost ex fuel (US$/unit)Cash cost ex fuel (US$/unit)
1.19 1.20
1.16
1.07
0.99
2012 2013 2014 2015 2016
BUMA’s initiatives has led to improved efficiency and lower costs
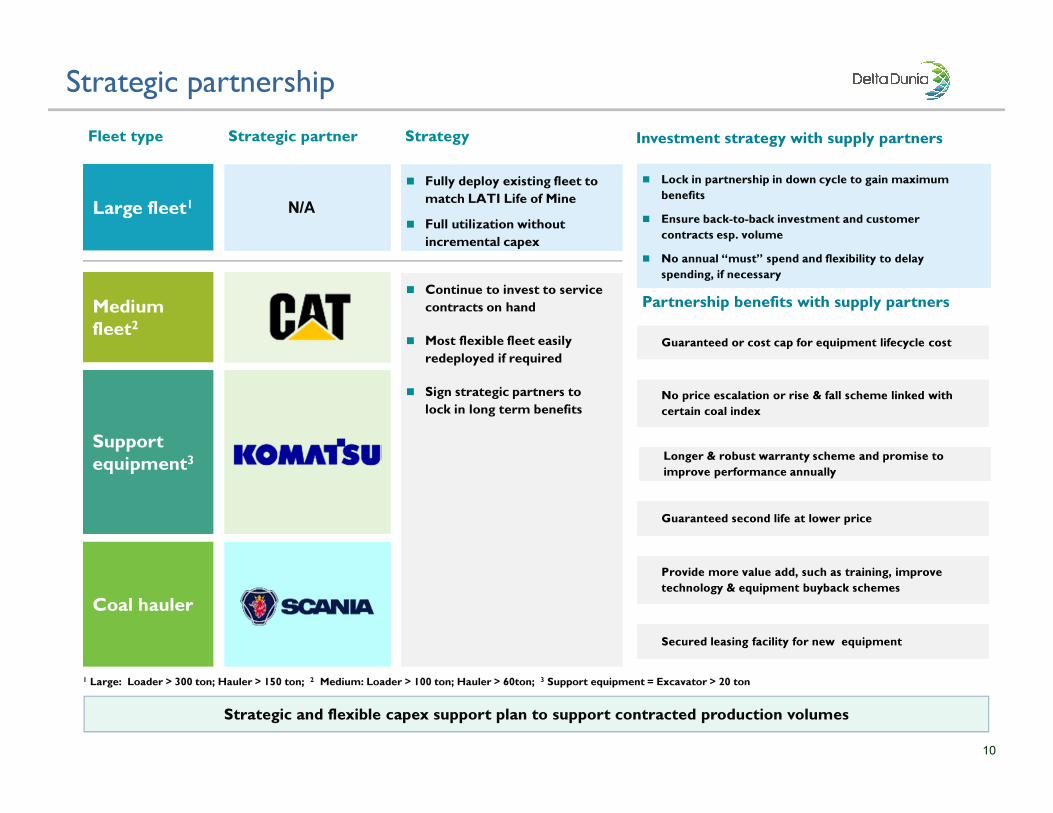
Strategic partnership
10
Medium
fleet2Medium
fleet2
Support
equipment3Support
equipment3
Large fleet1Large fleet1
Coal haulerCoal hauler
Strategic partnerStrategic partner StrategyStrategy
N/AN/A
� Fully deploy existing fleet to
match LATI Life of Mine
� Full utilization without
incremental capex
� Fully deploy existing fleet to
match LATI Life of Mine
� Full utilization without
incremental capex
� Continue to invest to service
contracts on hand
� Most flexible fleet easily
redeployed if required
� Sign strategic partners to
lock in long term benefits
� Continue to invest to service
contracts on hand
� Most flexible fleet easily
redeployed if required
� Sign strategic partners to
lock in long term benefits
Fleet typeFleet type
1 Large: Loader > 300 ton; Hauler > 150 ton; 2 Medium: Loader > 100 ton; Hauler > 60ton; 3 Support equipment = Excavator > 20 ton
No price escalation or rise & fall scheme linked with
certain coal index
No price escalation or rise & fall scheme linked with
certain coal index
Secured leasing facility for new equipmentSecured leasing facility for new equipment
Longer & robust warranty scheme and promise to
improve performance annually
Longer & robust warranty scheme and promise to
improve performance annually
Guaranteed second life at lower price Guaranteed second life at lower price
Provide more value add, such as training, improve
technology & equipment buyback schemes
Provide more value add, such as training, improve
technology & equipment buyback schemes
Guaranteed or cost cap for equipment lifecycle costGuaranteed or cost cap for equipment lifecycle cost
Partnership benefits with supply partnersPartnership benefits with supply partners
Investment strategy with supply partnersInvestment strategy with supply partners
� Lock in partnership in down cycle to gain maximum
benefits
� Ensure back-to-back investment and customer
contracts esp. volume
� No annual “must” spend and flexibility to delay
spending, if necessary
� Lock in partnership in down cycle to gain maximum
benefits
� Ensure back-to-back investment and customer
contracts esp. volume
� No annual “must” spend and flexibility to delay
spending, if necessary
Strategic and flexible capex support plan to support contracted production volumes
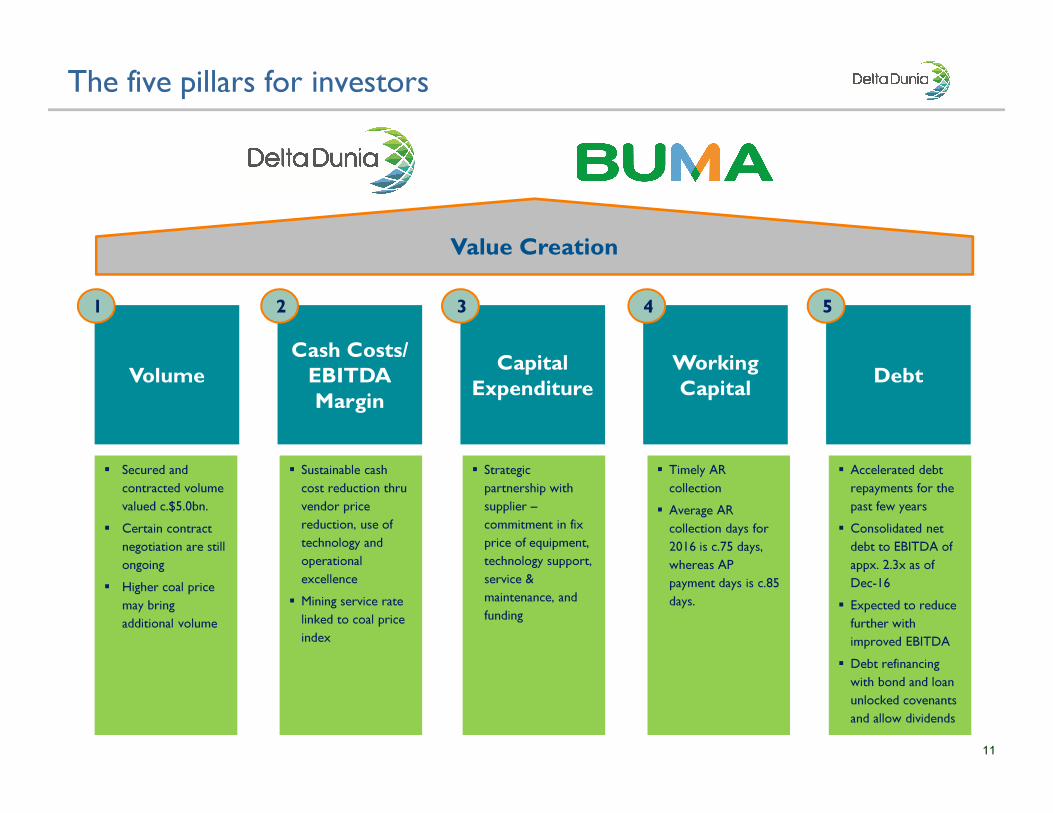
The five pillars for investors
11
Capital
Expenditure
� Secured and
contracted volume
valued c.$5.0bn.
� Certain contract
negotiation are still
ongoing
� Higher coal price
may bring
additional volume
Cash Costs/
EBITDA
Margin
VolumeWorking
CapitalDebt
� Sustainable cash
cost reduction thru
vendor price
reduction, use of
technology and
operational
excellence
� Mining service rate
linked to coal price
index
� Strategic
partnership with
supplier –
commitment in fix
price of equipment,
technology support,
service &
maintenance, and
funding
� Timely AR
collection
� Average AR
collection days for
2016 is c.75 days,
whereas AP
payment days is c.85
days.
� Accelerated debt
repayments for the
past few years
� Consolidated net
debt to EBITDA of
appx. 2.3x as of
Dec-16
� Expected to reduce
further with
improved EBITDA
� Debt refinancing
with bond and loan
unlocked covenants
and allow dividends
1 2 3 4 5
Value Creation
End of Presentation - Thank You
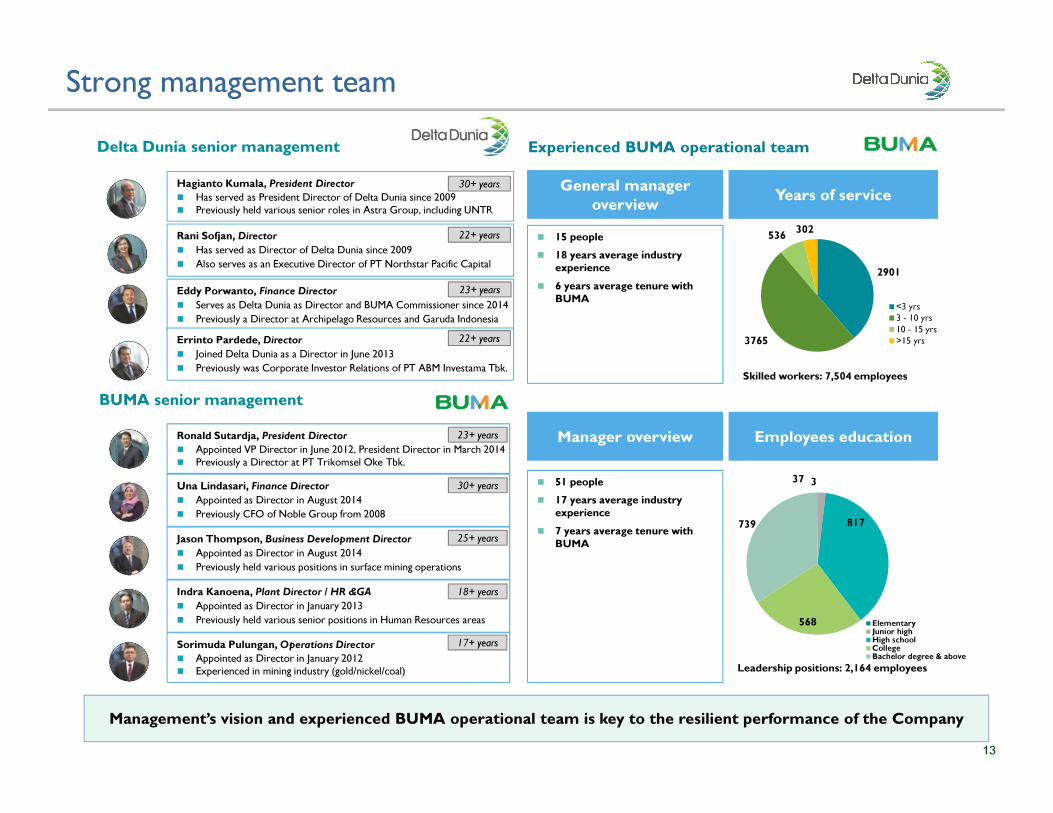
2901
3765
536302
<3 yrs
3 - 10 yrs
10 - 15 yrs
>15 yrs
Strong management team
13
337
817
568
739
ElementaryJunior highHigh schoolCollegeBachelor degree & above
Delta Dunia senior managementDelta Dunia senior management
BUMA senior managementBUMA senior management
Ronald Sutardja, President Director
� Appointed VP Director in June 2012, President Director in March 2014
� Previously a Director at PT Trikomsel Oke Tbk.
Experienced BUMA operational teamExperienced BUMA operational team
� 51 people
� 17 years average industry
experience
� 7 years average tenure with
BUMA
Manager overview
� 15 people
� 18 years average industry
experience
� 6 years average tenure with
BUMA
General manager
overview
Hagianto Kumala, President Director
� Has served as President Director of Delta Dunia since 2009
� Previously held various senior roles in Astra Group, including UNTR
Years of service
Leadership positions: 2,164 employees
Skilled workers: 7,504 employees
Employees education
Rani Sofjan, Director
� Has served as Director of Delta Dunia since 2009
� Also serves as an Executive Director of PT Northstar Pacific Capital
Eddy Porwanto, Finance Director
� Serves as Delta Dunia as Director and BUMA Commissioner since 2014
� Previously a Director at Archipelago Resources and Garuda Indonesia
Errinto Pardede, Director
� Joined Delta Dunia as a Director in June 2013
� Previously was Corporate Investor Relations of PT ABM Investama Tbk.
Una Lindasari, Finance Director
� Appointed as Director in August 2014
� Previously CFO of Noble Group from 2008
Jason Thompson, Business Development Director
� Appointed as Director in August 2014
� Previously held various positions in surface mining operations
Indra Kanoena, Plant Director / HR &GA
� Appointed as Director in January 2013
� Previously held various senior positions in Human Resources areas
Sorimuda Pulungan, Operations Director
� Appointed as Director in January 2012
� Experienced in mining industry (gold/nickel/coal)
Management’s vision and experienced BUMA operational team is key to the resilient performance of the Company
30+ years
22+ years
22+ years
23+ years
23+ years
30+ years
25+ years
18+ years
17+ years
Historical overview
14
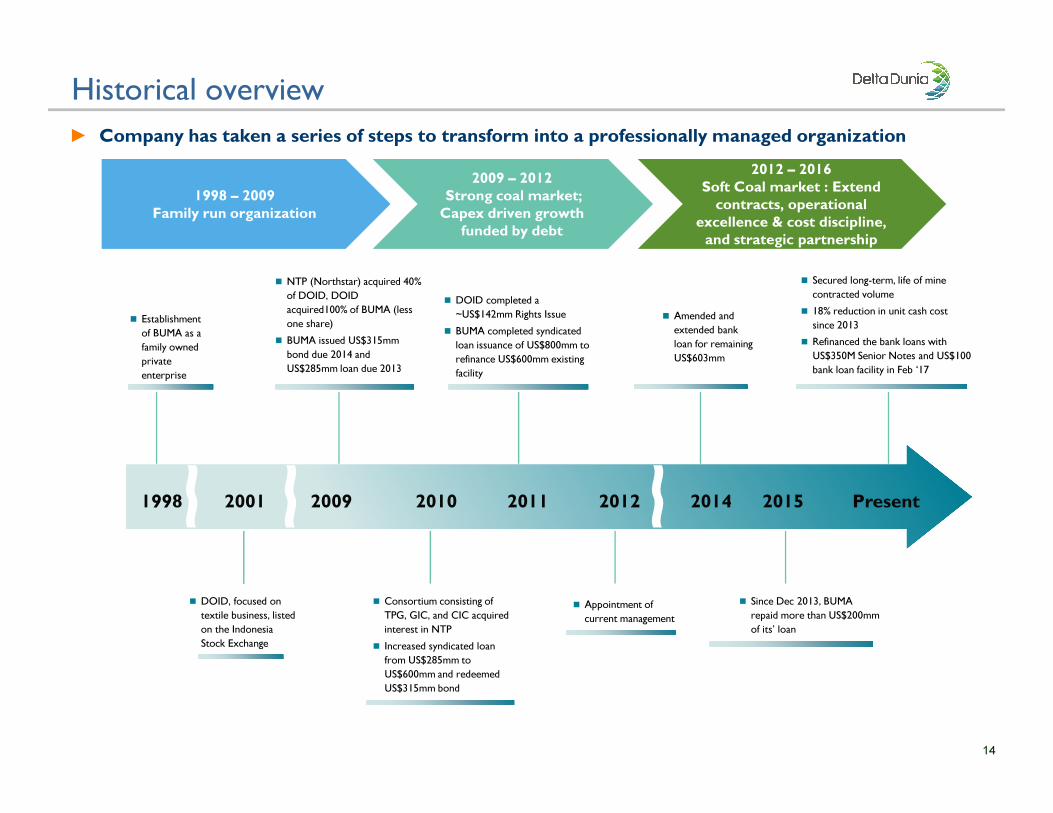
► Company has taken a series of steps to transform into a professionally managed organization
1998 – 2009
Family run organization
2009 – 2012
Strong coal market;
Capex driven growth
funded by debt
2012 – 2016
Soft Coal market : Extend
contracts, operational
excellence & cost discipline,
and strategic partnership
� DOID, focused on
textile business, listed
on the Indonesia
Stock Exchange
� NTP (Northstar) acquired 40%
of DOID, DOID
acquired100% of BUMA (less
one share)
� BUMA issued US$315mm
bond due 2014 and
US$285mm loan due 2013
� Consortium consisting of
TPG, GIC, and CIC acquired
interest in NTP
� Increased syndicated loan
from US$285mm to
US$600mm and redeemed
US$315mm bond
� DOID completed a
~US$142mm Rights Issue
� BUMA completed syndicated
loan issuance of US$800mm to
refinance US$600mm existing
facility
� Appointment of
current management
� Amended and
extended bank
loan for remaining
US$603mm
� Since Dec 2013, BUMA
repaid more than US$200mm
of its’ loan
� Secured long-term, life of mine
contracted volume
� 18% reduction in unit cash cost
since 2013
� Refinanced the bank loans with
US$350M Senior Notes and US$100
bank loan facility in Feb ‘17
201520122011201020092001 2014 Present1998
� Establishment
of BUMA as a
family owned
private
enterprise
15
Latest developmentN
ine-m
on
th U
pd
ate
New Contracts
► Several new contracts were signed in November and December 2016:
o PT Tadjahan Antang Mineral (“TAM”)
� Life of mine contract (to August 2025), an extension of existing contract, previously signed in August 2015.
� Valued at approximately IDR 3.8 trillion (~US$288 million) with total production target of approximately 147 million bcm of overburden
removal and 28 million tonnes of coal.
o PT Berau Coal (“Berau”)
� Two contract amendments for Lati and Binungan projects, which were initially signed in 2014.
� Valued at approximately Rp39 trillion (~US$3 billion) for a total production target of approximately 1,660 million bcm of overburden removal
and 145 million tonnes of coal . These contracts were initially signed in 2014.
o PT UPC Sidrap Bayu Energy
� An Infrastructure Contract with PT UPC Sidrap Bayu Energy, which is the first power plant infrastructure project for BUMA, revolving
around earthmoving operations.
� Valued at approximately Rp57 billion (~US$4 million)
o PT Adaro Indonesia
� An amendment to extend the existing contract to life-of-mine (2022) for the Paringin Pit
� Valued at approximately Rp5.7 trillion (~US$428 million)
o PT Angsana Jaya Energy
� A contract with new customer, who is a subsidiary of Geo Energy (SGX-listed)
� Value at approximately Rp862 billion (~US$66 million)
Debt repayments
► BUMA was further deleveraged after US$159 million debt repayment throughout 2016, with US$103 million being voluntary prepayments toward its
bank loan facilities. Despite incurring new finance leases of US$86 million to support capital expenditure needs, outstanding debt was reduced by a net
of US$73 million, resulting in net debt position of US$497 million and net debt to EBITDA ratio of 2.3x.
► In February 2017, the two bank facilities were refinanced (see next slide).
Indonesian coal market
16
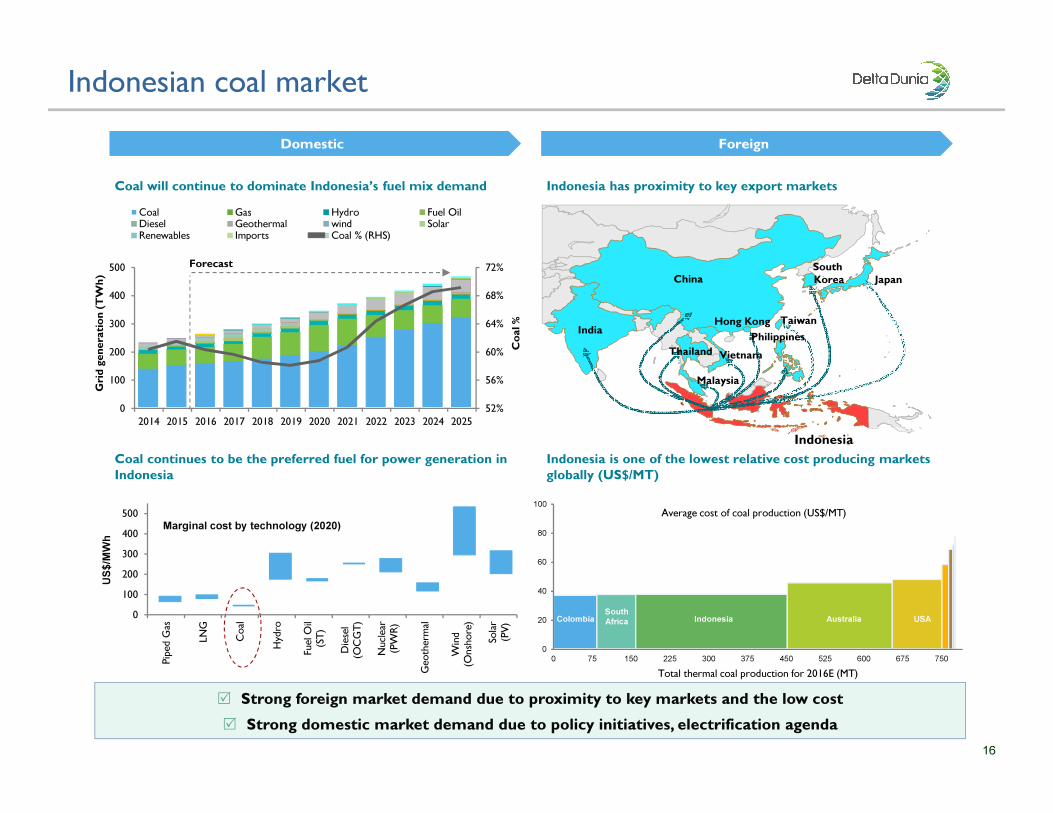
Coal will continue to dominate Indonesia’s fuel mix demandCoal will continue to dominate Indonesia’s fuel mix demand
Coal continues to be the preferred fuel for power generation in
Indonesia
Coal continues to be the preferred fuel for power generation in
Indonesia
Indonesia has proximity to key export marketsIndonesia has proximity to key export markets
India
China
VietnamThailand
Philippines
Taiwan
South
Korea Japan
Malaysia
Indonesia
Hong Kong
Indonesia is one of the lowest relative cost producing markets
globally (US$/MT)
Indonesia is one of the lowest relative cost producing markets
globally (US$/MT)
0
20
40
60
80
100
0 75 150 225 300 375 450 525 600 675 750
Total thermal coal production for 2016E (MT)
Average cost of coal production (US$/MT)
IndonesiaColombiaSouth
Africa Australia USA
Domestic Foreign
52%
56%
60%
64%
68%
72%
0
100
200
300
400
500
2014 2015 2016 2017 2018 2019 2020 2021 2022 2023 2024 2025
Coal Gas Hydro Fuel OilDiesel Geothermal wind SolarRenewables Imports Coal % (RHS)
Forecast
Gri
d g
en
era
tio
n (
TW
h)
Co
al %
US$/M
Wh
Marginal cost by technology (2020)
0
100
200
300
400
500
Piped G
as
LNG
Coal
Hydro
Fuel Oil
(ST)
Diesel
(OCGT)
Nuclear
(PW
R)
Geotherm
al
Wind
(Onshore)
Solar
(PV)
� Strong foreign market demand due to proximity to key markets and the low cost
� Strong domestic market demand due to policy initiatives, electrification agenda
12% 2%
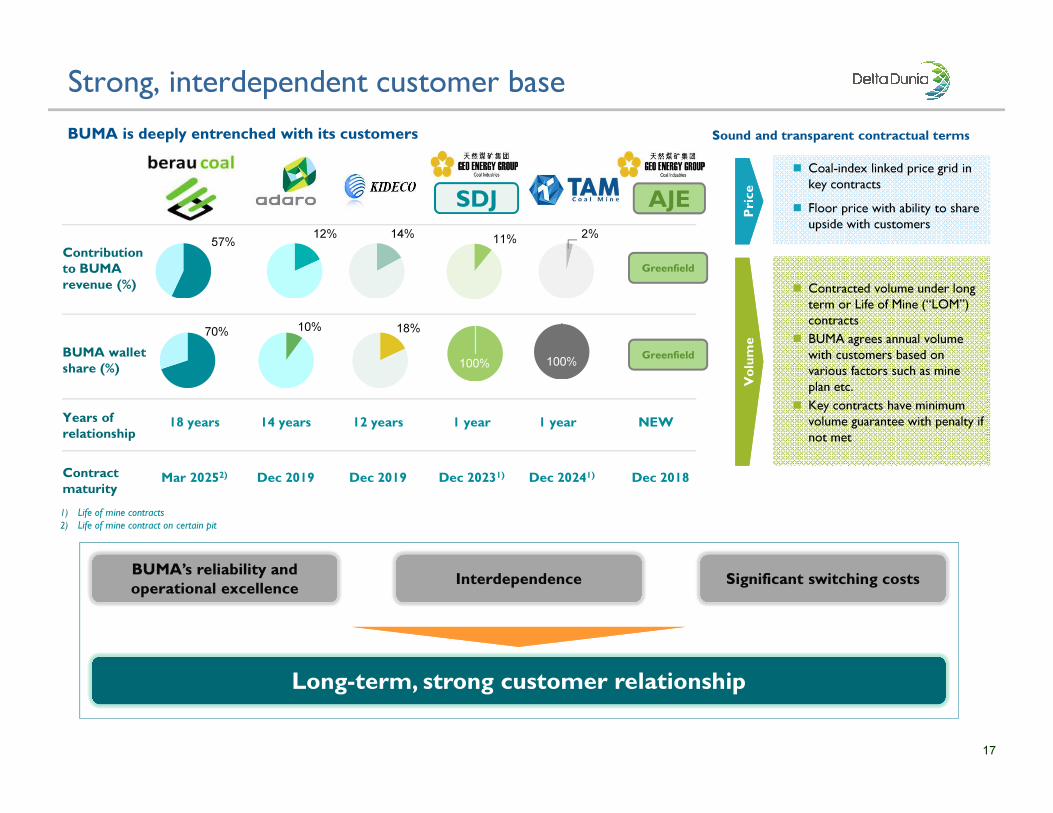
Strong, interdependent customer base
17
10% 18%
100%
Years of
relationship18 years 14 years 1 year1 year
Contribution
to BUMA
revenue (%)
BUMA wallet
share (%)
BUMA is deeply entrenched with its customersBUMA is deeply entrenched with its customers
100%
Contract
maturityMar 20252) Dec 2019 Dec 20231) Dec 20241)
� Coal-index linked price grid in
key contracts
� Floor price with ability to share
upside with customers
Price
Price
Volume
Volume
Sound and transparent contractual termsSound and transparent contractual terms
� Contracted volume under long
term or Life of Mine (“LOM”)
contracts
� BUMA agrees annual volume
with customers based on
various factors such as mine
plan etc.
� Key contracts have minimum
volume guarantee with penalty if
not met
Long-term, strong customer relationshipLong-term, strong customer relationship
BUMA’s reliability and
operational excellence
BUMA’s reliability and
operational excellenceInterdependenceInterdependence Significant switching costsSignificant switching costs
1) Life of mine contracts
2) Life of mine contract on certain pit
SDJ AJE
12 years
Dec 2019
NEW
Dec 2018
57%14%
70%
11%
Greenfield
Greenfield
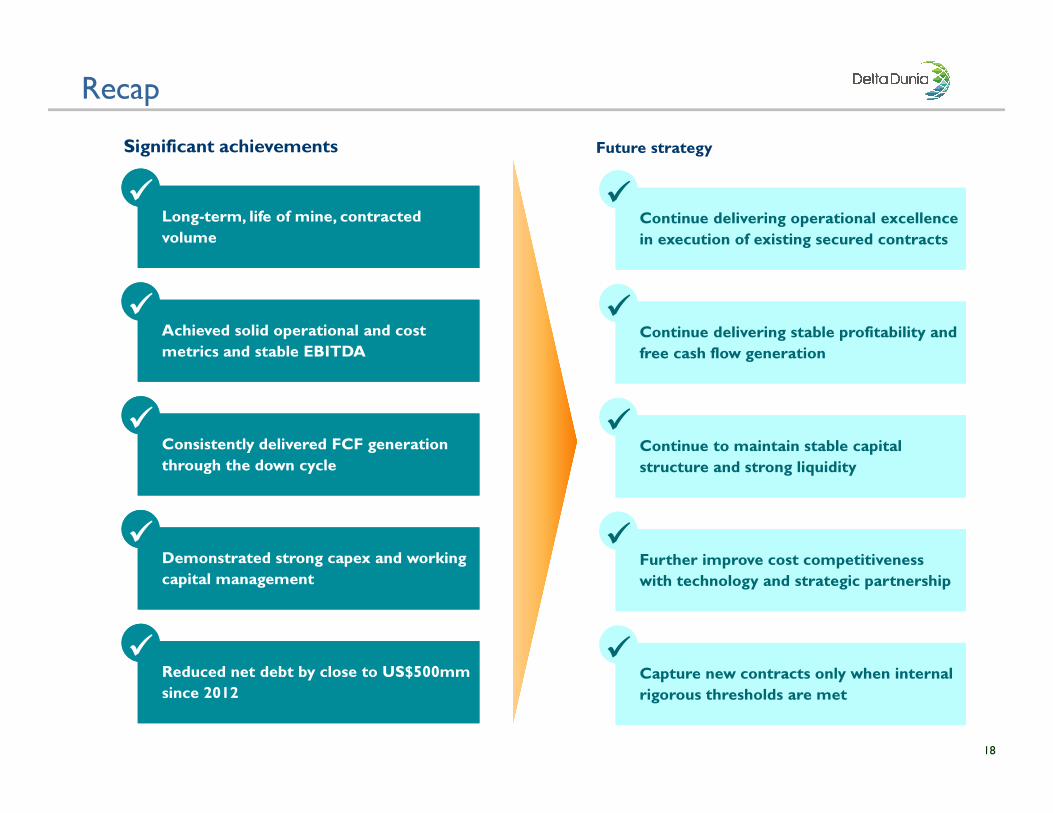
Recap
18
Significant achievementsSignificant achievements Future strategyFuture strategy
Long-term, life of mine, contracted
volume
Long-term, life of mine, contracted
volume
Achieved solid operational and cost
metrics and stable EBITDA
Achieved solid operational and cost
metrics and stable EBITDA
Consistently delivered FCF generation
through the down cycle
Consistently delivered FCF generation
through the down cycle
Demonstrated strong capex and working
capital management
Demonstrated strong capex and working
capital management
Reduced net debt by close to US$500mm
since 2012
Reduced net debt by close to US$500mm
since 2012
��
��
��
��
��
Continue delivering operational excellence
in execution of existing secured contracts
Continue delivering operational excellence
in execution of existing secured contracts
Continue delivering stable profitability and
free cash flow generation
Continue delivering stable profitability and
free cash flow generation
Continue to maintain stable capital
structure and strong liquidity
Continue to maintain stable capital
structure and strong liquidity
Further improve cost competitiveness
with technology and strategic partnership
Further improve cost competitiveness
with technology and strategic partnership
Capture new contracts only when internal
rigorous thresholds are met
Capture new contracts only when internal
rigorous thresholds are met
��
��
��
��
��