psychometric validation of the hispanic bilingual a
TRANSCRIPT
PSYCHOMETRIC VALIDATION OF THE HISPANIC BILINGUAL
GIFTED SCREENING INSTRUMENT (HBGSI)
A Dissertation
by
MÓNICA V. FULTZ
Submitted to the Office of Graduate Studies of Texas A&M University
in partial fulfillment of the requirements for the degree of
DOCTOR OF PHILOSOPHY
May 2004
Major Subject: Educational Psychology

PSYCHOMETRIC VALIDATION OF THE HISPANIC BILINGUAL
GIFTED SCREENING INSTRUMENT (HBGSI)
A Dissertation
by
MÓNICA V. FULTZ
Submitted to Texas A&M University in partial fulfillment of the requirements
for the degree of
DOCTOR OF PHILOSOPHY
Approved as to style and content by:
___________________________ ___________________________
Rafael Lara-Alecio Beverly Irby (Chair of Committee) (Member)
__________________________ ____________________________
Gonzalo García Michael Ash (Member) (Member)
____________________________
Victor Willson (Head of Department)
May 2004
Major Subject: Educational Psychology

iii
ABSTRACT
Psychometric Validation of the Hispanic Bilingual
Gifted Screening Instrument (HBGSI). (May 2004)
Mónica V. Fultz, B.S., Instituto Nacional del Profesorado Secundario;
M.A., Prairie View University
Chair of Advisory Committee: Dr. Rafael-Lara Alecio
There is an evident under-representation of Hispanic students in Gifted and
Talented (GT) programs. This is due to several reasons including lack of valid
instruments, biased standardized tools, biased teacher perceptions, and misinterpretation
of tests scores among others. The need to develop and/or validate instruments that reflect
students’ cultural backgrounds has become a priority in the U.S. today.
The purpose of this study was to analyze the reliability and validity facets of the
Hispanic Bilingual Gifted Screening Instrument (HBGSI) developed by Irby and Lara-
Alecio (1996), more specifically, the split-half reliability and the concurrent validity
when correlated to the Bilingual Verbal Abilities Test (BVAT). Participants were 527
students from two elementary schools in Texas. Students were administered the HBGSI
in May 2003 and a reduced sample was administered the BVAT in the latter part of 2003
and the beginning of 2004. Results were analyzed, interpreted and discussed.
The researcher found that the HBGSI has evidence of high reliability coefficients
using Guttman, Spearman-Brown and Cronbach’s alpha ranging from .93 to .97.
Concurrent validity was computed using Pearson correlation coefficient r =.39.

iv
Additionally, an exploratory factor analysis was conducted and revealed the existence of
5 factors.
Among the primary limitations is the generalizability of the findings. Readers
should use caution in applying the findings of this study to other settings and populations.
Further research is recommended to establish the concurrent validity of the HBGSI with
other achievement measures.
In conclusion, there has been a contemporary move to the incorporation of
inclusive screening instruments for use with language minority students. This movement
suggests the inclusion of portfolio and performance assessment, checklists, and teacher
observations in addition to standardized measures. The HBGSI has shown promising
results in the arena of Hispanic gifted identification. This instrument is recommended to
be used at the first stage of the screening process of potential Hispanic GT students. This
study provided insight into the improvement of practices and identification of Hispanic
bilingual students.

v
ACKNOWLEDGEMENTS
I would like to take this opportunity to thank those individuals that stood behind
me and helped me through the arduous path of completing a doctoral dissertation. First
and foremost, I would like to express my thanks to my husband, Joe, and my daughter,
Juliet, for showing a dependable and unconditional support in my endeavor. There were
many seemingly endless nights that they accommodated my “vacancy” at home as mom.
Secondly, I would like to thank my family in Argentina that spiritually followed
my journey towards my degree. I would like to include those family members that are
living and those that, due to ill-timed and inevitable fate, are not, but will always live in
my heart. I know that God answered their prayers and encouraged me through
challenging times.
A special thank you goes to Dr. Gonzalo Garcia for his help and support. He
devoted many hours of his time to coach me and prepare me for this stage in my life. He
offered expertise and a caring personality that helped me sort some of the difficulties I
encountered in this path.
I would like to extend my appreciation to Dr. Michael Ash for accepting to serve
on my committee. Finally, I would like to thank Dr. Rafael Lara-Alecio and Dr. Beverly
Irby for all their assistance and collaboration, their indulgence in the requirements of me
as a graduate assistant, and their letting me have access to their instrument, the HBGSI.
vi
TABLE OF CONTENTS
Page
ABSTRACT................................................................................................... iii
ACKNOWLEDGEMENTS........................................................................... v
TABLE OF CONTENTS............................................................................... vi
LIST OF TABLES ........................................................................................ ix
CHAPTER
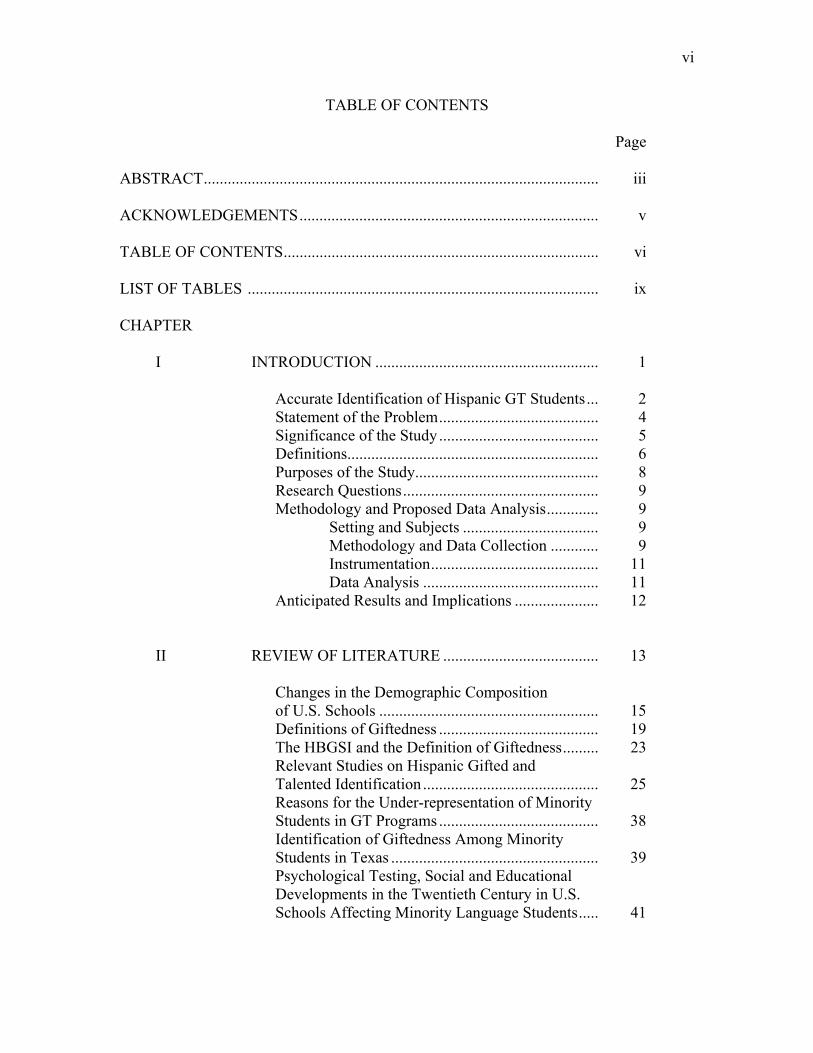
I INTRODUCTION ........................................................ 1
Accurate Identification of Hispanic GT Students... 2 Statement of the Problem........................................ 4 Significance of the Study ........................................ 5 Definitions............................................................... 6 Purposes of the Study.............................................. 8 Research Questions................................................. 9 Methodology and Proposed Data Analysis............. 9 Setting and Subjects .................................. 9 Methodology and Data Collection ............ 9 Instrumentation.......................................... 11 Data Analysis ............................................ 11 Anticipated Results and Implications ..................... 12
II REVIEW OF LITERATURE ....................................... 13
Changes in the Demographic Composition of U.S. Schools ....................................................... 15 Definitions of Giftedness ........................................ 19 The HBGSI and the Definition of Giftedness......... 23 Relevant Studies on Hispanic Gifted and Talented Identification ............................................ 25 Reasons for the Under-representation of Minority Students in GT Programs ........................................ 38
Identification of Giftedness Among Minority Students in Texas .................................................... 39 Psychological Testing, Social and Educational Developments in the Twentieth Century in U.S.
Schools Affecting Minority Language Students..... 41
vii
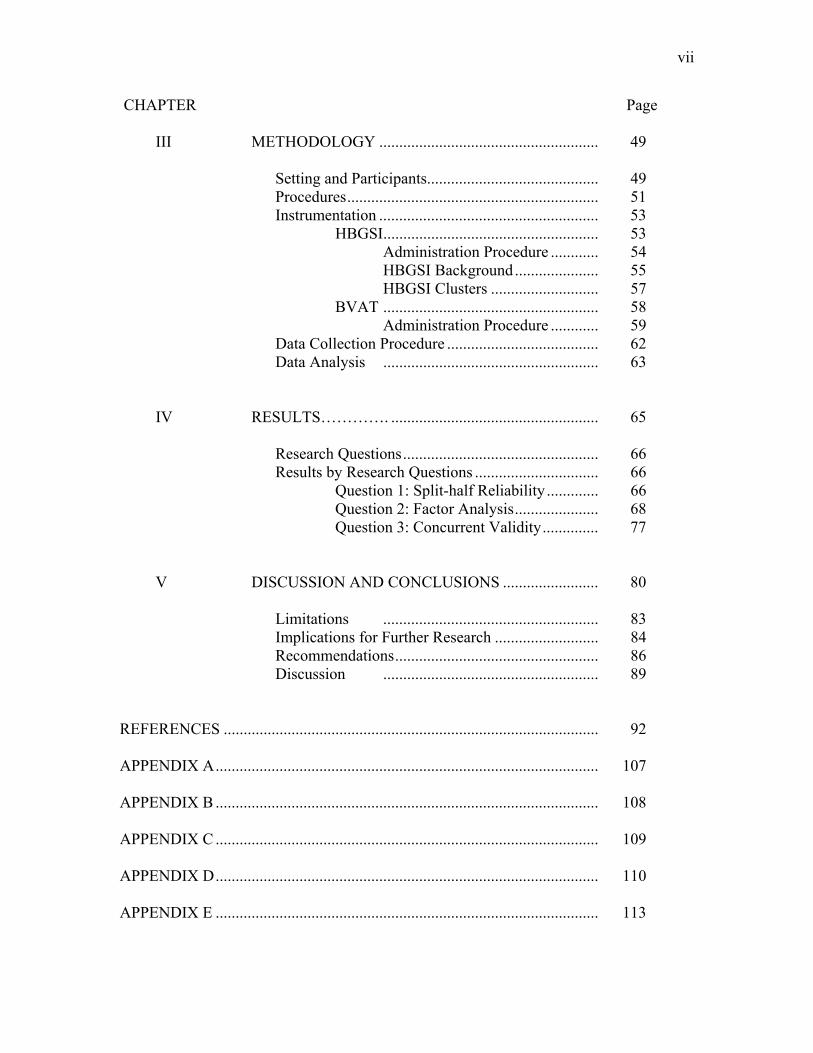
CHAPTER Page III METHODOLOGY ....................................................... 49 Setting and Participants........................................... 49 Procedures............................................................... 51 Instrumentation ....................................................... 53 HBGSI...................................................... 53 Administration Procedure ............ 54 HBGSI Background..................... 55 HBGSI Clusters ........................... 57 BVAT ...................................................... 58 Administration Procedure ............ 59 Data Collection Procedure ...................................... 62 Data Analysis ...................................................... 63
IV RESULTS…………. .................................................... 65
Research Questions................................................. 66 Results by Research Questions ............................... 66 Question 1: Split-half Reliability ............. 66 Question 2: Factor Analysis..................... 68 Question 3: Concurrent Validity.............. 77
V DISCUSSION AND CONCLUSIONS ........................ 80
Limitations ...................................................... 83 Implications for Further Research .......................... 84 Recommendations................................................... 86 Discussion ...................................................... 89
REFERENCES .............................................................................................. 92
APPENDIX A................................................................................................ 107
APPENDIX B ................................................................................................ 108
APPENDIX C ................................................................................................ 109
APPENDIX D................................................................................................ 110
APPENDIX E ................................................................................................ 113

viii
VITA ................................................................................................ 114

ix
LIST OF TABLES
TABLE Page
1. U.S. Total Population, White Population and Hispanic Populations .................................................................................. 15 2. Texas Total Population, White and Hispanic Populations …….. 16 3. Texas Student Population Characteristics.................................... 18 4. Student Ethnic Distribution for School # 1 and # 2 .................... 50 5. Ethnic Distribution of Teachers for School # 1 and # 2 .............. 51 6. Range, Mean and Standard Deviation for the HBGSI and the BVAT ..................................................... 65 7. Guttman Split-half, Spearman-Brown and Cronbach’s Alpha for the HBGSI Reliability Coefficient Using Odd and Even Items .......................................................... 67 8. Guttman Split-half, Spearman-Brown and Cronbach’s Alpha for the HBGSI Reliability Coefficient Using Random Selection of Cases ......................................................... 68 9. Rotated Component Matrix of the HBGSI Using Varimax Rotation Method Extraction of Factors........................................ 71 10. Pearson Correlation Coefficient of the HBGSI and the BVAT... 79

1
CHAPTER I
INTRODUCTION
The United States population demographics have seen a dramatic change in the
last few decades. The Hispanic population is growing significantly (U.S. Census Bureau,
2000) and reached 35.3 million in 2000 (12.5% of the nation’s total population) with 28
million of those individuals speaking Spanish at home (U.S. Census Bureau, Facts &
Features, 2002). These figures indicate a 58% Hispanic population increase between the
1990 and 2000 censuses. This growth is consequently reflected in the school
demographics. Hispanic students are no longer a minority; in fact, Houston has been
placed among the four largest cities in America , including Los Angeles, Chicago and
New York that have a “majority minority” population (Almond, 2002). Even though the
population demographics have seen a remarkable change, there is evidence of a low
representation of Hispanic students in gifted and talented (GT) programs (Castellano &
Díaz, 2002; Irby, 1993; Irby & Lara-Alecio, 1996, 1999; LaFontaine, 1987; Lara-Alecio
& Irby, 2000; Ortíz & González, 1989; Vanderslice, 1998).
This study sought to offer a solution to better identify Hispanic gifted students by
analyzing the psychometric properties of the Hispanic Bilingual Gifted Screening
Instrument (HBGSI) (Irby & Lara-Alecio, 1996). Specifically, I investigated the
concurrent validity between the HBGSI and the Bilingual Verbal Ability Tests (BVAT)
(Munoz-Sandoval, Cummins, Alvarado & Ruef, 1998) and the reliability of the HBGSI.
______________________ This dissertation follows the format of American Educational Research Journal

2
Accurate Identification of Hispanic GT Students
The concept of an instrument that can assess Hispanic students satisfactorily has
been considered for some time (González, 2002). Anastasi and Urbina (1997) defined
multicultural testing as exhibiting problematic issues. Similarly, Gindis (1999) referred to
bilingual assessment as a debatable field in school psychology. Anastasi (1992) stressed
the misinterpretations of test results when assessing culturally diverse students.
Additionally, several reports (Geisinger, 1992; Irby & Lara-Alecio, 1996) questioned the
validity and fairness of psychological testing of Hispanic students. Kloosterman (1997)
spoke about the lack of appropriate instruments to measure language minority students.
Marín and Marín (1991) stressed the importance of developing culturally appropriate
tools that could assess Hispanic students more accurately. Standardized testing offers a
“poor match” between students’ knowledge, culture and values, as the test’s content is
assessed by standardized instruments (Quintero & Cooks, 2002). These researchers have
enumerated several factors that helped reveal the gap in standardized tests between
“students of color” and the “European American”. Differences such as socioeconomic
status, ethnic background, and cultural bias, among others, have been found. Castellano
and Díaz (2002) identified factors that contribute to the under-representation of Hispanic
students in GT programs and listed them as: educators’ low expectations, and non-
responsive curriculum, inadequate identification tools, and misunderstanding or lack of
interest from the educational system.
Rodriguez (1992) mentioned three aspects that a test administrator needs to
consider when assessing a Hispanic student. These factors are: language, culture, and
socioeconomic status. He expanded the language factor explaining the inadequacy of

3
assessing a student’s performance in English when he/she does not grasp the language.
Rodriguez also raised the potential bias of testing Hispanic students when tests have been
developed, validated and standardized on a non-minority white, middle-class population.
Culture and socioeconomic factors are also important when assessing Hispanic students.
According to Rodriguez (1992), if Hispanics are not “test wise” or their culture is not
accustomed to being under the testing blade, then this population holds a “cultural
disadvantage”. He continued giving other reasons behind the culture concept, such as the
value of testing for Hispanics, and lack of knowledge of the testing implications for the
students’ future. Anastasi and Urbina (1997) expanded this concept into what they call
“parameters” where they include speed as part of the culture. Some cultures put emphasis
on the speed at which performance is measured whereas other cultures do not.
Following this reasoning, one can conclude that standardized assessment
instruments seem to “purge” Hispanic students and hinder their progress. These
instruments appear to be embedded in the main culture and discriminate against minority
students. Geisinger (1992) expressed the importance of validating the assessment
instruments that are used with Hispanic students. He emphasized how construct validity
and well-trained test users can compliment each other to succeed in the test procedure.
He continued explaining some of the characteristics of such tests: the construct validity
and the bias load that tests hold. He drew attention to the relevant importance of test
validity in the psychometric field and professional testing. He advised on three main
evidences of validity to consider when assessing Hispanic students: criterion related -
which includes concurrent and predictive- content, and construct validity.

4
Statement of the Problem
Giftedness is not the monopoly of a particular ethnic background (Lara-Alecio &
Irby, 2000), nor it is the prerogative of a social class group (Passow, 1986). Gifted and
talented students can be found in all groups, regardless of their background or social
status. Proper assessment and identification of these students seem to be rather difficult
and controversial. The current unsuitable and undemocratic testing procedures have left
the American schools with an under-representation of Hispanic students in GT programs
(Irby, 1993; Irby & Lara-Alecio, 1996; Ortíz & González, 1989; & U.S. Department of
Education, 1993).
Bermúdez and Rakow (1990) spoke of this disproportion and the lack of valid,
reliable and culturally responsive instruments that can assist with the assessment and
placement process of Hispanic GT students. Castellano (1998) and Cohen (1990) pointed
out the discrepancy of test takers and test makers. They acknowledged the background,
culture and language differences of Hispanic students facing traditional standardized
tests.
An immediate need to validate the HBGSI is necessary to help identify potential
Hispanic gifted students, thus helping reverse the under-representation of such students in
GT programs, and providing an egalitarian education system as described by Castellano
(1998) and Gintis (1988). This system would provide Hispanics an opportunity to be
assessed taking into consideration the background, culture, values, and uniqueness that
they bring to the classroom.

5
Significance of the Study
In summary, two very important concerns in today’s society are central to my
study: (a) the rapid Hispanic population growth which is reflected in our public schools,
and (b) the ever debatable topic of bilingual assessment (Anastasi, 1985; Daves, 1984;
Eyde, Moreland, Robertson, Primoff, & Most, 1988; Vanderslice, 1998). The latter issue
raises important concerns such as the misinterpretation of tests’ scores (Anastasi, 1992)
and, the under-representation of Hispanic students in GT programs (Cohen, 1990;
Colangelo & Davis, 1991; Irby & Lara-Alecio, 1996; LaFontaine, 1987; Ortíz &
González, 1989). Considering all these topics, a need for a more accurate and reliable
screening instrument for Hispanic GT students is a basic necessity.
The problem of testing, particularly, score interpretation and its misuse is not
new and has affected psychology for many years (Cronbach, 1975). Misinterpretation of
scores is very common today (Muñiz, Bartram, Evers, Boben, Matesic, Glabeke,
Fernández-Hermida, & Zaal, 2001). Studies from Collier (1985) and Rueda and Mercer
(1985) reported the misinterpretation of tests’ scores that minority school children from
cultural and linguistically diverse backgrounds may suffer. Rationale for this imprecision
(Rueda & Mercer, 1985) varies and is a result of a lack of valid assessment instruments
(Cohen, 1990; Irby & Lara-Alecio, 1996), and the unfair and biased characteristics of
standardized tests (Quintero & Cooks, 2002) among others.
Irby and Lara-Alecio (1996) developed the Hispanic Bilingual Gifted Student
Instrument (HBGSI). My intentions were to examine evidence of validity and reliability
of this instrument.

6
Definitions
The following are key terms and corresponding definitions used in this study. For
the purpose of this research, it should be noted that certain definitions have been adopted
that apply specifically to this study and are not recommended for generalization to other
settings, populations, and/or situations.
Validity: Geisinger (1992) agreed that validity is the most important aspect to
consider when analyzing the psychometric properties of an instrument. Anastasi and
Urbina (1997) have defined validity as “what” a test measures, using the relationship
between performance and an observable fact as a method to determine test validity.
Concurrent Validity: Gall, Borg & Gall (1996) defined concurrent validity as “the
extent to which individuals’ scores on a new test correspond to their scores on a
established test of the same construct that is administered shortly before or after the new
test” (p. 252).
Reliability: Reliability refers to the consistency or stability of scores over time. In
this particular study, I used the split-half reliability coefficient which derives from a
single test administration (Anastasi & Urbina, 1997).
Split-half Reliability: This approach yields a correlation coefficient called
coefficient of internal consistency. It consists of one administration of a test to one group
of individuals. In order to calculate this coefficient, the researcher will divide the test into
two halves and correlate them (e.g., odd and even item numbers in a test). The Spearman-
Brown formula is usually the procedure of choice for establishing reliability by the split-
half method. Other methods used to determine internal consistency are the Kuder-
Richardson formulas (K-R 20 and 21) when the items are dichotomous (yes vs. no,

7
incorrect vs. correct) (Anastasi & Urbina, 1997). The Cronbach’s coefficient alpha (often
symbolized by the lower case Greek letter ά) is also very popular (Keeling & Pavur,
1998) and a most common method used to calculate a split-half reliability coefficient.
Factor Analysis: Anastasi and Urbina (1997) defined factor analysis as a
mathematical analysis designed to identify common traits among tests. Gall, Borg & Gall
(1996) described factor analysis as the quest for groups of variables that correlate with
each other. In other words, factor analysis is a grouping or variable reduction technique
that is used in statistical analysis by researchers aiming at identifying measures that
belong together.
The number of factors that could potentially be extracted can be determined with
the use of a scree plot. A scree plot is a two dimensional graph with an X (factors in
ascending order) and Y axis (eigenvalues in descending order) (Newsom, 2003). It is
called scree plot because it resembles the side of a mountain with a soft slope at the base
(Kachigan, 1991). The scree plot is one of the methods that the researchers uses to
identify the main factors. Rotation is used to transform the matrix in order to maximize
factor loadings to their fullest extent, redefine the factors and eliminate middle score
loadings (Newsom, 2003).
Gifted and Talented: The U.S. Department of Education (1993) defined gifted and
talented in their report “National Excellence: A Case for Developing America's Talent”
as follows:
Children and youth with outstanding talent perform or show the potential for
performing at remarkably high levels of accomplishment when compared with
others of their age, experience, or environment. These children and youth exhibit

8
high performance capability in intellectual, creative, and/or artistic areas, as well
as possess an unusual leadership capacity, or excel in specific academic fields.
They require services or activities not ordinarily provided by the schools.
Outstanding talents are present in children and youth from all cultural groups,
across all economic strata, and in all areas of human endeavor. (p. 26)
Renzulli (1976) provided a definition of giftedness which was adopted as the
foundation upon which the HBGSI was developed. This definition describes gifted and
talented students as “those possessing or capable of developing above average
intelligence (IQ), task commitment, and creativity and applying them to any potentially
valuable area of human performance” (p. 261). Renzulli (1986) created a Venn diagram
illustrating the interaction between the three elements and the dynamic properties of the
concept, implying constant change and opposing a predetermined or static idea.
Hispanic Gifted and Talented Students (GT): Borrowing Renzulli’s definition of
giftedness, Lara-Alecio and Irby (1993) defined Hispanic GT students as those
individuals who have the three traits expressed in the previous paragraph, adding the
individual’s socio-linguistic-cultural context. This socio-linguistic-cultural context is
added to Renzulli’s Venn diagram (1976) by drawing an all-encompassing circle around
the three original characteristics.
Purposes of the Study
The primary purpose of this study was to investigate the following psychometric
properties of the HBGSI: reliability and validity. First, the reliability aspect of the HBGSI
was determined by providing split-half reliability evidence. Secondly, exploratory factor
analysis was conducted on the HBGSI. Finally, the study focused on concurrent validity,

9
established through correlations between the HBGSI and another validated instrument,
the Bilingual Verbal Abilities Test (REFERENCE).
Research Questions
The research questions that this study addressed were the following:
1. What is the split-half reliability coefficient for the HBGSI?
2. What are the main factors that are identified in the HBGSI?
3. What is the concurrent validity of the HBGSI when compared to a normed
cognitive measure such as the BVAT grades K through 4?
Methodology and Proposed Data Analysis
Setting and Subjects
Five hundred twenty seven Hispanic bilingual students participated in this study.
These students were enrolled in 1st through 5th grade levels of dual language and
bilingual classroom programs (approximately 6-12 year old females and males, all of
Hispanic background). This sampling procedure required a purposefully selected
elementary school district in a metropolitan area in central Texas. Criteria for the
selection of the elementary schools was as follows: elementary school with a large
concentration of Hispanic students in bilingual programs, and HBGSI already
implemented. The Hispanic population was reported to be at 85% according to the
Academic Excellence Indicator System (Texas Education Agency, 2001-2002).
Methodology and Data Collection
Data from 527 students that were administered the HBGSI were collected in May,
2003 and results were entered and stored into an internet website (these students were in
K through 4th grade in 2003).

10
Based on the analysis of these data, I was able to provide answers to the first and
second research questions. Question number one focused on establishing a coefficient of
internal consistency using split-half reliability in order to provide reliability information
(Guttman, Spearman-Brown formula and Cronbach’s Alpha). Results were analyzed,
interpreted and discussed for further implications. Answer to question number two
addressing factor analysis was established through the use of a Scree plot and Varimax
rotation technique.
In order to provide an answer to question three, a group of undergraduate students
in the bilingual program were trained to administer the second assessment tool (BVAT)
and to collect the data. The undergraduate students, under strict guidance, tested the
participants individually (approximate testing time was 20 to 25 minutes per participant).
The sample that the researcher used for this part of the study consisted of a reduced
number of students (n=75). All of them were participants in the original sample in 2003;
however, due to loss in the sample and other factors, the number of students available for
the second half of this study was drastically reduced since the first data collection in May
2003. Other important reasons for the reduction of the sample size for the second part of
the study were: (1) only those students who returned the consent forms signed by their
parents were eligible to participate. Unfortunately, not all students returned the consent
forms with signatures, and (2) students from 2nd grade in School # 1 were moved to
School # 2 for promotion into 3rd grade in August 2004. Some of the students did not
make this transition; some others were incorporated as new students, complicating the
allocation of students for whom the researcher had the HBGSI data. Once the data were

11
collected from both instruments, the results were correlated in an effort to provide
evidence of the validity of the HBGSI, thus answering question three in this study.
Additionally, my study provided insight and further information into the
improvement of practices and identification of Hispanic bilingual students. The goal of
my study was to be able to improve some of the screening practices and offer a more
democratic path to equality in GT programs.
Instrumentation
Two instruments were used data collection in this study- the HBGSI and the
BVAT. The latter is a standardized instrument, developed by Muñoz-Sandoval,
Cummins, Alvarado and Ruef (1998). It consists of a battery of three assessment tools
used to measure bilingual verbal ability in English and the students’ native language. This
instrument has been translated into 15 other languages including Spanish and has been
approved by the Texas Education Agency to assess LEP students as an oral language
proficiency test.
The HBGSI is an inclusive instrument developed by Irby and Lara-Alecio (1996)
and its purpose is to screen for potential Hispanic gifted and talented students. It is a
teacher-administered-instrument that consists of 77 items, organized into 11 clusters and
used in K through 4th grade.
Data Analysis
The first question was answered through the calculation of Guttman, Spearman-
Brown and Cronbach’s Alpha correlation coefficients to determine the reliability of the
HBGSI. The second research question was answered using exploratory factor analysis
with Principal Component analysis, Scree plot and the Varimax orthogonal rotation

12
technique. Concurrent validity for the third research question was determined through the
Pearson product moment correlation coefficient. All data were coded and then entered
using a computer statistical software program and analyzed with SPSS (Statistical
Package for the Social Sciences) version 11.5.
Anticipated Results and Implications
The intention of my study was to determine the specific psychometric properties
of the HBGSI: split-half reliability, exploratory factor analysis and concurrent validity.
Establishing further psychometric properties should provide stronger evidence in favor of
its use.
My dissertation will be posted on the http://ldn.tamu.edu website. It will be
maintained and supported by the bilingual program at Texas A&M University, submitted
for publication in major education journals, and presented at state and national
conferences including the Texas Association for Bilingual Education, the National
Association for Bilingual Education and the Southwest Educational Research
Association.

13
CHAPTER II
REVIEW OF LITERATURE
This chapter presents the main studies found in the review of literature on
minority GT identification, specifically Hispanic students. It also includes a
chronological approach to psychological testing affecting language minority students.
The purpose of the review of literature was to consider the latest research in the
identification of minority gifted and talented students, more specifically, bilingual
Hispanic. In doing so, this review of literature focused on national studies and reports that
attempted to find answers to the dilemma of minority representation in GT programs.
Finally, and because this dissertation focused on the HBGSI and its psychometric
properties, HBGSI studies are reported in this chapter.
Several data-bases were searched for the purposes of the literature review. These
were Communication Studies, EBSCOhost, Educational Resources Information Center
(ERIC), Linguistic and Language Behavior Abstracts, PsycINFO, SocioFile, Sociology,
WilsonWeb, and World Cat.
While the Hispanic population experiences a dramatic demographic growth in
educational settings, the representation of such students in GT programs does not appear
to be equally proportioned (Bermúdez & Márquez, 1998; Cantu, 1998; Castellano, 1998;
Castellano & Díaz, 2002; Cohen, 1990; Coleman & Galagheer, 1995; Cunningham,
Callahan & Plucker, 1998; Hadaway & Marek-Scroer, 1992; Jean, 1996; Irby, 1993;
Lara-Alecio, Irby & Walker, 1997; Masten, Plata, Wenglar & Thedford, 1999; Mclean,
1995; Passow & Frazier (1996); Plata & Masten, 1999; Plucker, Callahan & Tomchin,

14
1996; Reyes, Fletcher & Paez, 1996; Sarouphim, 1999; Scott, Deuel, Jean-Francois &
Urbano, 1996; Scott, Perou, Urbano, Hogan & Gold, 1992). Ford and Grantham (2003)
determined the under-representation of Hispanics to be approximately 50 to 70%. This
misrepresentation is due, in part, to different factors that pivot around the improper
identification, inaccurate assessment and incorrect interpretation of tests’ results of
culturally and linguistically diverse students (Bermúdez & Márquez, 1998; Castellano &
Díaz, 2002; Kester & Peña, 2002; Valdés, 2003). Jean (1996) explained the difficulty in
trying to reach harmony and accuracy in the assessment of minority students when
variables such as culture, norms, languages, ethnic backgrounds, economical and
educational levels come into play.
Mclean (1995) reported that, standardized tests, such as IQ tests, have been used
for over a century for different purposes regardless of the students’ ethnic background. It
was not until the late 1940’s that researchers and educators recognized the difficulties
that standardized tests presented to students of varied language backgrounds. The decades
of the 50’s through the 70’s, the height of the Civil Rights movement (Warger &
Burnette, 2000), were characterized by several major court cases that affected the way
minority students were viewed in the light of assessment, permanently bringing the
concept of non-discrimination to educational settings.
Language minority students are still underrepresented in GT programs, in spite of
researchers’ recognition and understanding of the problem and the implementation of a
variety of assessment tools designed to more accurately identify these particular students
(Castellano & Díaz, 2002; Mclean, 1995). Properly defining giftedness with a

15
contemporary outlook among minority Hispanic students has become the key concept in
the process of screening and identification of potential gifted students (Valdés, 2003).
Changes in the Demographic Composition of U.S. Schools
The last decade has seen the largest immigration influx in the history of the U.S.
(Bureau of Citizenship and Immigration Services, 2001). The 2000 U.S. Census indicated
an increase of 13 million persons in the Hispanic population during the last 10 years, that
is a growth of 58% since 1990. These figures make up a total of 38.8 million Hispanics
(as shown in Table 1), of which over 28 million of these individuals speak Spanish at
home and have chosen to concentrate in the West and South, mainly California and
Texas.
The following three tables show the total population of Hispanics in the U.S. and
in Texas compared to the White population. These tables provide the reader additional
demographic information about the population distribution in U.S. and student
demographic distribution in GT programs in Texas.
Table 1
U.S. Total Population, White Population and Hispanic Populations
U.S. Total Population U.S. White Population U.S. Hispanic Population
280,540,330 (100%) 212,541,793 (75%) 38,800,000 (14%)

16
Table 1 shows the U.S. distribution of the population according to the U.S.
Census Bureau (2002). According to this table, the Hispanic population represents 14%
of the total U.S. population, compared to 75% for the White population.
Surfacing at this level is the demographic ethnic distribution of Texas. Compared
to the 14% average Hispanic ethnicity among the general population in the U.S., Texas
claims 32% Hispanic (U.S. Census Bureau, 2001), as shown in the following table.
Table 2
Texas Total Population, White and Hispanic Populations
Texas Total Population White Population Hispanic Population
20,851,820 (100%) 10,933,313 (52%) 6,669,666 (32%)
This table shows a very high concentration in the Hispanic population in Texas
(Texas Education Agency, 2003). A newspaper article covering a top news story on
September 18, 2003, claimed that Texas had the second largest number of Hispanics, and
referred to this growth as being “explosive” (USA Today, 2003). A simple look into the
future predicts that by 2050 Hispanic students will grow to 18 million in Texas (Day,
1993).
Due to the changes in the socio-demographic composition of society, remarkable
demographic changes have occurred in the schools, and these have impacted the
classroom in many aspects (Cortez, 2003). The social increase in the population translates
directly to the increase of the population in the classrooms. Cortez (2003) quoted a
17
double-fold enrollment of limited-English-proficient students from 1990 to 2000 (from
over two million to over four million LEP students). Student enrollment increased by
almost 25% in the last decade (U.S. Census Bureau, 2001). California and Texas were the
top two states with the highest concentration of Hispanic students (Cortez, 2003). English
language learners have tackled a 105 % growth in schools, whereas the mainstream
population grew only 12 % (Education Week, 2003). Kindler (2002) reported over 460
languages spoken by students in their homes; however, three out of four of these students
speak Spanish at home (Castellano & Díaz, 2002) constituting, by far, the majority of the
culturally and linguistically diverse student population. As a matter of fact, Hispanic
students are no longer a minority; Houston, has been placed among the four largest cities
in America, after Los Angeles, Chicago, and New York, as having a “majority minority”
population (Almond, 2002).
Table 3 provides information related to the proportion of Hispanic students in
Texas compared to the number of White students. Additionally, this table provides data
that supports the disproportion of Hispanic students in GT programs compared to White
students.
When comparing the total Texas student population, one finds that the Hispanics
account for over 41% of the total student population. The White student population
follows with 40% (very similar). The disproportion emanates from the GT Hispanic
population accounting for 28% of the total GT population in Texas, whereas the GT
White population accounts for over 56% (double).

18
Table 3
Texas Student Population Characteristics
Hispanic Student
Population
1,728,059 (41.67%)
GT Hispanic
Student Population
95,788 (28%) Texas Total Student
Population
4,146,653 (100%) White Student
Population
1,694,297 (40.86%)
GT Student
Population
339,270 (8%) GT White Student
Population
192,476 (56.72%)
Note. Compiled from the Academic Excellence Indicator System (AEIS) report produced from Texas Education Agency (2003).
In summary, students that attend U.S. schools come from a variety of ethnic
backgrounds. They also have different backgrounds, some parents are professionals and
some are not. The children of the latter do not do very well in schools, have a higher
dropout rate than other minorities, or are allocated to levels below their age peers
(Valdés, 2003). They are placed in the school’s bilingual programs or Second Language
Programs (ESL). According to Castellano and Díaz (2002) these students run the risk of
never being identified as GT.
Teachers’ failure to recognize students that possess potential for GT programs
adds to the already controversial topic of fair assessment. The need for trained
professionals that can assist these students is crucial. The future of our state and our
nation are in the hands of the school system. Students have an important role in the
future, since they are going to be the leaders of tomorrow (doctors, lawyers, and
scientists), with their individualities and their own originality. Early and proper
identification of such individuals could ensure a nurturing environment that could
promote further development and enhancement in medicine, and science. We need to

19
make certain that this future remains viable and that no expense is spared in the
preparation of individuals that will be productive to our society.
Definitions of Giftedness
The definition of giftedness has been a long debated topic (Irby & Lara-Alecio,
1996; Robinson, 1998; Valdés, 2003; Valencia & Suzuki, 2001). Giftedness has been
defined using several different federal definitions since 1970 (Ford & Grantham, 2003).
These different definitions have affected the method by which minority students have
been identified by U.S. school districts. Despite disagreements defining giftedness, most
of the definitions involve the concept of IQ (Ford & Grantham, 2003).
The latest federal definition stems from the National Excellence: The Case for
Developing America's Talent in 1993. The U.S. Department of Education (1993) defined
gifted and talented as follows:
Children and youth with outstanding talent perform or show the potential for
performing at remarkably high levels of accomplishment when compared with
others of their age, experience, or environment. These children and youth
exhibit high performance capability in intellectual, creative, and/or artistic
areas, possess an unusual leadership capacity, or excel in specific academic
fields. They require services or activities not ordinarily provided by the
schools. Outstanding talents are present in children and youth from all cultural
groups, across all economic strata, and in all areas of human endeavor. (p. 26)
This definition speaks of “talent”, not “intelligence”. The concept of giftedness
has incorporated a new dimension, one that allows students to “nurture” their potential
and to develop it. It also adds the multi cultural background to the definition, opening

20
doors to all students, not just the White middle class pupil. This report produced some
recommendations: to establish challenging curriculum standards, to establish high level
learning opportunities, to ensure access to early childhood education, to expand
opportunities for economically disadvantaged and minority children, to encourage
appropriate teacher training and technical assistance, and to improve math world
performance (US Department of Education,1993).
Valdés (2003) and Robinson (1998) described two main schools of thought
regarding the definition of giftedness: the conservative and the liberal, both co-existing in
the field of GT. The conservative, or traditional sector has a very straightforward
definition and believes that gifted students are those that score in the top 1% on IQ tests.
In other words, this school of thought views intelligence as a synonym of giftedness. This
is a classical approach to the definition of giftedness that dates back to the early twentieth
century (McClellan, 1985) when psychologists used to discriminate between those
students who scored high on IQ tests (labeled geniuses) and those who scored low
(labeled retarded). At the top of the list of conservatives, one can find Terman (Renzulli,
1998) who believed that giftedness equals the top 1 %. Ford and Grantham (2003)
reported that this view of giftedness has closed the doors on the diversity found in
American classrooms. They emphasized that giftedness does not consider the variable of
culture, thus, invalidating results. This conservative view of giftedness is considered the
traditional approach and remained undisputed for several decades (McClellan, 1985).
Changing concepts of giftedness have characterized the second half of twentieth
century. Much debate and criticism has erupted in the field of giftedness and its
identification in recent years. The definition has become more “elastic” to include

21
uniqueness in individuals such as creativity, memory, and motivation that were not
previously included in the traditional concept of giftedness (McClellan, 1985). The
liberal view of giftedness supports a more contemporary, inclusive, contextual
(introducing concepts of time and location) and subjective perspective. It considers the
process of measuring giftedness as complex and problematic (Valdés, 2003) when
compared to the conservative approach. Renzulli (1986), a supporter of this definition of
giftedness, challenged the traditional concept of giftedness and believed that giftedness is
not genetically inherent and that the purpose of GT programs in schools is to provide
students with opportunities to display or to develop their potential. Researchers that
belong to this group include Renzulli, Tannerbaum and Sternberg (Valdés, 2003). These
scholars disagreed with the traditional concept of GT and argued that the concept of
intelligence is difficult to measure, and not as easy as an IQ test. They believed that
giftedness is an invention, not a discovery (Valdés, 2003). These researchers have had an
impact on the definitions of giftedness for many decades adding their contribution and
their studies to the field (McClellan, 1985). Sternberg contributed his triarchic model of
intelligence, Gardner developed his multiple intelligence theory, and Renzulli provided
his Three-Ring Conception of Giftedness (Valdés, 2003).
It is important to keep Renzulli’s definition of giftedness in mind for the purpose
of this study. This definition was addressed in Chapter 1 but it will be reiterated in this
section since the concept of giftedness measured in the HBGSI is based on this specific
definition. Renzulli (1999) supplied a new definition of giftedness, contradictory to his
contemporaries. His definition of GT students indicated that they are those children
having or capable of growing three traits (Renzulli, 1986). The traits referred to include

22
above average ability, task commitment and creativity (the Three-Ring Conception of
Giftedness). This means that individuals do not need to display the 3 traits at once, but
rather be identified as capable of developing any of these characteristics. He presented his
definition in the form of a Venn diagram, conveying the concepts of dynamic, change and
interaction between the 3 components (Renzulli, 1999). These components are
represented in an overlapping arrangement acknowledging the interactions within each
other.
From his Venn diagram, Renzulli (1999) recognized two types of giftedness: (a)
what he called the schoolhouse giftedness, and (b) the creative productive giftedness. He
stated that creative productive giftedness is contextual. This means that it is usually in
association to a specific domain, whereas the schoolhouse giftedness is more stable. He
continued saying that using traditional methods for the identification of giftedness would
have left many aspiring GT students unidentified.
Other definitions of giftedness include the one provided by The Marland Report
(1972), which defined giftedness beyond the exclusive consideration of IQ scores
(Valdés, 2003). The Marland definition of giftedness stated that:
Gifted and talented children are identified by professionally qualified persons
as those who, by virtue of outstanding abilities, are capable of high
performance. These are children who require differentiated educational
programs and services beyond those normally provided by the regular
program in order to realize their contribution to self and society. Children
capable of high performance include those with demonstrated achievement
and/or potential ability in any of the following areas: 1) General intellectual

23
ability; 2) Specific academic aptitude; 3) Creative or productive thinking; 4)
Leadership ability; 5) Visual and performing arts; and 6) Psychomotor ability
(as cited by Castellano & Díaz, 2002).
The Educational Security Act of 1984 defined gifted as a “student, identified by
various measures, who demonstrates actual or potential high performance capability in
the fields of mathematics, science, foreign languages, or computer learning”…”Gifted
students may come from historically under-represented and underserved groups,
including females, minorities, LEP and migrants” (as cited in McClellan, 1985). This
definition approach has an emphasis on different fields and bears a cultural influence.
In summary, there are numerous definitions of giftedness, and these would
warrant a study of its own. However, for the specific purposes of this study, the
researcher opted to follow Valencia and Suzuki ‘s criteria (2001) when they agreed to use
the words gifted and talented indistinctively, with no justification for the distinction.
The HBGSI and the Definition of Giftedness
As mentioned earlier, the HBGSI originated from Renzulli’s (1986) definition of
giftedness (Irby & Lara-Alecio, 2003). Renzulli (1998) expressed that giftedness is
developed or acquired and it is the result of the interaction between a person, the
environment around that person, and specific traits. He also spoke about gifted behaviors
as opposed to gifted children. Renzulli (1999) affirmed that one single measure or one
score can not be used to identify giftedness. He stated, “Persons who have achieved
recognition because of their unique accomplishments and creative contributions possess a
relatively well-defined set of three interlocking clusters of traits. These clusters consist of
above average, though not necessarily superior, ability, task commitment, and creativity”

24
(Renzulli, 1998). This definition incorporates three characteristics desirable in gifted
individuals: above average ability (not necessarily high or talent in lesson learning or
cognitive aspect), task commitment (motivation, determination, hard work, dedicated
practice, self-assurance) and creativity (solving problems techniques or developing
original ideas) (Sherman, 1997). Individuals who manifest these characteristics and
develop an interaction among them, should be provided with a broad array of educational
opportunities and programs to nurture that potential and develop it (Valdés, 2003). The
traditional IQ concept of intelligence is, with this definition, enhanced with other
characteristics (ability, task commitment and creativity), giving the HBGSI a broader
audience to target, and a more objective identification process.
The HBGSI has borrowed the definition of giftedness from Renzulli and added a
fourth characteristic to Renzulli’s concept of giftedness (Lara-Alecio & Irby, 1993).
According to Lara-Alecio & Irby (1993) a socio-cultural-linguistic aspect is added to
complement the other three characteristics. This fourth element is all encompassing and
surrounds the other three traits.
Renzulli (1999) explained the purpose behind the identification of GT students.
He gave two reasons: to provide students opportunities for cognitive development and to
allow students to become thinkers and problem solvers. He tied these purposes very
closely together giving examples of scientists and artists that produce talented work and
at the same time, provide benefits to society. Valencia and Suzuki (2001) stated that the
Three-Ring Conception of Giftedness (Renzulli, 1986, 1998) provides hope for better
identification of minority in GT programs.

25
The HBGSI follows an inclusionary perspective of the definition of giftedness
(Irby & Lara-Alecio, 1996). This means that the foundation of the HBGSI was based on
the idea that all students have the potential to be talented, if that potential is nurtured
accordingly. This definition “includes” rather than “excludes” those students that have a
potential to be identified as GT.
Relevant Studies on Hispanic Gifted and Talented Identification
The subject of screening and identification of minority students into GT programs
has seen few large-scale reports (Ford & Grantham, 2003). Sherman (1997) and Valdés
(2003) recognized two major national studies that addressed gifted education funded by
the U.S. Department of Education. The first study took place in 1972 (The Marland
Report) and the second one in 1993 (National Excellence: The Case for Developing
America's Talent, 1993).
The Marland Report was the first national in-depth study that focused on
America's brightest students and the schooling they received. It made public the absence
of minority and disadvantaged children in many gifted programs. One of the most
alarming revelations of the report was that 60 % of schools polled had no gifted minority
pupils (Sherman, 1997).
The Marland Report intended to broaden the concept of giftedness to try to
embrace a larger number of students targeting those who lay beyond the IQ cut-off scores
(Valdés, 2003). Thus, the definition of giftedness was expanded to include “those
identified by professionally qualified persons who, by virtue of outstanding abilities, are
capable of high performance” (Public Law 91-230, Section 806(c). This definition
intended to include areas such as intellectual ability, academic aptitude, creative or

26
productive thinking, leadership ability, visual and performing arts, and psychomotor
ability (Valdés, 2003). Unfortunately, very seldom did schools follow this inclusive
concept of giftedness but, instead, they resorted to IQ measures to define and evaluate
giftedness in students (Valdés, 2003) making no apparent change to the composition of
the GT programs across the nation.
The second largest report was published in 1993 was entitled National
Excellence: The Case for Developing America's Talent. This report confirmed the
unchanged situation and the conservative approach that schools and districts had
preserved in spite of growing evidence supporting different contemporary theories of
intelligence (Valdés, 2003). The 1993 report stated that schools had followed The
Marland Report from a technical perspective but not in reality. The same results that were
previously disclosed 20 years earlier were again brought forth to disclose the reality in
the schools: not an equal representation of minority students in gifted and talented
programs because the traditional methods of finding gifted students tended to favor
certain ethnic groups (Sherman, 1997). This report emphasized that talented students
were not exclusive to one ethnic group or a culture, but that they existed in all areas and
economic dimensions. It set forth several initiatives such as teacher development,
challenging curriculum, broadening the definition of giftedness, and increasing learning
opportunities for minority children. It continued expressing the need for a more accurate
identification of minority children with special talents. Additionally, the report focused
on the importance of a variety of assessment measures, and the identification of potential
talented students. This report recommended the practice of a challenging curriculum, the
students’ pursuit of high expectations, the increase in learning opportunities to match the
27
diversity in the classroom demographic, and the U.S. performance superiority above any
other nation in the globe (National Excellence: The Case for Developing America's
Talent, 1993).
Additional national studies were found that support the findings described in
earlier paragraphs. All of these reports provide evidence of minority under-representation
in GT programs. Landrum, Katsiyannis, and DeWaard (1998) conducted a national
survey intended to report state level policy for gifted students and to detect state efforts
after the National Excellence report (1993). Surveys were mailed to all 50 state
coordinators of gifted education. Forty-two individuals responded to the survey. Findings
from this survey indicated that some change was implemented toward the areas of teacher
preparation and challenging curriculum standards for gifted students. Most states either
offered teacher certification programs or other programs focused on the nature and needs,
assessment and identification, and affective needs of the gifted student. Approximately
half of the states reported having raised the standards of the curriculum for gifted
students. However, several of the other initiatives remained unchanged. Only one-fourth
of the 42 states participating in this survey indicated efforts to address matching world
performance by making gifted students globally competitive. Other findings included the
representation of minority students in GT programs ranging from 1% to 5% across the
states, blaming the lack of adequate assessment instruments as the result for the under-
representation (as cited in Castellano & Díaz, 2002). Among the recommendations posed
by the researchers, they encouraged states to provide certification and endorsement
policies for teachers of gifted students, and, recognizing the under-representation of

28
certain ethnic groups in GT programs, to continue the search for instruments that could
properly identify minority students for such programs.
In 1988 the National Center for Education Statistics began a series of data
collection as part of a longitudinal study that lasted until 2000. In this study, eight grade
students from different locations across the U.S participated in this study and were
followed at four different occasions (1990, 1992, 1994 and 2000). This study found an
astonishing low representation of certain minority groups in GT programs. Results
revealed that less than 9% of all students participated in GT programs. Percentages such
as 6.7 % of Hispanic students compared to 17.6 % of Asian students that were
represented in GT programs (Cantu, 1998; Sherman, 1997).
Other studies were reported concerning the identification techniques used in the
screening process of language minority students applying to enter GT program. A recent
study by Naglieri and Ford (2003) examined the identification of minority students as
gifted when using a nonverbal test, the Naglieri Nonverbal Ability Test (NNAT). Since
the NNAT is a test that does not require the participant to read, write or speak, it is
considered to be culture-free. This study included over 20,000 participants with a large
percentage of White students. Results revealed that there was no major difference in the
mean scores earned by White or Hispanic students. That is, this study found that White
and language minority students scored very similarly suggesting that there were no
significant differences in the mean scores. Among the conclusions, the researchers
hypothesized that if the NNAT were used for identification of GT students, there would
not be an under-representation of minority students in GT programs.

29
Cooper (2000) expressed her concerns about the under-representation of minority
students in GT programs and advocated that traditional methods of identification have
left the GT programs homogeneous in their demographic characteristics. As a result, she
developed a new model to help teachers identify language minority gifted students using
a non-traditional approach. Her model included the development of creative strategies
and the demystification of language as a barrier. Her concept emerged from a
constructivist type classroom together with a rapidly taught academic content and the
identification of GT among language minority students. Some of the strategies mentioned
were brainstorming, synectics, and productive thinking. She developed the Classroom
Observation Instrument for the identification of gifted minority students. This tool
requires teachers to complete a checklist indicating whether the student has demonstrated
or displayed certain characteristics called indicators. These indicators include the
following: whether the student adds details, compares ideas or objects, demonstrates
unexpected use of dimension, and puts new twist on ideas. This checklist was expected to
be piloted soon and no results have been reported to date (Cooper, 2000).
Cantu (1998) described many of the predicaments and difficulties teachers and
administrators encounter when trying to identify GT among minority students. She
described the low participation of Hispanic students in GT programs in Texas during
1997-98 school year, only a 24% of Hispanic students in GT programs compared to a
62% white population. She pointed out that bilingualism has been regarded as a handicap
needing improvement instead of a gift that could flourish with enhancement. She also
focused on the improper use of IQ measures that promote a higher gap between the
representations of different ethnic groups in GT programs in Texas.

30
Bermúdez and Márquez (1998) detailed some of the reasons for the under-
representation of English Language Learners in GT programs. These include the typical
bias characteristics of standardized measures, teachers’ lack of cultural awareness, lack of
teachers’ training in the field, and single score indicators of giftedness. They proposed
certain strategies to combat inaccurate identification of minority GT students, such as
multiple identification procedures using observation, parental nomination, portfolio
assessment, and proper judgment of cultural behavior of the child. These researchers
spoke of students as “victims” of the educational system that needs to be remedied to
satisfy the growing diverse population in society.
Jean (1996) reported that nomination has not been a very successful method for
screening minority GT students. This type of selection involves teachers identifying
candidates for the GT program. The inconsistency of this type of selection stems from the
teachers’ limited expectations. However, in a study conducted by Cunningham, Callahan,
& Plucker (1998), concerned about the misrepresentation of Hispanics in GT programs,
the reliability and validity of the Peer Referral Form (Udall, 1987) was investigated. This
screening tool was designed to be used in the identification of minority GT students. This
study included 670 participants in 4th through 6th grade from three school districts with
large Hispanic population in the states of Texas and Arizona. Test-retest reliability and
construct validity were calculated for the instrument. Researchers found reliability
coefficients of stability ranging from .79 to .85. Construct validity was supported by
factor analysis with oblique rotation. This instrument was suggested for teachers or
program coordinators seeking alterative assessment instruments to identify Hispanic GT
students. However, caution was recommended in their conclusions when using this

31
instrument, since it could not be generalized to other minority populations in other
geographical settings.
Arising from the controversial topic of teachers’ perceptions of students, Plata,
Masten, and Trusty (1999) studied the teacher nomination of minority GT students
screening process and teacher perception. Since teachers perform a vital role in the
nomination of GT students, Plata, Masten and Trusty (1999) expressed the critical need
to know the teachers’ perceptions of Hispanic students. They studied 220 participants
(106 Hispanic and 114 Anglo) in 5th grade. Teachers were asked to rate their students
using the Scales for Rating the Behavioral Characteristics of Superior Students
(SRBCSS) (Renzulli, Hartman, & Callahan, 1971). After a Chi square analysis, results
showed that teachers nominated as much as three times more Anglos than Hispanic
students to GT programs. According to the SRBCSS scale, results indicated that mean
ratings for Hispanic students were lower than for Anglos. Regression analysis was
performed to answer the question of nomination/non-nomination due to ethnicity. Results
showed a nomination conditional to ethnicity.
In a similar study, Masten, Plata, Wenglar, and Thedford (1999) expanded
previous findings and investigated the differences between Hispanic and Anglo students
according to GT nomination, using the SRBCSS, in addition to the acculturation rating
scale Children’s Hispanic Background Scale (CHBS) (Martinez, Norman, & Delaney,
1984). This study included 274 participants in a middle school. ANOVA analysis
determined ethnic group differences on teacher ratings and it indicated that Anglo
students were rated higher than Hispanic according to the first assessment tool used.
Therefore, researchers concluded that teachers’ attitudes toward Hispanic students

32
affected and influenced teachers’ judgment. For the second part of this study, students
were asked to complete the CHBS. Results showed that Hispanic students have a higher
likelihood of being nominated to GT programs the higher their score in the acculturation
scale. This study recommended further investigation of variables, such as acculturation,
to make accurate decisions in the nomination process of Hispanic GT students.
Sarauphim (2002) investigated the identification of Hispanic and Native
American students using the DISCOVER assessment tool as a promising alternative
solution to the under-representation of minorities in GT programs. She stressed the rise of
authentic assessment as a replacement of standardized tests. Her study consisted of 300
9th graders in Arizona, majority Hispanic, followed along 4 consecutive years. The
DISCOVER tool has been identified as a culturally sensitive test designed to measure
spatial artistic, linguistic, logical-mathematical and interpersonal intelligences
(Sarauphim, 2002). Inter-rating correlations were found to be very low (the highest was r
= .59 and the lowest was r = .19). Another finding revealed that there were no differences
in scores between gender and ethnicity in the study. Still another finding showed that the
use of the DISCOVER assessment could increase the proportion of minorities in GT
programs since this study showed almost 30% of the participants as eligible for the
advanced program.
Donovan and Cross (2002) reported the results from the 1998 Office of Civil
rights (OCR) National Research Council’s Committee Survey. One of the results
indicated a considerable improvement from the survey in 1976. The latter showed a 1%
of all students participating in GT programs, whereas in 1998 the number increased to
6%.

33
Additional data revealed the placement rate for Hispanic students in GT programs was
50% lower than the Anglo student. In other words, Anglo students were twice more likely
to be placed in GT programs than minority ethnic groups, excluding Asian American. In
spite of the observable increase in the rate of participation in GT programs, the increase
was not representative of the population numbers.
Scott, Deuel, Jean-Francois and Urbano (1996) conducted a study with the
purpose of examining potential GT students through the assessment of cognitive abilities.
Over 400 multi-ethnic-kindergarten students participated in this study, some already
identified as gifted by the school. A nine battery cognitive instrument was administered,
some of the batteries were non-verbal. Tasks included picture pointing, picture
recognition, word meaning, animal and dot sequencing, rhyming, among others. Students
were tested in English or Spanish, according to the information provided by the teachers
based on the child’s language abilities. This study used a sample of high IQ children
already identified as gifted as the criterion reference group. Results showed that seven out
of the eight scores in the top 2% were achieved by minority students. These students
scored in the same range as the White mainstream gifted student did. Researchers were
satisfied with the results of this study and encouraged further study using non-verbal
cognitive measures based on simple everyday objects for students to identify.
Plucker, Callahan and Tomchin (1996), influenced by Gardner’s (1983) Multiple
Intelligences theory, investigated the reliability and validity properties of the Multiple
Intelligences Assessment Technique, developed by combined efforts from Project
Spectrum at Harvard and the University of Arizona. The sample size consisted of 1,813
students in kindergarten and 1st grade level. The technique included measures from

34
teacher ratings and observations, checklists, and performance based activities. Students
were also administered the Iowa Test of Basic Skills (ITBS) to obtain evidence of
concurrent validity. Results showed Cronbach’s Alpha reliability coefficient to range
from .72 to .87 showing a satisfactory coefficient of internal consistency. Factor analysis
also was performed. Principal factor extraction with Varimax rotation was done.
Outcomes supported the presence of 4 intelligences that the battery of activities
measured, confirming the presence of subscales. Construct validity was also investigated.
No significant coefficients were observed. Researchers concluded that alternative
assessment tools present a challenge to test developers to provide evidence of construct
validity. They ultimately questioned the accuracy and veracity of establishing traditional
validity and reliability coefficients on non-traditional assessment tools.
Reyes, Fletcher & Paez (1996) presented the results from a project that took place
on the New-Mexico-Mexico-Texas border. This project included 2,000 students of which
97% were of Hispanic background kindergarten through 6th grade in two rural elementary
schools. The goal of the project was to increase the number of Hispanic students in GT
programs. In order to achieve this goal, committees were formed including parents,
school faculty, and project staff. One of the first tasks was to develop a cultural-sensitive
definition of giftedness using Gardner’s (1983) definition of Multiple Intelligences. After
several meetings and debates, consensus reached the following characteristics desirable
in gifted students: curiosity, problem solving skills, leadership, creativity, verbal skills,
ability to learn another language, and good memory among others. Forms were developed
that included the agreed characteristics and were completed by teachers, parents and
community contacts. Additionally, portfolios, students’ records, writing samples, and the

35
Torrence Test of Creativity Thinking and the Matrix Analogies Test were used in the
identification criteria for GT students. This report did not include any empirical data that
would confirm the inclusion of a larger number of Hispanic in GT programs. However, it
revealed similar profiles of students identified by traditional and those identified by non-
traditional methods.
Coleman and Gallagher (1995) conducted a study to examine the under-
representation of minorities in the entire U. S. and followed up in a second study with
some case studies in Ohio, Arkansas and Texas regarding policy making. They also
investigated state policies in the three states. Results from the first study showed that 41
out of 50 states had made specific mention to the inclusion of potential for giftedness
from special populations. Regarding screening methods, forty-four states acknowledged
having policies that contained provisions for the screening of potential GT students,
forty-six states mentioned using teacher nomination as the most frequently used method
of screening, in addition to standardized achievement and aptitude tests and parent
nomination, and forty-four states used students’ work samples as a screening method.
However, forty-nine states recognized intelligence and achievement as the primary areas
for gifted identification. Nevertheless, the majority of the states allowed for other
methods of GT identification such as work samples, creativity tests, input from teachers,
checklists and profiles. Regardless of the steps and efforts that states have made to
promote diversity in GT programs, Coleman and Gallagher (1995) were not able to
provide an accurate answer to the question of under-representation of minority students in
GT programs.

36
Bermúdez and Rakow (1990) conducted a very significant study in the field of
minority GT identification. Their study included 500 mail-out surveys to school districts
in Texas, California, Arizona, Colorado and Florida, which are the top states with a
majority minority demographic. Two hundred sixty eight school personnel responded to
the survey and provided the following results: 18% of the participants responded that
they have elaborated a way to identify minority language GT students, over 75% of the
respondents recognized the importance of alternative ways of assessing language
minority students, 70% responded that they were using multiple assessment criteria to
identify GT among culturally diverse students, 32% answered that their method of
identification was successful, and 8% admitted having a specialized programs for
minority language GT students. According to the researchers, these numbers do not seem
to satisfy the number of Hispanic students in the states where the study took place.
Scott, Perou, Urbano, Hogan and Gold (1992) studied the role played by White,
Hispanic and Black parents in the GT process of referral. They found differences in the
parents’ perceptions of potential GT students. Their research consisted in 600 mail-out-
surveys to parents of White, Hispanic and Black children in 3rd, 4th, and 5th grade in
Florida. Results showed that there was a high level of awareness among all parents of
their child’s giftedness. Thee next finding revealed that a much larger proportion of
White parents requested GT evaluation for their children when compared to the other two
ethnic groups. A third finding in this study was the parent-generated descriptors of the
characteristics typical in GT students. Over 200 descriptors were produced from the data
collected, however, there was much similarity and overlap among the three ethnic groups.
Several categories were identified: attention, learning and performance, memory,

37
language and communication, social and interpersonal, academic performance, motor
performance, talented, and idiosyncratic. In their conclusions, the researchers advocated
for a culture-free test that would address the characteristics they had identified.
Another study (Tallent-Runnels, & Martin, 1992) examined the Screening
Assessment for Gifted Elementary Students (SAGES)(Johnsen & Corn, 1987).
Participants in this study were students in 3rd to 5th grade (122 White and 41 Mexican
children) in a school district in Texas. All of the participants had been identified for GT
programs. The purpose of their study was to explore whether the SAGES scale was
unbiased or neutral regarding ethnicity. Results supported the hypothesis posed by the
researchers and a second sample validated the first study. This means that the SAGES
scale failed to predict ethnic group association.
In summary, Castellano and Díaz (2002) expressed that in today’s schools, there
seems to be a more agreeable view of GT programs receptive of minority students.
Research concerning Hispanic gifted students is limited and few empirical studies have
been conducted (Valencia & Suzuki, 2001). Needless to say, the problem of minority
under-representation in GT programs still persists and remains constant. In spite of this
trend, research has shown a few promising instruments that could help change the under-
identification of minority ethnic groups in GT programs. Other research focused on
alternative methods to assess these students, such as portfolios, checklists, nomination,
and observation. These methods seem to be more flexible, inclusive and unbiased
offering a more accurate and fair way to assess culturally and linguistically diverse
students.

38
Reasons for the Under-representation of Minority Students in GT Programs
Irby and Lara-Alecio (1996) have enumerated several reasons for the
misrepresentation of minority students in GT programs: (a) lack of cultural sensitivity by
educators and administrators; (b) standardized tests that are biased; and (c) the use of a
single measure to identify GT students. Sherman (1997) mentioned selective referral as
another reason for the under-representation.
There is a tendency that traditional methods for the identification of GT students
favor certain ethnic groups (Sherman, 1997). Traditional assessment methods vouch for a
single standardized test (IQ tests and achievement tests) and exclude a great number of
language minority students that possess diverse talents (Cantú, 1998). These IQ and
achievement tests are normally written by white middle class developers having in mind
white middle class students as test-takers (Castellano & Díaz, 2002; Sherman, 1997).
Standardized IQ tests have long been blamed for being unfair to minority students
(Sherman, 1997). This seems to “penalize” minority students from accessing GT
programs (Cantú, 1998).
As explained by Castellano and Díaz (2002), certain educational practices favor
an exclusionary method to identify GT students. These practices are responsible for
excluding many minority students with gifted potential from GT programs. They include:
elitist conception of giftedness, inaccurate referrals, the inappropriate use of screening
instruments, unequal educational opportunities, and low students expectations. These
researchers emphasize that the definition of giftedness is selective of a few students and
discriminatory.
39
Marin and Marin (1991) emphasized the importance of using cultural appropriate
instruments with language minority students. According to these researchers, cultural
appropriate indicates more than a mere translation of a standardized instrument. They
believed that an immersion in the minority culture of the ethnic group being studied was
necessary for the researcher to grasp the culture concept. They also stressed the need to
develop new instruments and not to translate already established ones. They suggested
the following psychometric properties to be considered when assessing Hispanic
children: factor analysis, reliability and validity.
In summary, the multiple-assessment process appears to be a valid solution to this
problem. Irby, Hernandez, Torres and Gonzales (1997) recommended the use of non-
verbal, non-traditional, linguistic and cultural sensitive instruments to assess language
minority students. Bermúdez and Márquez (1998) indicated that it is the responsibility of
teachers to establish and promote a multiple source of assessment including record
keeping of formal and informal samples of their students’ work, as well as observation
and collection of background data for each student. In addition to all these, Cantu (1998)
recommended the use of different assessment tools that cover a wide range of areas
(music, art, language, etc.). Warger and Burnette (2000) suggested the encouragement of
family involvement, parent support group, simultaneous respect for the students’ family
background, developing curriculum relevant to students and building on their strengths.
Identification of Giftedness among Minority Students in Texas
Texas has established several principles for the identification of minority GT
students (Irby, Lara-Alecio, & Rodriguez, 2003a). These principles, approved by the
school board, help determine the accepted definition of a GT student and the proper

40
identification process of these students for the district. The identification stage requires at
least five sources or criteria (objective and subjective measures) and it is subject to
ongoing check ups for students transferring, exiting or entering the GT program.
Once GT students are identified, Section 3.1A of the Texas State Plan for the
Education of Gifted/Talented Students states that “school districts shall provide an array
of appropriately challenging learning experiences for gifted/talented students in grades 1
through 12 that emphasize content from the core academic areas.” Further, according to
state guidelines, curriculum and instruction for gifted students must be addressed by
“modifying the depth, complexity, and pacing of the general school program.” (Texas
Association for the Gifted and Talented, n.d.).
In other words, in Texas, advanced level services are mandatory for students
identified as GT in K- 12th grade (Texas Education Agency, 1999). Among Texas
requirements for GT eligibility are the following: (a) three appropriate criteria
(qualitative and quantitative) are required for students 1 through 12th grade, (b) students
are assessed in their native language or with non-verbal based tests, (c) K through 12th
grades are assessed using measures collected from multiple sources for each area of
giftedness served by the district, and (d) teachers who provide instruction and services
that are a part of the program for gifted students have a minimum of 30 clock hours of
staff development that includes nature and needs of GT students, assessing student needs,
and curriculum and instruction for gifted students and 6 hours of compulsory continuous
education annually (Texas Education Agency, 1999). Students once identified as GT are
provided the appropriate services.

41
The district where my study took place followed the TEA criteria identified in the
previous paragraph. The identification process of GT students grades K through 2nd
followed these steps: (a) three planned activities portfolio, (b) Ravens Nonverbal Test of
Intelligence, and (c) Slocumb-Payne Teacher Perception Inventory. Students that attend
second grade or beyond are administered the ITBS (Iowa Test of Basic Skills) as a
measure that contributes to the GT identification process.
Psychological Testing, Social and Educational Developments
in the Twentieth Century in U.S. Schools Affecting Minority Language Students
Social, historical, political, legal and economical circumstances have shaped the
assessment procedures for minority language students adopted by school districts in the
U.S. (Valencia & Suzuki, 2001). The following is a brief chronological description of the
major landmarks that molded the assessment of minority language students, especially in
GT programs.
Sir Frances Galton, half cousin of Charles Darwin, is considered responsible for
launching the psychological testing movement in Europe in the late nineteenth century
(Valencia & Suzuki, 2001). His book Hereditary Genius: An Inquiry Into Its Laws and
consequences (1870) expressed his belief in genetic determinism.
Alfred Binet fueled the field of testing in the early 1900’s. He developed the first
cognitive measure in 1905 (Valencia & Suzuki, 2001). This test was designed to predict
between high academic achievers and those students that would fail in school (Anastasi
& Urbina, 1997). This is said to be the earliest sign of interest in the identification of GT
students worldwide (Valdés, 2003).

42
The origins of the word “gifted” can be traced back to Passow (1981). He stated
that the word was coined by Guy Whipple in 1920 when he was referring to those
students that were “highly intelligent” (as cited in Castellano & Díaz, 2002).
Once in the U. S., Binet’s test was translated into English and standardized by
Lewis Terman. The standardization sample was deliberately White and it was not until
1972 revision when minorities were included in the sample (Valencia & Suzuki, 2001).
Terman is responsible for a massive research study on GT students in California. He
studied almost 250,000 but his GT sample was less than 1,000 (as cited in Valencia &
Suzuki, 2001).
According to Castellano and Díaz (2002), by the 1920’s and 30’s, Binet’s test
was modified and adopted by U.S. schools, under the name Stanford Binet Test. Results
from this single measure considered intelligence to be a verbal component ignoring the
creative and artistic talents. During this time, the U.S. experienced an immigration influx
and the number of minority students increased in the public schools (Tyack, 1974).
When implemented in U.S. schools, a considerably large majority of immigrants scored
low or failed the test, which helped confirm the genetic theory of intelligence. This led to
the belief that immigrants were not going to be able to score any higher, and therefore,
the need to educate them was unfitting since they were not going to help in the
improvement of this country (Castellano & Díaz, 2002).
Beliefs sprang up that speaking a second language could only bring about
confusion and interfere with students’ cognitive development. Consequently, an anti-
immigrant attitude fueled and ended in the decay of non-English instruction, which had
been present in U.S. schools for a few decades. Regrettably, those individuals that scored

43
low in the IQ tests due to a lack of English proficiency, were labeled as having a low
mental ability and submersion and assimilation into classes where English was the only
language spoken was regarded as the correct path to adopt (Castellano & Díaz, 2002).
By the time the United States entered World War I, intelligence tests were
developed and used as a group testing strategy with the purpose of grouping individuals
according to their homogeneity. Group testing yielded many benefits, such as the
availability to target a large number of individuals at once, simplify administration, and
provide minimum examiner training (Anastasi & Urbina, 1997). However, these tests
were sometimes used inappropriately and their results ignored the cultural and language
barrier. Needless to say, immigrants scored low in these test and most of them failed.
Results from these tests – Army Alpha and Army Beta - developed for military purposes,
encouraged Congressmen and politicians to restrict immigration to the US by the
imposition of The Restriction Act of 1924 (Tyack, 1974). Immediately after the
introduction of the Army Alpha and Army Beta into the army, educational settings
starting bombarding school settings with revised versions of those tests under the name
National Intelligence Test. Norming on these tests were exclusively White students
(Valencia & Suzuki, 2001). During the1930’s, intelligence tests were widely used and
accepted. Results placed students in groups according to their mental ability (Mclean,
1995).
Conclusions drawn from this test were alarming. In 1922, a superintendent in
Arizona, disturbed at his students’ poor performance and inability to learn, contracted a
Stanford assessment evaluator to assess the situation in his district. The evaluator
erroneously concluded that the low scores were the result of a 50% Mexican population
44
that genetically could not produce high scores (Mclean, 1995). Similarly, race
psychologists such as Garth, from the University of Texas, noted the mental supremacy
of the white race (Valencia & Suzuki, 2001).
Regarding gifted education, in 1926, Hollingworth, from Columbia University,
published one of the first books on gifted education Gifted Children: Their Nature and
Nurture. Many centers were named after her work and after her research in the field
(History of Gifted Education).
By the 1940’s, public school administrators drew their attention to the fact that
standardized group testing was not addressing the diversity of the student population,
consequently, creating problems. Test developers started to properly address and make
accommodations to the influence of culture and language on individuals and tried to
design culture-free tests. Researchers started looking for common denominators and
symbols among cultures and socio-economic levels, in an effort to neutralize cultural
factors (Mclean, 1995).
After World War II, events outside the US called for a change in domestic
educational policy. Russia launched the satellite Sputnik into orbit that left an impression
that U.S. was falling behind Russia, which was not a palatable experience (Valdés, 2003).
Consequently, Americans directed their attention to the development of programs that
focused on Math and Science, indirectly affecting gifted education. This, together with
the social, political and judicial movement toward to the problem of cultural
discrimination, (Civil Rights Movement) helped change the traditional way of viewing
GT students (Castellano & Díaz, 2002).

45
In 1954, the case of Brown vs. Board of Education of Topeka was a major
breakthrough in the history of multicultural education in the U.S. The major implication
derived from this case was equal opportunity for all students regardless of their ethnic
background (Mclean, 1995).
In the 1950’s, the concept of creativity became more popular and several
programs intended to identify and cultivate talent and creativity were developed and
flourished. The cutoff level for entry into GT programs previously set at the top 1% was
expanded to include the top 10 or 15% (Castellano & Díaz, 2002). However, these
programs were shortlived until 1970 when legislation came to aid GT education
(Castellano & Díaz, 2002; Valdés, 2003). Still, by the end of the first half of the century,
giftedness was still being assessed with IQ scores (Castellano & Díaz, 2002).
During the 60’s and 70’s, minority groups achieved important victories,
legislatively speaking, where they demanded equity and excellence in U.S. schools
(Castellano & Díaz, 2002). A landmark event in the history of the U.S. took place when
Title VI of the Civil Rights Act of 1964 was enforced prohibiting discrimination on the
grounds of race, color, or nation of origin in any federally funded program (Mclean,
1995). By then, the concept of creativity had invaded the field of gifted education adding
a liberal connotation to the definition of giftedness. In the legal arena, in 1968, The
Bilingual Education Act was passed providing funds for programs for students with
limited English proficiency, teacher training, and parental involvement (Castellano &
Díaz, 2002).
Giftedness found several changes in its field in the decade of the 60’s.
Developments such as Bloom’s taxonomy and Torrance Tests of Creativity are among

46
the most important landmarks in the field of giftedness. The terms “brainstorm” and
“divergent thinking” were coined, and the Marland Report was issued (History of Gifted
Education). The Marland Report consisted of the acceptance of a multitude of talents
being lost “through the cracks” of the inadequate system of education. This report defined
the word “gifted and talented children”, which became very popular and was adopted by
many school districts in the U.S.. It also provided funds for the development and
implementation of GT programs (Castellano & Díaz, 2003).
The 1970’s were characterized by prominent court cases that affected the
assessment of culturally and linguistically diverse students in the U.S. The case of Diana
vs. California State Board of Education represented one of the many milestones in the
history of bilingual assessment (Mclean, 1995). The court ruled in favor of testing
students in their primary language and the use of non-verbal assessment tools for those
individuals not able to communicate their understanding of targeted concepts. In 1974,
Lau vs. Nichols, a class action lawsuit, presented a very similar scenario, addressing
Chinese students. The U.S. Supreme Court found that a school district in California had
violated Title VI of the 1968 regulations (Castellano & Díaz, 2002). The ruling gave
strength to the equal opportunity movement for immigrants and demanded that schools
offer education for all students, regardless of their native language (Mclean, 1995).
Shortly after this legal confrontation, the Bilingual Education Act of 1974 was passed
expanding eligibility to more students from lower socio-economic levels, including
Native American children, and providing additional funding (Castellano & Díaz, 2002).
During this same year, the National Office of the Gifted and Talented was established.

47
By the 80’s, reports such as A Nation at Risk: The Imperative for Educational
Reform (National Commission on Excellence in Education, 1983) declared that the U.S.
education was unsuccessful. Thus, education became a top priority and standards and
testing were emphasized (Castellano & Díaz, 2002). A controversial atmosphere of anti-
multiculturalism sprouted blaming the results of the 1983 report on the democratic efforts
for equality of the past decades (Castellano & Díaz, 2002). In spite of this negativism
toward multiculturalism, the Bilingual Education Act of 1984 is considered to be the first
law to provide funds for GT programs for language minority students. In 1988, the Jacob
K. Javits Gifted and Talented Students Education Act provided additional funds toward
the research and identification of language minority students (Castellano & Díaz, 2002).
During the 80’s, Renzulli (1986) developed the concept of the three interlocking
rings of giftedness: above average ability, task commitment and creativity (Irby & Lara-
Alecio, 1996). This definition focuses on a dynamic and interactive approach to
giftedness, including the environment as a necessary component (as cited in Castellano &
Díaz, 2002). Other theories and views of intelligence sprang during this decade, such as
Gagne (1985), Sternberg’s triarchic theory (1985), and Gardner’s seven intelligences
(1983) (as cited in Castellano & Díaz, 2002).
Herrnstein and Murray (1994) revived the genetic deterministic theory of
intelligence in their book The Bell Curve: Intelligence and Class Structure in American
Life (as cited in Valencia & Suzuki, 2001). This publication spurred heated debates and
much controversy.
An anti-immigrant policy persisted throughout the 90’s as the U.S. Congress
approved laws that would increase the control of borders in California and Texas and
48
illegal immigration filtering through this channel (Castellano & Díaz, 2002). Several Acts
were introduced during this decade: the Bilingual Education Act of 1994 and 1999
authorizing funds for the implementation and development of bilingual programs, and the
Jacob K. Javits Gifted and Talented Students Education Act of 1994 as well as the Gifted
and Talented Children Act of 1999 which provided additional funds for projects, training
and research for GT programs. Castellano and Díaz (2002) explained that the later also
recognized the under-representation of language minority students in GT programs.

49
CHAPTER III
METHODOLOGY
This chapter describes the methodology used in this study. It focuses on the
setting, participants, procedures, data collection, instrumentation and data analysis.
Setting and Participants
Hispanic bilingual participants for this study were selected from a population of
students attending two schools in Bryan ISD, Texas. Five hundred twenty seven Hispanic
bilingual students participated in the first part of this study, whereas only 75 students
participated in the analysis of the last research question of this study. All these students
were enrolled in K through 4th grade level in dual language and bilingual classroom
programs in May 2003. They were males and females approximately 6-11 years old, all
of Hispanic background. This required the purposeful selection of the schools which will
be referred to as School # 1 and # 2 for the purpose of this study. School # 1 houses Pre-
K through 2nd grade. School # 2 houses 3rd through 5th grade. Criteria for the selection of
the elementary schools were as follows: elementary schools with a large concentration of
Hispanic students in bilingual programs, and HBGSI already implemented.
According to the Texas Education Agency, school #1 and # 2 were rated as
acceptable in the 2001-2002 Academic Excellence Indicator System (AEIS). School # 1
had an attendance rate of 96.7% and School # 2 reported a 95.4% attendance rate
compared to a 95.5% average state rate. School # 1 enrolled a total of 540 students
ranging from Pre K through 2nd grade and School # 2 enrolled 493 students from 3rd to 5th
grade levels. Both of these schools offer bilingual and mainstream classrooms. Only dual

50
language and bilingual classrooms were selected for this particular study. The following
tables summarize the student ethnic distribution of School #1 and # 2.
Table 4
Student Ethnic Distribution for School # 1 and #2
Students School # 1 (n=540) School # 2 (n=493)
Hispanic 69.4% 68.8%
African American 24.8% 27.6%
White 5.7% 3.7%
Note. From Texas Education Agency’s website report 2001-2002, http://www.tea.state.tx.us/perfreport/aeis/
Table 4 shows a very large percentage of Hispanic students (almost 70%)
attending both schools compared to a relatively small White student representation (less
than 6%) and an African American composition of approximately 25%. Unlike the
student demographic characteristics in these schools, staff and teachers do not seem to be
proportionally equaled. This inconsistency is reflected in the next table.

51
Table 5
Ethnic Distribution of Teachers for School # 1 and #2
Teachers School # 1 (n=69) School # 2 (n=55)
Hispanic 25% 27.2%
African American 4.8% 8.1%
White 70.2% 64.7%
Note. From Texas Education Agency’s website report 2001-2002, http://www.tea.state.tx.us/perfreport/aeis/
These two tables show a distinct disproportional ethnic representation of teachers
and students in School # 1 and # 2. There is a very high concentration of Hispanic
students (almost 70%) compared to White (4%) in contrast to the relatively high
percentage of White teachers (70.2%) compared to a low 25% for Hispanic teachers. This
is an evident inequity of student-teacher ratio when considering their ethnic background.
Additionally, School # 1 was comprised of 92.6% female teachers and School # 2 had
89% female teachers.
Procedures
I targeted Hispanic bilingual students attending two elementary schools in Bryan
ISD with the purpose of investigating the following psychometric properties of the
HBGSI: reliability and concurrent validity. Data collection procedure included several
steps.
First step was the collection of the data from the HBGSI. The HBGSI had been
administered in May 2003 to all students in both elementary schools students enrolled in
52
bilingual classes. Teachers had been trained in the administration procedure of the
HBGSI which followed a stratified method of dissemination: a few teachers volunteered
to be trainers to others. Trainers attended a two-hour training session on the
implementation of the HBGSI. After the session they disseminated the information to the
other bilingual teachers on campus.
I requested access to the data already collected by the schools on the HBGSI. The
data were analyzed to provide a reliability coefficient (Research Question 1) and factor
analyzed to explore the underlying factors existing in the HBGSI (Research Question 2).
The second part of this study (Research Question 3) concentrated on the
correlation of the HBGSI with the BVAT. In order to correlate these two instruments,
raw scores were converted into standard scores with the assistance of SPSS 11.5. I
accessed the data and scores from the administration of the HBGSI in May 2003 and
collected data from the administration of the BVAT in the last part of 2003 and first part
of 2004.
Before collecting the BVAT data, consent forms were sent to all students in
School #1 and # 2 in dual language and bilingual classrooms. During this part of the
study, the number of participants was drastically reduced to 75. Several reasons affected
the sample size for this part of the study. One of the most important was that most
students did not return the consent forms signed by their parents. Another important
reason was the transition from School # 1 to School # 2 did not seem to reflect the
migration of all the students. Rosters were checked to verify the names of students that
were enrolled in 2nd grade in School # 1 in May 2003 and compared to the rosters from
3rd grade in School # 2 in November 2004. It was noted that not all the students from

53
School # 1 had migrated to School # 2 in 2004 as they were promoted into 3rd grade level.
Additionally, new names were found that were incorporated into the rosters of School #
2.
Next, a group of undergraduate students was trained to administer the BVAT (a
standardized normed assessment instrument). Results from the BVAT and the HBGSI
were correlated in an effort to determine concurrent validity for the HBGSI. Anonymity
was preserved by having an individual outside of the study code and enter all the data
collected into a micro-computer.
Instrumentation
HBGSI
The Hispanic Bilingual Gifted Screening Instrument is an inclusive instrument
developed by B. Irby and R. Lara-Alecio (1996). This individual-teacher-administered-
instrument was designed to assess Hispanic students in grades K through 4th. Its purpose
is to screen Hispanic students’ eligibility into GT programs and recommend students for
further GT testing.
The HBGSI began with 90 items in 1992. However, after undergoing several
revisions, the number of items was reduced to 78. Today, this screening tool consists of
77 items, one item was deleted since further investigation and analysis indicated it had
added little or no value to the instrument (Irby & Lara-Alecio, 2003). Items are measured
using a 5-point scale (5 as “always exhibits the behavior/characteristic”, 4 as “often
exhibits the behavior/characteristic”, 3 as “sometimes exhibits the
behavior/characteristic”, 2 as “seldom exhibits the behavior/characteristic, and 1 as
“never exhibits the behavior/characteristic”) (Irby & Lara-Alecio, 1996).

54
This screening instrument is the result of a comprehensive study and review of
literature that narrowed over 400 characteristics of the Hispanic culture into eleven
clusters. The clusters are: Social and Academic Language, Cultural Sensitivity, Familial,
Motivation for Learning, Collaboration, Imagery, Achievement, Support, Creative
Performance, Problem-solving, and Locus of Control. Research was based strictly on
Hispanic gifted students, and is not intended to be generalized to other populations (Irby
& Lara-Alecio, 1996).
Administration Procedure
The HBGSI is available on-line (www.teachbilingual.com) to teachers,
administrators, educators and anybody that would like to become familiar with this
instrument. It has a 30-day-free-trial for those interested in finding out more about this
instrument. Teachers can log on to the website, create their own classroom, and enter the
name of students. Once the students’ names have been entered, teachers can answer the
77 items in the HBGSI for each student. This is not a group-administered tool, so there
will be one instrument per student in the classroom. The software program can run
calculations and provide scores for each student. It also stores the information that the
teacher has created, allowing the teacher to add, delete, change, and/or continue
completing classroom information at anytime. Once the entire classroom has been
entered, the computer program will determine the mean score for that specific classroom.
This mean score is used to determine the cut off score that establishes the splitting point
between those Hispanic students that will be recommended for further GT testing and
those who will not be recommended.

55
Since the HBGSI consists of 77 items and uses a 5-point scale, the maximum
possible raw score a student can obtain is 385 if all answers are scored with a 5. The
lowest would be 77, indicating a wide range of 308. It should be noted that when the
HBGSI was administered in 2003, the instrument consisted of 78 items, which made the
highest score to be 390 and the lowest 78.
HBGSI Background
The HBGSI was based on Renzulli’s definition of giftedness (1986). This
definition was adopted as the foundation upon which the instrument was developed and
used to accommodate the Hispanic bilingual gifted student as “one who has above
average intelligence (IQ), task commitment, and creativity that is situated within socio-
cultural-linguistic characteristics (Lara-Alecio & Irby, 1993). This screening instrument
is designed to be implemented during the first part of the identification process of GT
students as a referral tool or preliminary screening stage for Hispanic students to be
placed in a GT program (Irby, Lara-Alecio & Rodriguez, 2003b).
The HBGSI was developed based on two main studies that focused on the
characteristics of Hispanic bilingual learners (Irby & Lara-Alecio, 1996). The two
foundational studies were conducted by Márquez, Bermúdez, and Rakow (1992), and
Bernal and Reyna (1974). Márquez, Bermúdez, and Rakow (1992) described the
characteristics of Hispanic students that could be used for screening Hispanic gifted
students. Bernal and Reyna (1974) studied the perceptions of the Mexican-American
community about the characteristics of Hispanic gifted students. Both of these studies
investigated the observable characteristics of the Hispanic community and the
perceptions among Mexican-Americans concerning GT Hispanic students.
56
During an exploratory study, an agglomerative hierarchical cluster analysis was
completed by Irby and Lara-Alecio (1996) and the results confirmed the existence of
eleven clusters. Sixty-one elementary (K through 4th grade) bilingual teachers
volunteered to complete the HBGSI. The results produced a Cronbach’s Alpha with
coefficients ranging between .62 to .91. These results revealed a fairly high correlation
between the characteristics depicted by the HBGSI and those considered as attributes of
Hispanic gifted bilingual students.
Further studies showed that the HBGSI was an effective screening instrument that
discriminated at p<.0001 between those students referred to gifted education and those
who were not referred (Irby, Hernandez, Torres & Gonzalez, 1997). An exploratory and
confirmatory factor analysis study was conducted on this screening tool on a sample of
elementary bilingual students in the Houston area.
A correlational study was conducted in order to investigate the properties of the
HBGSI with the Naglieri Nonverbal Ability Test (NNAT). Ten bilingual K through 4th
grade classes constituted a sample of 175 students who participated in the study. The
Pearson correlation revealed coefficients as high as .50 with p<.01 indicating a
statistically significant positive correlation between the two instruments (Irby, Lara-
Alecio, & Rodriguez, 1999).
An additional study by Irby, Lara-Alecio, and Rodriguez (1999) reported the
reliability coefficient of the HBGSI. Cronbach’s Alpha was reported to be .99, based on
only 34 items of the HBGSI.

57
HBGSI Clusters
Eleven clusters were identified in previous research (Irby & Lara-Alecio, 1996) as
contanined in the HBGSI. These clusters are described as attributes of potentially gifted
Hispanic bilingual elementary school students (Lara-Alecio, Irby, & Walker, 1997).
The first cluster, Social and Academic Language refers to reading, writing,
listening and speaking in the native language. Cluster number two, Cultural Sensitivity
indicates a student’s appreciation of their heritage. The third cluster, Familial, indicates
the relationship between the student and his/her parents, parental roles, authority, and
respect. The fourth cluster, Motivation, refers to learning focused on the students’ desire
to learn. The fifth cluster, Collaboration, deals with the ability of students to work with
others. The sixth cluster, Imagery, is concerned with student’s imagination, verbal or
written. The seventh cluster, Achievement, addresses the same indicators that mainstream
students have. The eighth cluster, Support, is characterized by the teacher’s helping in the
areas of assessment and language development. The ninth cluster, Creative Performance,
refers to creative productivity in the arts. The tenth cluster, Problem Solving, is indicated
by cognitive functions and actions in problem solving. And finally, the eleventh cluster,
Locus of Control, is representative of the level of effort that the student engages to
complete tasks (Irby & Lara-Alecio, 1996).
The HBGSI was described as offering promise to the referral process for
screening Hispanic students into GT programs by providing a more equitable and
democratic educational tool. Additionally, it is considered to take into consideration
factors that traditional tests do not account for (Irby, Lara-Alecio & Rodriguez, 2003a).

58
BVAT
The Bilingual Verbal Ability Tests is a standardized assessment instrument
consisting of three batteries that measure bilingual verbal ability in L1 (English) and L2
(other language, in this case Spanish), as well as cognitive and academic language in
bilingual students. Developed by Ana Muñoz-Sandoval, Jim Cummins, Griselda
Alvarado and Mary Ruef (1998), this psychometrically sound instrument represents the
combination of L1 and L2 when assessing bilingual students. It is an individually-
administered-instrument designed to help teachers with student placement and
assessment of the bilingual student’s verbal ability. The BVAT is helpful in the
evaluation of students’ ability for GT and special education programs (Muñoz-Sandoval,
Cummins, Alvarado, & Ruef, 2003). This battery has its origin in the Woodcock
Language Proficiency Battery-Revised (WLPB-R), which in turn was drawn from the
Woodcock-Johnson-Revised Tests of Cognitive Ability (WJ-R COG) (Muñoz-Sandoval,
Cummins, Alvarado, & Ruef, 2003). The BVAT is an assessment battery that contains
three tests measuring verbal ability: Picture Vocabulary (students name the objects
displayed by the test administrator which rank in an increasing difficulty), Oral
Vocabulary (students name synonym and antonym words), and Verbal Analogies
(students are asked to establish relationships between words) (Gindis, 1999). According
to the BVAT Comprehension manual (Muñoz-Sandoval, Cummins, Alvarado, & Ruef,
2003), the first component of this instrument, the Picture Vocabulary, is designed to
measure a students’ ability to name familiar single-word objects. Items are presented in
an increasing level of difficulty. The second component, the Oral Vocabulary has two
parts: synonyms and antonyms. The examiner presents a word verbally and the subject

59
must state a synonym or an antonym according to what part of the test is being
administered. During the third and last component, Verbal Analogies, students are
encouraged to complete a logical word relationship. All of these components start with
the simplest words and increase in difficulty as it progresses. The Comprehension manual
provides basal and ceiling rules that help cut down the testing time.
Administration Procedure
The BVAT is able to assess students’ vocabulary and oral academic proficiency in
two languages (English and Spanish). The three batteries are administered in English
first. Any missed item is then administered in the student’s native language (Spanish for
the sake of this study) and the scoring is 0 or 1 (0 meaning incorrect, 1 meaning correct
response) (Muñoz-Sandoval, Cummins, Alvarado, & Ruef, 2003).
The BVAT provides basal and ceiling rules and the BVAT Comprehensive
Manual explains in detail how they apply. This means that the items are arranged in
ascending order of difficulty. Basal rules are already set in the Manual according to the
age of the testee. This means that if a student is in 1st grade, then the test administrator
can start testing from item 14 in the first battery. Ceiling rules mean that when a student
misses 8 consecutive items, the administrator should not continue with this test and
should move on to the next battery. Basal and ceiling rules are designed to help minimize
the testing time and elevate productive time when testing. When computing the score, all
items with a 1 as calculated as such plus as many items as there were in the basal.
The BVAT consists of 137 total items. Fifty-eight items are included in the
Picture Vocabulary battery, 20 items in the Synonyms Oral Vocabulary, 24 items in the
Antonyms Oral Vocabulary and 35 items in the Verbal Analogies.
60
The BVAT has been translated into 15 languages other than English. There is no
age limit for this test, making this instrument very versatile and flexible for different
applications. It can be used for placement, as well as entry or exit into different bilingual
programs. It is an appropriate tool for assessing academic potential, scholastic aptitude,
verbal cognitive proficiency, and for the placement of bilingual students (Muñoz-
Sandoval, Cummins, Alvarado, & Ruef, 2003). According to the BVAT Comprehensive
Manual, it could be used to reverse the over-representation of bilingual students in special
education programs. Additionally, when used in combination with other instruments,
including observation, it could help to make more accurate placement decisions of
students into different programs, such as gifted and talented (Muñoz-Sandoval,
Cummins, Alvarado, & Ruef, 1998). According to the Texas Education Agency (TEA),
the BVAT is on the list of approved tests that assess LEP students as an oral language
proficiency test.
The BVAT Comprehensive Manual provides age norms, grade equivalents, levels
of Cognitive Academic Language Proficiency (CALP), percentile ranks, and standard
scores. Normative data was based on 5,602 randomly selected subjects distributed all
over the US. The subjects ranged from 5 to 90 years old. Subjects were selected using a
stratified random sampling design (Muñoz-Sandoval, Cummins, Alvarado, & Ruef,
2003). In Texas, some testing was done in several school districts in Dallas, Arlington
and San Antonio. Data were gathered from 1986 through 1988. The BVAT
comprehensive manual (1998) provides evidence of content, construct, concurrent and
predictive validity, and reliability measures. Content was measured through cluster
scores. Construct validity was established by intercorrelations among the BVAT tests

61
revealing correlations from r=.59 up to.96. Concurrent validity correlations with the Pre-
LAS (Language Assessment Scales) ranged from .64 to .91 and a correlation of .86 was
determined with the LAS, indicating a high correlation level with other measures of
English Language Proficiency tests. Predictive validity was established by correlating the
scores from the BVAT with school achievement scores, and the results showed
correlations ranging from .65 to .85. Content validity was also examined and reported as
high.
Evidence of reliability was obtained through alternative form and yielded a
correlation coefficient of .84 (BVAT manual, 1998). Reliability coefficients were
established through split-half procedures (Spearman-Brown formula) and they were
estimated to be .80.
In the reviews from the Mental Measurement Yearbook 14, Garfinkel (n.d.) stated
that the procedures in the BVAT Manual are very clear and include step-by-step
instructions on how to administer the instrument. He acknowledged the under-
representation of language minority students in GT programs, and reported that the
BVAT has the potential for solving this problem. He stated that the BVAT attempts to
satisfy the cultural bias issue in testing since it shows evidence of being a culturally
sensitive instrument. Stansfield (n.d.) reviewed the BVAT and declared his satisfaction
with it and his appreciation for this addition to the testing community. He stressed
caution not to use this instrument as a sole unit of measurement, but to combine it with
other assessment tools in order to make more accurate placement decisions.
Jean and Genest (2000) also expressed their satisfaction with the BVAT and they
found it to be a successful instrument that combines students’ first and second language

62
verbal academic ability. Additionally, they acknowledged the developers of the BVAT
for trying to solve some of the inequity problems that bilingual students are faced with
today including the inappropriate exiting or placing of students with exceptional
educational needs.
Data Collection Procedure
Bilingual classrooms from K through 4th grade were used for the purpose of data
collection during the first part of the study (May 2003). These classrooms were
purposefully selected totaling 527 participants. The second part of the study consisted of
75 students 1st through 5th grade (December 2003 & January 2004).
This first part of this study consisted of having access to the data collected in May
2003 that was stored and saved in an Internet website (www.teachbilingual.com). It
should be noted that in May 2003, participants were enrolled in K through 4th grade. The
particular schools selected had adopted the HBGSI as an instrument that teachers
administer to students annually at the end of the school year. Access to this information
was granted after the Institutional Review Board at Texas A&M University and the
Bryan Independent School District approved the study and procedures.
During the second half of the research, the second instrument was administered
(BVAT). Consent letters were sent out to the parents of all students attending 1st through
4th grade in School # 1 and # 2 (September 2003). These letters were sent home together
with the students’ report cards, hoping that this would render a higher response rate. The
researcher matched the rosters of current students, with the list of students that were
administered the HBGSI last May and the consent letters returned. Additionally, the
researcher trained undergraduate students from the bilingual program at Texas A&M

63
University to help collect the data. Teachers and test administrators adhered to the ethical
code and guaranteed the anonymity of the results at all times.
For this second part of the data collection, the number of participants was reduced
from the original 527 to 75 due to several reasons, not all of these students were enrolled
in these schools in 2004 (there was participant mortality due to migrant parents).
Secondly, not all of the parents returned the consent form with proper signatures. Due to
these reasons, the sample size for the second part of the study and the third research
question was 75.
Data Analysis
The results of the HBGSI administered in May 2003 were gathered, coded and
entered into a microcomputer using the SPSS version 11.5. Data was copied into a zip
disk for the convenience of transportation. Data were coded and involved a third party
outside of the study that volunteered to enter the data into a computer program - thus
protecting the anonymity of the participants. Each participant was assigned a number.
The same procedure was used for the analysis of the BVAT. Once coding was completed
for the results from both instruments, data were analyzed using the SPSS version 11.5,
statistical software.
Descriptive statistics were completed initially. The mean, range and standard
deviation were calculated for the scores of the HBGSI and the BVAT. The primary
research questions were answered as follows. The first research question focused on a
split-half reliability coefficient of internal consistency for the purpose of establishing the
reliability for the HBGSI. The second research question involved exploratory factor
analysis to determine the main factors contained in the HBGSI. A scree plot and Varimax

64
orthogonal rotation technique were used to maximize factor loadings and to extract
factors. Finally, the third research question was answered through the use of the Pearson
Product Moment correlation coefficient to determine the concurrent validity of the
HBGSI to the BVAT in grades K through 4.

65
CHAPTER IV
RESULTS
The major purpose of my study was to analyze the psychometric properties of the
HBGSI. More specifically, I focused on the validity and reliability aspects that
characterize the HBGSI. First, my study provided split-half reliability coefficients for the
HBGSI. Second, I searched for the main factors identified in the HBGSI through an
exploratory factor analysis. Third, my research explored the concurrent validity of the
HBGSI to the BVAT. This chapter presents the findings and results of my study in the
form of tables and charts and a short descriptive interpretation of them for each of the
research questions.
The first analysis of the data consisted of a descriptive analysis of the test scores.
Table 6 includes the range, mean and standard deviation for the HBGSI and the BVAT.
As can be noted, the range of the HBGSI (276) is considerably larger than that of the
BVAT (64). The standard deviation is also considerably different. This may be due to the
large spread of scores in the HBGSI.
Table 6
Range, Mean and Standard Deviation for the HBGSI and the BVAT HBGSI
BVAT
Range 276 64
Mean 311.90 59.57
Standard Deviation 57.24 14.37
Note. n=75

66
Research Questions
The research questions that this study addressed were the following:
1. What is the split-half reliability coefficient for the HBGSI?
2. What are the main factors that are identified in the HBGSI?
3. What is the concurrent validity of the HBGSI when compared to the BVAT, a
normed cognitive measure, in K through 4th grade?
Results by Research Questions
Question 1: Split-half Reliability
This first question targeted the reliability of the HBGSI- a method of internal
consistency. In order to calculate this coefficient of internal consistency, two different
statistical procedures were used to analyze the data and present the results. The collection
of the HBGSI data took place in May 2003 and it provided the information necessary to
answer the first research question. The number of participants for this part of the study
consisted of 527 students.
The following two tables show the reliability coefficients of the HBGSI. Table 7
displays the results of this screening instrument using split-half odd and even item
selection. As can be seen, the reliability coefficients range from .79 to .94
The reliability coefficient in Table 7 was calculated using the odd against even
item selection of cases for the HBGSI. SPSS selected the odd and even items in the
HBGSI and calculated the coefficient of internal consistency.

67
Table 7
Guttman Split-half, Spearman-Brown and Cronbach’s Alpha for the HBGSI Reliability Coefficient Using Odd and Even Items (n= 527)
Reliability Coefficients for the HBGSI
Guttman Split-half
.79
Equal-length Spearman-Brown .80
Alpha for part 1 .94
Alpha for part 2 .92
The correlations, as shown in Table 7, are indicative of a high reliability
coefficient of internal consistency. This suggests that the HBGSI meets the acceptable
criteria to yield reliable results. Nonetheless, an additional analysis was performed. Table
8 presents the results of a different statistical procedure to calculate split-half reliability
coefficient.
A second statistical method was used to investigate the consistency of the HBGSI.
Table 8 shows the results of a reliability coefficient derived from 39 randomly selected
items out of 78. SPSS randomly selected 39 items from the original 78 items and
calculated a split-half reliability coefficient comparing the first randomly selected 39
items against the remaining 39 items. Results indicated a high correlation between the
items, supporting the results from Table 7.

68
Table 8 Guttman Split-half, Spearman-Brown and Cronbach’s Alpha for the HBGSI Split-half Reliability Coefficient Using Random Selection of Cases (n= 527)
Reliability Coefficients for the HBGSI
Guttman Split-half
.93
Equal-length Spearman-Brown .93
Alpha for part 1 .97
Alpha for part 2 .96
Table 8 provides additional evidence of split-half reliability. The coefficients
ranged from .93 to .97. These coefficients are slightly higher than the ones provided in
Table 7.
After analyzing the data through two different statistical methods, one can
conclude that the HBGSI shows similar reliability values across the two methods used.
These two tables provide evidence of high split-half reliability for the HBGSI. Thus it
can be concluded that the HBGSI has a high reliability coefficient. Reliability
coefficients obtained as part of this analysis meet the acceptable category range of
reliability coefficients.
Question 2: Factor Analysis
Factor analysis was used to address the second question in this study. As
described by Kachigan (1991), factor analysis is a very powerful technique used to
reduce large data to a few factors. In my study, I reviewed prior research (Irby & Lara-

69
Alecio, 2003) and set out to analyze the results from the data collected in May 2003.
Several steps were followed in order to process the data and complete the factor analysis.
The first step in calculating factor analysis is to compute a correlation matrix. A
correlation matrix is a mere correlation of variables, in this case, all of the items in the
HBGSI. This is depicted in Appendix A. Items 1 through 15 from the HBGSI only are
included in this correlation matrix. A quick look at the table clearly identifies the first 4
items in the HBGSI correlating with each other. These items have been clustered together
by the test developers under the heading of Social and Academic Language. In addition
items 5, 6 and 7 seem to correlate together. This has also been identified through prior
research under the heading of Cultural Sensitivity. Items 9 through 15 have been
recognized as part of the cluster called Familial (Irby & Lara-Alecio, 2003). One can
easily identify item 8 not correlating with other items.
Once the correlation matrix was established, the next step in factor analysis was to
calculate a factor matrix. A factor matrix is a table of coefficients expressing the
relationship between the items in the HBGSI and the underlying factors (Kerlinger,
1973). Through the employment of matrix algebra (Kachigan, 1991), SPSS provided the
correlation matrix. Appendix D illustrates the un-rotated component matrix for the 78
items in the HBGSI. This table also identified the first four items clustering together.
Additionally, item 8 does not load significantly with any factor, whereas all other items
seem to load on only one Factor.
A third step is required in factor analysis, the rotation of factors. Table 9 shows
the rotating of the factors in the HBGSI. The method used to analyze the factors was
Principal Components Factor Analysis and the orthogonal rotation method used was

70
Varimax. Principal Components is the most commonly used variation in factor analysis
(Kachigan, 1991). The main reason for rotating factors is to obtain a better interpretation
of the factors (Nunnally, 1978), in this particular case, those underlying the HBGSI.
Rotation is used in order to maximize the loadings in the factors. Anastasi and
Urbina (1997) described factor analysis rotation as the turning of the axes on a plot to
better fit the loadings. There are two rotation methods: orthogonal and oblique.
Orthogonal means moving the axes clockwise while keeping them at 90-degree angle. It
also assumes that the factors are uncorrelated with each other (Tabachnick & Fidell,
2001). Varimax is one form of orthogonal rotation. Oblique means that the axes on a plot
rotate but do not keep a 90-degree angle. Oblique rotation assumes that the factors are
correlated and it produces a structure matrix and a pattern matrix (Tabachnick & Fidell,
2001).
The entries on the matrix were color coded for easier identification. The entries on
the matrix are called factor loadings and they represent the correlation between the
underlying factors and the items in the HGBSI. Their value will vary from –1 to +1
(Kachigan, 1991) similar to correlation coefficients.

71
Table 9 Rotated Component Matrix of the HBGSI using Varimax Rotation Method Extraction of Factors
Rotated Component Matrix (a) Factors Item #
1 2 3 4 5 6 7 8 9 10 1 .30 .15 .10 .82 .04 .01 .03 -.04 .00 .02 2 .32 .17 .19 .77 .00 .00 .00 -.01 -.01 .07 3 .17 .20 .10 .84 .11 .00 .08 .06 .10 .04 4 .20 .25 .09 .82 .05 .05 .06 .02 .06 -.02 5 .29 .34 .23 .50 .14 .16 .18 .34 .01 .05 6 .31 .38 .21 .46 .07 .21 .22 .39 .00 .01 7 .27 .46 .17 .32 .10 .17 .20 .42 .08 .10 8 -.03 .06 .03 -.09 -.02 .53 .36 .02 .13 .11 9 .24 .67 .19 .10 .16 .14 .24 .05 .08 -.01 10 .30 .57 .25 .12 .17 .06 .13 .13 .25 -.03 11 .17 .49 .00 .11 .08 .13 .56 -.03 .24 .05 12 .18 .33 .03 .17 .06 .10 .62 .01 -.13 .06 13 .09 .77 .08 .16 .06 .16 .20 .00 -.02 .10 14 .19 .42 .22 .12 .13 -.06 .58 .11 -.05 -.12 15 .17 .55 .09 .15 .11 .06 .62 .03 .07 .00 16 .48 .58 .19 .29 .01 .08 .16 -.06 .01 -.17 17 .32 .57 .18 .29 .03 .01 .18 -.26 .08 -.16 18 .51 .61 .19 .22 -.02 .02 .15 -.21 .03 -.11 19 .51 .59 .21 .27 -.03 .03 .10 -.22 .03 -.16 20 .23 .58 .05 .14 .41 .14 .12 -.0 6 .24 .02 21 .25 .60 .14 .08 .31 -.02 .02 .11 .16 .13 22 .16 .74 .12 .10 .09 .10 .05 .14 -.20 .08 23 .45 .51 .30 .11 .05 -.08 .06 .11 .05 -.04 24 .29 .76 .21 .15 .12 -.01 .09 .11 .02 .08

72
Table 9 Continued
Factors Item #
1 2 3 4 5 6 7 8 9 10 25 .51 .50 .32 .10 .05 -.02 .08 .28 .03 -.04 26 .59 .50 .23 .21 -.01 .06 .19 .03 .00 -.05 27 .37 .51 .16 .08 .16 .16 .08 .31 .15 .02 28 .53 .53 .17 .10 .10 .10 .13 .25 .06 .01 29 .42 .64 .13 .16 -.01 .06 .04 .02 -.22 .18 30 .22 .75 .10 .13 .19 .12 .07 .12 .14 .10 31 .38 .51 .35 .13 -.02 .25 .00 .27 .01 -.08 32 .51 .45 .28 .14 .20 -.04 .11 .08 .24 -.13 33 .50 .29 .39 .20 .03 .07 .04 .04 .41 .05 34 .55 .26 .37 .16 .06 .04 .06 .06 .41 .12 35 .61 .29 .39 .10 -.06 -.04 .07 .00 .26 .14 36 .76 .28 .12 .18 .14 .11 .09 .03 .09 .06 37 .75 .33 .05 .13 .21 .09 .06 -.05 .12 .06 38 .71 .23 .16 .18 .02 .15 .11 .16 .12 .04 39 .60 .23 .31 .16 .19 .15 .23 .19 -.07 -.06 40 .71 .23 .10 .19 .30 .10 .14 .02 .00 .11 41 .74 .21 .04 .18 .10 .04 .11 -.04 .04 .09 42 .29 .08 .31 .13 .05 .50 .05 .06 .00 .05 43 .71 .30 .13 .19 .13 .13 .09 .08 .06 .12 44 .67 .40 .17 .22 .04 .06 .07 -.02 -.03 .05 45 .59 .21 .40 .13 .01 .13 -.01 .24 .05 -.10 46 .28 .20 .27 .37 .08 .14 .00 .01 .00 .50 47 .56 .17 .35 .13 .14 .13 -.06 .10 .38 .03 48 .49 .23 .35 .11 .30 .09 -.03 .23 .23 -.06 49 .53 .04 .40 .11 .20 .21 -.03 .31 .20 .03 50 .61 .27 .35 .14 .07 .12 .04 .25 .02 .03 51 .22 .43 .04 .08 .54 .22 .04 -.06 .23 .03 52 .17 .15 .35 .11 .23 .62 -.09 .03 .04 -.07

73
Table 9 Continued
Factors Item #
1 2 3 4 5 6 7 8 9 10 53 .23 .08 .42 .11 .11 .60 .06 .08 -.12 .08 54 .31 .17 .31 .19 .10 .06 .03 .02 .04 .59 55 .07 .11 .12 .69 .20 .09 .10 .04 -.03 .15 56 .17 .22 .76 .13 .19 .08 .03 -.05 .06 .00
57 .18 .23 .76 .17 .05 .16 .06 .02 .06 .07 58 .31 .20 .71 .10 .10 .11 .01 .00 .03 .09 59 .20 .15 .76 .09 .05 .10 .05 .03 .00 .09 60 .10 .29 .47 .16 .46 .10 .05 .05 -.01 .20 61 .47 .21 .27 .13 .27 .11 -.16 -.03 -.03 -.02 62 .72 .18 .20 .09 .16 .18 .02 .00 -.07 .03 63 .56 .44 .21 .21 .07 .08 .00 -.10 -.22 .07 64 .47 .38 .25 .06 .06 .35 .00 -.04 -.16 .05 65 .59 .23 .38 .16 .14 .25 .11 .16 -.06 .09 66 .20 .09 .71 .09 .11 .19 .09 .08 .00 .07 67 .42 .05 .34 .12 .49 .14 .02 .00 .05 -.02 68 .42 .16 .40 .10 .47 -.03 .24 .02 -.05 -.15 69 .31 .20 .27 .25 .52 .14 .16 .15 -.06 .08 70 .41 .16 .32 .19 .42 .27 .06 .15 -.12 -.04 71 .54 .27 .32 .10 .21 -.06 .10 .00 .07 .12 72 .50 .35 .10 .13 .21 .09 .14 -.01 -.20 .23 73 .54 .21 .39 .22 .16 .15 .17 .17 -.04 .16 74 .74 .29 .07 .22 .09 .00 .10 -.05 -.06 .14 75 .17 .43 .20 .16 .49 .00 .11 .03 -.03 .25 76 .35 .52 .03 .17 .20 .08 .25 -.23 .06 .05 77 .35 .58 .14 .11 .03 .06 .05 .04 .07 .26 78 .28 .76 .20 .15 .06 .03 .10 .00 -.05 .07
Note. Extraction Method: Principal Component Analysis. Rotation Method: Varimax with Kaiser Normalization.

74
Table 9 shows Principal Component Analysis with Varimax rotation performed
through SPSS on the 78 items of the HBGSI. Five factors were identified and extracted.
Two different criteria were taken into consideration for the extraction of the factors on
Table 9, both conservative in nature. The first criteria required the following: (a) a
minimum of 3 items to define a factor, (b) at least one item needs to load .50 or higher,
and (c) the remaining 2 items need to load at least .30. The second criteria (Kerlinger,
1973) used to define factors was the following: (a) the factor matrix (Table 9) should
have a loading close to zero for each row, (b) each column should have as many zero-or-
near-zero-loading variable as there are factors, and (c) “for every pair of factors
(columns) there should be several variables with loadings in one factor (column) but not
in the other” (p. 673).
These findings are consistent with those in the HBGSI’s scree plot found in
Appendix B. Criteria for the identification of factors in the scree plot was defined by
Brown (2001). He stated that researchers should not be concerned with the factors that lie
in the debris or rubble at the bottom part of the mountain (after the elbow area). The scree
plot for the HBGSI shows the debris area after an eigenvalue of five. Appendix B
provides the reader with a graphical distribution of factor loadings in a scree plot. A scree
plot is a two dimensional graph with an X (factors in ascending order) and Y axis
(eigenvalues in descending order) (Newsom, 2003). It is called scree plot because it
resembles the side of a mountain with a soft slope at the base (Kachigan, 1991). As can
be seen in Appendix B, and following Kachigan (1991), Cattell (1966) and Brown’s
(2001) criteria, there are five factors that could be identified in the HBGSI.

75
A third factor identification method was investigated in this study. A table with
eigenvalues is included in Appendix C. Eigenvalues measure the variation in a pattern
and they are calculated by adding the factors squared loadings. They represent the
amount of variance accounted for by a factor (Kerlinger, 1973). According to Appendix
C, the first factor accounts for the majority of the variance in the HBGSI (46%), the
second factor adds a small percentage of variance, and so on. The Factors that lie after the
fifth factor do not seem to add considerable variability. In essence, Factors 6, 7, 8, 9 and
10 only account for a very small percentage of the variance- thus supporting the
identification of 5 factors in the HBGSI.
According to this study, Table 9 shows that the first seven items in the HBGSI
have a high loading on Factor 4. This is partially supported by the research conducted by
Irby and Lara-Alecio (1996). They found that items 1 through 4 grouped together under
the heading of Social and Academic Language, and items 5 through 7 group together
under the heading Cultural Sensitivity. Table 9 shows similar findings. However, this
study has found that items 5, 6 and 7 seem to group with the first 4 items (Factor 4).
Items 1 through 4 ask the participant whether he/she likes to read, write, speak or listen in
the native language. Items 5 through 7 focus on language, culture and tradition.
Additionally, item 55 loads high on Factor 4 on Table 9. Exploring item 55, I
found that it targets vocabulary and language. Additionally, item 7 loads heavier on
Factor 2. But after reviewing both items, the decision was made to incorporate item 7 and
item 55 on Factor 4 since they shared a semantic connection to the concepts attached to
Factor 4.

76
Factor 2 on Table 9 show high loadings for items 9 through 32, and 76 through
78. This is partially supported by the developers’ prior research (Irby & Lara-Alecio,
1996). They found that these items clustered together under 3 different headings,
Familial, Motivation for Learning, and Collaboration.
Factor 1 on Table 9 comprises of items 33 through 50, 61 through 65, and 71
through 74. This is also partially supported by the developers prior research (Irby & Lara-
Alecio, 1996). They found that items 33 through 35 load together under the heading
Imagery. Items 36 through 50 were grouped under the heading Achievement. This study
found that these items load together under the same Factor 1.
Items 61 through 65 had been grouped under the heading Problem Solving.
However, in their results this cluster included other items. Items 71 through 74 had been
clustered under the heading Locus of Control with some other items. This study found
that these items load together under the same Factor 1.
Factor 3 on Table 9 consists of items 52, 53, 54, 56 through 60 and 66. These
results are partially supported by Irby & Lara-Alecio (1996). Their results showed a
similar grouping into headings Support and Creative Performance.
Factor 5 on Table 9 involves items 51, 67 through 70 and item 75. This is as well
partially supported by previous research. Several of these items were grouped together in
a previous study (Irby & Lara-Alecio, 1996) and were labeled Problem Solving and
Locus of Control. This study has grouped them slightly differently due to the loadings in
Table 8.
Item 8 had been deleted from the instrument after May 2003 by the test
developers (Irby & Lara-Alecio, 2003). After careful consideration, this study is able to

77
support previous findings that suggested the deletion of item 8. Although it has a
significant loading on Factor 6 and Factor 7, both of those factors fail to meet the criteria
described earlier (Kerlinger, 1973) and consequently, the decision was made to support
the deletion of item 8.
As mentioned earlier, Table 9 did not provide enough evidence to warrant the
extraction of factors 6, 7, 8, 9 and 10. For that reason, only 5 factors were identified in
this study.
In summary, the results of the exploratory factor analysis provide evidence of the
existence of 5 factors in the HBGSI analyzed through Varimax rotation method, in
addition to the deletion of item 8 which did not meet the criteria established for the
extraction of factors.
Question 3: Concurrent Validity
This third research question analyzed the concurrent validity of the HBGSI in
relation to the BVAT. By definition, Gall, Borg and Gall (1996) identified concurrent
validity as “the extent to which individuals’ scores on a new test correspond to their
scores on a established test of the same construct that is administered shortly before or
after the new test” (p. 252). Cronbach (1975) explained that concurrent validity is used
when researchers intend to substitute one instrument for another or when a high
correlation exists between the two measures.
As expressed earlier in Chapter 3, the number of participants was drastically
reduced due to the following: the original sample included K through 4th grade students,
data were collected in May 2003, and it addressed the first two research questions in this
study. When the researcher started collecting the data to answer the last research question

78
in this study (October, 2004), students were a school year ahead and changes had
occurred in the composition of the sample. The sample received the biggest decrease in
reduction from the fourth graders that were no longer attending the same school building,
constituting a very large loss. The second most important attrition was the migration of
some of the families; consequently, some students were no longer attending schools in
the district, some others were new to the district and had no HBGSI on file, still others
had incomplete data from the HBGSI and were deleted from the original sample. Another
attrition factor that affected the sample size was the lack of signed consent letters. A
second set of consent letters was sent to parents in an effort to improve the number of
participants. There was a considerable improvement and once the sample size reached 75,
the researcher stopped the data collection process.
The Pearson Correlation coefficient was the chosen statistical technique applied to
Research Question 3. In order to calculate the correlation, all scores from the HBGSI and
the BVAT were converted to z scores using the SPSS statistical software. This type of
score is used when data is derived from a single sample and the mean and standard
deviation are provided (Gravetter & Wallnau, 2004).
Table 10 shows the correlation results of the HBGSI and the BVAT. As can be
seen, the number of participants for this analysis included 75 students. The Pearson
Correlation coefficient was the chosen statistical procedure for this type of analysis.

79
Table 10
Pearson Correlation Coefficient of the HBGSI and the BVAT (n= 75)
BVAT HBGSI
BVAT 1 .39**
HBGSI .39** 1
Note. ** Correlation is significant at the 0.01 level (2-tailed)
Table 10 provides the results of the correlation coefficient between the BVAT and
the HBGSI. As can be seen, the correlation coefficient resulted in r = .39, statistically
significant at the .01 level. This is considered to be a moderate correlation.
Next, the proportion of variance explained was determined by calculating the
coefficient of determination. This statistical procedure measures the proportion of
variability (expressed in percentages) in one of the tests scores accounted for by the other
and vice versa. The formula is r squared (Gravetter & Wallnau, 2004). This means that
.39 squared is approximately 15%. This means that 15% of the variability in the HBGSI
is explained by the BVAT or vice versa.
In summary, the results from this study provided the following answers to the
research questions expressed in previous chapters. First, the HBGSI has empirical
evidence of high Split-half reliability coefficients ranging between .79 and .97. Secondly,
factor analysis revealed the existence of five main factors among the 78 items. This found
partial support from earlier studies. Finally, the HBGSI shows evidence of concurrent
validity (r = .39) coefficient when compared with the BVAT. Additionally, the
coefficient of determination explained 15% of the variance.

80
CHAPTER V
DISCUSSION AND CONCLUSIONS
This chapter presents the conclusions and recommendations for practice and
research derived from this study. This study analyzed the psychometric properties of the
HBGS, specifically, the validity and reliability properties of this instrument.
Psychometrically speaking, validity and reliability are two very fundamental concepts
associated with an assessment tool (Marin & Marin, 1991). This study also included an
exploratory factor analysis and compared the results from this study against prior
research (Irby & Lara-Alecio, 2003).
Three research questions regarding the HBGSI guided this study. The first
question focused on the reliability of this instrument, more specifically, the split-half
coefficient of internal stability. The second research question addressed the factors
identified in this instrument through factor analysis. Finally, the third research question
concentrated on the concurrent validity of the HBGSI compared to a normed instrument,
the BVAT.
The reliability coefficient was answered using Guttman, Spearman-Brown and
Cronbach’s Alpha correlation coefficient. Of the two methods used to analyze reliability,
random selection of items is the method of preference since it provides more accurate
results. The results revealed a relatively high correlation ranging from .93 to .96. Such
high correlation indicates evidence of internal consistency in the instrument.
The second research question focused on the factors in the HBGSI. Factor matrix
and Principal Component Analysis were performed. Exploratory factor analysis using

81
Varimax rotation uncovered 5 underlying factors, some of them supported by previous
research (Irby & Lara-Alecio, 1996).
The last question addressed the evidence of concurrent validity in the HBGSI
when compared to a normed instrument, the BVAT. This was accomplished using the
Pearson Product Moment correlation. Results showed a correlation of r = .39. This
indicates that almost 15% of the variance in the HBGSI was explained by the BVAT, and
vice versa. In other words, only 15% of the variability of the scores on the HBGSI is
accounted for by the scores on the BVAT, and vice versa.
The results from this study reveal a moderate concurrent validity correlation.
Several reasons for this should be considered: (a) the variability of scores in the HBGSI,
as described in Table 6, and (b) the restriction of the range on the scores of the BVAT
may have affected the correlation. The range on the HBGSI scores was 276 compared to
64 on the BVAT. The standard deviation on the HBGSI was 57 compared to 14 on the
BVAT. These two reasons may have affected the correlation coefficient in Research
Question three.
In summary, the HBGSI has substantial evidence of reliability and some evidence
of concurrent validity. It has support for the existence of five factors in the instrument,
and valuable characteristics that need to be considered when identifying and screening
Hispanic students. Note that these factors were partially supported by previous study
(Irby & Lara-Alecio, 2003).
As recommended by Irby and Lara-Alecio (2003), teachers need to be
conscientious of the different characteristics that Hispanic gifted students possess when
using the HBGSI. These characteristics are reflected in the clusters and full

82
understanding of them is necessary to achieve higher accuracy in testing. Additionally,
the tests developers recommended that the completion of the HBGSI be based on
observation of the characteristics and not on inference. For this reason, teachers are
encouraged to proctor the HBGSI to their students since they possess more and better
knowledge about them.
The HBGSI is the product of a massive research of Hispanic attributes and the
efforts of hundreds of bilingual teachers who contributed to the research. It also includes
characteristics overlooked by traditional tests (Irby & Lara-Alecio, 2002)- thus making
the HBGSI a unique instrument in the bilingual field. It shows promising results in the
arena of Hispanic gifted identification. The first research question investigated in this
study provided evidence of a strong reliability coefficient, providing additional strength
to the test’s psychometric properties.
The concurrent validity coefficient gave support to further uses of the HBGSI.
However, further validation should be conducted if decisions about student placement
into different programs are to be made using this instrument.
Finally, the factor analysis on the HBGSI helped identify the main factors that are
involved in the identification of Hispanic gifted students. Those were Social and
Academic Language, Cultural Sensitivity, Familial, Motivation for Learning,
Collaboration, Imagery, Achievement, Support, Creative Performance, Problem Solving,
and Locus of Control. More research is necessary that could duplicate the findings and
support the conclusions from this study.
Additionally, this study provided insight and further information into the
improvement of practices and identification of Hispanic bilingual students. It was the

83
researcher’s ambition to improve the screening practices and offer a more universal
approach to equality in GT programs.
Limitations
This study carries several limitations that the reader needs to bear in mind. The
first and foremost limitation is the generalizability of the results that cannot go beyond
the characteristics of the sample in my study. This study involved the selection of two
specific schools in the area and participants were extracted from these schools. This study
required all participants to be of Hispanic origin. Results may vary if a study were
conducted in an altered setting with other language minority participants. The researcher
recommends caution when trying to apply the results of this study to another place and
time. This study focused on Hispanic students enrolled in a bilingual program K through
4th grade in a public school district in Texas. Special caution should be taken when
assuming that the results derived from this study will apply to other students in other
settings. This practice may be audacious and/or invalidate the results of the study. Further
investigation should include a larger sample, the use of random sample techniques, and
the addition of several school districts in various geographical areas at different time
settings.
Additionally, the reader needs to be aware of the reduction in the sample size of
the third research question. The inability to produce a sample as large as the one that
answered the first two research questions may have had an affect on the concurrent
validity coefficient. The first two research questions included the entire population, that
is, all students enrolled in dual and bilingual programs in the two selected schools.
However, the last question used a volunteer sample of participants that may represent a

84
bias and have weakened the results of this study. Research with a larger sample is
recommended that could additionally support the validity of this study.
A third limitation relates to the teachers’ perceptions of the items in the HBGSI.
The HBGSI is an instrument that only teachers can use with their own students. This
instrument requires specific background knowledge to be able to answer the questions in
the instrument. The proctoring of the HBGSI demands familiarity in areas such as
students’ performance, home environment, academic language, social behavior and
creative performance of students. Different teachers can rate students differently. The
researcher recommends that test developers include a short description of how the
HBGSI scale should be treated, thus providing uniformity and consistency of scores
across different raters.
Implications for Further Research
This study intended to provide evidence of two psychometric properties of the
HBGSI, specifically validity and reliability. The HBGSI is a screening instrument used
for initial identification of potential Hispanic bilingual GT students (Irby & Lara-Alecio,
2003). It is an inclusive screening instrument designed to detect precise characteristics
that conventional assessment tools fail to consider (Irby & Lara-Alecio, 2002). As
mentioned earlier in this study, current research studies have shown the inadequacy of
standardized instruments in the field. Ultimately, the concept of equalization in the
representation of minorities to GT programs needs to be corrected. This will require
teachers and administrators to ignore any and all stereotypical and biased notions of a
language minority that may conflict with the GT initial identification process in the
screening and placement of students in GT programs.

85
Additionally, a contemporary movement towards the inclusion of several
measures has been in place for some time. Performance and portfolio assessment,
checklists, teacher observations, and parent nomination, in addition to the standardized
measures, are used by districts to make decisions related to placement, entry or exit to
different programs. Fortunately, some districts are enforcing a variety of assessment
instruments to place students in different programs, including GT. This contemporary
outlook has brought some relief to the field. However, the numbers are not yet equalized.
Appropriate screening instruments must be developed or existing ones validated to
provide language minority students better opportunities to enter GT programs.
Regarding validity evidence, further research is recommended that would provide
additional evidence of concurrent validity in the HBGSI. The researcher suggests that the
correlation of the HBGSI with other achievement measures should be made that could
provide additional support to the instrument. Further studies that would provide
additional evidence of construct validity in the HBGSI could also be useful and
beneficial, supplying crucial information regarding the concept of giftedness among
Hispanic bilingual students. Additional studies could also include confirmatory factor
analysis to more accurately determine the number of factors in the instrument. A
longitudinal study could be an excellent source to gather data. Students at K level could
be administered the HBGSI and the researcher could follow up their development at a
later grade level to compare the results.
Regarding evidence of reliability, additional reliability studies could examine test-
retest, and parallel forms. The consistency of teacher perception and scoring of the
HBGSI could be controlled by using a modified version of test-retest reliability method,

86
where the same group of students could be tested by two different teachers and the results
correlated with each other.
Recommendations
Several methods could help minimize the inaccuracy in the interpretation of the
results of measures when testing language minority students. One of them is to validate
the assessment instruments that are used with Hispanic students in reference to the
particular use for which the test is being used (Anastasi & Urbina, 1997).
Another important method to consider when assessing minority language students
is the norming sample that is used to standardize an instrument. Valencia and Suzuki
(2001) reported that since the Stanford-Binet intelligence test was introduced into the
U.S. in the early twentieth century, the standardization sample used for the norming of
this test remained, for over 60 years, as being predominantly White, excluding all
minorities from the norms, until 1973 when the test was undergoing one of its many
revisions. Extending the sample to include equal proportions of ethnic and language
minorities in the norming sample of a standardized instrument could provide
improvements towards the accuracy of tests’ results (Valencia & Suzuki, 2001).
A third important topic to consider is the one described by Geisinger (1992). He
advised on several main validity issues to consider when assessing language minority
students: criterion-related -which includes concurrent and predictive- content, and
construct validity. He emphasized how construct validity and well-trained test users can
compliment each other. Further research is constantly encouraged in order to better fit the
ever-growing population of minority language students. Procedures such as validation of
instruments are critical when assessing this type of student.

87
A fourth consideration is the one expressed by Ford and Thomas (1997). They
stated their concern in the area of minority underachievement in U.S. schools and their
rationale emphasized the lack of a consensus on the definition of giftedness, and the
inappropriate methodology of assessing minority students. These two topics are pivotal to
the identification of Hispanic GT potential students. Their promotion of the combination
of different tools and methods helped remedy some of the inherent problems. They also
stressed the use of quantitative and qualitative research as beneficial tools in the
assessment process.
Finally, and after many decades of contradicting theories and beliefs about
bilingual and gifted students, researchers started spreading the notion that standard IQ
tests were ineffective assessment tools for the identification of giftedness among
culturally diverse backgrounds (Castellano & Díaz, 2002). In order to accommodate for
some of the differences between White and minority students regarding assessment
fairness, teachers have started implementing new techniques. The use of a variety of
instruments to assess minority language speakers has become an alternative and a
necessity in the U.S. today. According to the Standards for Educational and
Psychological Testing (1985), revised in 1999, an attempt was made to provide equal
testing opportunities to all students in the form of alternative types of assessments that are
necessary to satisfy English language learners. Minimal validity was placed on tests that
do not take into consideration language differences. Additionally, the assessment of
minority speaking students needs to be more in-depth and detailed than native speaking
students (Mclean, 1995).
88
Castellano (1998) suggested that the combination of qualitative and quantitative
measures could provide more accurate profiles of bilingual gifted students. Fortunately,
several school districts across the nation have adopted a multiple criteria approach when
identifying and assessing bilingual gifted students. These measures include portfolio
assessment, numerous observations, behavioral checklists, past school performance,
parental involvement, samples of creativity and/or achievement, dynamic assessment
where the students put new knowledge into practice, and the use of verbal and non-verbal
tests. These are the main tools that teachers and educators can use in the process of
screening or identifying potential minority candidates for GT programs.
As cited by Castellano and Díaz (2002) “one does not need to be fluent in English
to be intelligent”. Gifted children come from all different ethnic and linguistic groups.
The concept of proper identification of potential GT students is the reason for the under-
representation of minorities in such programs. This disproportion is the result of an
educational system that does not accommodate culturally and linguistically the diversity
in students (Castellano & Díaz, 2002).
All of these are optional suggestions that teachers and educators in the field of
bilingual should consider when assessing language minority students. Several books
(Castellano, 2002; Valdés, 2003; Valencia & Suzuki, 2004) have been recently published
that help understand the under-representation of minority students in GT programs and
add explanations and research on the field of minority language assessment.

89
Discussion
The U.S. has seen over time a change in the societal demographics that have
characterized its history. Influx from many immigration movements has left the U.S. with
a “colorful” blend of citizenry. This transformation has been reflected in all parts of
society, consequently affecting the demographics of the public schools. But
representation of minorities and special populations has not been equally distributed in
schools programs. Statistics show as much as a 70% misrepresentation of minority in GT
programs (Ford, & Thomas, 1997).
Researchers have commented on the issue of the under-representation of minority
students in GT programs for some time (Bermúdez & Márquez, 1998; Cantu, 1998;
Castellano, 1998; Castellano & Díaz, 2002; Cohen, 1990; Cunningham, Callahan, &
Plucker, 1998; Jean, 1996; Irby, 1993, 2000; Lara-Alecio, Irby & Walker, 1997; Masten,
Plata, Wenglar, & Thedford, 1999; Mclean, 1995; Plata, & Masten, 1999) and have
offered alternative methods of screening and identifying minority language GT students
(Ford, & Grantham, 2003; Ford, & Thomas,1997; Vanderslice, 1998).
The dilemma of accuracy in testing multicultural background students was
recognized early in the first decade of the twentieth century. However, it was not until the
1950’s when it received the proper attention (Anastasi & Urbina, 1997).
Moreover, a consensus on the definition of intelligence and giftedness is
necessary. Many fruitless debates have been initiated regarding the construct of
intelligence and how to measure it (Valencia & Suzuki, 2001).
Conventionally speaking, tests depend on language as a means of communication
in the conveyance of questions and answers. Being able to distinguish between the

90
students’ inability to express content knowledge and their lack of content knowledge
represents quite a challenge for teachers and educators. This inaccuracy is sometimes
reflected in test results that may not indicate the true characteristic intended to be
measured (Standards for Educational and Psychological Testing, 2002). As expressed by
the National Research Council, Board on Testing and Assessment (2000), unless the
assessment of minority language speakers had intended to target English skills, any other
performance results can be considered inaccurate.
It is imperative that teachers and educators give special consideration to the
language and culture of the student in the development, administration, scoring and
interpretation of test scores, especially if decisions are to be made based on the test
results. This same concept applies to the test norms that are usually based on English
speaking individuals. The Standards for Educational and Psychological Testing (2002)
clearly expressed the notion that if a student does not perform well on a test, it could be
the consequence of poor language proficiency instead of lack of content knowledge.
Another important issue to be cognizant of is the fact that some bilingual students speak
Spanish at home but they use English as their academic language, aggravating the choice
of a language for a test.
Additionally, the Standards for Educational and Psychological Testing (2002)
recommended trying to minimize the threats to validity and reliability of the
interpretation of the test scores that may be related to language differences. Another
important concept was testing an individual in the language he/she is most proficient or
feels more comfortable.
91
Furthermore, instruments need to be a solid solution to the existing controversial
problem relating to the interpretation of scores, and must be characterized by two
critically important concepts: validity and reliability (Gall, Borg & Gall, 1996). These
properties are vital when assessing students and interpreting their scores.
The need to develop and/or validate instruments that reflect students’ cultural
backgrounds has become a priority in the U.S. today. Irby and Lara-Alecio (1996)
developed the Hispanic Bilingual Gifted Student Instrument (HBGSI), a screening tool
that attempts to equalize Hispanic students’ opportunity to enter GT programs. The
HBGSI was designed to help identify potential gifted students among the Hispanic
population of students, thus attempting to revert the under-representation of Hispanic
students in gifted education, and making an effort to satisfy the need to develop
instruments that accommodate for this specific fast growing population.

92
REFERENCES
Almond, B. J. (2002, November). Houston in “majority minority” club. (The Faculty and
Staff Weekly Online No. 14). Houston, TX: Rice University.
Anastasi, A. (1985). Psychological testing: Basic concepts and common misconceptions.
In A.M. Rogers & C.J. Scheirer (Eds.), The G. Stanley Hall Lecture Series, 5, 87-
120. Washington, DC: American Psychological Association.
Anastasi, A. (1992). Introductory remarks. In K. Geisinger (Ed.). Psychological testing of
Hispanics (pp.1-7). Washington, DC: American Psychological Association.
Anastasi, A., & Urbina, S. (1997). Psychological testing (7th ed.). Upper Saddle River,
NJ: Prentice-Hall, Inc.
Barkan, J. H. & Bernal, E. M. (1991). Gifted education for bilingual and limited English
proficient students. Gifted Children Quarterly, 25(3), 144-147.
Bermúdez, A., & Márquez, J. (1998). Insights into gifted and talented English language
learners. Intercultural Development Research Association Newsletter. Retrieved
October 14, 2003, from
http://www.idra.org/newslettersubscribe.htm/Newslttr/1998/Jun/Andrea.htm
Bermúdez, A., & Rakow, S. (1990). Examining identification and instruction practices
for gifted and talented limited English proficient students. In L. M. Malavé (Ed.).,
Annual Conference Journal. Proceedings of the National Association for
Bilingual Education Conference, Tucson, AZ, 1990 and Washington, D.C., 1991
(pp. 99-114).

93
Bernal, E., & Reyna, J. (1974). Analysis of giftedness in Mexican American children and
design of a prototype identification instrument. Austin, TX: Southwest
Educational Development Laboratory.
Brown, J. (2001). What is an eigenvalue? Shiken: JALT testing & evaluation. SIG
Newsletter, 5, 13-16. Retrieved from http://www.jalt.org/test/bro_10.htm
Bureau of Citizenship and Immigration Services. (2001). Immigrants, fiscal year 2001.
Retrieved from http://www.immigration.com/common/bcis.html
Cantu, L. (1998). Traditional methods of identifying gifted students overlooks many.
Intercultural Development Research Association Newsletter, 6, p. 1-14.
Castellano, J. (1998). Identifying and assessing gifted and talented bilingual Hispanic
students. (Eric Document Reproduction Service No. ED 423 104). Retrieved
January 22, 2003, from
http://www.ericfacility.net/databases/ERIC_Digests/ed423104.html
Castellano, J., & Díaz, E. (2002). Reaching new horizons. Gifted and talented education
for culturally and linguistically diverse students. Boston, MA: Pearson Education
Company.
Cattell, R. (1966). The Scree test for number of factors. Multivariate Behavioral
Research, 1 ,140 –161.
Cohen, L. M. (1990). Meeting the needs of gifted and talented minority language
students. (ERIC Document Reproduction Service No. ED 321485). Retrieved
April 7, 2003, from http://www.ericec.org/digests/e480.html

94
Colangelo, N., & Davis, G. A. (1991). Introduction and historical overview. In N.
Colangelo & G. A. Davis (Eds.). Handbook of gifted education (pp. 3-13).
Needham Heights, MA: Allyn and Bacon.
Coleman, M., & Gallagher, J. (1995). State identification policies: Gifted students from
special populations. Roeper Review, 17, 268-275.
Collier, C. (1985). A comparison of acculturation and education characteristics of
referred and nonreferred culturally and linguistically different children. Ann
Arbor, MI: University Microfilms International.
Cooper, P. M. (2000). Emerging giftedness for the LEP student. Austin,TX: Association
for the Gifted and Talented.
Cortez, A. (2003). The emerging majority: The growth of the latino population and latino
student enrollments. Intercultural Development Research Association Newsletter.
Retrieved October 14, 2003, from
http://www.idra.org/newslettersubscribe.htm/newslttr/2003/Jan/Albert.htm
Cronbach, L. (1975). Beyond the two disciplines of scientific psychology. American
Psychologist, 30, 116-127.
Cunningham, C., Callahan, C., & Plucker, J. (1998). Identifying Hispanic students of
outstanding talent: Psychometric integrity of a peer nomination form. Exceptional
Children, 64, 197-209.
Daves, C. W. (Ed.). (1984). The uses and misuses of tests. San Fransisco, CA: Jossey-
Bass.

95
Day, (1993). Estimates and projections of the population by age, race, and Hispanic
origin 1900- 2050. Retrieved October 12, 2003, from
http://aspe.os.dhhs.gov/hsp/trends/tables.pdf
Donovan, M., & Cross, C. (2002). Minority students in special and gifted education.
National Research Council. Retrieved October 14, 2003, from
http://www.nap.edu/catalog/10128.html
Education Week (2003). Bilingual Education. Retrieved July 22, 2003, from
http://www.edweek.org/context/topics/issuespage.cfm?Id=8
Eyde, L. D., Moreland, K. L., Robertson, G. J., Primoff, E. S., & Most, R. B. (1988). Test
user qualifications: A data-based approach to promoting good test use. Issues in
scientific psychology. Washington, DC: American Psychological Association.
Ford, D., & Grantham, T. (2003). Providing access for culturally diverse gifted students:
from deficit to dynamic thinking. Theory into practice. Retrieved from
http://www.findarticles.com/cf_0m0NQM/3_42/108442649/print.jhtml
Ford, D., & Thomas, A. (1997). Underachievement among gifted minority students:
Problems and promises. The ERIC Clearinghouse on Disabilities and Gifted
Education. Retrieved from http://www.ericec.org/digests/e544.html
Gagne, F. (1985). Giftedness and talent: Reexamining a reexamination of definitions.
Gifted Child Quarterly, 29, 103-112.
Gall, M., Borg, W., & Gall, J. (1996). Educational research (6th ed.). New York:
Longman.
Gandara, P. (1999). Review of research on the instruction of limited English proficient
students. University of California Linguistic Minority Research Institute, 1999.

96
Gardner, H. (1983). Frames of mind: The theory of multiple intelligences. New York:
Basic Books.
Garfinkel, A. (n.d.). Review of the Bilingual Verbal Ability Tests. Mental Measurements
Yearbook. Retrieved March 23, 2003, from Silverplatter database.
Geisinger, K. (1992). Fairness and selected psychometric issues in the psychological
testing of Hispanics. In K. Geisinger (Ed.)., Psychological testing of Hispanics
(pp. 17-42). Washington, DC: American Psychological Association.
Gindis, B. (1999). A breakthrough in bilingual assessment- Or is it? Communique, 27, pp.
26-27. Retrieved November 16, 2002, from
http://www.bgcenter.com/BVATReview.htm
Gintis, H. (1988). Education, personal development, and human dignity. In H. Holtz et al
(Eds.)., Education and the American dream: Conservatives, liberals & radicals
debate the future of education. Greenwood, IN: Bergin & Garrey.
González, V. (2002). Advanced cognitive development and bilingualism. In J. Castellano
& E. Díaz (Eds.), Reaching new horizons (pp. 47-75). Boston, MA: Allyn &
Bacon.
Gravetter, F., & Wallnau, L. (2004). Statistics for the behavioral sciences (6th ed.).
Pacific Grove, CA: Wadsworth/Thomson Learning Inc.
Hadaway, N., & Marek-Schroer, M. (1992). Multidimensional assessment of the gifted
minority student. Roeper Review, 15, 73-77.
History of gifted education. (n.d.). Retrieved from http://207.228.215.62/history.htm
Hollingworth, L. S. (1926). Gifted children: Their nature and nurture. New York:
Macmillan.
97
Irby, B. (1993). Hispanic LEP gifted students. Education Week. May, 1993.
Irby, B., Hernandez, L., Torres, D., & Gonzalez, C. (1997). The correlation between
teacher perceptions of giftedness and the Hispanic Bilingual Screening
Instrument. Unpublished doctoral dissertation, Sam Houston State University,
Huntsville, Texas.
Irby, B., & Lara-Alecio, R. (1996). Attributes of Hispanic gifted bilingual students as
perceived by bilingual educators in Texas. SABE Journal, 11, 120-143.
Irby, B., & Lara-Alecio, R. (2003). The Hispanic Bilingual Gifted Screening Instrument:
A factor analysis report. Retrieved from www.teachbilingual.com
Irby, B., Lara-Alecio, R., & Rodriguez, L. (1999). Assessment from multiple perspectives
for second language learners; an analysis of the Hispanic Bilingual Gifted
Screening Instrument. (Eric Document Reproduction Service No. ED 430 404).
Irby, B., Lara-Alecio, R., & Rodriguez, L. (2003a). A multivariate analysis of the
Hispanic Bilingual Gifted Screening Instrument. Retrieved from
www.teachbilingual.com
Irby, B., Lara-Alecio, R., & Rodriguez, L. (2003b). Complementing the assessment of
gifted bilingual students with the Hispanic Bilingual Gifted Screening Instrument.
Retrieved January 19, 2004, from www.teachbilingual.com
Jacob K. Javits Gifted and Talented Students Education Act as Title V, Part D, Subpart 6
of the No Child Left Behind Act. (2001). Retrieved August 19, 2003, from
http://www.ed.gov/offices/OESE/Javits/

98
Jean, D. (1996). Valuing, identifying, cultivating, and rewarding talents of students from
special populations. The National Research Center on the Gifted and Talented.
Retrieved from http://www.sp.uconn.edu/~nrcgt/news/spring96/sprng965.html
Jean, G., & Genest, B. (2000). Bilingual Verbal Ability Tests. Canadian Modern
Language Review, 57(2). Retrieved from
http://www.utpjournals.com/product/cmir/572/Bilingual4.html
Johnsen, S. K., & Corn, A. L. (1987). SAGES: Screening Assessment for Gifted
Elementary Students. Austin, TX: PRO-ED.
Kachigan, S. (1991). Multivariate statistical analysis. New York, NY: Radius Press.
Keeling, K., & Pavur, R. (1998). Relationship between Cronbach’s reliability estimate
and research design. Retrieved October 11, 2003, from
http://www.sbaer.uca.edu/Research/1998/DSI/Pdffiles/Papers/0855.pdf
Kerlinger, F. (1973). Foundations of behavioral research. New York, NY: Holt, Rinehart
and Winston.
Kester, E., & Peña, E. (2002). Language ability assessment of Spanish-English
bilinguals: Future directions. Practical Assessment, Research & Evaluation, 8(4).
Retrieved March 31, 2003, from http://ericae.net/pare/getvn.asp?v=8&n=4
Kindler, A. L. (2002). Survey of the states limited English proficient students and
available educational programs and services, 2000-2001 Summary Report.
National Clearinghouse for English Language Acquisition and Language
Instruction Educational Programs.
Kloosterman, V. (1997). Building a bridge: A combined effort between gifted and
bilingual education. The National Research Center on the Gifted and Talented.
99
Retrieved April 7, 2003, from
http://www.sp.uconn.edu/~nrcgt/news/spring97/sprng972.html
Kloosterman, V. (1999). Socio-cultural contexts for talent development: A qualitative
study on high ability, Hispanic, bilingual students. The National Research Center
on the Gifted and Talented. Retrieved from
http://www.gifted.uconn.edu/klooster.html
LaFontaine, H. (1987). At-risk children and youth- The extra educational challenge of
limited English proficient students. Paper presented to the Council of Chief State
School Officers, Washington, DC.
Landrum, M. S., Katsiyannis, A., & DeWaard, J. (1998). A national survey of current
legislative and policy trends in gifted education: Life after the National
Excellence report. Journal for the Education of the Gifted, 21(3), 352-371.
Lara-Alecio, R., & Irby, B. (1993). Identifying the bilingual gifted. Paper presented to the
22nd National Association of Bilingual Education Annual Conference, Houston,
TX.
Lara-Alecio, R., & Irby, B. (2000). The culturally and linguistically diverse gifted. In C.
Reynolds (Ed.)., Encyclopedia of special education (pp. 506-510). New York:
John Wiley & Son.
Lara-Alecio, R., Irby, B., & Walker, M.V. (1997). Diversity of the gifted. Retrieved from
http://ldn.tamu.edu/Archives/program/articles/gifted.pdf
Marín, G., & Marín, B. (1991). Research with Hispanic populations. Applied Social
Research Methods Series, 23, p. 66-81.

100
Marquez, J., Bermúdez, A., & Rakow. S. (1992). Incorporating community perceptions in
the identification of gifted and talented Hispanic students. The Journal of
Educational Issues of Language Minority Students, 10, 117-127.
Martinez, R., Norman, R. D., & Delaney, H. D. (1984). A children’s Hispanic
background scale. Hispanic Journal of Behavioral Sciences, 6, 103-112.
Masten, W., Plata, M., Wenglar, K., & Thedford, J. (1999). Acculturation and teacher
ratings of Hispanic and Anglo-American students. Roeper Review, 22(1), 64.
McClellan, E. (1985). Defining giftedness. ERIC Clearinghouse on handicapped and
gifted children. Reston VA. Retrieved October 14, 2003, from
http://www.ericfacility.net/databases/ERIC_Digests/ed262519.html
Mclean, Zina Y. (1995). History of bilingual assessment and its impact on best practices
used today. New York State Association for Bilingual Education Journal, 10, p. 6-
12.
Muñiz, J., Bartram, D., Evers, A., Boben, D., Matesic, K., Glabeke, K., Fernández-
Hermida, J. R., & Zaal, J. N. (2001). Testing practices in European countries.
European Journal of Psychological Assessment, 17(3), 201-211. Retrieved
February 17, 2003 from
http://www.efpa.be/TaskForce/Testing%20Practices%20in%20European%20Cou
ntries.htm
Muñoz-Sandoval, A., Cummins, J., Alvarado, G., & Ruef, M. (1998). Bilingual Verbal
Ability Tests, comprehensive manual. Itasca, IL: Riverside Publishing.
Muñoz-Sandoval, A., Cummins, J., Alvarado, G., & Ruef, M. (2003). Bilingual Verbal

101
Bilingual Verbal Ability Tests, features. Retrieved March 31, 2003, from
http://www.riverpub.com/products/clinical/bvat/features.html
Naglieri, J. A., & Ford, D. (2003). Addressing underrepresentation of gifted minority
children using the Naglieri Nonverbal Ability Test (NNAT). Gifted Child
Quarterly, 47(2), 155-160.
National Center for Education Statistics. (n.d.). National Education Longitudinal study of
1988. Retrieved August 17, 2003, from http://nces.ed.gov/surveys/nels88/
National excellence: The case for developing America's talent (1993). Retrieved August
19, 2003, from http://www.ed.gov/pubs/DevTalent/intro.html#ExecSumm
Newsom, J. (2003). A quick primer on explanatory factor analysis. Retrieved October 20,
2003, from http://www.upa.pdx.edu/IOA/newsom/semclass/ho_efa.doc
Ortíz, V., & González, A. (1989). Validation of a short form of the WISC-R with
accelerated & gifted Hispanic students. Gifted Child Quarterly, 33, 152-155.
Passow, A. H. (1981). The nature of giftedness and talent. Gifted Child Quarterly, 25(1),
5-10.
Passow, A. H. (1986, February). Educational programs for minority/disadvantaged gifted
students. Paper prepared for presentation in the Distinguished Lecture Series of
the San Diego Unified School District, CA.
Passow, A. H., & Frazier, M. M. (1996). Toward improving identification of talent
potential among minority and disadvantaged students. Roeper Review, 18, 198-
202.
Plata, M., & Masten, W. (1999). Teacher ratings of Hispanic and Anglo students on a
behavior rating scale. Roeper Review, 21(2), 139.

102
Plata, M., Masten, W. & Trusty, J. (1999). Teachers’ perception and nomination of fifth
grade Hispanic and Anglo students. Journal of Research and Development in
Education, 32 (2), 113-123.
Plucker, J., Callahan, C., & Tomchin, E. (1996). Wherefore art thou, multiple
intelligences? Alternative assessments for identifying talent in ethnically diverse
and low-income students. Gifted Child Quarterly, 40, 81-92.
Quintero, K., & Cooks, J. (2002). Teaching to the test when one size doesn’t fill all.
Voices from the Middle, 10(1), 60-61. Retrieved February 17, 2003, from
http://www.ncte.org/pdfs/subscribers-only/vm/0101-sept02/VM0101Shades.pdf
Renzulli, J. S. (1986). The three-ring conception of giftedness: A developmental model
for creative productivity. In R. J. Sternberg & J. E. Davidson (Eds.), Conceptions
of giftedness (pp. 53-92). Cambridge, England: Cambridge University Press.
Renzulli, J. S. (1998). The three ring conception of giftedness. In S. M. Baum, S. Reis, &
L. R. Maxfield (Eds.), Nurturing the gifts and talents of primary grade students.
Mansfield Center, CT: Creative Learning Press. Retrieved from
http://sp.uconn.edu/~nrcgt/sem/semart13.html
Renzulli, J. S. (1999). What is this thing called giftedness, and how do we develop it? A
twenty-five year perspective. Journal for the Education of the Gifted, 23(1), 3-54.
Retrieved from http://www.sp.uconn.edu/~nrcgt/sem/semart14.html
Renzulli, J. S., Harman, R. K., & Callahan, C. M. (1971). Teacher identification of
superior students. Exceptional Children, 38, 211-214, 243-248.

103
Reyes, E., Fletcher, R., & Paez, D. (1996). Developing local multidimensional screening
procedures for identifying giftedness among Mexican American border
population. Roeper Review, 18, 208-211.
Robinson, A. (1998). Giftedness: An exceptionality examined. Review of Psychology, 49,
117-139.
Rodriguez, O. (1992). Technical and societal issues. In K. Geisinger (Ed.).,
Psychological testing of Hispanics (pp.11-15). Washington, DC: American
Psychological Association.
Rueda, R., & Mercer, J. (1985). A predictive analysis of decision-making practices with
limited English proficient handicapped students. Paper presented at the Third
Annual Symposium for Bilingual Special Education, Evaluation, and Research,
University of Colorado and Council for Exceptional Children, Northglenn, CO.
Sarouphim, K. M. (1999). DISCOVER: A promising alternative assessment for the
identification of gifted minorities. Gifted Child Quarterly, 43, 244-251.
Sarouphim, K. M. (2002). DISCOVER in high school: Identifying gifted Hispanic and
native American students. The Journal of Secondary Gifted Education, 14, 30-38.
Scott, M. S., Deuel, L., Jean-Francois, B., & Urbano, R. (1996). Identifying cognitively
gifted ethnic minority children. Gifted Child Quarterly, 40, 147-153.
Scott, M. S., Perou, R., Urbano, R., Hogan, A., & Gold, S. (1992). The identification of
giftedness: A comparison of White, Hispanic and Black families. Gifted Child
Quarterly, 36(3), 131-139.

104
Sherman, L. (1997). The “Quiet Crisis”, the educational needs of gifted students often go
unmet. Northwest Education Research Review. Retrieved August 17, 2003, from
http://www.nwrel.org/nwedu/fall_97/article1.html
Stansfield, C. (n.d.). Review of the BVAT. Mental Measurement Yearbook 14. Retrieved
from Silverplatter database.
Sternberg, R. J. (1985). Beyond IQ: A triarchic theory of human intelligence. New York:
Cambridge University Press.
Tabachnick, B. G., & Fidell, L. S. (2001). Using multivariate statistics (4th ed.). Needham
Heights, MA: Allyn & Bacon.
Tallent-Runnels, M. K., & Martin, M. R. (1992). Identifying Hispanic gifted children
using the Screening Assessment for Gifted Elementary Students. Psychological
Reports, 70, 939-942.
Texas Association for the Gifted and Talented. (n.d.). TAGT 2002-2003 State Public
Policy Priorities. Retrieved from
http://www.txgifted.org/Overview/Services/GovRel/2003TAGTstateagenda.html
Texas Education Agency. (1999). District effectiveness and compliance. Reference guide
part I for GT education. Retrieved from http://www.tea.state.tx.us/gted/gtdec.htm
Texas Education Agency (2001-2002). Academic Excellence Indicator System. Retrieved
from
http://www.tea.state.tx.us/cgi/sas8/broker?_service=marykay&_program=perfrept
.perfmast.sas&prgopt=2002/aeis/campus.sas&year4=2002&search=campback&y
ear2=02&topic=aeis&gifname=g_aeis2002campus&title=AEIS+Report&level=C
ampus&campback=021902109

105
Texas Education Agency (2003). Academic Excellence Indicator System (AEIS).
Retrieved from http://www.tea.state.tx.us/perfreport/aeis/2003/state.html
Texas Education Agency. (2001). Lists of approved tests for assessment of limited
English proficient students. Retrieved July 24, 2003, from http://www.
tea.state.tx.us/curriculum/biltest.doc
Tyack, D. B. (1974). The one best system: A history of American urban education.
Cambridge, MA: Harvard University Press.
Udall, A. J. (1987). Peer referral as a process for locating Hispanic students who may be
gifted (Doctoral dissertation, University of Arizona, 1987). Dissertation Abstracts
International, 49, 04A.
USA Today. (2003). Census: Hispanic population continues to surge. Retrieved October
14, 2003, from http://www.ncela.gwu.edu/states/census.htm
U.S. Census Bureau. (2000). Hispanic population in the United States. Retrieved August,
20th, 2002, from http://www.census.gov/population/socdemo/hispanic/p20-
535/p20-535.pdf
U.S. Census Bureau. (2001). Census 2000 paints statistical portrait of the nation’s
Hispanic population. Retrieved March 31, 2004, from
http://www.census.gov/Press-Release/www/2001/cb01-81.html
U.S. Census Bureau. (2002). Facts & features. Retrieved March 31st, 2003, from
http://www.census.gov/Press-Release/www/2002/cb02ff15.html
U.S. Department of Education, Office of Educational Research and Improvement. (1993).
National excellence: A case for developing America’s talented. Washington, DC:

106
U.S. Government Printing Office. Retrieved March 15th, 2003, from
http://www.ed.gov/pubs/DevTalent/part2.html
Valdés, G. (2003). Expanding definitions of giftedness, the case of young interpreters
from immigrant communities. Mahwah, NJ: Lawrence Erlbaum Associates.
Valencia, R., & Suzuki (2001). Intelligence testing and minority students. Thousand
Oaks, CA: Sage Publications.
Vanderslice, R. (1998). Hispanic children and giftedness: Why the difficulty in
identification? (Eric Reproduction Document No.ED 445436).
Warger, C., & Burnette, J. (2000). Five strategies to reduce overrepresentation of
culturally and linguistically diverse students in special education. ERIC/OSEP
Digest #E596. Retrieved October 14, 2003, from
http://firstsearch.oclc.org/webz/FSFETCH?fetchtype=fullrecord:sessionid=sp01s
w01-41694-dls3dld

107
APPENDIX A
Correlation Matrix Items 1 through 15 from the HBGSI
1 2 3 4 5 6 7 8 9 10 11 12 13 14 15
1
2 .85
3 .76 .71
4 .76 .71 .83
5 .51 .52 .60 .61
6 .50 .52 .56 .59 .83
7 .41 .45 .47 .47 .72 .71
8 00 -.03 .01 .00 .14 .17 .17
9 .32 .32 .32 .37 .47 .53 .54 .19
10 .35 .36 .37 .37 .48 .51 .53 .14 .68
11 .26 .23 .32 .33 .41 .44 .45 .20 .53 .52
12 .29 .27 .28 .31 .38 .40 .37 .12 .45 .34 .52
13 .31 .32 .36 .39 .44 .48 .52 .17 .62 .54 .53 .46
14 .27 .28 .31 .30 .41 .48 .48 .13 .54 .47 .50 .46 .49
15 .33 .30 .36 .37 .46 .50 .50 .19 .64 .53 .71 .60 .63 .66Note. Correlation is significant at the 0.01 level (2-tailed)

108
APPENDIX B
Graph 1 HBGSI scree plot

109
APPENDIX C
Eigenvalues for the HBGSI
Total Variance Explained Initial Eigenvalues Extraction Sums of Squared Loadings
Factor Total % of Variance Cumulative % Total % of Variance Cumulative %
1 35.87 45.98 45.98 35.87 45.98 45.98 2 4.34 5.56 51.55 4.34 5.56 51.55 3 2.82 3.61 55.17 2.82 3.61 55.17 4 2.79 3.57 58.74 2.79 3.57 58.74 5 1.78 2.28 61.03 1.78 2.28 61.03 6 1.45 1.85 62.89 1.45 1.85 62.89 7 1.41 1.81 64.71 1.41 1.81 64.71 8 1.29 1.65 66.36 1.29 1.65 66.36 9 1.14 1.47 67.83 1.14 1.47 67.83 10 1.04 1.34 69.17 1.04 1.3 69.17 11 .95 1.22 70.39
Note. Extraction Method: Principal Component Analysis

110
APPENDIX D
Un-rotated Component Matrix for the HBGSI
Factors Item number 1 2 3 4 5 6 7 8 9 10
1 .56 -.03 .68 -.08 -.04 -.02 .01 .03 .11 .00 2 .59 .01 .63 -.07 -.12 .00 .05 .00 .05 .00 3 .55 -.09 .69 .05 -.04 -.13 -.07 -.02 .06 .00 4 .58 -.11 .65 .01 -.06 -.05 -.06 -.02 .15 -.01 5 .72 -.02 .30 .16 .03 .03 -.20 -.12 -.06 -.10 6 .73 -.05 .25 .15 .02 .11 -.28 -.14 -.05 -.10 7 .71 -.11 .10 .18 .02 .03 -.24 -.23 -.13 -.05 8 .16 -.01 -.14 .28 .25 .22 -.24 .02 .05 .40 9 .72 -.31 -.15 .18 .00 -.01 -.03 .00 .06 .00 10 .72 -.16 -.13 .11 -.10 -.18 -.10 -.07 .04 .00 11 .55 -.42 -.07 .13 .10 -.04 -.23 .17 -.06 .28 12 .48 -.33 .05 .13 .16 .20 -.17 .29 -.20 .08 13 .63 -.48 -.06 .23 -.01 .10 .09 -.09 .04 .05 14 .57 -.30 -.06 .18 -.02 .04 -.24 .34 -.17 -.11 15 .62 -.45 -.04 .19 .06 .02 -.21 .24 -.12 .11 16 .79 -.23 .02 -.11 -.11 .07 -.03 .10 .19 -.04 17 .66 -.31 .04 -.04 -.16 -.03 .07 .21 .24 .05 18 .78 -.27 -.04 -.17 -.17 .06 .08 .15 .18 .04 19 .78 -.23 .00 -.18 -.19 .06 .08 .15 .25 .02 20 .66 -.27 -.10 .13 .18 -.29 .06 -.02 .14 .07 21 .65 -.22 -.13 .10 .01 -.25 .10 -.16 -.05 -.04 22 .62 -.36 -.11 .19 -.01 .17 .15 -.17 -.01 -.18 23 .72 -.09 -.12 -.07 -.21 -.04 .00 -.01 -.03 -.12 24 .77 -.33 -.10 .10 -.12 -.03 .09 -.13 -.04 -.08 25 .78 -.03 -.14 -.06 -.17 .01 -.11 -.09 -.08 -.17 26 .81 -.13 -.03 -.16 -.09 .11 -.06 .07 .03 -.02
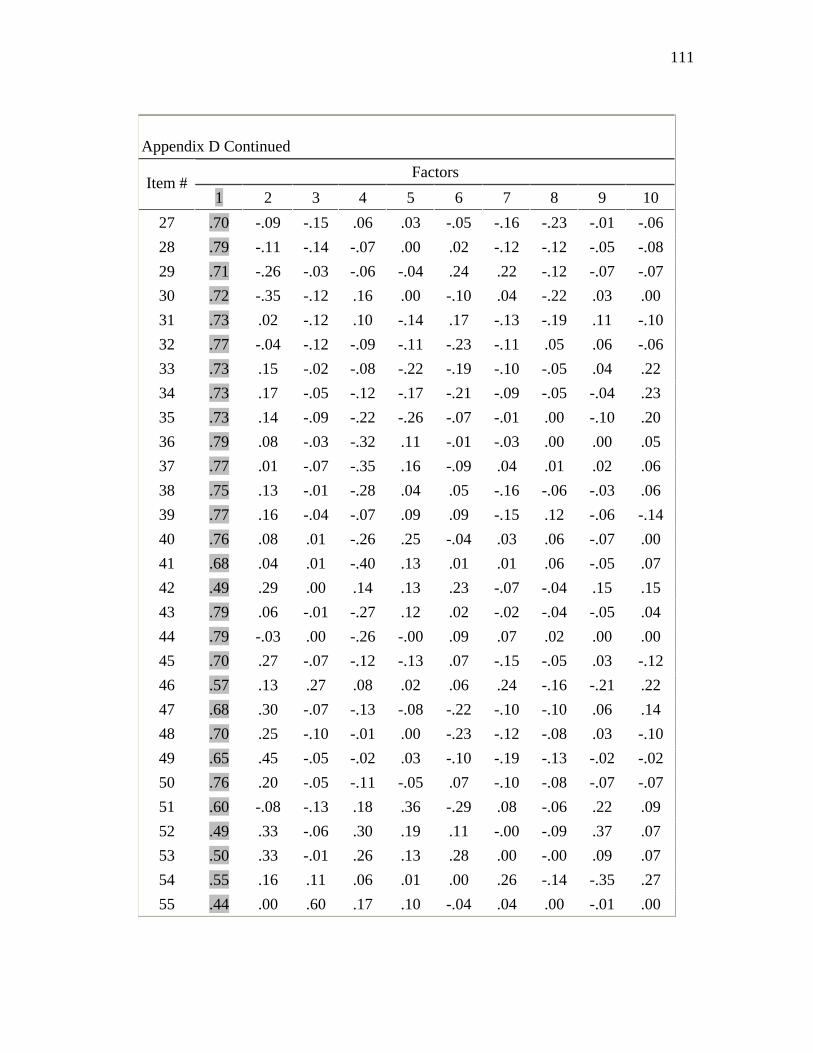
111
Appendix D Continued
Factors Item #
1 2 3 4 5 6 7 8 9 10 27 .70 -.09 -.15 .06 .03 -.05 -.16 -.23 -.01 -.06 28 .79 -.11 -.14 -.07 .00 .02 -.12 -.12 -.05 -.08 29 .71 -.26 -.03 -.06 -.04 .24 .22 -.12 -.07 -.07 30 .72 -.35 -.12 .16 .00 -.10 .04 -.22 .03 .00 31 .73 .02 -.12 .10 -.14 .17 -.13 -.19 .11 -.10 32 .77 -.04 -.12 -.09 -.11 -.23 -.11 .05 .06 -.06 33 .73 .15 -.02 -.08 -.22 -.19 -.10 -.05 .04 .22 34 .73 .17 -.05 -.12 -.17 -.21 -.09 -.05 -.04 .23 35 .73 .14 -.09 -.22 -.26 -.07 -.01 .00 -.10 .20 36 .79 .08 -.03 -.32 .11 -.01 -.03 .00 .00 .05 37 .77 .01 -.07 -.35 .16 -.09 .04 .01 .02 .06 38 .75 .13 -.01 -.28 .04 .05 -.16 -.06 -.03 .06 39 .77 .16 -.04 -.07 .09 .09 -.15 .12 -.06 -.14 40 .76 .08 .01 -.26 .25 -.04 .03 .06 -.07 .00 41 .68 .04 .01 -.40 .13 .01 .01 .06 -.05 .07 42 .49 .29 .00 .14 .13 .23 -.07 -.04 .15 .15 43 .79 .06 -.01 -.27 .12 .02 -.02 -.04 -.05 .04 44 .79 -.03 .00 -.26 -.00 .09 .07 .02 .00 .00 45 .70 .27 -.07 -.12 -.13 .07 -.15 -.05 .03 -.12 46 .57 .13 .27 .08 .02 .06 .24 -.16 -.21 .22 47 .68 .30 -.07 -.13 -.08 -.22 -.10 -.10 .06 .14 48 .70 .25 -.10 -.01 .00 -.23 -.12 -.08 .03 -.10 49 .65 .45 -.05 -.02 .03 -.10 -.19 -.13 -.02 -.02 50 .76 .20 -.05 -.11 -.05 .07 -.10 -.08 -.07 -.07 51 .60 -.08 -.13 .18 .36 -.29 .08 -.06 .22 .09 52 .49 .33 -.06 .30 .19 .11 -.00 -.09 .37 .07 53 .50 .33 -.01 .26 .13 .28 .00 -.00 .09 .07 54 .55 .16 .11 .06 .01 .00 .26 -.14 -.35 .27 55 .44 .00 .60 .17 .10 -.04 .04 .00 -.01 .00
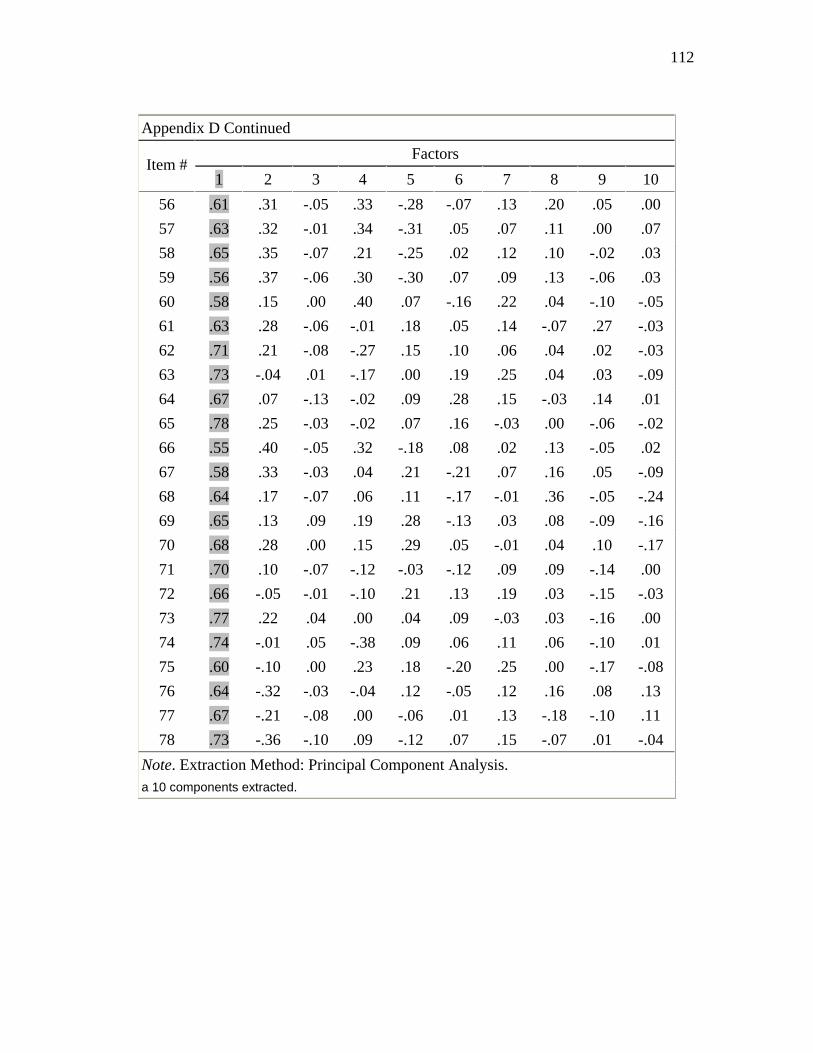
112
Appendix D Continued
Factors Item #
1 2 3 4 5 6 7 8 9 10 56 .61 .31 -.05 .33 -.28 -.07 .13 .20 .05 .00 57 .63 .32 -.01 .34 -.31 .05 .07 .11 .00 .07 58 .65 .35 -.07 .21 -.25 .02 .12 .10 -.02 .03 59 .56 .37 -.06 .30 -.30 .07 .09 .13 -.06 .03 60 .58 .15 .00 .40 .07 -.16 .22 .04 -.10 -.05 61 .63 .28 -.06 -.01 .18 .05 .14 -.07 .27 -.03 62 .71 .21 -.08 -.27 .15 .10 .06 .04 .02 -.03 63 .73 -.04 .01 -.17 .00 .19 .25 .04 .03 -.09 64 .67 .07 -.13 -.02 .09 .28 .15 -.03 .14 .01 65 .78 .25 -.03 -.02 .07 .16 -.03 .00 -.06 -.02 66 .55 .40 -.05 .32 -.18 .08 .02 .13 -.05 .02 67 .58 .33 -.03 .04 .21 -.21 .07 .16 .05 -.09 68 .64 .17 -.07 .06 .11 -.17 -.01 .36 -.05 -.24 69 .65 .13 .09 .19 .28 -.13 .03 .08 -.09 -.16 70 .68 .28 .00 .15 .29 .05 -.01 .04 .10 -.17 71 .70 .10 -.07 -.12 -.03 -.12 .09 .09 -.14 .00 72 .66 -.05 -.01 -.10 .21 .13 .19 .03 -.15 -.03 73 .77 .22 .04 .00 .04 .09 -.03 .03 -.16 .00 74 .74 -.01 .05 -.38 .09 .06 .11 .06 -.10 .01 75 .60 -.10 .00 .23 .18 -.20 .25 .00 -.17 -.08 76 .64 -.32 -.03 -.04 .12 -.05 .12 .16 .08 .13 77 .67 -.21 -.08 .00 -.06 .01 .13 -.18 -.10 .11 78 .73 -.36 -.10 .09 -.12 .07 .15 -.07 .01 -.04
Note. Extraction Method: Principal Component Analysis. a 10 components extracted.

113
APPENDIX E
Factor Plot of Rotated Factor Loadings and Item Numbers
33
34
35
3637
38
39
40
41
42
43
44
45
46
47
48
49
50
61
62
63
64
65
71
72
73
74
9
10
11
12
13
14
151617
181920
21
22
23
24
252627
29
30
31
32
76
77
78
52
53
54
5657
58
59
60
66
1
2
34
56
7
55
51
6768
69
70
7528
0
0.1
0.2
0.3
0.4
0.5
0.6
0.7
0.8
0.9
0 5 10 15 20 25 30 35 40 45 50 55 60 65 70 75
Item number
Fact
or lo
adin
g
Factor 1 Factor 2 Factor 3 Factor 4 Factor 5

114
VITA
Mónica Viviana S. Fultz
101 Brewer St Navasota, Texas 77868
936-870-3100 (Office)/ 936-825-5600 (Mobile) e-mail: [email protected]
PROFESSIONAL INTERESTS Bilingual Education/ESL Education Bilingual Assessment and Evaluation Bilingual Content Areas of Instruction Hispanic Parental Involvement Hispanic Gifted Identification Adult Learning EDUCATION 2004 Ph.D. Texas A&M University (Educational Psychology-Foundations) 1999 M.A. Prairie View A&M University (School Counseling) 1987 BS Instituto Nacional del Profesorado Secundario, Argentina
(Education) ACADEMIC LANGUAGES Spanish English