psychometric properties of the big five questionnaire ... properties of the big five...
TRANSCRIPT

Psychometric Properties of the Big Five Questionnaire-Children (BFQ-C)
in American Adolescents
by
Vanesa Gaio
A Thesis Presented in Partial Fulfillment of the Requirements for the Degree
Master of Arts
Approved November 2011 by the Graduate Supervisory Committee:
Linda C. Caterino, Chair
Marilyn Thompson Paul A. Miller
ARIZONA STATE UNIVERSITY
May 2012

i
ABSTRACT
The five-factor model of personality is a conceptual model for describing
personality, and represents five traits which are theorized to interact with each
other to form personality. The Big Five Questionnaire-Children (BFQ-C) was
developed by Barbaranelli, Caprara, Rabasca and Pastorelli (2003) specifically to
measure the five factor model in children. The original version was in Italian, but
it has subsequently been translated and used in Dutch, German, and Spanish
samples. Given that the BFQ-C has support in Europe, obtained in four different
languages it seems promising as an assessment of personality for English
speaking children and adolescents. The BFQ-C was translated into English
utilizing translation and back translation in order to maintain a high conceptual
equivalency. The current study utilizes principal components analysis in order to
examine the structure of the English language translation of the BFQ-C in a
sample of American adolescents. Results indicate that in contrast to the Italian
study, findings from this study suggest a six component solution as the most
effective interpretation of the data.

ii
DEDICATION
For Heath and Rachel, you gave up so much for this. Thank you.

iii
ACKNOWLEDGMENTS
This Thesis would never have been written if not for the
Contributions of the following people:
Linda Caterino, PhD; Amanda Sullivan, PhD; Paul Miller, PhD; Marilyn
Thompson, PhD; Marley W. Watkins, PhD; Joseph Mahoney, MA; Rachelle
Beard, MA; Louise DeBusk; Rebecca DeBusk, and April Sandoval.
iv
TABLE OF CONTENTS
CHAPTER Page
LIST OF TABLES .................................................................................................... vi
1 INTRODUCTION AND LITERATURE REVIEW ................................. 1
Personality ............................................................................... 1
The Big Five in the prediction of behavior ................................ 8
Personality Measures ............................................................ 13
Assessment of the 5 Factor Model ......................................... 14
Parent-teacher ratings of personality ................................. 14
Self-reports of personality .................................................. 15
Modified adult measures of the five factor model of personality
............................................................................................... 16
Modified alternative measures of the five factor model of
personality .............................................................................. 23
Child- and adolescent- specific measures of the five factor
model of personality ............................................................... 24
Summary ................................................................................ 31
Hypotheses ............................................................................ 33
2 METHOD…. .................................................................................... 34
Participants ............................................................................. 34
Procedure ............................................................................... 34
Measure ................................................................................. 35
Proposed Statistical Analysis ................................................. 36

v
CHAPTER Page
3 RESULTS… ............................................ ………….. ……………….40
Statistical Analysis .................................................................. 40
Examination of Reliability and Factor Independence ............. 52
4 DISCUSSION…. ........................................................................ 54
REFERENCES ................................................................................................ 81
APPENDIX
A BIG FIVE QUESTIONNAIRE-CHILDREN ...................................... 94
B THE COMPONENTS OF THE BFQ-C AS FOUND IN ITALIAN
SAMPLE OF ADOLESCENTS ................................................... 98
C THE COMPONENTS OF THE BFQ-C AS FOUND IN AN
AMERICAN SAMPLE OF ADOLESCENTS ............................ 102
D IRB APPROVAL .......................................................................... 106

vi
LIST OF TABLES
Table Page
1. Big Five Questionnaire-Children: Demographics Characteristics of
Participants; Gender, Ethnicity, and School Participation .............. 63
2. Means, Standard Deviations, Skew, and Kurtosis for Items on the Big
Five Questionnaire – Children (BFQ-C) ......................................... 64
3. Pattern Coefficients Following Oblimin Rotation for the Big Five
Questionnaire- Children Seven Component Solution .................... 67
4. Pattern Coefficients Following Oblimin Rotation for the Big Five
Questionnaire – Children Six Component Solution ....................... 70
5. Pattern Coefficients Following Oblimin Rotation for the Big Five
Questionnaire – Children Five Component Solution ..................... 73
6. Total Variance Explained by the Six Component Solution of the
BFQ-C ............................................................................................ 76
7. Component Correlations and Alpha Coefficients for the Big Five
Questionnaire-Children ................................................................. 77
8. Item-total Scale Correlations of the BFQ-C with Oblimin Oblique
Rotation and Coefficient Alphas ..................................................... 78

1
Chapter 1
Personality
What is personality? In order to answer this question, one must be
familiar with basic theories of personality, most of which have developed in the
last 70 years. One of the first researchers in the structure of personality was
Raymond Cattell (1955). He conceptualized personality as being made up of 16
distinct personality traits. Other researchers found evidence of three factors
(Eysenck, 1975), and also five factors (Goldberg, 1990). All of these theories are
based loosely upon Allport’s Trait Theory of personality (Allport, 1937; as cited in
John & Srivastava, 1999), the basic premise of which is that traits, “represent
generalized personality dispositions that account for regularities in the functioning
of a person across situations and over time” (Pervin, Cervone, & Oliver, 2005, p.
232). In order to provide a descriptive model of personality, theoreticians and
researchers created a unified definition of personality domains. This overarching
definition, referred to as a taxonomy, can enable researchers to understand
specific instances of behavior in a simplified way, thus permitting the study of
personality characteristics as a whole, rather than as thousands of individual
human characteristics. Additionally, taxonomies provide a standardized
vocabulary which facilitates research in the field (John, Naumann, & Soto, 2008).
Based on the work being done in Germany by Klages (1926) and
Baumgarten (1933), Allport and Odbert (1936) used natural language as a
source of attributes in developing a scientific taxonomy of personality. This
natural language, the basis for the lexical approach, begins with the extraction of
all personality-related terms found in the dictionary. The lexical hypothesis posits
that most of the socially relevant and salient personality characteristics have

2
become encoded in natural language (Allport, 1937; as cited in John &
Srivastava, 1999). This personality vocabulary provides extensive sets of
attributes that speakers of a language have found important and useful in daily
living (Goldberg, 1981). Using a lexical study of personality-relevant terms found
in the English dictionary, Allport and Odbert included 18,000 terms that could be
used to “distinguish the behavior of one human being from that of another”
(Allport & Odbert, 1937, p. 24, as cited in John & Srivastava, 1999). From these
18,000 terms, they identified six major categories: 1) personality traits; 2)
temporary states; 3) highly evaluative judgments of personal conduct and
reputation; and 4) physical characteristics, capacities, and talents; Additional
areas included: 5) terms of doubtful relevance to personality; and 6) any other
terms not assigned elsewhere.
Norman’s (1967) work elaborated on Allport and Odbert’s initial
classification and like them, he classified terms from the dictionary into mutually
exclusive categories. He then divided the domain of personality into seven
content categories that can describe an individual: enduring traits, internal states,
physical states, activities, effects on others, roles, and social evaluations of
conduct. However, some of these categories were unclear and overlapping (John
& Srivastava, 1999).
In order to clarify Norman’s (1967) categories, Chaplin, John, and
Goldberg (1988) conceptualized the prototype of personality. In this conception,
each category was defined in terms of its clear cases rather than its boundaries;
and category membership need not be discrete but rather, could be defined as
continuous. A distinction was made between prototypical states and prototypical
traits. Prototypical states are seen as temporary, brief, and externally caused. In

3
contrast, prototypical traits are seen as stable, long-lasting, and internally
caused. These traits require more frequent observation across a wider range of
situations (as compared to states) before they are attributed to an individual. This
was a widely shared view, and confirmed the conceptual definitions of traits and
states (John & Srivastava, 1999).
Using Allport and Odbert’s list of traits as a starting point, Cattell
developed his multidimensional model of personality structure (John &
Srivastava, 1999). The multidimensional model of personality structure posits
that taxonomies must provide a systematic framework for distinguishing,
ordering, and naming individual differences in people’s behavior and experiences
(John, 1989). In developing his framework, Cattell (1943) reduced Allport’s list of
4,500 trait terms to 35 variables. The data-analytic limitations of the time guided
this reduction process; specifically, factor analyses were time consuming and
costly. Using this set of 35 variables, he conducted several oblique factor
analyses and found 12 personality factors which later became part of his 16
Personality Factors questionnaire (16PF; Cattell, Eber, & Tatsuoka, 1970).
Although Cattell claimed that these factors showed excellent
correspondence across methods, some doubt was expressed by other
researchers (e.g., Becker, 1960; Nowakowska, 1973; as cited in Tupes &
Christal, 1961; reprinted 1992), and a reanalysis of his correlation matrices has
not confirmed the number and nature of the factors he proposed (e.g., Tupes &
Christal, 1961; reprinted 1992). Despite this contradictory evidence, the second-
order factors of the 16PF show some correspondence with those factors that
would later be referred to as big five factors. Several studies analyzed the 16
variables that Cattell identified, but found that only five factors could be replicated
4
reliably (Digman & Takemoto-Chock, 1981; Digman & Inouye, 1986; McCrae &
Costa, 1987).
A major proponent of a more parsimonious structure for personality was
Eysenck (1975). Recognizing that 16 was not the most parsimonious
explanation, Eysenck eventually proposed a 3-factor theory of personality that he
believed could explain human personality more succinctly than Cattell’s 16
factors. Eysenck’s theory was originally based on the idea of two universal traits,
Introversion/Extraversion, and Neuroticism/Emotional Stability. Introversion
focuses on inner states of being, while Extraversion focuses on external stimuli.
Neuroticism/Emotional stability refers to a tendency to become easily upset or
emotional or to remain more stable emotionally. These two traits were found to
be minimally correlated with each other; theoretically, any person had one or the
other of these traits to a greater or lesser degree, thereby explaining the
personality of that individual (Pervin et al., 2005). Following years of clinical
research, Eysenck introduced a third dimension to his personality system, that of
Psychoticism. According to Eysenck, people who scored high on this dimension
seemed to exhibit more maladaptive behaviors, such as being opposed to
accepted social customs, insensitivity, and a lack of caring for others (Pervin et
al., 2005).
Many researchers (e.g., Kamphaus & Frick, 2005) argued that Eysenck’s
Three Factor Theory was too narrow and could not adequately describe
personality characteristics. Goldberg (1981) continued the development of a
theoretical successor, known as the five factor model. This model was again
based on the work begun by Allport and Odbert (1936). Prior to Goldberg’s work,
Fiske (1949) constructed simplified descriptions from 22 of Cattell’s (1943)

5
variables and found that the five factors derived from self, peer, and
psychological staff ratings were very similar across respondents. Tupes and
Christal (1961) reanalyzed correlation matrices from eight different samples and
found “five relatively strong and recurrent factors and nothing more of any
consequence” (1961, p. 14). This five factor structure was replicated by Norman
(1963), Borgatta (1964), and Digman and Takemoto-Chock (1981) in lists derived
from Cattell’s 35 variables. These factors were initially labeled Extraversion or
Surgency (talkative, assertive, energetic), Agreeableness (good-natured,
cooperative, trustful), Conscientiousness (orderly, responsible, dependable),
Emotional Stability versus Neuroticism (calm, not neurotic, not easily upset), and
Culture (intellectual, polished, independent-minded) (Norman, 1963). Together,
these factors eventually became known as the “Big Five” (Goldberg, 1981), thus
labeled in order to emphasize the broad nature of each factor. This nomenclature
was not intended to imply that personality differences can be neatly reduced to
five traits; instead, personality is represented at a very abstract and broad level.
Distinct and specific personality characteristics are summarized by each of the
five dimensions (John, et al., 2008).
Goldberg (1990) subsequently clarified the nature and composition of the
five broad factors in the big five, and tested their stability and generalizability
across methodological variations and data sources using the list of the 75
semantic categories created by Norman (1967). To do so, Goldberg constructed
an inventory of 1,710 trait adjectives that could be used by participants to rate
their own personality. He then scored Norman’s semantic categories as an 8-
step Likert scale ranging from extremely inaccurate to extremely accurate, and
administered this to 187 college students (70 male, and 117 female). He then
6
used factor analysis to determine the inter-correlations in the self-rating trait
adjective data. The first five factors found represented the big five as expected,
replicated across a variety of different methods, and were found to be invariant
across factor rotations.
The big five “provides a descriptive taxonomy that organizes the myriad
natural- language and scientific trait concepts into a single classificatory
framework” (John & Srivistava, 1999, p. 33). Although the big five is able to
distribute personality traits into five factors, this does not mean that personality
differences are found only in five traits. These five dimensions are a much
broader picture of personality than can be found in individual traits. Each of these
dimensions organizes many separate but related traits, which have been deemed
relevant to personality, into one of five categories representing the five main
personality descriptors (John & Srivastava, 1999).
The big five taxonomy was never intended as a comprehensive
personality theory; instead, it is considered a model of personality developed to
account for the structural relations among personality traits (Goldberg, 1993). “In
scientific usage, the word model can refer either to a descriptive framework of
what has been observed, or to a theoretical explanation of causes and
consequences" (Srivastava, 2008, p. 1). Rather than explaining and predicting
outcomes, the five factor model provides an account of personality that is
descriptive rather than explanatory, emphasizes regularities in behavior rather
than dynamics and developmental processes, and focuses on variables rather
than individuals or types of individuals. It also provides a conceptual foundation
that helps to examine theoretical issues.

7
McCrae and Costa (1996; 1999) originally extrapolated their five factor
theory from the work done with the five factor model, as well as the work done
with the 3 factor model of Eysenck. A personality theory, in this instance,
provides an explanatory interpretation of the empirically derived big five
taxonomy. Within the five factor theory, there are five overarching dimensions as
found in the five factor model. However, according to the five factor theory, these
five domains are each comprised of six facets encompassing the components of
the dimension of personality being described. Whereas the domain is a sum of its
facets, the facets themselves offer more specific information about the individual.
This in turn allows for more accurate identification of problems, as well as more
appropriate treatment recommendations (McCrae & Costa, 1996).
The five factor theory posits that all of the big five dimensions have a
genetic basis and must derive, in part, from biological structures and processes,
such as gene loci, brain regions, and neurotransmitters. In this sense, traits have
causal status. The theory also distinguishes between basic tendencies and
characteristic adaptations. Personality traits as basic tendencies refer to the
underlying potentials of the individual. These traits remain stable over the
lifespan. In contrast, characteristic adaptations are defined by the interactions
between basic tendencies and environmental demands that accumulate over
time. These adaptations can undergo change as an individual interacts in more
or less adaptive ways with the environment (John & Srivastava, 1999).
In summary, although Cattell’s 16 factor theory of personality reduced
Allport’s 171 traits to a more manageable 16, it was subsequently found that this
structure could not be reliably replicated. Eysenck introduced a more
parsimonious theory consisting of only three factors. Additional research

8
determined that this structure did not sufficiently account for variances in
personality, and the five factor model was introduced. The five factor model is the
most comprehensive yet parsimonious explanation for personality that is
available to date for use in the study of personality for both children and adults
(John & Srivastava, 1999; Shiner & Caspi, 2003).
The Big Five as a Prediction of Behavior
Individual differences at an early age help shape a child’s life
experiences. It also influences the way in which the child responds to the
environment (Caspi, 1998). Personality is important in the developmental tasks
an individual faces throughout life, particularly during childhood. There is
evidence that personality may add to the predictive power of evaluations in the
study of developmental outcomes of children, being useful in such areas as
adjustment, delinquent behaviors, conduct disorders, and risk behaviors (Ehrler,
Evans, & McGhee, 1999; Graziano & Ward, 1992; John, Caspi, Robins, Moffitt, &
Stouthamer-Loeber, 1994; Robins, John, & Caspi, 1994). Personality can also be
helpful in determining traits that may be implicated in healthy social interactions,
academic outcomes, as well as chronic illness, pain, and possible treatment
options (Costa & McCrae, 1995; Kamphaus & Frick, 2005; Shiner & Caspi,
2003). Personality has also been shown to influence a child’s susceptibility to
maladaptative behaviors and psychopathology (Ingram & Price, 2001).
Inappropriate adjustment during early developmental stages has been
shown to have long lasting negative effects on many life outcomes such as
social, and family adjustment, as well as the development of later disorders
(Hinshaw & Lee, 2003). Research has shown that there is a relationship between
behavior and such disorders as “violence, emotional and behavioral disorders,

9
child maltreatment, substance abuse, delinquency, and learning difficulties”
(Mash and Barkley, 2003, p. 4).
There is evidence for the utility of personality measures to aid in the
prediction of internalizing, which can be considered problems that are related to
over control, and externalizing problems that may be considered related to, or
under control of behavior. Internalizing and externalizing disorders have been
identified by research as the “two broad dimensions of child psychopathology”
(Mash & Barkley, 2003, p. 27). These problems both can affect and interfere with
a child’s development (Barbaranelli, Fida, Paciello, Di Gunta, & Caprera, 2007).
A study by Rubin, Coplan, Fox, and Calkins (1995) found that children who had
poor emotion regulation and were more withdrawn were more likely to develop
internalizing problems, while children who were more social with poor emotion
regulation tended to develop externalizing disorders over time.
Disorders such as ADHD, disruptive behavior disorders such as
oppositional defiant disorder or conduct disorder, and internalizing disorders such
as anxiety and depression have all been shown to reflect aspects of personality
(Werry, 2001). Barkley (1997) suggests that ADHD is simply representing the
very low end of the construct known as Conscientiousness, specifically, the traits
of attention and inhibitory control. The symptom clusters found in ADHD,
inattention, disorganization, and impulsivity, were found to be related to the later
adult personality dimensions of low Conscientiousness, and low Agreeableness
(Nigg, John, Blaskey, Huang-Pollack, Willcutt, Hinshaw, & Pennington, 2001).
Delinquent behaviors, conduct disorders, and other negative outcomes have
been associated with big five personality descriptors, such as low scores on
Agreeableness, and Conscientiousness, and higher scores on Extraversion and

10
Neuroticism (Shiner & Caspi, 2003). Specifically, traits related to impulsivity,
maladjustment and aggressiveness and those related to increased anxiety were
found to increase the probability of continuing or escalating delinquency (Eklund,
Liljeberg, & af Klinteberg, 2010), indicating that both internalizing and
externalizing behaviors can contribute to delinquent behaviors. Cooper, Agocha,
and Sheldon (2000), found that affect regulation motives and personality
accounted for some of the variance found in risky behavior patterns, indicating
that the factors Neuroticism, Surgency (Extraversion), and Impulsivity could be
directly related to alcohol use and risky sexual activities.
Externalizing syndromes appear to be more stable across time than
internalizing problems; however, expression of symptoms for both types of
disorders does not necessarily remain the same (Olweus, 1979). While the
presenting behaviors may change over time, consistency in the general adaptive
or maladaptive patterns of organizing behavior and interacting with the
environment remain the same (Garber, 1984). A predisposition for behavioral
inhibition or disinhibition at an early age has been found to influence child
adjustment throughout life by affecting the way the child is able to adapt to and
assimilate novel situations (Kagan, 1994). The change in the expression of the
behaviors associated with ADHD throughout the educational experience is
relevant. As an example, Barkley (2003) summarizes a typical trajectory of
ADHD beginning with the hyperactive and inattentive behavior found in
preschool, through the difficulties with productivity, organization and peer
relationships found in later years and the development of oppositional and
delinquent behavior patterns.

11
Other areas which have been shown to have associations with
personality include childhood anxiety and depression, which in turn have been
found to be related to reading disorders. Studies have shown depression to be
correlated with the construct of Neuroticism (Kendler, Neale, Kessler, Heath, &
Eaves, 1993). Ialongo, Edelsohn, Werthamer-Larsson, Crocket, & Kellam (1995)
found that first-grade anxiety symptoms were directly related to adaptive
functioning in the fifth grade and were able to predict the levels of anxious
symptoms experienced.
The development of competent social adaptation over time has also been
shown to be related to personality (Shiner & Masten, 2002). Several studies on
relationships in children have found that establishing friendship and acceptance
among peers is one of the most important tasks a child undertakes (Hartup &
Stevens, 1999; Masten & Coatsworth, 1998). Among children all five of the
personality factors are important predictors in social development. Perhaps this is
due to the fact that social functioning requires an interaction of many skills such
as emotional expression, understanding, and the regulation of behavior
(Denham, 1998). Social difficulties in children have been linked to high scores on
Negative Emotionality, and low scores on Constraint, whereas those who score
high on Extraversion and Agreeableness tend to have overall better social
competence (Shiner, 2000). In addition, a study by Beard (2010) found that a
relationship exists between the personality constructs of Conscientiousness and
Intellect/Openness and that of popularity in middle school adolescents.
Personality traits have been shown to be related to general intelligence
(Chamorro-Premuzic & Furnham, 2006) as well as academic outcomes
(Furnham & Chamorro-Premuzic, 2004). Several studies have found that

12
academic outcomes, as well as general intelligence are related to Agreeableness
and Conscientiousness (Busato, Prins, Elshout, & Hamaker, 2000; Fritche,
McIntyre, & Yost, 2002; Musgrave-Marquart, Bromley, & Dalley, 1997; Paunonen
& Ashton, 2001), as well as Openness (Paunonen & Ashton, 2001). There is also
an indication that Conscientiousness is important in predicting performance in
higher education (Di Fabio, & Busconi, 2007; Kappe, & van der Flier, 2009;
Noftle, & Robins, 2007). Specifically, Conscientiousness has been found to
predict improvements in academic achievement through adulthood (Shiner,
2000). Positive Emotionality and Agreeableness have been found to predict
academic outcomes in adolescents (Shiner, 2000). Neuroticism was found to be
positively related to performance in a less stressful environment (Chamorro-
Premuzic, & Furnham, 2003; Kappe, et al., 2009). Results linking higher levels of
Neuroticism to SAT score improvement have also been found by Zyphur, Islam,
and Landis (2007). In another study, Openness was the strongest predictor of
SAT verbal scores, while Conscientiousness predicted both high school and
college grade point average (GPA) (Noftle, et al., 2007).
Research has also demonstrated that there is an interaction between
personality and health (Shiner & Caspi, 2003). There is also evidence that
personality traits, as measured by the Eysenck Personality Questionnaire (EPQ;
Eysenck, 1975), can allow examiners to determine which traits may affect the
implementation of effective treatment programs in pediatric patients. For
example, low levels of extraversion, high levels of psychopathological traits, and
higher levels of neurotic tendencies have been found to be related to poorer
outcomes in treatment programs designed for children with high stress levels
(Pop-Jordanova & Gucev, 2010). There is also evidence for the prediction of the

13
effects of chronic pain in adults on life satisfaction, as well as possibilities related
to personality traits impacting the implementation of effective treatments for pain
(Wombles, 2008). Longitudinal studies have even shown a correlation between
the traits of Conscientiousness and Positive Emotionality with longevity
(Snowdon, & Friesen, 2001). Another study indicated that those who were low on
Agreeableness were linked to a higher risk of disease, such as cardiovascular
illness (Miller, Smith, Turner, Guijarro, & Hallet, 1996).
Personality traits have been shown to be related to risk behaviors,
adjustment, general intelligence (Chamorro-Premuzic & Furnham, 2006), social
competence (Shiner & Caspi, 2003), academic outcomes (Furnham & Chamorro-
Premuzic, 2004), health, and treatment options (Wombles, 2008). “While
personality tests may not lead directly to a diagnostic decision, they can play
other important roles by identifying traits that have implications for the course or
prognosis of a disorder or even for treatment.” (Kamphaus & Frick, 2005, p. 21).
Thus, accurate ways to measure personality are needed.
Personality Measures
Personality as a taxonomy is an individual’s pattern of interaction with the
environment that is characterized by a unique organization of factors
(Kleinmuntz, 1967). With this taxonomy in place, these factors can then be
measured by personality tests. A definition of psychological tests was given by
Kleinmuntz (1967) as “a standardized instrument or systematic procedure
designed to obtain an objective measure of a sample of behavior” (p. 27-28).

14
Assessment of the 5 Factor Model
Parent-teacher ratings of personality. Childhood personality has been
predominantly addressed with parent-teacher ratings (Barbaranelli et al., 2008),
with parent-teacher ratings being used almost exclusively in the preadolescent
age range (Markey, Markey, Tinsley, & Erickson, 2002). The most commonly
used parent-teacher rating scales include the California Child Q-Set (CCQ; Block
& Block, 1980), the Hierarchical Personality Inventory for Children (HiPIC;
Merveilde & De Fruyt, 1999), and the NEO-Personality Inventory-Revised (NEO-
PI-R; Costa & McCrae, 1992).
Parent and teacher reports may be valuable tools in determining child
personality and behavior, as they give insight into the child in several different
settings (John & Robins, 1993; Barbaranelli et al., 2003; 2008). In addition, these
reports provide information from an outside observers’ point of view. Both parent
and teacher reports reduce the risk of biases associated with self-reports, such
as endorsement of traits that are socially desirable (Kamphaus & Frick, 2005).
Although parents tend to produce more differentiated ratings of their children’s
personality and behaviors than do teachers, possibly related to a parent’s ability
to observe a child across time and situations, teachers tend to be more accurate
in rating the child’s behaviors in the classroom, as related to other children.
Increased teacher report accuracy has been attributed to their ability to assess
the child in a structured setting with a comparison group available from which to
directly contrast the child’s behavior (Kamphaus & Frick, 2005). The lack of this
direct comparison to others may help explain why parents tend to report higher
estimates of behavioral problems in their own children (Loeber, Green, Lahey, &
Strouthamer-Loeber, 1991). Although parent-teacher personality reports have

15
benefits, they exhibit low inter-rater reliability between parent and teacher
(Reynolds & Kamphaus, 1992).
Self-reports of personality. Recognizing the problems with parent-
teacher reports, researchers have focused on child self-report measures of
personality. Theoretically, these measures are able to tap the internal state of the
child, something that parents and teachers are less likely able to do (Barbaranelli
et al, 2003; Branje, Van Lieshout, & Gerris, 2007; John & Robins, 1993;
Kamphaus & Frick, 2005).
Child self-reports offer several benefits that are lacking in either parent or
teacher reports. An individual who examines his or her own behavior has access
to a more accurate assessment of inner states not observable by others, such as
depression, anxiety, and other similar internal states (Barbaranelli et al., 2003;
Kamphaus & Frick, 2005). Self-report measures may also be less susceptible to
some of the biases found in other ratings, such as halo, leniency, severity, and
central tendency effects (Barbaranelli et al., 2003). A more negative aspect of
self-report measures, however, involves the influence of motivational factors.
These factors often have a greater influence on self-perceptions as opposed to
other-perceptions, especially for those traits that are more or less socially
desirable as compared to those traits that are more neutral in content (Branje et
al., 2007; Funder & Colvin, 1997; Merrell, 2008). Examples of socially desirable
responses may include positive responses to such questions as “I behave
correctly and honestly with others” or a negative response to “I easily get angry”.
This tendency for endorsing socially desirable responses may limit self-report
measures; however, the benefit of accessing the inner feelings and states of the
individual are thought to outweigh this potential liability (Chamorro-Premuzic &

16
Furnham, 2006). Additional ways of controlling for the effects of self-report bias
involves triangulation of measurement, which includes reports from more than
one source, such as parent, teacher, and peer reports (Warner, 2007).
Recommendations by Barbaranelli et al. (2003) discuss the utility of using
triangulation in order to gain maximal insight into the child’s personality and to
reduce the effects of bias associated with self- and other-report.
Because of the need for accessing these internal states, three major
strategies for developing self-report measures among school-age children and
adolescents have been applied: (a) a modified adult measure (top-down
strategy), (b) inventories for children or adolescents originally intended to assess
a model other than the FFM, and (c) inventories specifically designed for children
or adolescents based on the FFM (bottom-up strategy).
Modified adult measures of the five factor model of personality.
Three inventories based on a “top-down” method of measuring personality in
children are variations of the same test. These three tests are the Neuroticism,
Extraversion, Openness-Personality Inventory-Revised (NEO-PI-R; Costa &
McCrae, 1992), the Neuroticism, Extraversion, Openness-Personality Inventory-3
(NEO-PI-3; McCrae, Costa, & Martin, 2005), and the Neuroticism, Extraversion,
Openness-Five Factor Inventory (NEO-FFI; Costa & McCrae, 1992). Although
the NEO-PI-R was developed for adults, the successive tests (i.e., NEO-PI-3 and
NEO-FFI) were modifications of the original scale for those with lower reading
levels, such as adolescents and children.
The NEO-PI-R is a 240-item measure that was originally developed to
measure the five factors of personality in adults ages 17 and up. With 8 items to
measure each personality facet, this test permits differentiated measurement of

17
each big five dimension in terms of six specific facets per factor (Costa &
McCrae, 1992). A study was conducted with a national organization in order to
test the robustness of the factor structure in the NEO-PI-R (Costa, McCrae, &
Dye, 1991). Internal consistency information was derived from a job performance
sample (N = 1,539). The authors reported reliability in terms of internal
consistency estimates for the domains, ranging from .86 to .92, specifically:
Neuroticism = .92, Extraversion = .89, Openness = .87, Agreeableness = .86 and
Conscientiousness = .90. The internal consistency of facets ranged from .56 to
.81. Correlations between the NEO-FFI and the NEO-PI-R domains ranged from
.77 to .92 (Costa & McCrae, 1992b). Validity has been supported for the NEO-
based tests with its longitudinal stability, predictive utility, and self-ratings
compared to other observer ratings (correlations ranging from .34 to .73).
Additionally, these tests have been translated into 15 additional languages, each
with evidence of cross-cultural generalizability (McCrae, 2001).
In one study, the Dutch translation of the NEO-PI-R was used to assess a
sample of 469 adolescent boys (n = 228) and girls (n = 241) who were recruited
for a study conducted at a University in the Flemish part of Belgium (De Fruyt,
Merveilde, Hoekstra, & Rolland, 2000). Mean age of the participants was 13.6
years (SD = 1.1 years), with an age range of 12 to 17 years. In order to assess
convergent and divergent validity, the participants were also asked to respond to
the Hierarchical Personality Inventory-Children (HiPIC; Merveilde & De Fruyt,
1999). Adolescents completed the NEO-PI-R and the HiPIC with directions not to
respond to items they did not understand. NEO-PI-R facet-scale characteristics,
including item-total correlations and Cronbach’s Alpha coefficients, were

18
examined and those items that were not rated by 10 or more adolescents were
identified and omitted.
Internal consistency coefficients found for the adolescent sample were
similar to those of the adult sample. Cronbach’s alphas were reported for
adolescent and adult samples, respectively: Neuroticism (.92, .92), Extraversion
(.90, .88), Openness (.86, .88), Agreeableness (.87, .86), and Conscientiousness
(.90, .89). Ten or more adolescents of the total sample (N = 469) did not respond
to 44 of the items. The majority of these incomplete items were found in the
Openness facet, suggesting limited comprehension for these items. Overall, 63%
of adolescents answered all items, 13% failed to respond to one item, 6% failed
to respond to two items, and 5% failed to respond to 17 or more items, with a
maximum number of 105 total missing answers, and an average non-response
rate of 2.72 items with a standard deviation of 8.12 items. Despite this missing
data, factor structures in this sample of adolescents replicated those found in
adult measures with 54 percent of total variance explained by the five factors. To
determine convergent validity, a principal components analysis of the facet
scales was conducted jointly on the NEO-PI-R and the HiPIC. It was determined
that all but one of the HiPIC facet scales loaded primarily with their NEO-PI-R
counterparts.
Analysis at the item level illustrated that a number of the items in the
NEO-PI-R were probably too difficult to comprehend for some adolescents.
Some items showed very low corrected item-facet correlations. These were
found to be less than or equal to ± .20, suggesting that these particular items are
less appropriate in assessing the target trait. Inspection of the item content
further suggested that some items refer to characteristic adaptations that are

19
probably less suitable for adolescents, such as those items referring to work
related issues which therefore may be irrelevant. The NEO-PI-R facets overall
reflect traits important in the description of individual differences in adults and
adolescents.
The Neuroticism, Extraversion, Openness-Personality Inventory-3 (NEO-
PI-3) was designed to improve readability of the NEO-PI-R for children and
adults with limited literacy skills (McCrae et al., 2005). To improve its readability,
approximately one-sixth of the items on the NEO-PI-R were modified using
simpler words. The NEO-PI-3 only replaced the 48 potentially difficult items,
thereby making the NEO-PI-3 equivalent to the NEO-PI-R in length and scoring
(McCrae et al., 2005). When administered to a sample of 14 to 20 year olds (N =
500), the NEO-PI-3 exhibited higher cross-observer agreement and better
internal consistency than the NEO-PI-R, as well as better readability in this age
group (McCrae, Martin, & Costa, 2005). Using the Flesch-Kincaid reading grade
level, it was determined that readability improved in 17 of the 19 facets that had
item changes. The median reading grade level decreased across the 30 facets
from 5.2 to 5.0 (McCrae et al, 2005). Because the NEO-PI-3 is a version of the
NEO-PI-R, and shares the same normative sample as well as basic structure, it
would suggest that a substantial portion of validity is inherently shared by the two
measures. The authors stated that “academically successful adolescents were
overrepresented in this sample” (p. 266) and therefore, an additional factor
analysis based on the responses of the 113 individuals who reportedly received
grades in the B to D range were conducted. Internal consistency reliability
coefficients were reported to be “slightly lower” for the five domains in this
subsample of less academically capable students (.85 to .89 for Form S) as

20
compared to the full sample of students. Additionally, the factor structure of the
less able students was reported to be similar to the adult factor structure with
congruence coefficients of .88 to .96. The authors acknowledged the general
need for a minimum sample size of 200 to conduct a factor analysis, but stated
that the small sample of 113 was justified. However, there are arguments that a
sufficiently large sample size is needed in order to interpret significant findings
(Gorsuch, 1983). Therefore there is support for the opinion that this sample
should have included at least 10 subjects per variable to reduce sampling error
(Nunnally, 1978). Additionally, the introduction of more data may cause the
variables to switch from one factor to another (Guadagnoli & Velicer, 1988).
Similar results were found in a study of the NEO-PI-3 among 12 and 13
year old children (N = 424), of which 202 were boys (Costa, McCrae, & Martin,
2008). These children were from three Eastern states and predominantly from
white, middle-class families. A majority of the participants reported that they
received good grades at school (i.e., all A’s (n = 88), mostly A’s (n = 128), or
mostly A’s and B’s at school (no amounts reported).
Despite the claim that most 12- and 13- year old children were able to
read and understand the NEO-PI-3, this study suggested that a failure to
comprehend test items was still a major cause of missing data (Costa et al.,
2008), with respondents leaving 1.5% of the 240 items blank. It was determined
from these data that omissions were often related to misunderstood words. For
example, prior to completing the form, children were asked to circle words that
were not understood. In all, 28 words were circled 10 or more times in 33
different items. There was a strong association between blank items and circled
words (r = .88). The 33 problematic items were left blank a total of 720 times,

21
which was equal to 44% of the total missing items. Missing data occurred
predominantly in adolescents with academic skills that were less well developed
than those claiming to have higher academic achievement. However, the NEO-
PI-3 was found to replicate the adult factor structure of the five factor model with
congruence coefficients from .95 to .99 (Costa et al., 2008). According to this
study, the authors state that research on middle-school-aged children may be
informative, and adult models of personality may be appropriate for middle-
school-aged youth. However, as in the other versions of the NEO, difficulty with
understanding the vocabulary in this test hindered the usefulness of the NEO-PI-
3 in middle-school aged youth achieving who were achieving at an average or
below average level in academics.
Often, time constraints can make the use of an extended measure, such
as the NEO-PI-R, non-optimal. In order to accommodate this situation, the
Neuroticism, Extraversion, Openness-Five Factor Inventory (NEO-FFI) was
developed as a 60-item, shortened measure of the NEO-PI-R Form S. As with
the other versions of the NEO, this test was designed for use with those ages 17
and above. In contrast to the NEO-PI-R and the NEO-PI-3, which assess the five
dimensions and thirty facets of the five factor model, the NEO-FFI assesses only
the five broad factors. Coefficient alpha of the five scores in adult self-reports
ranged from .68 to .86, with spousal ratings of coefficient alpha ranging from .76
to .90 (Costa & McCrae, 1992).
A study of the NEO-FFI was published suggesting that high cognitive
ability (e.g., gifted students or those ages 16 and above) was needed for valid
results to be obtained on this test (Parker & Stumpf, 1998). The NEO-FFI self-
report was used with a sample of 870 “academically talented youth” (p. 1007),

22
with a mean age of 13.8 years, to determine the structural validity of this scale in
a population of youth. A clear replication of the adult five factor structure was
found in this academically talented population. However, this holds true for those
who are “academically talented,” and as seen in other studies, generalizability to
varied achievement and ability levels has not been demonstrated. The sample of
adolescents was homogenous for intelligence (all scoring at or above the 97th
percentile on achievement tests), social class, and family structure, with overall
family education being very high (79.3% of fathers and 76.7% of mothers having
completed a college education).
Internal consistency reliability, as measured by Cronbach’s alpha, in self-
report and parent-report was computed for these academically talented students.
Several scales exhibited weak reliability, including, Neuroticism (.51),
Extraversion (.55), and Openness (.65). Using the criterion of .70 as a minimally
acceptable level of internal reliability (Nunnally, 1978), the scales which met this
minimum requirement included only Agreeableness (.70) and Conscientiousness
(.72). Additionally, the structure of the NEO-FFI is such that items may be too
difficult for respondents, particularly those at lower education levels. Items may
also be too complex, revolving around more than one trait adjective. Additionally,
they may be too long, thereby increasing the complexity of the item. Items also
may be conditional or too specific, or contain negations. These item
characteristics may add to unreliable variance in item responses (Hendriks,
Hofstee, & De Raad, 1999). This study was specifically conducted with
academically talented youth who were specified by the authors as “atypical for
the general population in academic skills” (Parker & Stumpf, 1998, p. 1022).
Although the participants were children, they possessed adult vocabularies and

23
high intellectual ability that allowed them to validly respond to adult assessments.
The authors referred to the findings as specific to academically talented or gifted
youth.
In summary, the NEO-PI-R, NEO-PI-3, and NEO-FFI may be appropriate
for gifted youth with extensive vocabularies. As there is a lack of research with
normally developing youth, these tests are probably inappropriate for youths who
are not academically gifted. Difficulty with reading level raises concerns about
content validity, as these tests are susceptible to becoming measures of reading
ability rather than measures of personality.
Modified alternate inventories of the five factor model of personality.
Inventories for children or adolescents that were originally intended to assess a
model other than the FFM often use marker scales constructed from a re-
grouping of items (De Fruyt et al., 2000). For instance, John et al. (1994) and
Van Lieshout and Haselger (1994) derived five-factor scores from a re-analysis
of the California Child Q-Set (CCQ; Block & Block, 1980). The five-factor
measures resulting from this regrouping were largely dependent on the
theoretical framework of the original instrument. This is disadvantageous when
wishing to utilize the five factor model specifically. Since this inventory was
originally based on a theoretical structure not consistent with five factors it can
only be considered a substitute for the original FFM scale (De Fruyt et al., 2000).
The possibility of low content validity, low internal consistency, and poor
construction and structure of a test is present when this type of modification
occurs (Saucier, & Goldberg, 2002). Content validity is dependent on the
adequacy with which a specified domain of content is sampled, and the test must
measure what it is purporting to measure. When a test is created, the selection

24
of items is based on the theoretical perspective under consideration for that test.
Construction of a set of factor markers is based on the orientation of the theory or
method involved (Embretson & Gorin, 2001). Thus, as the California Child Q-sort
was not intended as a measure of the big five, it would be inappropriate to use it
in this way. However, Goldberg (2001), in his analysis of Digman’s work on the
Hawaiian Islands, was able to give evidence of the validity of using this modified
scale with teacher-report in order to determine the personality of school age
children.
Child- and adolescent-specific inventories of the five factor model of
personality. In recognition of the difficulties found in top-down measures as well
as those measures originally developed on alternate theories of personality, new
measures of the FFM have been developed specifically for children. It has been
recommended that an instrument that is consistent with a child’s cognitive
capacities and cultural characteristics be used to assess personality in order to
gather the most accurate and reliable information from children (Shiner, 1998).
Child- and adolescent- specific inventories, also referred to as a bottom-up
strategy, are a useful way of implementing this recommendation.
A bottom-up strategy is focused on the construction of a new FFM
inventory specifically aimed at addressing child or adolescent traits. To do this,
the kind and number of traits utilized should be derived from a careful study of
the range of individual differences that can be reliably observed in the target age
group. Examples of this type of personality inventory include the Five Factor
Personality Inventory-Children (FFPI-C; McGhee, Ehrler, & Buckhalt, 2007) and
the Big Five Questionnaire-Children (BFQ-C; Barbaranelli, Caprera, & Rabasca,
1998).

25
The Five-Factor Personality Inventory-Children (FFPI-C) was constructed
after studies conducted on the Five-Factor Personality Inventory (FFPI;
Hendricks, Hofstee, & De Raad, 1999), suggested that it was non-optimal for
adolescents (Hendriks, Kuyper, Offringa, & Van der Werf, 2008). The FFPI-C
measures personality based on dichotomous trait structures. An initial pool of
100 items was determined to be integral to defining the important facets within
the big five domain based on a comprehensive literature review. Theoretical
utility, ease of reading, and potential bias of these items was then determined by
a committee of experts. Ten items were dropped and 15 of the most valid items
were retained for each domain (McGhee et al., 2007).
The normative sample of the FFPI-C consisted of 1,284 children 9 to 18
years of age, with Hispanics being underrepresented (8% of normative sample,
13% of U.S. population) and youth with emotional disturbance being
overrepresented (6% of normative sample, 1% of U.S. population). Internal
consistency of the FFPI-C was measured using Cronbach’s coefficient alpha,
with reported values of .74 to .86. All item-total correlations exceeded .35.
Correlation between scales was found to be small, ranging from -.17 for
Extraversion and Conscientiousness to .49 for Agreeableness and
Conscientiousness. Validity evidence for this measure was provided by two
unpublished studies reported in the manual. To establish concurrent validity, the
first study compared the FFPI-C to the NEO-FFI. Correlation coefficients of
factors measuring similar constructs ranged from .45 to .59 (Openness and
Neuroticism, respectively). Internal structure was measured using intercorrelation
among the scales and Confirmatory Factor Analysis (CFA). Unfortunately, since
factor loadings were not provided, it could not be determined if a CFI test for fit

26
was done therefore, precluding an evaluation of the adequacy of the factor
structure.
Despite the psychometric evidence for the use of the FFPI-C, some
disadvantages are inherent in its design. The FFPI-C relies solely on self-report
data and is not constructed to take into account parent or teacher ratings of the
child thereby losing important information not available from adult observers.
While the test-retest data suggested acceptable reliability, it was noted by
Klingbeil (2008), that this sample included only 8% Hispanics, while the national
percentage of Hispanic population is closer to 13%. Although this assessment is
suitable as a screening tool in many situations, it relies solely on self-report data
and does not factor in parent or teacher ratings of the child and thus, may not
provide sufficient information for a fully formed personality assessment.
It is not clear that the current measures of personality available are
sufficient to adequately explore adolescent personality features (De Fruyt et al.,
2000). Reading comprehension is in question for all of the NEO-based tests,
while support for validity is limited in the CCQ. An additional problem found in the
NEO-PI-R and the NEO-PI-3 is the use of adjective lists that are either unipolar
or bipolar in nature. Although adjective lists have the advantage of providing a
finite set of trait descriptors, they are very narrow in scope and single words may
have multiple meanings (Saucier & Goldberg, 2002). Descriptive statements offer
a much more precise and rich measurement of personality, as well as allowing
for specificity and differentiation of a particular theory of personality (Caprara,
Barbaranelli, & Borgogni, 1993).
The Big Five Questionnaire for Children (BFQ-C) is a scale that purports
to resolve the above issues and deficits found in other personality scales for

27
children (Barbaranelli, Caprara, Rabasca, & Pastorelli, 2003). The BFQ-C was
developed to explore and measure the big five personality factors through parent,
teacher, and self-report with children ranging in age from 9 to 13 years old. The
BFQ-C is a phrase-based questionnaire that was developed by Barbaranelli et al.
(2003) specifically to measure the big five in children and is not a mere
adaptation of the Big Five Personality Questionnaire (BFQ; Caprara et al., 1993).
In order to create the BFQ-C, 285 trait adjectives were listed with 104 of
these adjectives being subsequently identified by parents and teachers as the
most useful in describing the personalities of children between the ages of 9 and
13 years. From this list of 104 adjectives, behaviorally oriented phrases were
developed. Pilot studies utilizing these phrases were conducted until a final set of
65 items were determined to be the most accurate descriptors of personality.
These 65 items were equally distributed across the five factors following the
recommendations of Saucier and Goldberg (2002). The items are rated
according to occurrence frequency on a 5-point Likert-type scale, ranging from 1
(Almost never) to 5 (Almost always). This structure allows the BFQ-C to assess
the Big 5 with fewer items than found in many other personality measures
(Barbaranelli, Caprara, Rabasca, & Pastorelli, 2003).
The five factors referred to in the BFQ-C are Energy/Extraversion,
Agreeableness, Conscientiousness, Emotional Instability, and
Intellect/Openness. Energy/Extraversion refers to traits such as an individual’s
sociability, assertiveness, and enthusiasm. Agreeableness refers to traits that
reflect concern toward others. Conscientiousness is related to dependability and
orderliness. Emotional Instability (Neuroticism) is related to moods, such as
being prone to anger, depression, or anxiety. Intellect/Openness is concerned

28
with imagination, creativity, and intelligence as well as openness to new
experiences (Barbaranelli et al., 2008).
Barbaranelli, Caprara, Rabasca, and Pastorelli (2003) conducted a study
of participants in Italy enrolled in grades 6 through 8 (M Age = 12.42 years, SD =
1.05 years). All 968 participants completed self-report measures and all were
rated by their teachers (60 teachers participated). Of the sample, only 520
children were also rated by their mothers. Parents and teachers utilized the same
5-point Likert-type scale worded in the third person to describe the personality of
the target child.
Reliability of the BFQ-C was established using Cronbach’s alpha:
Conscientiousness (.87), Extraversion (.77), Openness (.82), Neuroticism (.77),
and Agreeableness (.71). Principal components analysis (PCA) revealed five
clear components for all respondents (parent, teacher, and self-report), providing
evidence for criterion validity. Results of this study replicated what has been
found in other studies of the five factor model in elementary and junior high
school students. It was also suggested that the BFQ-C was valid for use as a
self-report measure and as a parent or teacher rating scale (Barbaranelli et al.,
2003).
An additional analysis of the BFQ-C, conducted in an Italian sample of 13
to 14 year olds, established that convergent validity was supported for some
factors, with validity coefficients ranging from .17 to .50. Convergent validity was
examined using self-report, teacher, and parent ratings (Barbaranelli et al.,
2008). Factor loadings ranged from .31 to .90. The percentage of variance
explained was 30% in the self-report measure, which is very low. Although
Barbaranelli et al. (2008) reported that discriminant validity was supported for all
29
five factors, it was achieved in a “weak sense” (p. 883) in this study when it was
found that the correlation between Conscientiousness and Intellect/Openness
was too high to enable a perfect discrimination claim. This may, in part, be
explained by the high correlation of the behaviors related to the two factors also
being relevant to academic achievement, thereby increasing their similarities to
each other on factor loadings: Intellect/Openness with; Extraversion: r = .62,
Agreeableness: r = .67, Conscientiousness: r = .70, and Emotional Instability: r =
-.28; Agreeableness with Extraversion: r = .58, Conscientiousness: r = .66,
Emotional Instability: r = -.33 (Barbaranelli et al., 2008).
Having established the overall validity of the BFQ-C in its original
language of Italian, it is important to determine if validity has been established in
other languages. Establishing validity in other languages is important to
determine cross cultural similarities and whether the measure is generalizeable.
Replication is the only true way to establish generalizability (Worthington &
Whittaker, 2006). McCrae and Costa (1997) suggested that there may be
evidence that “the structure of individual differences in personality is uniform
across cultures and may in fact, be universal” (p. 509). It may also allow
researchers to form a frame of reference for understanding cultural differences.
The psychometric properties of the BFQ-C were examined using a
sample of Dutch adolescents (N = 222) with a mean age of 14.18 years (Muris,
Meesters, & Diederen, 2005). Translation information was not included in this
publication. Students were given the BFQ-C, the revised version of the junior
version of the Eysenck Personality Questionnaire (JEPQ; Corulla, 1990; Eysenck
& Eysenck, 1975), and the Strengths and Difficulties Questionnaire (SDQ;
Goodman, 2001). Principal components analysis with an oblique rotation

30
resulted in a five factor solution that accounted for 36 percent of total variance.
Alpha coefficients for the five factors were .78 (Energy/Extraversion), .80
(Agreeableness), .74 (Conscientiousness), .71 (Intellect/Openness), and .83
(Emotional Instability). There were positive correlations between
Energy/Extraversion and Emotional Instability (BFQ-C) and Extraversion and
Neuroticism (JEPQ) with r = .63 and .71, respectively. Negative correlations were
found, as expected, between Agreeableness and Conscientiousness (BFQ-C)
and Psychoticism (JEPQ) with r = -.20 and -.18, respectively. Overall, the
findings were consistent with that of Barbaranelli et al. (2003).
A study conducted in Germany with 1,443 adolescents, ages 13 to 18
years with a mean age of 15.6, provided additional support for the construct
validity of the BFQ-C (Essau, Sasagawa, & Frick, 2006). In this study the BFQ-C
was translated from English into German by a bilingual translator, it was then
back translated into English from German by a different bilingual translator.
Students were given the BFQ-C as a secondary instrument used to support the
internal consistency of the big five subscales in the Inventory of Callous-
Unemotional Traits (ICU) developed in Germany by Frick (2003). The ICU was
designed to provide an assessment of callous-unemotional traits in adolescents,
and is theorized to capture three dimensions of behaviors linked to psychopathy
and antisocial behaviors. Callousness is a behavior dimension related to lack of
empathy. Uncaring is a behavior dimension focused on level of interest in task
performance, and the Unemotional factor is related to an absence of emotional
expression. Alpha coefficients for the BFQ-C ranged from .74
(Intellect/Openness) to .88 (Agreeableness). The ICU was correlated with the
Agreeableness and Conscientiousness personality dimensions of the BFQ-C.

31
Specifically, the ICU was negatively correlated with Conscientiousness and
Agreeableness, r = -.49 and -.57, respectively. In addition, there were unique
negative correlations of the ICU subscales and the big five dimensions of the
BFQ-C. Within the subscales, negative correlations were found between the
Unemotional dimension of the ICU and Emotional Instability of the big five, (r = -
.20), and ICU’s Uncaring dimension and the BFQ-C’s Openness dimension, (r = -
.26). The negative correlation between the Unemotional subscale of the ICU and
Emotional Instability supports the idea that the focus of the BFQ-C dimension of
Emotional Instability, which is characterized by excessive emotion, is in direct
contrast with the lack of emotion characterized by the Unemotional subscale of
the ICU. In addition, the negative correlation between the BFQ-C’s dimension of
Openness, characterized by actions and ideas, with the ICU dimension of
Uncaring suggests that the lack of motivation characterized in the ICU dimension
is in direct contrast to the willingness to try new things found in the BFQ-C.
Another international replication of the factor structure of the BFQ-C was
reported by Carrasco, Holgado, and Del Barrio (2005). In this study, 852 Spanish
students, ages 8 to 15 years with a mean age of 11.86, were given the self-report
version of the BFQ-C. The instrument was translated from Italian and adapted for
use in Spanish (Del Barrio & Carrasco, 2006). An exploratory factor analysis
was conducted with a promax rotation, and generalized least squares as the
estimation method. Results of the analysis were consistent with both a four- and
five-factor structure. The first factor explained 19.82% of the variance, the
second factor 4.81%, third factor 4.59%, the fourth factor 2.65%, and the fifth
explained 1.89% of the variance. Internal consistency reliability of the five factors
ranged from .78 for Emotional Instability (Neuroticism) to .88 for

32
Conscientiousness. Test-retest reliability over a one week span was found to
range from .62 (Agreeableness) to .85 (Conscientiousness). It was noted that
additional research would be needed to determine whether the Openness factor
should be included as an independent factor.
Summary
Several theories of personality exist. Cattell (1943) and Eysenck (1975)
each introduced theories that explained how personality is constructed, but
subsequent research determined that a five factor model is currently the most
parsimonious explanation of personality for both children and adults. Personality
traits are measured by using parent, teacher, and child ratings. Although parent
and teacher reports are the most commonly used for children and adolescents,
they fail to address internal states of the child. Self-reports are able to address
these internal states and are necessary for an accurate assessment of
personality to emerge. Many self-report measures of personality have been
developed, but there are issues with the construction of these tests. Tests
constructed in a top-down manner may be appropriate for gifted youth with
extensive vocabularies, but difficulty with reading raises concerns about content
validity. Tests that are constructed from alternate theories of personality are
simply not intended to measure the big five, and their use for this purpose would
be inappropriate. Although the FFPI-C is constructed in a bottom-up manner, it
relies solely on self-report data, thereby failing to utilize information available
from other-reports. Additional issues are found with its underrepresentation of the
Hispanic population in the United States.
The BFQ-C purports to be the most valid and useful personality measure
for children and adolescents and has been investigated in several languages,

33
including Italian, Dutch, German, and Spanish. Given that there is moderate
support for the BFQ-C in four different languages, replicating the factor structure
in another language would provide further support for this questionnaire as an
appropriate measure of personality for young adolescents. The current study will
determine if the English language version of the BFQ-C produces a five factor
structure among English speaking American adolescents that is congruent with
its structure in the original Italian language version.
Research Questions. The following research questions will be answered
by this study.
Question 1.
What is the optimal component solution that will allow the underlying theoretical
structure of the American version of the BFQ-C to emerge?
Question 2.
Is the solution found for the American sample of adolescents consistent with the
five-component solution observed in the Italian version of the BFQ-C?
34
Chapter 2
METHOD
Participants
The sample consisted of 416 children (279 female and 137 male) from
two elementary schools, both of which accommodated Kindergarten through 8th
grade, although only the 6th through 8th grades were sampled. One junior high
school was also sampled, which accommodated those in the 7 and 8th grade. All
three of the schools were in the Phoenix metropolitan area. Total student
attendance at the three schools was 2,782. Participants ranged in age from 10 to
14 years with 139 students attending 6th grade (33%), 115 attending 7th grade
(28%), and 162 attending 8th grade (39%). Because of confidentiality
requirements in one of the schools, specific ethnicity information was not
available for 79 students. Among the remaining students, the majority ethnic
representation was Caucasian (59%). Additional ethnicities that were reported on
the questionnaires included Hispanic (12%) and Unspecified (29%). To ensure
anonymity, no other demographic information was collected.
In contrast, the demographic makeup of the schools from which the
sample was drawn was; Caucasian (74.4%), Black (3.67%), Hispanic (15.83%),
Asian/Pacific Islander (4.8%), and American Indian/Alaskan Native (1.23%).
Students attending these schools were predominantly middle class, as measured
by percent of students listed as Economically Disadvantaged (22.6%) (Council of
Chief State School Officers, 2010).
Procedure
Following IRB and school district approval, parental informed consent and
student assent were obtained for all students participating in the study. To

35
encourage participation, students received pencils and parents were entered in a
raffle to win a $50 gift card. There was also a $20 gift card given to each teacher
who agreed to participate in the study, and each teacher who obtained a 100%
response with the parent permission to participate forms were entered into a
raffle for a $100 gift card.
Questionnaires were completed during the regular school day. Students
were read directions for completing the questionnaire and were allowed
approximately 30 minutes to read the questionnaire and complete the BFQ-C.
Makeup testing was conducted within one week of the original testing session. A
minimum of two researchers were present during testing to ensure independent
and confidential responses. Participating students were also engaged in an
additional study, and therefore were given two additional questionnaires to
complete prior to beginning the BFQ-C. Because this differed from that done in
the previous studies, the outcome of the BFQ-C in this sample may have been
affected.
Measure
The big five factors were assessed using the BFQ-C (Barbaranelli et al.
2003), a phrase-based self-report questionnaire designed specifically for use with
children and adolescents. The scale was translated by the authors into English,
and then independently back-translated utilizing accepted translation guidelines.
This is a 65-item questionnaire, containing 13 items related to each of the five
factors of Energy/Extraversion, Agreeableness, Conscientiousness, Emotional
Instability, and Intellect/Openness. Items are scored using a 5-point Likert-type
scale ranging from 1 (Almost Never) to 5 (Almost Always).

36
The factor structure of the BFQ-C was evidenced by examining the
evaluations of self-report, teacher, and parent ratings (Barbaranell et al., 2003).
Variance explained by the five factors was 30.2% and 39.1% for self-report in
elementary and junior high school, respectively, 38.4% and 40.5% for parent
ratings and 63.5% and 64% for teacher ratings, respectively. For self-report, all
factor correlations were lower than ± 0.20 except for Intellect/Openness and
Emotional Instability (r = -0.21), and Intellect/Openness and Energy/Extraversion
(r = 0.22). Similar results were found among the junior high school sample, with
all factor correlations lower than ± 0.20 except for Intellect/Openness and
Energy/Extraversion (r = 0.33), Intellect/Openness and Agreeableness (r = 0.38),
Conscientiousness and Agreeableness (r = 0.25), and Agreeableness and
Emotional Instability (r = -0.25). Alpha coefficients ranged from .82 to .95 (M =
.88, SD = .04) (Barbaranelli et al. 2003).
Proposed Statistical Analysis
Exploratory factor analysis (EFA) was used to determine the structure
of the BFQ-C among English speaking American adolescents. Ben-Porath
(1990) makes an argument for the use of EFA as opposed to Confirmatory
Factor Analysis (CFA) in this situation, stating that EFA should be used to
demonstrate the use and applicability of a personality assessment within a
culture prior to employing CFA across cultures. As suggested by Velicer and
Fava (1998) no less than three items per component are critical. Exceeding
this guideline, 13 items were used in the BFQ-C to determine each
component. Additionally, the study sample size (N = 416) exceeded the
minimum recommended sample size of 300-400 participants for a 65-item
scale.

37
For optimal factor recovery, Monte Carlo studies have found that
communality and number of indicators is very important. Velicer and Fava (1998)
suggested that “variable sampling has a critical effect on the interpretation of
factor patterns. Under the best conditions, the minimum of three variables per
factor or component is critical” (p. 243), but “a more prudent target would be to
have four- or five-to-one as a minimum” (p. 247). Exceeding these prudent
guidelines, the BFQ-C has a shown 13 items determine each factor.
The sample size used in factor analysis is important in order to assure
good recovery of components and accurate parameter estimates. Gorsuch
(1983) suggested that it is necessary “to have a sufficiently large sample so
that anything of interest for interpretation would be significant” (p. 209). At
least 300 participants were recommended by Tabachnick and Fidell (2007) as
well as by Tinsley and Tinsley (1987). Meyers, Gamst, and Guarino (2006)
recommended that around 250 participants would be needed for a 25-item
scale and 400 participants for a 90-item scale. Given these recommendations,
a minimum of 300 to 400 participants was needed for this analysis of a 65-
item scale. The study sample size exceeded the minimum recommended (N =
416).
One of the most basic requirements for a factor analysis is selecting and
using accurate and high-quality data that have been measured with either
interval or quasi-interval scales (Floyd & Widamen, 1995). Prior to analysis, the
data will be examined for accuracy. A review of the data will determine whether
all scores were within the ranges allowed by the Likert scale used in the BFQ-C
(i.e., 1 to 5). Data will also be examined for response sets and other obviously
inaccurate responses.

38
Linearity of relationships is also an important assumption of factor
analysis (Pett, Lackey, & Sullivan, 2003). Descriptive statistics will be used to
evaluate univariate normality and to detect the presence of univariate outliers. In
order to assess linearity between the variables, bivariate scatterplots for pairs of
items will be examined (Pett et al., 2003). Univariate frequency distributions will
also be reviewed in order to identify univariate outliers and to ensure that all
variables were distributed either approximately normal or in a uniform manner
(Goldberg & Velicer, 2006).
To determine the type and seriousness of any missing data, Tabachnick
and Fidell (2007) determined that “the pattern of missing data is more important
than the amount missing” (p. 62). Missing data will be characterized in one of
three ways; MCAR (missing completely at random), MAR (missing at random,
called ignorable non-response), and MNAR (missing not at random or non-
ignorable) (Tabachnick & Fidell, 2007). According to Gorsuch (1988), when less
than 5% of the data is missing, the problem is minimal and almost any procedure
for missing variables would be acceptable. With 5% or less of the data missing,
list-wise deletion will be implemented. According to Alison (2002), list-wise
deletion gives valid inferences when the data are MCAR, even though it does not
use all available information. If missing data of > 5% occurs, then the missing
data will be estimated with regression methods (Gorsuch, 1988). This method of
imputation makes use of a multiple regression equation to predict the missing
values on a variable. Although this method is better than several of the simpler
imputation methods, there is a tendency to “over fit” missing values based on
other independent variables (Tabachnick & Fidell, 2001). The samples generated
from such over fitting may not generalize well to the population sampled.

39
“Analyzing imputed data as though it were complete data produces standard
errors that are underestimated and test statistics that are overestimated” (Allison,
2002, p. 12).

40
Chapter 3
RESULTS
Statistical Analysis
The analysis was conducted on a sample consisting of 416 participants
(137 males, 279 females). Table 1 summarizes the breakdown of the
demographic information of the sample by gender, ethnicity, and school
participation. Children ranged in age from 11 to 14 years (mean age = 13.09
years). Of the participants with ethnic and gender information available, it was
determined that the sample was predominantly White (66.0%) and female (67%).
For the present analysis, principal components analysis (PCA) was
selected over common factor analysis. Although common factor analysis is
normally better suited for identifying the latent factors representing the theoretical
structure of a measure (Preacher & MacCallum, 2003), PCA was chosen as it
has been commonly used in personality research particularly by Barbaranelli et
al. (2003) with the BFQ-C (Carrasco et al., 2005; Muris et al., 2005). The goal of
PCA is data reduction, and in this method, “the components are estimated to
represent the variances of the observed variables in as economical a fashion as
possible,” and no latent variables underlying the observed variables are specified
(Floyd & Widaman, 1995, p. 287).
When the conceptual requirements for the variables included in this
analysis were met, it was determined the variables were sufficiently
intercorrelated so as to allow for the production of representative components
(Hair, Black, Babin, Anderson, & Tatham, 2006). In addition to correlations
exceeding .30, as recommended by Tabachnick and Fidell (2007),
appropriateness of PCA was determined by Bartlett’s test of sphericity (Bartlett,

41
1950) and the Kaiser-Meyer-Olkin (KMO) measure of sampling adequacy
(Kaiser, 1974). Bartlett’s test of sphericity tests the null hypothesis that the
correlation matrix is an identity matrix. An identity matrix is a correlation matrix on
which all of the off-diagonal items are completely uncorrelated. This test is very
sensitive to sample size and should be used only as a minimum standard
(Bartlett, 1950). A KMO “value of .6 and above is required for a good factor
analysis” (Kaiser, 1974, p. 614).
As recommended by O’Conner (2000), the number of components to
retain for rotation was identified using the Parallel Analysis Criterion (Horn, 1965)
and Minimum Average Partials (MAP; Velicer, 1976), supplemented by a visual
scree test (Cattell, 1966). Parallel analysis and MAP were conducted utilizing a
program developed by O’Connor (2000).
To make the components more meaningful, and thus more able to be
interpreted, they were rotated. To obtain a simple structure while allowing the
components to correlate, as well as to test for factors and retain comparable
results to the Italian sample (Barbaranelli et al. 2003), oblique oblimin rotation
was utilized. Because the BFQ-C already has a proposed theoretical structure,
interpretation of the factors was further guided by simple structure (Norman, &
Streiner, 2000) where pattern coefficients above .30 were deemed salient.
Item means, standard deviations, skew, and kurtosis for the 65 items of
the BFQ-C are presented in Table 2. On a 5-point scale, where 1 = Almost Never
to 5 = Almost Always, the means ranged from 2.23 (Item 25: I check my
homework many times) to 4.47 (Item 19: I like to be around others). As there
were no missing data found, recommended steps for imputation of values were
not necessary. Because forms of EFA are more likely to have a more replicable

42
component pattern if data are distributed in a multivariate normal manner, skew,
and kurtosis of the variables were examined. Descriptive statistics indicated that
the skewness and excess kurtosis was near 0, therefore, all of the items were
distributed approximately multivariate normally. In order to determine if univariate
outliers were present or problematic, examination of the frequency distributions,
box plots, and relationships between variables and the variables themselves
were conducted. The presence of univariate outliers were minimal and were not
found to be problematic to the final analysis. Bivariate scatterplots for pairs of
items were examined (Pett et al., 2003), and were found to be linear as
expected.
In order to provide a preliminary idea of which items might cluster in the
PCA, the correlation matrix was examined next. Eight of the 65 items (1%)
shared no correlations with other items that exceeded ≥ | .30 |. Twenty six of the
65 items (40%) had 6 or more shared correlations that exceeded ≥ | .30 |. The
matrix indicated there were no problems with multicollinearity, as none of the
inter-item correlations exceeded r = .68.
In order to test the strength of the linear relationships among the 65 items
in the correlation matrix, Bartlett’s test of sphericity and the KMO, was
implemented. Bartlett’s test of sphericity was significant (χ2 = 11091.277, p =
.000). This result indicated that the correlation matrix was not an identity matrix.
The KMO statistic of .87 was considered “meritorious” (Kaiser, 1974), and
indicated that magnitude of the observed correlations and that of the partial
correlations was acceptable. Together, these results suggest that a factor
analysis was appropriate and the BFQ-C items could be expected to share
common factors.

43
In order to answer the research questions proposed, a principal
components analysis was conducted to explore the underlying theoretical
structure of the BFQ-C data (Preacher & McCallum, 2003), the method that was
applied in the original study conducted by Barbaranelli and colleagues (2003).
The initial analysis indicated a presence of 16 factors with eigenvalues > 1.0 (i.e.,
11.25, 4.59, 4.37, 3.83, 2.07, 1.66, 1.57, etc.). The number of components then
selected to retain for rotation was identified using the parallel analysis criterion
(Horn, 1965) and minimum average partials (MAP; Velicer, 1976), supplemented
by a visual scree test (Cattell, 1966), and a priori hypothesis. Parallel analysis
and MAP criteria suggested 7 components be retained; however, the visual scree
test indicated 5 components. Likewise, theoretical expectations were for 5
components to emerge.
The five-, six-, and seven-component solutions were analyzed using
simple structure criteria and a priori expectations. Although Stevens (2002)
suggested .40 and statistical significance of loadings, in order to replicate the
study by Barbaranelli et al. (2003) pattern coefficients ≥ .30 were predetermined
to be salient., and it was deemed necessary that items loaded at approximately
zero (+ .10 or - .10) on some other factor, and that each factor contain at least
five items with loadings above .30.
In order to evaluate which solution of factors was the most relevant, it was
determined that the criteria of simple structure, as presented by Thurstone (1947)
also be evaluated. In order to determine if these criteria were met: (a) Each row
of the factor matrix was to contain at least one zero; (b) Each column of the
matrix needed to have a minimum number of zeros that would match the solution
presented (i.e., 7 components would need 7 zeros in each column, etc.); (c)

44
Every pair of columns within the matrix should have several variables which
approached zero in one column but not the other; (d) Every pair of columns in the
matrix required the presence of a large proportion of variables approaching zero
in both columns; (e) All pairs of columns in the matrix were allowed only a small
number of variables with non-zero entries in both columns (Pett et al., 2003). For
a more simple explanation, it was necessary that: (a) Optimal primary component
loadings should be > .5; however, to replicate the results of Barbaranelli et al.,
(2003), the primary component loadings were required to be a minimum of >.3;
(b) Ideally, item cross-loadings should have a difference of approximately .2
between the primary and the cross loadings of components; (c) It was necessary
for each component to make a meaningful and useful contribution to the factor it
loads on.
The seven component solution was first examined, and the outcome is
displayed in Table 3. Although the requirement for simple structure included the
presence of at least one zero in each row of the matrix, the seven component
solution did not strictly meet this, as one of the rows did not have a zero loading.
Each column in this solution, however, did have a minimum of seven near-zero
loadings. This solution also satisfactorily fulfilled the requirements of having
several variables approaching zero in one column, but not the other, a large
proportion of the variables approaching zero in both columns of the matrix, as
well as only a small number of the variables having non-zero loadings in both
columns. Although this solution did have all items loading on individual
components > .30, many of the item cross-loadings did not differ at or about .20
from the primary loading.
45
The seven components found in this solution were best described as: I)
Agreeableness; II) Extraversion; III) Neuroticism; IV) Intellect/Openness; V)
Neuroticism; VI) Conscientiousness; and VII) Extraversion. Possible explanations
for the split in the Neuroticism component may be related to research done by
Evans and Rothbert, (2007), which provides evidence of a six-factor solution
indicating a relationship exists between the temperament factors of Negative
affect and Neuroticism/ Emotional Instability. Explanations for the divergence in
the Extraversion scale may be related to the more social aspect of the second
component, as opposed to the more verbal aspect of the seventh. While all the
components of this solution seemed to add to the overall explanation of the data,
as noted above, this solution did not meet all of the requirements for simple
structure.
Next, the six component solution was examined, and the outcome is
displayed in Table 4. Again, the requirement for simple structure included the
presence of at least one zero in each row of the matrix. The six component
solution did meet this criterion. In this solution, all of the rows had zero loadings,
the only solution in this study to meet this requirement. Each column in this
solution also had a minimum of six near-zero loadings. This solution also
satisfactorily fulfilled the requirements of having several variables approaching
zero in one column but not the other, as well as a large proportion of the
variables approaching zero in both columns of the matrix. Only a small number of
the variables had non-zero loadings in both columns, as recommended.
Additionally, this solution did have all of the primary loadings on components at >
.30. As compared to the other solutions, the number of the item cross-loadings
differing at or about .20 from the primary loading was the greatest in this solution,

46
suggesting that this solution discriminates among the factors better than the
others.
The six components found in this solution are best described as: I)
Agreeableness; II) Energy/ Extraversion; III) Neuroticism; IV) Intellect/ Openness;
V) Neuroticism; and VI) Conscientiousness. All of the components in this solution
added to the overall explanation of the data, with the necessary minimum of five
items or more loading primarily on each component. Therefore, the six
component solution had the best fit for the components, as all of the
requirements were met for simple structure, as well the primary components
loaded > .30, and all of the components added to the overall explanation of the
data.
Finally, the five component solution was examined. The results for this
solution may be seen in Table 5. Contrary to the 2003 findings of Barbaranelli
and colleagues, this was not the best overall solution for explaining the results.
Of the three solutions, the five component solution had the least favorable simple
structure. Most notably, there were five rows which did not have zero loadings on
them, however, much as in the six and seven component solutions, the rest of
the requirements were adequately fulfilled for simple structure. Additionally, the
Agreeableness component was not independently represented in this solution,
but rather, was subsumed under the components of Conscientiousness and
Agreeableness. As found in both the six and seven solution, the five components
did have all of the primary components loading at > .30, however, the item cross-
loadings differing at or about .20 from the primary loading was similar to that
found in the seven-component solution and therefore, was greater than that
found in the six-component solution.

47
The five components found in this solution are best described as: I)
Conscientiousness; II) Extraversion; III) Neuroticism; IV) Intellect/ Openness; V)
Neuroticism. The findings of this solution indicated the absences of
Agreeableness as a separate component, however, it was split almost equally
between components I (5 items) and II (4 items). The split in the Neuroticism
component was again evidenced in this solution as well as the other two. Similar
to the other solutions, all five of the components found added to the overall
explanation of the data, with the necessary minimum of five items loading
primarily on each component.
In summary, based on simple structure, item loadings, number of items
per component, and clarity of components, the six component solution was
selected as the most appropriate for rotation. This was contrary to the
expectations of the study, as stated in Research Question 1, as well as the
findings of Barbaranelli et al. (2003). The findings were found to be similar to that
found by Del Barrio, Carrasco, and Holgado (2006), and also the findings of
research done by Evans and Rothbart (2007) regarding a six factor solution to
explain the split in the Neuroticism component. In order to continue with the
replication of the work done by Barbaranelli et al., (2003) oblimin oblique rotation
was used in order to interpret and label the factors. As indicated in Table 6, six
factors were determined to be the most accurate representation of the final
solution, as they accounted for the majority of the total variance, or about 42.7%.
Although Pett et al. (2003) recommend that 50-60% of variance be accounted for
by the extracted factors when applying PCA in the social sciences, the total
additional variance accounted for by the seven component solution was minimal
(45.13%). Additionally, total variance accounted for in self-report measures of the

48
BFQ-C was found to be less than recommended in other studies as well:
Barbaranelli et al. (2003), found that the self-report measures accounted for
39.1% of the variance found in a junior high school sample of adolescents, and
30.2% was explained when administered to elementary school children; Muris,
Meesters, & Diederen (2005), found that their five-factor solution accounted for
36.38% of the total variance in a sample of students ages 12 through 17 years. If
taken in light of these other studies, it would appear that 42.7% of the total
variance explained by this six-factor solution is an adequate amount of variance
explained despite the requirement indicated by Pett, et al., (2003)
Although a six component solution was selected, once the components
and their items were resolved both statistically and conceptually, the patterns of
loadings (see Table 7) for each component were interpreted according to the
theoretical constructs associated with the five factor model and the BFQ-C
(Barbaranelli et al. 2003). All items included on the factors either loaded above
0.30, or loaded most highly on the component where they appeared, with the
loadings on the other components being generally low. An examination of the
components after rotation indicated that there were six clear components
explaining 42.7% of the variance. These six components did not completely align
with the five factor model (see Table 8). Also, in contrast to the expectations of
this study’s research question 2, the findings of Barbaranelli et al., (2003) and
others (e.g., Muris et al. 2005); the items did not align as expected with previous
BFQ-C questionnaire results.
Although six components were selected as the most accurate
representation of the data, upon closer examination of the component structure,
it was determined that, except for a split in the Neuroticism/Emotional Instability

49
component, the components did measure the expected five components. The
split found in the Neuroticism/ Emotional Instability component (Components III
and V) resulted in the addition of a sixth component to these data. However,
again the overall structure in the current study was not consistent with the results
found in the study by Barbaranelli and colleagues (2003). The components found
in the American study, accounted for differing levels of total variance explained
as compared to that of the Italian study. The American components accounted
for variance beginning with Agreeableness, then Energy/Extraversion,
Neuroticism/Emotional Instability, Intellect/Openness, then again
Neuroticism/Emotional Instability, followed by Conscientiousness. The Italian
components, in contrast, accounted for the majority of variance explained with
the Energy/Extraversion component, followed by Agreeableness,
Conscientiousness, Emotional Instability/Neuroticism, and then
Intellect/Openness. Additionally, items in the current study did not always load on
the expected components. For example, the American component of
Agreeableness included three items (Item 16: I like to give gifts; Item 20: I get
very involved in the things I do and I do them to the best of my ability; Item 28: I
respect and follow the rules) not found on the corresponding Italian component.
Item 13 on the Italian component of Agreeableness (I understand when others
need my help), was not found on the American component. For a complete
overview of the components found in the American sample, refer to Appendix C.
Overall, only 62% of those items found in the Italian sample were found to
be represented similarly in the American version, by loading on the requisite
component. The first component of this version of the BFQ-C, consisting of 15
items, loaded with those items predominantly associated with component II,

50
Agreeableness in the Italian sample. Barbaranelli et al. (2003), stated that all of
their five components have 13 salient item loadings. However, of the 13 items
Barbaranelli et al., (2003) identified as being relevant to the Agreeableness
factor, 12 salient items (92%) were replicated in this sample: when accounting for
all items loading on this component, these items represented 80% of the items
identified by Barbaranelli et al., (2003). In the current study, the first component
predominantly reflected features of the Agreeableness component, with three
items from the Italian component Conscientiousness also loading here.
Component II consisted of 12 items, ten of which represented the
Energy/Extraversion factor, as demonstrated by Barbaranelli et al., (2003). Of the
13 salient items identified in the previous research as being relevant to
Energy/Extraversion, the ten salient items in the present study represented 83%
of those found in the Italian sample. Again, when accounting for all of the items
loading on this component, this was found to represent 77% of the items
previously identified. Agreeableness and Intellect/Openness were each also
represented by a single loading on this component.
Component III was comprised exclusively of those items found on
Barbaranelli et al’s., (2003) Neuroticism/ Emotional Instability factor. This was
found to account for 100% of the items identified, but it represented only 62% of
the items previously identified in the Italian sample. When taken in combination
with Component V (also labeled Neuroticism/Emotional Instability) of the
American sample, 14 items are represented, with 12 of them being from the
Neuroticism/Emotional Instability factor, thus accounting for 92% of the items
categorized by Barbaranelli et al’s, (2003), previous work. The reason for the
separation of these components may be explained by the work done by Evans

51
and Rothbart (2007; 2008) which postulates the existence of a six factor solution
using the temperament factors of Non-aggressive negative affect and Aggressive
negative affect to explain the presence of two distinct Neuroticism components.
Of interest, the five-, six-, and seven- component solutions examined in this study
all found a split in the Neuroticism component that aligned with Evans and
Rothbart’s research.
Component IV consisted exclusively of those items found to represent
Intellect/Openness in Barbaranelli et al’s., (2003) work. This component,
however, consisted of only 8 items, although representing 100% of
Intellect/Openness items for this component in the American sample; this was
not representative of the total number of items found to represent this
Intellect/Openness in the Italian sample. Only 62% of those items found in the
Italian sample were also represented in this component in the American version.
The sixth and final component in the American sample again consisted
almost exclusively of items that were originally found to load on the
Conscientiousness factor in the Italian sample (Barbaranelli et al. 2003). Eight of
the eleven items loading on this component were in the Conscientiousness
category (73%), however, of the Italian Conscientiousness component, this
represented only 62% of those items originally loading on this component.
In addition to there being an additional component found in the American
sample, as compared to that of the Italian sample, there were also three items
that did not contribute significantly to any of the components, and therefore were
not included in the final results. These items were: 22) I concentrate on my work
in class; 35) I find things to do so that I will not get bored; 44) When I start to do
something I have to finish it no matter what.

52
Examination of Reliability and Factor Independence. To determine if
these six components supported the finding that the BFQ-C measured relatively
distinct aspects of personality, the correlations between the components were
examined. As expected, it was found that the correlations between the six
components were relatively low. These correlations are presented in Table 9.
The correlations between the subscales ranged from -0.048 (for the two
subscales Neuroticism and Agreeableness) to 0.32 (for Conscientiousness and
Neuroticism). As expected, low intercorrelations support the existence of
separate components.
Additionally, the components were then subjected to reliability testing. As
expected, all of the components demonstrated an acceptable amount of internal
consistency. Table 7 also presents the internal reliability coefficients as
measured with Cronbach’s alpha for the BFQ-C components. Internal
consistency reliabilities were: Agreeableness, r = 0.88; Energy/Extraversion, r =
0.78; Neuroticism/ Emotional Instability, r = 0.82 and r = 0.68 (as Components III
and V respectively); Intellect/ Openness, r = 0.80; Conscientiousness, r = 0.78.
According to Nunnally and Bernstein (1992), item-total correlations for
the components were considered to be acceptable. It was determined that
corrected item-total correlations which were greater than 0.20, but less than 0.70
were acceptable values (Nunnally, 1978). A positive item-total correlation
indicates that the item is internally consistent with the total scale score. A
negative correlation indicates that the item is not measuring the same construct
as the other items in the scale. The correlations for Component I
(Agreeableness) ranged from .36 (Item 34: If I make an appointment, I keep it))
to .73 (Item 32: I treat others with kindness). Component II (Energy/Extraversion)

53
ranged from .20 (Item 10: I daydream a lot) to .62 (Item 57: I make friends
easily). Component III (Neuroticism/Emotional Instability) ranged from .35 (Item
rev41: I am not patient) to .75 (Item rev15: I get angry easily). Factor IV (Intellect/
Openness) ranged from .31 (Item 43: I am able to make up new games and
things to do) to .66 (Item 30: When the teacher explains something I understand
immediately). Component V (Neuroticism/Emotional Instability) item-to-total
correlations ranged from .27 (Item 09: I like to compete with others) to .50 (Item
rev61: I worry about silly things). Factor VI (Conscientiousness), the additional
factor found in the present study ranged from .26 (Item 59: I would like very much
to travel and learn about other countries) to .48 (Item 48: I like to keep all my
school things neat and organized). In this study, it was found that all of the items
loading on each scale had positive item-total correlations, thereby indicating
overall internal consistency with the total scale score. As expected, it appears
that the BFQ-C is an appropriate measure of personality for English speaking
adolescents.

54
Chapter 4
DISCUSSION
The purpose of this study was to conduct an analysis of an American
sample of adolescents in order to provide further support for the BFQ-C as an
appropriate measure of personality for young adolescents. Preliminary support
for this measure has already been established in four languages. Prior to using
this measure in the United States, it is important to determine if this is an
accurate representation of the construct of the five factor model of personality in
English.
Principal components analysis was used to begin the process of
determining construct validity. Particularly, exploratory factor analysis is useful in
determining the internal structure of a set of items and thus enabling them to be
grouped into relevant factors. Although a factor analysis provides a method for
determining the goodness of fit of items in the subscales of an instrument (Pett et
al., 1999), reliability and validity are not automatically assumed, but instead are
the first step in establishing construct validity. In order for this to happen, multiple
studies must be undertaken to determine if all of the components have been
identified and also correctly interpreted.
The present study, suggested the presence of six dimensions in the data,
rather than five. Although these components were recognizably similar to the
hypothesized five factor model, the overall structure of the components differed
from the structure found in the research of Barbaranelli et al. (2003). This
variation occurred in several ways. First among them, the order of the
components was altered in the current study. In addition, the number of items
loading on any specific component was not equivalent to those same items in the
55
Italian study. In particular, the first component that explained the greatest amount
of variance in the current data was found to be more closely related to the
construct of Conscientiousness, rather than the Italian findings of Energy/
Extraversion. Additionally, several items that loaded on this first component were
also related to Agreeableness.
The second component was similar to that found in the Italian sample,
and appeared most closely related to Energy/Extraversion, but had the additional
aspect of Agreeableness as well. Although this component was closely related to
its Italian counterpart, it was not the component to explain the most variance as it
was in Italian.
The third and fifth components in this study were found to be equivalent
to that found in the Italian sample, and so were labeled as the Neuroticism/
Emotional Instability component. Although the items found in the Neuroticism
scales in the American sample were consistent with those items found to
compose the Italian Neuroticism component, the overall structure of the
American components were different than that found in the original Italian study.
Specifically, the Neuroticism component split into two components. Neuroticism
component three included items related to aggressive affect. Item 15: I get angry
easily; Item 49: I lose my calm easily; Item 17: I argue with others; Item 6: I am in
a bad mood; Item 8: I get into heated arguments with others; Item 54: I get
irritated when things are difficult for me; and Item 41: I am not patient. In contrast,
the Neuroticism component five included items relevant to non-aggressive affect.
Item 61: I worry about silly things; Item 4: I get nervous for silly things; Item 29:
My feelings get hurt easily; Item 58: I cry. An explanation for this divergence of
the Neuroticism component may be found in the temperament literature.

56
Specifically, research done by Evans and Rothbart (2007; 2008), which posits
the presence of a sixth factor related to the temperament factors of Aggressive
negative affect and Non-aggressive negative affect. This explanation seems to
account for the differences in the items found on each of the Neuroticism
components of the six component solution of this study. Although the five and
seven component solutions were found to be non-optimal for explaining current
data, it was interesting to note that this split in the Neuroticism component was
consistent across the three solutions examined. Additional differences found in
the fifth component, while predominantly relevant to those items related to the
construct of Neuroticism/ Emotional Instability, this component also included
items which, in the Italian sample, were related to Agreeableness, Energy/
Extraversion, and Intellect/ Openness.
In contrast to the results found in Muris et al. (2005), the fourth
component was closely related to its Italian counterpart, and was found to include
all items related to Intellect/ Openness. It was also noted that Barbaranelli et al.,
(2003), discussed that issues with the Intellect/Openness component reflect an
overall “general problem with the heterogeneity of this Big Five factor” (Muris et
al., 2005, p. 1766), although there has been debate on the necessity of including
Intellect/Openness as a separate personality dimension (Eysenck, 1992), this
was not an issue in the current study. Because of the difficulties with this factor in
the research, specifically, it seems to share features with other dimensions (i.e.,
Extraversion, and Conscientiousness), and the variations found in the loadings of
the five factors across studies, there have been proponents of including
additional factors to the current big five. This research purports that five appears
to be an insufficient number of factors to explain personality across cultures

57
(Ashton, Perugini, de Vries, Boies, Lee, Szarota, Blas, & De Raad, 2004;
Jackson, Paunonen, Fraboni, & Goffin, 1996; Evans & Rothbart, 2007; 2008).
Ashton, et al., (2004), report that similar six factor solutions have been found in
seven different languages. These languages are; Dutch, French, German,
Hungarian, Italian, Korean, and Polish. Because these languages represent
several different “language families” (McCrae & Costa, 1997, p.510), it is possible
to infer that a six component solution may be more able to provide evidence of
the universality of personality (McCrae et al., 1997).
The concept of cross-cultural differences is an important aspect to
address. As mentioned in Benson (1998), a limitation of factor analysis is that it is
only able to provide information on the dimensionality of the construct being
measured. The measure of a construct is guided by theory, however an
additional problem found in this type of analysis is that the components are often
not held together by theory, but may be based on the process by which the
participants responded to items.
The differences in the structure of the components in the current study
may be related to cultural differences between American and Italian adolescents,
including, but not limited to, language variances and the effects of translation
found in cross-cultural studies. Specifically, the differences may also be
attributed to conflicting ways in which the two cultures view the items included in
this measure and their relationship to the constructs they are meant to describe.
As an example, the concepts found in Conscientiousness that did not load in the
American sample as they did in the Italian sample, such as “I treat even people I
dislike with kindness”, and “I am polite when I talk to others” may all be items
which are irrelevant to the American perception of the definition of the construct

58
Conscientiousness. In contrast, both of these items loaded on the Agreeableness
factor in Italian, and are similar enough that it is possible to see the relevance of
their current loadings. Hofstee, Kiers, De Raad, Goldberg, and Ostendorf (1997),
attempt to explain this by stating that “systematic discrepancies in the positions
of the factors are to be expected across languages. If the world conformed to
simple structure, factors would be stable and easily interpretable. In the absence
of simple structure, however, factor positions shift easily, and impressions of
global correspondence obscure subtle but systematic differences in angular
positions.” (p. 29).
A particular limitation of this study, relevant to the issue of cross-cultural
relevance, was the modification of Italian to English translations without benefit of
additional back-translation. Several of these items, such as those found on the
Agreeableness component differ on the Italian versus American translation, for
example Item 11 is translated on the original Italian to English version as “I
behave correctly and honestly with others”. In contrast, the current American
translation has Item 11: “I am honest and kind with others”. Additional examples
of this on the Agreeableness component include Item 20: “I engage myself in the
things I do” (Italian), compared to “I get involved in the things I do and I do them
to the best of my ability” (American); Item 27: “I treat my peers with affection”
(Italian), compared to “I am nice to all of my classmates” (American). Several of
the items in each component were submitted to this translation prior to the
administration of the BFQ-C in the schools.
In order to better define the construct of personality across cultures,
perhaps future research could include additional efforts to compare meanings of
items more precisely across the two languages, such as addressing the need for

59
back-translating the current translations, or using those already available in a
similar study.
Additionally, it has been noted that a “substantive theory underlying a
construct may not be well understood or agreed upon by those in the field”
(Benson, 1998, p. 17). As this may be generalized to the idea of cross-cultural
differences, interpretations of constructs across languages may also suffer. Thus,
further studies of the BFQ-C may be worthwhile in order to understand the
possible cultural differences between Italian and American adolescents that may
be evident when interpreting the traits believed to comprise each of the five
components. Given that none of the components loaded as expected, additional
scale development in the English language version of the scale may be needed,
as inadequate translation could be indicated (Butcher, & Pancheri, 1976). Only
by determining if meanings and interpretations from one culture transfer to
another can construct validity be inferred. Construct validation helps establish
whether constructs developed to characterize personality in one culture are
linked to the culture, or represent universal ideas applicable to all humans.
Universality cannot be proven, but can be strengthened by showing invariance of
personality across different cultures.
Another aspect of interest found in this study was the presence of four
items which did not contribute to the interpretation of any of the components.
These results may be directly related to the sample used in the American study.
The sample itself was different due to SES, ethnicity, and location, as compared
to the overall census found in the United States, and could be considered a
cluster sample. This type of sample automatically violates the assumption of
independence optimal for a study sample. The demographics of the participants

60
used were restricted within the specific school setting in which the study was
conducted, therefore it follows that the generalizability of the results to other
schools in the area sampled could not be guaranteed. Generalizability of results
to greater geographical ranges may also be questionable as the sample was
taken from a specific geographic area in the Southwest, thus a higher Hispanic
population than found in the overall U.S. demographics is possible. Future
studies may wish to include a more diversified sample from several geographic
locations in the United States. As this is such an immense undertaking, several
smaller studies of different groups, perhaps differentiated by geographical
regions may also be useful in establishing the validity of this measure.
The reliability of the BFQ-C appeared to be acceptable, with Cronbach’s
alphas ranging from .61 for the fifth component, to .89 for the first component.
Four of the five components were found to have adequate reliability for
exploratory research (Nunnally, 1978). The alpha coefficient found on the fifth
component does not meet reliability standards, but does meet the
recommendation that alpha coefficients be at least 0.50 for group comparisons
(Helmstadter, 1964). Future efforts may wish to include additional items that may
increase the alpha coefficient, and strengthen this dimension.
Additional limitations in the present study need to be acknowledged. This
study was also based solely on the self-report version of the BFQ-C. Studies
conducted in Italian, Dutch, German, and Spanish also included parent and
teacher report. The data gathered from these reports may provide additional
important cross- cultural validation regarding the structure, reliability, and validity
of the BFQ-C.

61
There is also an argument to be made that using a principal components
analysis (PCA) as opposed to a factor analysis may be a limitation in this study.
There have been several limitations associated with PCA when used for factor
analysis. Although PCA is the simplest solution conceptually, it is “not a true
factor analytic model” (Finch & West, 1997, p. 464). Rather than estimating the
variance associated with the specific factors and then removing it from the
diagonal of the correlation matrix as is done with the principal factor analysis
(PFA) and maximum likelihood (ML), PCA utilizes 1’s on the diagonal in order to
analyze the original correlation matrix.
According to Borgatta, Kercher, and Stull (1986) PCA as a factor analysis
has several theoretical drawbacks. In a PCA, it is assumed that there is perfect
reliability (i.e., no measurement error). In contrast to a true FA solution, a PCA
maximizes the variance accounted for in a set of variables rather than
reproducing the observed correlation between a set of variables. Also, PCA
continues until all variance has been accounted for, meaning that there will
always be the same number of components derived as there are items in order to
explain all of the variance found. However, when “a specific factor associated
with each variable is small and a large number of variables are being analyzed,
PCA produces results that are very similar to those produced by true factor
analytic procedures” (Finch & West, 1997, p. 465). Conversely, when a small
number of variables are analyzed or residuals are large, principal components
analysis does not give the same results as a true factor analysis and may
actually overestimate factor loadings. Additionally, rotation of the matrices may
increase small differences between the PCA and the PFA (Gorsuch, 1983).

62
The purpose of this study was to compare the structure of two samples of
young adolescents; one which utilizes a previous study of an Italian sample of
adolescents, and the second which utilizes a sample of American adolescents
selected for this study. Although the overall outcome of the factor structure found
in the American sample of adolescents was not as expected, construct validity
and reliability from this study appear to be such that further study of the BFQ-C in
English is supported. Despite the limitations of this study, it has provided further
evidence for the cross-cultural properties of the BFQ-C, and may be considered
as another point on the path for future research into the uses of personality
measures as predictors of behavior and life outcomes. Measuring internal
personality states may help shed light on improving social functioning, behavioral
disorders, and impaired academic functioning in adolescents and may also help
delineate the underlying reasons for academic success. With continuing research
supporting the reliability and validity of this instrument, the BFQ-C may be useful
with English speaking students in the United States.

63
Table 1
Big Five Questionnaire-Children: Demographic Characteristics of Participants, Gender,
Ethnicity, and School Participation
Characteristic n %
Gendera
Male 137 33
Female 279 67
Breakdown by Ethnicity
White 224 66
Black 8 2
Hispanic 61 18
Asian/Pacific Islander 29 8
American Indian/Alaskan Native 15 4
Participation by School
School 1 78 19
School 2 278 67
School 3 60 14
Note: N = 416. aAge range of participants 11 to 14 years (mean age = 13.09 years).
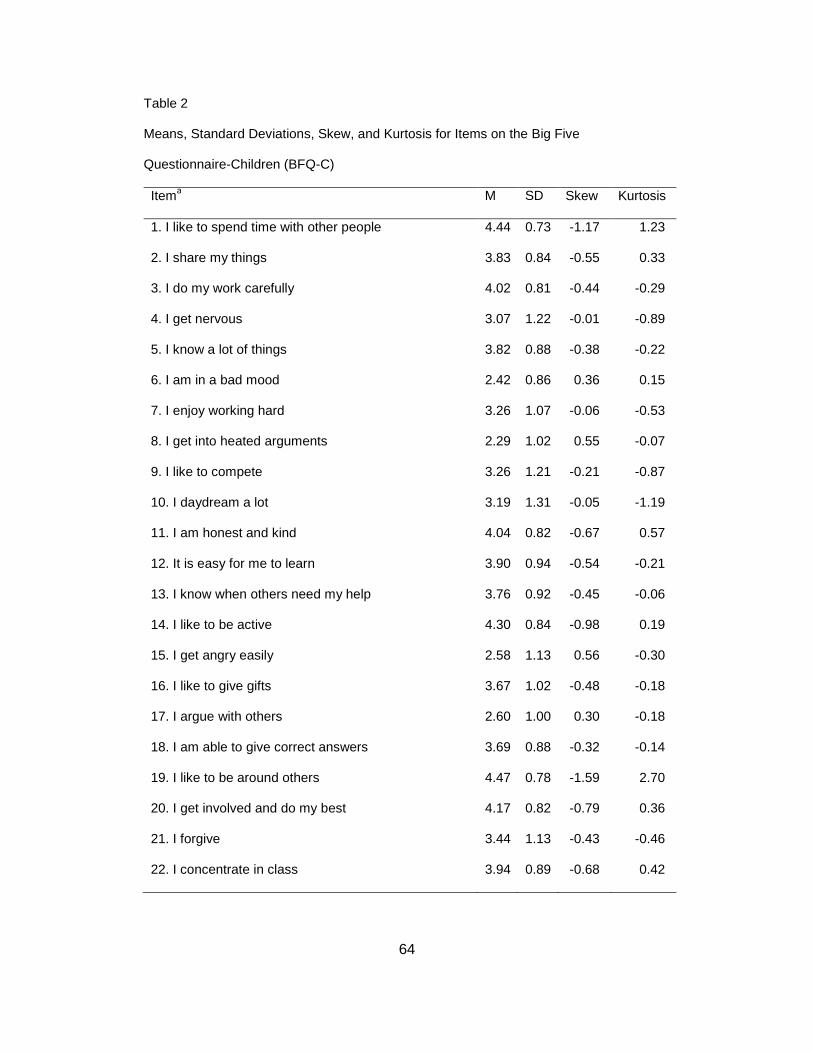
64
Table 2 Means, Standard Deviations, Skew, and Kurtosis for Items on the Big Five
Questionnaire-Children (BFQ-C)
Itema M SD Skew Kurtosis
1. I like to spend time with other people 4.44 0.73 -1.17 1.23
2. I share my things 3.83 0.84 -0.55 0.33
3. I do my work carefully 4.02 0.81 -0.44 -0.29
4. I get nervous 3.07 1.22 -0.01 -0.89
5. I know a lot of things 3.82 0.88 -0.38 -0.22
6. I am in a bad mood 2.42 0.86 0.36 0.15
7. I enjoy working hard 3.26 1.07 -0.06 -0.53
8. I get into heated arguments 2.29 1.02 0.55 -0.07
9. I like to compete 3.26 1.21 -0.21 -0.87
10. I daydream a lot 3.19 1.31 -0.05 -1.19
11. I am honest and kind 4.04 0.82 -0.67 0.57
12. It is easy for me to learn 3.90 0.94 -0.54 -0.21
13. I know when others need my help 3.76 0.92 -0.45 -0.06
14. I like to be active 4.30 0.84 -0.98 0.19
15. I get angry easily 2.58 1.13 0.56 -0.30
16. I like to give gifts 3.67 1.02 -0.48 -0.18
17. I argue with others 2.60 1.00 0.30 -0.18
18. I am able to give correct answers 3.69 0.88 -0.32 -0.14
19. I like to be around others 4.47 0.78 -1.59 2.70
20. I get involved and do my best 4.17 0.82 -0.79 0.36
21. I forgive 3.44 1.13 -0.43 -0.46
22. I concentrate in class 3.94 0.89 -0.68 0.42

65
Table 2
Means, Standard Deviations, Skew, and Kurtosis for Items on the Big Five
Questionnaire-Children (BFQ-C)
Itema M SD Skew Kurtosis
23. I can tell others what I think 3.26 1.07 -0.10 -0.49
24. I like to read books 3.27 1.41 -0.27 -1.19
25. I check my homework many times 2.23 1.10 0.74 -0.07
26. I say what I think 3.41 1.17 -0.34 -0.75
27. I am nice to all my classmates 3.88 0.90 -0.57 0.10
28. I respect and follow rules 4.14 0.92 -1.05 1.06
29. My feelings get hurt easily 2.67 1.13 0.43 -0.46
30. I understand directions immediately 3.34 0.89 -0.18 -0.05
31. I am sad 2.38 0.99 0.41 -0.17
32. I treat others with kindness 4.03 0.81 -0.62 0.31
33. I like scientific TV shows 2.40 1.31 0.64 -0.66
34. I keep my appointments 3.98 0.86 -0.60 0.11
35. I find things to do so I am not bored 4.03 0.99 -0.89 0.36
36. I like to watch the news and know what’s going on 2.82 1.22 0.09 -0.92
37. My room is neat and organized 2.99 1.35 0.01 -1.15
38. I am polite when I talk to others 3.93 0.83 -0.49 0.05
39. I have to do things immediately 3.38 1.02 0.11 -0.69
40. I like to talk with others 4.39 0.85 -1.49 1.98
41. I am not patient 2.95 1.19 0.18 -0.73
42. I am able to get people to agree with me 3.38 1.06 -0.24 -0.41
43. I make up new games and things to do 3.28 1.09 -0.15 -0.67
44. I have to finish what I start 3.32 1.04 -0.10 -0.41

66
Table 2
Means, Standard Deviations, Skew, and Kurtosis for Items on the Big Five
Questionnaire-Children (BFQ-C)
Itema M SD Skew Kurtosis
45. I help classmates when they have trouble 3.51 0.93 -0.26 -0.11
46. I am able to solve math problems 3.92 1.06 -0.87 0.26
47. I trust others 3.74 0.93 -0.65 0.41
48. I keep my school things neat and organized 3.70 1.14 -0.56 -0.53
49. I lose my calm easily 2.56 1.09 0.59 -0.20
50. Others listen and do what I say 3.04 0.93 -0.01 -0.02
51. I treat even people I dislike with kindness 3.19 1.13 -0.23 -0.56
52. I like to learn new things 3.92 0.94 -0.61 -0.17
53. I finish homework before I play 3.25 1.34 -0.13 -1.16
54. I get irritated with difficult things 3.60 1.02 -0.21 -0.69
55. I like to joke around 4.26 0.92 -1.15 0.76
56. I pay attention to what I am doing 3.15 0.92 0.14 -0.18
57. I make friends easily 3.98 1.04 -0.85 0.11
58. I cry 2.42 1.08 0.42 -0.47
59. would like to travel, learn of other countries 3.88 1.14 -0.68 -0.55
60. I think people are good and honest 3.39 0.93 -0.30 0.24
61. I worry about silly things 3.05 1.26 0.05 -0.95
62. I understand things immediately 3.32 0.97 -0.11 -0.16
63. I am happy and active 4.25 0.82 -0.92 0.49
64. I let other people use my things 3.64 0.91 -0.49 0.33
65. I take care of my responsibilities 4.07 0.86 -0.78 0.49
Note. N = 416 a Based on a response scale of 1 = Almost Never, 2 = Rarely, 3 = Sometimes, 4 = Often, 5 = Almost Always.

67
Table 3
Pattern Coefficients Following Oblimin Rotation of the Big Five Questionnaire--Children
Itema Componentb
1 2 3 4 5 6 7
32 .765 .047 .045 .010 -.095 .047 -.091
27 .748 -.064 .173 -.159 .070 .048 -.018
11 .679 .022 .163 .027 -.105 .032 -.038
51 .645 -.042 .080 -.060 .026 .143 -.037
60 .627 .183 .011 .084 .062 -.009 -.021
28 .609 -.111 .115 .067 -.091 .128 -.205
38 .591 .028 .107 .054 -.086 .179 -.054
45 .540 .027 -.064 .173 -.044 .099 .064
47 .531 .195 -.013 -.033 .135 .040 .076
21 .498 -.006 .136 -.022 -.161 -.036 .144
20 .439 .067 -.141 .209 .222 .180 -.028
64 .423 .305 -.030 .268 -.130 -.142 .115
2 .384 .213 .072 .230 -.161 -.190 .181
16 .380 .184 -.162 .041 -.302 .074 .154
34 .379 -.034 -.030 .246 -.015 -.089 .071
19 .106 .718 .045 .015 -.036 .065 .126
40 .134 .692 -.003 .010 -.033 .052 .150
1 .216 .636 .029 -.037 -.057 -.016 .063
57 .106 .552 .043 -.042 .099 .094 .356
33 .230 -.487 -.063 .165 .182 -.034 .181
24 .113 -.449 -.063 .101 -.187 .147 .230
63 .236 .338 .080 -.006 .286 .195 .223
rev@15 .049 .094 .793 -.001 .066 .034 .058
rev@49 .062 .081 .763 .038 .074 .015 .085
rev@17 .194 -.003 .682 -.034 -.108 .108 -.110
rev@6 .078 .299 .573 .023 .077 .091 .148
rev@8 .290 .033 .570 .000 .061 .015 -.192
rev@54 -.091 -.045 .525 .072 .195 .028 .064
rev@31 -.026 .143 .483 .024 .452 .007 .138
rev@41 .215 -.152 .390 -.007 .014 .199 -.030
39 -.028 .131 -.373 -.162 .095 .077 .215
46 -.100 .070 .026 .822 .013 -.026 -.157
12 -.036 .022 .088 .799 -.036 .010 -.035

68
Table 3 Pattern Coefficients Following Oblimin Rotation of the Big Five Questionnaire--Children
Itema
Componentb
1 2 3 4 5 6 7
62 -.043 -.088 -.033 .751 .099 .039 .066
30 .051 -.176 -.002 .736 .080 -.051 .048
18 .127 -.074 .037 .676 .026 -.028 .033
5 -.151 .041 .043 .521 -.099 .215 .130
52 .156 .017 .012 .384 .022 .376 .014
22 .279 -.089 .083 .315 -.003 .290 -.171
43 .229 -.087 -.078 .237 .083 -.027 .234
rev@4 .008 -.075 .043 -.028 .653 -.087 .012
rev@61 -.022 -.060 .116 .067 .641 -.090 -.044
rev@29 -.152 .001 .357 .060 .572 -.026 .123
rev@58 -.078 .001 .360 .124 .520 -.064 -.010
14 .080 .335 -.122 -.082 .448 .282 .078
9 -.247 .230 -.304 .178 .402 .101 .118
48 -.095 .138 .103 .075 -.249 .663 .056
37 -.072 .055 .096 .025 -.043 .620 .002
7 .121 .055 -.083 .121 .109 .604 -.035
25 .122 -.106 .134 -.048 .004 .584 .041
3 .211 -.107 .142 .276 -.030 .403 -.021
65 .255 .077 -.036 .341 -.057 .374 -.084
53 .314 -.007 -.109 .117 .164 .366 -.209
56 .236 -.083 -.255 -.021 .258 .352 .014
36 .029 -.286 -.087 .026 -.058 .300 .287
44 .241 .023 -.216 .132 .060 .265 .110
42 -.089 -.047 -.128 .167 .123 -.130 .649
23 -.039 .122 .210 -.040 -.063 .088 .637
26 -.109 .141 -.068 -.039 .002 -.009 .571
50 -.071 .095 -.008 .136 .180 .034 .437
59 .044 -.143 .028 .014 -.274 .246 .431
55 .057 .235 -.044 -.008 .155 -.222 .426
13 .181 .074 .042 .209 -.156 .071 .395
10 .078 .080 -.115 -.178 -.279 -.283 .347
35 .224 -.163 .069 -.017 .172 .063 .286
Note. N = 416. Extraction Method: Principal Component Analysis.

69
aDescription of items found in Appendix A bComponent: 1) Agreeableness, 2) Energy/Extraversion 3) Neuroticism – Aggressive Negative
Affect, 4) Intellect/Openness, 5) Neuroticism – Non-Aggressive Negative Affect, 6)
Conscientiousness; 7) Extraversion
*Near zero loadings, < .01.

70
Table 4
Pattern Coefficients Following Oblimin Rotation for the Big Five Questionnaire-Children
Itema Componentb
h2 1 2 3 4 5 6
32 .752 -.089 .052 .031 -.093 .064 .631
27 .656 -.104 .180 -.058 .013 .095 .528
11 .654 -.057 .169 .056 -.121 .056 .552
60 .649 .077 .028 .077 .079 -.012 .473
51 .588 -.099 .088 .000 .000 .177 .464
38 .583 -.064 .115 .057 -.080 .196 .515
28 .578 -.283 .121 .091 -.092 .144 .532
47 .533 .169 .001 -.020 .137 .048 .368
45 .528 .050 -.054 .206 -.050 .128 .449
64 .508 .292 -.019 .207 -.091 -.157 .433
21 .448 .088 .132 .043 -.211 .013 .314
20 .446 .010 -.118 .220 .243 .181 .440
2 .428 .287 .077 .214 -.162 -.181 .381
16 .425 .228 -.169 .007 -.272 .089 .388
34 .357 .033 -.022 .301 -.043 -.061 .244
22 .294 -.214 .100 .288 .028 .286 .439
57 .209 .661 .058 -.146 .147 .068 .568
23 -.095 .617 .202 .035 -.153 .165 .426
26 -.145 .585 -.076 .031 -.063 .051 .352
40 .326 .578 .013 -.199 .089 -.025 .507
19 .311 .575 .062 -.214 .096 -.022 .505
42 -.188 .543 -.131 .335 .000 -.034 .430
55 .046 .527 -.039 .047 .105 -.193 .333
1 .393 .461 .043 -.232 .058 -.093 .431
50 -.102 .449 .000 .199 .125 .078 .281
63 .273 .403 .104 -.041 .304 .188 .462
13 .168 .379 .041 .248 -.198 .125 .357
10 .047 .339 -.139 -.114 -.334 -.235 .329
rev@15 .042 .101 .807 -.032 .026 .030 .674
rev@49 .049 .118 .777 .019 .028 .016 .637

71
Table 4
Pattern Coefficients Following Oblimin Rotation for the Big Five Questionnaire-Children
Itema Componentb
h2 1 2 3 4 5 6
rev@17 .187 -.121 .687 -.075 -.125 .103 .585
rev@6 .128 .314 .590 -.059 .081 .070 .511
rev@8 .291 -.161 .585 -.034 .055 -.006 .508
rev@54 -.131 .031 .538 .096 .142 .037 .337
rev@31 -.047 .222 .510 .038 .408 .001 .528
rev@41 .150 -.147 .395 .036 -.031 .229 .309
39 -.029 .268 -.377 -.140 .102 .092 .251
30 .049 -.041 .020 .779 .057 -.032 .617
62 -.010 .036 -.008 .752 .103 .043 .608
12 .059 .021 .113 .721 .009 -.018 .558
46 .031 -.045 .055 .703 .092 -.085 .492
18 .154 .004 .059 .682 .024 -.022 .534
5 -.084 .159 .055 .455 -.066 .211 .327
33 .036 -.166 -.063 .414 .035 .075 .225
43 .169 .145 -.071 .340 .022 .027 .210
rev@61 -.084 -.054 .146 .149 .591 -.095 .429
rev@4 -.078 -.021 .070 .084 .589 -.077 .383
rev@29 -.211 .128 .385 .126 .505 -.020 .511
14 .135 .286 -.095 -.143 .503 .247 .445
rev@58 -.113 .014 .390 .161 .477 -.076 .461
9 -.181 .285 -.281 .130 .452 .066 .419
59 -.038 .256 .009 .109 -.351 .339 .312
24 -.040 -.111 -.081 .283 -.300 .257 .283
48 -.011 .119 .103 -.066 -.167 .648 .442
25 .081 -.063 .138 -.043 .002 .617 .434
37 -.030 .022 .102 -.066 .015 .611 .358
7 .157 -.008 -.066 .057 .171 .596 .493
3 .202 -.101 .155 .268 -.023 .423 .488
36 -.089 .045 -.098 .160 -.140 .391 .225
56 .185 -.056 -.243 .039 .255 .380 .317
52 .195 .022 .031 .339 .060 .376 .465
65 .325 -.030 -.019 .258 .012 .356 .460
53 .333 -.198 -.090 .084 .217 .349 .384

72
Table 4
Pattern Coefficients Following Oblimin Rotation for the Big Five Questionnaire-Children
Itema Componentb
h2 1 2 3 4 5 6
44 .236 .099 -.207 .150 .070 .288 .289
35 .099 .125 .072 .138 .068 .143 .115 Note. N = 416. Extraction Method: Principal Component Analysis. aDescription of items found in Appendix A. bComponent: 1) Agreeableness, 2) Energy/Extraversion, 3) Neuroticism – Aggressive Negative
Affect, 4) Intellect/Openness, 5) Neuroticism – Non-Aggressive Negative Affect, 6)
Conscientiousness
*Near zero loadings, < .01.

73
Table 5 Pattern Coefficients Following Oblimin Rotation for the Big Five
Questionnaire-Children
Itema Componentb
1 2 3 4 5
7 .672 .001 -.090 .083 .104
53 .596 -.102 .009 .063 .040
25 .570 -.091 .087 .007 .029
56 .563 -.006 -.215 .025 .108
37 .505 -.039 .002 -.010 .084
20 .489 .143 .014 .199 .014
65 .486 .017 .051 .279 -.104
48 .468 .034 -.006 .020 -.078
51 .462 .070 .284 -.002 -.231
3 .452 -.101 .175 .304 -.039
14 .441 .372 -.125 -.159 .385
52 .436 .025 .040 .368 .015
38 .436 .086 .301 .070 -.288
22 .423 -.164 .189 .292 -.060
27 .418 .101 .408 -.067 -.236
32 .417 .126 .323 .025 -.398
28 .415 -.128 .344 .082 -.307
44 .412 .137 -.170 .163 -.061
45 .364 .176 .110 .215 -.268
60 .338 .282 .246 .063 -.201
36 .249 -.054 -.183 .210 -.075
35 .168 .136 .064 .158 .056
57 .117 .731 .024 -.100 .081
40 .096 .693 .049 -.168 -.044
19 .087 .688 .091 -.181 -.021
1 .074 .606 .128 -.214 -.105
55 -.180 .554 -.074 .064 .081
23 -.083 .532 .051 .131 -.005
26 -.130 .506 -.215 .094 .023
63 .340 .501 .108 -.022 .203
42 -.195 .443 -.270 .383 .093
64 .049 .427 .141 .221 -.292
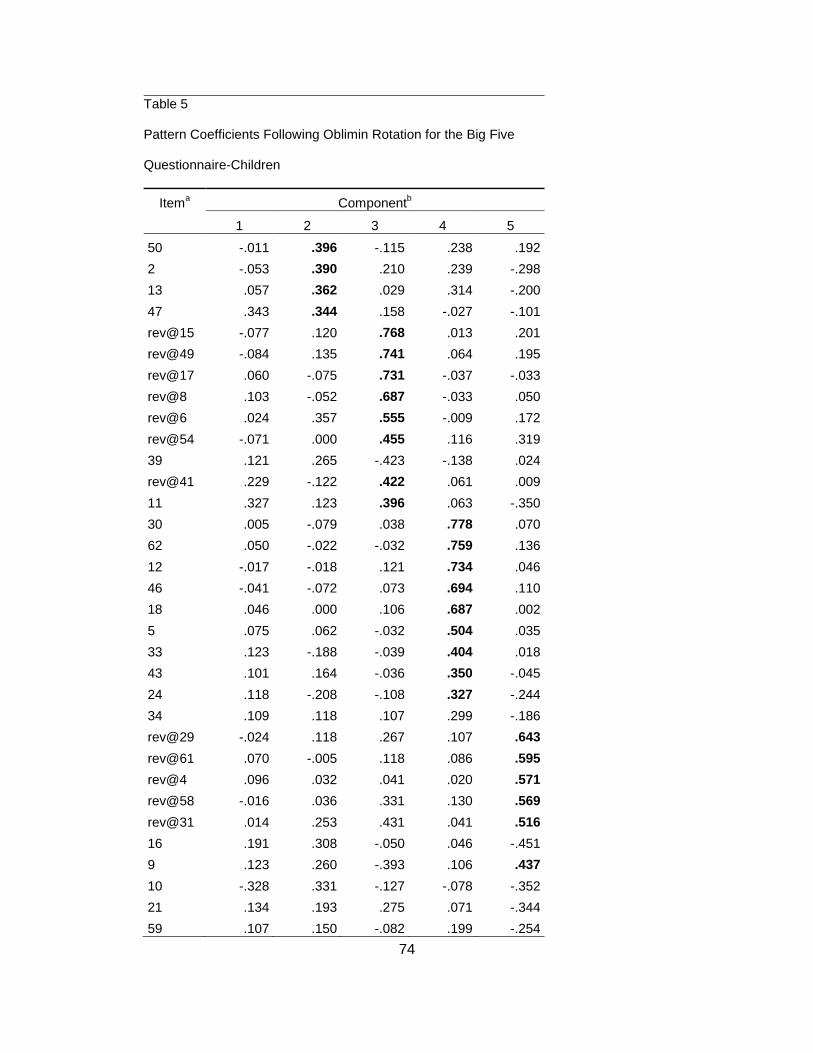
74
Table 5
Pattern Coefficients Following Oblimin Rotation for the Big Five
Questionnaire-Children
Itema Componentb
1 2 3 4 5
50 -.011 .396 -.115 .238 .192
2 -.053 .390 .210 .239 -.298
13 .057 .362 .029 .314 -.200
47 .343 .344 .158 -.027 -.101
rev@15 -.077 .120 .768 .013 .201
rev@49 -.084 .135 .741 .064 .195
rev@17 .060 -.075 .731 -.037 -.033
rev@8 .103 -.052 .687 -.033 .050
rev@6 .024 .357 .555 -.009 .172
rev@54 -.071 .000 .455 .116 .319
39 .121 .265 -.423 -.138 .024
rev@41 .229 -.122 .422 .061 .009
11 .327 .123 .396 .063 -.350
30 .005 -.079 .038 .778 .070
62 .050 -.022 -.032 .759 .136
12 -.017 -.018 .121 .734 .046
46 -.041 -.072 .073 .694 .110
18 .046 .000 .106 .687 .002
5 .075 .062 -.032 .504 .035
33 .123 -.188 -.039 .404 .018
43 .101 .164 -.036 .350 -.045
24 .118 -.208 -.108 .327 -.244
34 .109 .118 .107 .299 -.186
rev@29 -.024 .118 .267 .107 .643
rev@61 .070 -.005 .118 .086 .595
rev@4 .096 .032 .041 .020 .571
rev@58 -.016 .036 .331 .130 .569
rev@31 .014 .253 .431 .041 .516
16 .191 .308 -.050 .046 -.451
9 .123 .260 -.393 .106 .437
10 -.328 .331 -.127 -.078 -.352
21 .134 .193 .275 .071 -.344
59 .107 .150 -.082 .199 -.254

75
Note. N = 416. Extraction Method: Principal Component Analysis. aDescription of items found in Appendix A. bComponent: 1) Conscientiousness, 2) Energy/Extraversion, 3) Neuroticism – Aggressive
Negative Affect, 4) Intellect/Openness, 5) Neuroticism – Non-Aggressive Negative Affect
*Near zero loadings, < .01.

76
Table 6 Total Variance Explained by the Six Component Solution of the BFQ-C
Component Initial Eigenvalues
Extraction Sums of Squared
Loadings
Rotation
Sums of
Squared
Loadingsa
Total
% of
Variance
Cumulative
% Total
% of
Variance
Cumulative
% Total
1 11.247 17.302 17.302 11.247 17.302 17.302 8.485
2 4.585 7.054 24.357 4.585 7.054 24.357 4.787
3 4.367 6.719 31.076 4.367 6.719 31.076 4.889
4 3.829 5.891 36.967 3.829 5.891 36.967 6.153
5 2.071 3.187 40.153 2.071 3.187 40.153 3.273
6 1.658 2.550 42.704 1.658 2.550 42.704 6.001
aWhen components are correlated; sums of squared loadings cannot be added to obtain a total variance.

77
Table 7 Factor Correlations and Factor Alpha Coefficients for the BFQ-C
(N = 416)
Component 1 2 3 4 5 6
1. Agreeableness (n = 15) (.88)
2. Energy/Extraversion (n = 12) .146 (.78)
3. Neuroticism/Emotional Instability (n = 8) .167 -.050 (.82)
4. Intellect/Openness to Experience (n = 8) .201 .050 .059 (.80)
5. Neuroticism (n = 6) -.048 .079 .121 .049 (.68)
6. Conscientiousness (n = 11) .322 .030 .049 .323 .020 (.78)
Total Scale (n = 60) (.90) Note: Reliability estimates appear in the parentheses on the diagonal.

78
Table 8 Item-total Scale Correlations of the BFQ-C with Oblimin Oblique Rotation and Coefficient
Alphas (N = 416).
Item Component loadings
Component 1: Agreeableness
(α = 0.88)
32 .730
27 .628
11 .652
60 .605
51 .601
38 .640
28 .546
47 .494
45 .592
64 .502
21 .469
20 .476
02 .456
16 .426
34 .364
Component 2:Energy/Extraversion
(α =0.78 )
57 .623
23 .483
26 .438
40 .555
19 .544
42 .400
55 .436
01 .447

79
Table 8
Item-to-total Scale Correlations of the BFQ-C with Oblimin Oblique Rotation and
Coefficient Alphas (N = 416).
Item Component loadings
50 .369
63 .377
13 .338
10 .196
Component 3: Neuroticism/Emotional Instability
(α = 0.82)
rev15 .750
rev49 .678
rev17 .623
rev6 .555
rev8 .572
rev54 .385
rev31 .472
rev41 .354
Component 4: Intellect/Openness
(α = 0.80)
30 .657
62 .672
12 .629
46 .566
18 .614
05 .440
33 .304
43 .305
Component 5: Neuroticism/Emotional Instability
(α = 0.68)
rev61 .499

80
Note: Item descriptions can be found in Appendix A.
Table 8
Item-to-total Scale Correlations of the BFQ-C with Oblimin Oblique Rotation and
Coefficient Alphas (N = 416).
Item Component loadings
rev4 .497
rev29 .487
14 .285
rev58 .424
09 .267
Component 6: Conscientiousness
(α = 0.78)
48 .483
25 .493
37 .423
07 .552
03 .536
36 .298
56 .350
52 .552
65 .548
53 .446
59 .255

81
REFERENCES
Allport, G. W. & Odbert, H.S. (1936). Trait-names: A psycho-lexical study. Psychological Monographs, 47 (1, Whole No. 211).
Allison, P. D. (2002). Missing data. Thousand Oaks, CA: Sage.
Barbaranelli, C., Caprara, G. V, & Rabasca, A. (1998). Big Five Questionnaire
Child (BFQ-C). Manuale. Italy: O. S. Organizzazioni Speciali-Firenze. Barbaranelli, C., Caprara, G. V., Rabasca, A., & Pastorelli, C. (2003). A
questionnaire for measuring the big five in late childhood. Personality and Individual Differences, 34, 645-664. doi:10.1016/S0191-8869(02)00051-X
Barbaranelli, C., Fida, R., Paciello, M., Di Gunta, L., & Caprara, G. V. (2008).
Assessing personality in early adolescence through self-report and other-ratings a multitrait-multimethod analysis of the BFQ-C. Personality and Individual Differences, 44, 876-886. doi:10.1016/j.paid.2007.10.014
Barkley, R. A. (1997). ADHD and the nature of self-control. New York, NY:
Guilford Press. Barkley, R. A. (2003). Attention-deficit/Hyperactivity disorder. In E. J. March, & R.
A. Barkely (Eds.), Child Psychopathology (2nd ed.). New York, NY: The Guilford Press (pp. 75-143).
Bartlett, M. S. (1950). Tests of significance in factor analysis. British Journal of
Psychology (Statistical Section), 3, 77-85. Retrieved from http://login.ezproxy1.lib.asu.edu/login?url=http://search.proquest.com.ezproxy1.lib.asu.edu/docview/615207737?accountid=4485
Baumgarten, F. (1933). ‘Die Charktereigenschaften’. [The character traits]. In:
Beitraege zur Charackter-und Persoenlichkeitsforschung (Whole No. 1). A Francke, Bern Switzerland.
Beard, R. C. (2010). Personality and popularity in middle childhood.
(Unpublished master’s thesis). Arizona State University, Arizona. Becker, W. C. (1960). The matching of behavior rating and questionnaire
personality factors. Psychological Bulletin, 57, 201-212. doi:10.1037/h0048607
Ben-Porath, Y. S. (1990). Cross-cultural assessment of personality: The case for
replicatory factor analysis. Advances in Personality Assessment, 8, 27-48.
Benson, J. (1998). Developing a strong program of construct validation: A test
anxiety example. Educational Measurement: Issues and Practice, 17, 10-22.

82
Block, J., & Block, J. H. (1980). The California Child Q-set. Palo Alto, CA: Consulting Psychologists Press. (Original work published 1969).
Borgatta, E. F. (1964). A very short test of personality: The Behavioral Self-
Rating (BSR) form. Psychological Reports, 14(1), 275-284. Borgatta, E. F., Kercher, K., & Stull, D. E. (1986). A cautionary note on the use of
principal components analysis models. In K. G. Joreskog & H. Wold (Eds.), Systems under indirect observation (1st ed.),149-174. Amsterdam: North Holland.
Branje, S. J., Van Lieshout, C. F. M., & Gerris, J. R. M. (2007). Big five
personality development in adolescence and adulthood. European Journal of Personality, 21, 45-62. doi:10.1002/per.596
Busato, V. V., Prins, F. J., Elshout, J. J., & Hamaker, C. (2000). Intellectual
ability, learning style, personality, achievement motivation and academic success of psychology students in higher education. Personality and Individual Differences, 29, 1057-1068. doi.org/10.1016/S0191-8869(99)00253-6
Caprara, G. V., Barbaranelli, C. Borgogni, L., & Perugini, M. (1993). The “Big
Five Questionnaire”: A new questionnaire to assess the Five Factor Model. Personality and Individual Differences, 15, 281-288.
Carrasco, M. A., Holgado, F. P., & Del Barrio, V. (2005). Dimensionality of the
BFQ-C Questionnaire. Psicothema, 17, 286-291. Cattell, R. B. (1943). The description of personality: Basic traits resolved into
clusters. Journal of Abnormal and Social Psychology, 38(4), 476-506. Cattell, R. B. (1955). Psychiatric screening of flying personnel: Personality
structure in objective tests – a study of 1,000 air force students in basic pilot training. (Proj. No. 21-0202-007. [Rep. No. 9]). USAF School of Aviation Medicine. 1955.
Cattell, R. B. (1966). The scree test for the number of factors. Multivariate
Behavioral Research, 1, 245-276. Cattell, R. B., Eber, H. W., & Tatsuaoka, M. M. (1970). Handbook for the Sixteen
Personality Factor Questionnaire. Champaign, IL: IPAT Chamorro-Premuzic, T., & Furnham, A. (2006). Intellectual competence and the
intelligent personality: A third way in differential psychology. Review of General Psychology, 10, 251-267. doi:10.1037/1089-2680.10.3.251
Chaplin, W. F., John, O. P., & Goldberg, L. R. (1988). Conceptions of states and
traits: Dimensional attributes with ideals as prototypes. Journal of Personality and Social Psychology, 54, 541-557. doi:10.1037/0022-3514.54.4.541

83
Cooper, M. L., Agocha, V. B., & Sheldon, M. S. (2000). A motivational
perspective on risky behaviors: The role of personality and affect regulatory Processes. Journal of Personality, 68, 1059-1088.
Corulla, W. J. (1990). A revised version of the Psychoticism scale for children.
Personality and Individual Differences, 11, 65-76. doi:10.1016/0191-8869(90)90169-R
Costa, P. T., Jr., & McCrae, R. R. (1992). Normal personality assessment in
clinical practice: The NEO Personality Inventory. Psychological Assessment, 4, 5-13. doi:10.1037/1040-3590.4.1.5
Costa, P. T., Jr., & McCrae, R. R. (1995). Domains and facets: Hierarchical
personality assessment using the Revised NEO-Personality Inventory. Journal of Personality Assessment, 64(1), 21-50.
Costa, P. T., Jr., McCrae, R. R., & Dye, D. A. (1991). Facet scales for
agreeableness and conscientiousness: A revision of the NEO Personality Inventory. Personality and Individual Differences, 12, 887-898.
Costa, P. T., & McCrae, R. R. (1995). Domains and facets: Hierarchical personality assessment using the Revised NEO Personality Inventory. Journal of Personality Assessment 64(1), 21- 50.
Costa, P. T., Jr., McCrae, R. R., & Martin, T. A. (2008). Incipient adult personality: The NEO-PI-3 in middle-school-aged children. British Journal of Developmental Psychology, 26, 71-89. doi:10.1348/026151007X196273
Council of Chief State School Officers (2010). School Matters. Retrieved from
Portion’s (2010) Standard and Poor’s website: http://www.schoolmatters.com/
Deary, I. J., Strand, S., Smith, P., & Fernandes, C. (2007). Intelligence and
educational achievement. Intelligence, 35, 13-21. doi:10.1016/j.intell.2006.02.001
De Fruyt, F., Mervielde, I., Hoekstra, H. A., & Rolland, J. P. (2000). Assessing
adolescents’ personality with the NEO-PI-R. Psychological Assessment, 7, 329-345.
Del Barrio, V., Carrasco, M. A., & Holgado, F. P. (2006). Factor structure
invariance in the Children’s Big Five Questionnaire. European Journal of Psychological Assessment, 22, 158-167. doi:10.1027/1015-5759.22.3.158.
Denham, S. A. (1998). Emotional development in young children. New York, NY:
Guilford Press.

84
Di Fabio, A., & Busconi, L. (2007). Fluid intelligence, personality traits and scholastic success: Empirical evidence in a sample of Italian high school students. Personality and Individual Differences, 43, 2095-2104. doi:10.1016/j.paid.2007.06.025
Digman, J. M., & Inouye, J. (1986). Further specification of the five robust factors
of personality. Journal of Personality and Social Psychology, 50, 116-123. doi:10.1037/0022-3514.50.1.116
Digman, J. M., & Takemoto-Chock, N. K. (1981). Factors in the natural language
of personality: Re-analysis, comparison, and interpretation of six major studies. Multivariate Behavioral Research, 16, 149-170. doi:10.1207/s15327906mbr1602_2
Eklund, J. M., Liljeberg, J. F., & af Klinteberg, B. (2010). Delinquent behavior
patterns in adolescence: Development and associated personality traits. Personality and Mental Health, 5, n/a. doi:10.1002/pmh.137
Ehrler, D. J., Evans, J. G., & McGhee, R. L. (1999). Extending the Big-Five
theory into childhood: A preliminary investigation into the relationship between Big-Five personality traits and behavior problems in children. Psychology in the Schools, 36, 451-458. doi:10.1002/(SICI)1520-6807(199911)36:6<451::AID-PITS1>3 .0.CO;2-E
Embretson, S., & Gorin, J. (2001). Improving construct validity with cognitive
psychology principles. Journal of Educational Measurement, 38, 343-368. doi:10.1111/j.1745-3984.2001.tb01131.x
Essau, C. A., Sasagawa, S., & Frick, P. J. (2006). Callous-Unemotional traits in a
community sample of adolescents. Assessment, 13, 454-469. doi:10.1177/1073191106287354
Evans, D. E., & Rothbart, M. K. (2007). Developing a model for adult
temperament. Journal of Research in Personality, 41, 868-888. doi:10.1016/j.jrp.2006.11.002
Evans, D. E., & Rothbart, M.K. (2008). Temperamental sensitivity: Two
constructs of one? Personality and Individual Differences, 44, 108-118. doi:10.1016/j.paid.2007.07.016
Eysenck, H. J. (1975). The Structure of Social Attitudes. British Journal of Social
and Clinical Psychology, 14(4), 323-331. Eysenck, H. J., & Eysenck, S. B. G. (1975). Manual of the Eysenck Personality
Questionnaire. London, England: Hodder & Stoughton. Fergusson, D. M., Horwood, L. J., & Ridder, E. M. (2005). Partner violence and
mental health outcomes in a New Zealand birth cohort. Journal of Marriage and Family, 67, 1103-1119.

85
Finch, J. F., & West, S. G. (1997). The investigation of personality structure: Statistical models. Journal of Research in Personality, 31, 439-485.
Fiske, D. W. (1949). Consistency of the factorial structures of personality ratings
from different sources. Journal of Abnormal and Social Psychology, 44(3), 329-344.
Floyd, F. J., & Widaman, K. F. (1995). Factor analysis in the development and
refinement of clinical assessment instruments. Psychological Assessment, 7, 286-299. doi:10.1037/1040-3590.7.3.286
Frick, P. J. (2003). The Inventory of Callous-Unemotional Traits. Unpublished
rating scale, University of New Orleans: New Orleans, LA. Fritzche, B. A., McIntire, S. A. & Yost, A. P. (2002). Holland type as a moderator
of personality-performance predictions. Journal of Vocational Behavior, 60(3), 422-436.
Funder, D. C., & Colvin, C. R. (1997). Congruence of others’ and self-judgments
of personality. In R. Hogan, J. A. Johnson, S. R., Briggs (Eds.), Handbook of personality psychology, (pp. 617-647). San Diego, CA: Academic Press.
Furnham, A., & Chamorro-Premuzic, T. (2004). Personality and intelligence as
predictors of statistics examinations grades. Personality and Individual Differences, 37, 943-955. doi:10.1016/j.paid.2003.10.016
Garber, J. (1984). Classification of childhood psychopathology: A developmental
perspective. Child Development, 55(1), 30-48. Goldberg, L. R. (1981). Language and individual differences: The search for
universals in personality lexicons. In L. Wheeler (Ed.), Review of personality and social psychology, (Vol. 2, pp. 141-165). Beverly Hills, CA: Sage.
Goldberg, L.R., (1990). An alternative “Description of personality”: The Big-Five
factor structure. Journal of Personality and Social Psychology, 59, 1216-1229.
Goldberg, L.R. (1993). The structure of phenotypic personality traits. American
Psychologist, 48(1), 26-34. Goldberg, L. R. (2001). Analysis of Digman’s child-personality data: Derivation of
Big-Five factor scores from each of six samples. Journal of Personality, 69, 709-743.
Goldberg, L. R., & Velicer, W. F. (2006). Principles of exploratory factor analysis.
In S. Strack (Ed.), Differentiating normal and abnormal personality (2nd ed., pp. 209-237). New York, NY: Springer.

86
Goodman, L. R. (2001). Psychometric properties of the Strengths and Difficulties Questionnaire. Journal of the American Academy of Child and Adolescent Psychiatry, 40, 1337-1345. doi:10.1097/00004583-200111000-00015
Gorsuch, R. L. (1983). Factor analysis (2nd ed.). Hillsdale, NJ: Lawrence
Erlbaum. Gorsuch, R. L. (1988). Exploratory factor analysis. In J. R. Nesselroade & R. B.
Cattell (Eds.), Handbook of multivariate experimental psychology (2nd ed., pp. 231-258). New York, NY: Plenum.
Graziano, W. G., & Ward, D. (1992). Probing the big five in adolescence:
Personality and adjustment during a developmental transition. Journal of Personality. Special Issue: The five-factor model: Issues and application, 60, 425-439. doi:10.1111/j.1467-6494.1992.tb00979.x
Guadagnoli, E., &Velicer, W. F. (1988). Relation of sample size to the stability of
component patterns. Psychological Bulletin, 103, 265-275.
Hair, J. F., Black, W. C., Babin, B. J., Anderson, R. E., & Tatham, R. L. (2006).Multivariate data analysis (6th ed.). Upper Saddle River, NJ: Pearson Prentice Hall.
Hartup, W. W., & Stevens, N. (1999). Friendships and adaptation across the life
span. Current Directions in Psychological Science, 8(3), 76-79. Helms, J. E., Henze, K. T., Sass, T. L., & Mifsud, V. A. (2006). Treating
Cronbach's alpha reliability coefficients as data in counseling research. US: Sage Publications. doi:10.1177/0011000006288308
Helmstadter, G. C. (1964). Principles of psychological measurement. New York:
Appleton-Century-Crofts. Hendricks, A. A. J., Hofstee, W. K. B., & De Raad, B. (1999). The Five Factor
Personality Inventory (FFPI). Personality and Individual Differences, 27, 307-325. doi:10.1016/S0191-8869(98)00245-1
Hendriks, A. A. J., Kuyper, H, Offringa, G. J., & Van der Werf, M. P. C. (2008).
Assessing young adolescents’ personality with the Five-Factor Personality Inventory. Assessment, 15, 304-316. doi:10.1177/1073191107313761
Hinshaw, S. P., & Lee, S. S. (2003). Conduct and oppositional defiant disorders.
In E. J. March, & R. A. Barkely (Eds.), Child Psychopathology (2nd ed., pp. 144-198). New York, NY: The Guilford Press.
Hofstee, W. K. B., Kiers, H. A. L., De Raad, B., Goldberg, L. R., & Ostendorf, F.
(1997). A Comparison of Big-Five structures of personality traits in Dutch, English, and German. European Journal of Personality, 11, 15-31. doi:10.1002/(SICI)1099-0984(199703)11:1<15::AID-PER273>3.0.CO;2-8

87
Horn, J. (1965). A rationale and test for the number of factors in factor analysis.
Psychometrika, 30, 179-185. Howell, K. W., & Nolet, V. (2000). Curriculum-Based evaluation: Teaching and
decision making. (3rd ed.). Belmont, CA: Wadsworth Ialongo, N., Edelsohn, G., Werthamer-Larsson, L., Crocket, L., & Kellam, S.
(1995). Effects of reward and response costs on inhibition in ADHD children. Journal of Abnormal Psychology, 104, 232-240.
Ingram, R. E., & Price, J. M. (2001). The role of vulnerability in understanding
psychopathology. In R. E. Ingram, & J. M. Price (Eds.), Vulnerability to psychopathology: Risk across the lifespan. New York, NY: Guilford Press. Retrieved from http://login.ezproxy1.lib.asu.edu/login?url=http://search.proquest.com/docview/619666159?accountid=4485
John, O. P. (1989). Towards a taxonomy of personality descriptors. In D. M. Buss
and N. Cantor (Eds.), Personality psychology: Recent trends and emerging directions (pp. 261-271). New York, NY: Guilford Press.
John, O. P., Naumann, L. P., & Soto, C. J. (2008). Paradigm shift to the
integrative big-five trait taxonomy: History, measurement, and conceptual issues. In O. P. John, R. W. Robins, & L. A. Pervin (Eds.). Handbook of personality: Theory and research (pp. 114-158). New York, NY: Guilford Press. Retrieved from http://www.ocf.berkeley.edu/~johnlab/pdfs/2008chapter.pdf
John, O. P., & Robins, R. W. (1993). Accuracy and bias in self-perception:
Individual differences in self-enhancement and the role of narcissism. Journal of Personality and Social Psychology, 66, 206-219. doi:10.1037/0022-3514.66.1.206
John, O. P., Caspi, A., Robins, R. W., Moffitt, T. E., & Stouthamer-Loeber, M.
(1994). The “little five”: Exploring the nomological network of the five-factor model of personality in adolescent boys. Child Development, 65, 160-178. doi:10.2307/1131373
John, O. P., & Srivastava, S. (1999). The Big-Five trait taxonomy: History,
measurement, and theoretical perspectives. Handbook of personality: Theory and research (2nd ed.). New York, NY: Guilford Press.
Kagan, J. (1994).Galen’s prophecy: Temperament in human nature. New York.
NY: Basic Books. Kaiser, H. F. (1974). An index of factorial simplicity. Psychometrika, 39(1), 31-36. Kamphaus, R. W., & Frick, P. J. (2005). Clinical assessment of child and
adolescent personality and behavior (2nd ed.). New York, NY: Springer.

88
Kappe, R., & van der Flier, H. (2009). Using multiple and specific criteria to
assess the predictive validity of the Big Five personality factors on academic performance. Journal of Research in Personality, 44, 142-145. doi:10.1016/j.jrp.2009.11.002
Kendler, K. S., Neale, M. C., Kessler, R. C., Heath, A. C., & Eaves, L. J. (1993).
A longitudinal twin study of personality and major depression in women. Archives of General Psychiatry, 50(11), 853-862.
Klages, L. (1926). The Science of character (Translated 1932). London, England:
Allen and Unwin. Kleinmuntz, B. (1967). Sign and seer: Another example. Journal of Abnormal
Psychology, 72, 163-165. doi:10.1037/h0024433 Loeber, R., Green, S. M., Lahey, B. B., & Stouthamer-Loeber, M. (1991).
Differences and similarities between children, mothers, and teachers as informants on disruptive child behavior. Journal of Abnormal Child Psychology, 19, 75-95. doi:10.1007/BF00910566
Lubinski, D. (2000). Scientific and social significance of assessing individual
differences: “Sinking shafts at a few critical points”. Annual Review of Psychology, 51, 405-444. doi:10.1146/annurev.psych.51.1.405
Markey, P. M., Markey, C. N., Tinsley, B. J., & Ericksen, A. J. (2002). A
preliminary validation of preadolescents self-reports using the five-factor model of personality. Journal of Research in Personality, 36, 173-181. doi:10.1006/jrpe.2001.2341
Mash, E. J., & Barkley, R. A. (2003). Child Psychopathology (2nd ed.). New York,
NY: The Guilford Press. Masten, A. S., & Coatsworth, J. D. (1998). The development of competence in
favorable and unfavorable environments: Lessons from research on successful children. American Psychologist, 53, 205-220. doi: 10.1037/0003-066X.53.2.205
McCrae, R. R. (2001). Trait psychology and culture: Exploring intercultural
comparisons. Journal of Personality, 69, 819-846. doi:10.1111/1467-6494.696166
McCrae, R. R., & Costa, P. T., Jr. (1987). Validation of the five-factor model of
personality across instruments and observers. Journal of Personality and Social Psychology, 52, 81-90. doi:10.1037/0022-3514.52.1.81
McCrae, R. R., & Costa, P. T., Jr. (1996). Toward a new generation of
personality theories: Theoretical contexts for the five-factor model. In J. S. Wiggins (Ed.), The Five factor model of personality. Theoretical perspectives (pp. 139-153). New York, NY: Guilford.

89
McCrae, R. R., & Costa, P. T., Jr., (1997). Personality trait structure as a human
universal. American Psychologist, 52, 509-516. doi:10.1037/0003-066X.52.5.509
McCrae, R. R., & Costa, P. T., Jr. (1999). A five-factor theory of personality. In L.
A. Pervin & O. P. John (Eds.), Handbook of personality: Theory and Research (pp. 139-153). New York, NY: Guilford.
McCrae, R. R., Costa, P. T., Jr., & Martin, T. A. (2005). The NEO-PI-3: A more
readable Revised NEO Personality Inventory. Journal of Personality Assessment, 84, 261-270. doi:10.1207/s15327752jpa8403_05
McCrae, R. R., Martin, T. A., & Costa, P. T., Jr. (2005). Age trends and age
norms for the NEO Personality Inventory-3 in adolescents and adults. Assessment, 12, 363-373. doi:10.1177/1073191105279724
McDermott, P. A., Goldberg, M. M., Watkins, M. W., Stanley, J. L., & Glutting, J.
J. (2007). A Nationwide epidemiologic modeling study of LD: Risk, protection, and unintended impact. Journal of Learning Disabilities, 3, 230-251. doi:10.1177/00222194060390030401
McGhee, R. L., Ehrler, D. J., & Buckhalt, J. A. (2007, March). Personality
assessment in schools: Absent without excuse. Paper presented at the annual meeting of National Association of School Psychologists, New York, NY.
McGhee, R. L., Ehrler, D. J., & Buckhalt, J. A. (2007). Test Review of the Five
Factor Personality Inventory-Children. Austin, TX: Pro-Ed. doi:10.1177/0734282907312830
Merrell, K. W. (2008). Behavioral, social, and emotional assessment of children
and adolescents. (3rd ed.). New York, NY: Lawrence Erlbaum. Merveilde, I., & De Fruyt, F. (1999). Construction of the Hierarchical Personality
Inventory for Children (HiPIC). In I. Merveilde, I. Deary, F. De Fruyt, & F. Ostendorf (Eds.), Personality psychology in Europe: Proceedings of the Eighth European Conference on Personality Psychology (pp. 107-127). Netherlands: Tilburg University Press.
Meyers, L. S., Gamst, G., & Guarino, A. J. (2006). Applied multivariate research:
Design and interpretation. Thousand Oaks, CA: Sage. Muris, P., Meesters, C., & Diederen, R. (2005). Psychometric properties of the
Big Five Questionnaire for Children (BFQ-C) in a Dutch sample of young adolescents. Personality and Individual Differences, 38, 1757-1769. doi:10.1016/j.paid.2004.11.018
Musgrave-Marquart, D., Bromley, S. P., & Dalley, M. B. (1997). Personality,
academic attrition, and substance abuse as predictors of academic

90
achievement in college students. Journal of Social Behavior & Personality, 12, 501-511.
Naglieri, J. A., & Bornstein, B. T. (2003). Intelligence and achievement: Just how
correlated are they? Journal of Psychoeducational Assessment, 21, 244-260. doi:10.1177/073428290302100302
Neisser, U., Boodoo, G., Bouchard, T. J., Jr., Boykin, A. W., Brody, N., Ceci, S.
J., … Urbina, A. (1996). Intelligence: Knowns and unknowns. American Psychologist, 51, 77-101. doi:10.1037/0003-066X.51.2.77
Newman, D. A. (2003). Longitudinal modeling with randomly and systematically
missing data: A simulation of Ad Hoc, Maximum Likelihood, and Multiple Imputation Techniques. Organizational Research Methods, 6(3), 332-338.
Nigg, J. T., Blaskey, L. G., Huang-Pollack, C. L., Hinshaw, S. P., John, O. P.,
Willcutt, E. G., & Pennington, B. (2002). Big five dimensions and ADHD symptoms: Links between personality traits and clinical symptoms. Journal of Personality and Social Psychology, 83 451-469. doi:10.1037//0022-3514.83.2.451
Noftle, E. E., & Robins, R. W. (2007). Personality predictors of academic
outcomes: Big Five correlates of GPA and SAT scores. Journal of Personality and Social Psychology, 93, 116-130. doi:10.1037/0322-3514.93.1.116
Norman, W. T. (1963). Toward an adequate taxonomy of
personality attributes: Replicated factor structure in peer nomination personality ratings. Journal of Abnormal and Social Psychology, 66, 574-583. doi:10.1037/h0040291
Norman, W. T. (1967). On estimating psychological relationships: Social
desirability and self-report. Psychological Bulletin, 67, 273-293. doi:10.1037/h0024414
Norman, G. R., & Streiner, D. L. (2000). Biostatistics: The bare essentials (2nd
ed.). Hamilton, Canada: Decker. Nowakowska, M. (1973). Basic concepts of the theory of psychological tests: A
non-formal description :I. Probleme und Ergebnisse der Psychologie, 44(May), 5-23.
Nunnally, J. C. (1978). Psychometric theory (2nd ed.). New York, NY:
McGraw-Hill.
O’Connor, B. P. (2000). SPSS and SAS programs for determining the number of components using parallel analysis and Velicer’s MAP test. Behavior Research Methods, Instruments & Computers, 32, 396-402.

91
Olweus, D. (1979). Stability of aggressive reaction patterns in males: A review. Psychological Bulletin, 86, 852-857.
Parker, W. D., & Stumpf, H. (1998). A validation of the five-factor model of
personality in academically talented youth across observers and instruments. Personality and Individual Differences, 25, 1005-1025. doi:10.1016/S0191-8869(98)00016-6
Paunonen, S. V., & Ashton, M. C., (2001). Big Five factors and facets and the
prediction of behavior. Journal of Personality and Social Psychology, 81, 524-539. doi:10.1037/0022-3514.81.3.524
Pervin, L., Cervone, D., & Oliver, J. (2005). HIS814: Theories of personality
material excerpted from personality theory and research. Hoboken, NJ: John Wiley & Sons.
Petrides, K. V., Chamorro-Premuzic, T., Frederickson, N., & Furnham, A. (2005).
Explaining individual differences in scholastic behavior and achievement. British Journal of Educational Psychology, 75, 239-255. doi:10.1348/000709904X24735
Pett, M. A., Lackey, N. R., & Sullivan, J. J. (2003). Making sense of factor
analysis: The use of factor analysis for instrument development in health care research. Thousand Oaks, CA: Sage.
Preacher, K. J., & MacCallum, R. C. (2003). Repairing Tom Swift’s electric factor
analysis machine. Understanding Statistics, 2, 13-43. doi:10.1207/S15328031US0201_02
Pop-Jordanova, N., & Gucev, Z. (2010). Game-based peripheral biofeedback for
stress assessment in children. Pediatrics International, 52, 428-431. doi:10.1111/j.1442-200X.2009.02978.x
Reynolds, C. R., & Kamphaus, R. W. (1992). Behavior assessment system for
children (BASC). Circle Pines, MN: American Guidance Services. Robins, R. W., John, O. P., & Caspi, A. (1994). Major dimensions of personality
in early adolescents: The big five and beyond. In C. F. Halverson, J. A. Kohnstamm, & R. P. Martin (Eds.). The developing structure of temperament and personality from infancy to adulthood (pp. 267-291). Hillsdale, NJ: Ehrlbaum.
Rubin, K. H., Coplan, R. J., Fox, N. A., & Calkins, S. D. (1995). Emotionality,
emotion regulation, and preschoolers’ social adaptation. Development and Psychopathology, 7, 49-62.
Saucier, G., & Goldberg, L. R. (2002). Assessing the Big Five: Applications of 10
psychometric criteria to the development of marker scales. In B. de Raad & M. Perugini (Eds.), Big five assessment (pp. 30-34). Seattle, WA: Hogrefe & Huber.

92
Schaefer, B. A., & McDermott, P. A. (1999). Learning behavior and intelligence
as explanations for children’s scholastic achievement. Journal of School Psychology, 37, 299-313. doi:10.1016/S0022-4405(99)00007-2
Shiner, L. R. (1998). How shall we speak of children’s personalities in middle
childhood? A preliminary taxonomy. Psychological Bulletin, 124, 308-332. doi:10.1016/S0022-4405(99)00007-2
Shiner, R. L. (2000). Linking childhood personality with adaptation: Evidence for
continuity and change across time into late adolescence. Journal of Personality and Social Psychology, 78, 310-325. doi:10.1037/0022-3514.78.2.310
Shiner, R. L., & Caspi, A. (2003). Personality differences in childhood and
adolescence: Measurement, development, and consequences. Journal of Child Psychology & Psychiatry, 44, 2-32. doi:10.1111/1469-7610.00101
Shiner, R. L., & Masten, A. S. (2002). Transactional links between personality
and adaptation from childhood through adulthood. Journal of Research in Personality, 36, 580-588. doi:10.1016/S0092-6566(02)00508-1
Snyder, T. D., Dillow, S. A., & Hoffman, C. M. (2007). Digest of Education
Statistics 2006 (NCES 2007-017). National Center for Education Statistics, Institute of Education Sciences, U.S. Department of Education. Washington, DC: U.S. Government.
Srivastava, S. (2008). Measuring the Big Five personality factors. Retrieved from
http://www.uoregon.edu/~sanjay/bigfive.html Stevens, J. P. (2001). Applied multivariate statistics for the social sciences (4th
ed.). Mahwah, NJ: Lawrence Erlbaum. Tabachnick, B. G., & Fidell, L. S. (2001). Using multivariate statistics (4th ed.).
Boston, MA: Allyn & Bacon. Tabachnick, B. G., & Fidell, L. S. (2007). Using multivariate statistics (5th ed.).
Boston, MA: Allyn and Bacon/ Pearson Education. Tinsley, H. E. A., & Tinsley, D. J. (1987). Uses of factor analysis in counseling
psychology research. Journal of Counseling Psychology, 34, 414-424. doi:10.1037/0022-0167.34.4.414
Thurstone, L. L. (1947). Multiple factor analysis. Chicago, IL: University of
Chicago. Tupes, E. C., & Christal, R. E. (1961). Recurrent personality factors based
on trait ratings (USAF ASD Tec. Rep. No. 61-97). Lackland Air Force Base, TX: U.S. Air Force.

93
Van Lieshout, C. F., & Haselger, G. J. T. (1994). The Big Five personality factors in Q-sort descriptions of children and adolescents. In C. F. Halverson, G. A. Kohnstamm, & R. P. Martin (Eds.), The developing structure of temperament and personality from infancy to childhood (pp. 293-318). Hillsdale, NJ: Erlbaum.
Velicer, W. F. (1976). Determining the number of components from the matrix of
partial correlations. Psychometrika, 41, 321-327. doi:10.1007/BF02293557
Velicer, W. F., & Fava, J. L. (1998). Affects of variable and subject sampling on
factor pattern recovery. Psychological Methods, 3, 231-251. doi:10.1037/1082-989X.3.2.231
Watkins, M. W., Lei, P. W., & Canivez, G. L. (2007). Psychometric intelligence
and achievement: A cross-lagged panel analysis. Intelligence, 35, 59-68. doi:10.1016/j.intell.2006.04.005
Warner , M. B. (2007). Personality traits, traitedness, and disorders: Towards an
enhanced understanding of trait-disorder relationships Retrieved from http://login.ezproxy1.lib.asu.edu/login?url=http://search.proquest.com/?url=http://search.proquest.com/docview/622015442?accountid=4485
Werry, J. S. (2001). Pharmacological treatments of autism, attention deficit
hyperactivity disorder, oppositional defiant disorder, and depression in children and youth: Commentary. Journal of Clinical Child Psychology, 30, 110-113.
Wombles, K. A. (2008). The relationship of personality traits, explanatory style,
religious coping methods, and spiritual well-being to adaptive coping and satisfaction with life among persons with chronic pain. (Unpublished master’s thesis). Walden University, Texas.
Worthington, R. L., & Whitaker, T. A. (2006). Scale development research: A
content analysis and recommendations for best practices. Counseling Psychologist, 34, 806-838. doi:10.1177/0011000006288127
Yen, C. J., Konold, T. R., & McDermott, P. A. (2004). Does learning behavior
augment cognitive ability as an indicator of academic achievement? Journal of School Psychology, 42, 157-169. doi:10.1016/j.jsp.2003.12.001
Zyphur, M. J., Islam, G., & Landis, R. S. (2007). Testing 1, 2, 3,…4? The
personality of repeat SAT test takers and their testing outcomes. Journal of Research in Personality, 41, 715-722. doi:10.1016/j.jrp.2006.06.005

94
APPENDIX A
BIG FIVE QUESTIONNAIRE-CHILDREN
BARBARANELLI, CAPRARA, RABASCA, & PASTORELLI (2003)

95
1. I like to spend time with other people.
2. I share my things with other people.
3. I do my work carefully.
4. I get nervous for silly things.
5. I know a lot of things.
6. I am in a bad mood.
7. I enjoy working hard.
8. I get into heated arguments with others.
9. I like to compete with others.
10. I daydream a lot.
11. I am honest and kind with others.
12. It is easy for me to learn what is taught at school.
13. I know when others need my help.
14. I like to be active.
15. I get angry easily.
16. I like to give gifts.
17. I argue with others.
18. When the teacher asks questions I am able to give the correct answer.
19. I like to be around others.
20. I get very involved in the things I do and I do them to the best of my
ability.
21. If someone does something to hurt me, I forgive him/her.
22. I concentrate on my work in class.
23. It is easy for me to tell others what I think.

96
24. I like to read books.
25. When I finish my homework, I check it many times to make sure I did it
correctly.
26. I say what I think.
27. I am nice to all of my classmates.
28. I respect and follow the rules.
29. My feelings get hurt easily.
30. When the teacher explains something I understand immediately.
31. I am sad.
32. I treat others with kindness.
33. I like scientific TV shows.
34. If I make an appointment I keep it.
35. I find things to do so that I will not get bored.
36. I like to watch news on TV, and to know what happens in the world.
37. My room is neat and organized.
38. I am polite when I talk to others.
39. If I want to do something, I cannot wait and I have to be able to do it
immediately.
40. I like to talk with others.
41. I am not patient.
42. I am able to convince other people to agree with what I think.
43. I am able to make up new games and things to do.
44. When I start to do something I have to finish it no matter what.
45. If a classmate is having trouble I help him/her.
46. I am able to solve mathematical problems.

97
47. I trust others.
48. I like to keep all my school things neat and organized.
49. I lose my calm easily.
50. When I say something, others listen to me and do what I say.
51. I treat even the people I dislike with kindness.
52. I like to learn new things.
53. I always finish my homework before I play.
54. I get irritated when things are difficult for me.
55. I like to joke around.
56. I almost never move my attention away from what I am doing.
57. I make friends easily.
58. I cry.
59. I would like very much to travel and learn about other countries.
60. I think other people are good and honest.
61. I worry about silly things.
62. I understand things immediately.
63. I am happy and active.
64. I let other people use my things.
65. I take care of my responsibilities.

98
APPENDIX B
THE COMPONENTS OF THE BFQ-C AS FOUND IN AN ITALIAN SAMPLE OF
ADOLESCENTS
(BARBARANELLI ET AL., 2003)

99
Energy/ Extraversion: 1. I like to meet with other people.
9. I like to compete with others.
14. I like to move and to do a great deal of activity.
19. I like to be with others.
23. I can easily say to others what I think.
26. I say what I think.
35. I do something not to get bored.
40. I like to talk with others.
42. I am able to convince someone of what I think.
50. When I speak, the others listen to me and do what I say.
55. I like to joke.
57. I easily make friends.
63. I am happy and lively.
Agreeableness:
2. I share my things with other people.
11. I behave correctly and honestly with others.
13. I understand when others need my help.
16. I like to give gifts.
21. If someone commits an injustice to me, I forgive him/her.
27. I treat my peers with affection.
32. I behave with others with great kindness.
38. I am polite when I talk with others.
45. If a classmate has some difficulty, I help her/him.
47. I trust in others.

100
51. I treat kindly also persons who I dislike.
60. I think other people are good and honest.
64. I let other people use my things.
Conscientiousness:
3. I do my job without carelessness and inattention.
7. I work hard and with pleasure.
20. I engage myself in the things I do.
22. During class-time I am concentrated on the things I do.
25. When I finish my homework, I check it many times to make sure I did
it correctly.
28. I respect the rules and the order.
34. If I take an engagement I keep it.
37. My room is in order.
44. When I start to do something I have to finish it at all costs.
48. I like to keep all my school things in a great order.
53. I play only when I finished my homework.
56. It is unlikely that I divert my attention.
65. I do my own duty.
Emotional Instability:
4. I get nervous for silly things.
6. I am in a bad mood.
8. I argue with others with excitement.
15. I easily get angry.
17. I quarrel with others.
29. I easily get offended.

101
31. I am sad.
39. If I want to do something, I cannot wait and I have to be able to do it immediately.
41. I am not patient.
49. I easily lose my calm.
54. I do things with agitation.
58. I weep.
61. I worry about silly things.
Intellect/ Openness:
5. I know many things.
10. I have a great deal of fantasy.
12. I easily learn what I study at school.
18. When the teacher asks questions I am able to answer correctly.
24. I like to read books.
30. When the teacher explains something I understand immediately.
33. I like scientific TV shows.
36. I like to watch the TV news, and to know what happens in the world.
43. I am able to create new games and entertainments.
46. I am able to solve mathematics problems.
52. I like to know and learn new things.
59. I would like very much to travel and learn about other countries.
62. I understand immediately.

102
APPENDIX C
THE COMPONENTS OF THE BFQ-C AS FOUND IN AN AMERICAN SAMPLE OF
ADOLESCENTS

103
Agreeableness:
32. I treat others with kindness.
27. I am nice to all of my classmates.
11. I am honest and kind with others.
60. I think other people are good and honest.
51. I treat even the people I dislike with kindness.
38. I am polite when I talk to others.
28. I respect and follow the rules.
47. I trust others.
45. If a classmate is having trouble I help him/her.
64. I let other people use my things.
21. If someone does something to hurt me, I forgive him/her.
20. I get very involved in the things I do and I do them to the best of my ability.
02. I share my things with other people.
16. I like to give gifts.
34. If I make an appointment I keep it.
Energy/Extraversion:
57. I make friends easily.
23. It is easy for me to tell others what I think.
26. I say what I think.
40. I like to talk with others.
19. I like to be around others.
42. I am able to convince other people to agree with what I think.
55. I like to joke around.
01. I like to spend time with other people.

104
50. When I say something, others listen to me and do what I say.
63. I am happy and active.
13. I know when others need my help.
10. I daydream a lot.
Neuroticism/Emotional Instability:
15. I get angry easily.
49. I lose my calm easily.
17. I argue with others.
06. I am in a bad mood.
08. I get into heated arguments with others.
54. I get irritated when things are difficult for me.
31. I am sad.
41. I am not patient.
Intellect/Openness:
30. When the teacher explains something I understand immediately.
62. I understand things immediately.
12. It is easy for me to learn what is taught at school.
46. I am able to solve mathematical problems.
18. When the teacher asks questions I am able to give the correct answer.
05. I know a lot of things.
33. I like scientific TV shows.
43. I am able to make up new games and things to do.
Neuroticism/ Emotional Instability:
61. I worry about silly things.
04. I get nervous for silly things.

105
29. My feelings get hurt easily.
14. I like to be active.
58. I cry.
09. I like to compete with others.
Conscientiousness:
48. I like to keep all my school things neat and organized.
25. When I finish my homework, I check it many times to make sure I did it correctly.
37. My room is neat and organized.
07. I enjoy working hard.
03. I do my work carefully.
36. I like to watch news on TV, and to know what happens in the world.
56. I almost never move my attention away from what I am doing.
52. I like to learn new things.
65. I take care of my responsibilities.
53. I always finish my homework before I play.
59. I would like very much to travel and learn about other countries.

106
APPENDIX D
IRB APPROVAL

107
