psychology of perception - psych.colorado.edupsych.colorado.edu/~lharvey/p4165...
TRANSCRIPT

Psychology of Perception
Psychology 4165, Section 581
Continuing Education Online Class Spring 2016
Lewis O. Harvey, Jr. – Instructor Steven M. Parker–Teaching Assistant
Thatcher Illusion (Thompson, 1980)

Psychology of Perception Lewis O. Harvey, Jr.–Instructor Psychology 4165-581 Online Steven M. Parker–Teaching Assistant Spring 2016
Page 2/13 16.Mar.2016
This Page Blank (except, of course, for these words and the header and the footer, so I guess that it’s not really a blank page at all)

Psychology of Perception Lewis O. Harvey, Jr.–Instructor Psychology 4165-581 Online Steven M. Parker–Teaching Assistant Spring 2016
Page 3/13 16.Mar.2016
Syllabus Topics and Reading Assignments
1 11 Jan No Class 1 13 Jan No Class 1 15 Jan No Class 2 19 Jan Introduction (Note: Tuesday) 2 20 Jan Psychophysics (W 1) 2 22 Jan Psychophysics •1 (W 1) 3 25 Jan Vision (W 2) 3 27 Jan Vision (W 2) 3 29 Jan Vision •2 (W 2) 4 1 Feb Spatial Vision (W 3) 4 3 Feb Spatial Vision (W 3) 4 5 Feb Spatial Vision •Q1 (W 3) 5 8 Feb Object Perception (W 4) 5 10 Feb Object Perception (W 4) 5 12 Feb Object Perception •3 (W 4) 6 15 Feb Color Vision (W 5) 6 17 Feb Color Vision (W 5) 6 19 Feb Color Vision •4 (W 5) 7 22 Feb Space Perception (W 6) 7 24 Feb Space Perception (W 6) 7 26 Feb Space Perception •Q2 (W 6) 8 29 Feb Attention (W 7) 8 2 Mar Attention (W 7) 8 4 Mar Attention •5 (W 7)
9 7 Mar Motion (W 8) 9 9 Mar Motion (W 8) 9 11 Mar Motion •6 (W 8) 10 14 Mar Hearing (W 9) 10 16 Mar Hearing (W 9) 10 18 Mar Hearing •Q3 (W 9) 11 21 Mar Spring Break 11 23 Mar Spring Break 11 25 Mar Spring Break 12 28 Mar Audition (W 10) 12 30 Mar Audition (W 10) 12 1 Apr Audition •7 (W 10) 13 4 Apr Music & Speech (W 11) 13 6 Apr Music & Speech (W 11) 13 8 Apr Music & Speech •8 (W 11) 14 11 Apr Vestibular (W 12) 14 13 Apr Vestibular (W 12) 14 15 Apr Vestibular •Q4 (W 12) 15 18 Apr Touch (W 13) 15 20 Apr Touch (W 13) 15 22 Apr Touch (W 13) 16 25 Apr Taste & Smell (W 14 & 15) 16 27 Apr Taste & Smell (W 14 & 15) 16 29 Apr Taste & Smell •Q5 (W 14 & 15)
Textbook for the Course
Wolfe, J. M., Kluender, K. R., Levi, D. M., Bartoshuk, L. M., Herz, R. S., Klatzky, R. L., . . .
Merfeld, D. M. (2015). Sensation and Perception. Sunderland, Massachusetts: Sinauer Associates, Inc.
Note: The numbers in parentheses above refer to chapters in the Wolfe (W) text. Please read
the indicated chapter before the class meeting. The bulleted numbers indicate homework assignments and the bulleted Qs indicate quizzes.

Psychology of Perception Lewis O. Harvey, Jr.–Instructor Psychology 4165-Online Steven M. Parker–Teaching Assistant Spring 2016
Page 4/13 16.Mar.2016
Office Hours Name Lewis O. Harvey, Jr. Steven M. Parker Office MUEN D251b MUEN D352A Hours Telephone 303-492-8882 email [email protected] [email protected] web http://psych.colorado.edu/~lharvey/
Psychology of Perception Lewis O. Harvey, Jr.–Instructor Psychology 4165-Online Steven M. Parker–Teaching Assistant Spring 2016
Page 5/13 16.Mar.2016
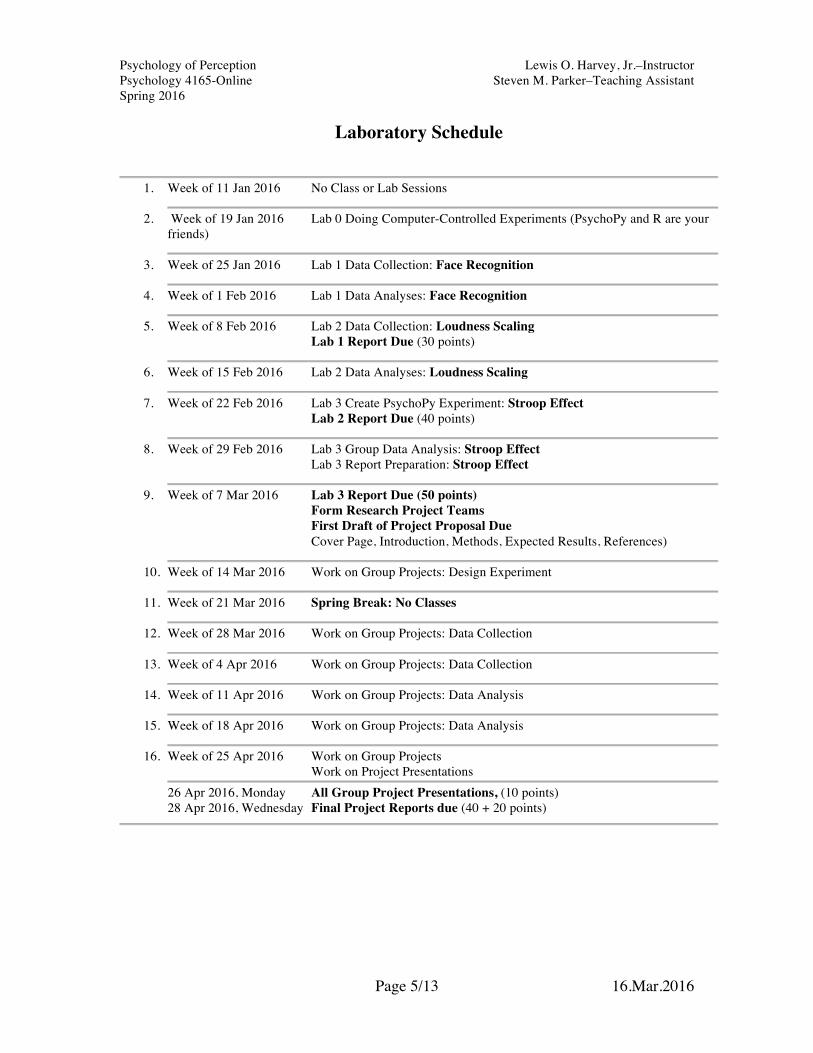
Laboratory Schedule
1. Week of 11 Jan 2016 No Class or Lab Sessions
2. Week of 19 Jan 2016 Lab 0 Doing Computer-Controlled Experiments (PsychoPy and R are your
friends)
3. Week of 25 Jan 2016 Lab 1 Data Collection: Face Recognition
4. Week of 1 Feb 2016 Lab 1 Data Analyses: Face Recognition
5. Week of 8 Feb 2016 Lab 2 Data Collection: Loudness Scaling Lab 1 Report Due (30 points)
6. Week of 15 Feb 2016 Lab 2 Data Analyses: Loudness Scaling
7. Week of 22 Feb 2016 Lab 3 Create PsychoPy Experiment: Stroop Effect
Lab 2 Report Due (40 points)
8. Week of 29 Feb 2016 Lab 3 Group Data Analysis: Stroop Effect Lab 3 Report Preparation: Stroop Effect
9. Week of 7 Mar 2016 Lab 3 Report Due (50 points)
Form Research Project Teams First Draft of Project Proposal Due Cover Page, Introduction, Methods, Expected Results, References)
10. Week of 14 Mar 2016 Work on Group Projects: Design Experiment
11. Week of 21 Mar 2016 Spring Break: No Classes
12. Week of 28 Mar 2016 Work on Group Projects: Data Collection
13. Week of 4 Apr 2016 Work on Group Projects: Data Collection
14. Week of 11 Apr 2016 Work on Group Projects: Data Analysis
15. Week of 18 Apr 2016 Work on Group Projects: Data Analysis
16. Week of 25 Apr 2016 Work on Group Projects
Work on Project Presentations 26 Apr 2016, Monday All Group Project Presentations, (10 points) 28 Apr 2016, Wednesday Final Project Reports due (40 + 20 points)

Psychology of Perception Lewis O. Harvey, Jr.–Instructor Psychology 4165-Online Steven M. Parker–Teaching Assistant Spring 2016
Page 6/13 16.Mar.2016
Original Articles
1. 11 Jan 2016 No Assignment
2. 18 Jan 2016 (Swets, 1961)
3. 25 Jan 2016 (Schiller, 2010)
4. 1 Feb 2016 (Schiller & Carvey, 2005)
5. 8 Feb 2016 (Owens, Antonoff, & Francis, 1994)
6. 15 Feb 2016 (Jacobs & Nathans, 2009)
7. 22 Feb 2016 (Kaufman & Rock, 1962)
8. 29 Feb 2016 (Most & Astur, 2007; Most, Scholl, Clifford, & Simons, 2005)
9. 7 Mar 2016 (Nuthmann, 2014; Psalta, Young, Thompson, & Andrews, 2014)
10. 14 Mar 2016 (Plomp, 1964)
11. 22 Mar 2016 Spring Break Week
12. 28 Mar 2016 (Plomp & Levelt, 1965)
13. 4 Apr 2016 (Poeppel, Emmorey, Hickok, & Pylkkänen, 2012)
14. 11 Apr 2016 (Held, 1965)
15. 18 Apr 2016 (Guterstam, Petkova, & Ehrsson, 2011; Slater, Spanlang, Sanchez-Vives, & Blanke, 2010)
16. 25 Apr 2016 (Gelstein et al., 2011; Savic, Berglund, Gulyas, & Roland, 2001)
Copies of these papers are available to download for reading through D2L using your CU IdentiKey ID. See the
reference section at the end of the syllabus for complete citation information.

Psychology of Perception Lewis O. Harvey, Jr.–Instructor Psychology 4165-Online Steven M. Parker–Teaching Assistant Spring 2016
Page 7/13 16.Mar.2016
Conditions Under Which The Course Operates Lecture: There will be five exams given during the semester on the Firdays indicated by Q on the syllabus. There will be eight homework assignments. Each homework will be handed out on a Friday (marked by bullets on the syllabus) and will be due the following week on Friday. Original Articles Reading: There are 19 original journal papers that are assigned as part of the course. These papers will form the basis of a 10 page paper about experimental design and drawing conclusions from data that you will write. This paper will be due on Monday, 28 March 2016, and is worth 50 points. Laboratory: The laboratory is not optional in PSYC 4165. There are four assignments in the laboratory. These assignments will be graded and the sum of the four grades will be your laboratory grade. All lab assignments must be written and printed with a computer word processor and all graphs must be prepared using computer graphics. We will use the open source statistical package R, which is powerful, free, and runs on Macintosh, Windows, and Linux computers. It is available for download at: https://www.r-project.org. The experiments in the laboratory part of the course are based on PsychoPy, a free, open source system for designing and running psychological experiments. It is especially designed for creating and presenting visual and auditory stimuli and collection responses with a timing precision of about 16 msec. It may be downloaded for your Macintosh, Windows or Linux computer at: http://www.psychopy.org Grading: Your final grade is computed from your exam scores, homework grades, and the laboratory grade. The total possible points in the course is 850:
Your final letter grade in the course will be assigned in the following manner. First a "Reference Score" will be calculated by taking the mean of the top five percent of the class. Your grade will be determined by how well you have done in comparison to this reference score:
A >96.6%, A- >93.3% of the reference score B+ >90.0%, B >86.6%, B- >83.3% of the reference score C+ >80.0%, C >76.6%, C- >73.3% of the reference score D+ >70.0%, D >66.6%, D- >63.3% of the reference score F <63.3%
It is therefore possible for the entire class to receive the grade of A. By the same token, it is also possible that very few people would receive an A, depending on the spread of grades across the class.
500 Five Quizzes 200 Laboratory Grade 80 Eight Homeworks 50 Analytic Paper (29 April 2016) 20 Participation
----- 850 Total Possible Points

Psychology of Perception Lewis O. Harvey, Jr.–Instructor Psychology 4165-Online Steven M. Parker–Teaching Assistant Spring 2016
Page 8/13 16.Mar.2016
Comments About The Psychology Of Perception Why Take This Course? There are three reasons to take this course:
1. To gain an understanding of the capabilities and limitations of our perceptual experiences;
2. To sharpen your ability to critically evaluate the results of experiments in light of theories of perception;
3. To gain practical skills in the use of computers for designing experiments, for analyzing and graphing data, and for preparing written laboratory reports.
The study of perception is the oldest part of modern psychology. It developed from trying to answer two questions posed by philosophers: “How do we know what we know?” and “Why do things appear the way they appear?” Since most of what we know about the outside world comes to us through our sensory systems, our sensory capabilities were the first to be studied extensively. Perceptions are derived from neural and psychological mechanisms that operate on sensory information. We will study the limits of our sensory and perceptual abilities and learn how to characterize the unreliability that results from these limits. Prerequisites: A broad understanding of the basic concepts from a general psychology course is assumed. You will be using methods of inferential statistics, such as those taught in Psychology 2101, to evaluate the results of your experiments. A facile ability with these methods in particular and with mathematical concepts through algebra and trigonometry are required. A familiarity with calculus is helpful but is not necessary. Please work through the eight questions on the next two pages. If you find these questions very difficult and you don’t even know how to find out how to answer them, you probably are not ready to take this course. You will learn modern statistical methods that go beyond the t-test and analysis of variance (ANOVA) that are common in introductory statistics courses. These modern methods include linear mixed models (of which ANOVA is one part) that can handle within- and between-subjects variables as well as fixed-effects and random-effects variables. You will learn how to measure effect size and confidence intervals using bootstrapping techniques as an alternative to the deprecated use of significance testing. You will learn how to carry out these analyses using the R statistical package, a powerful, open-source, and free software platform for Macintosh, Windows and Linux computers. You need to make a considerable commitment of time to do well in this class. For each credit hour of the course you should expect to spend 3 hours on class-related activities (studying, research, writing) per week. Since the class is a four-credit course, expect to spend 12 additional hours per week outside the class and laboratory.

Psychology of Perception Lewis O. Harvey, Jr.–Instructor Psychology 4165-Online Steven M. Parker–Teaching Assistant Spring 2016
Page 9/13 16.Mar.2016
Skills Needed for Psychology of Perception
Question 1: Rearrange the following linear equation to solve for b: y = a + bx b =
Question 2: Solve the following equation for X: y = log x( )
x =
Question 3: Compute the arithmetic mean and the standard deviation of this sample of numbers: 10.0, 9.0, 12.0, 11.0, 8.5, 13.0, 8.0, 10.0, 7.0, and 11.5:
µ =
σ =
Question 4: In an experiment you observe the number of times six different kinds of events occur. A theoretical model makes predictions about how often these events should occur. These data are presented in the table below. Compute the chi-square ( χ 2 ) statistic to test if the observed data are significantly different from the predicted data. You may assume n-1=5 degrees of freedom for the significance test.
E1 E2 E3 E4 E5 E6
Observed Data 174.0 172.0 104.0 92.0 41.0 8.0
Predicted Data 175.5 167.8 106.5 90.4 44.3 6.5 χ 2 =

Psychology of Perception Lewis O. Harvey, Jr.–Instructor Psychology 4165-Online Steven M. Parker–Teaching Assistant Spring 2016
Page 10/13 16.Mar.2016
Question 5: In an experiment with two levels of an independent variable you observe the following values of the dependent variable for 10 subjects (five were tested under level 1 and five under level 2). Compute the mean of each column and calculate a t-test (or ANOVA if you wish) to test the hypothesis that there is not a significant difference between the means of groups:
t df( ) =p =
Question 6: Convert the probability 0.8413447 to a quantile score based on the cumulative distribution function (CDF) of the unit normal Gaussian distribution (a quantile is a z-score). Such a transformation is achieved by the quantile function (q <- qnorm(p) in R, where p is the probability). What is the probability that a single sample drawn from a population having a Gaussian distribution with a mean of 0.0 and a standard deviation of 1.0 will have a value of 1.959964 or greater (use pnorm(q) in R)?
q =p =
Question 7: Using least-squares linear regression, compute the slope ( a ) and y-intercept (b ) of the straight line, y = a + bx , that best fits this set of data. In R you can use lm(y ~ 1 + x):
x 1.0 3.0 5.0 7.0 9.0
y 0.98 8.73 17.0 20.9 27.4
a =b =
Question 8: Plot the data in Question 7 on a graph using linear axes. The x-axis should have a range of 0.0 to 10.0 and the y-axis should range from 0.0 to 30. Use the plot() function in R.
Level 1 Level 2
Subject Dependent Subject Dependent
1 8.0 6 10.0
2 9.0 7 9.5
3 7.5 8 11.0
4 7.0 9 9.0
5 8.5 10 10.5
Mean Mean

Psychology of Perception Lewis O. Harvey, Jr.–Instructor Psychology 4165-Online Steven M. Parker–Teaching Assistant Spring 2016
Page 11/13 16.Mar.2016
Academic Integrity Policy A university’s intellectual reputation depends on maintaining the highest standards of intellectual honesty. Commitment to those standards is a responsibility of every student, faculty, and staff member on the University of Colorado at Boulder campus.
A university’s intellectual reputation depends on maintaining the highest standards of intellectual honesty. Commitment to those standards is a responsibility of every student, faculty, and staff member on the University of Colorado at Boulder campus.
Honor Code
A student-run Honor Code was instituted on the Boulder Campus in 2002. The intent of the Honor Code is to establish a community of trust where students do not plagiarize, cheat, or obtain unauthorized academic materials. An honor code council collaborates with the colleges and schools in addressing allegations and instances of academic dishonesty and in assisting to educate all members of the university community on academic integrity issues.
Breaches of academic honesty include cheating, plagiarism, and the unauthorized possession of examinations, papers, computer programs, as well as other class materials specifically released by the faculty.
A student accused of academic dishonesty will either accept the accusation made by a faculty member or request a hearing before a student panel, who will make a decision on the accusation of academic dishonesty. In addition to academic sanctions imposed by the faculty, students found guilty of academic dishonesty also face consequences from the honor code council ranging from attending a mandatory class in ethics to expulsion from the campus. More information about CU-Boulder’s Honor Code may be found at www.colorado.edu/academics/honorcode/Home.html.
The following terms are clarified for the benefit of all members of the university community.
Cheating
Cheating is defined as using unauthorized materials or receiving unauthorized assistance during an examination or other academic exercise. Examples of cheating include: copying the work of another student during an examination or other academic exercise (includes computer programming), or permitting another student to copy one’s work; taking an examination for another student or allowing another student to take one’s examination; possessing unauthorized notes, study sheets, examinations, or other materials during an examination or other academic exercise; collaborating with another student during an academic exercise without the instructor’s consent; and/or falsifying examination results.
Plagiarism
Plagiarism is defined as the use of another’s ideas or words without appropriate acknowledgment. Examples of plagiarism include: failing to use quotation marks when directly quoting from a source; failing to document distinctive ideas from a source; fabricating or inventing sources; and copying information from computer-based sources, i.e., the Internet.
Unauthorized Possession or Disposition of Academic Materials
Unauthorized possession or disposition of academic materials may include: selling or purchasing examinations, papers, reports or other academic work; taking another student’s academic work without permission; possessing examinations, papers, reports, or other assignments not released by an instructor; and/or submitting the same paper for multiple classes without advance instructor authorization and approval.
Reproduced from: http://www.colorado.edu/policies/academic-integrity-policy
Check out http://www.umuc.edu/writingcenter/plagiarism/ for explicit examples.

Psychology of Perception Lewis O. Harvey, Jr.–Instructor Psychology 4165-Online Steven M. Parker–Teaching Assistant Spring 2016
Page 12/13 16.Mar.2016
References Gelstein, S., Yeshurun, Y., Rozenkrantz, L., Shushan, S., Frumin, I., Roth, Y., & Sobel, N.
(2011). Human Tears Contain a Chemosignal. Science, 331(6014), 226-230.
Guterstam, A., Petkova, V. I., & Ehrsson, H. H. (2011). The Illusion of Owning a Third Arm. PLoS ONE, 6(2), e17208.
Held, R. M. (1965). Plasticity in sensory-motor systems. Scientific American, 213(5), 84–94. doi: doi:10.1038/scientificamerican1165-84
Jacobs, G. H., & Nathans, J. (2009). The evolution of primate color vision. Scientific American, 300(April), 53–63.
Kaufman, E. L., & Rock, I. (1962). The Moon Illusion. Scientific American, 207(1), 120–131. doi: doi:10.1038/scientificamerican0762-120
Most, S. B., & Astur, R. S. (2007). Feature-based attentional set as a cause of traffic accidents. Visual Cognition, 15(2), 125-132. doi: 10.1080/13506280600959316
Most, S. B., Scholl, B. J., Clifford, E. R., & Simons, D. J. (2005). What You See Is What You Set: Sustained Inattentional Blindness and the Capture of Awareness. Psychological Review, 112(1), 217-242.
Nuthmann, A. (2014). How do the regions of the visual field contribute to object search in real-world scenes? Evidence from eye movements. Journal of Experimental Psychology: Human Perception and Performance, 40(1), 342-360. doi: 10.1037/a0033854
Owens, D. A., Antonoff, R. J., & Francis, E. L. (1994). Biological motion and nighttime pedestrian conspicuity. Human Factors, 36(4), 718–732. doi: doi: 10.1177/001872089403600411
Plomp, R. (1964). The Ear as a Frequency Analyzer. The Journal of the Acoustical Society of America, 36(9), 1628-1636. doi: doi:http://dx.doi.org/10.1121/1.1919256
Plomp, R., & Levelt, W. J. M. (1965). Tonal consonance and critical bandwidth. Journal of the Acoustical Society of America, 38(4), 548–560.
Poeppel, D., Emmorey, K., Hickok, G., & Pylkkänen, L. (2012). Towards a new neurobiology of language. The Journal of neuroscience : the official journal of the Society for Neuroscience, 32(41), 14125-14131. doi: 10.1523/JNEUROSCI.3244-12.2012

Psychology of Perception Lewis O. Harvey, Jr.–Instructor Psychology 4165-Online Steven M. Parker–Teaching Assistant Spring 2016
Page 13/13 16.Mar.2016
Psalta, L., Young, A. W., Thompson, P., & Andrews, T. J. (2014). The Thatcher Illusion Reveals Orientation Dependence in Brain Regions Involved in Processing Facial Expressions. Psychological Science, 25(1), 128-136. doi: 10.1177/0956797613501521
Savic, I., Berglund, H., Gulyas, B., & Roland, P. (2001). Smelling of Odorous Sex Hormone-like Compounds Causes Sex-Differentiated Hypothalamic Activations in Humans. Neuron, 31(4), 661-668.
Schiller, P. H. (2010). Parallel information processing channels created in the retina. Proceedings of the National Academy of Sciences, 107(40), 17087-17094. doi: 10.1073/pnas.1011782107
Schiller, P. H., & Carvey, C. E. (2005). The Hermann grid illusion revisited. Perception, 34(11), 1375-1397.
Slater, M., Spanlang, B., Sanchez-Vives, M. V., & Blanke, O. (2010). First Person Experience of Body Transfer in Virtual Reality. PLoS ONE, 5(5), e10564.
Swets, J. A. (1961). Is there a sensory threshold? Science, 134(3473), 168–177.
Thompson, P. G. (1980). Margaret Thatcher: A new illusion. Perception, 9(4), 483–484.