pss and css long term cost report 2014 css... · web viewthe outcomes of this investigation are...
TRANSCRIPT

PSS AND CSS LONG TERMCOST REPORT 2014A report on the long term cost of the Public Sector Superannuation Scheme and Commonwealth Superannuation Scheme
Prepared by Mercer Consulting (Australia) Pty Ltd using data as at 30 June 2014
GOVERNANCE AND RESOURCE MANAGEMENT GROUP
PSS AND CSS LONG TERM COST REPORT 2014A report on the long term cost of the Public Sector Superannuation Scheme and Commonwealth Superannuation Scheme
Prepared by Mercer Consulting (Australia) Pty Ltd using data as at 30 June 2014

Contents
1. Executive Summary3
2. Scheme Information and Assets8
3. Membership and Data11
4. Assumptions15
5. Unfunded Liability24
6. Projected Outlays28
7. Notional Employer Contribution Rates32
8. Sensitivity Analysis34
Appendix A: Summary of Benefit Provisions 43
Appendix B: Detailed Assumptions 50
Appendix C: Actuary’s Certification 62
1. Executive Summary
1.1 We are pleased to present this Report on the actuarial investigation of the long term costs of the Public Sector Superannuation Scheme (PSS) and the Commonwealth Superannuation Scheme (CSS), prepared at the request of the Department of Finance. This Report has been carried out based on membership data as at 30 June 2014.
Previous PSS and CSS Long Term Cost Report1.2 The previous actuarial investigation into the long term costs of the PSS and
CSS was undertaken by Mercer Consulting (Australia) Pty Limited based on data as at 30 June 2011. The outcomes of this investigation are outlined in the PSS and CSS Long Term Cost Report 2011 (2011 Report) dated 14 April 2012.
Purpose of the Report1.3 This Report estimates the long term cost of providing superannuation benefits
to members of the PSS and the CSS. The scheme costs have been estimated in the following ways:
Unfunded Liability;
Projected Outlays; and
Notional Employer Contribution Rates.
Unfunded Liability 1.4 The Unfunded Liability as at 30 June 2014 for current contributors in respect
of service up to 30 June 2014, preserved members and pensioners has been calculated to be $109.8 billion. This represents an estimate of the present value of the superannuation liability less the fair value of scheme assets.
1.5 A breakdown of the Unfunded Liability by scheme and prior years’ estimates are outlined below:
Report as atAccrued Unfunded Liability ($ billions)
PSS CSS Combined
30 June 2002 9.1 49.3 58.4
30 June 2005 13.8 50.6 64.4
30 June 2008 20.9 59.2 80.1
30 June 2011 33.1 59.9 93.0
30 June 2014 46.9 62.9 109.8
Note: The prior year figures have not been adjusted to 2014 dollars
PSS and CSS Long Term Cost Report 2014 | 3
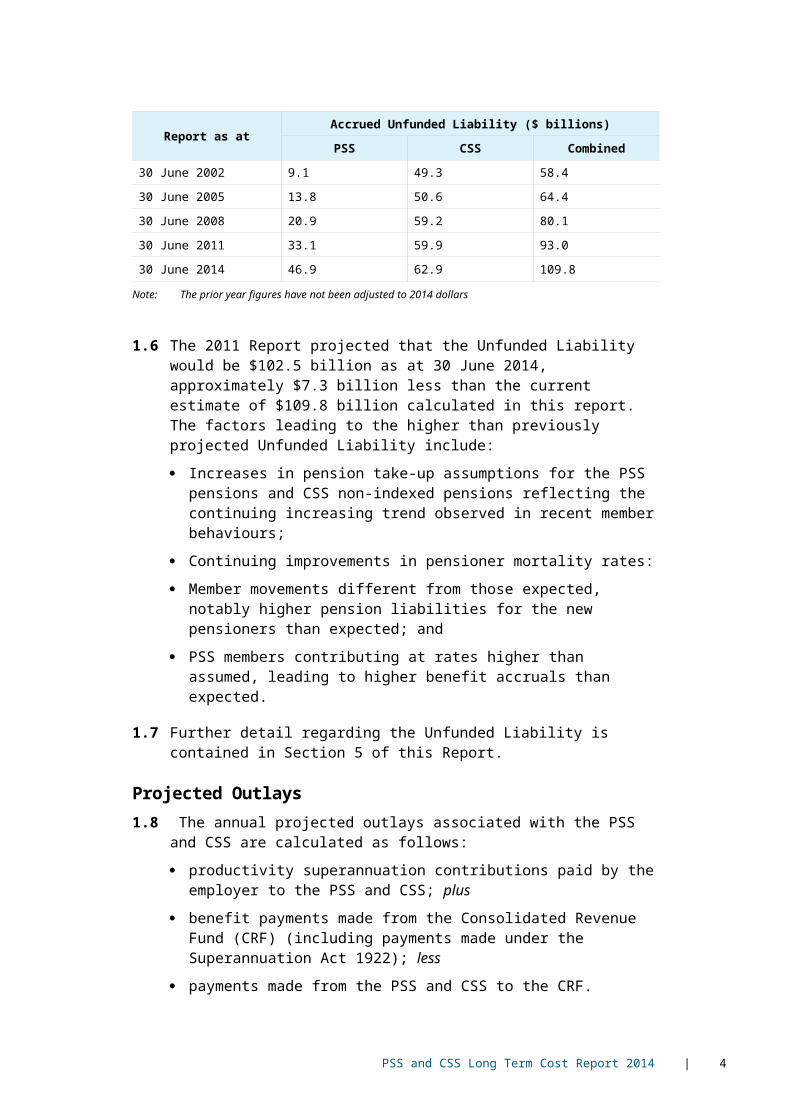
1.6 The 2011 Report projected that the Unfunded Liability would be $102.5 billion as at 30 June 2014, approximately $7.3 billion less than the current estimate of $109.8 billion calculated in this report. The factors leading to the higher than previously projected Unfunded Liability include:
Increases in pension take-up assumptions for the PSS pensions and CSS non-indexed pensions reflecting the continuing increasing trend observed in recent member behaviours;
Continuing improvements in pensioner mortality rates:
Member movements different from those expected, notably higher pension liabilities for the new pensioners than expected; and
PSS members contributing at rates higher than assumed, leading to higher benefit accruals than expected.
1.7 Further detail regarding the Unfunded Liability is contained in Section 5 of this Report.
Projected Outlays1.8 The annual projected outlays associated with the PSS and CSS are calculated
as follows:
productivity superannuation contributions paid by the employer to the PSS and CSS; plus
benefit payments made from the Consolidated Revenue Fund (CRF) (including payments made under the Superannuation Act 1922); less
payments made from the PSS and CSS to the CRF.
1.9 The projected outlays are expected to reduce as a percentage of projected Gross Domestic Product (GDP) from 0.28% in the year ending 30 June 2015 to 0.09% in the year ending 30 June 2054.
1.10 The projected outlays represent the total cost to the Australian Government of funding the PSS and CSS benefits to current and past employees and their dependants. As such the projected outlays are better representations of the expected future contributions required from the Australian Government. In comparison, the notional employer contribution rates relate to the cost of future benefit accrual for contributors only.
1.11 Further detail regarding the projected outlays is contained in Section 6 of this Report.
Notional Employer Contribution Rates1.12 The Notional Employer Contribution Rates (NECRs) represent the estimated
contribution rates that would be required to fund the benefits accruing to contributors over the next three years (from 1 July 2014 to 30 June 2017) based on current projections – that is, if the PSS and CSS schemes were fully funded at the valuation date and contributions were made at their respective NECRs, then the liability for contributors would be expected to be fully funded at the end of the period.
PSS and CSS Long Term Cost Report 2014 | 4
1.13 The NECRs disclosed in this Report are determined using long term assumptions as these rates are notional in nature. These assumptions may differ from current settings – for example the assumed 4 per cent salary growth rate is different to the Commonwealth Government’s stated intention to keep average annual wage rises across the public service to 1.5 per cent or less over the next three years, as outlined in the 2014-15 Mid-Year Economic and Fiscal Outlook.
1.14 The NECRs for the two schemes (including allowances for contributions towards the productivity superannuation benefit) are summarised in the following table:
Notional Employer Contribution Rates (% of Superannuation Salaries)
Report as at PSS CSS Combined
30 June 2002* 15.4 28.3 19.3
30 June 2005* 15.6 28.2 18.3
30 June 2008 16.3 21.4 17.1
30 June 2011 18.8 20.3 19.0
30 June 2014^ 22.6 18.3 22.1
* Old methodology – the methodology was changed in the 2008 Long Term Cost Report to bring calculations more in line with the approach used in Australian Accounting Standards and the Budget process. Please refer to the 2008 Long Term Cost Report for further details of the change
^ The 2014 NECR have been expressed as a percentage of full time equivalent salaries for consistency with NECRs published in previous LTCR reports. If the 2014 NECR were to be expressed as actual salaries (allowing for part-timers) the 2014 NECR would be 23.6% for PSS and 18.5% for CSS
Note 1: Productivity contributions of approximately 3% were included in the 2002 to 2011 NECRs. Productivity contributions of approximately 2.6% for PSS and 2.4% for CSS are included in the 2014 NECRs reflecting more accurate allowance for productivity contributions based on salary thresholds
Note 2: The combined rates are weighted average rates based on the superannuation salaries of the members of the two schemes.
1.15 The contribution rate for the PSS as at 30 June 2014 has increased by 3.8 percentage points of superannuation salaries compared to the rate as at 30 June 2011. The contribution rate for the CSS as at 30 June 2014 has decreased by 2.0 percentage points compared to the rate as at 30 June 2011.
1.16 The significant increase in the NECR for PSS is primarily due to changes in assumptions, based on observed member behaviour, relating to:
Increase in the proportion of PSS benefits taken as a pension from 70% to 80%. Under the assumptions made in this actuarial investigation, a member electing to take their benefit as a pension leads to a more valuable benefit: and
Introducing age-based member contribution rates reflecting the observation that as members age they increase their member contribution rates. Higher member contribution rates lead to a higher accrual of benefits and therefore more valuable benefits.
PSS and CSS Long Term Cost Report 2014 | 5

1.17 The decrease in the NECR for the CSS is due to the nature of the benefit design whereby the rate of benefit accrual declines with length of membership. The more accurate allowance for productivity contributions has also reduced the NECR.
1.18 Further detail regarding the NECRs is contained in Section 7 of this Report.
Scheme Membership1.19 The table below summarises the total membership of the PSS and CSS as at
30 June 2014:
Membership as at 30 June 2014
Report as at PSS CSS Combined
Number of Contributors 96,049 10,548 106,597
Total Salaries of Contributors
$9,239m $1,210m $10,449m
Number of Preserved Members
102,906 6,694 109,600
Number of Pensioners 34,314 113,310 147,624
Total Number of Members
233,269 130,552 363,821
1.20 Further detail regarding the schemes’ membership is contained in Section 3 of this Report, including historical membership figures from previous reports.
Assumptions1.21 The key economic assumptions adopted for this Report are shown in the table
below. All economic assumptions used to value the unfunded liability and projected outlays are the same as those used in the 2011 Report.
Item Assumption
Investment Return / Discount Rate 6.0% per annum (nominal)3.5% per annum (real)
General Salary Increases 4.0% per annum (nominal)1.5% per annum (real)
CPI Increases 2.5% per annum
1.22 Maintaining the long-term assumptions from the 2011 Report (and prior LTCRs) reflects the long term nature of the Schemes’ liabilities. The use of long-term assumptions continues the underlying principle of not using short and long term assumptions as short-term deviations are expected to be smoothed out in the longer term.
PSS and CSS Long Term Cost Report 2014 | 6

1.23 There has been considerable volatility in financial markets over recent years which has led to greater uncertainty around long-term assumed outcomes. The existing long-term assumptions remain within that range of outcomes. We have therefore continued to adopt the same long-term assumptions to provide consistency with prior years. Further commentary on these assumptions is included in Section 4 of this Report.
1.24 Section 8 of this Report provides sensitivity analysis of the results under different individual assumptions.
1.25 The demographic assumptions have been reviewed based on the experience of the schemes over the eight years to 30 June 2013. This analysis was conducted at the start of 2014 to allow time to analyse the results in detail. The most significant changes include:
increases in the pension take-up assumptions for PSS members and CSS members in taking up non-indexed pension benefits:
reductions to pensioner mortality rates; and
increases in member contribution rates for PSS members.
1.26 Further detail regarding assumptions is contained in Section 4 of this Report.
Post Valuation Date Experience1.27 Since 30 June 2014, there has been a higher than anticipated number of exits
from the schemes. This subsequent experience has not been allowed for in the results or projections of this Report.
1.28 The post valuation date experience is expected to have more significant impact on the pattern of the projected outlays than on the projected unfunded liabilities; further commentary is provided in Section 6 on Projected Outlays.
PSS and CSS Long Term Cost Report 2014 | 7

2. Scheme Information and Assets
Introduction2.1 The PSS was established on 1 July 1990, following the closure of the CSS on
the same date. The Superannuation Act 1990 and a Trust Deed and Rules govern its operations. The PSS was closed to new members from 1 July 2005. Employees of Australian Government agencies prior to 1 July 2005 were eligible for membership of the PSS.
2.2 Most employees of Australian Government agencies who commence employment on or after 1 July 2005 are eligible to join the Public Sector Superannuation Accumulation Plan (PSSap) that was established on 1 July 2005.
2.3 The CSS was introduced on 1 July 1976. Its operations are governed by the Superannuation Act 1976, as amended, and associated regulations. The CSS has been closed to new members since 1 July 1990. All CSS contributors at 1 July 1990 were given the option of transferring to the PSS. A further option to transfer to the PSS was provided in 1996 for a limited period of time. The current membership of the CSS covers Australian Government employees who were members on 30 June 1990 and who have not transferred to the PSS.
2.4 Prior to July 1976 the superannuation of Australian Government public servants was covered by the Superannuation Act 1922. There are no longer any members contributing under the Superannuation Act 1922. However, some pensioners remain entitled to benefits under this Act and the liabilities in respect of these members are included in the CSS Unfunded Liability.
Benefits2.5 The PSS and CSS are defined benefit schemes.
2.6 In the PSS, the primary benefit is expressed as a lump sum based on a multiple of final average salary that is related to a member’s average contribution rate and total service. On exit, the benefit may be wholly or partially taken as an indexed pension.
PSS and CSS Long Term Cost Report 2014 | 8

2.7 The CSS provides a retirement benefit equal to the sum of: employer-financed indexed pension – being a percentage of final salary
based on the period of contributory service and discounted for early retirement before age 65:
productivity component – made up of accumulated productivity contributions; and
member-financed benefit – made up of accumulated basic and supplementary contributions.
The member can elect to take the productivity component and member-financed benefit either as a non-indexed pension or a lump sum.
2.8 Further details of the benefits provided by the PSS and CSS are set out in Appendix A.
Employer Productivity Contributions and Member Contributions2.9 Member and employer productivity superannuation contributions paid to the
PSS and CSS are invested by the trustee of the two schemes, the Commonwealth Superannuation Corporation (CSC). These contributions are accumulated at a crediting rate periodically declared by the trustee.
2.10 Employer productivity contributions are contributions of approximately 2% to 3% (depending on an individual’s salary) of employees’ salaries that employers are required to pay as a result of award negotiations in the late 1980s. They (usually) form part of the scheme benefits. Generally agencies pay productivity superannuation contributions in respect of their employees to the PSS or CSS. However, there are some agencies that have made alternative arrangements in respect of their CSS members. These agencies pay their productivity superannuation contributions elsewhere.
2.11 The PSS and CSS are partly funded to the extent that actual assets are held in respect of member contributions and productivity superannuation contributions. These assets, as appeared in the financial statements for the schemes, were:
Assets of the PSS and CSS ($ millions)
Date PSS CSS Combined
30 June 2002 4,468 5,337 9,805
30 June 2005 7,583 6,015 13,598
30 June 2008 11,346 6,073 17,419
30 June 2011 12,481 4,598 17,079
30 June 2014 16,563 4,049 20,612
2.12 The Unfunded Liability is that portion of the total superannuation liability in excess of the assets held in the schemes. That is, these assets offset the schemes’ liabilities.
PSS and CSS Long Term Cost Report 2014 | 9

Investment Policy and Earning Rate Policy2.13 For PSS contributors, the total benefit is a defined benefit payable from the
CRF. Member contributions and productivity contributions, accumulated with investment returns, are paid from the PSS for these contributors into the CRF to offset the cost of benefit payments. Hence, positive investment returns reduce the cost of the scheme to the Government.
2.14 For PSS preserved members and all CSS members, the member and productivity contributions are accumulated with investment returns to provide part of the eventual benefits. Hence, positive investment returns for these members increase their benefits.
2.15 We have reviewed the trustee’s investment policy and considered it to be suitable, taking into account the largely unfunded nature of the schemes’ liabilities and the Government’s method of funding outlays from the CRF.
2.16 The earning rate applied to members’ accruals is effectively the actual rate of investment return, with no smoothing or reserves. The policy is documented and included on the trustee’s website. We consider the trustee’s earning rate policy to be suitable.
Insurance Policy2.17 Standard death and invalidity benefits in the PSS and CSS are self-insured. We
consider this to be appropriate, given the unfunded nature of the schemes, the credit rating of the Australian Government, and the ability to spread any risk over a sizeable population.
2.18 PSS contributors have the option of taking out additional death and invalidity cover. This additional benefit is covered by an external insurance policy held by CSC.
Changes to Benefits Since 20112.19 There have been no material changes to the benefits provided by the PSS and
CSS since the previous Report as at 30 June 2011.
2.20 There has been an increase in the level of Superannuation Guarantee (SG) from 9% to 9.5% as at 1 July 2014, with further incremental increases to 12% in future years.
2.21 In defined benefit schemes such as the PSS and CSS, the SG operates by requiring that a minimum level of benefits be provided (instead of a minimum level of contributions). Due to the generous nature of the scheme benefits, the increase in the SG rate does not have a material impact on the valuation results.
PSS and CSS Long Term Cost Report 2014 | 10
3. Membership and Data
3.1 Data relating to the membership of the PSS and CSS was provided for this Report by ComSuper, the schemes’ administrator, on behalf of the schemes’ trustee. Data provided included:
details of contributory members, pensioners and preserved members (generally former contributors who have preserved their benefits) of the PSS and CSS as at 30 June 2014; and
details of exits by contributory members and preserved members from the PSS and CSS during the three year period from 1 July 2011 to 30 June 2014.
3.2 A range of validity data checks were conducted by ComSuper prior to the data being provided to Mercer. A series of checks have also been carried out by Mercer to test the integrity of the data and the variation reports produced by ComSuper. In addition, a reconciliation of the current data with the data utilised for the 2011 Report has been carried out. We are satisfied that the data is sufficiently accurate for the purposes of this Report. However, CSC and ComSuper are ultimately responsible for the validity, accuracy and comprehensiveness of this information
3.3 In the PSS, more contributory members exited during the period from 1 July 2011 to 30 June 2014 than anticipated in the actuarial assumptions. However, this was partially offset by previously preserved members re-joining as contributory members. In the CSS the number of contributor exits was comparable to that expected. Overall the total contributory membership for the PSS and CSS at 30 June 2014 was higher than expected.
3.4 The number of PSS preserved members at 30 June 2014 was lower than expected mainly due to previously preserved members re-joining contributory membership. The number of CSS preserved members at 30 June 2014 was comparable to that expected.
PSS and CSS Long Term Cost Report 2014 | 11

3.5 The tables below summarise the total membership of the PSS and the CSS as at 30 June 2014:
PSS Membership as at 30 June 2014
Male Females Total
Number of Contributors 40,313 55,736 96,049
Total Salaries of Contributors
$4,143m $5,096m $9,239m
Number of Preserved Members
41,417 61,489 102,906
Number of Age Pensioners
14,170 15,551 29,721
Number of Invalidity Pensioners
1,359 1,811 3,170
Number of Dependant Pensioners
434 989 1,423
CSS Membership as at 30 June 2014
Male Females Total
Number of Contributors 6,793 3,755 10,548
Total Salaries of Contributors
$812m $398m $1,210m
Number of Preserved Members
4,455 2,239 6,694
Number of Age Pensioners
53,096 20,451 73,547
Number of Invalidity Pensioners
8,397 3,920 12,317
Number of Dependant Pensioners
1,550 25,896 27,446
PSS and CSS Long Term Cost Report 2014 | 12

3.6 The following tables summarise the membership of the schemes since 2002:
Total Number of Members
PSS CSS Total
30 June 2002 213,969 165,255 379,224
30 June 2005 252,025 157,821 409,846
30 June 2008 252,354 149,055 401,409
30 June 2011 240,237 140,025 380,262
30 June 2014 233,269 130,552 363,821
Number of Contributors
PSS CSS Total
30 June 2002 129,683 39,986 169,669
30 June 2005 154,897 32,006 186,903
30 June 2008 132,274 22,162 154,436
30 June 2011 113,224 15,916 129,140
30 June 2014 96,049 10,548 106,597
Number of Preserved Members
PSS CSS Total
30 June 2002 76,357 13,969 90,326
30 June 2005 85,709 12,227 97,936
30 June 2008 103,628 11,461 115,089
30 June 2011 103,092 9,110 112,202
30 June 2014 102,906 6,694 109,600
PSS and CSS Long Term Cost Report 2014 | 13

Number of Age and Invalidity Pensioners
PSS CSS Total
30 June 2002 7,598 83,370 90,968
30 June 2005 10,912 85,028 95,940
30 June 2008 15,759 86,901 102,660
30 June 2011 22,868 86,532 109,400
30 June 2014 32,891 85,864 118,755
Number of Dependant Pensioners
PSS CSS Total
30 June 2002 331 27,930 28,261
30 June 2005 507 28,560 29,067
30 June 2008 693 28,531 29,224
30 June 2011 1,053 28,467 29,520
30 June 2014 1,423 27,446 28,869
PSS and CSS Long Term Cost Report 2014 | 14

4. Assumptions
4.1 In order to value liabilities, it is necessary to make assumptions regarding the incidence, timing and amount of future benefits. These assumptions fall into two broad categories:
economic assumptions: assumptions that relate to the general economic environment and not directly to the membership of the schemes; and
demographic assumptions: assumptions that relate to the experience of the membership of the scheme.
4.2 This section sets out details of the assumptions adopted for the 2014 Report and highlights any changes from those adopted for the 2011 Report.
4.3 In total the changes in assumptions have resulted in an increase in the combined Unfunded Liability of the PSS and CSS of approximately $4.3 billion or 3.9% as at 30 June 2014. Further commentary is provided in Section 5.8.
4.4 The assumptions are detailed in Appendix B.
Economic Assumptions
Key Economic Assumptions
4.5 The key economic assumptions adopted for this Report include: future increases in the Consumer Price Index (CPI) which links to the level
of pension increases; and
future rate of investment return / discount rate; and
future increases in salaries (i.e. increases in salaries other than those arising from promotions).
4.6 The relationships between the assumptions adopted for these factors have a greater bearing on the long term cost estimates of the PSS and CSS than do the individual assumptions. This is due to the effect of one assumption being used to project the liability into the future (e.g. future salary increases) and another assumption being used to discount that liability to current day values (investment return / discount rate).
PSS and CSS Long Term Cost Report 2014 | 15

4.7 The key economic assumptions adopted for this Report are shown in the table below. The assumptions are the same as those used for the 2011 Report.
Item Assumption
Investment Return / Discount Rate6.0% per annum (nominal)3.5% per annum (real)
General Salary Increases4.0% per annum (nominal)1.5% per annum (real)
CPI Increases 2.5% per annum
4.8 There has been substantial volatility in financial markets since the global financial crisis and particularly in Australian bond markets since the 2011 Report. Adopting individual economic assumptions is therefore more complex at the current time than in calmer market periods. Given the long term nature of benefits to be provided by the schemes and the unfunded status we have continued to adopt a long term approach to setting the assumptions.
4.9 The assumptions adopted for the 2011 Report when considered over a duration consistent with that of the scheme’s liabilities continue to be within a reasonable range of outcomes based on economic forecasts. We have therefore adopted the same key economic assumptions as for 2011 to maintain consistency between valuations.
4.10 We have not adopted different economic assumptions for the short term and long term as a general principle. To adopt, for example, short term salary increase assumptions would necessitate the use of other short term assumptions (e.g. inflation and investment). However, as noted above, it is the relationships between the assumptions which are the key drivers to impact results. Whilst in the short term these rates may vary, in the longer term we expect them and their relationships to be more stable. We have commented more on these relationships in the sections below.
4.11 Section 8 of this Report provides sensitivity analysis of the results under different individual assumptions.
PSS and CSS Long Term Cost Report 2014 | 16

CPI
4.12 The assumed rate of future CPI increases remains at 2.5% per annum. This rate was set based on the following considerations:
The Reserve Bank target for CPI increase is 2% to 3% per annum.
The average CPI increase rate for the last 10 years to 30 June 2014 was 2.8% per annum.
The long term level of inflation projected by the 2010 and 2015 Intergenerational Reports is 2.5% per annum.
Mercer’s best estimate economic outlook for CPI is 2.5% per annum and this is consistent with other market forecasters.
Short term rates for CPI over the last 10 years have ranged from 1.2% to 5% per annum.
Investment Return / Discount Rate
4.13 The assumed investment return / discount rate remains at 6.0% per annum (nominal). This rate is maintained based on the following considerations:
As the PSS and CSS are largely unfunded, our view is that the best determinant of the discount rate is the expected return on government bonds over the long term as this would be the cost to the Australian Government were it to fund the schemes via borrowings. This compares to funded schemes where discount rates are typically based on expected investment return on the assets.
The bond market has seen a period of unprecedented volatility in recent years and the bond yields have been at historical lows. However a long term assumption for bond yields at 6.0% per annum (nominal) remains within the range of reasonable economic forecasts for long term bond yields.
4.14 To illustrate the recent volatility in the bond market, the yield for the Australian Government bond maturing in April 2024 (approximately 10 years to maturity) was just above 4% per annum in December 2013, fell to around 3.5% in June 2014, and continued falling to around 2.7% in December 2014.
4.15 Despite this short term volatility and reduction in bond yields, economic forecasts at the valuation date (based on a sample of different forecasters) for the 10-year government bond yield are for a recovery to around 5.5% per annum in the long term, consistent with a 2.5% CPI assumption.
4.16 The duration of the schemes’ liabilities far exceeds the duration of the 10-year Australian Government bonds. In setting a discount rate for the scheme liabilities, consideration is therefore required for an additional liquidity or term premium above the 10-year bond yields.
PSS and CSS Long Term Cost Report 2014 | 17

4.17 The longest dated Australian Government bond currently in issuance matures in 2037, its bond yield has exceeded that of the 2024 bonds by between 0.5% to 0.6%. This differential could be considered as the additional liquidity or term premium for longer term bonds.
4.18 The duration of the schemes’ liabilities exceeds the duration of the 2037 bonds, therefore it is reasonable to allow for a similar additional yield above the 10-year bond yield in setting the discount rate assumption. A range of 0.5% to 0.75% may be expected in the long term.
4.19 Overall, given the above commentary it is reasonable to maintain a long term discount rate at 6% per annum.
4.20 It is also worth noting that whilst the schemes are largely unfunded, assets are held by the Trustee within the schemes in relation to productivity and member contributions prior to the member retiring or exiting the Schemes. The target return on these assets is also CPI + 3.5%. Approximately $20 billion is currently held in these funds.
General Salary Increases
4.21 The assumed rate of future general salary increases remains at 4.0% per annum (nominal). This rate was set based on the following considerations:
Over the last 10 years Australian national wage inflation increases have ranged from 1.6% per annum to 6.1% per annum, with an average of 4.2% per annum.
The margin of Average Weekly Earnings over CPI has averaged 1.4% per annum over the past 10 years.
Real wages growth (i.e. above price inflation) is expected to be in line with labour productivity growth. The 2015 Intergenerational Report assumes that long term wage growth will be 4.0% (with productivity growth in the order of 1.5% combined with long term price inflation of 2.5%).
4.22 The magnitude of future salary increases in the short term are expected to be lower than recent years as the Government has announced its intention to keep average annual wage rises across the public service to 1.5 per cent or less over the next three years, as outlined in the 2014-15 Mid-Year Economic and Fiscal Outlook.
4.23 However, as noted above we have adopted the principle of not adjusting Long Term Cost Report assumptions for short term rates. This is consistent with Long Term Cost Report assessments historically when salary growth has been higher than assumed.
4.24 Please note for CSS members the salary increase assumption has very little impact on the overall results (see Section 8). For PSS, where there is a higher impact, a longer period consistent with the duration of PSS contributors’ future service should be considered when setting the salary assumptions.
PSS and CSS Long Term Cost Report 2014 | 18

4.25 In the longer term we would expect the net difference between rate of salary increase and rate of investment return to remain around 2% per annum. Retaining the existing salary growth assumption of 4% per annum is therefore reasonable in the long term and consistent with the other valuation assumptions.
GDP
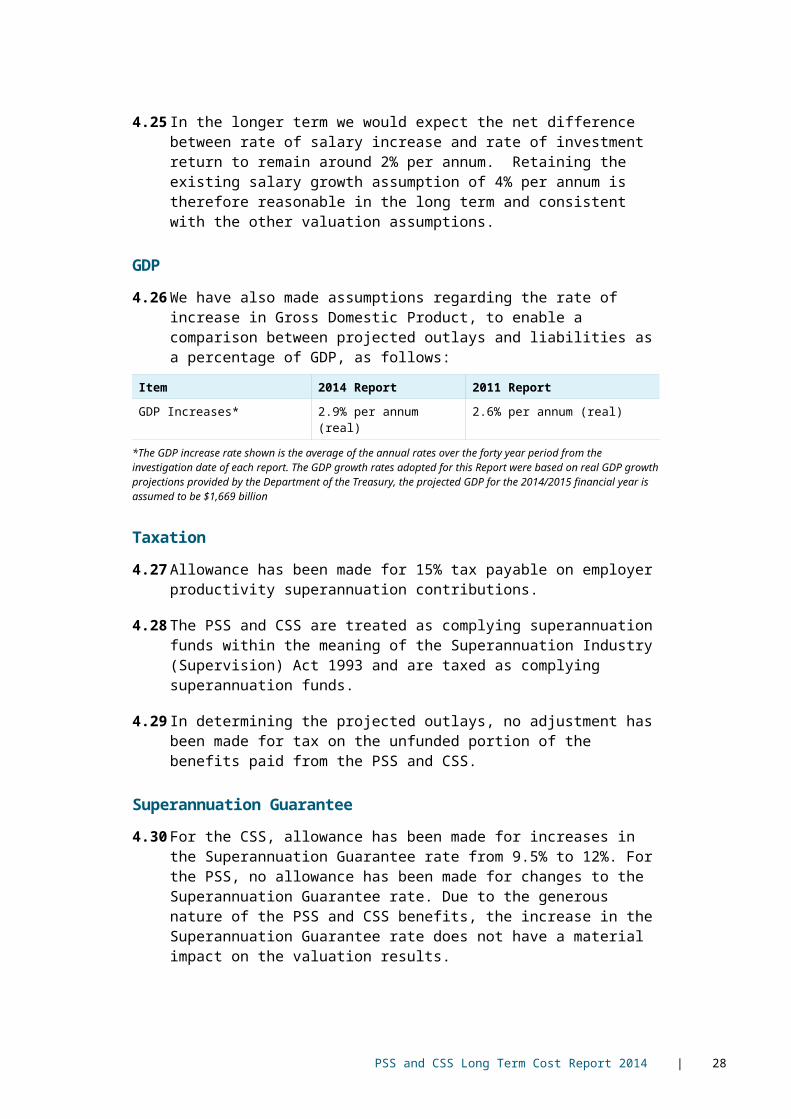
4.26 We have also made assumptions regarding the rate of increase in Gross Domestic Product, to enable a comparison between projected outlays and liabilities as a percentage of GDP, as follows:
Item 2014 Report 2011 Report
GDP Increases* 2.9% per annum (real) 2.6% per annum (real)
*The GDP increase rate shown is the average of the annual rates over the forty year period from the investigation date of each report. The GDP growth rates adopted for this Report were based on real GDP growth projections provided by the Department of the Treasury, the projected GDP for the 2014/2015 financial year is assumed to be $1,669 billion
Taxation
4.27 Allowance has been made for 15% tax payable on employer productivity superannuation contributions.
4.28 The PSS and CSS are treated as complying superannuation funds within the meaning of the Superannuation Industry (Supervision) Act 1993 and are taxed as complying superannuation funds.
4.29 In determining the projected outlays, no adjustment has been made for tax on the unfunded portion of the benefits paid from the PSS and CSS.
Superannuation Guarantee
4.30 For the CSS, allowance has been made for increases in the Superannuation Guarantee rate from 9.5% to 12%. For the PSS, no allowance has been made for changes to the Superannuation Guarantee rate. Due to the generous nature of the PSS and CSS benefits, the increase in the Superannuation Guarantee rate does not have a material impact on the valuation results.
PSS and CSS Long Term Cost Report 2014 | 19

Demographic Assumptions4.31 The demographic assumptions adopted for this Report have incorporated the
results of a detailed analysis of the membership experience for the eight years from 1 July 2005 to 30 June 2013. This analysis was conducted at the start of 2014 to allow time to analyse the results in detail. Details of the updated demographic assumptions are set out in Appendix B.
Promotional Salary Increase
4.32 Salary increases consist of general salary increases due to salary inflation together with increases due to promotion. General salary increases capture the average salary increase for all government employees, while promotional salary increases capture the increases due to promotion within and between employment bands.
4.33 As discussed above, the assumed rate of future general salary increases remains at 4.0% per annum.
4.34 The promotional salary increase assumptions have been simplified to be based on sex and age only, and are no longer based on the length of scheme membership as previously assumed in the 2011 Report. This reflects the fact that the majority of contributor members now have more than eight years of scheme membership with PSS closed to new members in 2005 and CSS in 1990.
4.35 Overall this change leads to more realistic promotional salary assumptions reflecting past scheme experience.
Rate of Retirement
4.36 We have made minor adjustments to the assumed rates of retirement to better reflect the scheme experience.
Rate of Resignation
4.37 For PSS members, we have adjusted the rates of resignation to better reflect the scheme experience. The overall change was a reduction in the resignation rates for members with 10 years or more of service and an increase in rates for members with between zero and nine years of service.
4.38 For CSS members, the only change is the reduction in the resignation rate at age 54, to bring the assumption in line with the scheme experience.
Rate of Redundancy
4.39 While there have been fewer redundancies than expected, we have maintained the assumptions used in the 2011 Report. This reflects an anticipated increase in the three years from 1 July 2014 compared to previous years. From data provided by ComSuper for post 30 June 2014 this appears to be the case. The assumptions will be reviewed at the 2017 valuation.
PSS and CSS Long Term Cost Report 2014 | 20

Rate of Invalidity Retirement
4.40 The number of contributors retiring from the PSS due to invalidity has been higher than expected, while the number of PSS preserved members retiring due to invalidity has been lower than expected. The assumptions have been adjusted to reflect the scheme experience.
4.41 The number of contributors retiring from the CSS due to invalidity has been slightly higher than expected. We have maintained the assumptions used in the 2011 Report as any adjustment to the invalidity rates based on experience will not have a material impact on CSS liabilities due to the maturity of the contributor membership.
4.42 The number of preserved members retiring from the CSS due to invalidity has been significantly lower than expected. We have reduced the invalidity assumptions to reflect this experience.
Mortality of Contributors and Preserved Members
4.43 Mortality experience for contributors and preserved members has been broadly in line with expectations. We have not revised these assumptions.
Mortality of Pensioners
4.44 For age retirement pensioners, spouse pensioners, and invalidity pensioners with duration greater than 3 years, the 2011 pensioner mortality assumptions have been adjusted at specific ages to better align with experience, and then with three years of short term improvement factors applied for all ages.
4.45 For invalidity pensioners with duration less than 3 years, there has been no change in the assumed mortality rates.
Future Mortality Improvements
4.46 For the purposes of this Report allowance is made for future improvements in mortality for all pensioners except invalidity pensioners with duration less than 3 years and child pensioners. These improvements have been made in accordance with the short and long term rates of mortality improvement derived by the Australian Bureau of Statistics in conjunction with the Australian Government Actuary as published in the Australian Life Tables 2005-07.
4.47 In December 2014 (and after calculations had commenced for this Report), the Australian Government Actuary published the Australian Life Tables 2010-2012. Improvement factors in the latest Australian Life Tables will be incorporate into future long term cost reports.
4.48 We have incorporated short term rates for the period 2014 to 2021 and long term rates thereafter.
PSS and CSS Long Term Cost Report 2014 | 21

4.49 Short term rates of mortality improvement relate to mortality improvements measured over the last 25 years. Long term rates relate to mortality improvements measured over the last 100 years. Short term rates are significantly higher than the long term rates.
4.50 Our analysis of the experience of the PSS and CSS as well as other public sector schemes shows that recent mortality improvements have been broadly in line with the short term rates. Due to this, we have extended the period of short term improvements from 2018 (assumed in the 2011 Report) to 2021.
Preservation of Benefits
4.51 Members who are made redundant are eligible to be paid benefits immediately and they therefore have a different pattern of preservation from members leaving due to resignation. Different preservation rates have therefore been adopted for resignation and redundancy exits in 2014, this compares to 2011 where the same preservation rates were assumed.
Rates of Pension Take-up
4.52 The proportion of benefits taken as a pension by PSS members continues to increase. We have therefore increased the assumed proportion of benefits taken as a pension from 70% to 80% to reflect the scheme experience.
4.53 CSS members have the option to convert the funded portion of their benefits from a lump sum benefit to a non-indexed pension. We are now seeing an increasing number of members taking up this option. It is assumed that 30% of funded benefits are taken as a non-indexed pension; zero percent was assumed in the 2011 Report.
PSS Member Contribution Rate
4.54 Members of the PSS are able to contribute at any whole percentage rate from 2% to 10% of superannuation salary (or not to contribute at all) and the rate of increase in a member’s benefit accrual is dependent on his/her contribution rate.
4.55 Experience is showing that the average contribution rate continues to increase over time. Our analysis also indicates that the contribution rate is heavily correlated to a member’s age, with higher contribution rates at older ages. We have therefore introduced an age-based contribution rate to better reflect the scheme experience.
Family Law
4.56 It is assumed for this Report that benefits subject to Family Law splitting orders or agreements that have already been implemented as at 30 June 2014 have been allowed for in the data as at 30 June 2014. The member spouse has had their benefit reduced due to the split. The non-member spouse is included as a dependant pensioner if currently receiving a pension, or as a preserved member if their benefit is currently unpaid.
PSS and CSS Long Term Cost Report 2014 | 22

Co-contributions
4.57 Co-contributions are treated as fully funded additional member accounts and have no effect on the Unfunded Liability or Notional Employer Contribution Rates.
Spouse Assumptions
4.58 The experience analysis indicated the proportion of members in a marital or couple relationship was broadly aligned with that assumed for the 2011 Report.
4.59 For the 2011 Report it was assumed that male members were three years older than their spouse and that female members were two years younger than their spouse. The experience analysis indicated that the assumption was broadly reasonable. There has been no change to our assumptions.
Future New Entrants
4.60 The PSS has been closed to new members since 1 July 2005. The CSS has been closed to new members since 1 July 1990. This Report assumes that there are no future new entrants to either the PSS or CSS. In practice there may be some members who we class as new entrants to the schemes in the future – for example members who had previously left employment with the Australian Government returning to work who have a right to re-join. However the level of these future new entrants is not material.
PSS and CSS Long Term Cost Report 2014 | 23

5. Unfunded Liability
5.1 The Unfunded Liability is the total accrued superannuation liability in respect of service up to 30 June 2014 reduced by the assets held.
5.2 The Unfunded Liability represents an estimate of the schemes’ superannuation liabilities and represents the total discounted value of all future (net) payments that will be made from the CRF in respect of scheme membership accrued to 30 June 2014.
Valuation Methodology5.3 The steps involved in calculating the Unfunded Liability are as follows:
1. The membership of each scheme as at 30 June 2014 is projected into the future based on assumptions relating to the rates of exit of members (as set out in Appendix B).
2. The total value of benefits payable to the projected exits and pensioners in each future year are determined taking into account assumed salary growth and pension indexation in each future year.
For contributory members, the projected benefits are determined based on members’ service rendered prior to 30 June 2014 only.
For example, for the PSS retirement benefit, this involves determining the benefit attributable to service to 30 June 2014 using.
Accrued Multiple ×
Final Average Salary
as at 30 June 2014 at future date
3. The Unfunded Liability as at 30 June 2014 is determined as the sum of the present values of the benefits payable to the projected exits over all future years, offset by funded accumulated member and productivity contributions accounts as at 30 June 2014.
5.4 The calculation methodology is consistent with the Professional Standard No. 402 of the Actuaries Institute relating to the determination of accrued benefits for defined benefit superannuation funds.
5.5 The same valuation methodology was used for the 2011 Report.
PSS and CSS Long Term Cost Report 2014 | 24

Unfunded Liability as at 30 June 20145.6 The accrued Unfunded Liability as at 30 June 2014 for current members in
respect of service up to 30 June 2014, preserved members and pensioners has been calculated to be $109.8 billion. A breakdown of this estimate is outlined in the table below. The results calculated in 2008 and 2011 are also shown for comparison purposes.
Estimate of Unfunded Liability for the PSS and CSS as at 30 June ($ billions)
Liability for 2008 2011 2014
– Contributors 26.5 30.5 35.0
– Pensioners 44.6 53.8 65.5
– Preserved Members 9.0 8.7 9.3
Unfunded Liability 80.1 93.0 109.8
Total Unfunded Liability (as a percentage of GDP)
6.6% 6.3% 6.9%
Note: The prior year figures have not been adjusted to 2014 dollars.
5.7 The table below shows the total Unfunded Liabilities as at 30 June 2014 split between the PSS and CSS:
Estimate of Unfunded Liability for the PSS and CSS as at 30 June 2014 ($ billions)
Liability for PSS CSS Total
– Contributors 25.8 9.2 35.0
– Pensioners:
1922 Pensioners - 0.7 0.7
1976 Pensioners - 48.8 48.8
1990 Pensioners 16.0 - 16.0
– Total pensioners 16.0 49.5 65.5
– Preserved Members 5.1 4.2 9.3
Unfunded Liability 46.9 62.9 109.8
PSS and CSS Long Term Cost Report 2014 | 25

Summary of Changes in Unfunded Liability5.8 The 2011 Report projected that the Unfunded Liability would be $102.5
billion as at 30 June 2014, approximately $7.3 billion less than the current estimate of $109.8 billion calculated in this report. The factors leading to the higher than previously projected Unfunded Liability include:
Increases in pension take-up assumptions for the PSS pensions and CSS non-indexed pensions reflecting the continuing increasing trend observed in recent member behaviours (approximately $2.2 billion increase in liabilities);
Continuing improvements in pensioner mortality rates (approximately $1.9 billion increase in liabilities);
Member movements different from those expected, notably higher pension liabilities for the new pensioners than expected (approximately $2.8 billion increase in liabilities); and
PSS members contributing at rates higher than assumed leading to higher benefit accruals than expected (approximately $0.2 billion increase in liabilities).
Of the $7.3 billion higher than expected increase in Unfunded Liability, approximately $4.3 billion is due to the assumptions adopted for the 2014 report being different from those for the 2011 Report. Approximately $3.0 billion is due to experience differing from assumptions made in the 2011 Report.
PSS and CSS Long Term Cost Report 2014 | 26

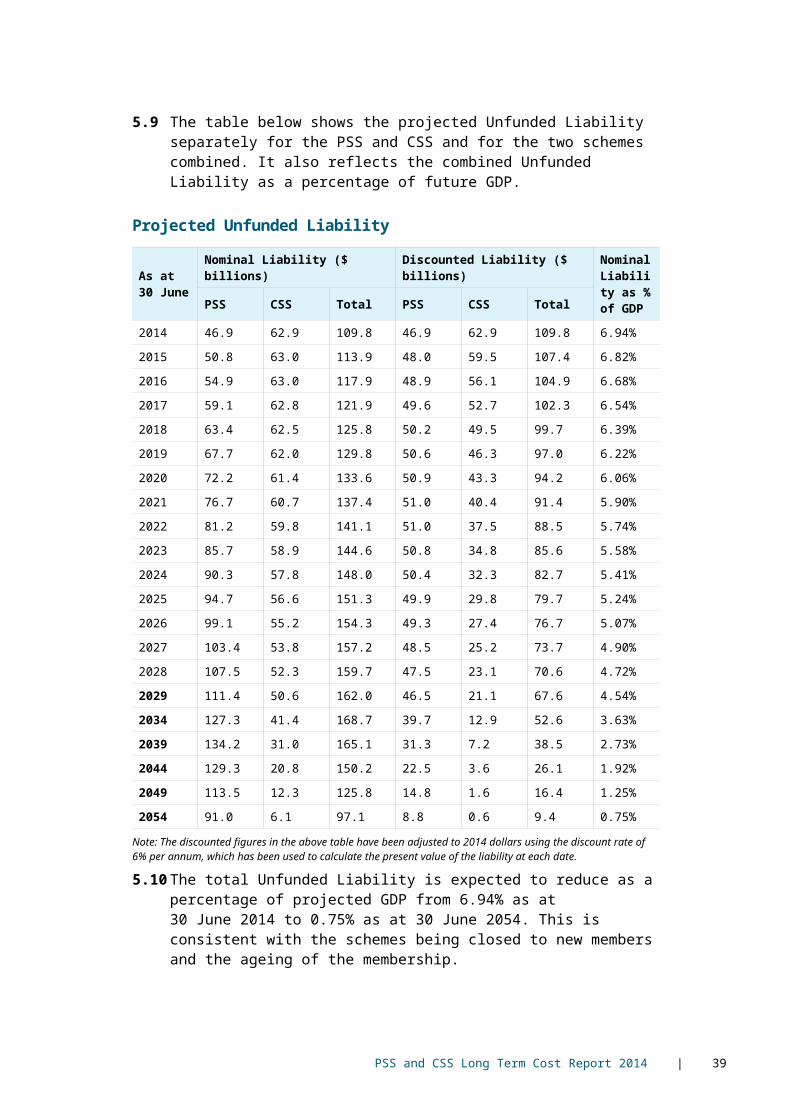
5.9 The table below shows the projected Unfunded Liability separately for the PSS and CSS and for the two schemes combined. It also reflects the combined Unfunded Liability as a percentage of future GDP.
Projected Unfunded Liability
As at 30 June
Nominal Liability ($ billions) Discounted Liability ($ billions) Nominal Liability as % of GDP
PSS CSS Total PSS CSS Total
2014 46.9 62.9 109.8 46.9 62.9 109.8 6.94%
2015 50.8 63.0 113.9 48.0 59.5 107.4 6.82%
2016 54.9 63.0 117.9 48.9 56.1 104.9 6.68%
2017 59.1 62.8 121.9 49.6 52.7 102.3 6.54%
2018 63.4 62.5 125.8 50.2 49.5 99.7 6.39%
2019 67.7 62.0 129.8 50.6 46.3 97.0 6.22%
2020 72.2 61.4 133.6 50.9 43.3 94.2 6.06%
2021 76.7 60.7 137.4 51.0 40.4 91.4 5.90%
2022 81.2 59.8 141.1 51.0 37.5 88.5 5.74%
2023 85.7 58.9 144.6 50.8 34.8 85.6 5.58%
2024 90.3 57.8 148.0 50.4 32.3 82.7 5.41%
2025 94.7 56.6 151.3 49.9 29.8 79.7 5.24%
2026 99.1 55.2 154.3 49.3 27.4 76.7 5.07%
2027 103.4 53.8 157.2 48.5 25.2 73.7 4.90%
2028 107.5 52.3 159.7 47.5 23.1 70.6 4.72%
2029 111.4 50.6 162.0 46.5 21.1 67.6 4.54%
2034 127.3 41.4 168.7 39.7 12.9 52.6 3.63%
2039 134.2 31.0 165.1 31.3 7.2 38.5 2.73%
2044 129.3 20.8 150.2 22.5 3.6 26.1 1.92%
2049 113.5 12.3 125.8 14.8 1.6 16.4 1.25%
2054 91.0 6.1 97.1 8.8 0.6 9.4 0.75%
Note: The discounted figures in the above table have been adjusted to 2014 dollars using the discount rate of 6% per annum, which has been used to calculate the present value of the liability at each date.
5.10 The total Unfunded Liability is expected to reduce as a percentage of projected GDP from 6.94% as at 30 June 2014 to 0.75% as at 30 June 2054. This is consistent with the schemes being closed to new members and the ageing of the membership.
PSS and CSS Long Term Cost Report 2014 | 27
6. Projected Outlays
6.1 The projected outlays in each year are calculated as follows:
productivity superannuation contributions paid by the employer to the PSS and CSS; plus
benefit payments made from the CRF (including payments made under the Superannuation Act 1922); less
payments made from the PSS and CSS to the CRF.
6.2 When a member becomes entitled to a benefit from the PSS or CSS, the member's accumulation accounts (i.e. funded member and productivity contributions plus interest) are paid from the PSS or CSS to the CRF. The total benefit payment to the member is then made from the CRF.
6.3 The indexed pension benefit from the CSS is therefore financed from the CRF on an unfunded basis. Similarly the benefit from the PSS after deducting the accumulated value of the member contributions and productivity superannuation contributions is also financed from the CRF on an unfunded basis.
6.4 The projected outlays represent the total cost to the Australian Government of funding the PSS and CSS benefits to current and past employees and their dependants, as such the projected outlays are better representations of the expected future contributions required from the Australian Government.
6.5 In comparison, the NECRs represent the estimated contribution rates that would be required to fund the benefits accruing to contributors over the next three years assuming PSS and CSS were fully funded at the start of the three-year period and based on actuarial projection assumptions. The NECRs are therefore short-term in nature and relate to the cost of funding future benefit accruals of contributors only.
PSS and CSS Long Term Cost Report 2014 | 28

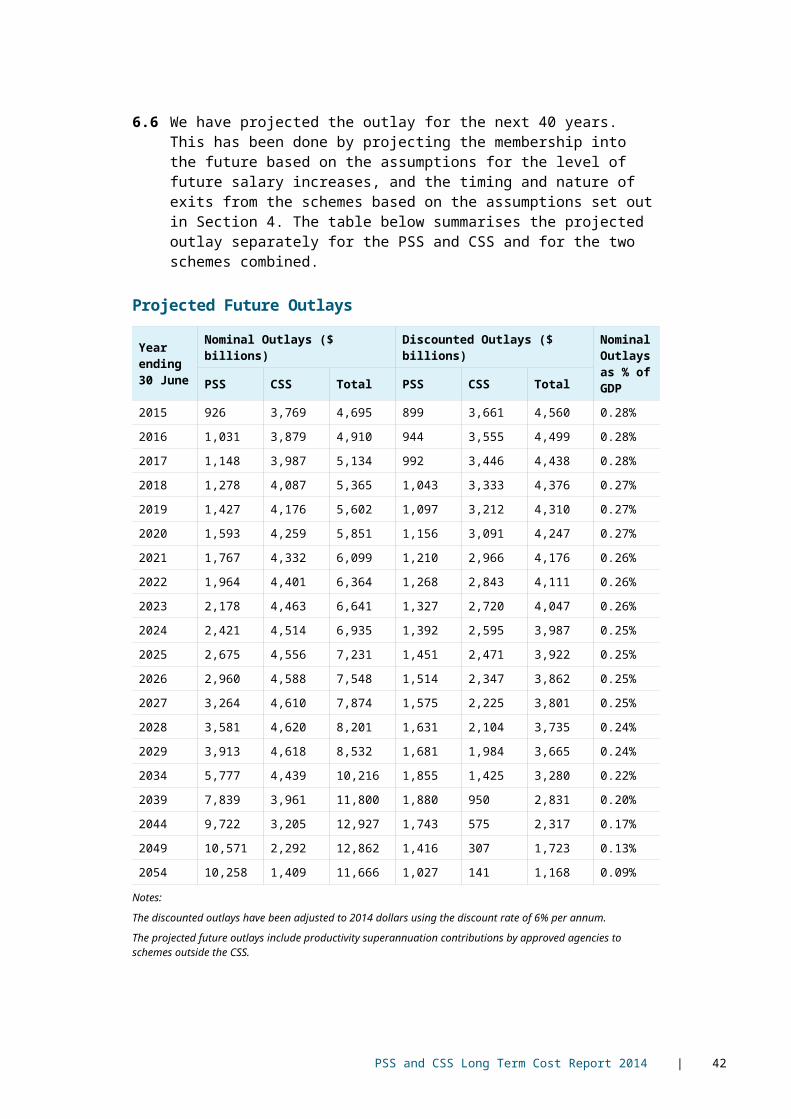
6.6 We have projected the outlay for the next 40 years. This has been done by projecting the membership into the future based on the assumptions for the level of future salary increases, and the timing and nature of exits from the schemes based on the assumptions set out in Section 4. The table below summarises the projected outlay separately for the PSS and CSS and for the two schemes combined.
Projected Future Outlays
Year ending 30 June
Nominal Outlays ($ billions) Discounted Outlays ($ billions) Nominal Outlays as % of GDP
PSS CSS Total PSS CSS Total
2015 926 3,769 4,695 899 3,661 4,560 0.28%
2016 1,031 3,879 4,910 944 3,555 4,499 0.28%
2017 1,148 3,987 5,134 992 3,446 4,438 0.28%
2018 1,278 4,087 5,365 1,043 3,333 4,376 0.27%
2019 1,427 4,176 5,602 1,097 3,212 4,310 0.27%
2020 1,593 4,259 5,851 1,156 3,091 4,247 0.27%
2021 1,767 4,332 6,099 1,210 2,966 4,176 0.26%
2022 1,964 4,401 6,364 1,268 2,843 4,111 0.26%
2023 2,178 4,463 6,641 1,327 2,720 4,047 0.26%
2024 2,421 4,514 6,935 1,392 2,595 3,987 0.25%
2025 2,675 4,556 7,231 1,451 2,471 3,922 0.25%
2026 2,960 4,588 7,548 1,514 2,347 3,862 0.25%
2027 3,264 4,610 7,874 1,575 2,225 3,801 0.25%
2028 3,581 4,620 8,201 1,631 2,104 3,735 0.24%
2029 3,913 4,618 8,532 1,681 1,984 3,665 0.24%
2034 5,777 4,439 10,216 1,855 1,425 3,280 0.22%
2039 7,839 3,961 11,800 1,880 950 2,831 0.20%
2044 9,722 3,205 12,927 1,743 575 2,317 0.17%
2049 10,571 2,292 12,862 1,416 307 1,723 0.13%
2054 10,258 1,409 11,666 1,027 141 1,168 0.09%
Notes:
The discounted outlays have been adjusted to 2014 dollars using the discount rate of 6% per annum.
The projected future outlays include productivity superannuation contributions by approved agencies to schemes outside the CSS.
PSS and CSS Long Term Cost Report 2014 | 29

6.7 Future outlays are expected to reduce as a percentage of projected GDP from 0.28% in the year ending 30 June 2015 to 0.09% in the year ending 30 June 2054. The decline over the next 40 years is consistent with the schemes being closed to new entrants and the ageing of the membership.
6.8 The main reasons for the increase in outlays compared with the 2011 projections are the increased pension take-up rate assumption for PSS members (which means fewer lump sum payments initially, replaced by a longer stream of pension payments) and the increased PSS member contribution rate assumption (members are assumed to be accruing benefits at a faster rate leading to higher benefit entitlements). Other assumptions such as the decrease in mortality rates have also had an impact.
6.9 We consider that the Australian Government has sufficient liquidity and financial resources to provide for Scheme benefits from the CRF as they become due, taking into account the credit rating of the Australian Government and the level and trend of projected outlays as a percentage of GDP.
Post Valuation Date Experience6.10 Since 30 June 2014, there has been a higher than anticipated number of exits
from the schemes. This subsequent experience has not been allowed for in the results or projections of this Report.
6.11 The impact of this post valuation date experience is to generate variations in the short term cash flows. The long term financial position (UFL) is not expected to be materially affected as the short term increase in total benefits paid from the schemes will be offset by lower amounts in future years.
6.12 The table below illustrates the actual benefit payments provided by the Department of Finance for the period from 1 July 2014 to 31 January 2015 compared to the projected benefit payments for the same period. The figures are inclusive of emerging cost agency cash flows. For CSS the pensioner payments made under the Superannuation Act 1922 have been excluded.
Cash flows from 1 July 2014 to 31 January 2015
PSS CSS (excluding OSS)
Actual($millions)
Projected ($millions)
Actual ($millions)
Projected ($millions)
1. Total benefits paid from scheme 1,063 823 2,620 2,470
2. Total offsets/ funded benefits paid from scheme 1,029 408 558 345
3. Total net appropriations from CRF/unfunded benefits paid from scheme (1. – 2.)
34 415 2,062 2,125
* Projected cash flows are based on pro-rata of the full year projections from 1 July 2014 using the long term assumptions adopted for this Report.
PSS and CSS Long Term Cost Report 2014 | 30

6.13 The immediate impact of the increased number of exits is a reduction in net appropriations from CRF due to the increased payments of members’ funded accounts to the CRF. Following this, outlays would increase due to members receiving pension benefits earlier than projected. The long term impact on outlays is a slight reduction due to members ceasing to accrue benefits earlier than projected.
6.14 The overall impact on unfunded liabilities is not expected to be material, due to the offsetting changes to the outlays described above.
PSS and CSS Long Term Cost Report 2014 | 31

7. Notional Employer Contribution Rates
7.1 The Notional Employer Contribution Rates (NECRs) represent the estimated contribution rates that would be required to fund the benefits accruing to contributors over the next three years (from 1 July 2014 to 30 June 2017) based on current projections – that is, if the PSS and CSS schemes were fully funded at the valuation date and contributions were made at their respective NECRs, then the liability for contributors would be expected to be fully funded at the end of the period.
7.2 The NECRs disclosed in this Report are determined using long term assumptions as these rates are notional in nature. These assumptions may differ from current settings – for example the assumed 4 per cent salary growth rate is different to the Commonwealth Government’s stated intention to keep average annual wage rises across the public service to 1.5 per cent or less over the next three years, as outlined in the 2014-15 Mid-Year Economic and Fiscal Outlook.
7.3 Only the productivity components of the NECRs are actually paid by the employers to the PSS and CSS schemes and are invested in actual assets by the Trustee. The non-productivity components of the NECRs are notional in nature and no such employer contributions are paid to the schemes.
7.4 The calculation of the NECR takes into account (by offsetting the cost of benefits accruing for the purposes of the calculation) any additional lump sums paid in the previous three years under the Agency Assessment Framework, under which agencies pay additional lump sums for employees with large salary increases. The Agency Assessment adjustment to NECR is 0.3% for the PSS and 0.1% for the CSS.
PSS and CSS Long Term Cost Report 2014 | 32

7.5 The NECRs for the two schemes (including allowances for contributions towards the productivity superannuation benefit) are summarised in the following table:
Notional Employer Contribution Rates (% of Superannuation Salaries)
Report as at PSS CSS Combined
30 June 2002* 15.4 28.3 19.3
30 June 2005* 15.6 28.2 18.3
30 June 2008 16.3 21.4 17.1
30 June 2011 18.8 20.3 19.0
30 June 2014^ 22.6 18.3 22.1
* Old methodology. The methodology was changed in the 2008 Long Term Cost Report to bring calculations more in line with the approach used in Australian Accounting Standards and the Budget process. Please refer to the 2008 Long Term Cost Report for further details of the change.
^ The 2014 NECR have been expressed as a percentage of full time equivalent salaries for consistency with NECRs published in previous LTCR reports. If the 2014 NECR were to be expressed as actual salaries (allowing for part-timers) the 2014 NECR would be 23.6% for PSS and 18.5% for CSS.
Note 1: Productivity contributions of approximately 3% were included in the 2002 to 2011 NECRs. Productivity contributions of approximately 2.6% for PSS and 2.4% for CSS are included in the 2014 NECRs reflecting more accurate allowance for productivity contributions based on salary thresholds.
Note 2: The combined rates are weighted average rates based on the superannuation salaries of the members of the two schemes.
7.6 The contribution rate for the PSS as at 30 June 2014 has increased by 3.8 percentage points of superannuation salaries compared to the rate as at 30 June 2011. The contribution rate for the CSS as at 30 June 2014 has decreased by 2.0 percentage points compared to the rate as at 30 June 2011.
7.7 The significant increase in the NECR for PSS is primarily due to changes in assumptions, based on observed member behaviour, relating to:
Increase in the proportion of PSS benefits taken as a pension from 70% to 80%. Under the assumptions made in this actuarial investigation, a member electing to take their benefit as a pension leads to a more valuable benefit, and
Introducing age-based member contribution rates reflecting the observation that as members age they increase their member contribution rates. Higher member contribution rates lead to a higher accrual of benefits and therefore more valuable benefits.
7.8 The decrease in the NECR for the CSS is due to the nature of the benefit design whereby the rate of benefit accrual declines with length of membership. The more accurate allowance for productivity contributions has also reduced the NECR.
PSS and CSS Long Term Cost Report 2014 | 33

8. Sensitivity Analysis
Economic Assumptions8.1 The sensitivity of the estimated Unfunded Liability as at 30 June 2014 and
total projected outlays to the key economic assumptions were tested by measuring the effect on the Unfunded Liability and total projected outlays of varying each key assumption in turn by plus or minus 1% whilst keeping all other assumptions unchanged. The alternative assumptions used were:
Investment Return / Discount Rate plus 1%; increased to 7% per annum (nominal).
Investment Return / Discount Rate minus 1%; reduced to 5% per annum (nominal).
General Salary Increases plus 1%; increased to 5% per annum (nominal). General Salary Increases minus 1%; reduced to 3% per annum (nominal).
CPI Increases plus 1%; increased to 3.5% per annum. CPI Increases minus 1%; reduced to 1.5% per annum.
For the CPI analysis we have assumed that the nominal rates of return remain unchanged i.e. the nominal rate of Investment Return / Discount Rate remains at 6.0% per annum and the nominal rate of General Salary Increases remains at 4.0% per annum.
Unfunded Liability
8.2 The table below shows the Unfunded Liability of the PSS and CSS at 30 June 2014 under each of the above alternative assumptions.
Sensitivity of Unfunded Liability to Key Economic Assumptions
Assumption PSS($ billions)
CSS($ billions)
Combined($ billions)
UFL Change UFL Change UFL Change
Valuation basis 46.9 62.9 109.8
Investment Return/ Discount Rate
+1% 37.7 -9.2 56.6 -6.3 94.3 -15.5
-1%58.9 +11.9 70.5 +7.6 129.4 +19.4
General Salary Increases
+1% 50.1 +3.1 63.2 +0.3 113.3 +3.5
-1% 44.2 -2.7 62.7 -0.2 106.9 -2.9
CPI Increases
+1% 54.7 +7.8 69.7 +6.8 124.4 +14.6
-1% 40.5 -6.4 57.2 -5.8 97.7 -12.1
PSS and CSS Long Term Cost Report 2014 | 34

Total Projected Outlays
8.3 The table below shows the projected total PSS and CSS outlays for the next six years and then for the next three 10-year intervals under the valuation basis and the alternative assumptions for investment return/discount rate.
Projected Total PSS and CSS Future Outlays
Year ending 30 June
Nominal Outlays($ millions)
Discounted Outlays($ millions)
Valuation basis
Investment return/ Discount rate +1%
Investment return/ Discount rate -1%
Valuation basis
Investment return/ Discount rate +1%
Investment return/ Discount rate -1%
2015 4,695 4,695 4,695 4,560 4,539 4,582
2016 4,910 4,903 4,916 4,499 4,430 4,569
2017 5,134 5,121 5,148 4,438 4,324 4,557
2018 5,365 5,344 5,386 4,376 4,217 4,541
2019 5,602 5,573 5,631 4,310 4,110 4,521
2020 5,851 5,813 5,888 4,247 4,007 4,502
2030 8,863 8,693 9,014 3,592 3,046 4,231
2040 12,057 11,869 12,204 2,729 2,114 3,517
2050 12,699 12,828 12,585 1,605 1,162 2,227
Note 1: It can be seen that the investment return/discount rate has little impact on the nominal outlays as the Schemes are unfunded apart from member and productivity contributions.
Note 2: These nominal outlays are then discounted at different rates leading to variations in the discounted outlays.
PSS and CSS Long Term Cost Report 2014 | 35
The table below shows the projected total PSS and CSS outlays for the next six years and then for the next three 10-year intervals under the valuation basis and the alternative assumptions for general salary increases.
Projected Total PSS and CSS Future Outlays
Year ending 30 June
Nominal Outlays($ millions)
Discounted Outlays($ millions)
Valuation basis
Salary increase +1%
Salary increase -1%
Valuation basis
Salary increase -1%
Salary increase -1%
2015 4,695 4,695 4,695 4,560 4,560 4,560
2016 4,910 4,911 4,909 4,499 4,500 4,498
2017 5,134 5,142 5,127 4,438 4,445 4,432
2018 5,365 5,381 5,350 4,376 4,389 4,363
2019 5,602 5,629 5,576 4,310 4,330 4,290
2020 5,851 5,891 5,813 4,247 4,275 4,219
2030 8,863 9,213 8,546 3,592 3,734 3,463
2040 12,057 13,034 11,218 2,729 2,950 2,539
2050 12,699 14,185 11,462 1,605 1,793 1,448
8.4 Salary increases have little impact on the outlays in the early years as the majority of the payments relate to members already retired. The impact increases in the later years, although this is dampened when discounting is included.
PSS and CSS Long Term Cost Report 2014 | 36

8.5 The table below shows the projected total PSS and CSS outlays for the next six years and then for the next three 10-year intervals under the valuation basis and the alternative assumptions for CPI increases.
Projected Total PSS and CSS Future Outlays
Year ending 30 June
Nominal Outlays($ millions)
Discounted Outlays($ millions)
Valuation basis
CPI increase +1%
CPI increase -1%
Valuation basis
CPI increase +1%
CPI increase -1%
2015 4,695 4,695 4,695 4,560 4,560 4,560
2016 4,910 4,956 4,863 4,499 4,542 4,456
2017 5,134 5,231 5,038 4,438 4,522 4,355
2018 5,365 5,515 5,218 4,376 4,498 4,255
2019 5,602 5,809 5,401 4,310 4,469 4,155
2020 5,851 6,118 5,594 4,247 4,440 4,060
2030 8,863 9,971 7,882 3,592 4,041 3,194
2040 12,057 14,314 10,189 2,729 3,239 2,306
2050 12,699 15,725 10,326 1,605 1,987 1,305
8.6 Adjustments to CPI have a larger impact in the short term than salary and discount rate as the outlays relate largely to pension payments. The pension is directly affected each year by the rate of CPI.
PSS and CSS Long Term Cost Report 2014 | 37
Demographic Assumptions8.7 The sensitivity of the estimated Unfunded Liability as at 30 June 2014 to
certain demographic assumptions was tested by measuring the effect on the Unfunded Liability of varying each assumption in turn whilst keeping all other assumptions unchanged. The alternative assumptions used were:
PSS Pension Take-Up Rate
Increasing the proportion of PSS members who elect a pension from 80% to 90%.
PSS Member Contribution Rate
Increasing the age-specific member contribution rates assumed by 0.5% of salary at each age.
Pensioner Mortality Improvements
Decreasing the rate of pensioner mortality improvement by applying the 100-year mortality improvement factors from the Australian Life Tables 2005 07 (ALT), from 1 July 2014, rather than applying the ALT 25-year mortality improvement factors for seven years and the 100-year mortality improvement factors thereafter.
Increasing the rate of pensioner mortality improvement by applying the ALT 25-year mortality improvement factors from 30 June 2014 onwards with no reversion to the 100-year factors.
PSS and CSS Long Term Cost Report 2014 | 38
8.8 The table below shows the Unfunded Liability of the PSS and CSS at 30 June 2014 under each of the above alternative assumptions.
Unfunded Liability
Sensitivity of Unfunded Liability to Key Demographic Assumptions
Assumption PSS($ billions)
CSS($ billions)
Combined($ billions)
UFL Change UFL Change UFL Change
Valuation basis 46.9 62.9 109.8
PSS pension take up rate increased to 90% 48.8 +1.9 62.9 - 111.7 +1.9
PSS member contribution rates assumed increased by 0.5% of salary at each age
46.9 - 62.9 - 109.8 -*
Rates of pensioner mortality improvement
100-year 46.4 -0.5 62.2 -0.7 108.6 -1.2
25-year 48.1 +1.2 63.7 +0.8 111.8 +2.0
-1% 40.5 -6.4 57.2 -5.8 97.7 -12.1
* Any increases to the assumed PSS member contribution rates do not affect unfunded liabilities accrued to date, but will affect future benefit accruals and projected outlays (see Section 8.8 for sensitivity results on projected outlays).
PSS and CSS Long Term Cost Report 2014 | 39

Total Projected Outlays8.9 The table below shows the projected total PSS and CSS outlays for the next six
years and then for the next three 10-year intervals under the valuation basis and the alternative assumptions for PSS pension take up rate and PSS member contribution rates.
Projected Total PSS and CSS Future Outlays
Year ending 30 June
Nominal Outlays($ millions)
Discounted Outlays($ millions)
Valuation basis
PSS 90% pension take up
PSS member contribution rate + 0.5% of salary
Valuation basis
PSS 90% pension take up
PSS member contribution rate + 0.5% of salary
2015 4,695 4,566 4,712 4,560 4,435 4,576
2016 4,910 4,778 4,925 4,499 4,378 4,513
2017 5,134 5,002 5,149 4,438 4,324 4,451
2018 5,365 5,233 5,379 4,376 4,268 4,386
2019 5,602 5,472 5,615 4,310 4,210 4,320
2020 5,851 5,726 5,863 4,247 4,156 4,255
2030 8,863 8,926 8,886 3,592 3,618 3,601
2040 12,057 12,670 12,138 2,729 2,867 2,747
2050 12,699 13,865 12,850 1,605 1,752 1,624
8.10 The projected outlays for the next six years assuming PSS pension take up rate of 90% are lower than those under the valuation basis (assuming 80% PSS pension take up). The reductions are a result of lower projected lump sum benefit payments due to higher pension take up rate. This is offset in the longer term by increases to the amount of annual pension payments.
8.11 Increasing the member contribution rates progressively increases the outlays as higher benefits are accrued over time.
PSS and CSS Long Term Cost Report 2014 | 40

8.12 The table below shows the projected total PSS and CSS outlays for the next six years and then for the next three 10-year intervals under the valuation basis and the alternative assumptions for pensioner mortality improvements.
Projected Total PSS and CSS Future Outlays
Year ending 30 June
Nominal Outlays($ millions)
Discounted Outlays($ millions)
Valuation basis
ALT 100-year
ALT 25-year
Valuation basis
ALT 100-year
ALT 25-year
2015 4,695 4,695 4,695 4,560 4,560 4,560
2016 4,910 4,909 4,910 4,499 4,498 4,499
2017 5,134 5,133 5,134 4,438 4,437 4,438
2018 5,365 5,362 5,366 4,376 4,373 4,376
2019 5,602 5,596 5,602 4,310 4,305 4,310
2020 5,851 5,841 5,851 4,247 4,239 4,247
2030 8,863 8,785 8,904 3,592 3,560 3,609
2040 12,057 11,878 12,324 2,729 2,688 2,789
2050 12,699 12,444 13,363 1,605 1,573 1,689
PSS and CSS Long Term Cost Report 2014 | 41
8.13 The impact of adjustments to mortality have greater impact over long time horizons as it takes time to flow through into the payments.
8.14 Please note that the above sensitivity scenarios are illustrations only, and show what may occur under assumed future experiences which differ from assumptions. These scenarios do not constitute upper or lower bounds and the actual future unfunded liabilities and outlays may differ significantly from the range shown above, depending on actual future experience.
Richard Boyfield
FIAA
Partner, Mercer
Peer Reviewed by:
David Knox
FIAA
Senior Partner, Mercer
24 June 2015
PSS and CSS Long Term Cost Report 2014 | 42

Appendix A: Summary of Benefit Provisions
THE SUPERANNUATION ACT 1990 (PSS)
Membership
The PSS was closed to new entrants from 1 July 2005.
Superannuation Salary
Generally, superannuation salary is basic salary plus any recognised allowances. Superannuation salary is the salary on commencement subject to adjustment on each birthday.
Final Average Salary
Final Average Salary (FAS) is generally the average superannuation salary on the three birthdays before leaving the PSS.
Member Contributions
Members can choose to contribute at any rate between 2% and 10% of superannuation salary. Members can also choose not to contribute to the PSS. The rate of contribution can be varied at any time.
Benefits
The benefits from the PSS consist of three parts
the employer-financed component is determined as the Total Benefit net of the productivity and member component. This component is an untaxed benefit.
the productivity component is made up of accumulated productivity contributions. This is a "taxed benefit". Any unfunded productivity component is an “untaxed benefit”.
the member-financed component is made up of accumulated member contributions. The investment earnings are a "taxed benefit.
PSS and CSS Long Term Cost Report 2014 | 43

Total Benefit
A member's Total Benefit is calculated by multiplying the member's Benefit Multiple by his or her FAS. A member's Benefit Multiple increases with each contribution made. The Benefit Multiple consists of the Member's share and the Employer's share.
Total Benefit Multiple = Member's share of Benefit Multiple + Employer's share of Benefit Multiple.
Member's share of Benefit Multiple = Member Contribution Rate (per year of service).
Employer's share of Benefit Multiple = Member Contribution Rate + 0.11 (per year of service).
10 year Rule – Restriction on Employer's Share of Benefit Multiple
Employer's share of Benefit Multiple cannot be greater than that which would have accrued if member contributions had been made at 5% for 10 years (or total membership if less) and 10% for any membership in excess of that 10 years.
On death or disablement the 5% maximum average applies to prospective service until the 10-year period is notionally completed.
Maximum Benefit
The maximum benefit allowable under the PSS is known as the Maximum Benefit Limit (MBL). For most members the MBL is 10 times the member’s Final Average Salary. On reaching the MBL, a member will cease contributing to the scheme.
Retirement Benefits
Retirement benefits are payable upon retirement on or after minimum retiring age (usually age 55), subject to general superannuation preservation rules.
The four options on retirement are as follows:
Total pension – The benefits can be taken in the form of a total pension.
Lump sum benefit – The three benefit components can be taken as a lump sum.
Lump sum plus pension benefit – The benefits can be taken as a pension (subject to a minimum of 50% of the total benefit) and a lump sum.
Preserve total benefit – The total benefit can be preserved in the PSS and later taken as a lump sum, indexed pension or a combination of both.
While a benefit is being preserved in the PSS, member and productivity components are increased at the Scheme allocation rate and the employer-financed component is adjusted annually in accordance with changes in the CPI.
PSS and CSS Long Term Cost Report 2014 | 44

Invalidity Retirement
The following benefit choices are available on retirement on medical grounds:
Invalidity pension with no lump sum – This option provides for the payment of the three benefit components as an indexed pension. Under this option, the total benefit is calculated based on potential service to age 60 (assuming that the member will continue to contribute at their rate at retirement or 5% if more, but subject to a maximum average contribution of 5% for the first 10 years of service, actual or potential).
The total benefit is converted to an indexed pension using the same factors used to convert a lump sum to a pension on age retirement but assuming that the member is aged 60 at the time of invalidity retirement.
Invalidity pension with a lump sum – Under this option, the member component can be taken as a lump sum. The remainder must be taken as an indexed pension.
The total benefit is calculated based on potential service to age 60 and the amount in excess of the member component is converted to an indexed pension.
Death of a Contributor Full pension with no lump sum –
A pension payable at the rate of 67% of the invalidity pension that would have been payable to the deceased plus 11% of the invalidity pension for each eligible child (until age 16 or if a full-time student, until age 25) with total pension limited to 100% of the invalidity pension.
Part pension and part lump
The spouse can convert up to half of the pension to a lump sum. The lump sum value of any children's pensions for children not living with the spouse is deducted from the lump sum. The benefits for the children are paid as a pension.
Maximum lump sum and no pension This allows the spouse to take the benefit wholly as a lump sum except for the lump sum value of any pension payable to children who are not living with the spouse.
Death of a Pensioner
Pension payable based on the percentages that apply in respect of the death of a contributor, but using the pension payable to the deceased at the time of death. Therefore, if the retirement benefit was taken wholly as a lump sum then no further benefit is payable to the spouse or children.
PSS and CSS Long Term Cost Report 2014 | 45
Resignation
The three benefit options are as follows:
Preserve all benefits in the PSS.
Immediate refund of member-financed benefit and preserve all employer-financed benefits in the PSS. Note that due to general superannuation preservation rules and the Scheme Rules under most circumstances all post 1 July 1999 contributions will be preserved within the scheme.
Transfer all benefits to an eligible superannuation scheme.
Redundancy
On redundancy, a PSS member has the option of:
a. taking his/her personal contributions and interest in cash, up to the limit allowed under general superannuation preservation rules, and preserving the rest of the benefit in the PSS; or
b. preserving the whole of the benefit in the PSS; or
c. transferring his/her benefit to another complying superannuation scheme; or
d. transferring his/her benefit to an eligible superannuation scheme; or
e. taking his/her personal contributions and interest in cash, up to the limit allowed under general superannuation preservation rules, and taking the rest of the benefit as an immediate, non-commutable, indexed pension; or
f. taking the whole benefit in the form of an immediate, non-commutable, indexed pension that has reference to a person’s age.
Indexation
Pensions are indexed twice yearly in line with changes in the Consumer Price Index
PSS and CSS Long Term Cost Report 2014 | 46

THE SUPERANNUATION ACT 1976 (CSS
Membership
The CSS has been closed to new entrants since 1 July 1990.
Salary
The salary used for contribution purposes is, in most cases, the annual rate of salary. Generally, the annual rate of salary is basic salary plus any recognised allowances on a member’s last birthday.
Final Salary
The salary used for calculating benefits is, in most cases, the annual rate of salary on a member's date of exit.
Member Contributions
Basic contributions are 5% of salary. Supplementary contributions of up to a further 5% may be made. Contributions are accumulated with interest based on the crediting rates of the CSS. Members can also choose not to contribute to the CSS. Any period where the member does not contribute does not count towards their contributory service.
Retirement Benefits
Retirement benefits are payable upon retirement at maximum retirement age (usually age 65) or early retirement at ages 55 or above.
The amount of retirement benefit is the sum of:
employer-financed indexed pension being a percentage of final salary based onthe period of contributory service and discounted for early retirement before age 65;
productivity component made up of accumulated productivity contributions or if a member elects can be taken as a non-indexed pension; and
member-financed benefit made up of accumulated basic and supplementarycontributions or an equivalent non-indexed pension.
PSS and CSS Long Term Cost Report 2014 | 47

Employer-financed indexed pension
The employer-financed pension is calculated as a percentage of final salary based on the period of contributory service and discounted for early retirement before age 65.
The discount factors for retirement prior to age 65 are age-dependent. They reduce at the rate of 0.02 per year from 1 at age 65 to 0.90 at age 60 and then at the rate of 0.03 per year to 0.75 at age 55.
The accrual rates are based on years of contributory service and on whether the member:
transferred from the 1922 Scheme (the scheme established under the Superannuation Act 1922) to the CSS;
transferred from a former Provident Account; or
joined the CSS after 30 June 1976.
Generally, the accrual rates are 2% per annum for the first 20 years of active membership, 1% per annum for the next 10 years, and 0.25% per annum for each of the next 10 years. The maximum percentage is 52.5% of salary.
Invalidity Retirement
The following benefits are payable on invalidity retirement:
an employer-financed indexed pension being a percentage of final salary basedon the period of prospective service to maximum retirement age (usually 65).
a lump sum of accumulated basic contributions or an additional non-indexed pension being a percentage of final salary based on the period of prospective service to maximum retirement age (usually age 65).
a lump sum of accumulated supplementary and productivity contributions.
Death of a Contributor
A pension payable at the rate of 67% of the invalidity pension that would have been payable to the deceased, plus 11% of the invalidity pension for each eligible child (until age 16 or if a full-time student, until age 25) with total pension limited to 100% of the invalidity pension.
The accumulated productivity contributions and any supplementary contributions are also payable.
Death of a Pensioner
A pension payable based on the percentages that apply in respect of the death of a contributor, but using the pension payable to the deceased at the time of death.
PSS and CSS Long Term Cost Report 2014 | 48

Resignation
A lump sum benefit of accumulated member and productivity contributions is payable on resignation. A minimum employer-financed benefit of the SG contributions, accumulated with investment earnings is payable.
Alternatively, the member may elect to receive a preserved benefit. Under this option, generally on reaching age 55 and having retired from the workforce, the member will receive the following:
an indexed pension based on 2.5 times the basic contributions accumulated to the date of payment converted to a pension;
productivity contributions accumulated to the date of payment or if the member elects can be taken as a non-indexed pension; and
member contributions (basic and supplementary) accumulated to the date of payment or an equivalent non-indexed pension.
Alternatively, the member can choose to take a transfer value of 3.5 times the accumulated basic contributions plus supplementary and productivity contributions, to an eligible superannuation scheme.
Redundancy
The benefit options available to a CSS member who is made redundant are similar combinations of pension (based on age) and lump sum as are available on age retirement.
In addition, the member may choose to preserve all benefits in the scheme, roll over the accrued benefit to a preservation fund if aged less than 55, or take the accrued benefit as a cash lump sum if aged 55 or more. For the purposes of rollover the accrued benefit is a lump sum of 2.5 times personal basic (5%) contributions together with all personal contributions and interest and any productivity contributions plus interest. Where the rollover is chosen the member may take their member contributions and interest in cash up to the limit allowed under the superannuation regulatory regime.
Indexation
Pensions are indexed twice yearly in line with changes in the Consumer Price Index. Pensions purchased with accumulated member contributions and productivity contributions are fixed in dollar terms and not subject to indexation.
PSS and CSS Long Term Cost Report 2014 | 49

Appendix B: Detailed Assumptions
Economic AssumptionsThe following table summarises the key economic assumptions adopted for this Report.
Item Assumption Item
CPI Increases 2.5% per annum CPI Increases
Investment Return / Discount Rate
6.0% per annum (nominal)3.5% per annum (real)
Investment Return / Discount Rate
General Salary Increases 4.0% per annum (nominal)1.5% per annum (real)
General Salary Increases
GDP Growth RateThe projected GDP for the 2014/2015 financial year is assumed to be $1,669 billion.
The table below reflects a sample of the expected nominal and real rates of GDP growth over the next 40 years (based on Department of Treasury estimates):
Year Rate per annum (nominal)
Rate per annum (real)
2014/2015 5.5% 3.0%
2015/2016 5.7% 3.2%
2019/2020 5.7% 3.2%
2024/2025 5.4% 2.9%
2029/2030 5.5% 3.0%
2034/2035 5.4% 2.9%
2039/2040 5.3% 2.8%
2044/2045 5.2% 2.7%
2049/2050 5.1% 2.6%
2054/2055 4.9% 2.4%
Note 1: The average assumed GDP growth rate over the 40-year period from 30 June 2014 is 5.4% (nominal) or 2.9% (real) per annum.
PSS and CSS Long Term Cost Report 2014 | 50

Taxation
Allowance has been made for 15% tax payable on superannuation productivity contributions.
Superannuation Guarantee
For the CSS, allowance has been made for increases in the Superannuation Guarantee rate from 9.5% to 12%. For the PSS, no allowance has been made for changes to the Superannuation Guarantee rate. Due to the generous nature of the scheme benefits, the increase in the Superannuation Guarantee rate does not have a material impact on the valuation results.
Demographic Assumptions
Promotional Salary Increase Assumptions
The following table shows examples of the annual assumed percentage increase in salary due to promotion (excluding general salary increases due to inflation).
Promotional Salary Increase Assumptions(% per annum at age shown)
Age Last Birthday Male Female
30 2.03% 1.65%
35 1.20% 0.90%
40 0.83% 0.75%
45 0.45% 0.56%
50 0.26% 0.49%
55 0.15% 0.36%
60 0.04% 0.11%
65 0.00% 0.00%
For example, a male aged 40 is assumed to have a promotional salary increase in the following year of 0.83% together with a general salary increase of 4.0%.
PSS and CSS Long Term Cost Report 2014 | 51

PSS Member Contribution RateIn the 2011 Report, it was assumed that PSS contributors at all ages would contribute at 6% of salary. For 2014, we have adopted age-based member contribution rates. The following table shows examples of assumed member contribution rates.
Age Last BirthdayMember Contribution Rate(% of Salary)
30 4.0
35 4.5
40 5.0
45 6.0
50 7.3
55 8.5
60 8.5
65 8.5
PSS and CSS Long Term Cost Report 2014 | 52
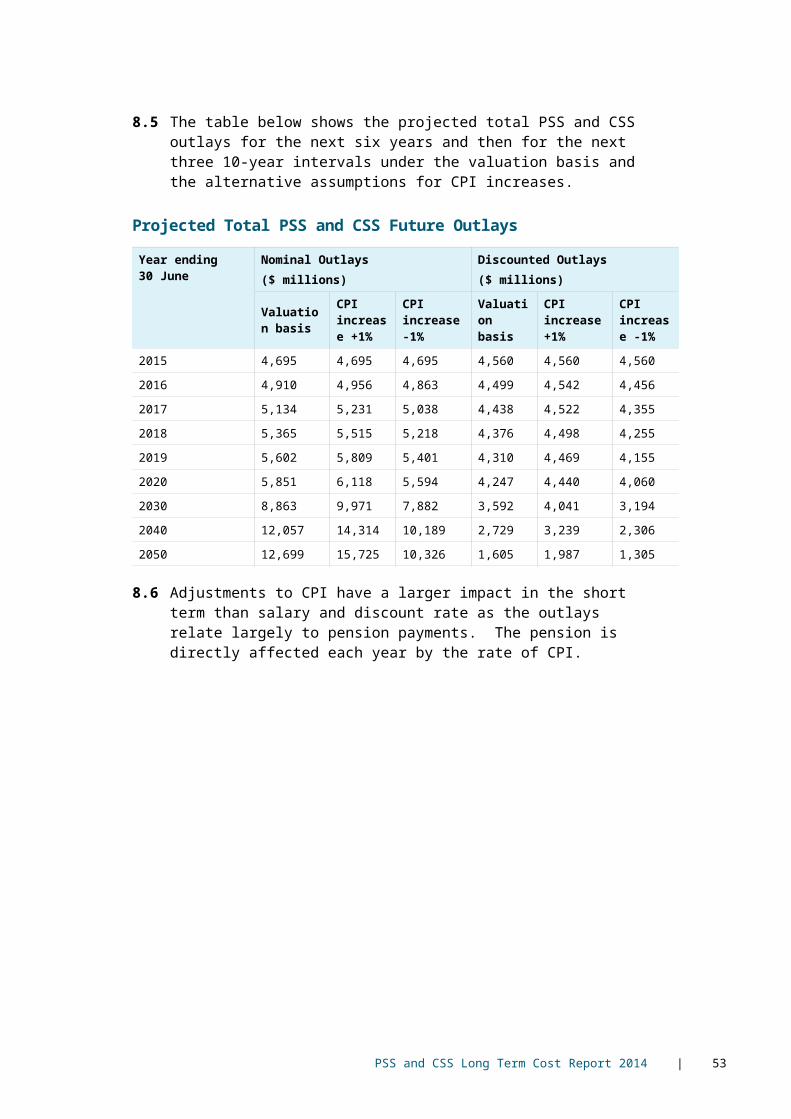
Contributors exits by Age Retirement
Age Retirement Assumptions – Contributors(per 1,000 at age shown)
Age Last Birthday
PSS CSS
Males Females Males Females
55 70 80 75 110
56 55 70 45 40
57 55 68 39 49
58 55 70 55 58
59 55 75 57 67
60 125 135 180 180
61 100 130 130 152
62 100 130 140 157
63 100 130 130 171
64 120 200 174 215
65 250 220 320 320
66 200 200 200 200
67 200 200 200 200
68 200 200 200 200
69 200 200 200 200
70 280 240 200 240
71 200 200 200 200
72 200 200 200 200
73 200 200 200 200
74 200 200 200 200
75 1,000 1,000 1,000 1,000
PSS and CSS Long Term Cost Report 2014 | 53

Contributors exits by Resignation
Resignation Assumptions – PSS Contributors (per 1,000 at age shown)
Age Last Birthday
Males Females
Membership0 years
Membership10 years
Membership0 years
Membership10 years
30 132.0 39.9 97.6 39.8
35 116.1 35.1 86.0 35.1
40 95.4 28.8 82.0 33.5
45 81.1 24.5 67.8 27.6
50 70.5 21.3 65.9 26.9
Factor* 0.86 0.92 0.89 0.95
Resignation Assumptions – CSS contributors age less than 54(per 1,000 at age shown)
Age Last Birthday
Males Females
Membership0 years
Membership10 years
Membership0 years
Membership10 years
30 71.5 35.5 49.3 43.3
35 70.3 30.8 47.1 36.5
40 74.0 29.4 41.1 30.2
45 74.9 28.7 33.0 24.4
50 81.7 31.2 30.1 23.2
Factor* 0.88 0.91 0.90 0.95
*The factors are used to determine the resignation rates for each age for membership periods other than 0 and 10.
For year “y” between membership years 1 to 9, the resignation rate equals to membership 0 resignation rate x membership 0 factor raised to the power of y.
For membership year 11 onwards, the resignation rate equals to membership 10 resignation rate x membership 10 factor raised to the power of minimum of (y-10) or 15 years.
PSS and CSS Long Term Cost Report 2014 | 54

Resignation Assumptions – CSS contributors age 54(per 1,000 at age shown)
Age Last Birthday Males Females
54 400 400
Contributors exits by Redundancy
Redundancy Assumptions – Contributors (per 1,000 at age shown)
Age Last Birthday
PSS CSS
Male Female Male Female
30 5.2 7.4 29.6 18.7
35 7.5 9.1 16.9 11.1
40 9.6 9.0 15.3 9.5
45 12.6 9.1 15.3 11.9
50 17.4 11.1 27.8 19.0
55 26.1 22.3 67.8 36.7
60 42.9 31.0 96.8 55.1
Contributors exits by Death and Invalidity
Death and Invalidity Assumptions – Contributors(per 1,000 at age shown)
Age Last Birthday
PSS and CSS Deaths PSS Invalidities CSS Invalidities
Males Females Males Females Males Females
30 0.30 0.14 0.27 0.38 0.32 0.32
35 0.38 0.20 0.53 0.82 0.57 0.61
40 0.47 0.26 0.86 1.42 0.79 1.03
45 0.63 0.41 1.74 2.12 1.27 1.64
50 0.88 0.62 3.32 2.98 1.94 2.55
55 1.24 1.06 5.10 5.76 3.05 4.26
60 1.83 1.73 - 6.68 6.01 6.46
65 2.74 2.69 - - - -
70 4.11 4.50 - - - -
PSS and CSS Long Term Cost Report 2014 | 55

Preservation on resignation or redundancy
Members are generally required to retain their employer-financed benefits within the schemes. Members who join the PSS after 1 July 1999 are required to retain all their benefits within the scheme. For members who joined the PSS before 1 July 1999 the member-financed benefits may be taken as a lump sum on termination of service (subject to general preservation rules) or retained within the scheme. CSS members who elect not to retain their member financed benefit within the CSS on termination of service forfeit a significant part of their employer-financed benefit.
Members who are made redundant are eligible to be paid benefits immediately and they therefore have a different pattern of preservation from members under resignation.
Rate of Preservation Resignation Redundancy
PSS pre-1 July 1999 members 80% 40%
PSS post-1 July 1999 members 100% 40%
CSS 100% 70%
PSS and CSS Long Term Cost Report 2014 | 56

Rates of Pension Take-up
It has been assumed for the PSS that 80% of lump sum entitlements of age retirees and spouses of deceased contributors and 80% of the lump sum entitlements of members, who resign and preserve their entire benefit, will be converted to pensions. Invalid retirees must take a pension and members who do not preserve their member accumulations on resignation cannot take a pension.
Generally in the CSS, the employer component of the benefit must be taken as a pension. Members then have the option to convert the funded benefits to a non-indexed pension. It has been assumed that 100% of the employer component is taken as a pension.
We have also assumed that 30% of the funded benefits will be converted to a non-indexed pension. However, this is limited by the upper cap taking into account individual members’ details.
PSS Members Election to Cease PSS Membership in Order to Join PSSap
No PSS members are assumed to exercise this option.
Preserved member exits by Age Retirement
Age Retirement Assumptions – Preserved Members(per 1,000 at age shown)
Age Last Birthday
PSS CSS
Males Females Males Females
55 145 200 740 740
56 50 60 170 160
57 50 60 160 150
58 50 55 170 140
59 50 55 170 120
60 130 145 315 270
61 75 85 230 200
62 82 85 230 200
63 95 100 250 200
64 150 150 280 300
65 1,000 1,000 1,000 1,000
PSS and CSS Long Term Cost Report 2014 | 57
Preserved member exits by Death and Invalidity
Death and Invalidity Assumptions – Preserved Members(per 1,000 at age shown)
Age Last Birthday
PSS and CSS Deaths PSS Invalidities CSS Invalidities
Males Females Males Females Males Females
30 0.30 0.14 0.05 0.06 0.10 0.10
35 0.38 0.20 0.11 0.12 0.17 0.18
40 0.47 0.26 0.17 0.21 0.24 0.31
45 0.63 0.41 0.35 0.32 0.38 0.49
50 0.88 0.62 0.66 0.45 0.58 0.77
55 1.24 1.06 1.02 0.86 0.92 1.28
60 1.83 1.73 - 1.00 1.80 1.94
Pensioner Mortality
The table below shows the mortality rates assumed for age retired and dependant pensioners in the year 1 July 2014 to 30 June 2015.
Age Retirement Pensioner Mortality (per 1,000 at age shown)
Age Last Birthday
Males Females
Age Retired Widower Age Retired Widower
20 0.35 0.74 0.18 0.24
30 0.53 1.11 0.23 0.32
40 0.62 1.28 0.44 0.59
50 1.07 2.40 0.96 1.42
55 1.79 3.95 1.57 2.31
60 2.84 6.66 2.24 3.56
65 5.13 11.45 3.68 5.56
70 9.75 20.16 6.89 9.30
75 18.71 32.91 12.50 15.98
80 38.19 56.47 24.42 30.13
85 77.39 99.62 50.69 60.15
90 142.91 161.77 102.25 110.21
95 249.01 244.17 176.83 193.21
100 419.08 358.79 313.35 338.67
Child pensioners are assumed to leave at age 25 with no decrement applied prior to age 25.
PSS and CSS Long Term Cost Report 2014 | 58

The table below shows the mortality rates assumed for invalidity pensioners with duration less than 3 years. The duration refers to the time since the member became an invalid pensioner.
Invalidity Pensioner Mortality (per 1,000 at duration shown)
Duration (Years) Males Females
0 – 1 86.45 43.70
1 – 2 42.75 24.70
2 – 3 28.50 23.75
The table below shows the mortality rates assumed for invalidity pensioners in the year 1 July 2014 to 30 June 2015.
Invalidity Pensioner Mortality – Duration Greater than 3 Years(per 1,000 at age shown)
Age Last Birthday Males Females
20 0.65 0.37
30 0.92 0.50
40 1.15 0.92
50 2.02 2.05
55 3.21 3.50
60 5.75 5.72
65 10.76 9.43
70 18.75 15.90
75 31.11 26.08
80 56.15 42.08
85 101.35 79.59
90 159.21 145.24
95 244.17 216.37
100 358.79 356.50
Pensioner Mortality Improvement Factors
Improvements in mortality for all pensioners except invalidity pensioners with duration less than three years and child pensioners will be based on the improvement factors from Australian Life Tables 2005-07. The 25-year improvement factors will be applied for the year 2014 to 2021, and the 100-year improvement factors will be applied thereafter.
PSS and CSS Long Term Cost Report 2014 | 59

Assumed Rates of Mortality Reduction (% per annum)
AgeLast Birthday
Short Term(1 July 2014 to 30 June 2021)
Long Term(1 July 2021 onwards)
Male Female Male Female
60 3.34 2.52 1.27 1.47
70 3.08 2.45 1.16 1.44
80 2.21 2.07 0.87 1.12
90 1.07 1.04 0.53 0.61
100 0.51 0.47 0.26 0.25
For example, for the projection year from 1 July 2022, a male age retirement pensioner aged 60 would have an improved mortality rate equal to the base mortality rate of 2.84 (per 1000 population) at 1 July 2014 improved for 8 years from 1 July 2014, 7 years of improvement based on short term improvement factor of 3.34% pa and 1 year of improvement based on long term improvement factor of 1.27% pa. This leads to a mortality rate of 2.21 = 2.84 x (1-3.34%)7 x (1-1.27%).
The following table shows the projected life expectancies of retirement pensioners aged 65 under the pensioner mortality and mortality improvement assumptions adopted for this Report. The projected life expectancies calculated under assumptions adopted for the 2011 Report are also included for comparison.
Projected life expectancy for a retirement pensioner aged 65
Sex At valuation date In 20 years’ time
2014 assumptions
2011 assumptions
2014 assumptions
2011 assumptions
Male 22.73 21.84 23.85 23.06
Female 25.48 24.40 26.67 25.66
New Entrants
The PSS has been closed to new members since 1 July 2005. The CSS has been closed to new members since 1 July 1990. This Report assumes that there are no future new entrants to either the PSS or CSS.
Proportion Married
It has been assumed that the proportion of males who are in a Marital or Couple Relationship at 30 June 2014 (or at the commencement date of their pension if later) will gradually increase with age to 60% at age 42; remain constant to age 69; increase to 75% for ages 70 to 72 and then reduce.
It has been assumed that the proportion of females who are in a Marital or Couple Relationship at 30 June 2014 (or at the commencement date of their pension if later) will gradually increase with age to 44% at age 27; remain constant to age 62; and then reduce.
It has been assumed that 1% of males and females are in same sex relationships.
PSS and CSS Long Term Cost Report 2014 | 60

Age Gap between Member and Spouse
It is assumed that male members are 3 years older than their spouses, and that female members are 2 years younger than their spouses.
PSS and CSS Long Term Cost Report 2014 | 61

Appendix C: Actuary’s Certification
This Report has been carried out by Richard Boyfield FIAA FIA and Roger Bohlsen FIAA, of Mercer Consulting (Australia) Pty Limited at the request of the Department of Finance.
Martin Stevenson and Darren Wickham carried out the previous actuarial investigation of the schemes as at 30 June 2011. The results of that investigation were set out in the 2011 Report.
This Report satisfies the requirements of Professional Standard No. 400 of Actuaries Institute. Professional Standard No. 400 relates to the preparation of reports commenting on the financial condition of defined benefit superannuation funds.
Use of reportThis Report should not be relied upon for any other purpose or by any party other than the Department of Finance and the schemes’ trustee. Mercer is not responsible for the consequences of any other use. This Report should be considered in its entirety and not distributed in parts.
The advice contained in this Report is given in the context of Australian law and practice. No allowance has been made for taxation, accountancy or other requirements in any other country.
Actuarial Uncertainty and AssumptionsAn actuarial investigation report contains a snapshot of a scheme’s financial condition at a particular point in time, and projections of the scheme’s estimated future financial position based on certain assumptions. It does not provide certainty in relation to a scheme’s future financial condition or its ability to pay benefits in the future.
Future funding and actual costs relating to a scheme are primarily driven by the scheme’s benefit design, the actual rate of salary increases and any discretions exercised by the trustee of the scheme or the Australian Government. The scheme’s actuary does not directly control or influence any of these factors in the context of an actuarial investigation.
The schemes’ future financial position and the estimated long term cost depend on a number of factors, including the amount of benefits the scheme pays, the cause and timing of member withdrawals, the level of taxation and the amount earned on any assets invested to pay the benefits. These amounts and others are uncertain and unknowable at the valuation date, but are predicted to fall within a reasonable range of possibilities.
PSS and CSS Long Term Cost Report 2014 | 62

To prepare this Report, assumptions, as described in Section 4, are used to select a single scenario from the range of possibilities. The results of that single scenario are included in this Report.
However, the future is uncertain and the schemes’ actual experience may differ from those assumptions. These differences may be significant or immaterial. In addition, different assumptions or scenarios may also be within the reasonable range and results based on those assumptions would be different. For this reason this Report also shows the impact on the results of certain changes in assumptions (see Section 8).
Actuarial assumptions may also be changed from one valuation to the next because of mandated requirements, experience of the schemes, changes in expectations about the future and other factors. We did not perform, and thus do not present, an analysis of the potential range of future possibilities and scenarios.
Because actual experience of the schemes may differ from the assumptions, decisions about benefit related issues should be made only after careful consideration of alternative future financial conditions and scenarios, and not solely on the basis of a set of valuation results.
If the data is not accurate and complete, the valuation results may differ significantly from the results that would be obtained with accurate and complete information; this may require a revision of this Report.
PSS and CSS Long Term Cost Report 2014 | 63