psad-76-56 causes of excessive profits on defense and ...psad-76-56 dec.3:!,1975 . comptroller...
TRANSCRIPT

BY THE COMPTROLLER OF THE UNITED STATES
~~~llllllllllllllllllllllllllllllllulullllllllll LM096869
Causes Of Excessive Profits On efense And Space Contracts
The Renegotiation Board
During the years 1970 through 1973, the Board- found- excessive profits- primarily at small contractors who produced relatively low-technology items and did most of their business with the Government. The contrac- tors’ average profit rates were 28 percent.on costs and 84 percent on capital and were made on negotiated as well as formally adver- tised contracts.
The profits were caused primarily by a seller’s market rather than poor procurement proce- dures.
Because good procurement procedures will not necessarily prevent excessive profits, re- negotiation is needed if the Congress intends to recover these profits.
PSAD-76-56 DEC.3:!,1975

COMPTROLLER GENERAL OF THE UNITED STATES
WASHINGTON. DC. 20548
B-163520
To the President of the Senate and the Cl Speaker of the House of Representatives f
This is our report entitled "Causes of Excessive Profits on Defense and Space Contracts." It represents part of our continuing work on the renegotiation process by the Renegotia- tion Board for excessive contractor profits.
tie made our review pursuant to the Budget and Accounting Act, 1921 (31 U.S.C. 53), and the Accounting and Auditing Act of 1950 (31 U.S.C. 67).
In May 1973 we also reported to the Congress on the Re- negotiation Board's activities and recommended improvements in its operations in our report entitled "The Operations and Activities of the Renegotiation Board" (B-163520). In that report we recommended that the Board give to procurement agen- cies its analyses of excessive profit determinations; however, that review did not inquire into the relationship between pro- curement policies, procedures, and excessive profits.
We made this review to determine the
--products and characteristics of contractors making excessive profits from fiscal years 1970 to 1973,
--profitability of those contractors,
--type of contracts where high profits were made., and
--relationship of procurement procedures to selected high-profit contracts.
We are sending copies of this report to the Chairman, Renegotiation Board: the Director, Office of Management and Budget: the Secretary of Defense; and the Administrator, Na- tional Aeronautics and Space
Comptroller General of the United States

.
Contents
/ DIGEST
Page
i
i CHAPTER i
1 INTRODUCTION
i General renegotiation procedures General DOD procurement provisions
and procedures
2 PROFILE OF CONTRACTORS MAKING EXCESSIVE PROFITS
Characteristics of contractors Dominant industries and products Sources of sales and profits Profitability of contractors Use of Government-furnished capital Profit rate comparisons--industry
averages and nonrenegotiable business
Conclusions
3 RELATIONSHIP BETWEEN HIGH PROFITS AND PROCUREMENT PROCEDURES
Differences between renegotiation and defense procurement
Causes of high profits--statutory factors analyses
Causes of high profits--selected con- tractors and awards
Characteristics of contracts Procurement procedures--selected awards Conclusions
4 COORDINATION SETWEELL' 'TkiE BOARD AND PROCURE- MENT ACTIVITIES
Extent of coordination Potential uses of the RB-1 Conclusions Recommendation Agency comments and GAO evaluation
SCOPE OF REVIEW
APPENDIX
I Letter dated September 29, 1975, from the Renegotiation Board
1 2
4
5 6 7 7
10 12
12 13
15
15
15
16 17 21 25
27 27 29 30 31 31
33
34
Page
APPENDIX
II
III
IV
ASPR
DCAA
DOD
DPSC
GAO
NASA
Letter dated September 30, 1975, from the National Aeronautics and Space Administration
Letter dated October 6, 1975, from the Assistant Secretary of Defense (Installations and Logistics)
Principal officials of the Renegotiation Board responsible for administration of the matters discussed in this report.
ABBREVIATIONS
Armed Services Procurement Regulation
Defense Contract Audit Agency
Department of Defense
Defense Personnel Support Center
General Accounting Office
National Aeronautics and Space Administration
36 ‘-
38 i
40

COMPTROLLER GENERAL'S REPORT TO THE CONGRESS
CAUSES OF EXCESSIVE PROFITS ON DEFENSE AND SYALZ CONTRACTS Renegotiation Board
DIGEST - - - - - -- I The Renegotiation Board was established in 4. ;7T/ / 1951 to eliminate contractors' excessive prof-
its on defense and space contracts and re- lated subcontracts. From its inception, through June 30, 1974, the Board made 4,572 determinations of excessive profits, totaling over $1,233 billion.
GAO looked at the Board's determinations of excessive profits during fiscal years 1970-73 and developed the following.
The contractors
Most of the 526 contractors against which the Board made determinations were prime contrac- tors which had annual sales under $10 million and which did most of their business with the Government. (See p. 5.)
Their average profit rates on renegotiable business was 28 percent on costs (ranging from 3 to 652 percent) and 84 percent on capital (ranging from 15 to 1,629 percent). (See p. 11.)
Many of the 526 contractors made relatively low-technology items of military apparel or ordnance and used Government-furnished facili- ties or material. (See p0 7.)
The contracts -- -------- ---- -
Contracts resulting in excess profits were negotiated, as well as formally advertised. The required *price or cost analyses were made before the contracts were negotiated. In addition, some contracts were awarded as formally advertised contracts although com- petition was limited. (See p. 23.)
Tear Sheet. Upon removal, the report cover date should be noted hereon.
PSAD-76-56

What caused excessive profits? _-___ _..-^_-- - ___- - - -- ---- -.-- .---
Most excessive profits were caused by a seller's market which lessened competition and let prices increase. When contractors" volume rose I frequently unit production costs were reduced and profits were in- creased. (See p. 25.1
Excessive profits were not caused to any great extent by inadequate procurement pro- cedures or poor implementation of procedures by Government procurement officials. (See p. 25.)
Implementation of good procurement procedures will not necessarily prevent excessive prof- its. Renegotiation is needed as long as the Congress intends to recover excessive profits on procurements for national defense. (See pe 26.)
Information available at the Board on con- tractors could be useful to procurement officials in
--assessing the reasonableness of contrac- tors' prices,
--analyzing contractors‘ proposed costs,
--supporting procurement decisions, and
--selecting contracts for review for possible violations of the Truth-in-Negotiations Act. (See p. 29.)
.
GAO recommends that the Board provide procure- ment and Defense Contract Audit Agency person- nel with contractor data to be used for these purposes. (See p- 31.)
ii

CHAPTER 1 - -
INTRODUCTION
The Renegotiation Act of 1951 (50 1J.S.C. App. 1211, 65 Stat. 7, as amended) was enacted to eliminate contractors' excessive profits on defense and space contracts and related subcontracts. The Renegotiation Boardp an independent agency, was created to administer that act. The actp which has been
I extended 12 times, will expire on December 31, 1975, unless further extended.
In a previous report to the Congress entitled "The Opera- tions and Activities of the Renegotiation Board" (B-163520, May 9, 1973), GAO reported on the Board's activities and made recommendations for improving its operations.
Since one of our recommendations urged the Board to con- sider forwarding to procurement activities data on the Board's analyses of excessive profit determinations (hereinafter referred to as determinations), we did not ascertain at that time whether a relationship existed between excessive profits and the procurement policies and procedures used in awarding' the contracts which generated those profits. Critics of re- negotiation have argued that the experience gained by the various procurement agencies and the development and imple- mentation of new pricing techniques preclude excessive profits and thus the need for renegotiation.
We made this review to determine
--the productlline and other characteristics of those contractors found to have made excessive profits in fiscal years 1970-73,
--the profitability of those contractors,
--the type of contracts on which high profits were made, and
--the procurement procedures used in awarding a selected number of high-profit contracts and whether those pro- cedures caused the high profits.
lAs used in the report, unless otherwise specified, the term "contractor" refers to prime contractors and subcontractors and the term "contract" refers to prime contracts and sub- contracts.

We also wanted to learn whether information available at the ..^ Board regarding high-profit contractors could be useful to Government officials involved in the procurement process,
GENERAL RENEGOTIATION PROCEDURES
In renegotiation the Government, acting through the Board, requires contractors and agents or brokers to refund those portions of profits on defense, space, and certain civilian agency contracts and related subcontracts which are determined to be excessive.l The Board has a headquarters I office, known as the Statutory Board, in Washington, D.C., and two field offices: the Eastern Regional Board, in Wash- ington, D.C., and the Western Regional Board, in Los Angeles, California.
A contractor whose total renegotiable sales in its fiscal year exceed $1 million (statutory floor) must file a report with the Statutory Board.2 A broker or agent must also file with the Statutory Board when commissions on renegotiable sales exceed $25,000 (statutory floor) in a fiscal year.
1Under the act, renegotiation currently applies to contracts and related subcontracts with the Department of Defense, Department of the Army, Department of the Navy, Department of the Air Force, the Maritime Administration, the Federal Maritime Boardl the General Services Administration, the National Aeronautics and Space Administration, the Energy Research and Development Administration, and the Federal Aviation Administration. Due to numerous exemptions contained in the act, the Department of Defense, the military depart- ments, and the National Aeronautics and Space Administration account for nearly all contracts and related subcontracts subject to renegotiation.
2In determining whether to file, a contractor with a fiscal period of less than 12 months must prorate the $1 million statutory floor over the actual number of months in its fiscal period. Similarly, a group of contractors under com- mon control must aggregate renegotiable sales of the entire group and eliminate intergroup receipts and accruals before , applying the floor, even though each group member actually files and renegotiation is administered on an individual- contractor basis. As a consequence of these provisions, the Board's excessive profit determinations have included con- tractors whose total renegotiable sales are below $1 million.
2

The contractor or agent reports renegotiable sales, costs, and profits in aggregate for the reporting period. Determina- tions of-excessive profits are made on the oasis of tnese aggregate amounts and not on the basis of individual contracts.
After the Statutory Board receives the Standard Form of Contractor's Report for Renegotiation (RB form l), referred to as a filing, it makes a cursory review to determine whether the data is complete and accurate and screens out those con- tractors whose profits are obviously not excessive. In such cases, the Statutory Board sends clearance notices to the contractors. If, however, there is a reasonable possibility of excessive profits, the Statutory Board assigns the filing to a regional board for full-scale renegotiation.
The act and its implementing regulations provide that, in determining excessive profits, the Board consider the contractor's efficiency in attaining quantity and quality production, cost reduction, and economy. In addition, the Board is required to consider the following.
--Reasonableness of costs and profits with partic- ular regard to volume of production, normal earnings, and comparison of wartime and peace- time products.
--Net worth with particular regard to the amounts and sources of public and private capital used.
--Extent of risk assumed, including the risk inci- dent to reasonable pricing policies.
--Nature and extent of contribution to the defense effort, including inventive and developmental contribution and cooperation with the Govern- ment and contractors in supplying technical assistance.
--Character of business, including source and nature of materials, complexity of manufactur- ing technique, character and extent of subcon- tracting, and rate of turnover.
--Such other factors which the public interest and fair and equitable dealing may require to be considered and which shall be published in the Board's regulations.
BEST DOCUMENTAVAl
3

I
GENERAL DOD PROCUREMENT I PROVISIONS AND PROCEDURES
The Armed Services Procurement Act of 1947 (10 U.S.C. 2301 et. seq.) is the basic law regulating Department of Defense's (DOD'S) procurement actions. The Armed Services Procurement Regulation (ASPR), which implements the require- ments of the act, sets forth DOD's procurement policies and procedures.
Formal advertising and negotiation are the basic methods I of procurement the Government uses. The act and ASPR require using formal advertising except when existing conditions and circumstances fall within 1 or more of 17 exemptions per- mitting the use of negotiation. Negotiation, rather than formal advertising, has accounted for the bulk of DOD's pro- curement dollars.
Procurement by formal advertising, when feasible, offers the best opportunity for full and free competition and should result in fair and reasonable prices. Suppliers are invited to submit firm bid prices for specified products or services. Following evaluation of the bids, the responsible contractor submitting the lowest responsive bid is awarded the contract.
Procurement by negotiation permits discussion of pro- posals and can be either competitive or noncompetive. For noncompetitive contracts and contract modifications expected to exceed $100,000, the Truth-in-Negotiations Act (Public Law 87-653) and ASPR provide that contractors be required, with certain exceptions, to submit cost or pricing data supporting proposed prices. Such data must be accurate, com- plete, and current, or the contractor getting the award is subject to a defective-pricing determination which can re- sult in a reduction to the contract price.
4

CHAPTER 2
PROFILE OF CONTRACTORS MAKING EXCCSSTVE ?ROFITS
In fiscal years 1970-73, the Board made 536 determina- tions of excessive profits, involving 526 contractors and 10 brokers or agents. The profits determined to be excessive totaled $167 million before deductions of credits for Federal income and excess profits taxes. The net amount of those determinations after deductions totaled $87 million.
We examined the 526 contractors found to have made excessive profits on renegotiable business, to identify any common characteristics and the major industry groups and product lines they represented. We also determined their average rates of return on sales, costs, and capital.1 We did not include the 10 excessive profit determinations made against brokers or agents in our examination.
We found that most of the contractors against which the_ Board made determinations in fiscal years 1970-73 were prime contractors which had total annual sales under $10 million and which did most of their business with the Government. Also the high profits were made primarily under firm fixed- price contracts. We found that the Board had allowed many contractors to retain rates of return on renegotiable busi- ness greater than the average rate of return for other firms within the same industry. It has not, however, generally allowed a contractor a rate of return on its renegotiable business greater than a particular firm realized on its nonrenegotiable business.
l-Although the Board is required to consider a contractor's net worth in determining excessive profits, we did not in- clude the rate of return on net worth in our examination of average profit rates. The rate of return on net worth depends, in part, on the contractor's decision to finance privately held assets with its own equity (net worth) or borrowed funds. Two contractors with identical profits can have very different rates of return on net worth simply because one relies on 'equity financing while the other relies on debt financing. From the standpoint of defense procurement, the method of financing privately held assets is not as important as the rate of return on total capital used.

CHARACTERISTICS OF CONTRACTORS
We reported to the Congress in our May 1973 report (p. 44) that the contractors making excessive profits were primarily small producers of relatively low-technology prod- ucts, such as military apparel and ordnance. We found this condition still existed and the following table summarizes the size characteristics of the contractors that had excessive profit determinations by the Board during fiscal years 1970- 73.
Size Characteristics of Contractors With Excessive Profits
Characteristics
Renegotiable profits: To $800,000 Over $800,000
Renegotiable sales to total sales: 0 to 50 percent 51 to 99 percent 100 percent
Total sales: (Government and commercial) Below $5 million . $5 to $10 million $10 to $25 million Over $25 million
Renegotiable sales: Below $5 million $5 to $10 million $10 to $25 million Over $25 million
Total capital (note a): Below $500,000 $500,000 to $1 million $1 to $5 million Over $5 million
Percent of 526 determinations
63 37
26 56 18
57 19 12 12
74 15
7 4
24 19 37 20
a/As used in this report and by the Board, contractors’ capi- tal refers to total assets used in contract work, excluding Government-furnished capital.
6

Most of the determinations involved contractors with total annual sales below $10 million (76 percent), renegoti- able sales below $5 million (74 percent), renegotiable profits below $800,000 (63 percent), and total capital below $5 million (80 percent). In 74 percent of the determinations the contractors did the bulk of their business with the Government and in 18 percent the contractors' entire sales were subject to renegotiation.
The 526 determinations included 416 different contractors. Excessive profits were made by
--86 contractors in 2 or more fiscal years,
--64 contractors in 2 fiscal years,
--20 contractors in 3 fiscal years, and
--2 contractors in all 4 fiscal years.
DOMINANT INDUSTRIES AND PRODUCTS
Although contractors fell within 23 major industry groups and produced 131 different product lines, the bulk of the determinations were represented by relatively few industries. The table on page 8 lists these industries and their major product lines and shows that 8 of the 23 industry groups accounted for 81 percent of the determinations.
Contractors in two industries of relatively low technologies --military apparel and ordnance--were most frequently found to have made excessive profits, represent- ing 27 percent of the determinations. Their prevalence resulted from Government needs created by the Southeast Asia conflict.
SOURCES OF SALES AND PROFITS
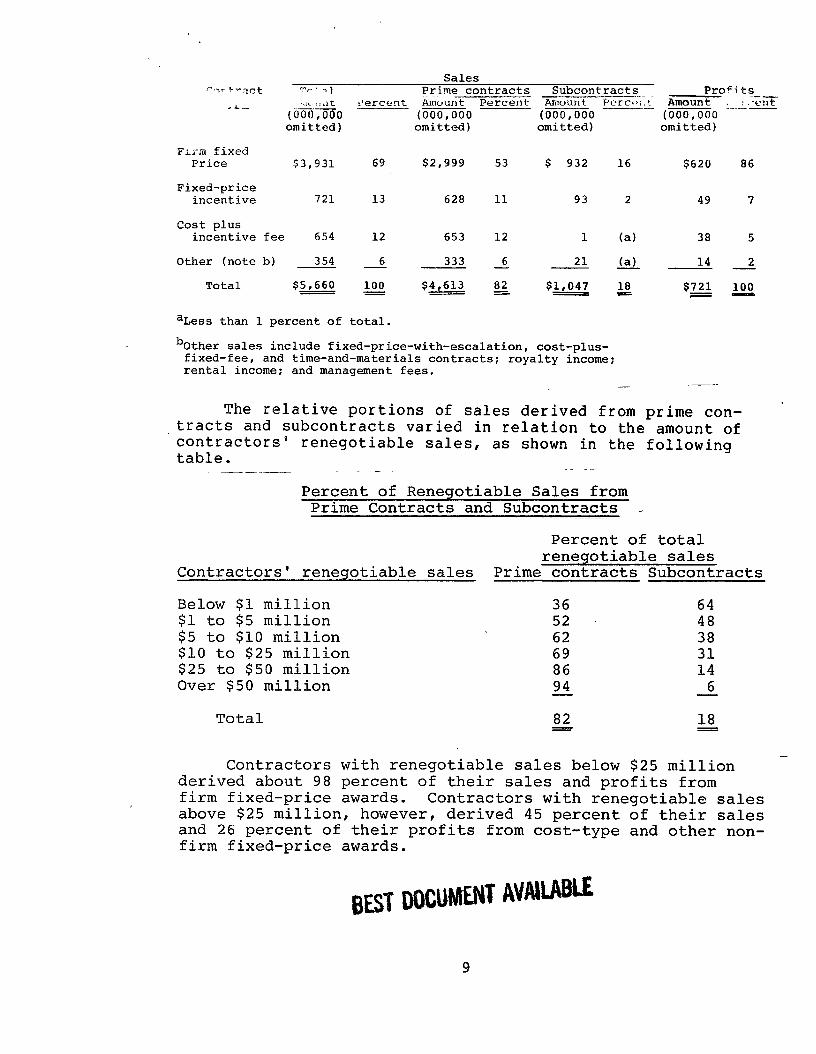
The table on page 9 shows the methods of pricing and the types of contracts which were the sources of Government sales and profits for contractors included in the determina- tions.
Firm fixed pricing was the principal method of pricing, accounting for 69 percent of total sales (53 percent prime contracts and 16 percent subcontracts) and 86 percent of total profits subjected to renegotiation. Prime contracts represented the bulk of sales, accounting for 82 percent of the total. z
T
7

Industry Groups and Product Lines Dominatinq Excessive Profit Determinations
During Fiscal Years 1970-73
Number cf Percent of 526 determinations determinations
Group and product line
Military apparel, miscellane- ous items 77
Ordnance, ammunition--except small arms 66
Nonelectrical machinery, mis- cellaneous items 60
Electrical electronic machin- ery, transmitting, and detecting devices and components 56
Fabricated metal products 51
Transportation and aircraft equipment, engines, and parts
Transportation services, aircraft fueling
Primary metal products
Other
Total
51 .
38
28
427
99
526 -
15
12
11
11
10
10
7
5
81
19
100 -
I i, .“I s
8
Sales i--l?- +-=-act. rn,' >I Prime contracts Subcontracts Profits
Amuunt Perceni Amount -.-_
aA.- ~.,i.s,‘lt 9ercrnt Pcrcf>i.r Amount ___- - I.-. : -GiX (000,000 (000,000 (000,000 (000,000 omitted) omitted) omitted) omitted)
Fx-m fixed Price $3,931 69 $2,999 53 $ 932 16 $620 86
Fixed-price incentive 721 13 628 11 93 2 49 7
cost plus incentive fee 654 12 653 12 1 (a) 38 5
Other (note b) 354 6 333 6 - - - - (a) -- 21 14 2
Total $5,660 100 - - $4,613 82 $1,047 18 - = $721 z
aLess than 1 percent of total.
bother sales include fixed-price-with-escalation, cost-plus- fixed-fee, and time-and-materials contracts; royalty income; rental income; and management fees.
__- -
The relative portions of sales derived from prime con- tracts and subcontracts varied in relation to the amount of contractors' renegotiable sales, table.,
as shown in the following
Percent of Renegotiable Sales from Prime Contracts and Subcontracts r
Percent of total renegotiable sales
Contractors' renegotiable sales Prime contracts Subcontracts
Below $1 million 36 64 $1 to $5 million 52 48 $5 to $10 million 62 38 $10 to $25 million 69 31 $25 to $50 million 86 14 Over $50 million 94 6 -
Total
Contractors with renegotiable sales below $25 million derived about 98 percent of their sales and profits from firm fixed-price awards. Contractors with renegotiable sales above $25 million, however, derived 45 percent of their sales and 26 percent of their profits from cost-type and other non- firm fixed-price awards.
BEST DDCUPMNT AVANABLE
9

PROFITABILITY OF CONTRACTORS
The following table summarizes the average rates of return for contractors before and after gross refunds1 of excessive profits. The contractors are categorized accord- ing to the amount of their sales subject to renegotiation. The table also shows the high and low rates of return and the average amount of profits refunded to the Government expressed as a percentage of renegotiable profits.
The table accentuates the predominance of small con- tractors among the determinations. More than 70 percent of the determinations involved contractors with renegotiable sales below $5 million; less than 4 percent involved con- tractors with renegotiable sales over $25 million. For reasons stated below, the Board rarely found the largest defense contractors to have made excessive profits.
The rates of return among the contractors revealed an inverse relationship; that is, the smaller -the -amount of sales subject to renegotiation, the greater the rates of return on sales, costs, and total capital used and the greater the proportional share of profits refunded to the Government through renegotiation. The lower rates of re- turns among the larger contractors are explained, in part, by an inherent feature of the renegotiation process. Specifically, since the Board is required to renegotiate a contractor's profits in the aggregate for a fiscal year rather than on an individual-contract basis, a large con- tractor with numerous contracts has greater opportunity to offset the high profits of certain contracts against the low profits or losses of others.
The contractors showed wide variations in their profit rates, particularly in rates of return on capital used for renegotiable sales. Contractors with renegotiable sales below $1 million were predominant among the extreme values of the various ranges and exhibited the most variability among all the contractors in rates of return on sales and capital. Contractors with renegotiable sales over $50 million showed the least variability in profit rates.
'The amount of excessive profits determination before adjust- ment for taxes measured.by Hao"me,.$ AL
i
10

Amount of Number renegotiable of
sales determinations
Below $1 million 68
$1 to $5 million 322
$5 to $10 million 78
$10 to $25 million 38
L $25 to $50 million 9
Over $50 million 11
Total 526 20 B =
Profit ranges High
Percent of contractors LOW
AVERAGE (MEAN) PERCEhiT RETURN ON RENEGOTIABLE SALES
Sales costs Total capital used Before After Before After Before After refund refund refund refund refund refund - G - - -,- -8
27
20
18
15
14
11 -
87
3
16
14
13
12
11
9 - 14 = 73
2
48
26
23
18
18
12 28 =
652
3
22 172 61
16 75 45
15 86 52
14 53 40
12 61 42
10 40 35 - -
16 85 48 = = =
275 1,629 353
2 15 5
Gross refund percent of
gross profits
46
32
30
22
26
15 - 33 =

I USE OF GOVERNMENT-FURNISHED CAPITAL I 1 Contractor use of Government-furnished capital in the
form of facilities or materials was involved in 36 percent of the determinations. Among industries, apparel contractors were the most frequent users of Government-owned materials while ordnance contractors were the primary users of Govern- ment-owned facilities. The contractors with larger renegoti- able sales were more frequent users of Government-owned capital. For example, while only 34 percent of the determi- nations made against contractors with renegotiable sales below $25 million included Government-furnished capital, 85 percent of the determinations made against contractors with renegotiable sales above $25 million included such capital.
We could not determine the effect of Government-owned capital on profit rates because we could not measure the value of such capital on the basis of information available in the Renegotiation Board's records. However, Government- furnished capital decreases the amounts of costs that must be incurred and privately owned assets that must be employed, thereby increasing the rates of return on costs and on con- tractor capital. In terms of both the type of industry and the amount of renegotiable sales, apparel contractors with sales between $1 and $5 million were the single, most fre- quent users of materials furnished by the Government. Their average rates of return on costs and capital, after refunds of excessive profits, were 14 percent and 63 percent, respectively. The average profit rates for the entire apparel industry were 4 percent on costs and 11 percent on capital:
PROFIT RATE COMPARISONS--INDUSTRY AVERAGES AND NONRENEGOTIABLE BUSINESS
By comparing rates of returnlon renegotiable sales and capital to industry average rates for 245 determinations, we found that the contractors consistently made profits well above industry averages. Before refunds of excessive profits, the contractors' profit rates exceeded the comparable in- dustry averages for 98 percent of the determinations. After refunds, the renegotiable profit rates still exceeded the industry averages for 94 percent of the determinations.
1 Computed from data published annually by the Internal Revenue Service. Only corporations reporting positive tax- able income were included in the computations. Comparisons were made by major product lines and the amount of con- tractors' total capital employed and were based on profits before deduction of income taxes.
12

Furthermore, for 76 percent of the determinations, the con- tractors' rates of return on renegotiable sales and capital before reiil:xIs were more tnan twice the industry averages. Even after refunds, renegotiable profit rates in nearly half the determin~~ti-ons exceeded twice the industry averages.
For particular contractorsp the contrast between their profit rates and the industry averages was striking. One apparelmaker, for example, had a rate of return on capital before refund that was 44 times greater than the industry average. Similarly, one producer of machine tool products had a rate of return on capital before refund that was 72 times greater than the industry average. Although the Board's determination of excessive profits reduced the machine tool __.__ --- __-..__ producers' rate of returns from 238 to 116 percent, the average rate of return for firms with comparable amounts of capital -- in the industry was less than 4 percent. As far as we could determine, the profits of the two contractors were entirely generated from private sources of capital.
Contractors making excessive profits subject to rene- gotiations also tend to make high profits on their nonrene- gotiable sales. The Board generally did not allow contractors to retain higher profit rates on their renegotiable business than they made on their nonrenegotiable business: For about 70 percent of the determinations examined,1 the renegotiable profit rates after refund were less than their nonrenegotiable profit rates. In the remaining 30 percent of the cases, the contractors' renegotiable profit rates after refunds were higher than their nonrenegotiable profit rates.
CONCLUSIONS
The contractors found to have made excessive profits in fiscal years 1970-73 were primarily small producers of relatively low-technology products, such as military apparel and ordnance, and they were concentrated within relatively ___
The Board found tiiaY%%er few industries and product lines. one-fifth of the contractors had made excessive profits in 2 or more of the 4 fiscal years we examined. In 74 percent of the determinations, the contractors did most of their business with the Government. Contractors with renegotiable sales below $25 million derived about 98 percent of their sales and profits from firm fixed-price awards: those with
1 Comparisons of nonrenegotiable to renegotiable profit rates included only those contractors whose nonrenegotiable sales accounted for more than 10 percent of total sales and whose nonrenegotiable and renegotiable products were the same or quite similar. The comparisons included 115 of the 526 determinations.
13

renegotiable sales over $25 million derived 55 percent of their sales and 74 percent of their profits from such awards. Prime contracts, rather than subcontracts, were the principal sources of sales, except for contractors whose annual rene- gotiable sales were below $1 million.
The contractors' profit levels, as measured by rates of return on renegotiable sales, costs, and capital, varied inversely with the amount of renegotiable sales.
Large contractors had lower average rates of return than small ones. This appears to be caused, in part, by the fact that renegotiation is conducted in the aggregate for a fiscal year rather than on an individual contract basis. A large contractor with numerous contracts has greater opportunity to offset the high profits of certain contracts against the low profits or losses of others than does a small contractor with fewer contracts.
Large contractors were more frequent users of Government- furnished facilities and materials, and among the producers of military apparel, extraordinary profits were generated, in part, from Government-furnished capital under contracts bearing minimal risk to the contractor.
The contractors' profit rates were consistently higher than the comparable industry averages. Even after excessive profits were refunded, renegotiable pro,fit rates in nearly half the determinations were more than twice the industry averages. Contractors making excessive profits from products subject to renegotiation generally also made high profits from nonrenegotiable sales of these products. In about two- thirds of the renegotiated cases, profits on renegotiable work were reduced to rates lower than the contractors derived from their nonrenegotiable business. In the remaining one- third of the cases, the contractors were allowed to retain renegotiable profits in excess of the rates that they made on their nonrenegotiable business.
14

CHAPTER 3
RELATIONSHIP BETWEEN HIGH PROFITS
AND PROCUREMENT PROCEDURES
Poor procurement procedures were not the dominant cause of high profits earned on a sample of 42 contracts and sub- contracts we reviewed. We found that high profits were caused primarily by a seller's market. This permitted high prices on increased production which reduced unit production costs and thereby increased profits.
DIFFERENCES BETWEEN RENEGOTIATION AND DEFENSE PROCUREMENT
Defense procurement, according to ASPR, is primarily concerned with reasonableness of price. Profits earned by a'contractor are only a secondary concern. cern of renegotiation, however,
The primary con- is profits made by a con-
tractor, whereas reasonableness of price is but one factor the Board considers.
Competitive procurement is generally accepted as one of the best methods for insuring reasonable prices.- The Congress has indicated that the best way to foster competition is through procurement by formal advertising, whereby all qual- ified suppliers have the opportunity to bid on and receive Government contracts. The Congress therefore has designated procurement by negotiation as the exception to formal ad- vertising.
According to ASPR, adequate price competition requires that at least two responsive and responsible offerers con- tend independently for a contract.
Although the Board has not explicitly defined "adequate competition," in its analyses of contractors' profits it makes numerous references to the evident lack of competition for contracts, procedures.
including those awarded through competitive The Board has cited the lack of competition
within both the narrow context of individual awards and the broad context of general market conditions prevailing when a procurement is made.
CAUSES OF HIGH PROFITS-- STATUTORY FACTORS ANALYSES
The Board explicitly cited the effects of high Govern- ment demand as the major cause of high profits in nearly 75
15

percent of the determinations we reviewed. The effects of high demand included limited competition that did not in- spire realistic prices and cost savings realized by con- tractors from high-volume production that were not passed on to the Government.
To identify causes of high profits, we reviewed the Board's analyses of the statutory factors for 35 determina- tions of excessive profits. The 35 determinations covered 25 contractors producing 19 different product lines. We al- so discussed individual determinations with renegotiators at the Eastern Regional Board.
For most of the determinations, the Board indicated that it gave the contractors favorable consideration for the complexity of production operations, efficiency, and reason- ableness of costs. For most of the determinations the con- tractors were not considered to have incurred abnormally high risks or to have made exceptional contributions to the defense effort. In about half the determinations, the con- tractors used Government-furnished capita1 or received prog- ress payments. In nearly all the determinations, the Board considered the contractor's rates of return on capital and net worth high and indicative of excessive profits.
Renegotiators at the Eastern Regional Board also em- phasized high Government demand as the major cause of high profits. Other factors cited included strained production capacity; limited competition; high prices; and reduced unit production costs which were realized from high-volume pro- duction but were not passed on to the Government through reduced prices.
CAUSES OF HIGH PROFITS-- SELECTED CONTRACTORS AND AWARDS
We visited 13 contractors1 included among the Board's determinations in 1970-73 and identified 42 contracts be- lieved to have been the sources of their high profits. We
lThe 13 contractors were selected on the basis of such fac- tors as the size of excessive profit refunds, types of industries represented, currentness of fiscal year, and geographical representativeness. The 42 contracts were selected primarily on the basis of availability of procure- ment data. Neither the 13 contractors nor the 42 contracts can be considered statistically representative of all con- tracts or subcontracts subject to renegotiation.
16

identified causes of the contractors' high profits and analyzed the procurement procedures the procurement offices used in awarding the contracts.
CHARACTERISTICS OF CONTRACTS
The 42 contracts were performed by contractors that fell within 7 industry groups and produced 10 product lines. table on the following page identifies the industries and
The I
products and shows for each contractor the number and dollar value of the 42 contracts by method of procurement.
The table also shows that the total value of the con- tracts was nearly $116 million. Half of the contracts in- volving 74 percent of the total value were awarded on a sole- source basis. About one-fifth of the contracts involving 21 percent of the total value were formally advertised and almost one-third involving 5 percent of the total value were competitively negotiated.
Our analysis shows that, of these contracts
--88 percent were firm fixed-price contracts.
--12 percent were fixed-price-with-escalation contracts.
--60 percent were prime contracts.
--40 percent were subcontracts.
--55 percent were awarded on the basis of price competition or market or catalog prices.
--26 percent were awarded on the basis of contractor-submitted cost or pricing data.
--19 percent L/ were awarded on the basis of some other or unknown method of pricing.
1The 19 percent represents eight sole-source subcontracts. The procurement file of one subcontract was incomplete and we could not determine the method of pricing. The procure- ment files of the remaining seven subcontracts did not show that the methods of pricing included market or catalog prices or cost analyses of cost data submitted by the sub- contractors. Two of the seven subcontracts were apparently justified by the prime contractors on the basis of current prices; two were apparently justified on the basis of com- parisons to prior prices: and three were apparently justi- fied on the basis of cost estimates prepared in-house by the prime contractors.
17

Industry and contractor
Military apparel: contractor A contractor B contractor C
Ordnance: contractor D
Electric and electronic equipment:
contractor E contractor F
Nonelectrical machinery: contractor G contractor H
Transportation equipment: contractor I contractor J contractor K
Special trade construction: contractor L
Total Formal advertising Competitive negotiation Number Value Number Value Number Value - - -~
(000,000 (000,000 (000,000 omitted) omitted) omitted)
6 $ 12,089 5 $ 7,359 1 $4,730 3 4,553 1 3,884 2 669 1 1,057 1 1,057 -
Sole-source negotiation Number Value
(000,000 omitted)
4 $ -
7 82,394 1 12,128 - 6 70,266
3 4
3 1,322 - 4 172 -
1 1
'5
3
Water transportation services :
contractor M 1 --
Total
Percent of total number 100 Percent of total val"e
599 - 571 1
2,980 - 212 - 501 -
3,258 -
155 2
4
3
6,000 - - -
$115,708 9 $24 583 12 - = I - = 21 29
100 21
299
/ 172
257
3 599 1 117
3 1,322
2,980 212
2 244
3' 3,258
$6,127
5
1 - 6,000
21 = $84,998
50 74

Characteristics of contractors
Of the 13 contractors we reviewed, 7 had renegotiable sales of below $5 million; 5 had sales between $5 and $25 million; and 1 had sales of over $50 million. Government sales made up most of the total sales of 10 of the 13 con- tractors. Seven contractors had excessive profit determi- -_ nations made against them for 2 or 3 consecutive--fiscal years.
In total, the Board found the contractors made excessive profits of nearly $12 million (before any adjustment for taxes measured by income). This represents 7 percent of the total value of all determinations made in fiscal years 1970- 73.
The primary cause of high profits earned by the 13 con- tractors was high demand. The high demand was generated, to a large extent, by the needs of the Government, which, in turn, limited the adequacy of competition and enabled con- tractors to charge higher unit prices. The increased sales also enabled contractors to benefit from the economies of volume production through reduced unit costs which were not passed on to the Government.
Following is our analysis of the causes forhigh profits of the four contractors in the military apparel and ordnance industry included in our review.
Military apparel
Of the 42 contracts we selected, 10 contracts, totaling '$17.7 million, were awarded to 3 military apparelmakers
during 1967-69. All 10 contracts were awarded on the basis of price competition. Although none of the contractors had accounting systems that identified profits for individual contracts, the average rates of return on total renegotiable costs was 40 percent for contractor A, 22 percent for con- tractor B, and 19 percent for contractor C.
19 '

According to the Board, there was a large increase in Government demand for military apparel during the period involved. In 1967 demand was 28 times greater than in 1965. Although demand has since decreased, it was 10 times greater in 1969 than in 1965. The high level of demand strained the production capacity of military ap arelmakers, and the Gov- ernment had to use multiple awards P and rated orders2 to fill its quantity requirements. In the Board's opinion the high demand and strained production capacity within the industry limited the adequacy of competition, and as a result, prices increased.
Sales and profits of the three contractors reflected the increase in demand. Sales of contractor A, for example, were 148 percent greater in 1969 than in 1965. The changes in con- tractor A's profits paralleled changes in the price of its major renegotiable product, an overcoat. The Board related the price level of this item directly to the demand created by the Southeast Asia conflict.
Ordnance
Contractor D performed seven high-profit contracts, totaling $82 million, for ordnance produc,ts. All but one of the contracts were negotiated on a sole-source basis by the Ships Parts Control Center. The actual rates of return on costs from the contracts ranged from 14 to 32 percent of total costs, compared with initially negotiated rates which ranged from 10 and 13 percent.
During the period 1966-68 contractor D had a substantial increase in sales. Compared with its 1966 sales, contractor
'Under a multiple award responsive bidders or offerers, other than the low responsive bidder of offerer, are also awarded contracts in accordance with normal procurement procedures, in order to meet total quantity requirements.
2A directive requiring a contractor to supply a product after normal procurement procedures have failed to generate sources sufficient to meet quantity requirements.
20

D's sales were 170 percent greater in 1967 and 240 percent greater in 1968.
The Board attributed the contractor's high profits to its increased sales and attendant reduction in unit costs which were not passed on to the Government through lower prices. We found that another factor contributing to the high pro- fits was the failure by the procurement office involved to detect, prior to award, that cost data was inaccurate for three of the seven contracts. These contracts were later subject to defective-pricing claims totaling $3.9 million under the Truth-in-Negotiations Act.
PROCUREMENT PROCEDURES--SELECTED AWARDS
Formally advertised awards
Of the nine formally advertised awards included in our review, seven were for military apparel. The 7 awards had an average number of 12 responsive bids, which was 3 times greater than the average number of bids or proposals re- ceived for the other 14 awards that were also based on price competition. Thus, in terms of the number of responsive bids, competition for the seven awards appears to have been relatively active. As a result of a seller's market at the time the seven awards were made, however, the relatively large number of bids did not result in reasonable prices. Formal advertising gave the appearance, but not the substance, of active competition, and high profits resulted.
The military apparel contracts were awarded by the Defense Personnel Support Center. (DPSC). Discussing the uses of formal advertising, a procurement official with DPSC told us he would like to see the procurement officer given the authority to reject all bids and to negotiate after solicita- tion by formal advertising whenever he determines that the bids are priced unreasonably. Under present law, the pro- curement officer has few options if dissatified with the re- sponses to a formally advertised soliciation.
He can accept the lowest bid, despite his reservations about its price; he can cancel the solicitation and readver- tise; or he can seek the authority to negotiate, to obtain a more reasonable price. Cancellation usually is not feasible if the need for the product is urgent, and readvertising is pointless if market conditions remain unchanged. The authority to reject all bids and negotiate is retained by the
21

highest management levell, and obtaining approval is a tedious procedure requiring extensive justification. The DPSC offi- cial stated he had seen the authority invoked only once in 17 years of procurement experience. In discussions with top procurement officials in the three services and Defense Supply Agency, we were told that the authority had been re- guested only several times within the past 5 years within the Navy and Air Force and had not been requested at all in that period within the Army and Defense Supply Agency.
Negotiated awards
Under current defense contract negotiation procedures, little consideration is given to the amount of capital in- vestment required from the contractor for contract performance. Instead, profit objectives are developed as a percentage of anticipated costs.
Since return on capital is not considered in establishing the profit element of contract prices, it is to be expected that some extremely high contractor profits in relation to investments will occur. We believe this is an important objective and in our "Defense Industry Profit Study" (B-159896 March 17, 19711, and as recently as November 1974, we recommended that corrective action be taken. DOD has been considering various approaches to solving this problem but has made little headway.
Another major factor that results in excessive profits is a change in production volume or costs that was not antic- ipated at the time contract prices were established. As discussed below, cost or price analysis will not be effective in these circumstances.
Cost or price analysis
Cost analysis or price analysis did not prevent con- tractors from making high profits.
According to ASPR, a procurement office must make some type of cost or price analysis for every negotiated procure- ment action. Cost analysis is the review and evaluation, element by element, of the cost estimate supporting a com- pany's proposal. Price analysis is defined as whatever
1The highest management level includes the Secretary of De- fense, the Under Secretary or any Assistant Secretary of any military department in DOD, and the Administrator or Deputy Administrator in the National Aeronautics and Space Admin- istration.
22

actions the buyer takes to reach a price decision without recourse to cost analysis; it may be done by comparison of prices or comparison with an engineering estimate.
There were 33 negotiated contracts among the 42 selected contracts. Of the 33 contracts, 14 were either competitively negotiated or awarded on the basis of established catalog or market prices. Each of the 14 awards underwent a price analysis by the procurement office, or, in the case of sub- contracts, by the prime contractor.
The remaining 19 negotiated contracts were sole-source awards. Of the 19 contracts, 111 had cost analyses made by the procurement office or prime contractors. Of those 11 contracts, -10 were prime contract awards, each of which in- cluded input from the Defense Contract Audit Agency (DCAA) in the cost analysis. Yet, despite the applications of cost or price analysis to the negotiated awards, profits were high.
Cost analysis
If increasing demand causes sales to rise at a faster rate than costs, while a contract is performed, reductions in unit costs may be realized that were not anticipated at the time of contract award. The graphs on the next page illustrate the results of this situation for one of the negotiated contracts performed by a producer of pumping equipment. Early in 1967 the contractor negotiated with the Government for a $39,100 unit price including antici- pated unit costs of $35,200 and a unit profit of $3,900. It performed the contract during the period 1968-69. Although its price remained steady for the 3-year period 1967-69, its sales increased greatly and unit costs decreased.
A comparison of the contractors estimated and actual profits for fiscal years 1967-69 --shown in the table on paw 25, for the weighted averaged of 15 pumps included in the contract showed a wide variance.
Although a cost analysis was made, the contractor realized an actual profit rate on costs of 64 percent rather than the negotiated rate of 11 percent.
lThe other eight sole-source awards were subcontracts. Six of the awards included price analyses, one did not require a price analyses, and the procurement file of one award was incomplete and did not disclose whether price analysis was made.
23

COMPARISON OF CONTRACTOR’S NEGOTIATED AND ACTUAL UNIT COST AND UNIT PROFIT
THOUSANDS NEGOTIATED ACTUAL OF DOLLARS 1967 1967-69
25
0
COMPARISON OF CONTRACTOR’S TOTAL SALES AND TOTAL COStS BEFORE CONTRACT AWARD AND DURING PERFORMANCE
MILLIONS OF DOLLARS
1966 1967 1968 1969
cl PROFIT COST
24
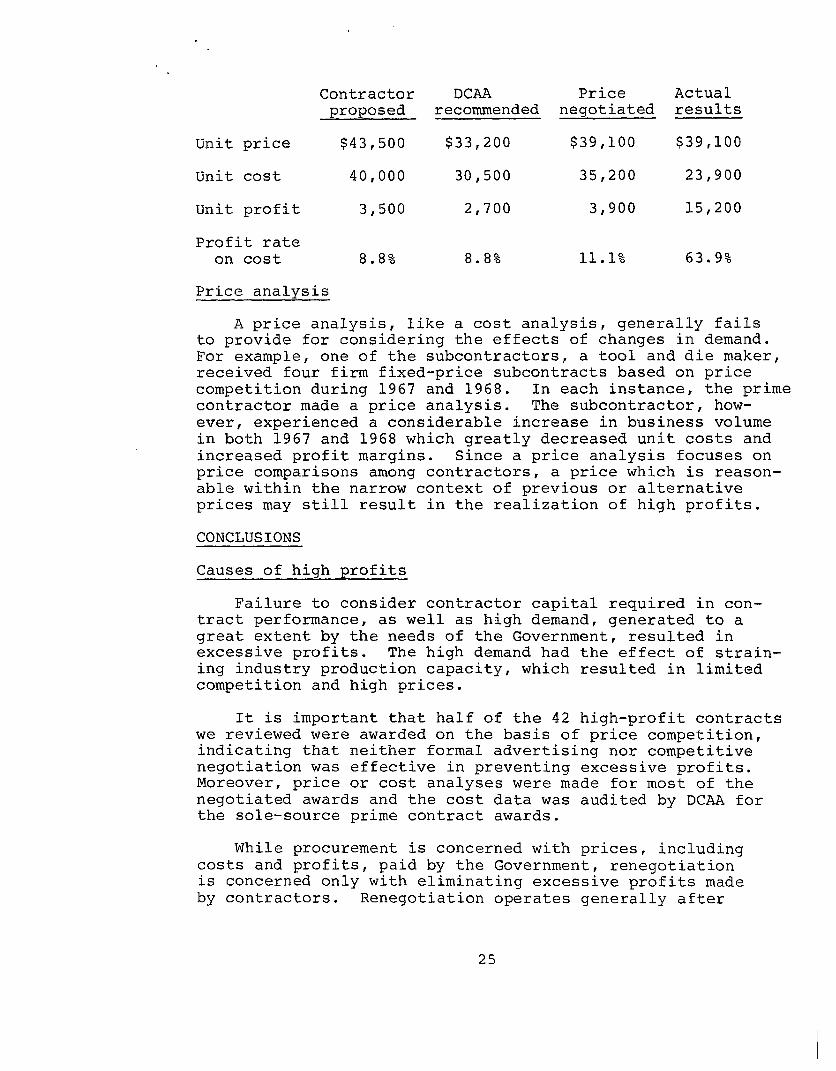
Unit price
Unit cost
Unit profit
Profit rate on cost
Contractor DCAA Price Actual proposed recommended negotiated results
$43,500 $33,200 $39,100 $39,100
40,000 30,500 35,200 23,900
3,500 2,700 3,900 15,200
8.8% 8.8% 11.1% 63.9%
Price analysis
A price analysis, like a cost analysis, generally fails to provide for considering the effects of changes in demand. For example, one of the subcontractors, a tool and die maker, received four firm fixed-price subcontracts based on price competition during 1967 and 1968. In each instance, the prime contractor made a price analysis. The subcontractor, how- ever, experienced a considerable increase in business volume in both 1967 and 1968 which greatly decreased unit costs and increased profit margins. Since a price analysis focuses on price comparisons among contractors, a price which is reason- able within the narrow context of previous or alternative prices may still result in the realization of high profits.
CONCLUSIONS
Causes of high profits
Failure to consider contractor capital required in con- tract performance, as well as high demand, generated to a great extent by the needs of the Government, resulted in excessive profits. The high demand had the effect of strain- ing industry production capacity, which resulted in limited competition and high prices.
It is important that half of the 42 high-profit contracts we reviewed were awarded on the basis of price competition, indicating that neither formal advertising nor competitive negotiation was effective in preventing excessive profits. Moreover, price or cost analyses were made for most of the negotiated awards and the cost data was audited by DCAA for the sole-source prime contract awards.
While procurement is concerned with prices, including costs and profits, paid by the Government, renegotiation is concerned only with eliminating excessive profits made by contractors. Renegotiation operates generally after
25
contracts have been completed, to determine retrospectively whether the profits made were excessive.
Even assuming we had efficient and effective price negotiations for contract awards, we believe that renegotia- tion of actual profits realized is desirable to prevent ex- cessive profits which result from changed conditions that cannot be anticipated at the time of contract award.
26

CHAPTER 4
COORDINATION BETWEEN THE BOARD
AND PROCUREMENT ACTIVITIES
In our May 1973 report (p. 461, GAO recommended the Board consider forwarding data on excessive profit determi- nations to procurement activities. We felt such data might be useful to procurement activities in their evaluations of procurement practices and policies.
As part of this review, we sought to determine whether historical data available at the Board, concerning contractors' costs and profits, would be useful to personnel involved in the procurement process.
EXTENT OF COORDINATION
Formal feedback of contractor data
During the years 1968-74, the Board periodically sent to the Office of Assistant Secretary of Defense copies of completed RB Form 67s, Assigned Case Data Reports, which the Board prepared. (An RB-67 summarizes data regarding a contractor's sales and profits for a particular fiscal period.) These RB-67s were not forwarded until after the Board either entered into refund agreements with the con- tractors or issued unilateral orders for the amounts of ex- cessive profits.
The RB-67s were not useful to DOD for procurement pur- poses, principally because they lacked timeliness. DOD did not receive the RB-67s until 3 to 6 years after the close of the contractors' fiscal periods. The time lag between the award dates and the dates the Board received the relevant RB-67s made it difficult for the Board to identify the pro- curement officials who originally awarded the high-profit contracts. More importantly, the market conditions and pro- curement circumstances could have changed during that time.
Other characteristics of the for procurement purposes are:
RB-67 which inhibit its use
--Sales and profits are shown in the aggregate. Thus it is difficult to relate profits to specific awards, particularly if the contractor is large and complex and has numerous products and operating divisions.
27

--Labor, overhead, and other expenses are not shown individually, making it impossible to isolate and analyze the various elements of cost which were included in the contract price.
Informal feedback of contractor data
Upon request, the Board forwards to individual procure- ment offices the RB-67 and data derived from the RB Form 1, Standard Form of Contractor's Report for Renegotiation.
Compared with the RB-67, the RB-1 has the following advantages.
--It is more timely. Analysis of 322 of the 536 excessive profit determinations made in fiscal years 1970-73 showed that about two-thirds of the RB-1s were received by the Board within 12 months after the close of the contractors' fiscal years. Officials of the Board estimate that, on the average, about 11 months elapse from the date a contractors' fiscal year ends, the Board receives and examines its RB-1 and the contractor is either assigned for full-sc le renegotiation or cleared without assignment. f
--Total renegotiable costs are shown by several elements, including labor, materials, overhead, selling and advertising, and general and adminis- trative.
Like the RB-67, the RB-1 shows aggregate financial data for a fiscal period rather than data for completed contracts individually. Also shown is data regarding the amount of sales of standard commercial items exempt from renegotiation, the amount of voluntary refunds and price reductions, and the identity of major renegotiable and nonrenegotiable products. The costs reported are those allowable for Federal tax pur- poses rather than those allowable under ASPR. Furthermore the Board does not review the RB-1 in detail until after the contractor has been assigned for full-scale renegotiation.
'During fiscal years 1970-73 the number of contractors as- signed annually for full-scale renegotiation averaged 515. The Board receives annually about 4,000 RB-1s.
28

POTENTIAL USES OF THE RB-1
Although requests for RB-1 data have been few, procure- ment officials who have used the data have found it helpful in evaluating contractors' proposals. To determine whether the data could be more widely used in the procurement process, we held discussions with representatives of eight major de- fense procurement offices and with DCAA.
The procurement office personnel were aware of the rene- gotiation process, but most were not familiar with the cost and profit data available from the Board. After reviewing the RB-1, many of the procurement officials stated that they could use it as an additional source of information to strengthen their negotiating positions and support their decisions.
Most of the officials agreed that the data would be mos't useful for those procurements for which the contractor is not required to submit cost or pricing data under the provisions of the Truth-in-Negotiations Act. Such procure- ments include formally advertised awards: negotiated awards for $100,000 or less; and negotiated awards of any dollar value that are based on adequate price competition, estab- lished catalog or market prices of commercial items, or prices set by law or regulation.1
Procurement officials cited the following potential applications of the data.
--Evaluation of the reasonableness of a contractor's proposed price by considering previously incurred amounts of costs and profits, i.e., the elements of price.
--Identification of trends in the relationships among sales, costs, and profits.
--Comparison of components of historical costs, such as the overhead rate, to those shown in current proposals.
1 Such procurements may also include negotiated awards in excess of $100,000 when the contractor is subjected to, but declines to comply with, the requirements of the act. The necessity to waive the requirements of the act in these circumstances is a recurring problem.
29

--Determination of the amount of a contractor's total sales which are subject to renegotiation. According to one procurement official, a con- tractorPs pricing policy is influenced by the relative amount of its defense-related sales.
--Verification of a contractor's contention that its product or service qualifies for exemption from the act as a catalog- or market-priced item since such an item generally qualifies for exemption from renegotiation as a standard com- mercial item.
DCAA comments generally supported those expressed by representatives of the procurement offices. DCAA cited potential uses of the RB-1 as a benchmark for evaluating relationships among and detecting trends in sales, costs, and profits. In addition, DCAA considers the data potentially useful in selecting contractors for defective-pricing audits and for performing pricing reviews of small contractors.
CONCLUSIONS
DOD did not find the RB-67s obtained from the Board to be useful for procurement purposes. We be'lieve, however, that information on the RB-1 could be used by procurement offi- cials as an additional pricing tool.
We believe the Board, to assist procurement personnel, should periodically submit to heads of relevant agencies a listing of those contractors recently assigned for full- scale renegotiation. The listing should show the identity of the contractor, its major products, and its fiscal year under review. The agency head should then send it to individual procurement offices where contracting personnel could check it for contractors of current interest and, at their discretion, submit requests' for RB-1 data directly to the Board. For DOD, similar procedures should be instituted between the Secretary and DCAA for the distribution of listings received from the Board.
1These requests need not be restricted to those contractors recently assigned for renegotiation, The Board may have useful m-1 data on contractors which have been cleared without assignment. The listing is intended merely as a convenient way to alert procurement personnel to contractors currently subject to detailed review by the Board.
30

We believe this RB-1 data should be distributed at the discretion of contracting personnel at individual procurement offices, to avoid the time-consuming and more costly procedures inherent in obtaining high-level authorization. Moreover, by limiting distribution to situations identified by the actual users of the RB-1, the Board need not engage in rou- tine, widespread forwarding of data having no useful applica- tions.
RECOMMENDATION
The Chairman of the Board should make available to pro- curement and DCAA personnel data on the RB-1 for their use in procurement and audit activities.
The relevant agencies should familiarize procurement and DCAA personnel with the potential applications of RB-1 data. In addition, the Board should periodically notify agency heads of contractors recently assigned for full-scale renegotiation. The agency heads should distribute the Board's notifications to DCAA and procurement offices for their use.
AGENCY COMMENTS AND GAO EVALUATION
Agencies commenting on our findings and recommendation included DOD, the National Aeronautics and Space Administra- tion (NASA), and the Board.
Although DOD generally agreed with our findings and recommendation, it expressed some concern over the level of detail and timeliness of contractor data to be made available for use by procurement and DCAA personnel. However, it was willing to discuss this issue with the Board and work out a mutually satisfactory arrangement.
We believe that such data could be useful to procurement and DCAA personnel and that items of concern can be worked out satisfactorily.
NASA agreed with the report recommendation but had the same reservations as DOD had. Discussions concerning the procedure permitting procurement personnel to use RB-1 have been held for the past year with DOD and the Board. These discussions will be continued to work out procedures that obtain the level of detail and timeliness that will be useful for NASA's procurement purposes. We believe that these dis- cussions will lead to effective, procedures that should pro- vide NASA with current and detailed data useful for its pur- poses.
31

The Chairman of the Board found our findings to be factual and informative, and he fully supports our recommenda- tion. The Board will cooperate with DOD and NASA in develop- ing an effective procedure within a framework that will de- fine and safeguard the rights, interests, and responsibilities of all parties concerned.
The combined efforts of DOD, NASA and the Board should result in a workable procedure.
32

CHAPTER 5
SCOPE OF REVIEW
To identify the characteristics for and determine the profitability of contractors found to have made excessive profits in fiscal years 1970-73, we analyzed data available at the Board and data published annually by the Internal Revenue Service.
To identify causes of high profits, we reviewed the Board's written analyses of the statutory factors, held discussions with renegotiators, and selected 13 contractors for detailed examination. We based our selection of con- tractors on (1) the size of the excessive profit refunds, (2) the absence of litigation pending or in process, (3) the types of industries represented, (4) the currentness of the contractors' fiscal years, and (5) the availability of financial and procurement data.
To determine the relationship between high profits and procurement, we (1) reviewed procurement law and provisions of ASPR and (2) examined the procurement procedures used in making 42 awards believed to have been sources of high profits to the 13 selected contractors.
To determine whether information available from the Board on contractors' costs and profits would be useful to Government personnel involved in defense procurement, we held discussions with officials of the Board, representatives of DCAA, and representatives of the DOD procurement offices listed below.
Procurement office
Defense Supply Agency: Defense Personnel Support Center Defense Industrial Supply Center Defense Electronics Supply
Center Defense Construction Supply
Center Defense General Supply Center
Department of the Navy: Naval Air Systems Command Naval Aviation Supply Office
Department of the Air Force: Aeronautical Systems Division
Location
Philadelphia, Pennsylvania Philadelphia, Pennsylvania
Dayton, Ohio
Columbus, Ohio Richmond, Virginia
Arlington, Virginia Philadelphia, Pennsylvania
Wright Patterson Air Force Base
Dayton, Ohio
33

APPENDIX I APPENDIX I
WASHINGTON. D.C. 20446
SEP 29 1975
Honorable Elmer B. Staats Comptroller General of the United States Washington, D. C. 20548
Dear Mr. Staats:
Enclosed with a letter, dated August 4, 1975, by R. W. Gutman, Director, Procurement and Systems Acquisition Division, the Board received copies of a GAO draft report to the Congress on the causes of excessive profits on defense and space contracts, and was requested to submit comments thereon within 60 days.
We have reviewed the draft report and have found it factual and informative.
The draft report makes only one specific recommendation directly affecting the Board, to wit, that "the Board and the procurement agencies should institute procedures permitting procurement and DCAA personnel to use data represented by the RB Form 1 in their procurement and audit activities.PP (p. 41). The Board fully supports the spirit of the recom- mendation and will be pleased to cooperate with the procurement agencies in developing the necessary procedures, within a framework that will define and safeguard the rights, interests and responsibilities of all parties concerned.
In several places, and particularly on page 15, the draft report comments on the fact that, in reviewing 245 determinations, it was found that contractors "consistently made profits well above industry averages." We would like to point out that the return rates, or their relative height, discussed by the draft report are by no means conclusive with regard to the presence or absence of excessive profits in individual cases. While in theory it is conceivable that excessive profits may be found by the Board where contractors' profits are at or below industry averages, as a practical matter the likelihood of such a situation is fairly remote, The Board evaluates contractors' profits in the light of the statutory factors, and in that evaluation, return rates are but guides and are in no way controlling as far as the Board's ultimate decisions are concerned.
34
’ APPENDIX I ‘APPENDIX I
Honorable Elmer B. Staats
In the world of specific contractor situations there is an endless variety of reasons, under the statutory factors, why the Board should leave a given contractor with return rates higher than industry averages.
In addition to the above, we would like to make some technical comments which might be of help in finalizing the draft report. These comments are contained in an attadhed aide memoire.
We appreciate the opportunity to comment on the draft report.
Sincerely,
Enclosure
GAO note: Enclosure omitted because comments were considered in finalizing the report.
35

APPENDIX II
6 OCT 1975
APPENDIX II ,
Mr. R. W. Gutmann Director, Procurement and
Systems Acquisition Division u "6. General Accounting Office Washington, D. C, 20548
Dear Mr, Gutmann:
This is in response to your letter of August 4, 1975, to the Secretary of Defense transmitting General Accounting Office Draft Report on "Causes of Excessive Profits on Defense and Space Contracts" (OSD Case No. 4139).
Your report covers Renegotiation Board determinations of excessive profits during FYs 1970-73. The report reveals that (1) the contractors involved in these excess profit determinations were small producers of relatively low-technology items such as the military apparel and ordnance items, many of whom used Government furnished facilities or material; (2) the average profit rates were 28% on costs and 84% on capital and were con- sistently higher than industry averages; (3) the types of contracts employed were primarily fixed price contracts “(82%); (4) procurement procedures used were formal advertising (21%), competitive negotiation (20$,)s and sole source negotiation (50%), and further that these proaure- ment procedures or their implementation did not cause excessive profits to any great extent; and (5) information available at the Renegotiation Board could be helpful to procurement officials.
We are pleased to note your report states that poor procurement procedures were not the dominant cause of high profits earned on a sample of 42 con- tracts and subcontracts reviewed by GAO. Apparently, high profits which were adjusted by the Renegotiation Board were caused primarily by a selleras market coupled with unexpected production volume increases.
You recommended that the Renegotiation Board provide procurement and DCAA personnel with contractor data to be used in evaluating price reasonableness, analyzing proposed costs, and selecting contracts for review for instances of defective pricing. We are not sure how this would be helpful since the data have not normally been made available by the Board. We are willing to discuss this with the Board. Presently we have some concern that the level of detail and timeliness of the data in these reports will not provide useful information for contract negotiations.
36

1 APPENDIX II
[See GAO note.]
APPENDIX II
We appreciate the opportunity to comment on this draft report.
Sincerely,
GAO note: This information is no longer relevant to this report and has been deleted.
37

.
I
. NATIONAL AERONAUTICS AND SPACE ADMINISTRATION
I WASHINGTON, D C 20546 .‘,
L’ S A
APPENOIX III 1
’ : PLY TO
1-1N OF w
SEP 30 1975
Mr. R. W. Gutmann Director, Procurement and Systems
Acquisition Division U.S. General Accounting Office Washington, DC 20546
Dear Mr. Gutmann:
Thank you for the opportunity to comment on your draft report to the Congress entitled "Causes Of Excessive Profits On Defense And Space Contracts", which was forwarded to us with your letter dated August 4, 1975. The following information is submitted with regard to GAO's proposed recommendation that the Renegotiation Board and procurement agencies should institute procedures permitting procurement personnel to use RB Form 1 data filed by contractors with the Renegotiation Board.
The Office of Procurement has been discussing this type of procedure with the Department of Defense (DOD), General Accounting Office (GAO), and the Renegotiation Board (RB) for the past year. On its face, the recommendation by GAO appears to have merit. However, after numerous dis- cussions with personnel from the above agencies, we have no indication that the RB can furnish the type and quantity of information considered essential for use in negotiating contracts and selecting contracts for review to determine possible violations of the Truth-in-Negotiations Act. The data as presently provided by contractors on the RB Form 1 to the RB is an accumulation of all costs and profits for all contracts. Presently, we see no advantage in receiving aggregate data of costs and profits and the usefulness to Contracting Officers in negotiation of cqtracts, including contracts which do not require cost or pricing data, is not readily apparent.'. *
Also, in order for the data to be useful to NASA in analyzing contractor's costs for the purpose of negotiating contracts, the data would have to be current and provided to the Agency on a timely basis. We have no assurances at this time that the RB can provide the data in a timely manner.
38 --

APPENDIX III APPENDIX III
During our prior discussions with the RB we requested data for possible use in one of our competitive procurements. The data received was not current or pertinent for use in the procurement process.
Based on the above, we feel that at the present time, dis- cussions with the above Agencies should continue in order to determine if more detailed data, in addition to the data presently being provided, can be made available using the RB-1 form, and if it can be made available, would it be current and would it's potential applications as stipulated on page 39 of the GAO draft report, be useful for NASA pro- curement purposes.
Sincerely,
39

APPENDIX IV APPENDIX IV
PRINCIPAL OFFICIALS OF THE RENEGOTIATION BOARD
RESPONSIBLE FOR ADMINISTRATION OF THE MATTERS
DISCUSSED IN THIS REPORT
CHAIRMAN: Richard C. Holmquist Rex M, Mattingly William S. Whitehead Richard T, Burness
Tenure of office From To -
June 1975 Present Dec. 1974 June 1975 July 1973 Dec. 1974 Nov o 1971 July 1973
BOARD MEMBERS: Richard C. Holmquist Rex. M. Mattingly Goodwin Chase Norman B. Houston Christopher U. Sylvester D. Eldred Rinehart William S. Whitehead Lawrence E. Hartwig Richard T. Burness
June Aug. Oct. Oct. July Oct. June Oct. Nov o
1975 Present 1969 Present 1973 Present 1973 Present 1975 Present 1969 Jan. 1975 1969 Dec. 1974 1951 June 1973 1971 June 1973
40

Copies of GAO reports are available to the general public at a cost of $1 .OO a copy. There is no charge for reports furnished to Members of Congress and congressional committee staff members; officials of Federal, State, local, and foreign govern- ments; members of the press; college libraries, faculty mem- bers, and students: and non-profit organizations.
Requesters entitled to reports without charge should address their requests to:
U.S. General Accounting Office Distribution Section, Room 4522 441 G Street, NW. Washington, D.C. 20548
Requesters who are required to pay for reports should send their requests with checks or money orders to:
U.S. General Accounting Office Distribution Section P.O. Box 1020 Washington, D.C. 20013
Checks or money orders should be made payable to the U.S. General Accounting Office. Stamps or Superintendent of Doc- uments coupons will not be accepted. Please do not send cash.
To expedite filling your order, use the report number in the lower left corner and the date in the lower right corner of the front cover.
-I AN EQUAL OPPORTUNITY EMPLOYER I
j UNITED STATES I GENERALACCOUNTINGOFFICE
WASHINGTON, D-C, 20548
OFFICIAL BUSINESS
PENALTY FOR PRIVATE USE,$300
POSTAGE AND FEES PAID
U. S. GENERAL ACCOUNTING OFFICE
THIRD CLASS