ps flow prop
TRANSCRIPT
8/4/2019 Ps Flow Prop
http://slidepdf.com/reader/full/ps-flow-prop 1/13
The rheological properties of polystyrene/poly(vinylmethylether) blendnear the critical region and in the homogenous region
Jin Kon Kim*, Hye Won Son
Department of Chemical Engineering and Polymer Research Institute, School of Environmental Engineering,
Pohang University of Science and Technology, Pohang 790-784, Kyungbuk, Korea
Received 12 October 1998; received in revised form 15 December 1998; accepted 4 January 1999
Abstract
The rheological properties of polystyrene/poly(vinylmethylether) (PS/PVME) blend near the critical region and in the homogeneousregion were investigated. The blend had a lower critical solution temperature (LCST) of 112 C obtained by a turbidity experiment using a
light scattering (LS) apparatus at a heating rate of 1C/h. Four different blend compositions (critical (30/70 PS/PVME by weight) and three
off-critical (10/90, 50/50, and 70/30) as well as neat PS and PVME were prepared. For the critical composition, logarithmic plots of shear
modulus (GH) versus loss modulus (G
HH) showed temperature dependence even in the homogenous region determined by LS, while those plots
become temperature independent in the homogeneous region for off-critical compositions.
Logarithmic plots of blend viscosity versus composition exhibited a negative deviation at constant temperature; however, these showed a
maximum at a certain composition when the reference temperature is taken as fixed T T g (under approximately iso-free volume condition).
1999 Elsevier Science Ltd. All rights reserved.
Keywords: Rheological properties; PS/PVME blends; Blend viscosity
1. Introduction
The polystyrene (PS) and poly(vinylmethylether)
(PVME) blend has been extensively investigated by poly-
mer scientists [1–19], after this blend was found to exhibit a
lower critical solution temperature (LCST) [9]. Some
research groups have studied the phase-separation kinetics
and its morphology [9–12], while others have investigated
the rheological properties of PS/PVME blends near the
critical temperatures as well as in the homogeneous regime
[2–7].
A phase diagram of the PS/PVME blend was obtained by
a light scattering and/or a small angle neutron scattering
method [7,10–14] with the aid of the random phase approx-imation based on Flory–Huggins mean field theory. Kapnis-
tos et al. [7] showed that the spinodal temperature of PS/
PVME blend could be obtained by rheological methods of
temperature sweep experiments of storage shear modulus
(G H) and logarithmic plots of G H versus loss shear modulus
(G HH). Recently, Kim et al. [18] found that the critical
composition of PS/PVME blend exhibits a concentration
fluctuation in the homogeneous regime close to the LCST,while off-critical composition does not exhibit the concen-
tration fluctuation. These behaviors are consistent with
results given in Ref. [7]. In addition, we showed that the
extent of the concentration fluctuation in a blend near the
critical temperature is inversely proportional to the absolute
value of the temperature coefficient ( B) in the Flory inter-
action parameter (x � A B = T , where T is the absolute
temperature) [18]. It is shown that the rheological properties
of the blend in the phase-separated regime vary quite
complicatedly with blend composition, as rheological prop-
erties depend upon the phase-separated morphology [7].
Very recently, we investigated the change in the rheological
properties of PS/PVME blend with phase-separation time,depending upon the blend composition and the quenching
depth [19].
Semi-empirical or theoretical predictions have long been
sought which allow one to calculate the zero-shear viscosity
of a miscible polymer blend (h ob) in terms of the zero-shear
viscosities of constituent components (h oi) in the blend [20–
25]. It is reported that at isothermal conditions, plots of
log h ob versus composition exhibit a positive deviation for
blends with small difference in the glass transition (T g)
between constituent components, such as poly(methyl-
methacrylate) (PMMA)/poly(styrene-co-acrylonitrile)
Polymer 40 (1999) 6789–6801
0032-3861/99/$ - see front matter 1999 Elsevier Science Ltd. All rights reserved.
PII: S0032-3861(99) 00030-0
* Corresponding author. Tel.: 82-562-279-2276; fax: 82-562-279-
8298.
E-mail address: [email protected] (J.K. Kim)

8/4/2019 Ps Flow Prop
http://slidepdf.com/reader/full/ps-flow-prop 2/13
(PSAN) blend [21,23–25], and PS/poly(cyclohexyl
methacrylate) blend [22], whereas these plots show a nega-
tive deviation for blends with large difference (say 50C)
in the T gs between constituent components, such as
PS/PVME blend [3,26], PMMA/poly(vinylidene fluoride)
(PVDF) blend [20,23–25], PSAN/poly(e -caprolactone)
blend [27]. However, the above speculation does not always
lead in the right direction. For instance, plots of log h obversus composition at isothermal conditions for PS/poly-
(2,6-dimethyl-1,4-phenyleneether) (PPE) blend [28] and
1,2-polybutadiene/1,4-poly(butadine) blend [29] show a
positive deviation or linear relationship, even though
the difference in the T gs of two components is very large
(e.g. 100C).
According to Ougizawa and coworkers [30,31], a nega-
tive deviation from linearity in plots of log h ob versus
composition at isothermal condition can be expected for a
blend (e.g. PMMA/PVDF) with a positive excess volume of
mixing; whereas a positive deviation was found for another
blend (e.g. PS/PPE) with a negative excess volume of mixing. However, there is no comprehensive theory avail-
able at the present time to include this kind of an excess
volume of mixing to predict the blend viscosity [32]. In
order to predict the blend viscosity from the constituent
viscosities, some researchers [20–22] have developed a
mixing rule that is a quadratic form with respect to the
volume fraction. This kind of the mixing rule, however,
contains one additional (or adjustable) parameter that
cannot be obtained without measuring the viscosities of
the entire blend compositions. Han and Kim [23,24] devel-
oped a molecular viscoelastic theory that enables one to
predict the linear viscoelastic properties of miscible poly-mer blends. They showed that x plays a very important role
in determining the blend viscoelastic properties [23–
25,28,33], and that theoretical predictions of the linear
viscoelastic properties of the several blends, such as
PMMA/PVDF, PMMA/PSAN, PS/PPE, and poly(ethylene
oxide) (PEO)/poly(vinylacetate) and PEO/poly(vinylace-
tate-ran-ethylene) blends, are qualitatively consistent with
experimental data. But except for PS/PPE and PMMA/
PSAN blends, all blends have at least one semi-crystalline
polymer or very broad molecular weight distribution. In
addition, a PMMA/PSAN blend has a random copolymer
and very broad molecular weight distribution. As the study
of the viscoelastic properties of an amorphous polymerblend with similar T g of the constituent component has
been reported [22], in this study we employed another amor-
phous polymer blend of the PS/PVME system, as this has a
large difference in T g between constituent components.
Also, this system might be a supplement to the PS/PPE
blend system [28]. Although some have recently investi-
gated the rheological properties of PS/PVME blends near
the critical temperatures as well as in the homogeneous
regime [2–6], a few blend compositions were considered.
In this study, we have investigated in detail the rheologi-
cal properties of PS/PVME blends covering entire blend
compositions in the homogenous regime as well as near
the critical regime. The emphasis is placed on investigating
whether or not the changes in h ob with blend composition at
isothermal conditions are different from those at iso-free
volume conditions.
2. Experimental
2.1. Materials
The PS was synthesized via anionic polymerization using
a high vacuum apparatus. Cyclohexane was used as the
solvent with sec-butyl lithium as the initiator, and the reac-
tion temperature was 35C. The PVME in water solution
was purchased from Aldrich Chemical Co. After water
was completely removed, PVME was dissolved into toluene
(5 wt % of solute) and precipitated using hexane. The
weight average molecular weights and molecular weight
distributions were 117 000 and 1.06 for the PS, and
94 300 and 1.82 for the PVME. The molecular weight of
PS was determined from a calibration curve of monodis-
perse PS standards, while that of PVME was obtained by
a low-angle laser light scattering with the value of dn /dc �
0.063 ml/g.
2.2. Sample preparation for rheological measurement
Four blend compositions (10/90, 30/70, 50/50, 70/30 PS/
PVME by weight) as well as neat PS and PVME were
prepared by dissolving a predetermined amount of polymer
in benzene (10 wt % solute in solution) in the presence of an
antioxidant (Irganox 1010, Ciba-Geigy Group). The solu-
tion was freeze-dried at room temperature for 3 days under
vacuum and further dried at T g 40C for 2 days under
vacuum. The dried sample was compression-molded at T g
70C, except for the 70/30 PS/PVME blend which was
molded at 100C, into a sheet of 1 mm in thickness. As
the molding temperatures for all blends are lower than the
turbidity temperature, all blends are transparent.
2.3. Differential scanning calorimetry (DSC)
The glass transition temperature (T g) of each blend
sample was measured by differential scanning calorimetry
(Perkin-Elmer DSC 7 series). Prior to measurement, thebaseline was established using two empty pans. To prevent
thermal degradation, nitrogen gas was circulated around the
sample pan. Each sample of about 15 mg was first heated to
T g 50C, at a heating rate of 10C/min, annealed there for
3 min and quenched to T g 50C at a cooling rate of 200C/
min. The second heating was used to determine the T g of the
specimen.
2.4. Turbidity temperature measurement
Eight blend compositions for the turbidity temperature (T b)
measurement were prepared by dissolving a predetermined
J.K. Kim, H.W. Son / Polymer 40 (1999) 6789–68016790
8/4/2019 Ps Flow Prop
http://slidepdf.com/reader/full/ps-flow-prop 3/13
amount of polymer into toluene (10 wt % in solute) and
evaporating solvent slowly for 8 h at room temperature.
The sample thickness was
10 mm. The turbidity tempera-ture of each specimen was first estimated by the temperature
at which the scattering intensity at the scattering angle of
30 increased abruptly upon heating at a rate of 1C/min.
Then, the T b of the specimen was determined by the thresh-
old temperature above which the scattering intensity at 30
could be detected, as temperature was increased stepwise
with an interval of 1C from a temperature of 10C lower
than the above estimated value. (e.g. 100C for 30/70
blend). As the specimen was annealed for 1 h at each
temperature, the maximum error in the values of T bdetermined would be less than ^1C.
2.5. Rheological properties measurement
G H and G HH were measured at various temperatures as
functions of angular frequency (v ) using an Advanced
Rheometric Expanded System (ARES) covering the range
of v from 0.01 to 100 rad/s with 25 mm parallel-plates.
Before rheological properties measurement the sample
was soaked for at least 30 min at each temperature.
Temperature sweep experiments of GH and G
HH for various
blend compositions were carried out using an ARES at a
heating rate of 0.5C/min and v � 0.5 rad/s. The strain
amplitude (g o) for the frequency sweep experiment was
0.05, while that for the temperature sweep experiment was
0.07. Both values of g o lay in a linear viscoelastic range.
3. Results and discussion
3.1. Turbidity curve
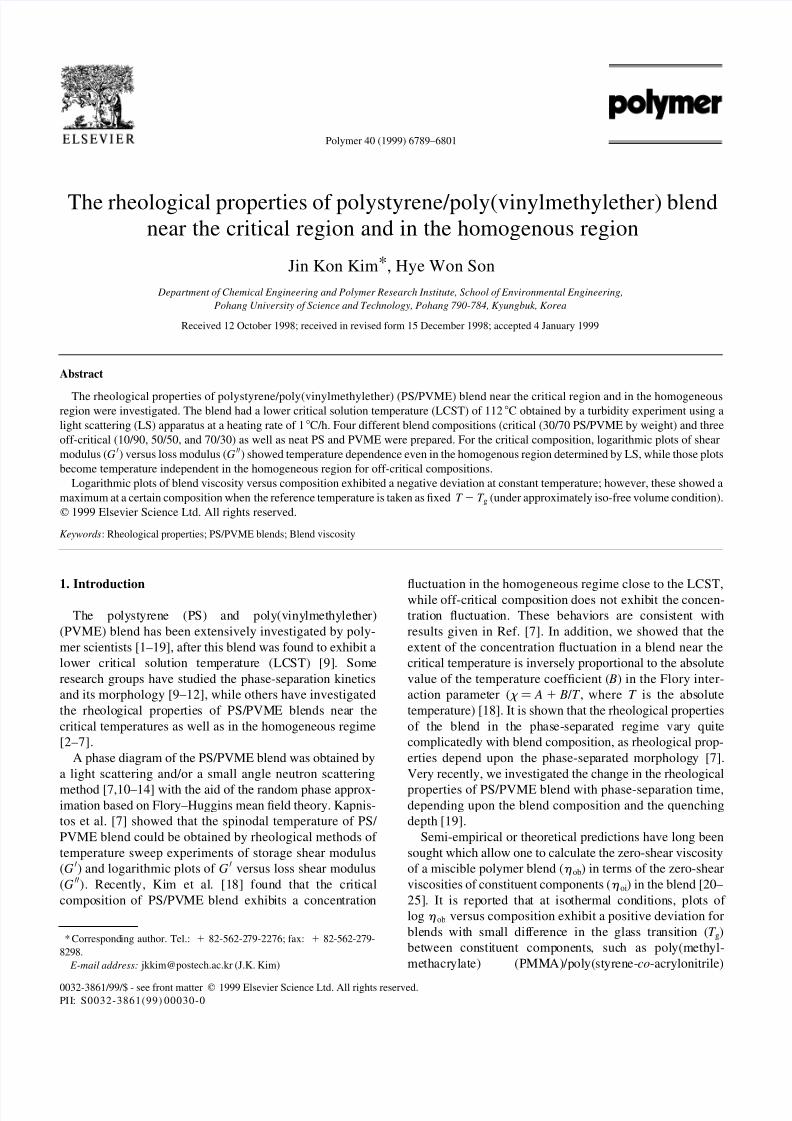
Fig. 1 gives composition-dependent cloud points (X)
determined by LS, composition-dependent glass transitions
of the onset point (T gi), the midpoint (T gm), and the final
point (T gf ), and the temperatures (x) where the rheological
properties were measured, for PS/PVME blends employed
in this study. From Fig. 1, the blend had a lower critical
solution temperature (LCST) of 112 ^ 1C, and the critical
weight faction of PS in the blend was 0.3. The interaction
energy density (a ) in mol/cm3 was obtained by Flory–
Huggins theory and given by [18]:
a � 0:478 × 103 �0:176 0:0062f PS� = T �1�
where f PS is the volume fraction of PS in the blend, and T is
the absolute temperature. The theoretically predicted
binodal curve obtained by Flory–Huggins theory with the
aid of Eq. (1) is given as a solid line, from which one notes
that the theoretical binodal curve is in good agreement with
turbidity results.
J.K. Kim, H.W. Son / Polymer 40 (1999) 6789–6801 6791
Fig. 1. Composition-dependent cloud points (X) determined from light scattering and glass transition temperatures T gi (W), T gm (K), and T gf (A) for PS/PVME
blend employed in this study. The solid line (—) is a binodal curve calculated from curve-fitting experimental data to the Flory–Huggins theory. The symbol
( × ) denotes temperatures at which rheological properties are measured.
8/4/2019 Ps Flow Prop
http://slidepdf.com/reader/full/ps-flow-prop 4/13
3.2. Miscibility of the blend determined by rheological
properties
3.2.1. Temperature sweep experiment
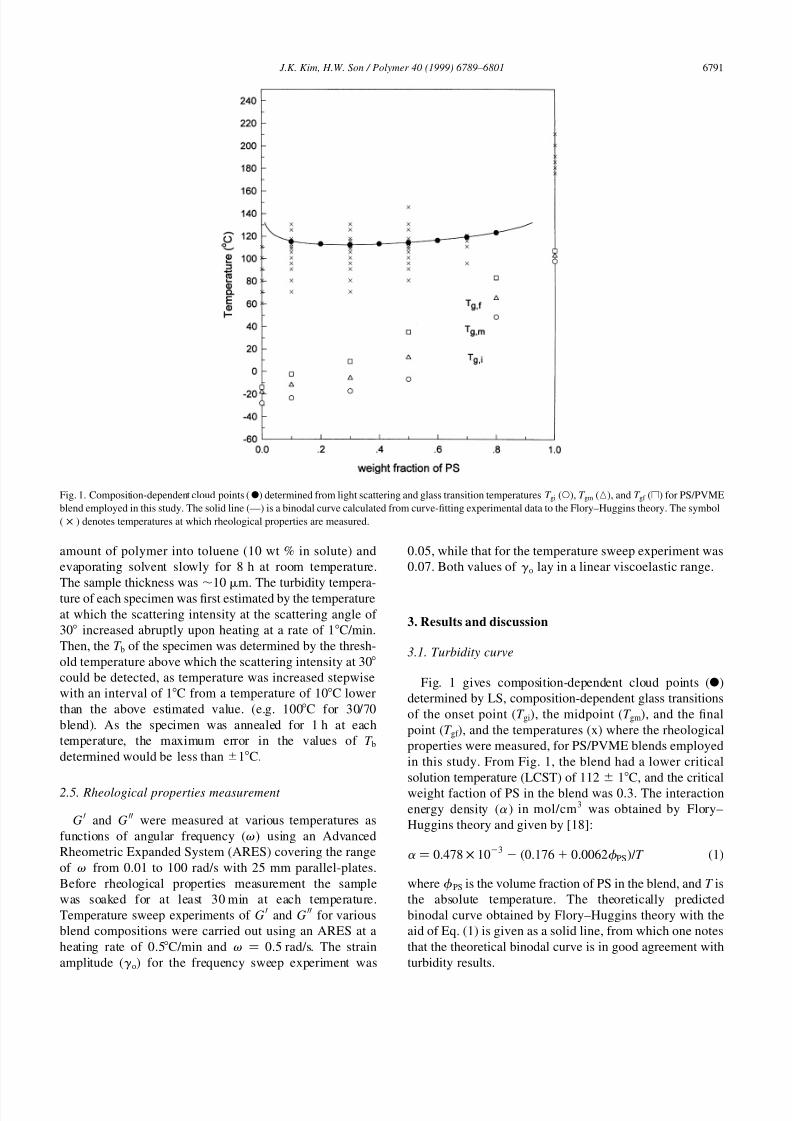
Fig. 2 shows temperature sweep of G H and G HH at v �
0.5 rad/s and g o � 0.07 for 30/70, 50/50, and 10/90 PS/
PVME blends. The onset temperature for the turbidity
(T in), above which the turbidity of the sample through the
window in a rheometer (RDS-II) could be observed visuallyduring shearing, is marked as the arrow ( 5 ) in each G H. The
values of the T in for 30/70, 50/50, and 10/90 PS/PVME
blends are 102C, 116C, and 113C, respectively. When
we consider the experimental errors in measuring T in and
T b, the values of the T in for the 50/50 and 10/90 PS/PVME
blends are essentially identical to those of the T b. However,
the T in for the 30/70 PS/PVME blend is smaller than the
LCST (112 ^ 1C) measured by the turbidity method.
This is not because of the thickness of the specimens
(1 mm) employed in rheometry compared with that
(10 mm) employed in LS method. We found that when
there was no shear, the turbidity temperature of a thick
sample judged by the naked eye was almost the same as
the LCST of a thinner sample measured by LS method.
This implies that the effect of the oscillatory shear on the
turbidity temperature (or shear-induced demixing or phase-
separation) was not neglible for the critical composition.
Mani et al. [4] reported that a shear-induced mixing and
demixing for a PS/PVME blend depended upon the shear
rate, shear stress and the blend composition. They found thata shear-induced demixing occurred at temperature as much
as 40C below the LCST. However, the flow type employed
in their study was a steady shear. Recently, investigating the
effect of oscillatory shear on the demixing process of the
blend of polyisoprene and polybutadiene using a large oscil-
latory shear amplitude (g o � 0.8), Matsuzaka et al. [34]
showed that the oscillatory shearing might induced the
phase demixing and mixing alternately depending on the
phase angle. However, in this study, although a small
g o (0.07) and v � 0.5 rad/s were applied to the critical
composition of the PS/PVME blend, the shear-induced
J.K. Kim, H.W. Son / Polymer 40 (1999) 6789–68016792
Fig. 2. Temperature sweep of G H (symbols) and G HH (lines) at v � 0.5 rad/s and g o � 0.07 for the 30/70 (K and —), the 50/50 (W and ….) and 10/90 (A and ---)
PS/PVME blends. The onset temperature for the turbidity (T in), above which the turbidity of the sample through the window in a rheometer (RDS-II) could be
observed visually, is marked as the arrow( 5 ) in each G H.
8/4/2019 Ps Flow Prop
http://slidepdf.com/reader/full/ps-flow-prop 5/13
phase-separation (or demixing) was observed even at
temperatures as much as 10C below the LCST obtained
without shearing flow. This is attributed to the fact that
the concentration fluctuation in the blend found at tempera-
tures corresponding to the homogeneous state but close to
the LCST can be accelerated by the oscillatory shearing,
thus a shear-induced phase-separation might occur. Once
the phase-separation took place, the viscoelastic propertieswere increased as shown in Fig. 2. As the concentration
fluctuation is the largest for the critical composition, the
oscillatory shear-induced phase-separation would be small
for off-critical compositions such as the 10/90 and 50/50 PS/
PVME blends.
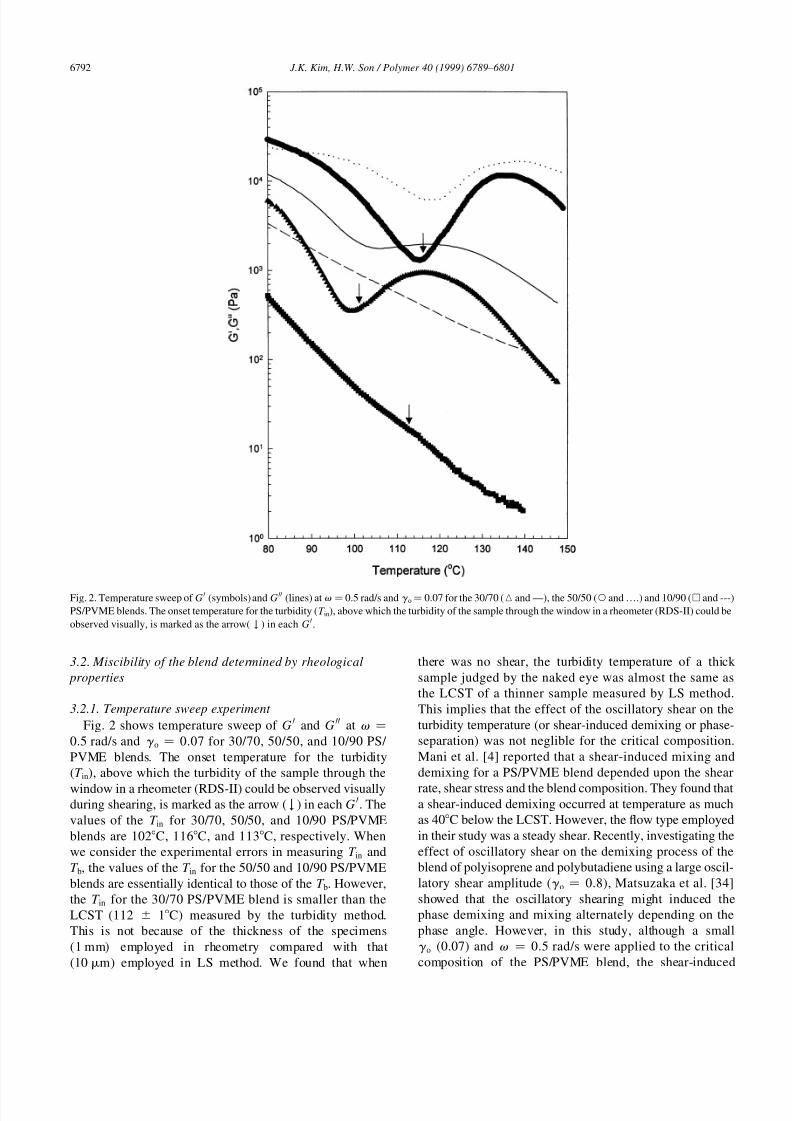
In order to investigate whether the shear-induced phase-
separation indeed occurred at temperatures lower than the
LCST, we observed the morphology of the 30/70 blend by
using a scanning electron microscope (Field Emission SEM;
Hitachi 301). The sample preparation for SEM was as
follows. First, the blend was loaded at 70C in the rheometer
and maintained at this temperature for 30 min. At this
moment, the blend was transparent, which was judgedvisually through the window in the rheometer. Then, the
temperature inside the rheometer was increased to 105C
at a rate of 0.5C/min while successive oscillatory shearing
with v � 0.5 rad/s and g o � 0.07 was imposed to the
sample. When the temperature reached 102C (namely
T in), the sample became turbid for the first time. Then, the
sample became more turbid as the temperature increased
further. When the sample temperature reached 105C, the
oscillatory shearing stopped and the sample was rapidly
quenched to a temperature lower than the T g of this blend
by flowing liquid nitrogen into the rheometer. It took less
than 10 s to reach this temperature; thus the morphology
was successfully fixed as described in a previous paper
[19]. Finally, the PVME rich phase in the blend was etched
out by methanol for 10 min, then coated with a thin layer of
gold.
Fig. 3 gives the SEM image of the 30/70 PS/PVME blend
showing clearly the co-continuous structure with a domain
spacing of 0.3 mm, which is similar to phase-separation
structure found in the early stage of spinodal decomposition.
Previously, we reported that for the 30/70 PS/PVME blends
having co-continuous structure with large interdomain
spacing (say 2 mm), the PS-rich phase appeared to be
dispersed-phase [19]. However, in this study, the PS-rich
phase seemed to be matrix phase. But, the SEM image as
shown in Fig. 3 was the overlap image of many layers
consisting of PS-rich and etched-out PVME-rich phases
having small domain spacing (0.3 mm). Thus, the PS-
rich phase in Fig. 3 should be considered as dispersed-phase.
On the basis of the results given in Figs. 2 and 3, we
concluded that the turbidity judged visually was not becauseof the concentration fluctuation itself, but to the existence of
distinct phase-separation resulting from the enhanced
concentration fluctuation. This kind of co-continuous struc-
ture from the phase-separation definitely increased the
modulus. We also found that the sample in the edge of the
plates was most turbid because the parallel-plate fixture was
employed. However, when the oscillatory shearing stopped
at 105C, the turbid sample returned to be transparent after
4 h. Interestingly, the T in was dependent upon the frequency.
For instance, the T in obtained under v � 50 rad/s and g o �
0.07 was 106C, which is 4C higher than that obtained
under v �
0.5 rad/s and g o�
0.07. The above results led usconclude that the oscillatory shearing also induced a phase-
separation for the critical composition of PS/PVME blend.
It can be also seen in Fig. 2 that for the 30/70 PS/PVME
blend G H decreased up to 100C upon heating, as this regime
was indeed in the homogenous state. Then, GH and G
HH
increased up to 118C with increasing temperature. Interest-
ingly, the temperature of 100C above which GH increases
for the first time was very close to the T in, which is definitely
lower than the LCST measured by LS method. This is
caused by the shear-induced phase-separation resulting
from the enhanced concentration fluctuation in the homo-
genous regime near the critical temperature, as described
already. The increase in moduli with temperature in therange from 100C to 118C is attributed to the formation
of phase-separated morphology. In addition, the tempera-
ture where G H increases for the first time is 6C lower than
that for GHH, and the increase in G
H is more evident than that
in G HH. This suggests that G H becomes more sensitive to the
existence of phase-separation than G HH does, which was
often found for microphase-separated block copolymers
[35–38]. Finally, at higher temperatures where the mobility
effect for reducing modulus becomes dominant over the
phase-separation effect for increasing modulus, G H and G HH
decreased again. Applying the concentration fluctuation
J.K. Kim, H.W. Son / Polymer 40 (1999) 6789–6801 6793
Fig. 3. Field emission SEM image of the 30/70 PS/PVME blend at 105C
while imposing successive oscillatory shearing at v � 0.5 rad/s and g o �
0.07.

8/4/2019 Ps Flow Prop
http://slidepdf.com/reader/full/ps-flow-prop 6/13
concept for a block copolymer developed by Fredrickson
and Helfand [39] in a homogenous state near the critical
point to polymer blend, the spinodal temperature of the
blend can be determined by the plots of �G HH2 = G
HT �2 = 3 versus
1/ T [7,40]. The spinodal temperature (T s) of the 30/70 PS/
PVEM blend obtained from this plots was 110C.
For the 50/50 PS/PVME blend, the moduli change with
temperature is very similar to that for the critical blend,namely, the moduli first decrease, then increase, and finally
decrease upon heating. The T s of this blend was estimated to
be 135C from the plots of �G HH2 = G
HT �2 = 3 versus 1/ T [7,40].
The estimated T s was 21C higher than the T b (114C). The
difference between the two seems to be too large even if we
consider that the former of an off-critical composition
should be larger than the latter. Thus, the T s obtained from
this method for a critical composition can be estimated more
reliably than that for off-critical compositions, as this
method was originally derived for the critical composition
of a blend.
However, the moduli change with temperature for the 10/
90 PS/PVME blend is quite different from that for the 30/70
and 50/50 blends. For instance, the moduli steadily
decreased with temperature even if phase-separation
occurred. But the slope of G H versus temperature plots
may change at 115C, although the blend becomes turbid
for the first time at 113C. The steady decrease in the modu-
lus with temperature is as a result of the highly asymmetricblend composition where the rheological properties of the
blend with phase-separated morphology are very similar to
those of the blend without phase-separated morphology
[19].
3.2.2. Frequency sweep experiment
Log G H versus log G HH plots have been widely used for
polymer blends, block copolymers, and liquid crystalline
polymer [35–37,41]. It is generally known that the blend
under investigation becomes homogenous at a specific
temperature where these plots do not depend on temperature
J.K. Kim, H.W. Son / Polymer 40 (1999) 6789–68016794
Fig. 4. (a) Log G H versus log v plots and (b) log G HH versus log v plots of the 30/70 PS/PVME blend at various temperatures.
8/4/2019 Ps Flow Prop
http://slidepdf.com/reader/full/ps-flow-prop 7/13
any more. Fig. 4 gives log GH versus log v plots and log G
HH
versus log v plots for the 30/70 PS/PVME blend measured
from 70C to 130C. Using the data given in Fig. 4, we
prepared log G H versus log G HH plots, which are given in
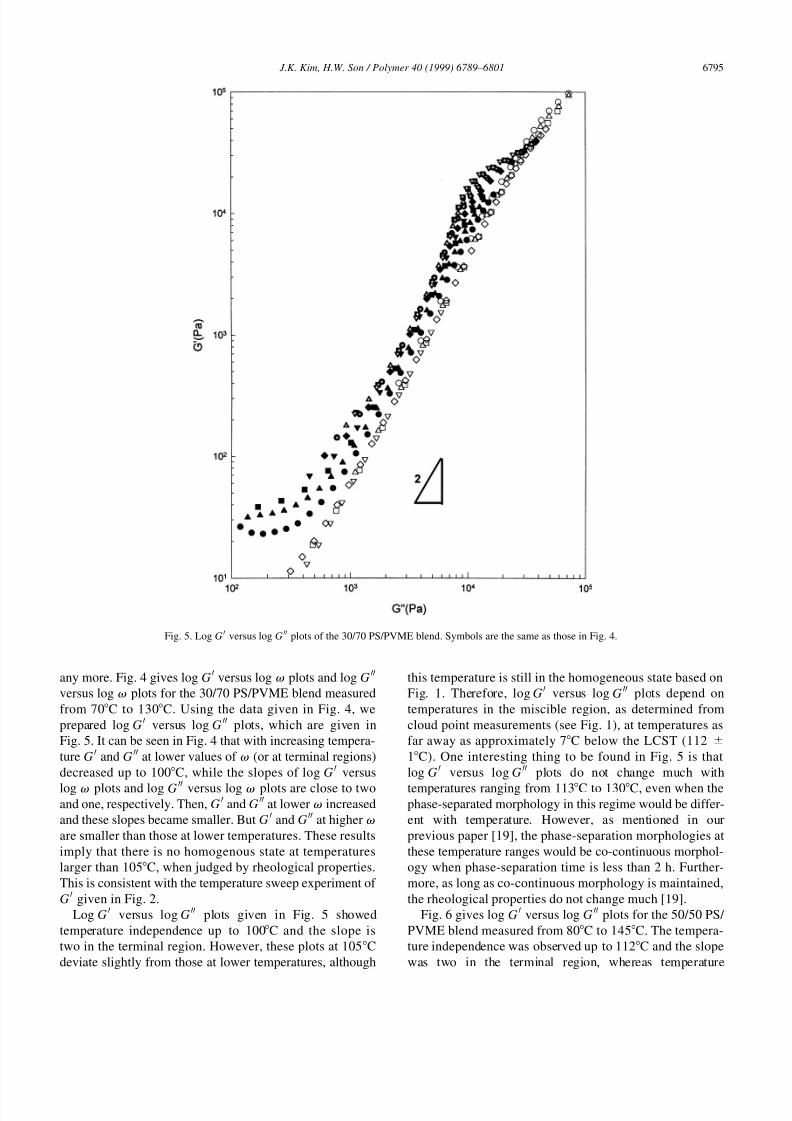
Fig. 5. It can be seen in Fig. 4 that with increasing tempera-
ture G H and G HH at lower values of v (or at terminal regions)
decreased up to 100C, while the slopes of log G H versus
log v plots and log G HH versus log v plots are close to twoand one, respectively. Then, G
H and GHH at lower v increased
and these slopes became smaller. But G H and G HH at higher v
are smaller than those at lower temperatures. These results
imply that there is no homogenous state at temperatures
larger than 105C, when judged by rheological properties.
This is consistent with the temperature sweep experiment of
GH given in Fig. 2.
Log G H versus log G HH plots given in Fig. 5 showed
temperature independence up to 100C and the slope is
two in the terminal region. However, these plots at 105C
deviate slightly from those at lower temperatures, although
this temperature is still in the homogeneous state based on
Fig. 1. Therefore, log G H versus log GHH plots depend on
temperatures in the miscible region, as determined from
cloud point measurements (see Fig. 1), at temperatures as
far away as approximately 7C below the LCST (112 ^
1C). One interesting thing to be found in Fig. 5 is that
log G H versus log G HH plots do not change much with
temperatures ranging from 113C to 130C, even when thephase-separated morphology in this regime would be differ-
ent with temperature. However, as mentioned in our
previous paper [19], the phase-separation morphologies at
these temperature ranges would be co-continuous morphol-
ogy when phase-separation time is less than 2 h. Further-
more, as long as co-continuous morphology is maintained,
the rheological properties do not change much [19].
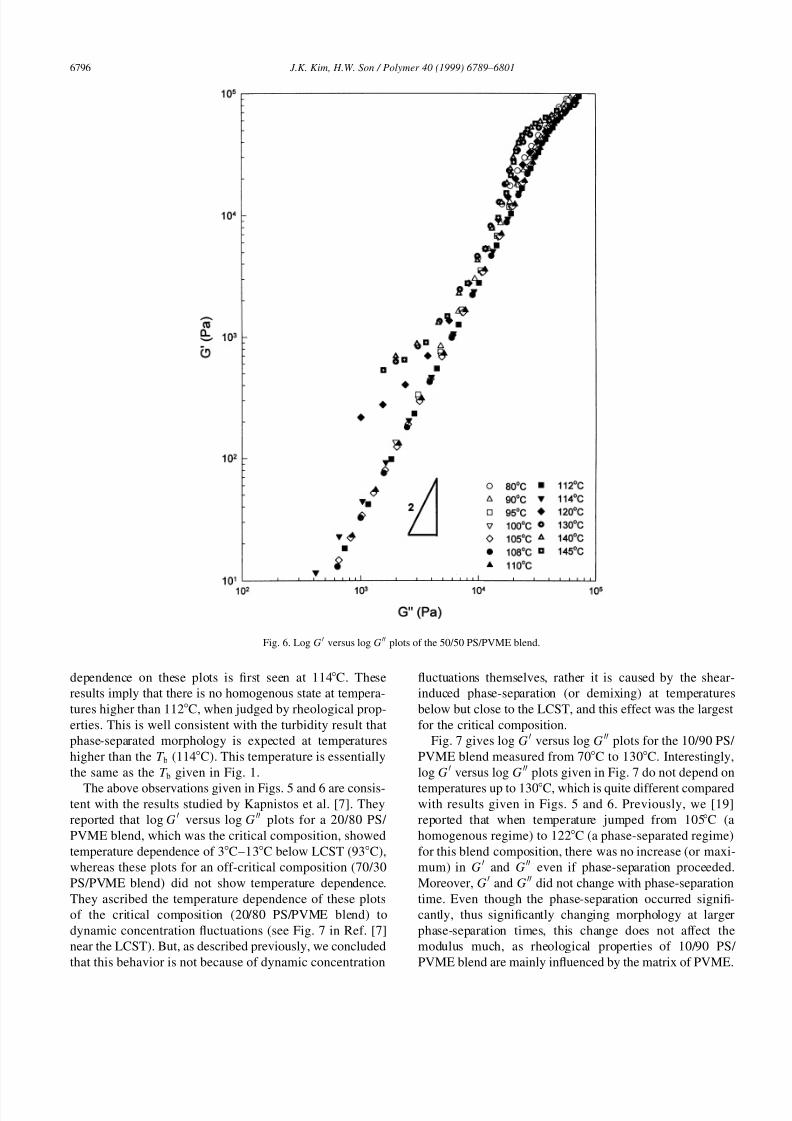
Fig. 6 gives log GH versus log G HH plots for the 50/50 PS/
PVME blend measured from 80C to 145C. The tempera-
ture independence was observed up to 112C and the slope
was two in the terminal region, whereas temperature
J.K. Kim, H.W. Son / Polymer 40 (1999) 6789–6801 6795
Fig. 5. Log G H versus log G HH plots of the 30/70 PS/PVME blend. Symbols are the same as those in Fig. 4.
8/4/2019 Ps Flow Prop
http://slidepdf.com/reader/full/ps-flow-prop 8/13
dependence on these plots is first seen at 114C. These
results imply that there is no homogenous state at tempera-
tures higher than 112C, when judged by rheological prop-
erties. This is well consistent with the turbidity result that
phase-separated morphology is expected at temperatures
higher than the T b (114C). This temperature is essentially
the same as the T b given in Fig. 1.
The above observations given in Figs. 5 and 6 are consis-tent with the results studied by Kapnistos et al. [7]. They
reported that log G H versus log G HH plots for a 20/80 PS/
PVME blend, which was the critical composition, showed
temperature dependence of 3C–13C below LCST (93C),
whereas these plots for an off-critical composition (70/30
PS/PVME blend) did not show temperature dependence.
They ascribed the temperature dependence of these plots
of the critical composition (20/80 PS/PVME blend) to
dynamic concentration fluctuations (see Fig. 7 in Ref. [7]
near the LCST). But, as described previously, we concluded
that this behavior is not because of dynamic concentration
fluctuations themselves, rather it is caused by the shear-
induced phase-separation (or demixing) at temperatures
below but close to the LCST, and this effect was the largest
for the critical composition.
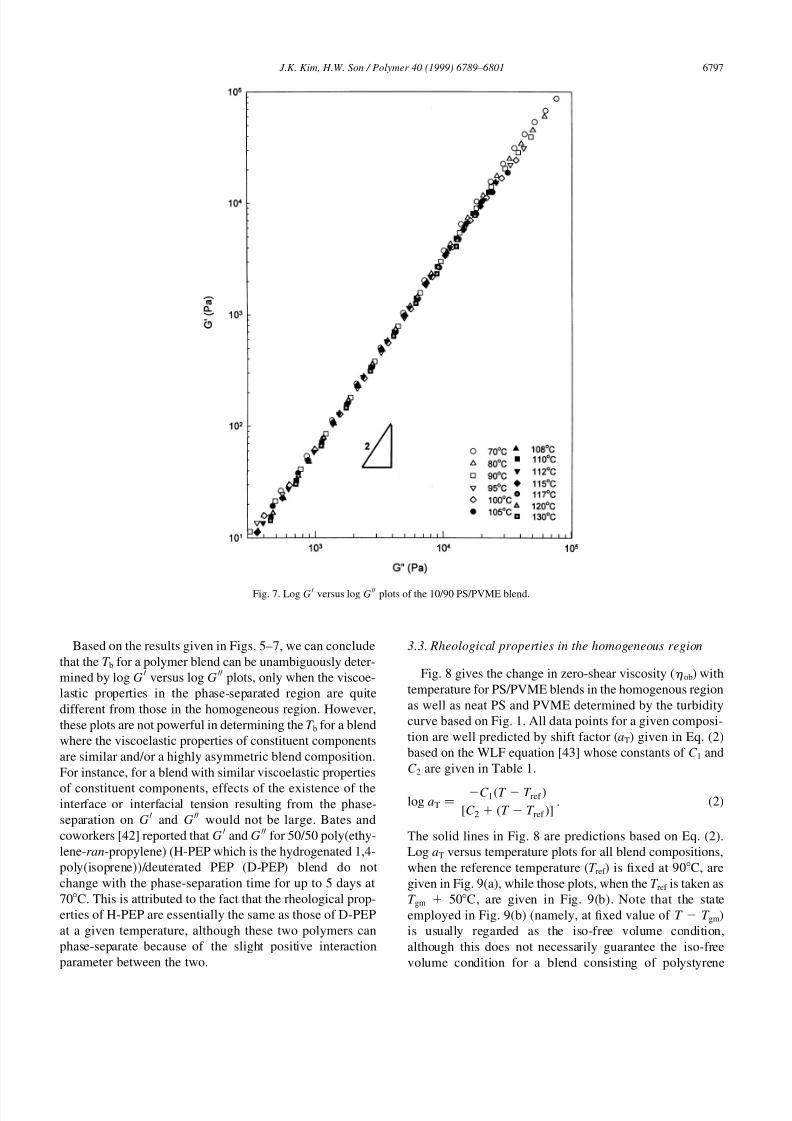
Fig. 7 gives log GH versus log G
HH plots for the 10/90 PS/
PVME blend measured from 70C to 130C. Interestingly,
log G H versus log G HH plots given in Fig. 7 do not depend on
temperatures up to 130C, which is quite different comparedwith results given in Figs. 5 and 6. Previously, we [19]
reported that when temperature jumped from 105C (a
homogenous regime) to 122C (a phase-separated regime)
for this blend composition, there was no increase (or maxi-
mum) in G H and G HH even if phase-separation proceeded.
Moreover, G H and G HH did not change with phase-separation
time. Even though the phase-separation occurred signifi-
cantly, thus significantly changing morphology at larger
phase-separation times, this change does not affect the
modulus much, as rheological properties of 10/90 PS/
PVME blend are mainly influenced by the matrix of PVME.
J.K. Kim, H.W. Son / Polymer 40 (1999) 6789–68016796
Fig. 6. Log G H versus log G HH plots of the 50/50 PS/PVME blend.
8/4/2019 Ps Flow Prop
http://slidepdf.com/reader/full/ps-flow-prop 9/13
Based on the results given in Figs. 5–7, we can conclude
that the T b for a polymer blend can be unambiguously deter-
mined by log GH versus log G
HH plots, only when the viscoe-
lastic properties in the phase-separated region are quite
different from those in the homogeneous region. However,
these plots are not powerful in determining the T b for a blend
where the viscoelastic properties of constituent components
are similar and/or a highly asymmetric blend composition.
For instance, for a blend with similar viscoelastic properties
of constituent components, effects of the existence of theinterface or interfacial tension resulting from the phase-
separation on G H and G HH would not be large. Bates and
coworkers [42] reported that G H and G HH for 50/50 poly(ethy-
lene-ran-propylene) (H-PEP which is the hydrogenated 1,4-
poly(isoprene))/deuterated PEP (D-PEP) blend do not
change with the phase-separation time for up to 5 days at
70C. This is attributed to the fact that the rheological prop-
erties of H-PEP are essentially the same as those of D-PEP
at a given temperature, although these two polymers can
phase-separate because of the slight positive interaction
parameter between the two.
3.3. Rheological properties in the homogeneous region
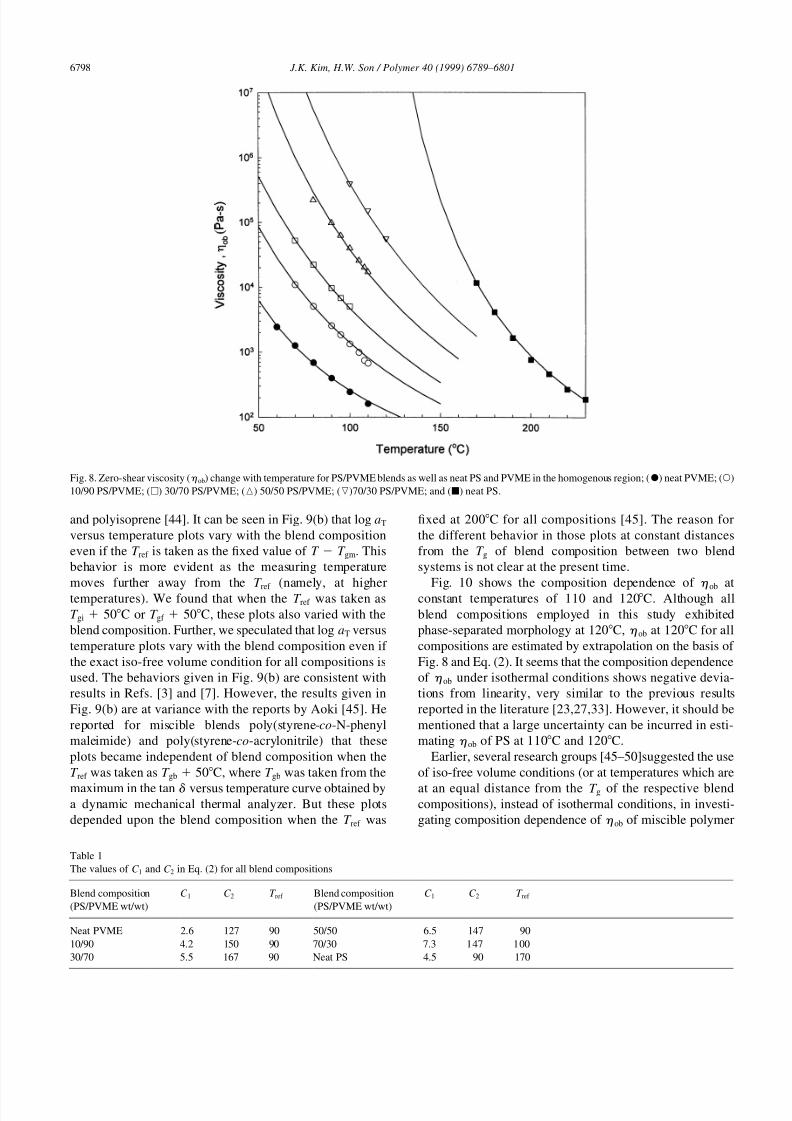
Fig. 8 gives the change in zero-shear viscosity (h ob) with
temperature for PS/PVME blends in the homogenous region
as well as neat PS and PVME determined by the turbidity
curve based on Fig. 1. All data points for a given composi-
tion are well predicted by shift factor (aT) given in Eq. (2)
based on the WLF equation [43] whose constants of C 1 and
C 2 are given in Table 1.
log aT �C 1�T T ref �
�C 2 �T T ref ��: �2�
The solid lines in Fig. 8 are predictions based on Eq. (2).
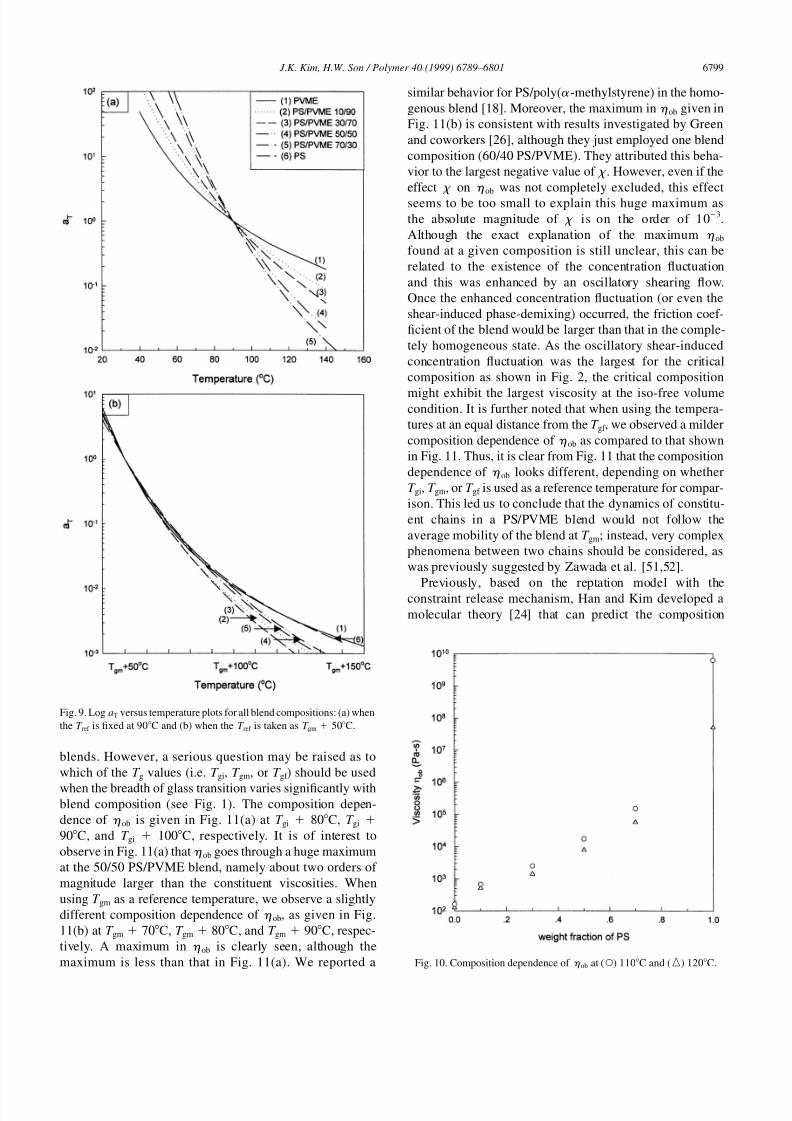
Log aT versus temperature plots for all blend compositions,
when the reference temperature (T ref ) is fixed at 90C, are
given in Fig. 9(a), while those plots, when the T ref is taken as
T gm 50C, are given in Fig. 9(b). Note that the state
employed in Fig. 9(b) (namely, at fixed value of T T gm)
is usually regarded as the iso-free volume condition,
although this does not necessarily guarantee the iso-free
volume condition for a blend consisting of polystyrene
J.K. Kim, H.W. Son / Polymer 40 (1999) 6789–6801 6797
Fig. 7. Log G H versus log G HH plots of the 10/90 PS/PVME blend.
8/4/2019 Ps Flow Prop
http://slidepdf.com/reader/full/ps-flow-prop 10/13
and polyisoprene [44]. It can be seen in Fig. 9(b) that log aT
versus temperature plots vary with the blend composition
even if the T ref is taken as the fixed value of T T gm. This
behavior is more evident as the measuring temperature
moves further away from the T ref (namely, at highertemperatures). We found that when the T ref was taken as
T gi 50C or T gf 50C, these plots also varied with the
blend composition. Further, we speculated that log aT versus
temperature plots vary with the blend composition even if
the exact iso-free volume condition for all compositions is
used. The behaviors given in Fig. 9(b) are consistent with
results in Refs. [3] and [7]. However, the results given in
Fig. 9(b) are at variance with the reports by Aoki [45]. He
reported for miscible blends poly(styrene-co-N-phenyl
maleimide) and poly(styrene-co-acrylonitrile) that these
plots became independent of blend composition when the
T ref was taken as T gb 50C, where T gb was taken from the
maximum in the tan d versus temperature curve obtained bya dynamic mechanical thermal analyzer. But these plots
depended upon the blend composition when the T ref was
fixed at 200C for all compositions [45]. The reason for
the different behavior in those plots at constant distances
from the T g of blend composition between two blend
systems is not clear at the present time.
Fig. 10 shows the composition dependence of h ob atconstant temperatures of 110 and 120C. Although all
blend compositions employed in this study exhibited
phase-separated morphology at 120C, h ob at 120C for all
compositions are estimated by extrapolation on the basis of
Fig. 8 and Eq. (2). It seems that the composition dependence
of h ob under isothermal conditions shows negative devia-
tions from linearity, very similar to the previous results
reported in the literature [23,27,33]. However, it should be
mentioned that a large uncertainty can be incurred in esti-
mating h ob of PS at 110C and 120C.
Earlier, several research groups [45–50]suggested the use
of iso-free volume conditions (or at temperatures which are
at an equal distance from the T g of the respective blendcompositions), instead of isothermal conditions, in investi-
gating composition dependence of h ob of miscible polymer
J.K. Kim, H.W. Son / Polymer 40 (1999) 6789–68016798
Fig. 8. Zero-shear viscosity (h ob) change with temperature for PS/PVME blends as well as neat PS and PVME in the homogenous region; (X) neat PVME; (W)
10/90 PS/PVME; (A) 30/70 PS/PVME; (K) 50/50 PS/PVME; (L)70/30 PS/PVME; and (B) neat PS.
Table 1
The values of C 1 and C 2 in Eq. (2) for all blend compositions
Blend composition
(PS/PVME wt/wt)
C 1 C 2 T ref Blend composition
(PS/PVME wt/wt)
C 1 C 2 T ref
Neat PVME 2.6 127 90 50/50 6.5 147 90
10/90 4.2 150 90 70/30 7.3 147 100
30/70 5.5 167 90 Neat PS 4.5 90 170
8/4/2019 Ps Flow Prop
http://slidepdf.com/reader/full/ps-flow-prop 11/13
blends. However, a serious question may be raised as to
which of the T g values (i.e. T gi, T gm, or T gf ) should be used
when the breadth of glass transition varies significantly withblend composition (see Fig. 1). The composition depen-
dence of h ob is given in Fig. 11(a) at T gi 80C, T gi
90C, and T gi 100C, respectively. It is of interest to
observe in Fig. 11(a) that h ob goes through a huge maximum
at the 50/50 PS/PVME blend, namely about two orders of
magnitude larger than the constituent viscosities. When
using T gm as a reference temperature, we observe a slightly
different composition dependence of h ob, as given in Fig.
11(b) at T gm 70C, T gm 80C, and T gm 90C, respec-
tively. A maximum in h ob is clearly seen, although the
maximum is less than that in Fig. 11(a). We reported a
similar behavior for PS/poly(a-methylstyrene) in the homo-
genous blend [18]. Moreover, the maximum in h ob given in
Fig. 11(b) is consistent with results investigated by Green
and coworkers [26], although they just employed one blend
composition (60/40 PS/PVME). They attributed this beha-
vior to the largest negative value of x . However, even if the
effect x on h ob was not completely excluded, this effect
seems to be too small to explain this huge maximum as
the absolute magnitude of x is on the order of 103.
Although the exact explanation of the maximum h obfound at a given composition is still unclear, this can be
related to the existence of the concentration fluctuation
and this was enhanced by an oscillatory shearing flow.
Once the enhanced concentration fluctuation (or even the
shear-induced phase-demixing) occurred, the friction coef-
ficient of the blend would be larger than that in the comple-
tely homogeneous state. As the oscillatory shear-induced
concentration fluctuation was the largest for the critical
composition as shown in Fig. 2, the critical composition
might exhibit the largest viscosity at the iso-free volumecondition. It is further noted that when using the tempera-
tures at an equal distance from the T gf , we observed a milder
composition dependence of h ob as compared to that shown
in Fig. 11. Thus, it is clear from Fig. 11 that the composition
dependence of h ob looks different, depending on whether
T gi, T gm, or T gf is used as a reference temperature for compar-
ison. This led us to conclude that the dynamics of constitu-
ent chains in a PS/PVME blend would not follow the
average mobility of the blend at T gm; instead, very complex
phenomena between two chains should be considered, as
was previously suggested by Zawada et al. [51,52].
Previously, based on the reptation model with theconstraint release mechanism, Han and Kim developed a
molecular theory [24] that can predict the composition
J.K. Kim, H.W. Son / Polymer 40 (1999) 6789–6801 6799
Fig. 9. Log aT versus temperature plots for all blend compositions: (a) when
the T ref is fixed at 90C and (b) when the T ref is taken as T gm 50C.
Fig. 10. Composition dependence of h ob at (W) 110C and (e) 120C.

8/4/2019 Ps Flow Prop
http://slidepdf.com/reader/full/ps-flow-prop 12/13
dependence of h ob for a miscible blend at the isothermal
condition. However, as a result of many uncertainties in
estimating the h o values at 110C and 120C for homo-
polymer PS, we could not apply the above theory for the
prediction of the log h ob versus composition plots.
4. Concluding remarks
In this study, we have shown that the rheological proper-
ties of PS/PVME blend were dependent upon the blend
composition. For the critical composition, log GH versus
log G HH plots show temperature dependence even in the
homogenous region determined by LS method, while
those plots become temperature independent in the homo-
geneous region for off-critical compositions. This is because
of the oscillatory shear-induced phase-separation and this
behavior was most evident for the critical composition.
The logarithmic plots of blend viscosity (h ob) versus
composition exhibit a negative deviation at a constant
temperature, whereas these show a maximum at a certain
composition when the reference temperature is taken as
fixed value of T T g (under approximately iso-free volume
condition). However, we found that the composition depen-
dence of h ob looks different, depending on whether T gi, T gm,
or T gf is used as a reference temperature for comparison.
This led us to conclude that the dynamics of chains in a
PS/PVME blend would not follow the average mobility of
the blend at T gm; instead, very complex phenomena between
two chains should be considered.
Acknowledgements
This work was supported by the Korean Foundation of
Science and Engineering (#97-05-02-03-01-3).
References
[1] Stadler PF, Feitas LL, Krieger V, Klotz S. Polymer 1988;29:1643.
[2] Ajji A, Choplin L, Prud’homme RE. J Polym Sci: Phys Ed
1991;29:1573.
[3] Schneider HA, Wirbser J. New Polym Mater 1990;2:149.
[4] Mani S, Malone MF, Winter HH. Macromolecules 1992;25:5671.
[5] Takahashi Y, Susuki H, Nakagawa, Noda I. Macromolecules
1994;27:6476.
[6] Takahashi Y, Susuki H, Nakagawa Y, Noda I. PolymInt 1994;34:327.
[7] Kapnistos M, Hinrichs A, Vlassopoulos D, Anastasiadis SH, Stammer
A, Wolf BA. Macromolecules 1996;29:7155.
[8] Polios IS, Soliman M, Lee C, Gido SP, Schmidt-Rohr K, Winter HH.
Macromolecules 1997;30:4470.
[9] Nishi T, Wang TT, Kwei TK. Macromolecules 1975;8:227.
[10] Hashimoto T, Kumaki J, Kawai T. Macromolecules 1983;16:641.
[11] Hashimoto T, Itakura M, Hasegawa H. J Chem Phys 1986;16:6118.
[12] Yang H, Shibayama M, Stein RS, Shimizu N, Hashimoto T. Macro-
molecules 1986;19:1667.
[13] Okada M, Han CC. J Chem Phys 1986;85:5317.
[14] Han CC, Okada M, Muroga Y, Bauer BJ, Tran-Cong Q. Polym Eng
Sci 1986;26:1208.
[15] Shibayama M, Yang H, Stein RS, Han CC. Macromolecules
1985;18:2179.
[16] Fernamdez ML, Higgins JS, Horst R, Wolf BA. Polymer
1995;36:149.
[17] Fernamdez ML, Higgins JS, Richardson SM. Polymer 1995;36:931.
[18] Kim JK, Lee HH, Son HW, Han CD. Macromolecules 1998;31:8566.
[19] Kim JK, Son HW, Lee YB, Kim J. J Polym Sci: Polym Phys Ed 1999.
In press.
[20] Wu S. J Polym Sci: Polym Phys Ed 1987;25:557, 2511.
[21] Wu S. Polymer 1987;28:1144.
[22] Friedrich C, Schawarzwalder C, Riemanm RE. Polymer
1996;37:2499.
[23] Han CD, Kim JK. Macromolecules 1989;22:1914.
[24] Han CD, Kim JK. Macromolecules 1989;22:4292.
[25] Yang HH, Han CD, Kim JK. Polymer 1994;35:1503.
[26] Green PF, Adolf DB, Gilliom LR. Macromolecules 1991;24:3377.
[27] Han CD, Yang HH. J Apply Polym Sci 1987;33:1199.
[28] Kim JK, Han CD, Lee YJ. Polymer J 1992;24:205.
[29] Roover J, Toporowski PM. Macromolecules 1992;25:1096, 3454.
J.K. Kim, H.W. Son / Polymer 40 (1999) 6789–68016800
Fig. 11. (a) Composition dependence of h ob at T gi 80C (W), T gi 90C
(e), and T gi 100C (A). (b) Composition dependence of h ob at T gm
70C (W), T gm 80C (e), and T gm 90C (A).

8/4/2019 Ps Flow Prop
http://slidepdf.com/reader/full/ps-flow-prop 13/13
[30] Ougizawa T. Polymer Prep (Japan) 1990;39:1217.
[31] Ougizawa T, Dee GT, Walsa DJ. Polymer Prep (Japan) 1990;39:
3539.
[32] Personal Communication with Ougizawa T (Sept 1998).
[33] Han CD, Chung HS, Kim JK. Polymer 1992;33:546.
[34] Matsuzaka K, Jinnai H, Koga T, Hashimoto T. Macromolecules
1997;30:1146.
[35] Han CD, Kim JK. Polymer 1993;34:2533.
[36] Han CD, Baek DM, Kim JK. Macromolecules 1990;23:561.[37] Han CD, Baek DM, Kim JK, Ogawa T, Hashimoto T. Macromole-
cules 1995;28:5043.
[38] Bates FS. Macromolecules 1984;17:2607.
[39] Fredrickson GH, Helfand E. J Chem Phys 1987;87:697.
[40] Ajji A, Choplin L. Macromolecules 1991;24:5221.
[41] Kim SS, Han CD. Macromolecules 1993;26:6633.
[42] Kedrowski C, Bates FS, Eiltzius P. Macromolecules 1993;26:3448.
[43] Ferry JD. Viscoelastic properties of polymers. New York: Wiley,
1980.
[44] Chapman BR, Hamersky MW, Milhaupt JM, Kostelecky C, Lodge
TP, von Meerwall ED, Smith SD. Macromolecules 1998;31:4562.
[45] Aoki Y. Macromolecules 1990;23:2309.
[46] Roland CM, Ngai KL. Macromolecules 1991;24 2261:5315.
[47] Chung G-C, Kornfield JA, Smith SD. Macromolecules 1994;27:964,
5729.
[48] Arendt BH, Krishnamoorti R, Kannan RM, Zawail M, Kornfield JA,Smith SD. Polym Mater Sci Eng 1994;71:471.
[49] Kim E, Kramer EJ, Osby JO. Macromolecules 1995;28:1979.
[50] Kim E, Kramer EJ, Wu W, Garrett PD. Polymer 1994;35:5706.
[51] Zawada JA, Ylitalo CM, Fuller GG, Colby RH, Long TE. Macromo-
lecules 1992;25:2896.
[52] Zawada JA, Fuller GG, Colby RH, Fetters LJ, Roover J. Macromo-
lecules 1994;27:6851–6861.
J.K. Kim, H.W. Son / Polymer 40 (1999) 6789–6801 6801