prtg network monitor 7 - user manual
TRANSCRIPT

© 2008 Paessler AG
PRTG Network Monitor 7 -User Manual

PRTG Network Monitor 7 - User Manual2
© 2008 Paessler AG
Table of Contents
Part I System Requirements 6
Part II Installation 8
................................................................................................................................... 81 Downloading the Software
................................................................................................................................... 82 Upgrading to Version 7 from Previous Versions
................................................................................................................................... 83 Installation of a PRTG Core Server
................................................................................................................................... 134 Installation of a PRTG Remote Probe
................................................................................................................................... 135 Uninstallation
Part III Introduction 15
................................................................................................................................... 151 Key Features
................................................................................................................................... 162 Available Licenses
................................................................................................................................... 173 About This Document
Part IV Basic Concepts of PRTG Network Monitor 19
................................................................................................................................... 191 Architecture: PRTG Core Server and PRTG Probe
................................................................................................................................... 202 Object Hierarchy: Probes, Groups, Devices, Sensors, Channels
................................................................................................................................... 213 Inheritance of Settings
................................................................................................................................... 224 Notifications, Schedules, and Dependencies
................................................................................................................................... 235 Reports, Maps, and Todos
................................................................................................................................... 246 Priorities and Favorite Sensors
................................................................................................................................... 247 Default Values
Part V User Interfaces 27
................................................................................................................................... 281 Web Interface Navigation
................................................................................................................................... 292 Web Page Overview
................................................................................................................................... 313 Context Menus
................................................................................................................................... 324 Lists
................................................................................................................................... 335 Monitoring Status Information Available Through the Web
Interface
................................................................................................................................... 346 System Tray Notifier
................................................................................................................................... 357 iPhone User Interface
Part VI Sensor Setup 38
................................................................................................................................... 381 Reviewing Settings of the Root Group
................................................................................................................................... 392 Creating Groups, Devices and Sensors Manually
................................................................................................................................... 423 Creating Devices and Sensors Using the Auto Discovery

3Contents
3
© 2008 Paessler AG
Part VII Sensor Types 46
................................................................................................................................... 461 SNMP Sensors Types
................................................................................................................................... 482 WMI Sensors Types
................................................................................................................................... 493 HTTP Sensor Types
................................................................................................................................... 514 Packet Sniffing Sensor Types
................................................................................................................................... 535 NetFlow Sensor Types
................................................................................................................................... 546 SQL Server Sensor Types
................................................................................................................................... 557 File Server Sensor Types
................................................................................................................................... 568 VMware Server Sensor Types
................................................................................................................................... 569 Other Sensor Types
................................................................................................................................... 5610 Custom Sensor Types
................................................................................................................................... 5711 Comparison of Bandwidth Monitoring Sensor Types
Part VIII Notifications 60
Part IX Maps 65
Part X Reports 72
Part XI Todos 77
Part XII User Management 79
Part XIII System Settings and Administration 82
................................................................................................................................... 821 Account Settings - My Account
................................................................................................................................... 832 Account Settings - Schedules
................................................................................................................................... 843 Account Settings - Notifications
................................................................................................................................... 864 System Setup - Web Server
................................................................................................................................... 875 System Setup - Probes
................................................................................................................................... 876 System Setup - Notifications
................................................................................................................................... 887 Core Server Admin Tool
................................................................................................................................... 928 Probe Admin Tool
Part XIV Technical Topics 96
................................................................................................................................... 961 Multiple Probes and Remote Probes
................................................................................................................................... 1002 Importing Data from PRTG Traffic Grapher 6 or IPCheck Server
Monitor 5
................................................................................................................................... 1023 API (Application Programming Interface)
................................................................................................................................... 1024 Data Storage
................................................................................................................................... 1035 Security Features
................................................................................................................................... 1036 SNMP Helper

PRTG Network Monitor 7 - User Manual4
© 2008 Paessler AG
................................................................................................................................... 1057 Interface Definition for Custom EXE Sensors
................................................................................................................................... 1068 Acknowledgements
Index 107

Part
I
System Requirements

PRTG Network Monitor 7 - User Manual6
© 2008 Paessler AG
1 System Requirements
Required Operating Systems
The PRTG "Core Service" and "Probe Service" can be run on 32-bit and 64-bit versions of:
· Microsoft Windows XP· Microsoft Windows Vista· Microsoft Windows Server 2003· Microsoft Windows Server 2008
The web interface has been successfully tested on the following web browsers (in order of performance andreliability):
· Mozilla Firefox 3· Google Chrome· Apple Safari 3.1· Microsoft Internet Explorer 8· Mozilla Firefox 2· Microsoft Internet Explorer 7
The optional PRTG Tray Tool runs under all Windows versions (Windows 95 or later). The optional iPhoneinterface was created for Apple iPhone firmware 2.0.
Required Hardware
Please note: The following values are provided as reference for average situations only. Hardware requirementsmainly depend on the sensor types used. If you plan installations with more than 500-1,000 sensors or more than10 packet sniffing/NetFlow sensors please consult the PRTG Site Planner tool ("Help" menu).
· CPU: An average new PC can easily monitor 1,000 sensors (depending on the sensor type).· RAM: You will need about 150KB of RAM per sensor.· Hard Disk: You will need about 200KB of disk space per sensor per day (for sensors with 60 second interval).· An Internet connection is required for license activation (via HTTP or email).
To give you an idea of a high end setup, here is a sample for a very large installation:
We have successfully tested PRTG Network Monitor running with 30,000 SNMP sensors on a Dual-CPUQuad-Core system (Dell 2900 III) with 16GB RAM on Windows 2003 64-bit. This scenario required about 3GBof RAM for the PRTG processes, the CPUs were running at 20% load and it created about 1.5TB of data on thedisk for one year. An installation of this size is able to monitor 625 SNMP-enabled switches with 48 ports.
Requirements for Monitored Devices
· SNMP monitoring: The monitored device(s) must be equipped with SNMP Version 1, 2c or 3 (i.e. aSNMP-compatible software must be installed on the device). SNMP must be enabled on the device and themachine running PRTG must be allowed access to the SNMP interface.
· WMI monitoring: In order to use WMI (Windows Management Instrumentation) monitoring you will need aWindows network.
· NetFlow monitoring: The device must be configured to send NetFlow data packets (NetFlow Version 5) to themachine running PRTG.
· Packet Sniffing: Only data packets passing the local machine’s network card can be analyzed. Switches withso-called "monitoring ports" are necessary for network-wide monitoring in switched networks.

Part
II
Installation

PRTG Network Monitor 7 - User Manual8
© 2008 Paessler AG
2 Installation
To use PRTG Network Monitor you need to download and install the software as described in the followingsections:
· Downloading the Software: How to get the latest version from Paessler· Upgrading to Version 7 from Previous Versions: Read this if you have used PRTG Traffic Grapher 6 or
IPCheck Server Monitor 5 before· Installation of the PRTG Core Server: How to install the PRTG core server software on your PC/Server· Uninstallation: How to remove the software from your PC/Server
2.1 Downloading the Software
Please download the latest version of PRTG Network Monitor from the Paessler website. There are two differentinstallers for PRTG, a public download for the Freeware and Trial editions, and another download for thecommercial editions (which is only available for paying customers).
Downloading the Freeware Edition and Trial Edition
Please download the latest publicly available files from the Paessler website at www.paessler.com/prtg/download
Downloading the Commercial Editions
Upgrades are free to customers with an active maintenance contract. Please log into the Paessler website at www.paessler.com/login to get the latest download.
If you do not have an active maintenance contract, please contact [email protected]
2.2 Upgrading to Version 7 from Previous Versions
If you have been running one of the two predecessor products of PRTG 7 (namely PRTG Traffic GrapherVersion 6 or IPCheck Server Monitor Version 5), you can import most of your data (monitoring setup andhistoric data) into PRTG 7. Importing data from earlier versions is not possible.
Please refer to the Import Data from PRTG 6/IPCheck 5 section of this manual for details.
2.3 Installation of a PRTG Core Server
Installing the software is similar to other Windows-based applications. To install the application please insertyour PRTG CD-ROM into your computer or open the installation setup routine from the ZIP file you havedownloaded.
The usual software installation wizard will guide your through the installation process:

Installation 9
© 2008 Paessler AG
Please click "Next" to walk through the wizard.
After accepting the license agreement, you can choose the folder you wish to install the software in. Afterwardsyou will see the following installation options:
PRTG Network Monitor 7 - User Manual10
© 2008 Paessler AG
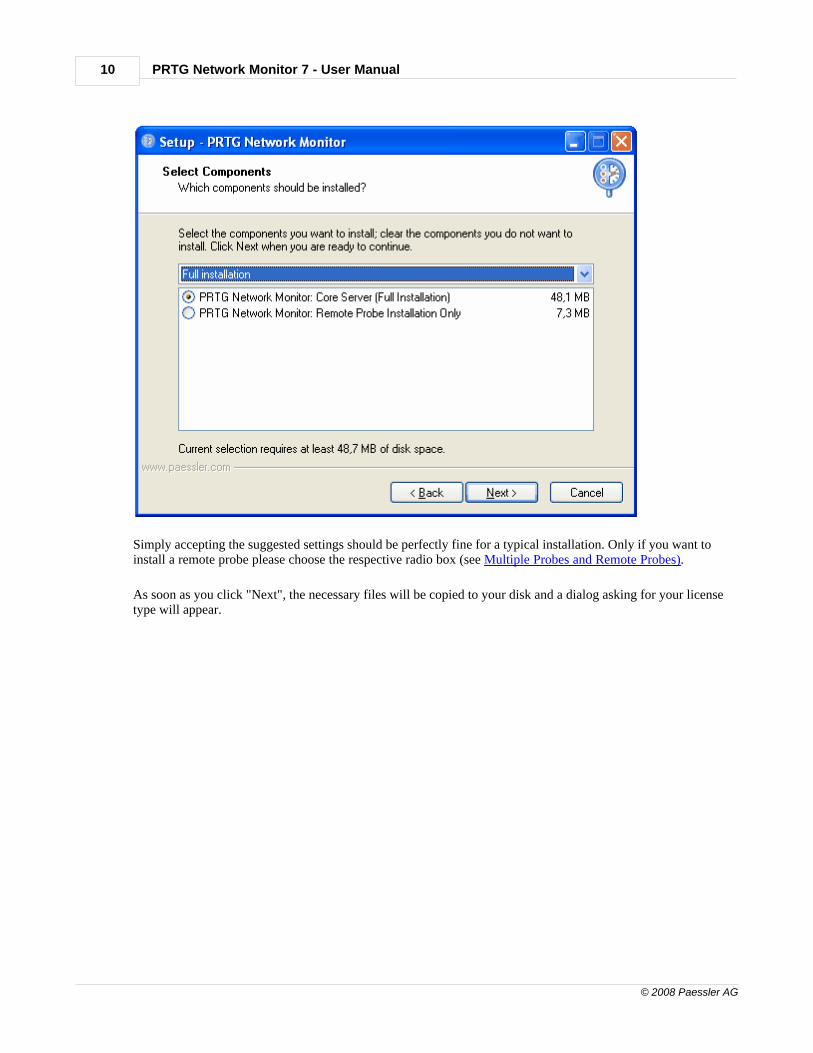
Simply accepting the suggested settings should be perfectly fine for a typical installation. Only if you want to install a remote probe please choose the respective radio box (see Multiple Probes and Remote Probes).
As soon as you click "Next", the necessary files will be copied to your disk and a dialog asking for your licensetype will appear.

Installation 11
© 2008 Paessler AG
Please select the proper option and enter the necessary data.
Afterwards you will see a dialog with some base settings:
PRTG Network Monitor 7 - User Manual12
© 2008 Paessler AG
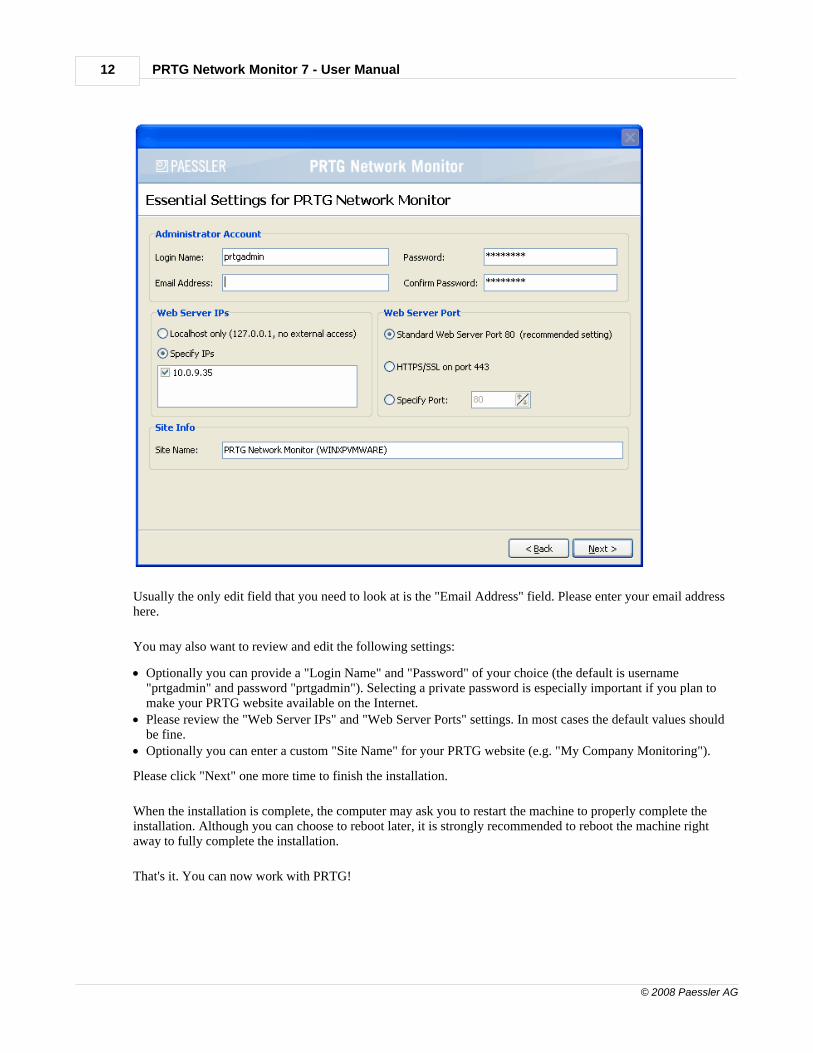
Usually the only edit field that you need to look at is the "Email Address" field. Please enter your email addresshere.
You may also want to review and edit the following settings:
· Optionally you can provide a "Login Name" and "Password" of your choice (the default is username"prtgadmin" and password "prtgadmin"). Selecting a private password is especially important if you plan tomake your PRTG website available on the Internet.
· Please review the "Web Server IPs" and "Web Server Ports" settings. In most cases the default values shouldbe fine.
· Optionally you can enter a custom "Site Name" for your PRTG website (e.g. "My Company Monitoring").
Please click "Next" one more time to finish the installation.
When the installation is complete, the computer may ask you to restart the machine to properly complete theinstallation. Although you can choose to reboot later, it is strongly recommended to reboot the machine rightaway to fully complete the installation.
That's it. You can now work with PRTG!

Installation 13
© 2008 Paessler AG
2.4 Installation of a PRTG Remote Probe
PRTG has two modules that perform the monitoring: The core server, which handles data storage, web serverand a lot more, plus one or more "probes" which perform the actual monitoring. Please see Multiple Probes andRemote Probes for details.
2.5 Uninstallation
To uninstall PRTG Network Monitor:
· Select the Add/Remove Programs option from the computer’s Control Panel. · Select PRTG Network Monitor from the list of programs.· Click the Remove button to uninstall the program.
Or select the "Uninstall PRTG Network Monitor" icon from the PRTG Network Monitor group in theStart|Programs menu.
Note: During uninstallation, your monitoring data will not be removed automatically.
After the completion of the uninstallation process of the software please check the PRTG Network Monitorinstallation folder and delete all remaining files that you do not want to keep. Also, please check the"\Documents and Settings\All Users\Application Data\Paesser\PRTG Network Monitor\V7" (Windows XP)folder for remaining data files which are not automatically removed.

Part
III
Introduction

Introduction 15
© 2008 Paessler AG
3 Introduction
Today, most businesses rely on a computer and network infrastructure for Internet, internal management,telephone and email.
A complex set of servers and network equipment is required to ensure that business data flows seamlesslybetween employees, offices and customers. The economical success of an organization is tightly connected withthe flow of data.
Why Network Monitoring is Important
So, the computer network's reliability, speed and efficiency are crucial for businesses to be successful. But, likeall other technical objects, network devices may fail from time to time - potentially causing trouble and loss ofsales - no matter what mitigation efforts have been made up-front.
Network administrators, need to take three key steps to maintain network uptime, reliability, and speed:
1. Set up a well-planned network with reliable components.2. Create recovery plans for the event of device failure.3. Monitor their network to know about failures as they build up or actually happen.
PRTG Network Monitor, the software described in this document, is a complete solution for monitoring small,medium and large networks.
Monitoring Networks with PRTG Network Monitor
PRTG Network Monitor is a powerful network monitoring application for Windows-based systems. It is suitablefor small, medium and large networks and capable of LAN, WAN, WLAN and VPN monitoring.
It monitors network availability and bandwidth usage as well as various other network parameters such asmemory and CPU usages. It provides system administrators with live readings and periodical usage trends tooptimize the efficiency, layout and setup of leased lines, routers, firewalls, servers and other networkcomponents.
The software is easy to set up and use and monitors a network using SNMP, WMI, packet sniffing, CiscoNetFlow as well as many other industry standard protocols. It runs on a Windows-based machine in yournetwork for 24-hours every day. PRTG Network Monitor constantly records the network usage parameters andthe availability of network systems. The recorded data is stored in an internal database for later reference.
3.1 Key Features
PRTG Network Monitor can be used to:
· monitor and alert for uptimes/downtimes or slow servers.· monitor and account bandwidth and network device usage.· monitor system usage (CPU loads, free memory, free disk space, etc.).· classify network traffic by source/destination and content.· discover unusual, suspicious or malicious activity with devices or users.· control SLA agreements.· discover and assess network devices.

PRTG Network Monitor 7 - User Manual16
© 2008 Paessler AG
The PRTG installer contains all modules and software necessary to run the monitoring system without the needfor third party modules, inlcuding:
· Paessler's own fast and efficient database system to store the raw monitoring results.· built-in web server with HTTP and HTTPS support for the user interface.· mail server for automatic email delivery.· SQLite SQL Server for storage of monitoring events.· report generator to create PDF reports.· graphics engine for user-friendly charts.· network analysis module to auto-discover devices and sensors.
PRTG Network Monitor supports up many thousands of sensors and can optionally work with multiple remoteprobes (agents) to monitor multiple sites or network segments from one central core installation. The software isbased on Paessler’s proven monitoring technology, which has been constantly improved since 1997 and isalready used by more than 150,000 users around the world every day.
Attractive licensing packages from freeware (up to 10 sensors) to enterprise level, with thousands of sensorsmake sure that every user finds the proper solution.
3.2 Available Licenses
There are three editions available:
Freeware Edition
The Freeware Edition is a good solution to get started with PRTG or for private use:
· May be used for free for personal and commercial use.· Can monitor up to 10 sensors.· Supports all available sensor types (except NetFlow).· Shortest available monitoring interval is one minute.
This edition runs as default after installation when no license key is entered.
Trial Edition
The Trial Edition is intended for evaluation purposes for customers who are interested in purchasing commerciallicenses:
· Can monitor up to 500 sensors.· Supports all available sensor types (including NetFlow).· Shortest available monitoring interval is one second.· Temporary license key must be requested from Paessler's website.· Trial period limited to 30-days (automatically reverts to Freeware Edition afterwards).
Free trial license keys are available on our website at http://www.paessler.com/prtg/trial
Commercial Editions
There are several different licenses of PRTG Network Monitor available to suit the demands of smaller, as wellas larger customers and organizations.

Introduction 17
© 2008 Paessler AG
· Maximum number of sensors depends on the license (100 or more).· Supports all available sensor types (including NetFlow).· Shortest available monitoring interval is one second.
To learn more about pricing and feature matrix or to order licenses please visit: http://www.paessler.com/order
3.3 About This Document
This document introduces the reader to the system concepts of PRTG Network Monitor and explains how to setup the software to achieve the best results. You will learn how to plan your monitoring setup, how to set up yoursensors, reports, maps and user accounts.
This document does not explain each and every edit field or button of the user interface. Detailed information isincluded in PRTG’s web interface itself in the form of short contextual help texts and hints. Also, this documentis not a technical in-depth documentation of file formats, APIs and other background information. Thisinformation is available online on the Paessler knowledge base at www.paessler.com

Part
IV
Basic Concepts of PRTG Network Monitor

Basic Concepts of PRTG Network Monitor 19
© 2008 Paessler AG
4 Basic Concepts of PRTG Network Monitor
There are a number of basic concepts that lay the foundation for the functionality and ease of use of the PRTGNetwork Monitor. Please read this section carefully to make it easier for you to understand how best to use thesoftware.
· Architecture: PRTG Core Server and PRTG Probe· Object Hierarchy: Probes, Groups, Devices, Sensors, Channels· Inheritance of Settings· Notifications, Schedules, and Dependencies· Reports, Maps, and Todos· Priorities and Favorite Sensors· Default Values
4.1 Architecture: PRTG Core Server and PRTG Probe
PRTG Network Monitor consists of two main parts:
· PRTG Core Server: The central part of a PRTG installation is the "Core Server" that includes the datastorage, web server, report engine and notification system.
· PRTG Probe: A "probe" performs the actual monitoring. It receives its configuration from the Core Server,runs the monitoring processes and delivers monitoring results back to the Core Server. A Core Server canmanage an unlimited number of probes in order to achieve multiple location monitoring.
Core and probe are Windows services which are run by the Windows system without the requirement for alogged-in user.
You can consider the PRTG Web Interface to be the third part. It runs on the user's web browser, seeing as it isentirely web-based. The users access the configuration and monitoring results using a standard web browser.
Additionally, there are the two administrator tools, "PRTG Server Administrator" and "PRTG ProbeAdministrator", to configure basic settings such as the admin login and webserver IPs.
Core Server
The Core Server is the heart of your PRTG system and contains the following processes:
· Configuration management for object monitoring.· Management and configuration of the connected probes.· Storage of raw monitoring results.· Notification management including a mail server for email delivery.· Report generator and scheduler.· User account management.· Data purging (culling data that is older than 365 days, for example).
The Core Server also includes a built-in, fast and secure web server (no IIS or Apache is required) that supportsHTTP as well as secure HTTPS (via SSL). The Ajax-based interface is used for the configuration of devices andsensors, as well as the review of monitoring results. The web interface is highly interactive and uses Ajax todeliver a powerful and easy-to-use user experience. While the user is logged in, the data on the screen ispermanently refreshed (via Ajax calls) so it always shows the current monitoring results (refresh interval andmethod can be set by the user). The global monitoring statistics are always shown at the top of the page,including number of sensors with an error, warning, down, paused or unusual status plus a graph showing a

PRTG Network Monitor 7 - User Manual20
© 2008 Paessler AG
recent history of alarms, bandwidth usage, CPU usage and speed indices for all sensors.
Probes
The actual monitoring is performed by the PRTG Probe process which runs on one or more computers. Duringinstallation the so-called "Local Probe" is automatically created by the system. Additional remote probes must becreated by the user (see Multiple Probes and Remote Probes). In a single-probe installation - which is the defaultsetup - all monitoring is performed by the local probe.
After receiving their configuration from the Core system, all probes are able to work independently of the Coreserver for some time, e.g. in case the connection between probe and Core is lost due to connectivity problems.The probe automatically reconnects to the Core as soon as it is available again and transmits all monitoringresults gathered during the connection loss, so no information is lost.
PRTG automatically monitors the "system health" of the Core server and each probe in order to discoveroverloading situations or badly configured systems that may distort monitoring results. To do this, the systemautomatically creates a number of sensors for each probe to monitor the their system status:
It is recommended to keep these sensors, but you can optionally remove all except for the "Probe Health" sensor.It measures various internal system parameters of the probe system hardware and the probe's internal processesand then computes a resulting value. Values below 100% should be investigated.
4.2 Object Hierarchy: Probes, Groups, Devices, Sensors, Channels
In PRTG Network Monitor, the actual monitoring is performed by "sensors". Each of these sensors monitors onesingle aspect of a network device. For example:
· one network service like SMTP, FTP, HTTP, etc.· the traffic of one port or a network switch.· the CPU or memory load of a device.· one network card’s traffic.· one NetFlow device, etc.
Sensors are arranged in a tree-like hierarchy to create an easy to navigate list and to give the user the possibilityto arrange them in groups that monitor similar devices, locations or services.
Users can create nested "groups"; each group has a number of "devices"; each device has a number of "sensors"and; finally, each sensor has one or more "channels" (e.g. IN and OUT channel, or one channel for each CPUfor a multiprocessor system).
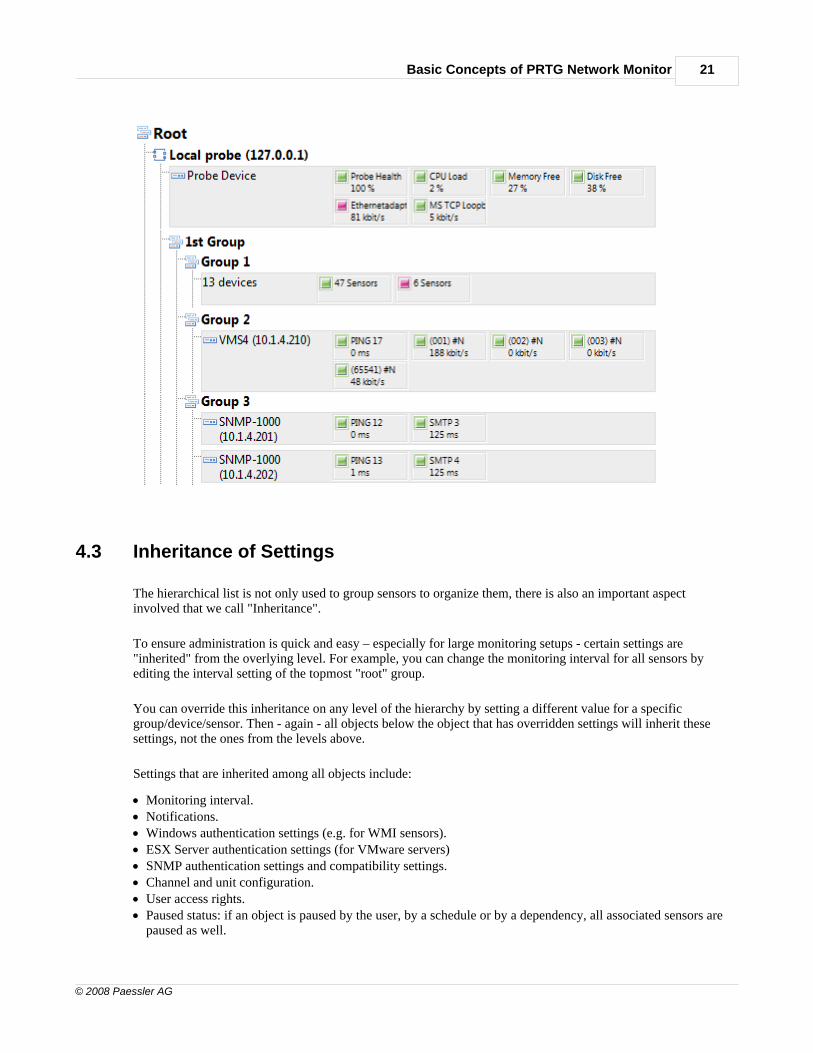
You will also see a level for "Probes" in the hierarchy. All groups/devices/sensors that are configured below aprobe will be monitored via that probe (see Multiple Probes and Remote Probes).
Here is a sample configuration:
Basic Concepts of PRTG Network Monitor 21
© 2008 Paessler AG
4.3 Inheritance of Settings
The hierarchical list is not only used to group sensors to organize them, there is also an important aspectinvolved that we call "Inheritance".
To ensure administration is quick and easy – especially for large monitoring setups - certain settings are"inherited" from the overlying level. For example, you can change the monitoring interval for all sensors byediting the interval setting of the topmost "root" group.
You can override this inheritance on any level of the hierarchy by setting a different value for a specificgroup/device/sensor. Then - again - all objects below the object that has overridden settings will inherit thesesettings, not the ones from the levels above.
Settings that are inherited among all objects include:
· Monitoring interval.· Notifications.· Windows authentication settings (e.g. for WMI sensors).· ESX Server authentication settings (for VMware servers)· SNMP authentication settings and compatibility settings.· Channel and unit configuration.· User access rights.· Paused status: if an object is paused by the user, by a schedule or by a dependency, all associated sensors are
paused as well.

PRTG Network Monitor 7 - User Manual22
© 2008 Paessler AG
There is one exception for devices and sensors: The IP address (or DNS name) of a device and the SNMP andWMI settings are always inherited by sensors and can not be changed on sensor level.
The actual overriding of the parent's settings takes place by selecting the radio button "specify settings for this(object)" on the object's settings page. This screenshot shows Windows authentication settings:
4.4 Notifications, Schedules, and Dependencies
PRTG offers the following three concepts that can help to set up a monitoring configuration.
Notifications
Whenever PRTG discovers downtime, an overloaded system, threshold breach or similar situations, it will send a"notification". Notifications use various methods by which you can be notified (e.g. email, SMS, pager message,among others). After creating notifications in the system settings, you can select them on the group, device andsensor settings pages. See Notifications for more details.
Schedules
Group, device or sensor monitoring can be paused by user intervention or by a "schedule" (e.g. don’t monitorSundays between 4 and 8am). Using schedules, you can limit the monitoring time. PRTG comes with a numberof pre-defined schedules that you can edit - or you can add your own schedules.
Dependencies
Using "dependencies", you can pause sensor monitoring based on the status of another sensor in order to avoidfalse alarms and incorrect downtime recording. A dependency stops the monitoring of one sensor or a set ofsensors as soon as another specified sensor is down. This means, for example, you can stop monitoring remotenetwork services when the corresponding firewall is down due to connection problems.
There are three options for dependencies:
· "Use Parent": By default, all objects depend on their parent object. This means that if you specify adependency for a group and the dependency sensor goes down or is paused, all sensors in the group will bepaused.
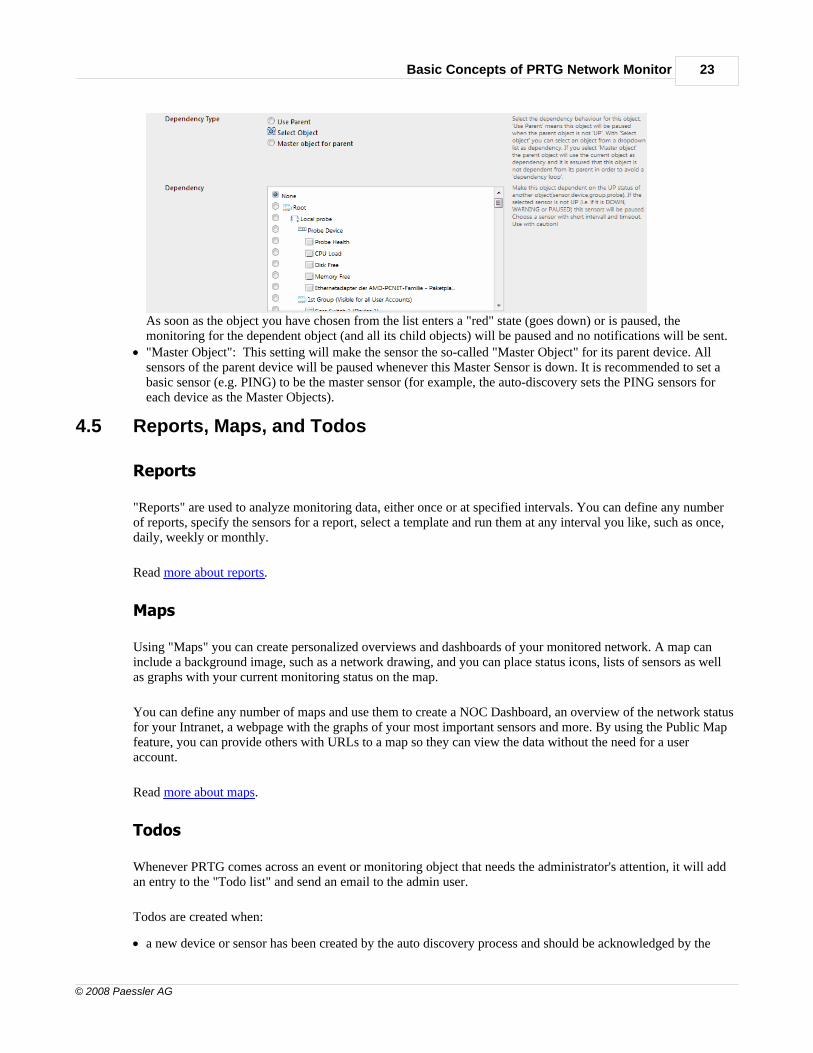
· "Select Object": To set up a dependency, go to the settings page of an object that is intended to "depend" onanother object. Then select the object it shall depend on from the list:
Basic Concepts of PRTG Network Monitor 23
© 2008 Paessler AG
As soon as the object you have chosen from the list enters a "red" state (goes down) or is paused, themonitoring for the dependent object (and all its child objects) will be paused and no notifications will be sent.
· "Master Object": This setting will make the sensor the so-called "Master Object" for its parent device. Allsensors of the parent device will be paused whenever this Master Sensor is down. It is recommended to set abasic sensor (e.g. PING) to be the master sensor (for example, the auto-discovery sets the PING sensors foreach device as the Master Objects).
4.5 Reports, Maps, and Todos
Reports
"Reports" are used to analyze monitoring data, either once or at specified intervals. You can define any numberof reports, specify the sensors for a report, select a template and run them at any interval you like, such as once,daily, weekly or monthly.
Read more about reports.
Maps
Using "Maps" you can create personalized overviews and dashboards of your monitored network. A map caninclude a background image, such as a network drawing, and you can place status icons, lists of sensors as wellas graphs with your current monitoring status on the map.
You can define any number of maps and use them to create a NOC Dashboard, an overview of the network statusfor your Intranet, a webpage with the graphs of your most important sensors and more. By using the Public Mapfeature, you can provide others with URLs to a map so they can view the data without the need for a useraccount.
Read more about maps.
Todos
Whenever PRTG comes across an event or monitoring object that needs the administrator's attention, it will addan entry to the "Todo list" and send an email to the admin user.
Todos are created when:
· a new device or sensor has been created by the auto discovery process and should be acknowledged by the
PRTG Network Monitor 7 - User Manual24
© 2008 Paessler AG
user.· a new probe connects to the Core and must be acknowledged.· a new version of the software is available.· a new report is ready for review.· and a few other situations, such as when the system runs out of disk space, licensing issues, etc.
Read more about todos.
4.6 Priorities and Favorite Sensors
Priority
You can specify a priority for each object in the sensor tree, shown with 1 star ("*") for the lowest priority to 5stars ("*****") for the highest priority. By default, PRTG sensors are sorted first by priority and thenalphabetically by name in lists like "Alarms" or "Sensors".
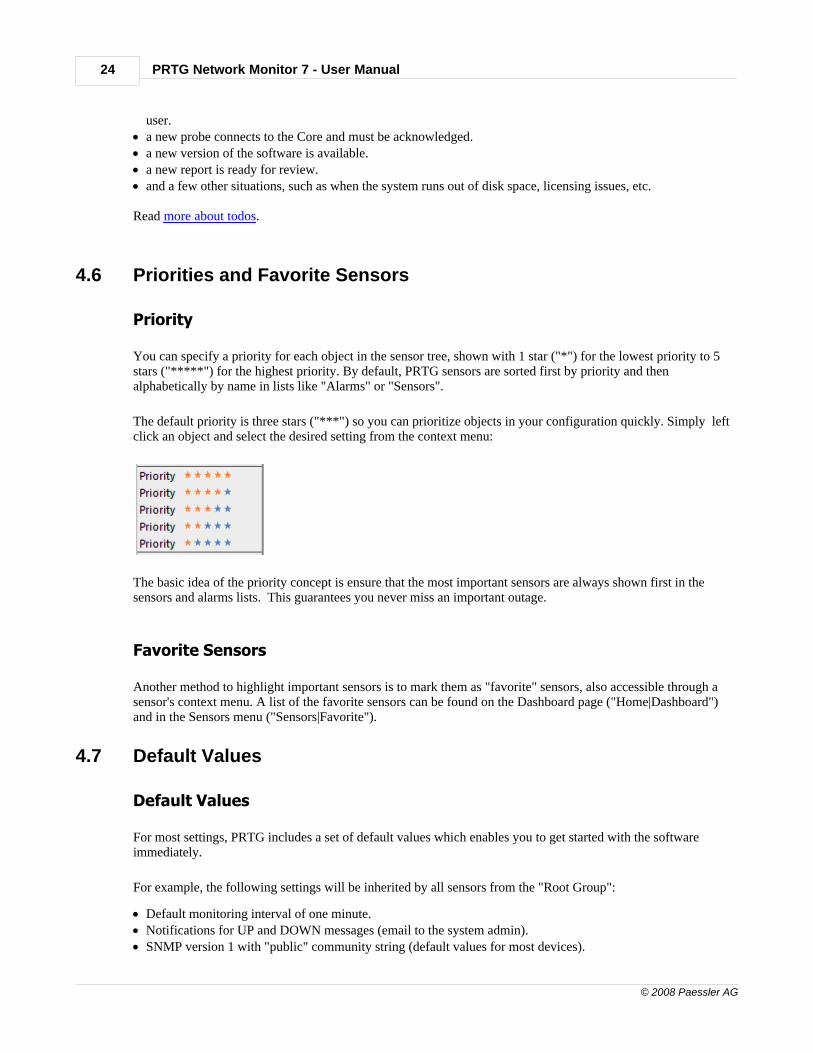
The default priority is three stars ("***") so you can prioritize objects in your configuration quickly. Simply leftclick an object and select the desired setting from the context menu:
The basic idea of the priority concept is ensure that the most important sensors are always shown first in thesensors and alarms lists. This guarantees you never miss an important outage.
Favorite Sensors
Another method to highlight important sensors is to mark them as "favorite" sensors, also accessible through asensor's context menu. A list of the favorite sensors can be found on the Dashboard page ("Home|Dashboard")and in the Sensors menu ("Sensors|Favorite").
4.7 Default Values
Default Values
For most settings, PRTG includes a set of default values which enables you to get started with the softwareimmediately.
For example, the following settings will be inherited by all sensors from the "Root Group":
· Default monitoring interval of one minute.· Notifications for UP and DOWN messages (email to the system admin).· SNMP version 1 with "public" community string (default values for most devices).

Basic Concepts of PRTG Network Monitor 25
© 2008 Paessler AG
· Various SNMP compatibility options.· Various channel unit configurations.· No schedule, no dependency, no Windows authentication account.
Additionally, these default entries are set up automatically:
· One user group (PRTG Users) that should be used for non-admin users.· One notification (email to the system admin).· Various web interface settings (refresh, auto folding, etc).· A set of schedules.· Various data purging settings.
You may need to change a number of these default entries as you become used to the interface, however, thesesettings should initially suffice for most situations.
Part
V
User Interfaces

User Interfaces 27
© 2008 Paessler AG
5 User Interfaces
PRTG Network Monitor includes three user interface elements:
Web Based User Interface
The main interface is a browser-based interface which is used to configure the software, set up sensors, reviewcurrent status and create reports. Here is a screenshot:
Read more about it in sections Web Interface Navigation.
Windows Tray Tool
The System Tray Notifier runs on your PC in the background and will notify you with popups and soundswhenever PRTG discovers changes to your network.
Read more about the System Tray Notifier.
iPhone Interface
If you have an iPhone you can access a user interface that is optimized for the device:

PRTG Network Monitor 7 - User Manual28
© 2008 Paessler AG
Read more about the iPhone User Interface.
5.1 Web Interface Navigation
Please have look at this screenshot of PRTG's web interface:
User Interfaces 29
© 2008 Paessler AG
The main layout consists of a status bar at the top, the header area with the main menu and quick-search boxbelow it and, finally, the main page content (all these elements are described in the next section).
When you navigate through PRTG's web interface you will always use one of the following five navigationalpaths:
· The "Main Menu" provides access to many important aspects of the software· The "Quick Search" is often the fastest way to navigate to an object · Using the page's "Tabs" you can switch between various sub-pages for an object· Many objects offer a "Context Menu" that will pop up when you right-click them· And, finally, you are able to drill down into the object hierarchy of probes, groups, devices and sensors in the
object tree shown above by merely clicking an object
These five navigation paths put PRTG's complete functionality at your fingertips. Quite likely you are alreadyfamiliar with these techniques from many other websites and web-based user interfaces - with the exception ofthe context menus which are not commonly found on web-based user interfaces. However, after a short while youwill understand what a powerful feature these context menus are when it comes to effectively navigating theinterface.
Read more here:
· Web Page Overview· Context Menus· Lists· Monitoring Status Information Available Through the Web Interface
5.2 Web Page Overview
Let's have a detailed look at PRTG's webpages building blocks:
Global Status Bar
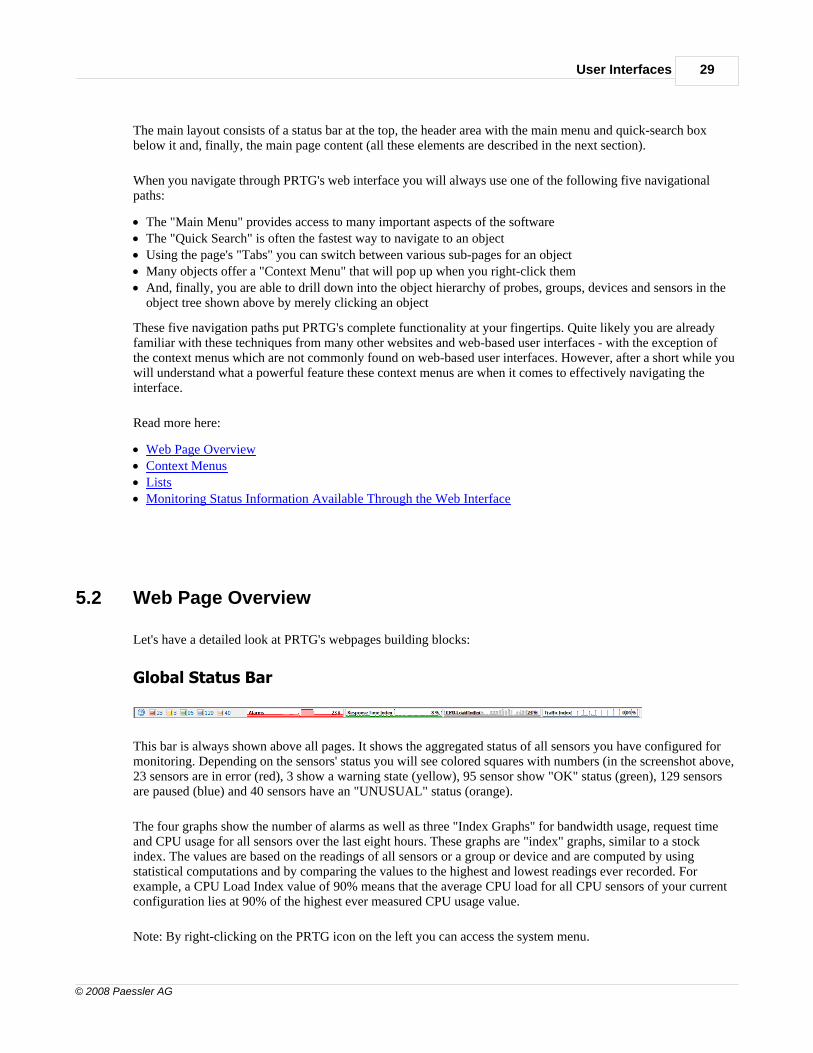
This bar is always shown above all pages. It shows the aggregated status of all sensors you have configured formonitoring. Depending on the sensors' status you will see colored squares with numbers (in the screenshot above,23 sensors are in error (red), 3 show a warning state (yellow), 95 sensor show "OK" status (green), 129 sensorsare paused (blue) and 40 sensors have an "UNUSUAL" status (orange).
The four graphs show the number of alarms as well as three "Index Graphs" for bandwidth usage, request timeand CPU usage for all sensors over the last eight hours. These graphs are "index" graphs, similar to a stockindex. The values are based on the readings of all sensors or a group or device and are computed by usingstatistical computations and by comparing the values to the highest and lowest readings ever recorded. Forexample, a CPU Load Index value of 90% means that the average CPU load for all CPU sensors of your currentconfiguration lies at 90% of the highest ever measured CPU usage value.
Note: By right-clicking on the PRTG icon on the left you can access the system menu.

PRTG Network Monitor 7 - User Manual30
© 2008 Paessler AG
Website Header Area, Search Box and Main Menu
Navigating through the web interface is performed using the main menu. Please take a few minutes to familiarizeyourself with all menu items and sub-items.
To search for any monitoring object, simply enter the name, part of the name, an IP address, a DNS name or atag in the search box on the right and hit the enter key. A web page with all items that fit the search term will bereturned - even displaying online help articles.
Below the menu you will see a red bar with important messages whenever PRTG discovers changes in thenetwork or requires your attention for other reasons. Simply click the text inside the red bar to navigate to thedetailed information page.
Page Header and Tabs
The individual page content starts below the website header area. Depending on the page's content you will see amenu and a few action links on the right. "Breadcrumbs" that will always show the path back to the homepagecan be found below the heading.
Many pages have a tab-like interface. Using these tabs you can navigate to various sub-pages for an object:
"Overview" tab All monitoring objects offer this tab providing a quickoverview of all parameters and status
"Live Data", "48 Hours", "30 Days", "365 Days" tabs These three or four tabs show the group's, device's orsensor's historical graphs and data tables (note: live datais only available for sensors)
"Alarms" and "Log" tab Shows a list of current alarms and historic events for anobject (and its child objects)
"Settings" and "Notifications" tab Allows you to edit an object's settings and notifications"Comments" tab Provides a notepad for your own comments"History" tab Shows a lifetime log for each object (who created it,
who edited it, etc.)
Please note that you will also see other tabs for other objects.
Overview Page for Groups, Devices and Sensors
Have a look at the following three screenshots showing the "Overview" tab of a group, a device and a sensor:
User Interfaces 31
© 2008 Paessler AG
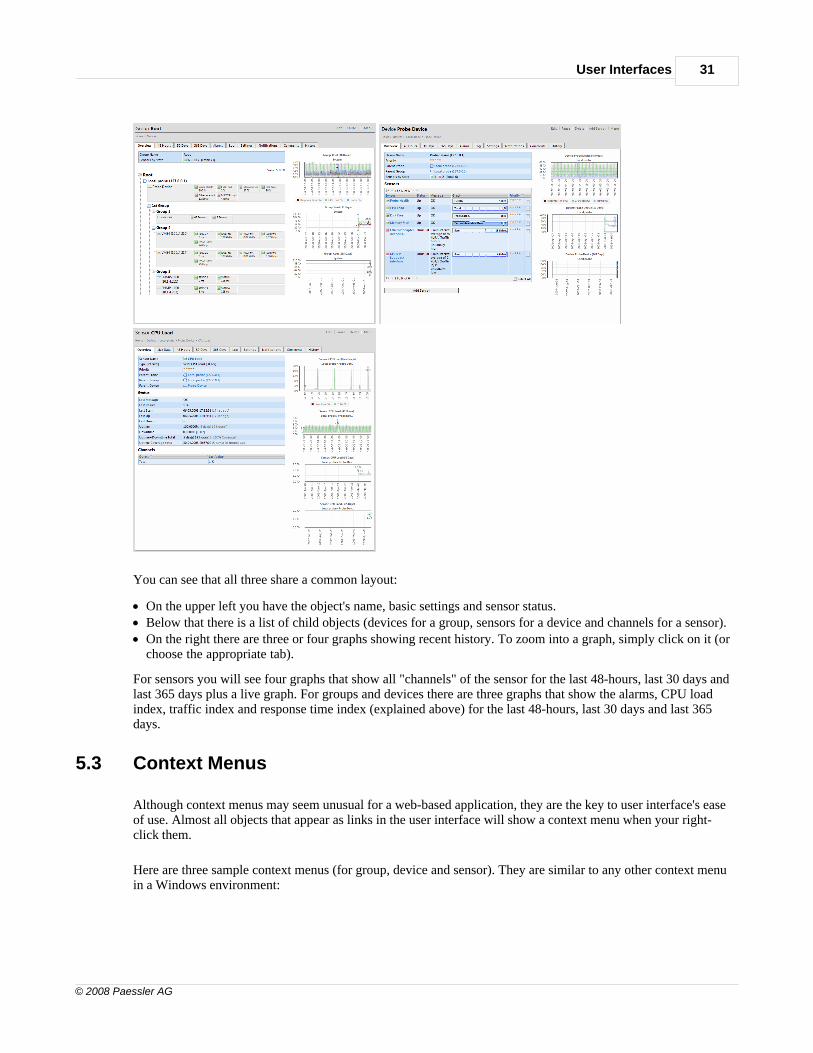
You can see that all three share a common layout:
· On the upper left you have the object's name, basic settings and sensor status.· Below that there is a list of child objects (devices for a group, sensors for a device and channels for a sensor).· On the right there are three or four graphs showing recent history. To zoom into a graph, simply click on it (or
choose the appropriate tab).
For sensors you will see four graphs that show all "channels" of the sensor for the last 48-hours, last 30 days andlast 365 days plus a live graph. For groups and devices there are three graphs that show the alarms, CPU loadindex, traffic index and response time index (explained above) for the last 48-hours, last 30 days and last 365days.
5.3 Context Menus
Although context menus may seem unusual for a web-based application, they are the key to user interface's easeof use. Almost all objects that appear as links in the user interface will show a context menu when your right-click them.
Here are three sample context menus (for group, device and sensor). They are similar to any other context menuin a Windows environment:
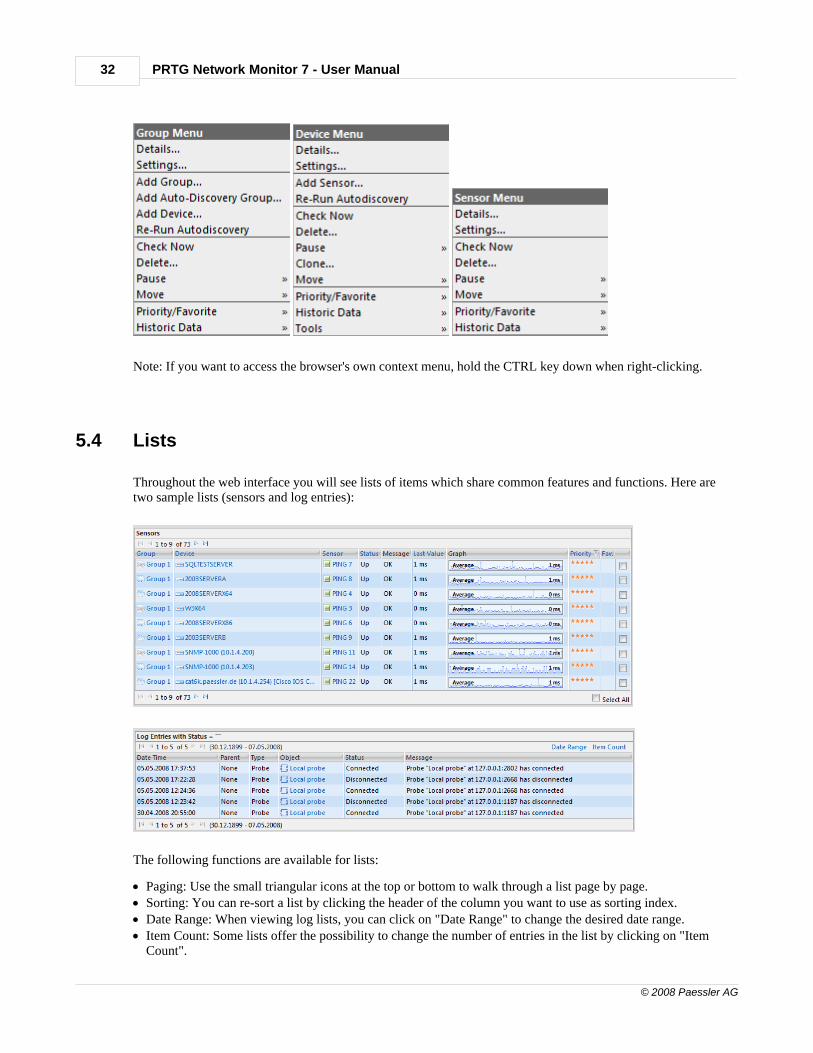
PRTG Network Monitor 7 - User Manual32
© 2008 Paessler AG
Note: If you want to access the browser's own context menu, hold the CTRL key down when right-clicking.
5.4 Lists
Throughout the web interface you will see lists of items which share common features and functions. Here aretwo sample lists (sensors and log entries):
The following functions are available for lists:
· Paging: Use the small triangular icons at the top or bottom to walk through a list page by page.· Sorting: You can re-sort a list by clicking the header of the column you want to use as sorting index.· Date Range: When viewing log lists, you can click on "Date Range" to change the desired date range.· Item Count: Some lists offer the possibility to change the number of entries in the list by clicking on "Item
Count".

User Interfaces 33
© 2008 Paessler AG
· Multi Edit: Some lists offer a column of checkboxes. As soon as you select one or more checkboxes, anadditional menu will offer functions that will be applied to all items in the lists whose checkboxes have beenselected. Here is a sample screenshot of this menu:
5.5 Monitoring Status Information Available Through the WebInterface
As soon as the monitoring system is running, PRTG provides a wealth of information about the current status ofthe system.
A sensor's status is shown by of the following messages and colors:
· OK (Green): Sensor is running well, measured values are OK.· WARNING (Yellow): Sensor is slow or the measured value is below/above a user-defined warning threshold.· ERROR (Red): Sensor can not be monitored (e.g. device is down) or the measured value is below/above a
user-defined error threshold.· PAUSED (Blue): Sensor has been paused by the user or due to a dependency or schedule. · UNUSUAL (Orange): Sensor is running well but recent values are unusually high or low (PRTG calculates
this by applying statistical analysis on the recent measurements and the historic data of a sensor).· UNKNOWN (black): Sensor has not been checked recently, e.g. shortly after starting the program or when the
associated probe is unavailable.
The web interface provides in-depth information for each sensor:
· 4 graphs (live data, last two hours, last 48-hours, last 30 days, last 365 days).· 4 data tables (one for each graph).· Current status and error message (if available).· Last measured value for each channel.· Aggregated uptime and downtime.· Last good request, last failed request.· Coverage (% of time monitoring information is available)· Sensor’s editing history (which user has changed what settings).· Sensor activity log.· User comments.
PRTG Network Monitor 7 - User Manual34
© 2008 Paessler AG
Current sensor and device status can be reviewed in numerous ways:
· "Sensor Tree": a hierarchical view with a tree-like display of all groups, devices and sensors.· "Lists": various lists of sensors. · "Alarms": a list of all sensors showing an error state, a warning state or unusual values.· "Dashboard": a quick overview of the most important lists (alarms, recent log entries, favorite sensors status,
recent todos).· "Maps": You can create your own overviews and dashboards for your monitored network.
You can review the status of sorted sensors and filtered lists based on various parameters (e.g. sensor type, tag,device, status, measured value, etc).
· Various Top 10 lists. · Best/worst availability.· Fastest/slowest PING.· Highest/lowest bandwidth usage.· Fastest/slowest website.· Highest/lowest CPU usage.· Highest/lowest available disk space.
Graphs for groups and devices show the alarms, a "bandwidth index", "speed index" and a "CPU load index" forthe associated sensors. These values are calculated using a sophisticated algorithm that merges the data ofvarious sensor types into one graph showing a rough overview of how the sensors of the group/device behavedrecently. These graphs are quite helpful to discern unusual network behavior.
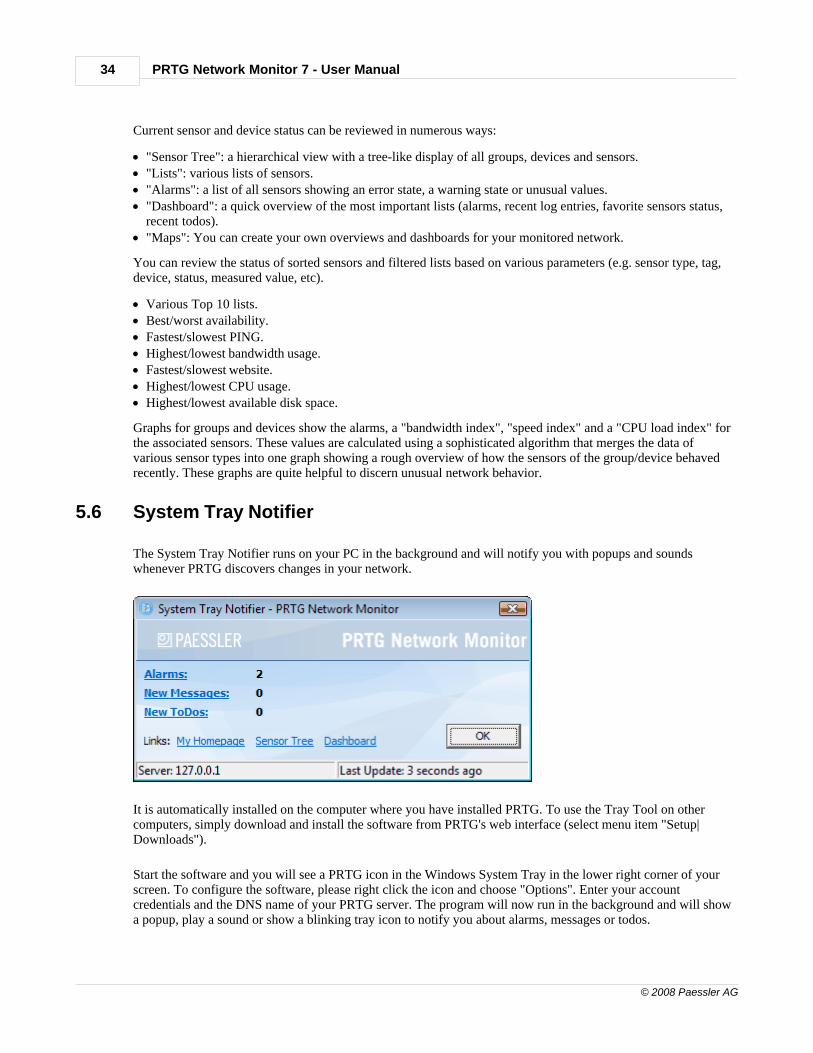
5.6 System Tray Notifier
The System Tray Notifier runs on your PC in the background and will notify you with popups and soundswhenever PRTG discovers changes in your network.
It is automatically installed on the computer where you have installed PRTG. To use the Tray Tool on othercomputers, simply download and install the software from PRTG's web interface (select menu item "Setup|Downloads").
Start the software and you will see a PRTG icon in the Windows System Tray in the lower right corner of yourscreen. To configure the software, please right click the icon and choose "Options". Enter your accountcredentials and the DNS name of your PRTG server. The program will now run in the background and will showa popup, play a sound or show a blinking tray icon to notify you about alarms, messages or todos.
User Interfaces 35
© 2008 Paessler AG
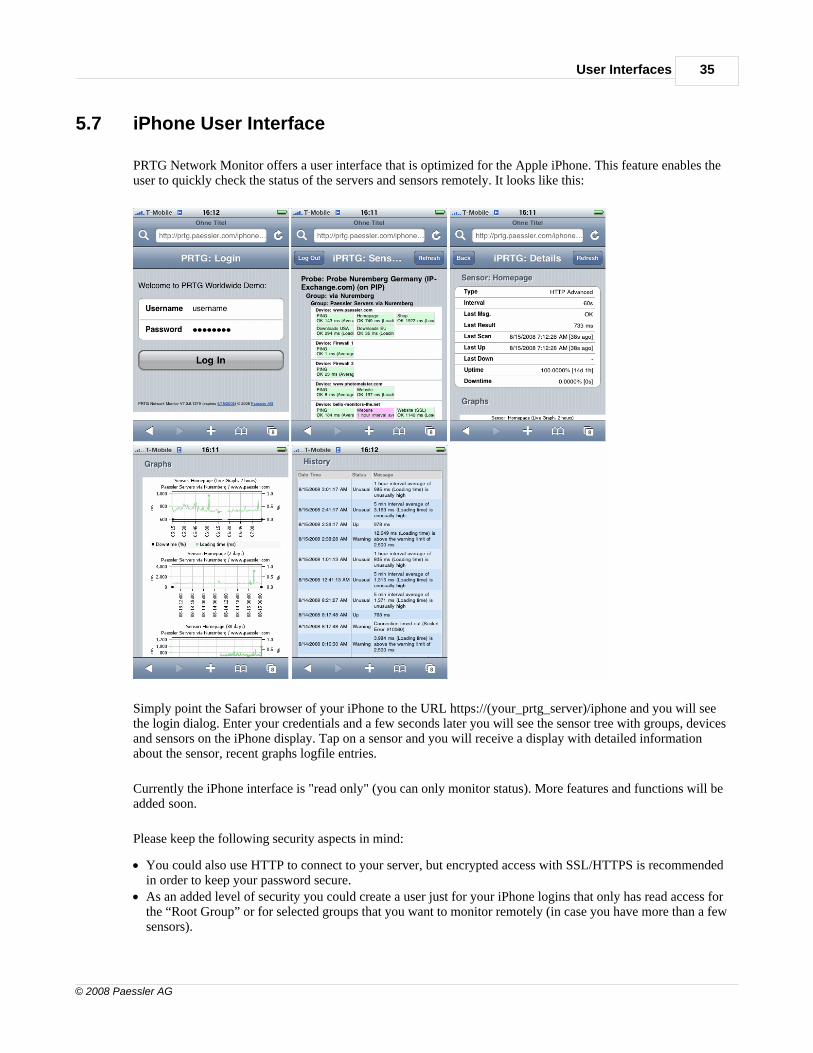
5.7 iPhone User Interface
PRTG Network Monitor offers a user interface that is optimized for the Apple iPhone. This feature enables theuser to quickly check the status of the servers and sensors remotely. It looks like this:
Simply point the Safari browser of your iPhone to the URL https://(your_prtg_server)/iphone and you will seethe login dialog. Enter your credentials and a few seconds later you will see the sensor tree with groups, devicesand sensors on the iPhone display. Tap on a sensor and you will receive a display with detailed informationabout the sensor, recent graphs logfile entries.
Currently the iPhone interface is "read only" (you can only monitor status). More features and functions will beadded soon.
Please keep the following security aspects in mind:
· You could also use HTTP to connect to your server, but encrypted access with SSL/HTTPS is recommendedin order to keep your password secure.
· As an added level of security you could create a user just for your iPhone logins that only has read access forthe “Root Group” or for selected groups that you want to monitor remotely (in case you have more than a fewsensors).

PRTG Network Monitor 7 - User Manual36
© 2008 Paessler AG
Part
VI
Sensor Setup
PRTG Network Monitor 7 - User Manual38
© 2008 Paessler AG
6 Sensor Setup
Before starting to create sensors, review the "Root Group's" settings that will be inherited by all other objects(see Setting Base Settings for Your Network).
As soon as this step is completed you can start to create new sensors to monitor your network. This can be doneeither manually or automatically using the Auto Discovery. The following sections explain these steps.
Note: If you want to create a multi-probe setup, you need to add and configure the necessary probes first (see Multiple Probes and Remote Probes).
6.1 Reviewing Settings of the Root Group
Objects in the sensor tree inherit many settings from their parent objects as explained in the Inheritance section.Obviously, the "Root Group", which is the parent object to all other objects, is especially important in thisregard.
So, before you create your own sensors, it is a good idea to review the Root Group's settings to ensure they suityour network. Choose the "Devices" item from the main menu and click the "settings" tab. There are severalrelevant settings:

Sensor Setup 39
© 2008 Paessler AG
Please review the settings and refer to the help texts on the right for detailed explanations for each of them.Remember that you can override these settings for all child objects later.
You should note the "Windows Connection", "SNMP Connection", and "interval" settings:
· Windows Connection: The Active Directory user account provided here will be used for all WMI-basedmonitoring and during the Auto Discovery process. It is recommended to enter a user account withadministrator privileges.
· SNMP Connection: Please select the SNMP version and enter the necessary authentication strings used in yournetwork. The defaults are "SNMPV1", community string "public" and port 161.
· Interval: Please select the default interval that shall be used for monitoring by all sensors.
6.2 Creating Groups, Devices and Sensors Manually
Creating Groups
To create new groups go to the devices list ("Devices" under the main menu) and either choose a probe or groupthat is intended to contain the new group. Right click the object and then choose "Add Group" from the context

PRTG Network Monitor 7 - User Manual40
© 2008 Paessler AG
menu.
Enter a name for the new group, optionally review the Windows and SNMP connection settings and then click"Continue".
Creating Devices
To create a new device, right-click a device and select "Add Device" from the context menu.
There are two settings that you must enter for a device: The name and the IP address (or DNS name). Optionally,review the Windows and SNMP connection settings and then click "Continue".
Creating Sensors
In order to create new sensors, right-click on the device where the new sensor is to be added and choose "AddSensor" from the context menu.
Creating new sensors involves two steps: First, you must select a sensor type, then - after some preparations byPRTG - you need to specify the sensor settings.
Sensor Setup 41
© 2008 Paessler AG
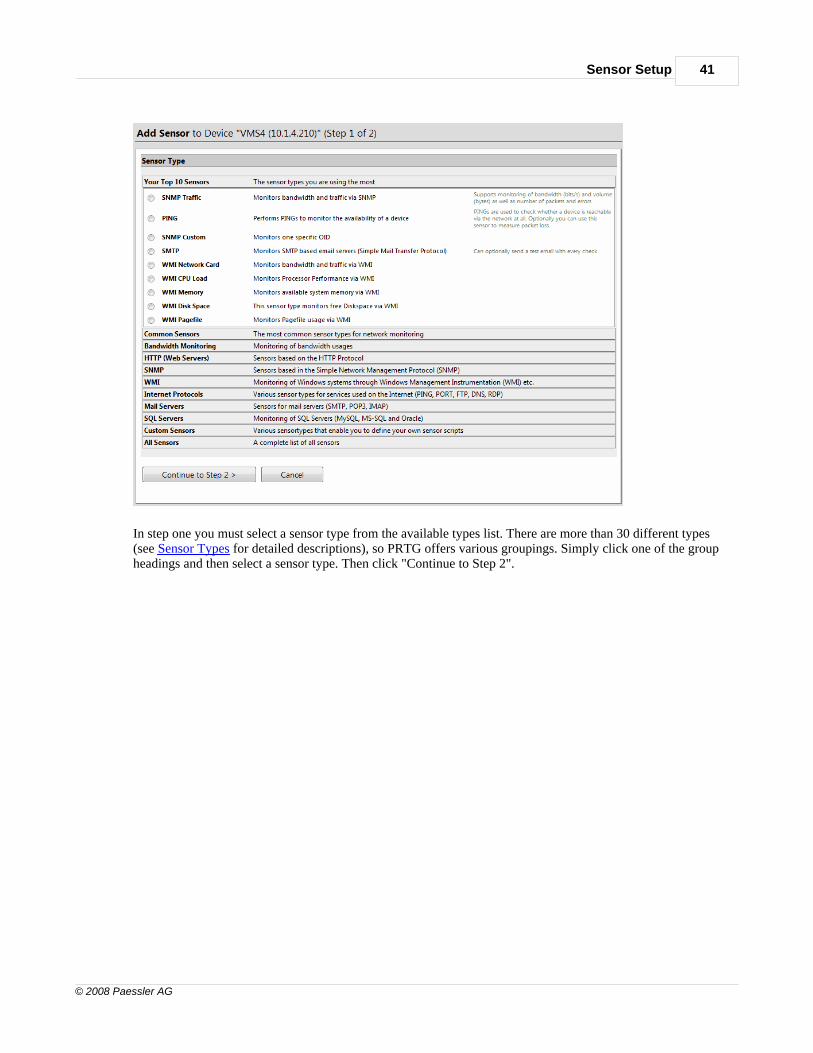
In step one you must select a sensor type from the available types list. There are more than 30 different types(see Sensor Types for detailed descriptions), so PRTG offers various groupings. Simply click one of the groupheadings and then select a sensor type. Then click "Continue to Step 2".

PRTG Network Monitor 7 - User Manual42
© 2008 Paessler AG
In step two the settings available depend on the sensor type. Please review the settings and make any necessarychanges, then click "save". The new sensor will start monitoring right away.
6.3 Creating Devices and Sensors Using the Auto Discovery
PRTG's Auto Discovery is a great way to automatically create a sophisticated and concise set of sensors for yourcomplete network. It is mainly suitable for LAN discovery since it involves a lot of SNMP and WMI.
How it works
PRTG's Auto Discovery process has three stages:
1. Step: Scanning a network segment for devices using PINGs (for groups only).2. Step: Assessing the device type for all devices discovered in Step 1 (using SNMP, WMI and other protocols).3. Step: Creating sensor sets that match the discovered device types of Step 2 (based on built-in device templates
with recommended sensors for many device types).
The Auto Discovery can be used on a group level for a range of IP addresses, or for individual devices you mighthave created manually. It can be run just once, on demand via the context menu, or scheduled every hour, day or
Sensor Setup 43
© 2008 Paessler AG
week. Running the Auto Discovery every day or week will automatically create new sensors when new devicesare connected to the network (regardless of being authorized or not). As soon as new devices or sensors arediscovered, new "todos" are created and mailed to the system admin.
There are some restrictions in place, in order to successfully use the Auto Discovery:
· PRTG can not discover devices that can not be pinged since Step 1 uses PINGs (e.g. if a firewall blocks echorequests).
· You must supply authentication settings for SNMP and Windows/WMI in order to fully exploit the power ofthis feature.
· If a device has more than one IP address, it may show up more than once in the discovery results, even thoughPRTG tries to identify these situations.
Creating an Auto Discovery Group
Create a new group by right-clicking a probe, or group, and selecting "Add Auto-Discovery Group" from thecontext menu.
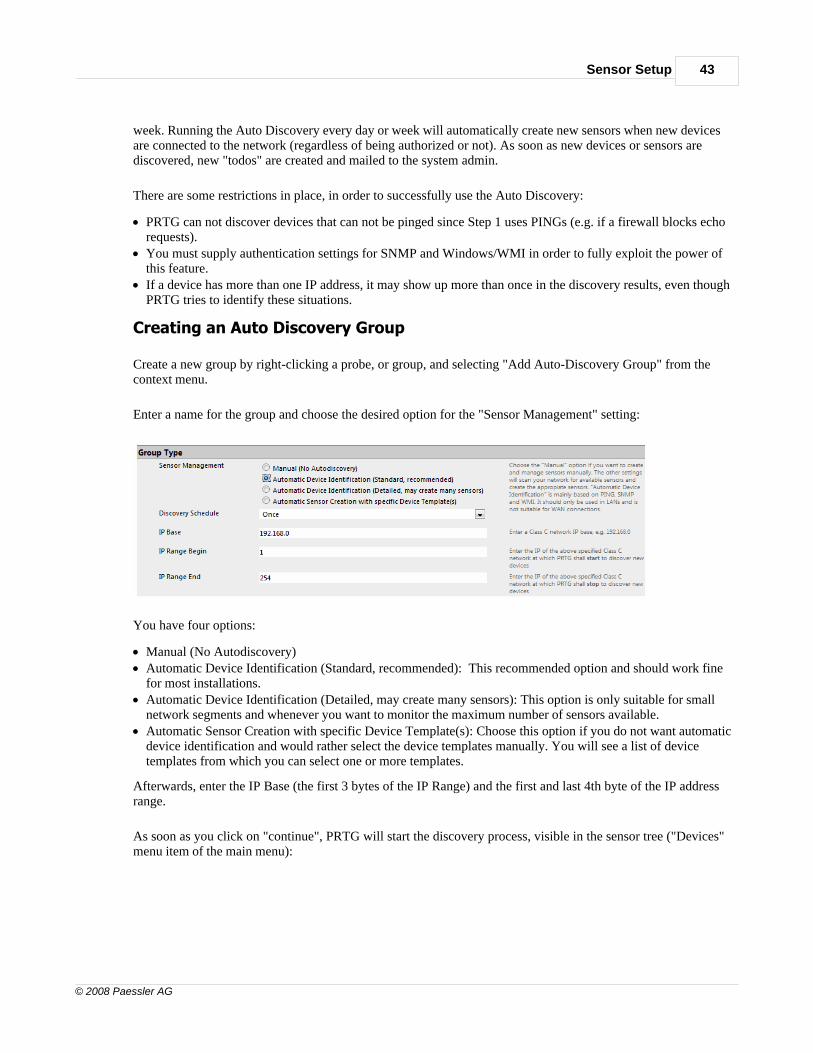
Enter a name for the group and choose the desired option for the "Sensor Management" setting:
You have four options:
· Manual (No Autodiscovery)· Automatic Device Identification (Standard, recommended): This recommended option and should work fine
for most installations.· Automatic Device Identification (Detailed, may create many sensors): This option is only suitable for small
network segments and whenever you want to monitor the maximum number of sensors available.· Automatic Sensor Creation with specific Device Template(s): Choose this option if you do not want automatic
device identification and would rather select the device templates manually. You will see a list of devicetemplates from which you can select one or more templates.
Afterwards, enter the IP Base (the first 3 bytes of the IP Range) and the first and last 4th byte of the IP addressrange.
As soon as you click on "continue", PRTG will start the discovery process, visible in the sensor tree ("Devices"menu item of the main menu):

PRTG Network Monitor 7 - User Manual44
© 2008 Paessler AG
If you keep looking at this page, you will see more and more devices and sensors showing up in the list. TheAuto Discovery process can take anywhere from 0.1 to 0.8 minutes per IP address, depending on theconfiguration and the network.
All sensors created by this process will start monitoring immediately and will notify failures as soon as theyhappen.
Creating an Auto Discovery Device
Creating sensors for just one device using the Auto Discovery function is quite similar to creating an autodiscovery group. Create a new device by right-clicking a group and choosing "Add Device" from the contextmenu.
Enter a name and IP address (or DNS name) for the device and choose one of the options for "SensorManagement" (described above).
As soon as you click "Continue" the device assessment will begin and create the sensors that suit the device.

Part
VII
Sensor Types

PRTG Network Monitor 7 - User Manual46
© 2008 Paessler AG
7 Sensor Types
PRTG offers more than 30 different sensor types for various network services. All sensor types have a number oftype-specific settings plus there are a number of common settings for all sensors. Please refer to the help text inthe web interface for a detailed description of all other settings.
Overview of Sensors
When creating new sensors you will see the following groups of sensor types. Note that some sensor types willshow up several times in this list because they fit into more than one catergory
· Common Sensors: The most common sensor types for network monitoring· Bandwidth Monitoring: Monitoring of bandwidth usages· HTTP (Web Servers): Sensors based on the HTTP Protocol· SNMP: Sensors based in the Simple Network Management Protocol (SNMP)· WMI: Monitoring of Windows systems through Windows Management Instrumentation (WMI) etc.· Internet Protocols: Various sensor types for services used on the Internet (PING, PORT, FTP, DNS, RDP)· Mail Servers: Sensors for mail servers (SMTP, POP3, IMAP)· SQL Servers: Monitoring of SQL Servers (MySQL, MS-SQL and Oracle)· File Servers: Monitoring of File Servers, NASs, etc.· VMware Servers: Sensors for VMware ESX Servers· Custom Sensors: Various sensortypes that enable you to define your own sensor scripts
7.1 SNMP Sensors Types
The Simple Network Management Protocol (SNMP) is the most basic method of gathering bandwidth andnetwork usage data.
How SNMP Monitoring works
It can be used to monitor bandwidth usage of routers and switches on a port-by-port basis, as well as devicereadings such as memory, CPU load, etc.

Sensor Types 47
© 2008 Paessler AG
When this technology is used, PRTG queries the devices (e.g. routers, switches and servers) for the trafficcounters of each port with quite small data packets. These are triggering reply packets from the device. Of thethree methods, this option creates the least CPU and network load.
Reasons To Choose SNMP Monitoring
SNMP is the most commonly used method mainly because it is easy to set up and requires minimal bandwidthand CPU cycles. If your network devices support SNMP, and/or if you want to monitor large networks withseveral hundred or thousands of sensors, we recommend you start with SNMP.
Besides network usage monitoring, another well-known feature of SNMP is the ability to also watch othernetwork parameters such as CPU loads, disk usage, temperatures, as well monitoring many other readings(depending on the device).
Network issues: In order to use SNMP for monitoring purposes, it is imperative that UDP packets are allowedto travel from the machine running PRTG, to the device you want to monitor and back, which is usually the casein LANs and Intranets. This is not usually the case for Internet connections, DMZ and WAN connections andsome changes to the traversed firewalls may be necessary. Keep in mind that SNMP V1 and V2c are not secureprotocols and should not be used across the Internet or insecure data connections. Only SNMP version 3supports encryption.
SNMP Sensors Types
The following sensors use the Simple Network Management Protocol (supports SNMP V1, V2c and V3):
· SNMP Traffic: Supports monitoring bandwidth (bits/s) and volume (bytes), as well as the number of packetsand errors via SNMP for a port or a network card on PCs, servers, switches, firewalls, printers.
· SNMP Custom: Monitors one specific OID supplied by the user.· SNMP Helper: SNMP Helper enables you to monitor thousands of performance counters on Windows systems
(SNMP Helper agent must be installed on the device, see SNMP Helper).· SNMP Library: SNMP libraries make it easy to create system-specific sensors based on MIBs (some are
included and new ones can be created from standard SNMP MIB files using the free MIB importer tool, seebelow).
SNMP Version 1, 2c and 3
PRTG supports three versions of the SNMP protocol:
SNMP Version 1: The oldest and most basic version of SNMP
· Pros: Supported by most SNMP-compatible devices; simple to set up.· Cons: Limited security as it only uses a simple password (“community string”) and data is sent in clear text
(unencrypted); should only be used inside LANs behind firewalls, not in WANs; only supports 32-bit counterswhich is not enough for high-load bandwidth monitoring (gigabits/second).
SNMP Version 2c: Adds 64-bit counters
· Pros: Supports 64-bit counters to monitor bandwidth usage in networks with gigabits/second loads.· Cons: Limited security (same as with SNMP V1).
SNMP Version 3: Adds authentication and encryption
· Pros: Offers user accounts and authentication for multiple users and optional data packet encryption,

PRTG Network Monitor 7 - User Manual48
© 2008 Paessler AG
increasing available security; plus all advantages of Version 2c.· Cons: difficult to configure.
It is important to know that if you select an SNMP version which is not supported by the server or device youwant to monitor, you will receive an error message. Unfortunately, most of the time these error messages do notexplicitly mention the possibility of using the incorrect SNMP version. These messages provide minimuminformation such as “cannot connect” or similar. The same situation exists if community strings, usernames andpasswords are incorrect.
What is the “SNMP Community String”?
The “SNMP Community String” is similar to a user ID or password that allows access to a router's, or otherdevice's, statistics. PRTG Network Monitor forwards the community string along with all SNMP requests. If thecorrect community string is provided, the device responds with the requested information. If the communitystring is incorrect, the device simply discards the request and does not respond. Note: SNMP community stringsare only used by devices that support SNMPv1 and SNMPv2c protocols. SNMPv3 uses username/passwordauthentication, along with an encryption key.
By convention, most SNMPv1-v2c equipment ships with a read-only community string set to "public". It isstandard practice for network managers to change all the community strings to customized values within thedevice setup.
Tools
Paessler MIB Importer: Imports MIB (Management Information Base) files and converts them into OID librariesfor use with PRTG Network Monitor.http://www.paessler.com/tools/
Paessler SNMP Tester: SNMP Tester can run simple SNMP requests against a device in a network to debugSNMP requests down to the protocol level in order to find communication and/or data problems in SNMPmonitoring configurations.http://www.paessler.com/tools/
See also
Bandwidth Monitoring Sensor Type Comparison
7.2 WMI Sensors Types
Windows Management Instrumentation (WMI) is the base technology from Microsoft for monitoring andmanaging Windows-based systems. WMI allows access to data for many Windows configuration parameters, aswell as current system status values. Access can be local or remote via a network connection. WMI is based onCOM and DCOM and is integrated in Windows 2000, XP, 2003 and Vista (add-ons are available for Windows9x and NT4).
In order to be able to monitor remote machines, PRTG's WMI sensor needs an Active Directory account to haveaccess to the WMI interface. You can enter these credentials for the parent device or group. The sensor will theninherit these settings.

Sensor Types 49
© 2008 Paessler AG
WMI Sensor Types
PRTG supports the following WMI based sensor types:
· WMI CPU Load: Measures CPU load of a system (total and per CPU).· WMI Memory: Displays free system memory (MB and %).· WMI Disk Space: Free disk space on fixed drives (MB and %, per drive).· WMI Network Card: Measures traffic going through network cards.· WMI Page File: Checks the usage of the Windows page file.· WMI Service: Checks if a service is running and optionally restarts a service if it is not running.· WMI Event Log Sensor: Monitors a system’s application, system and security event log for specific events.· WMI Process: Monitors one process via WMI.· WMI File: Monitors file size and existence, as well as changes to a file via WMI.· WMI Query: Performs a custom WMI query.· WMI Vital System Data: Users can select from more than 20 different vital Windows System parameters
(CPU: Percent Processor Time, CPU: Processor Queue Length, CPU: Processor Percent Privileged Time,CPU: Processor Percent User Time, Thread Context Switches, Memory: Free Physical Memory, Memory:Total Visible Memory, Memory: Pages/sec, Memory: Page Faults/sec, Memory: Page Reads/sec, Memory:Page Writes/sec, Memory: Pool Non-paged bytes, Pagefile Usage, Disk: Percent Disk Time, Disk: CurrentDisk Queue Length, Disk: Reads/sec, Disk: Writes/sec, Network: Bytes Total/sec, Network: BytesReceived/sec, Network: Bytes Sent/sec, Server: Bytes Total/sec, Server: Bytes Received/sec, Server: BytesSent/sec, etc).
· WMI Exchange Server 2003: Monitors vital readings of an Exchange Server 2003.
Links to WMI related articles
Paessler WMI Tester - A practical freeware tool to test WMI connections. Tests the accessibility of WMI(Windows Management Instrumentation) counters in a quick and easy manner.http://www.paessler.com/tools/wmitester
Microsoft: Windows Management Instrumentation Technical Articles: Managing Windows with WMI http://msdn2.microsoft.com/en-us/library/ms811533.aspx
Microsoft: WMI Referencehttp://msdn.microsoft.com/en-us/library/aa394572.aspx
See also
Bandwidth Monitoring Sensor Type Comparison
7.3 HTTP Sensor Types
The HTTP protocol (Hypertext Transfer Protocol) is most commonly used for the World Wide Web. Webbrowsers request web pages, graphics, etc from web servers using this protocol.
Common Parameters include:
· URL— the URL address of the web page to monitor (including the leading http://).· Mode — the HTTP request mode to use (GET, POST, HEAD).· POSTDATA — the data part when using the POST method.

PRTG Network Monitor 7 - User Manual50
© 2008 Paessler AG
For simple web pages, simply enter the URL (with http:// at the beginning) and keep the default mode selectionof GET. If you want to monitor a URL for a POST form, you must select the POST method and enter thePOSTDATA. The HEAD method only requests the HTTP header from the server without the actual web page.Although this saves bandwidth since less data is transferred, it is not recommended because the measured requesttime is not the one experienced by your users and you might not be notified for slow results or timeouts.
Note: If your network requires a proxy for HTTP requests or the URL requires authentication, you must use theHTTP Advanced Sensor.
Bandwidth Issues and Log File Analysis Issues
Important: Keep in mind that the HTTP sensor can create substantial bandwidth load since it is one of thesensors that transfers many bytes per requests (sometimes 1000 times more that a simple ping). So, choosing aURL that only provides a small HTML page in return is recommended if you have to pay for the bandwidth(either for your connection or for your web server). This is certainly not a major problem in most LANs andIntranets, but bandwidth usage should always be monitored. Requesting a 25kb web page with an interval of oneminute creates a traffic of 36MB per day or more than one Gigabyte per month.
Also, keep in mind that the monitoring requests will show up in your web server log analysis (one month ofmonitoring with a one minute interval will create 43,200 requests). You should filter out the requests from PRTGwhen analyzing log files. Filtering can be done based on the IP address of the server running PRTG or byfiltering requests from PRTG's browser agent:
Mozilla/5.0 (compatible; PRTG Network Monitor Vxxxx; Windows)
HTTP Sensor Types
PRTG offers the following HTTP-based sensors to monitor web servers:
· HTTP: Monitors a web server via the HTTP protocol.· HTTP Advanced: Monitors a web server via the HTTP protocol with various advanced settings (e.g. to check
the content of a web page or to use authentication or a proxy server).· HTTP Transaction: Monitors a web server using a set of URLs to monitor whether logins or shopping carts are
working fine. You must supply a series of URLs (GET and/or POST requests) including the parameters tomonitor a transaction. Use the Paessler URL Recorder to build such a URL list (see below).
· HTTP Content: Monitors a return value provided by a HTTP request. This sensor requests a HTTP URL andparses the result for a value enclosed in brackets "[value]". The most common use is to monitor a particularvalue inside a web server for validity. For example if you have a script or CGI running on the web server thatmerely publishes the free disk space of the server's hard disk or the current processor usage you can actuallymonitor this value. Of course many other usage concepts are possible.
All sensors support HTTP and HTTPS.
What it means when the HTTP sensor is up
The UP status of an HTTP sensor means that the web server delivers an HTTP result that is correct according tothe HTTP protocol and that the URL is available. This means that the web server software is up and running butyou do not know whether the results are correct, e.g. the webpage can contain error messages. So you don't knowwhether the CGI scripts, etc, are working correctly or whether, for example, the database of the web server is ok.It is recommended to also check the content of a web page by using the HTTP Advanced Sensor, instead of thesimple HTTP sensor, for added reliability.
Sensor Types 51
© 2008 Paessler AG
What it means when the HTTP sensor is down
There are numerous reasons for an HTTP sensor to fail. Besides normal connectivity problems, the mostcommon problems are internal server errors (error code 50x) and problems caused by an incorrect URL (errorcode 404, page not found).
Tools
Paessler URL Recorder: Find out the URLs and the POSTDATA strings that a user sends to a web server whilesurfing a sequence of URLs - useful when setting up HTTP Transaction sensorshttp://www.paessler.com/tools/
7.4 Packet Sniffing Sensor Types
Packet Sniffing should come into consideration if your network device(s) do not support SNMP or if you need todifferentiate the bandwidth usage by network protocol and/or IP addresses.
How Packet Sniffing works
If you need to know what applications or IP addresses are causing the traffic in your network, you can use apacket sniffer. This will look at every single data packet traveling through your network for accountingpurposes.
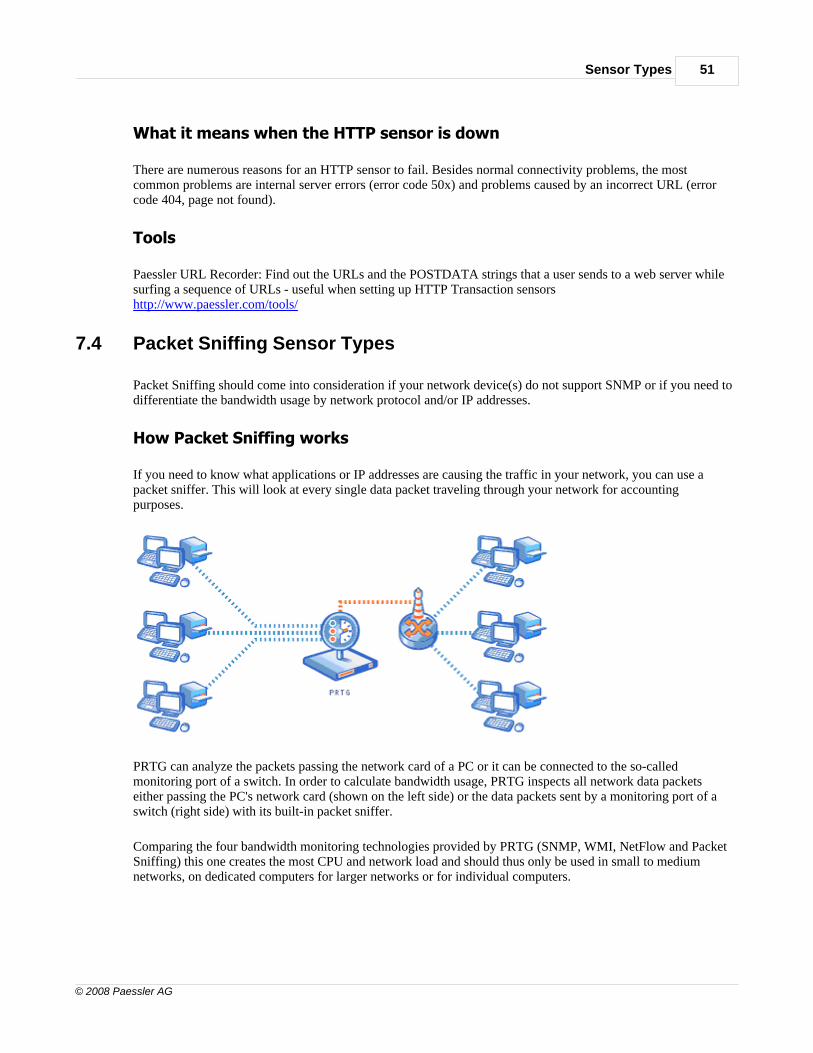
PRTG can analyze the packets passing the network card of a PC or it can be connected to the so-calledmonitoring port of a switch. In order to calculate bandwidth usage, PRTG inspects all network data packetseither passing the PC's network card (shown on the left side) or the data packets sent by a monitoring port of aswitch (right side) with its built-in packet sniffer.
Comparing the four bandwidth monitoring technologies provided by PRTG (SNMP, WMI, NetFlow and PacketSniffing) this one creates the most CPU and network load and should thus only be used in small to mediumnetworks, on dedicated computers for larger networks or for individual computers.

PRTG Network Monitor 7 - User Manual52
© 2008 Paessler AG
Reasons To Choose Packet Sniffing
It is important to understand that the packet sniffer can only access and inspect data packets that actually flowthrough the network interface(s) of the machine running the PRTG software. This is fine if you only want tomonitor the traffic of this machine (e.g. your web server). In switched networks, only the traffic for a specificmachine is sent to each machine’s network card, so PRTG can usually not discern the traffic of the othermachines in the network.
If you also want to monitor the traffic of other devices in your network, you must use a switch that offers a“monitoring port” or “port mirroring” configuration (Cisco calls it “SPAN”). In this case the switch sends a copyof all data packets traveling through the switch to the monitoring port. As soon as you connect, the PRTG hostmachine connected to the port monitored by the packet sniffer is able to analyze the complete traffic that passesthrough the switch. Another option is to use the PC running PRTG as a gateway for all other computers.
Header Based vs. Content Based Packet Sniffing
PRTG provides two base technologies for packet sniffing:
· Header based: PRTG looks at the IPs and ports of source and destination to assess the protocol. This is veryfast but, at times, not very accurate. For example it is not possible to identify HTTP traffic on ports other than80, 8080, and 443 as HTTP.
· Content based: PRTG captures the TCP packets, reassembles the data streams and then analyzes the content ofthe data using an internal set of rules to identify the type of traffic. This is quite accurate (e.g. HTTP traffic onany port number is accounted for as HTTP) but requires much more CPU and memory resources, especiallywhen a lot of traffic passes the network card.
Header based sniffing is much faster but the accounting is less reliable (e.g. HTTP packets on non-standard portsare not accounted as HTTP traffic). Content based sniffing is quite accurate, but creates more CPU load.
Packet sniffing can differentiate between the following protocols:
· WWW Traffic: HTTP, HTTPS· File Transfer: FTP· Mail Traffic: IMAP, POP3, SMTP· Chat, Instant Messaging: IRC, AIM· Remote Control: RDP, SSH, Telnet, VNC· Network Services: DHCP, DNS, Ident, ICMP, SNMP· NetBIOS: NETBIOS· Various: Socks, OtherUDP, OtherTCP
Packet Sniffing Sensor Types
PRTG offers three sensor types that are based on Packet Sniffing:
· Packet Sniffer (Header): Looks at the headers of the data packets to account traffic by IP, by port, by protocol,etc.
· Packet Sniffer (Content): Reassembles data packets to streams and looks into the payload data of the streamsto assess the type of traffic (e.g. SMTP, HTTP, IMAP, file sharing, NETBIOS, etc.)
· Packet Sniffer (Custom): Accounts for data packets using user-specific rules (header based).
In the sensor settings you can choose how detailed you want traffic to be accounted for according to theprotocols used. You can also include and exclude filters that allow monitoring of specific packets, IPs, Ports, etc.

Sensor Types 53
© 2008 Paessler AG
Tools
Paessler Card Packet Counter: Shows short term statistics about the network data packets passing a local networkcard.http://www.paessler.com/tools/
See also
Bandwidth Monitoring Sensor Type Comparison
7.5 NetFlow Sensor Types
NetFlow monitoring is the domain of networks using Cisco switches.
How NetFlow Monitoring works
One option to measure bandwidth usage "by IP address" or "by application" is to use Cisco's NetFlow protocolwhich is specially suited for high traffic networks. Many Cisco routers and switches support this protocol.
Cisco devices with NetFlow support track the bandwidth usage of the network internally and merely forwardpre-aggregated data to the PRTG system for accounting purposes. This way PRTG's computing load is muchlower. This option is recommended for high traffic networks.
Reasons To Choose NetFlow Monitoring
NetFlow monitoring is the domain of networks that use Cisco switches. These switches can be configured to senddata streams providing the network’s usage data to the machine running PRTG which, in turn, analyzes the data.
Because the switch already performs a pre-aggregation of traffic data, the flow of data to PRTG is much smallerthan the monitored traffic. This makes NetFlow the ideal option for high traffic networks that need todifferentiate the bandwidth usage by network protocol and/or IP addresses.

PRTG Network Monitor 7 - User Manual54
© 2008 Paessler AG
PRTG Features for NetFlow Monitoring
NetFlow is a bandwidth monitoring technology created by Cisco. PRTG supports flow monitoring usingNetFlow Version 5 with the following two sensors:
· NetFlow: Monitors Cisco switches using NETFLOW V5.· NetFlow (Custom): User configurable version of the NetFlow sensor.
Before you can create NetFlow sensors, you must configure NetFlow on your switch/router. Configure the switchto send the NetFlow packets to the computer running the PRTG probe. Also, configure the NetFlow port andflow timeout. These two values must be defined within PRTG when creating new NetFlow sensors. Don't forgetto open the NetFlow port in the PRTG system's firewall.
Limitations
On a powerful 2007/2008 PC, (Dual Core, 2.5 Ghz) you can process about 100,000 flows per second for oneNetFlow stream. When using complex filters, the value can be much lower. For example, with a router sendingabout 2,000 flows/second (which corresponds to mixed traffic at gigabit/sec level) you can expect to configureup to 50 NetFlow sensors operating properly. PRTG internally monitors its own NetFlow processing and youwill see a decreased probe health reading as soon as NetFlow packets are not processed due to an overload.
If you experience an overload please consider setting up multiple probes and distribute the NetFlow streams tothem. We do not recommend adding more than 400 NetFlow sensors per PRTG probe.
Tools
Paessler NetFlow Tester: NetFlow Tester simply dumps the data of all NetFlow packets that a computer receivesfrom a Cisco router - useful when debugging bandwidth monitoring configurations based on NetFlow protocol.http://www.paessler.com/tools/
See also
Bandwidth Monitoring Sensor Type Comparison
Paessler Knowledge Base: Configuration Tips for Cisco Routers and PRTG http://www.paessler.com/support/kb/questions/20/
7.6 SQL Server Sensor Types
Using the SQL Server sensors you can natively monitor the most commonly implemented SQL servers: MySQL,Microsoft SQL, and Oracle SQL. The sensors monitor when the database server process accepts and processesrequests. Additionally, you can run a custom SQL command and check the return values.
PRTG supports native monitoring for the following SQL Servers:
· Microsoft SQL Server: Checks Microsoft SQL server connections.· MySQL Server: Checks MySQL server connections.· Oracle SQL Server: Checks Oracle SQL server connections.

Sensor Types 55
© 2008 Paessler AG
Common Settings for all SQL Sensors
· Database Name – in this field, the name of the database or the path of the database can be entered in order toaccess the database information.
· User and Password – provide the username and password to login to the database.· SQL Expression – provide an expression to fetch data. When a cursor is returned, only the first row will be
fetched.· Result Set – select this checkbox if your SQL expression returns a result set. Then the value of the first column
in the first row of the result set is used as the return value of the monitoring request (e.g. will be compared tothe limits). Otherwise the “number of affected rows” is regarded to be the return value of a monitoring request.
Notes for MS-SQL Sensors
· Supports SQL Server 2005, SQL Server 2000, SQL Server 7 and MSDE (requires OLE DB installed on themachine running the PRTG probe that accesses the server).
· Instance Name – This holds the name of the instance if you want to connect to a "named instance", otherwisethis field should remain empty. Note: Sometimes you will see connection strings like SQLSERVER\SQLINSTANCE in database clients. The first part is the server name configured under the general serversettings. The second part refers to the instance name mentioned above. NEVER enter the string in the instancefield of the sensor setup page in this form, merely provide the second part (without the backslash).
· Port – If your SQL server runs the instance at a different static port than 1433, you can define the port numberin this field. If your SQL server uses the default value of 1433 or is configured for dynamic port settings, leavethis field empty.
Notes for Oracle SQL Sensors
· Supports Oracle 10g, 9i, 8i and Oracle 7 (requires default TCP Port Setting 1521). · Interface – Oracle offers two possibilities when connecting to the server - either through direct TCP/IP
communication (SQL-NET) or via the Oracle Client Interface (OCI). Select the one you want to use for thissensor.
· Port – Under SQL-NET you need to supply the TCP/IP port for the connection in this field. Usually thedefault value of 1521 is correct. With an OCI connection the setting of the port property is ignored.
Notes for MySQL Sensors
· Supports MySQL server 5.0, 4.1, 4.0 and 3.23.
7.7 File Server Sensor Types
In order to monitor file servers you can use the following sensors.
· WMI Disk Space: This sensor type monitors free disk space via WMI (see WMI Sensors Types)· WMI File: Monitors a file via WMI (see WMI Sensors Types)· Share Disk Space: Monitors free disk space of SMB shares (Windows/Samba) · File: Monitors a file's existence, size, and age and also discovers changes to the file· Folder: Monitors a folder's existence as well as the number of files and their ages/sizes and also discovers
changes to the folder's content
PRTG Network Monitor 7 - User Manual56
© 2008 Paessler AG
7.8 VMware Server Sensor Types
With PRTG you can monitor the vital parameters of VMware host servers and the virtual machines running onthem.
Sensor types are:
· VMware ESX Host Server: Monitors a VMware ESX Host Server · VMware Virtual Machine: Monitors a single Virtual Machine
While the ESX Host Server sensor only works directly with an VMware ESX 3.x server as its parent device youcan use the virtual machine sensor in two ways:
· Use it to directly communicate with a VMware ESX 3.x Host Server to monitor virtual machines running onthis server.
· Use it to communicate with a VMware Virtual Center installation to monitor all virtual machines managed bythis virtual center. Only this option supports virtual machines running on VMware Server 2.x and virtualmachines that are under control of VMware's VMotion feature.
For VMware sensors PRTG needs an administrator login for the host server(s). You can enter these credentials inthe VMware Credentials section for the parent device or group. The sensors will then inherit these settings.
Notes:
Due to performance limitations we recommend to keep the number of VMware sensors querying the same virtualserver and using the same user account below 20. If you have more sensors you should use two or more useraccounts or your should distribute the sensors across multiple probes.
VMware is a registered trademark of VMware Inc.
7.9 Other Sensor Types
The following sensor types allow to monitor various TCP and UDP based services:
· PING: Performs one or more PINGs to monitor the availability of a device and optionally measure packet lossin percent.
· PORT: Checks the availability of TCP based network services.· FTP: Monitors the availability of a FTP Server.· DNS: Checks a DNS (Domain Name Service) server.· SMTP: Monitors SMTP based email servers (Simple Mail Transfer Protocol).· POP3: Monitors POP3 based email servers (Post Office Protocol V3).· IMAP: Monitors IMAP based email servers (Internet Message Access Protocol).· RDP (Remote Desktop): Checks whether the RDP service of a device is available.
All these sensors use the protocol standards.
7.10 Custom Sensor Types
PRTG supports four custom sensor types:
· WMI Custom Sensor: Performs a custom WMI query written in WQL (WMI Query Language). · EXE: Runs a custom program (EXE, DLL) or script/batch file.

Sensor Types 57
© 2008 Paessler AG
· Packet Sniffer (Custom): Accounts for data packets using user-specific rules, see Packet Sniffing Sensor Types.
· NetFlow (Custom): User configurable version of the NetFlow sensor, see NetFlow Sensor Types.
Custom sensors allow a number of monitoring tasks that go far beyond the standard sensor set to be performed.You can create your own sensors using WQL (WMI Query Language) and by compiling an EXE file, using anyWindows software development tool.
In both cases you must create a file and place it in a specific folder on the system running the PRTG probe:
· Place executables (.EXE), batchfiles (.CMD or .BAT), VBS scripts (.VBS), or PowerShell scripts (.PS1) intothe "PRTG Network Monitor\custom sensors\EXE" subfolder.
· Place .WQL files with WQL scripts into the "PRTG Network Monitor\custom sensors\WMI WQL scripts"subfolder.
As soon as a file is placed into the folders mentioned above, you can create or edit a Custom EXE sensor orWMI Custom sensor and select the new file from the list of files.
The probe will then execute the file on the probe system. The local probe file will be run on the local system.But for remote probes, the file will actually run on the remote system. If your custom sensor code relies on otherfiles (eg. DLLs, .NET framework, Windows PowerShell, etc.) you must copy/install these files onto the probemachine manually.
See Interface Definition for Custom EXE Sensors for detailed documentation. Sample projects for these Customsensors can be found in the Knowledge Base on the Paessler website under www.paessler.com/support.
In the parameter fields you can use these placeholders:
· %host: device IP/DNS· %device: device name· %probe: probe name· %name: sensor name
Notes
· For PowerShell scripts, make sure that they may be executed by either signing the files or changing thesecurity policy for Powershell.exe accordingly.
· The API interface for custom EXE sensors is compatible to the custom EXE sensors provided by IPCheckServer Monitor 5.
7.11 Comparison of Bandwidth Monitoring Sensor Types
The following table shows the differences between PRTG's four methods available for bandwidth monitoring:
WMI SNMP Packet Sniffing Netflow
Setup Medium Easy Easy to Complex(depending on filterrules used)
Can be complex(e.g. the switchmust beconfigured)
Traffic can befiltered
No No Yes Yes

PRTG Network Monitor 7 - User Manual58
© 2008 Paessler AG
WMI SNMP Packet Sniffing Netflow
Differentiatebandwidth usageby protocol orIPs
No No Yes Yes
PRTG can showToplists (TopTalker, TopConnections,Top Protocols,etc.) (V7.1)
No No Yes Yes
Filter bandwidthusage by IP
No No Yes Yes
Filter bandwidthusage by MACaddress
No No Yes No
Filter bandwidthusage byphysical networkport
Yes Yes No No
Monitor networkparameters otherthan bandwidthusage
Yes Yes No No
CPU load on themachine runningPRTG
Low Low Higher, depends onthe amount of traffic
Higher, dependson the amount oftraffic
Excessbandwidth usageof monitoring
Small Small None (except whenmonitoring switchports are used)
Depends on thetraffic

Part
VIII
Notifications
PRTG Network Monitor 7 - User Manual60
© 2008 Paessler AG
8 Notifications
“Notifications” are used to send alerts to the user whenever PRTG discovers a defined state, such as slow orfailing sensors, or when thresholds are reached. You can define an unlimited number of notifications allowing touse one, or more, of several communication channels like email, pager, SMS messaging, Instant Messengernotification, execute program (EXE file/batch file) or HTTP request, Network Broadcast (NET SEND), play asoundfile and Windows event log entries.
Notifications can be triggered by:
· Sensor status changes (a sensor goes down or up, responses are slow or the sensors show an unusual status).· When the measured value reaches a specific threshold, (e.g. higher than 1000ms request time for more than 30
minutes).· Reaching a specific speed threshold (e.g. more than 1Mbit/s for more than 5 minutes. Ttraffic sensors only).· Reaching a specific data volume threshold (e.g. more than 1 Gbyte transferred in 24-hours. Traffic sensors
only).
Notifications can be sent by:
· Email: PRTG 7 provides a built-in mail server (uses MX records to deliver emails) or can use an availableSMTP relay.
· SMS or pager message (through third party services).· Network Broadcast (Note: NetSend is no longer supported on computers running Windows Vista or Windows
Server 2008).· Instant Messenger (ICQ, MSN, Yahoo, AIM).· HTTP request.· running an external program or batch file.· play a sound via external speakers.· writing an entry into the local system log.
Notifications contain valuable sensor information, such as:
· last error message.· last good/failed request.· total downtime.· total uptime.· recent sensor history.· and: email texts, SMS messages, etc. (can be fully edited by the user using placeholders).
Check Notification Setup Before Sending Notifications!
Some notification types require additional setup by the administrator user. Please see System Setup -Notifications.
Creating Notifications
To create and edit notifications choose "Setup|Notifications" from the main menu. Click a name to edit anotification or click on "add notification" to create a new one:
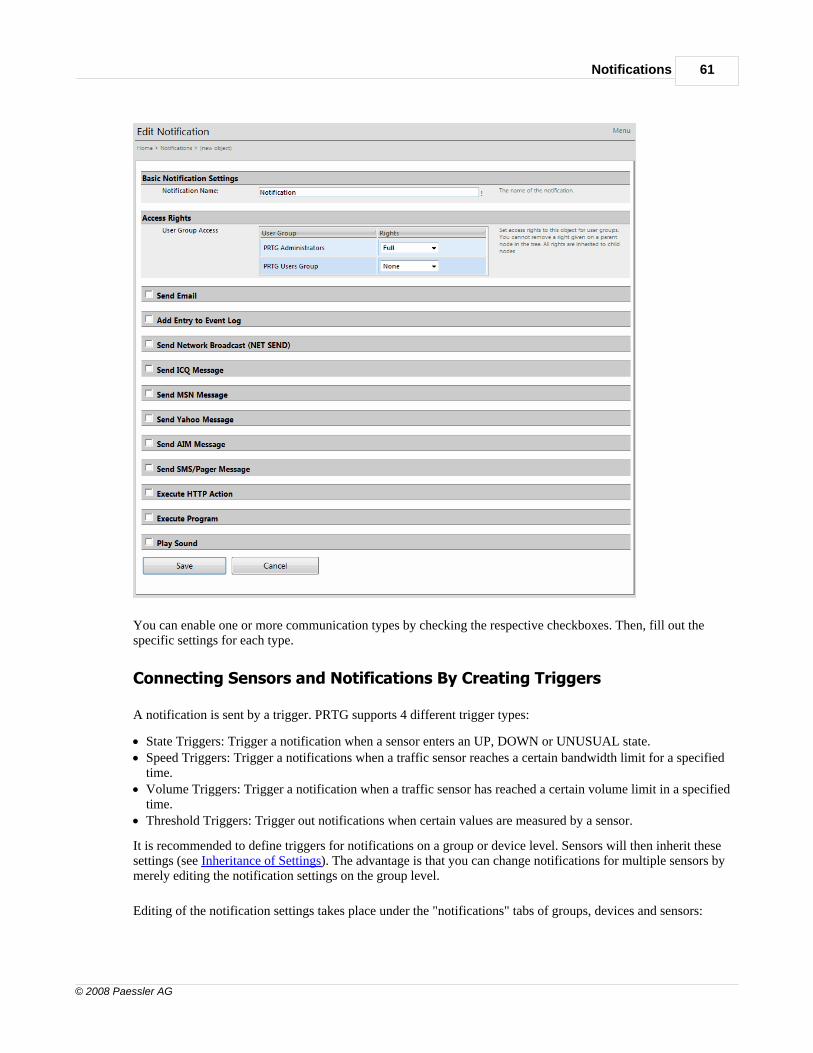
Notifications 61
© 2008 Paessler AG
You can enable one or more communication types by checking the respective checkboxes. Then, fill out thespecific settings for each type.
Connecting Sensors and Notifications By Creating Triggers
A notification is sent by a trigger. PRTG supports 4 different trigger types:
· State Triggers: Trigger a notification when a sensor enters an UP, DOWN or UNUSUAL state.· Speed Triggers: Trigger a notifications when a traffic sensor reaches a certain bandwidth limit for a specified
time.· Volume Triggers: Trigger a notification when a traffic sensor has reached a certain volume limit in a specified
time.· Threshold Triggers: Trigger out notifications when certain values are measured by a sensor.
It is recommended to define triggers for notifications on a group or device level. Sensors will then inherit thesesettings (see Inheritance of Settings). The advantage is that you can change notifications for multiple sensors bymerely editing the notification settings on the group level.
Editing of the notification settings takes place under the "notifications" tabs of groups, devices and sensors:
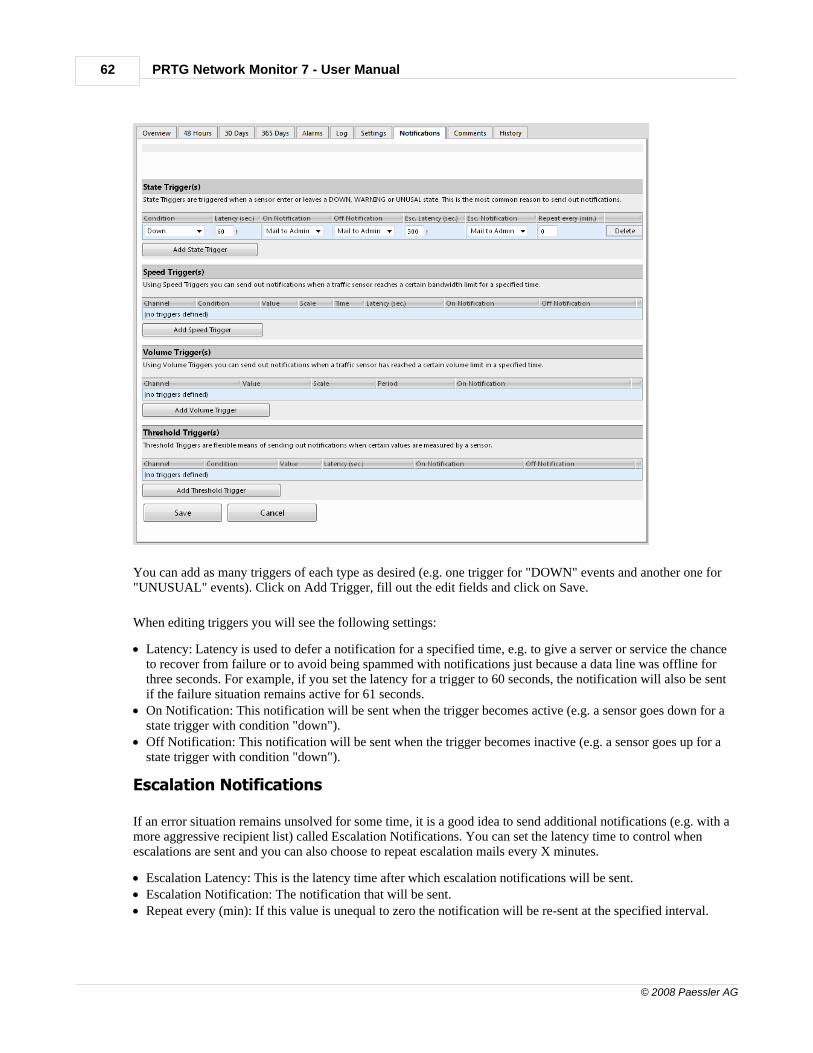
PRTG Network Monitor 7 - User Manual62
© 2008 Paessler AG
You can add as many triggers of each type as desired (e.g. one trigger for "DOWN" events and another one for"UNUSUAL" events). Click on Add Trigger, fill out the edit fields and click on Save.
When editing triggers you will see the following settings:
· Latency: Latency is used to defer a notification for a specified time, e.g. to give a server or service the chanceto recover from failure or to avoid being spammed with notifications just because a data line was offline forthree seconds. For example, if you set the latency for a trigger to 60 seconds, the notification will also be sentif the failure situation remains active for 61 seconds.
· On Notification: This notification will be sent when the trigger becomes active (e.g. a sensor goes down for astate trigger with condition "down").
· Off Notification: This notification will be sent when the trigger becomes inactive (e.g. a sensor goes up for astate trigger with condition "down").
Escalation Notifications
If an error situation remains unsolved for some time, it is a good idea to send additional notifications (e.g. with amore aggressive recipient list) called Escalation Notifications. You can set the latency time to control whenescalations are sent and you can also choose to repeat escalation mails every X minutes.
· Escalation Latency: This is the latency time after which escalation notifications will be sent.· Escalation Notification: The notification that will be sent.· Repeat every (min): If this value is unequal to zero the notification will be re-sent at the specified interval.

Notifications 63
© 2008 Paessler AG
More
· Account Settings - Notifications· System Setup - Notifications

Part
IX
Maps

Maps 65
© 2008 Paessler AG
9 Maps
PRTG's "maps" feature is a unique concept that enables the user to create web pages with up-to-the-minutemonitoring status information in a customizable layout. There are countless possibilities for the implementationof maps. For example this feature can be used to:
· Create network maps with an overlay of status icons for each device on the map.· Create "dashboard" views that can be shown on network operations center screens.· Create a quick network overview for publishing on the Intranet, allowing at-a-glance information for
management of other employees.· Create a custom view of the most important sensors in your monitoring setup.· Create Top 10 lists of the sensors of a specific group or device.
Technically a map is a normal web page and consists of the following:
· an optional background image (a PNG/GIF/JPG file, e.g. your company logo, a graphical view of yournetwork).
· a set of map items, which can include a sensor status icon, a graph or a list of sensors.
You can also specify the size of the map. Using the AJAX-based map editor, you can place the items anywhereon the map and you can also control the size of the items. Each map has a unique URL which can be used to linkto the map. Users who want to access the map either need an account under your PRTG installation, or canaccess a "public URL" of the map if you enable the "Public Map" feature. Public maps contain a unique accesskey ("Map ID") in the URL that secure the map from unwanted visitors.
Sample maps
Here are a few sample maps:
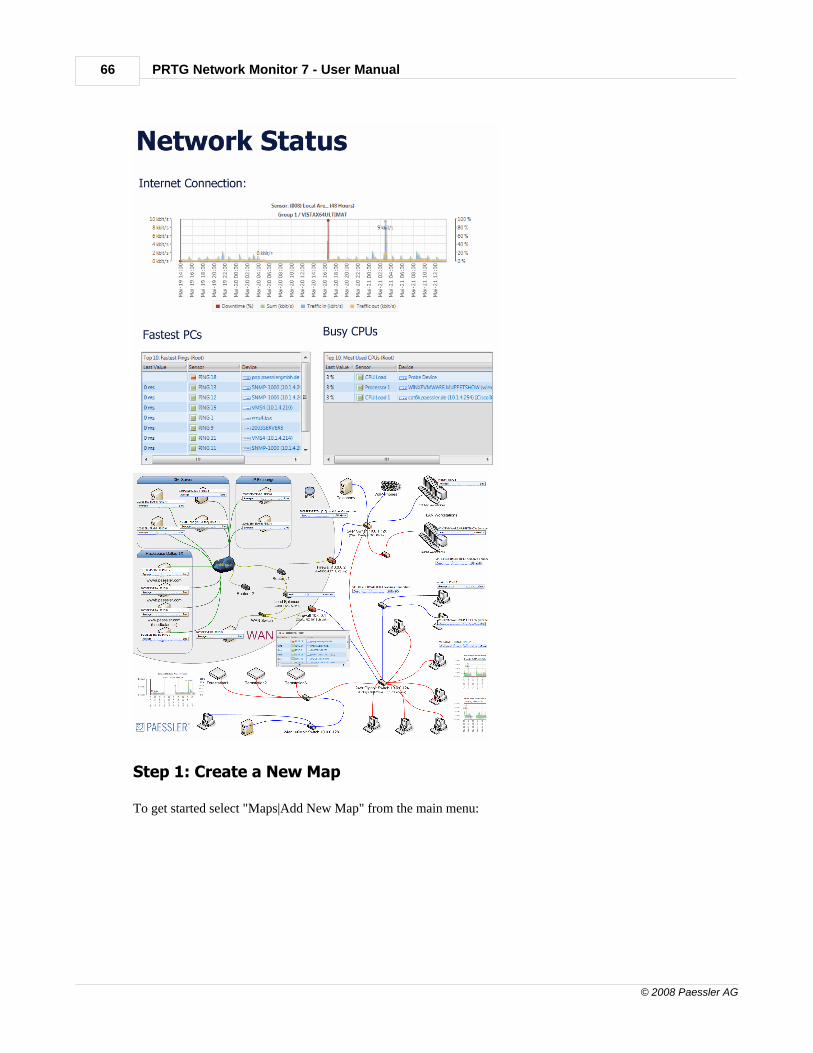
PRTG Network Monitor 7 - User Manual66
© 2008 Paessler AG
Step 1: Create a New Map
To get started select "Maps|Add New Map" from the main menu:

Maps 67
© 2008 Paessler AG
Fill out the fields and optionally select a map background image. Enable "Allow Public Access" if you wantusers without a PRTG user account to be able to view the map. Click "Continue to Step 2" and you will be takento the new map.
Step 2: Add Items to the Map
Click on "Edit Layout" to enable the Map Editor:
To add an item to the map click on "Add Map Item":
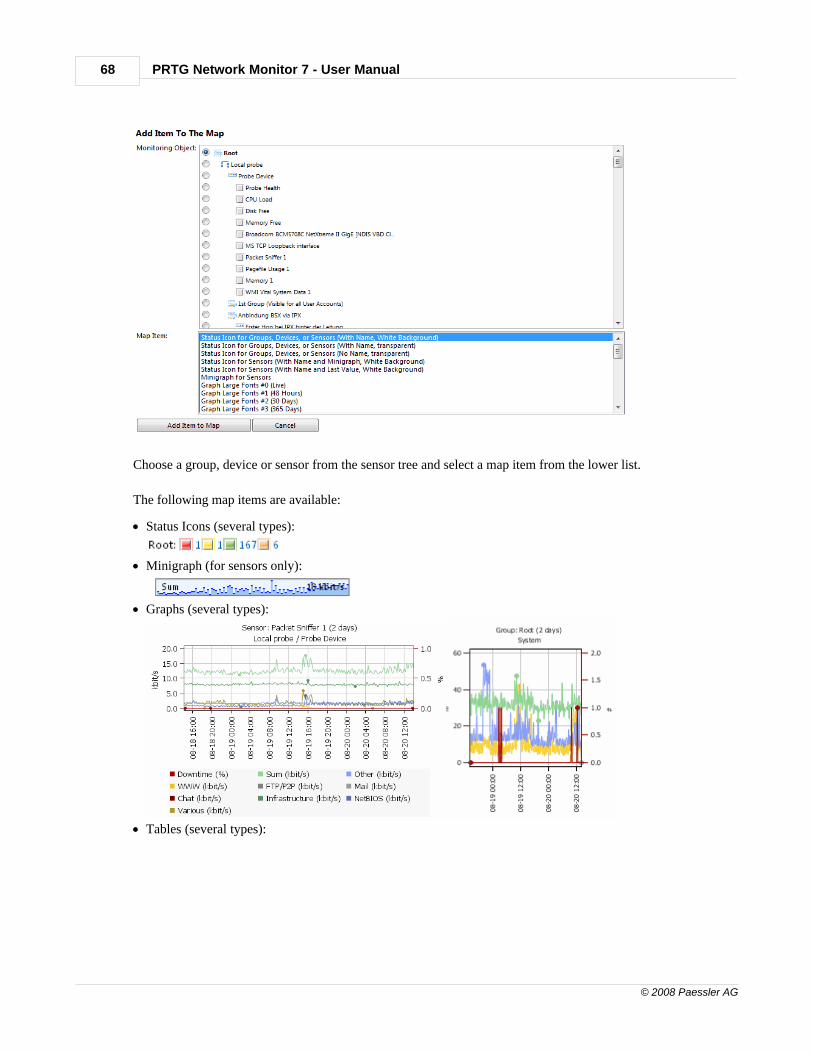
PRTG Network Monitor 7 - User Manual68
© 2008 Paessler AG
Choose a group, device or sensor from the sensor tree and select a map item from the lower list.
The following map items are available:
· Status Icons (several types):
· Minigraph (for sensors only):
· Graphs (several types):
· Tables (several types):

Maps 69
© 2008 Paessler AG
Step 3: Move and Edit Map Items
As soon as you have added an item to the map you can modify it as follows:
· Move the item by clicking and dragging the black "grip bar" at the top.· Resize the item by dragging the blue arrow at the bottom right corner.· Delete the item by clicking the "Delete" link.· Edit item settings by clicking the "Settings" link: You can then change the associated monitoring item as well
as the template.

PRTG Network Monitor 7 - User Manual70
© 2008 Paessler AG
Step 4: View a Map and Share a Map
Click on "View Map" to look at the final layout.
To use the map outside of PRTG you have to two options:
· Option 1: Link to a web page with the map.· Option 2: Show a map inside other webpages using an IFRAME.
Please click on "Get HTML" in order to discern the necessary URLs and HTML codes as well as additionalinstructions.

Part
X
Reports
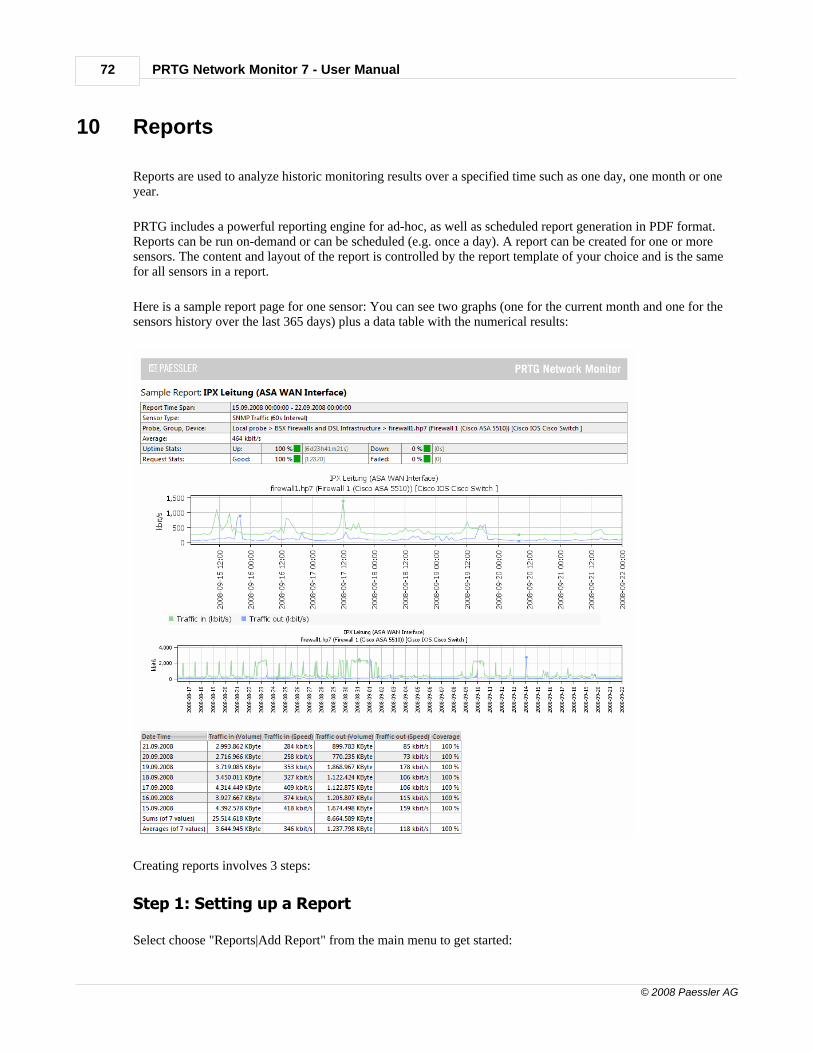
PRTG Network Monitor 7 - User Manual72
© 2008 Paessler AG
10 Reports
Reports are used to analyze historic monitoring results over a specified time such as one day, one month or oneyear.
PRTG includes a powerful reporting engine for ad-hoc, as well as scheduled report generation in PDF format. Reports can be run on-demand or can be scheduled (e.g. once a day). A report can be created for one or moresensors. The content and layout of the report is controlled by the report template of your choice and is the samefor all sensors in a report.
Here is a sample report page for one sensor: You can see two graphs (one for the current month and one for thesensors history over the last 365 days) plus a data table with the numerical results:
Creating reports involves 3 steps:
Step 1: Setting up a Report
Select choose "Reports|Add Report" from the main menu to get started:

Reports 73
© 2008 Paessler AG
Click on "Save" when your are done with the settings.
Step 2: Editing the List of Channels
On the next page you can review and fine tune the list of sensors and channels:

PRTG Network Monitor 7 - User Manual74
© 2008 Paessler AG
You can enable individual channels of a sensor using the checkboxes. Use the "Delete" links to remove a sensorfrom the report. To add more sensors to a report choose one from the list of all sensors in the lower half and clickthe "Add" link. To find a specific sensor either use the paging function of the table or enter a search term in thesearch box and click "Search".
Step 3: Run the Report Interactively (or wait for the Schedule)
Click on the "Run Now" tab to run the report now:
Select the desired settings an click on "Run Report".
· HTML Reports will be shown immediately.· PDF reports will be created in the background and you will receive an email with a Todo when the report is
finished.
Editing Report Settings
To configure a report you must edit the following main settings:

Reports 75
© 2008 Paessler AG
· Name: Please choose a descriptive name.· Template: You can choose from the list of available templates. There are templates that offer optional data
tables besides the graphs. You also specify the graph/calculation intervals by selecting a template. Note: Youcan edit the template *.htm in the "website\reporttemplates" subfolder of your PRTG Installation.
· Report Type: Please choose between daily, weekly, monthly or yearly reports. Choose "Current" period forreports that are intended to include the present moment (i.e. a monthly report run on the 20th of the monthcovers the period from the 1st to 20th of the current month) or "previous" period (i.e. a monthly reports alwayscover the full previous month).
· Sensors: Select the sensors for the report (note: If you have more than 500 sensors you can not add sensorswhile creating the report, you must add them later).
· Schedule: You can create reports for manual "on-demand use" or for automatic generation every hour, day,day of week, day of month or a specific date.
· Processing: PRTG can email the report to an email address, save the PDF file to disk or both.
If you choose automatic processing you will receive a Todo email every time the report is run.

Part
XI
Todos
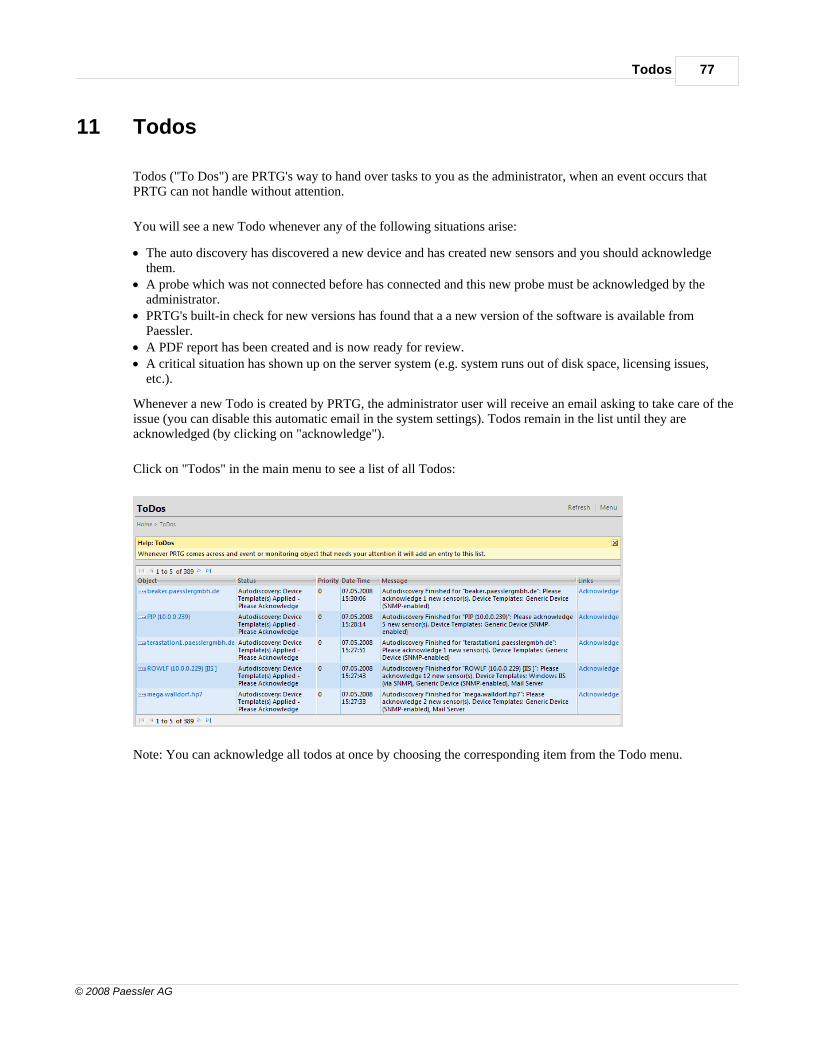
Todos 77
© 2008 Paessler AG
11 Todos
Todos ("To Dos") are PRTG's way to hand over tasks to you as the administrator, when an event occurs thatPRTG can not handle without attention.
You will see a new Todo whenever any of the following situations arise:
· The auto discovery has discovered a new device and has created new sensors and you should acknowledgethem.
· A probe which was not connected before has connected and this new probe must be acknowledged by theadministrator.
· PRTG's built-in check for new versions has found that a a new version of the software is available fromPaessler.
· A PDF report has been created and is now ready for review.· A critical situation has shown up on the server system (e.g. system runs out of disk space, licensing issues,
etc.).
Whenever a new Todo is created by PRTG, the administrator user will receive an email asking to take care of theissue (you can disable this automatic email in the system settings). Todos remain in the list until they areacknowledged (by clicking on "acknowledge").
Click on "Todos" in the main menu to see a list of all Todos:
Note: You can acknowledge all todos at once by choosing the corresponding item from the Todo menu.

Part
XII
User Management

User Management 79
© 2008 Paessler AG
12 User Management
The default administrator can use the PRTG installation as the only user or can create an unlimited number ofusers.
Users are organized using an unlimited number of groups. All the security settings as well as the rightsmanagement are conducted via the user groups. This means that group membership controls what a user may doand see when logged in.
Creating New Users
For each new user the administrator user must specify a login name and an email address. New users can becreated by selecting "Setup|Users" from the main menu and clicking on "Add new user".
Tip: If you want to control the rights of each user individually, you must create a user group for each user. Thiscan be automated by choosing "Create new user group for this user" from the "Primary Group" drop-down whencreating a new user account. This will create a new user and a new user group with the same name. In turn, youcan use this user group to control the user's rights individually.
User Account Settings
Each user account has a number of settings that can be changed by the user (choose "Setup|My Account" fromthe main menu) or by the administrator. These settings are:
· Password: Here you can change your login password.· Time zone: All times will be shown in this time zone as soon as the user is logged on.· Auto refresh type and interval: PRTG automatically refreshes the content in your browser. Here you can
choose between two different refresh methods, you can disable the refreshing and you can specify the refreshtime (30s recommended).
· Graph rendering and graph delay: Choose whether you would like graphs based on static images (which loadfaster) or Flash based graphs (which offer more interactivity, e.g. with hover information for each value).
· Autofolding Settings: In order to provide you with a speedy user experience PRTG tries to keep the page sizefor the pages with the sensor tree small by automatically "folding" groups and devices with many items. Thetwo settings "Max. Groups/Devices per Group" and "Max. Sensors per Device" control how manygroups/devices or how many sensors are shown at max before the automatic reduction is performed.Recommended values are 10-30 for both settings. If you do not want to see any individual sensors in the treeview enter a zero for "Max. Sensors per Device".
· Active/inactive: The administrator can set a user to inactive, meaning the user can not log on.
Creating New User Groups
Creating new users is performed by selecting "Setup|User Groups" from the main menu and clicking on "Addnew user group".
Controlling User Rights
Throughout the web interface of PRTG you can control access to the monitoring objects (e.g. groups, devices,sensors, maps, reports, etc.) using the following settings:
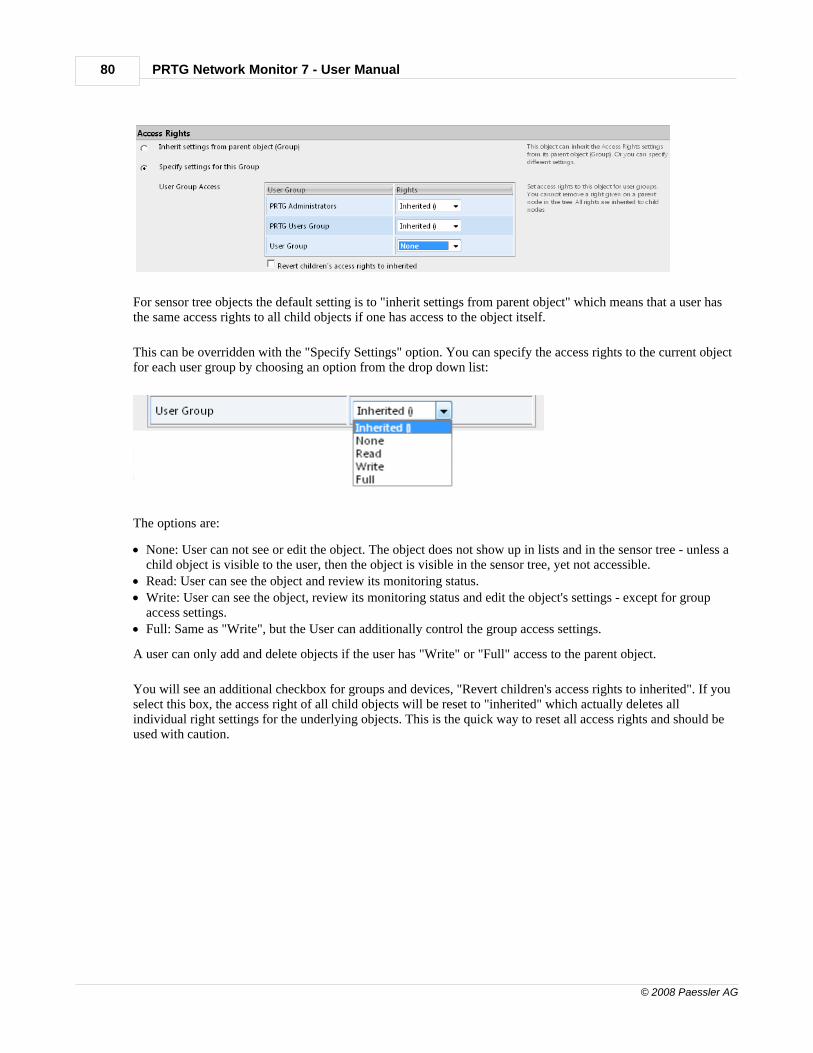
PRTG Network Monitor 7 - User Manual80
© 2008 Paessler AG
For sensor tree objects the default setting is to "inherit settings from parent object" which means that a user hasthe same access rights to all child objects if one has access to the object itself.
This can be overridden with the "Specify Settings" option. You can specify the access rights to the current objectfor each user group by choosing an option from the drop down list:
The options are:
· None: User can not see or edit the object. The object does not show up in lists and in the sensor tree - unless achild object is visible to the user, then the object is visible in the sensor tree, yet not accessible.
· Read: User can see the object and review its monitoring status.· Write: User can see the object, review its monitoring status and edit the object's settings - except for group
access settings.· Full: Same as "Write", but the User can additionally control the group access settings.
A user can only add and delete objects if the user has "Write" or "Full" access to the parent object.
You will see an additional checkbox for groups and devices, "Revert children's access rights to inherited". If youselect this box, the access right of all child objects will be reset to "inherited" which actually deletes allindividual right settings for the underlying objects. This is the quick way to reset all access rights and should beused with caution.

Part
XIII
System Settings and Administration

PRTG Network Monitor 7 - User Manual82
© 2008 Paessler AG
13 System Settings and Administration
The settings for your account, the system settings and most of the system administration settings are availablefrom the "Setup" menu in the web interface. Some settings (e.g. web server IP and port and license key) arelocated in the Server Admin Tool and Probe Admin Tool.
Please read on in the following sections:
· Account Settings - My Account· Account Settings - Schedules· Account Settings - Notifications· System Setup - Web Server· System Setup - Probes· System Setup - Notifications· Core Server Admin Tool· Probe Admin Tool
13.1 Account Settings - My Account
Under "My Account" you can change various settings specific to your user account:

System Settings and Administration 83
© 2008 Paessler AG
This page allows to define the following information in detail:
· User Account Settings: These fields allow you to define the login name, the user name, the email address forthe user, the time zone and allows you to set a new password.
· Auto Refresh Settings: Using these fields you can select whether you want the content of your browser to berefreshed automatically or not, if you want to merely refresh page elements or the entire page, and what refreshinterval (in seconds) you want to use.
· Web Interface Settings: These fields allow you to select the charts display mode: select static images for fastergraph processing or Flash for increased interactivity. You can further select to turn the contextual help on andoff.
· Autofolding Settings for the Sensortree: PRTG tries to keep the page size for the pages with the sensor treesmall by automatically "folding" groups and devices with many items. In these fields you can define how manygroups/devices or how many sensors maximum are to be shown before the specific branch is reduced (folded).
· Account Control: These fields allow you to define to what group(s) the user in case belongs to, among otherdefining the user's access rights. Non-admin users can also be set to active or inactive by selecting therespective radio button (available for the admin only).
13.2 Account Settings - Schedules
Under "Schedules" users can define a timetable that can be used to pause monitoring for groups, servers orsensors based on time and day of week, as well as pause the delivery of notifications.
Various common schedules are available by default, further schedules can be added using the "Add newschedule" button.
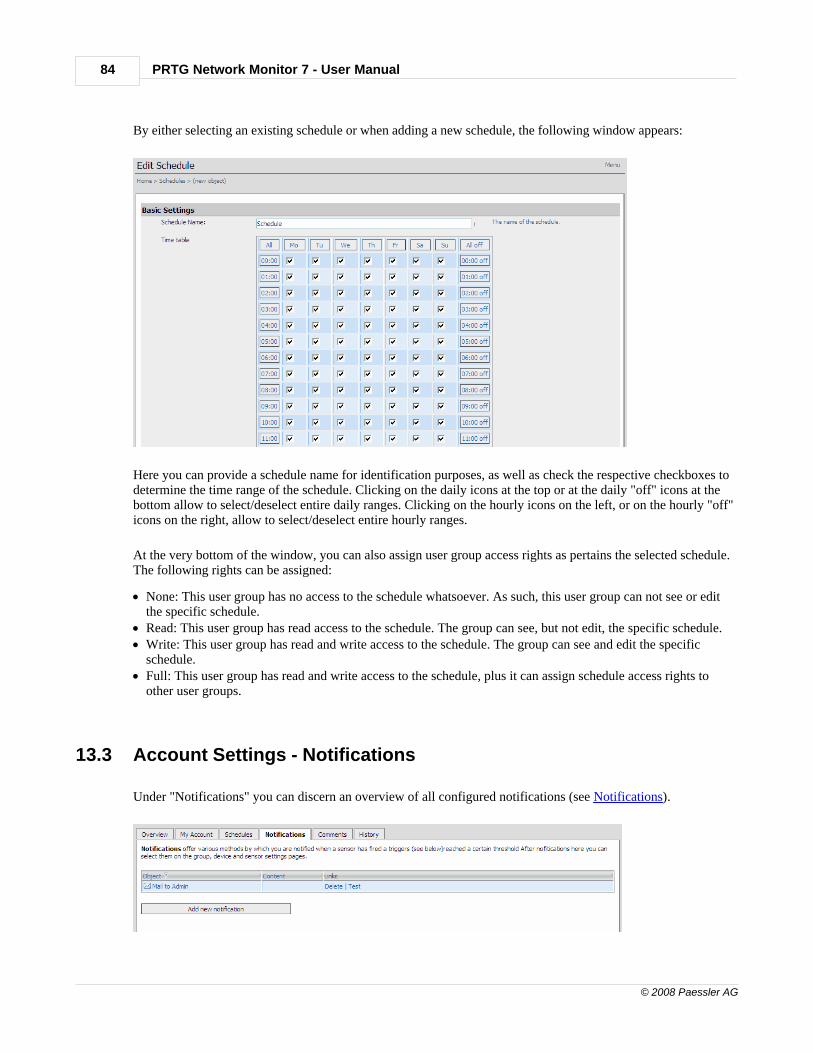
PRTG Network Monitor 7 - User Manual84
© 2008 Paessler AG
By either selecting an existing schedule or when adding a new schedule, the following window appears:
Here you can provide a schedule name for identification purposes, as well as check the respective checkboxes todetermine the time range of the schedule. Clicking on the daily icons at the top or at the daily "off" icons at thebottom allow to select/deselect entire daily ranges. Clicking on the hourly icons on the left, or on the hourly "off"icons on the right, allow to select/deselect entire hourly ranges.
At the very bottom of the window, you can also assign user group access rights as pertains the selected schedule.The following rights can be assigned:
· None: This user group has no access to the schedule whatsoever. As such, this user group can not see or editthe specific schedule.
· Read: This user group has read access to the schedule. The group can see, but not edit, the specific schedule.· Write: This user group has read and write access to the schedule. The group can see and edit the specific
schedule.· Full: This user group has read and write access to the schedule, plus it can assign schedule access rights to
other user groups.
13.3 Account Settings - Notifications
Under "Notifications" you can discern an overview of all configured notifications (see Notifications).
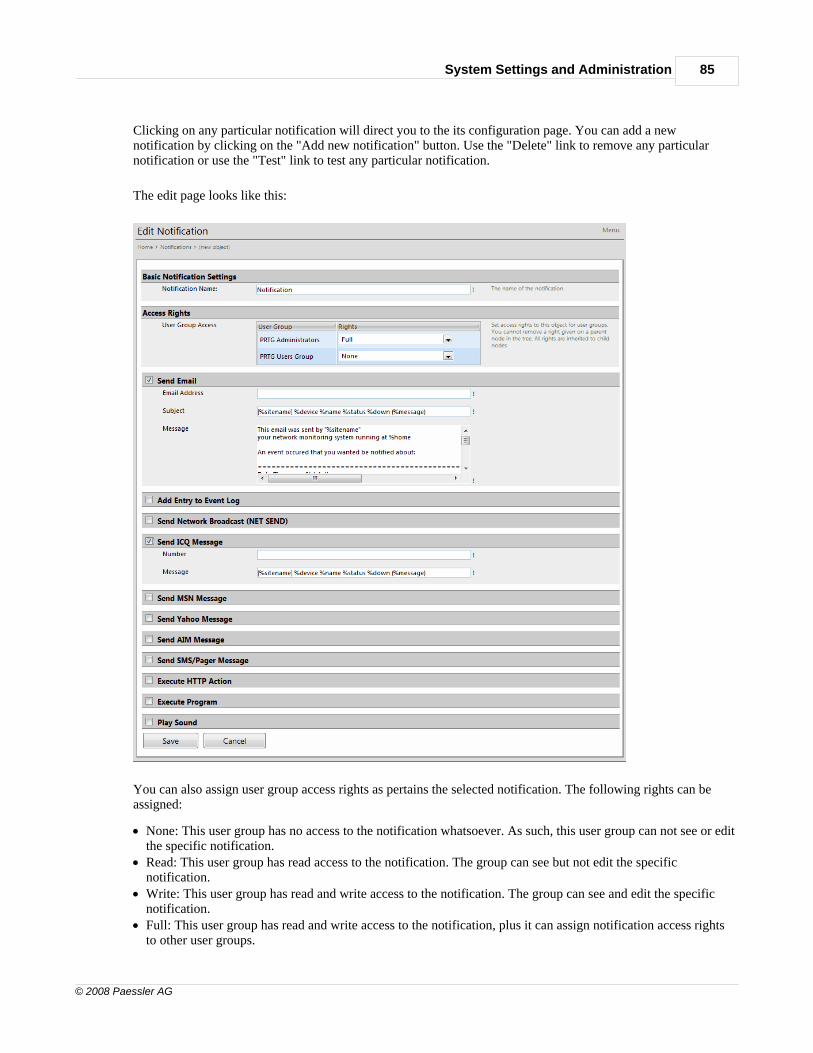
System Settings and Administration 85
© 2008 Paessler AG
Clicking on any particular notification will direct you to the its configuration page. You can add a newnotification by clicking on the "Add new notification" button. Use the "Delete" link to remove any particularnotification or use the "Test" link to test any particular notification.
The edit page looks like this:
You can also assign user group access rights as pertains the selected notification. The following rights can beassigned:
· None: This user group has no access to the notification whatsoever. As such, this user group can not see or editthe specific notification.
· Read: This user group has read access to the notification. The group can see but not edit the specificnotification.
· Write: This user group has read and write access to the notification. The group can see and edit the specificnotification.
· Full: This user group has read and write access to the notification, plus it can assign notification access rightsto other user groups.

PRTG Network Monitor 7 - User Manual86
© 2008 Paessler AG
First you can enter a name for the notification and you can set the user group rights (e.g. if you want to enable ordisable the use of a specific notification by some users).
Using the checkboxes you can activate various methods of notification. For each method you must enter thereceiver address. Optionally, you can also change the notification texts (the available placeholders are explainedon the right).
Note: For notifications with instant messengers, it is important to understand that in order to use instantmessaging for notifications you always need two accounts: One account that sends the messages and another onethat receives the messages.
Important: For most notification methods, you must enter the sender information in the System Setup -Notifications screen.
13.4 System Setup - Web Server
Under the "Web Server" tab it is possible to define specifics relevant to the web server:
This page allows to define the following information in detail.
· Site Information: Here you can define a site name (used in the web interface and in the subject of emails), aswell as the URL for the site (used for building links in emails). If you want to use a symbolic (DNS-) name toaccess PRTG's web server you must enter the name here.
· Sensor Intervals: Here you can define intervals which will in turn become selectable when adding objects tothe installation. In order to add a new interval value merely add a numerical value followed by a time spanenumerator (s/m/h/d for defining seconds/minutes/hours/days respectively).
· Email Options: Here you can edit the footer that will be added to outgoing emails (placeholders allowed) anddefine whether "Todo" emails are to be forwarded to the administrator, a specific email address or to no one atall. If "specific email" is selected, a new field appears allowing to define the email address in case.
· Data Purging Limits: Here you can select for how many days historic data remains accessible. Enter thenumber of days to retain historic data for each of the available entries.
· Unusual Detection: Here you can define the sensitivity of the "unusual" state detection mechanism.
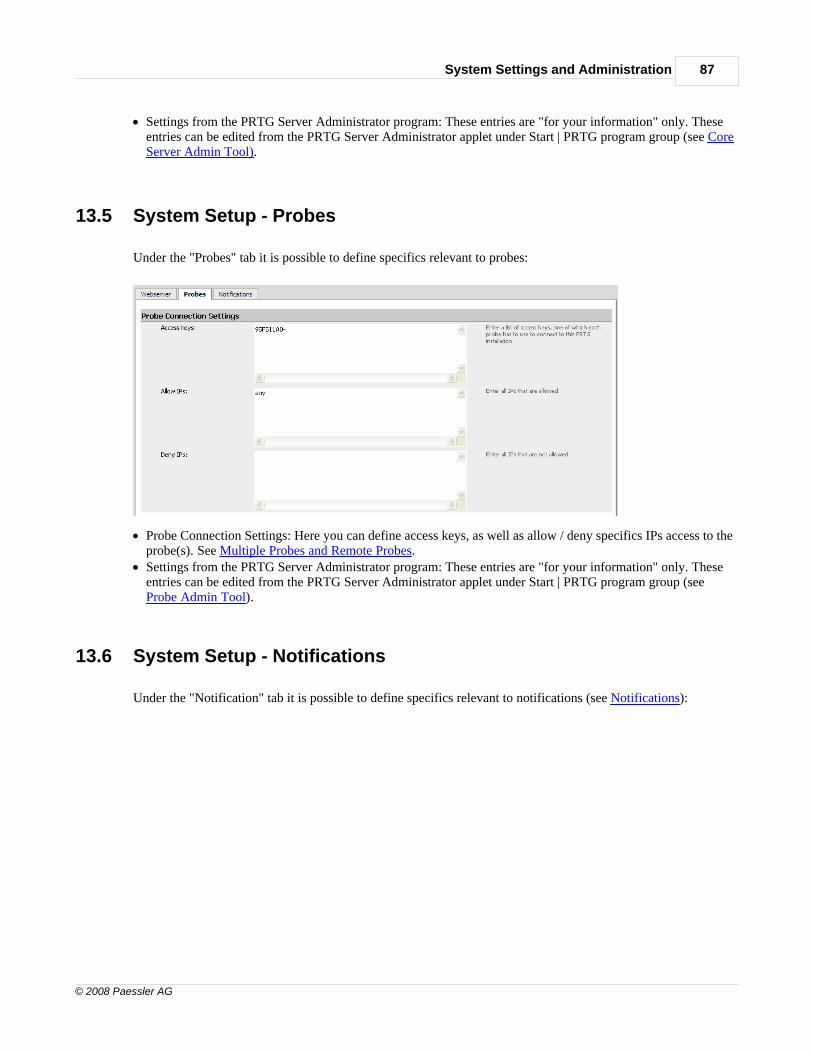
System Settings and Administration 87
© 2008 Paessler AG
· Settings from the PRTG Server Administrator program: These entries are "for your information" only. Theseentries can be edited from the PRTG Server Administrator applet under Start | PRTG program group (see CoreServer Admin Tool).
13.5 System Setup - Probes
Under the "Probes" tab it is possible to define specifics relevant to probes:
· Probe Connection Settings: Here you can define access keys, as well as allow / deny specifics IPs access to theprobe(s). See Multiple Probes and Remote Probes.
· Settings from the PRTG Server Administrator program: These entries are "for your information" only. Theseentries can be edited from the PRTG Server Administrator applet under Start | PRTG program group (see Probe Admin Tool).
13.6 System Setup - Notifications
Under the "Notification" tab it is possible to define specifics relevant to notifications (see Notifications):

PRTG Network Monitor 7 - User Manual88
© 2008 Paessler AG
Note: It is important to understand that in order to use instant messaging for notifications you always need twoaccounts: One account that sends the messages and another one that receives the messages.
This page allows to define the following information in detail.
· SMTP Delivery: Here you can define the SMTP delivery mechanism (either use PRTG's automatic relay ordefine your own SMTP server), as well as all relevant information for email forwarding. If you select to defineyour own SMTP server, you will need to provide your server's information, including the server itself (useeither IP address or DNS name), the SMTP port, as well as the relay authentication type (standard or SASL).If you require authentication, username and password need to be provided. Furthermore, it is possible to definewhen PRTG should start merging individual notifications, as well as provide a maximum number ofnotifications to be merged at any given time (this will reduce the number of mails that you will receive).
· SMS Delivery: From the drop-down, select your SMS gateway provider. Furthermore, provide your gateway'saccess username and password.
· ICQ Delivery: Provide your ICQ number and password for the account intended to relay (not receive!) ICQnotifications.
· Windows Live Messenger (MSN Messenger) Delivery: Provide your MSN ID and password for the accountintended to relay (not receive!) MSN notifications.
· Yahoo! Messenger Delivery: Provide your Yahoo! Messenger ID and password for the account intended torelay (not receive!) Yahoo! Messenger notifications.
· AOL Instant Messenger Settings: Provide your AIM ID and password for the account intended to relay (notreceive!) AIM notifications.
13.7 Core Server Admin Tool
The Core Server Admin Tool can be started from the "START | PRTG Network Monitor" program group andallows to configure implemented probes. The Core Server Admin Tool is divided into eight tabs:

System Settings and Administration 89
© 2008 Paessler AG
Web Server
Under the Web Server tab you can define the web server IP addresses. You can select to use local host only(which means that no external access will be possible. This is the most secure setting) or specify individual IPsfrom a list provided. You can further define the web server port to use. The options are:
· Standard Web Server Port 80: This is the standard port used and recommended for most installations.· HTTPS/SSL on port 443: Website can only be used via secure SSL ("https://(your IP)").· Specify Port: Enter a port number of your choice.
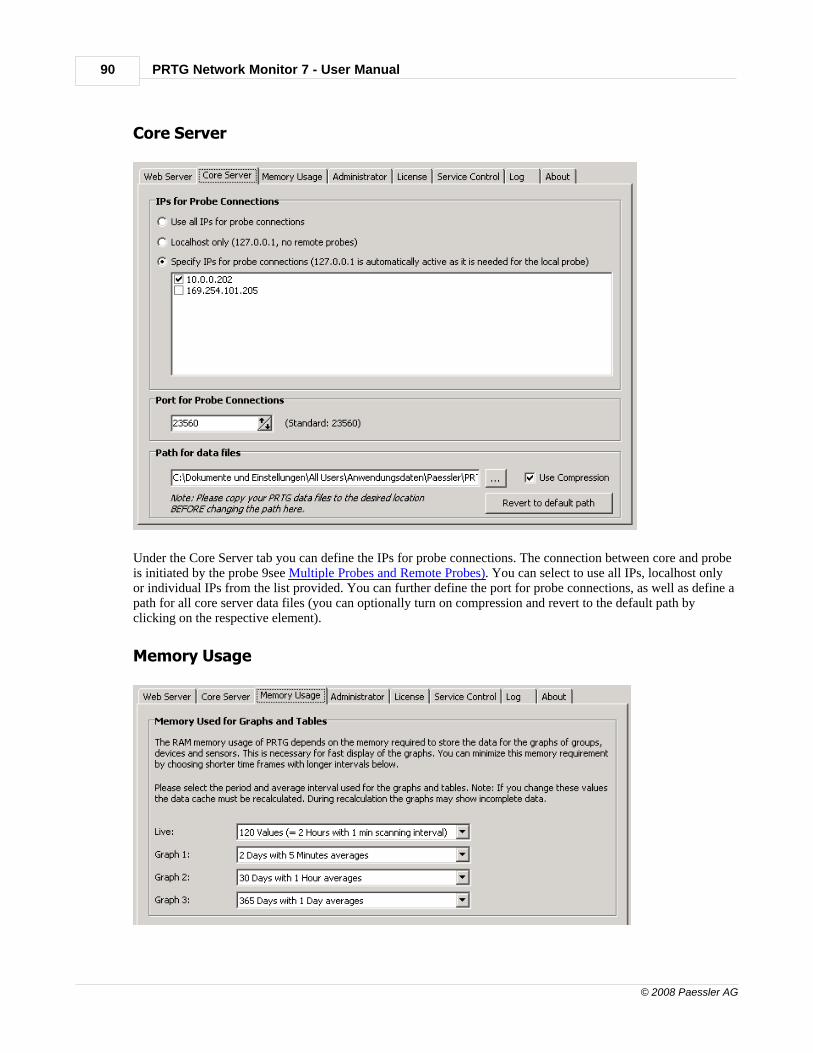
PRTG Network Monitor 7 - User Manual90
© 2008 Paessler AG
Core Server
Under the Core Server tab you can define the IPs for probe connections. The connection between core and probeis initiated by the probe 9see Multiple Probes and Remote Probes). You can select to use all IPs, localhost onlyor individual IPs from the list provided. You can further define the port for probe connections, as well as define apath for all core server data files (you can optionally turn on compression and revert to the default path byclicking on the respective element).
Memory Usage

System Settings and Administration 91
© 2008 Paessler AG
Under the Memory Usage tab you can define timeframes for live graphs, as well as the other three standardgraphs displayed under PRTG. You can reduce memory usage by decreasing the graph time frame and increasingthe intervals.
Administrator
Under the Administrator tab you can define the login name, the password and the email address of theadministrator user.
License
Under the License tab you can enter your program license information (name and key, which will return a licenseedition value), as well as Netflow/xFlow add-on licenses. Once the licensing information has been entered clickon the "Check Key(s)" button to check and activate the same. If you wish to revert to the freeware edition merelyclick on "Uninstall Key".

PRTG Network Monitor 7 - User Manual92
© 2008 Paessler AG
Service Control
Under the Service Control tab you can install/uninstall, as well as start/stop the core service.
Log
Under the Log tab you can view the current day's web server log, the core server system logs or directly open thecore's log file directory.
13.8 Probe Admin Tool
The Probe Admin Tool can be started from the "START | PRTG Network Monitor" program group and allows toconfigure implemented probes. The Probe Admin Tool is divided into four tabs:
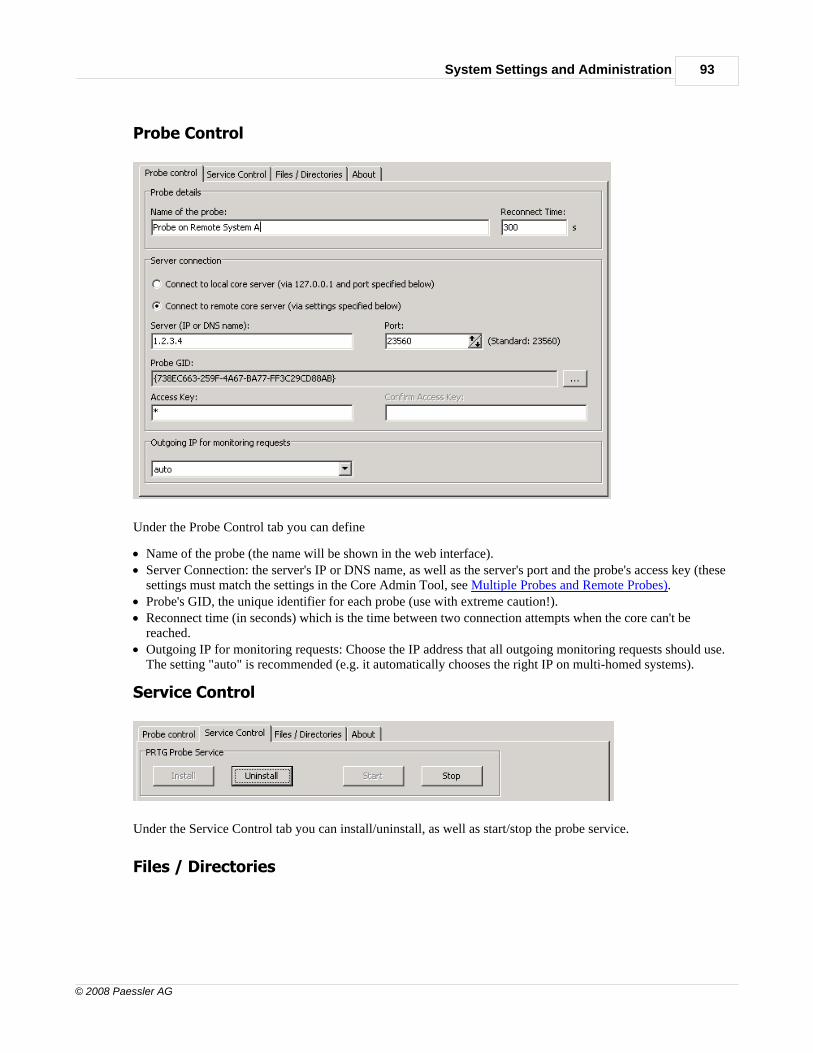
System Settings and Administration 93
© 2008 Paessler AG
Probe Control
Under the Probe Control tab you can define
· Name of the probe (the name will be shown in the web interface).· Server Connection: the server's IP or DNS name, as well as the server's port and the probe's access key (these
settings must match the settings in the Core Admin Tool, see Multiple Probes and Remote Probes).· Probe's GID, the unique identifier for each probe (use with extreme caution!).· Reconnect time (in seconds) which is the time between two connection attempts when the core can't be
reached.· Outgoing IP for monitoring requests: Choose the IP address that all outgoing monitoring requests should use.
The setting "auto" is recommended (e.g. it automatically chooses the right IP on multi-homed systems).
Service Control
Under the Service Control tab you can install/uninstall, as well as start/stop the probe service.
Files / Directories

PRTG Network Monitor 7 - User Manual94
© 2008 Paessler AG
Under the Files/Directories tab you can select a path specifying where probe data is to be stored. You can furtheropen the probe log files and the probe's log file directory.

Part
XIV
Technical Topics
PRTG Network Monitor 7 - User Manual96
© 2008 Paessler AG
14 Technical Topics
14.1 Multiple Probes and Remote Probes
PRTG has two modules that perform the monitoring: The core server, which handles data storage, web serverand a lot more, as well as one or more "probes" which perform the actual monitoring.
How Probes Work
As soon as a Probe starts work it automatically connects to its Core Server, downloads the sensor configurationand begins its monitoring tasks. The core server sends new configuration data to a probe as soon as themonitoring configuration is changed by the user. Probes monitor autonomously and send the monitoring resultsback to the core server for each check they have performed. If the connections between core and probe fails forany reason (e.g. a reboot of the core) the probe continues its monitoring and stores the results.
The connection between probe and core is initiated by the probe, secured using SSL (Secure Sockets Layer).This means that the data sent back and forth between core and probe is not visible to someone capturing datapackets. The core server provides an open TCP/IP port and waits for connection attempts from probes. If a newprobe connects for the first time the administrator will receive a Todo and will then see the new probe in thesensor tree. As a security precaution, the probe must be manually approved by the administrator (Click on"accept") before any sensors can be created and monitored. The admin can also deny a probe which will then bedisconnected. No further connection attempts will be accepted (the probe IP is added to the "Deny IPs" list inthe probe system settings). This ensures that unauthorized probes can not connect to a core server.
Since the probe initiates the connection, you must ensure that it can be created from the outside world onto yourcore server, e.g. you may need to open any necessary ports in your firewall and you may need to specify a NATrule for your network. The process is the same when you want to allow access to the web server of the coreserver via port 80.
Note: The local probe is automatically configured and approved and connects to the core via localhost(127.0.0.1) and SSL.
Situations That Require Monitoring Using Remote Probes
Upon installation, PRTG creates the first probe automatically called the "local probe". The local probe runs onthe same machine as the core server and monitors all sensors from this system. Working with only one localprobe should suffice for LAN monitoring and if you have just one location that you need monitoring for.
However, there are several situations that make it necessary to work with multiple probes or remote probes:
· If you have more than one location and you need to make sure that services are available from all locations.· If your network is separated in several LANs by firewalls and the local probe can not monitor specific services
across the firewalls.· If you need to monitor systems in VPNs across public or in-secure data lines.· If you want to sniff packets on another computer.· If you want to monitor NetFlow data on another computer.· If you experience performance issues with CPU intensive sensors like packet sniffing or NetFlow sensors and
need to distribute the load onto more than one PC.

Technical Topics 97
© 2008 Paessler AG
Step 1: Preparing a Core Server for Remote Probes
Before remote probes can connect to a core server you must edit the relevant settings in the core serveradministrator tool which you can find in PRTG's Start menu group:
Be default, a core server only accepts connections via localhost (127.0.0.1) which means that only the localprobe can connect. This is the most secure setting. In order to allow external probes to connect you must check"Use all IPs..." or "Specify IPs..." and select one of the IPs of the server. You can also specify the TCP/IP portnumber.
When you are done, click "OK" to save your settings. The core server process will be restarted so that thechanges take effect.
Step 2: Setting up Remote Probes
There are two options to install a remote probe:
1. Run the normal PRTG Network Monitor installer on the machine that you want to run the probe on and choose"Remote probe installation only". 2. Go to the web interface of the Core Server installation, go to "Setup|Download", download the Remote ProbeInstaller and run it. This option is usually faster to deploy because the file is only a few megabytes.
At the end of the installation, in both cases, the Probe Administrator will be started (or you can start it manuallyfrom the Start menu later) and you can enter the settings:

PRTG Network Monitor 7 - User Manual98
© 2008 Paessler AG
The important settings are (See Probe Admin Tool for more details):
· Name of the probe: A name of your choice that will be visible in the sensor tree in the web interface.· Server Connection: Please choose "Connect to remote core server".· Server (IP or DNS name). Please enter the server's IP address or DNS name (the one that you have specified in
the core server administrator tool above). Note: If the core server resides in a NAT-ed network behind afirewall you must edit your firewall NAT settings and supply the external mapped IP address.
· Port: Please enter the same port number that you have set up in your Core Server above.
You can edit the access keys on the server through the web interface: Choose "Setup|System Setup" from themain menu of the web interface and you will see this screen:
You can enter one or more access keys in the web interface (one for each probe is recommended) and the exact
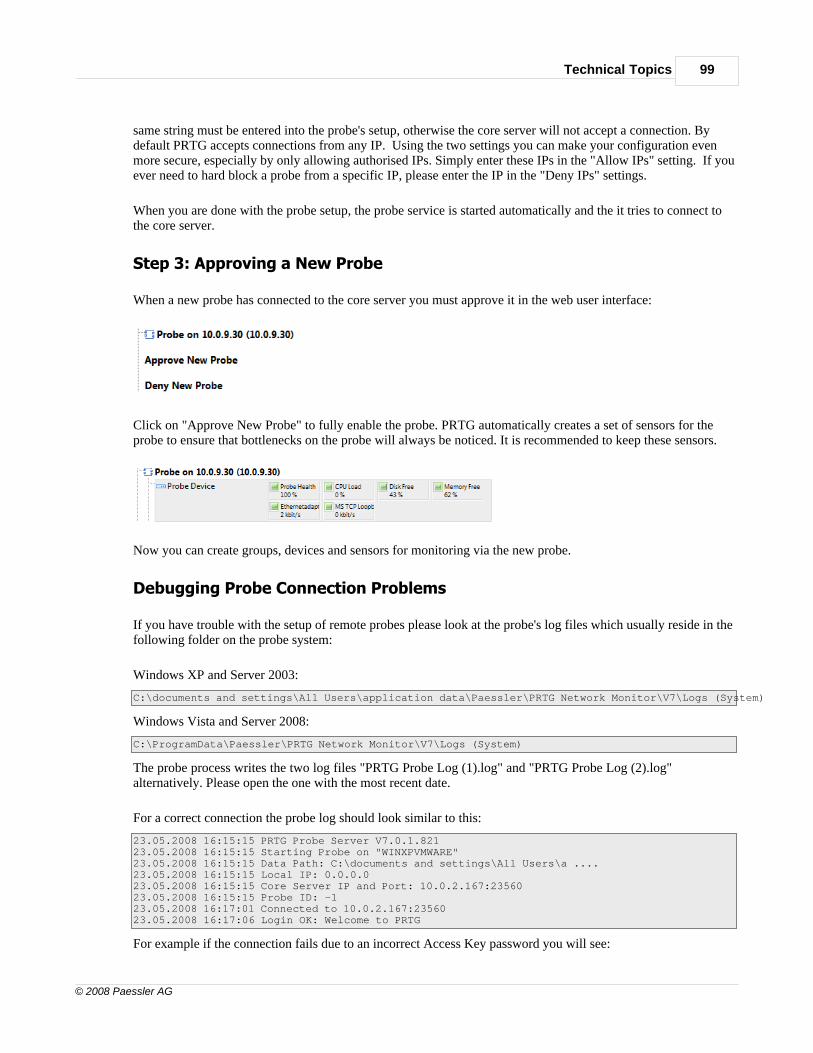
Technical Topics 99
© 2008 Paessler AG
same string must be entered into the probe's setup, otherwise the core server will not accept a connection. Bydefault PRTG accepts connections from any IP. Using the two settings you can make your configuration evenmore secure, especially by only allowing authorised IPs. Simply enter these IPs in the "Allow IPs" setting. If youever need to hard block a probe from a specific IP, please enter the IP in the "Deny IPs" settings.
When you are done with the probe setup, the probe service is started automatically and the it tries to connect tothe core server.
Step 3: Approving a New Probe
When a new probe has connected to the core server you must approve it in the web user interface:
Click on "Approve New Probe" to fully enable the probe. PRTG automatically creates a set of sensors for theprobe to ensure that bottlenecks on the probe will always be noticed. It is recommended to keep these sensors.
Now you can create groups, devices and sensors for monitoring via the new probe.
Debugging Probe Connection Problems
If you have trouble with the setup of remote probes please look at the probe's log files which usually reside in thefollowing folder on the probe system:
Windows XP and Server 2003:
C:\documents and settings\All Users\application data\Paessler\PRTG Network Monitor\V7\Logs (System)
Windows Vista and Server 2008:
C:\ProgramData\Paessler\PRTG Network Monitor\V7\Logs (System)
The probe process writes the two log files "PRTG Probe Log (1).log" and "PRTG Probe Log (2).log"alternatively. Please open the one with the most recent date.
For a correct connection the probe log should look similar to this:
23.05.2008 16:15:15 PRTG Probe Server V7.0.1.82123.05.2008 16:15:15 Starting Probe on "WINXPVMWARE"23.05.2008 16:15:15 Data Path: C:\documents and settings\All Users\a ....23.05.2008 16:15:15 Local IP: 0.0.0.023.05.2008 16:15:15 Core Server IP and Port: 10.0.2.167:2356023.05.2008 16:15:15 Probe ID: -123.05.2008 16:17:01 Connected to 10.0.2.167:2356023.05.2008 16:17:06 Login OK: Welcome to PRTG
For example if the connection fails due to an incorrect Access Key password you will see:

PRTG Network Monitor 7 - User Manual100
© 2008 Paessler AG
23.05.2008 16:31:02 Try to connect...23.05.2008 16:31:02 Connected to 10.0.2.167:2356023.05.2008 16:31:07 Login NOT OK: Access key not correct!
14.2 Importing Data from PRTG Traffic Grapher 6 or IPCheck ServerMonitor 5
You can import your sensor configuration and historic monitoring data from PRTG's predecessor products -PRTG Traffic Grapher V6 or IPCheck Server Monitor 5 - into your PRTG 7 installation using the Import tool.
Every time you run the import procedure, a new group will be created and all imported groups, devices andsensors will be placed in this new group (i.e. if you import from multiple IPCheck and/or PRTG installationseach imported configuration will show up in its own group). Depending on the volume amount of historicmonitoring data, the import can take between a few minutes and several hours (e.g. for hundreds of sensors withone year of monitoring data).
Please note that the import tool is an optional part of the installation. If you can not find the Import tool inPRTG's start menu group, please rerun the PRTG installer and enable the "Import Tool" option.
Limitations When Importing from PRTG 6
The import process will try to import all groups and sensors, as well as the historic sensor data, with thefollowing exceptions:
· Whenever possible the Import tool will create "devices" from the groups in the PRTG 6 setup.· Packet sniffing and NetFlow sensors are not imported and must be recreated (because of many technical
changes).· Aggregation sensors are not supported by PRTG 7 and thus are not imported.· User accounts, custom graphs, notifications, dependencies and schedules are not imported.
Limitations When Importing from IPCheck 5
The Import process will try to import all groups, devices and sensors, as well as the historic sensor data, with thefollowing exceptions:
· System sensors (service, file, disk space, event log) are imported and converted into WMI sensors.· SNMP traffic sensors are converted into simple SNMP sensors.· Script, TCP-script and custom sensors are not imported.· User accounts, notifications, dependencies and schedules are not imported.
Importing from PRTG 6
· First: Make a backup of your old PRTG system, preferably a full machine backup. · Now install the latest version of PRTG 6 from the Paessler Website at www.paessler.com on your old system
and run it at least once. This will make sure that the file formats are are updated to the format the Import toolexpects.
· Stop PRTG 6.· Start the Import tool from the PRTG 7 Start group. First it will ask you to stop your PRTG 7 services since the
import process can not be run while PRTG 7 is in operation.
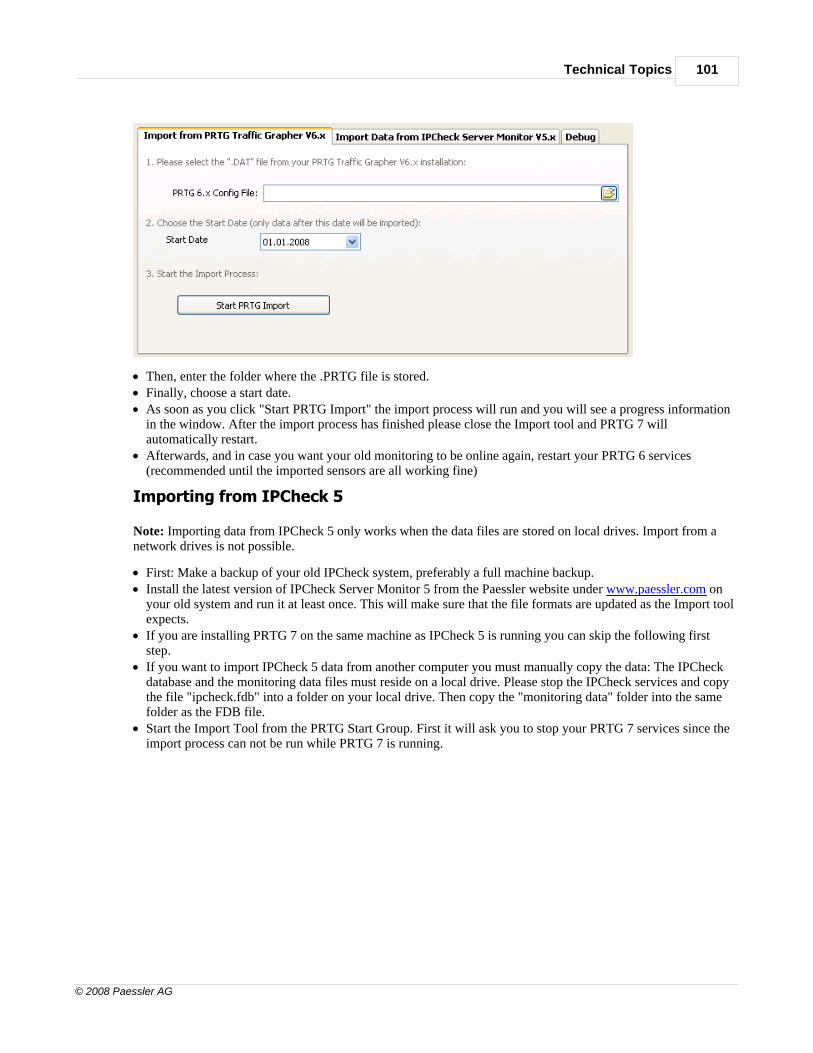
Technical Topics 101
© 2008 Paessler AG
· Then, enter the folder where the .PRTG file is stored.· Finally, choose a start date.· As soon as you click "Start PRTG Import" the import process will run and you will see a progress information
in the window. After the import process has finished please close the Import tool and PRTG 7 willautomatically restart.
· Afterwards, and in case you want your old monitoring to be online again, restart your PRTG 6 services(recommended until the imported sensors are all working fine)
Importing from IPCheck 5
Note: Importing data from IPCheck 5 only works when the data files are stored on local drives. Import from anetwork drives is not possible.
· First: Make a backup of your old IPCheck system, preferably a full machine backup. · Install the latest version of IPCheck Server Monitor 5 from the Paessler website under www.paessler.com on
your old system and run it at least once. This will make sure that the file formats are updated as the Import toolexpects.
· If you are installing PRTG 7 on the same machine as IPCheck 5 is running you can skip the following firststep.
· If you want to import IPCheck 5 data from another computer you must manually copy the data: The IPCheckdatabase and the monitoring data files must reside on a local drive. Please stop the IPCheck services and copythe file "ipcheck.fdb" into a folder on your local drive. Then copy the "monitoring data" folder into the samefolder as the FDB file.
· Start the Import Tool from the PRTG Start Group. First it will ask you to stop your PRTG 7 services since theimport process can not be run while PRTG 7 is running.

PRTG Network Monitor 7 - User Manual102
© 2008 Paessler AG
· Thereon, enter the credentials required to access the firebird database file of IPCheck. · Then enter the folder where you have copied the "ipcheck.fdb" file. · Finally choose a start date.· As soon as you click "Start IPCheck Import" the import process will run and you will see progress information
in the window. After the import process has finished please close the Import tool and PRTG 7 willautomatically restart.
· Afterwards, and in case you want your old monitoring to be online again, restart your IPCheck 5 services onthe old system (recommended until the imported sensors are all working fine).
14.3 API (Application Programming Interface)
PRTG Network Monitor includes an API that enables access to internal data for external programs. This meansthat you can create your own programs or scripts that have access to information from the monitoring databaseand are able to manipulate the object database of PRTG. The API is HTTP based and uses a set of URLs toaccess the data.
Please see the menu item "PRTG API" in the "Help" menu for details.
14.4 Data Storage
PRTG stores data in four different formats:
· Configuration data (groups, devices, sensors, maps, reports, notifications, etc.) is stored in an XML file which is automatically backed up into a daily ZIP file every few hours.
· Historic monitoring data is stored in a specialized file format that has been heavily optimized for this kind ofdata. This file format factors in aspects like speedy access (when creating reports) and minimizingfragmentation (which would usually occur for files that steadily grow by small chunks) and is far better for thistype of application than SQL servers.
· Todos and log entries are stored in SQLite databases.· Reports are stored in PDF format.
Automatic data purging mechanisms are included for all file types (user can set the number of days until files arepurged, see "Setup|System Settings" in the main menu).
Users can select the location of the data folder on the system’s disks. PRTG automatically enables NTFS filecompression for its data folders if available (this saves a lot of disk space, avoids fragmentation and actually

Technical Topics 103
© 2008 Paessler AG
speeds up read access to the files). This behavior can be disabled in the Core Administrator tool.
Note: Support for data storage in third party SQL servers will be available later.
14.5 Security Features
There are various security related features built into PRTG:
· Web server supports SSL encryption (HTTPS).· All communication between probe and core is secured by SSL encryption, especially important for remote
probes that are located outside the LAN.· Remote probes must present a correct probe access key in order to be allowed access to the core server;
furthermore IP addresses can be define to allow / prohibit access.· Web server checks the user account and the user’s rights before delivering any web page. · Web browser sessions are stored in a session cookie and time out after 20 minutes (if user or auto-refresh is
inactive).· Web server does not deliver files from folders that are not configured by PRTG (avoids directory traversal
attacks).· PRTG internal data management is not based on a SQL server, so SQL injection attacks are impossible.· User accounts require a password.· Passwords that are stored internally are always stored encrypted.· Script files for sensors and notifications can not be edited inside the web interface, user must have access to
the file system of the probe system to edit them (this avoids that somebody who is able to access the webinterface actually injects and runs malicious scripts on the PRTG system).
14.6 SNMP Helper
Paessler SNMP Helper enables PRTG to collect in-depth performance information from Windows servers andworkstations. Up to several thousand PC parameters and performance counters can be monitored with just a fewmouse clicks.
SNMP Helper License Options
There are three different available variations:
· Freeware Edition: Supports monitoring of memory, disks, network, and processors and comes free with thePRTG installer.
· Pro Edition: Adds more than 2000 performance counters for servers and workstations running Windows 2000,XP or 2003.
· Pro Extensions: Are available for in-depth monitoring of MS Exchange Server, MS ISA Server, MS SQLServer and MS Biztalk Server.
Fully Integrated Into PRTG
Simply install SNMP Helper on Windows 2000, XP or 2003 systems and you can monitor numerousperformance counters using PRTG - simply by adding new sensors: PRTG provides built-in support for theadditional counters. Within a few minutes you will be able to monitor values like "disk writes/s", "DHCP ServerRequests/s", "Exchange Server: Messages/s", "SQL Server: Requests/s"and many more.

PRTG Network Monitor 7 - User Manual104
© 2008 Paessler AG
We have compiled a list of recommended performance counters that you can monitor using SNMP Helper. Youcan find the same in our knowledge base under www.paessler.com/support .
SNMP Helper Freeware Edition
The Freeware Edition supports about 80 performance counters and is part of the PRTG download. You mustinstall SNMP Helper on the machine(s) you want to monitor. After installing PRTG you will find the SNMPHelper Freeware setup files in the "/website/public" sub-folder of your PRTG installation and you can downloadit from the web interface (select menu item "Setup/Downloads"). Run this setup on all the systems you want tomonitor. Afterwards you can monitor the additional system parameters by simply adding new sensors.
SNMP Helper Pro Edition and its Extensions
The Pro Edition of SNMP Helper offers the ability to monitor more than 2000 counters for Windows 2000, XP,and 2003. With the optional SNMP Helper Extensions you can additionally monitor the following MicrosoftServer applications:
· MS Exchange Server: more than 1726 performance counters · MS SQL Server: more than 511 performance counters · MS Biztalk Server: 32 performance counters · MS ISA Server: 149 performance counters
Detailed lists of supported counters are available under www.paessler.com/snmphelper.
To use SNMP Helper Pro, you must either purchase a license or you must request a Free 30 Day Trial License.Either way you will receive a license key and the installation files via email. Please install the software on theserver that you want to monitor and enter the license key that comes with it. Afterwards you can monitor theadditional system parameters by simply adding new sensors to PRTG.
Installing Paessler SNMP Helper
Paessler SNMP Helper is a small library that makes it much easier to access system parameters of Windowsmachines using SNMP. If the SNMP Helper is installed PRTG Traffic Grapher will be able to read varioussystem parameters from this machine. SNMP Helper can be used on Windows XP, 2000 and 2003. You onlyneed to install SNMP Helper on a computer if you want to monitor it! You must install SNMP Helper on eachWindows computer you want to monitor using the additional sensors.
First, make sure to install the Windows SNMP component using the Add/Remove Software control from yourWindows Control Panel (see “Howto: Installing SNMP Service on Windows NT/2000/XP”).
In order to install Paessler SNMP Helper, launch the" Paessler SNMP Helper Freeware Setup.exe" file located inthe "/installers" subfolder of your PRTG installation directory after you have installed PRTG Traffic. This willlaunch the Paessler SNMP Helper Setup Wizard.
Once you have read the information provided in the welcome screen click Next to continue installation. From theSelect Destination Location window use the Browse button to select a directory in which to install the PaesslerSNMP Helper. You can also enter the destination location directly in the provided box. Once you have chosenyour destination location, click on Next to continue.
Once Paessler SNMP Helper is installed, the program will prompt you that it needs to restart the machine inorder to complete the installation process. If you are ready to restart your machine, select this option from the

Technical Topics 105
© 2008 Paessler AG
provided menu. Otherwise, select to restart your computer later.
Note: Keep in mind – in order for the Paessler SNMP Helper to work properly, your system has to be restarted.If you opt to restart the machine later you will need to do so before the Paessler SNMP Helper can be fully putinto operation.
14.7 Interface Definition for Custom EXE Sensors
Every time the sensor is run, the selected EXE or DLL file is executed.
EXE Sensors
The string entered in the parameter field of the sensor's settings is placed in the command line. The EXE filemust send the results to the Standard OUT. The data must be in the following format:
value:message
Value has to be a 32bit integer and will be used as the resulting value for this sensor (e.g. bytes, milliseconds,etc.), message can be any string and will be stored in the database.
The EXE's exit code has to be one of the following values:
· 0: ok· 1: warning· 2: system error (e.g. a network/socket error)· 3: protocol error (e.g. web server returns a 404)· 4: content error (e.g. a web page does not contain a required word)
If the EXE does not return control to the PRTG process it is killed as soon as the timeout value set for this sensoris reached.
You can test the EXE file you want to use for the sensor very easily on the command line (cmd.exe). Simply startthe EXE file and pipe the results into a file, e.g.:
sensorexe parameter > result.txt
The results are then written into the file result.txt and you can check the results with notepad or any other texteditor.
DLL sensors
Every time the sensor is to be checked the selected DLL file is called. The DLL must export one function:
function perform(para,msg:pchar):integer; stdcall;
para and msg are zero terminated strings. The allocated buffer for msg is 255 bytes, the DLL must make sure thatfewer bytes are returned. Msg must be in the following format:
value:message
Value has to be an 32 bit integer and will be used as the resulting value for this sensor (e.g. bytes, milliseconds,etc.), message can be any string and will be stored in the database.
The integer return value of the perform function has to be one of the following values:

PRTG Network Monitor 7 - User Manual106
© 2008 Paessler AG
· 0: ok· 1: warning· 2: system error (e.g. a network/socket error)· 3: protocol error (e.g. web server returns a 404)· 4: content error (e.g. a web page does not contain a required word)
Warning: If the function call in the DLL does not return control it could block the whole PRTG system. Makesure to handle your own timeouts and build in a reliable error management. For this reason EXE sensors arerecommended.
Links
Sample projects for Custom Sensors can be found in the Knowledge Base on the Paessler Website under www.paessler.com/support.
14.8 Acknowledgements
Build using Indy Internet Direct (http://www.indyproject.org/). This product includes cryptographic softwarewritten by Eric Young ([email protected]). Uses the net-SNMP library, see "netsnmp-license.txt". Uses theDelphiZip library distributed under the GNU LESSER GENERAL PUBLIC LICENSE(http://www.delphizip.net/). Uses the Info.Zip library, license info in the provided "info-zip-license.txt". UsesFastMM (http://sourceforge.net/projects/fastmm/) and TPLockBox (http://sourceforge.net/projects/tplockbox)under the Mozilla Public License 1.1 (MPL 1.1, available from http://www.mozilla.org/MPL/MPL-1.1.html).

Index 107
© 2008 Paessler AG
Index- A -access key 87, 88, 92
Access Rights 79
Account 82
Account Settings 82, 83, 84
Account Setup 82
administrator 88
AIM 60, 84, 87
allow IP 87
API 102
apple 35
Architecture 19
Auto Discovery 42
Auto Folding 82
Auto Refresh 82
Automatic Sensor Creation 42
- B -Bandwidth Monitoring 57
BAT 56, 105
Browser Type 6
- C -Change Password 82
Channels 20, 21
CMD 56, 105
COM 48
Content Based Packet Sniffing 51
Context Menu 28, 31
Core 88
Core Server 19
Core Server Admin Tool 88
Custom Layouts 65
Custom Sensor 105
- D -data folders 88, 92
Data Purging 86
DCOM 48
Default Values 24
Deinstall PRTG 13
deny IP 87
Dependencies 22
device 20, 21, 39, 42
DNS 56
Download 8
- E -EMail 60, 84, 86, 87
esx 56
EXE 56, 60, 84, 87, 105
Execute 84, 87
- F -Favorite Sensors 24
Features 15
file 55
File Format 102
FireFox 6
Flash graphs 82
folder 55
folders 88, 92
Freeware 16
FTP 56
- G -GET 49
Global Status Bar 29
graph intervals 88
Group 20, 21, 39, 42
- H -Hardware Requirements 6
Header Based Packet Sniffing 51
host 56
HTTP 49, 84, 87
HTTP request 60
HTTPS 49
PRTG Network Monitor 7 - User Manual108
© 2008 Paessler AG
- I -ICQ 60, 84, 87
images 82
IMAP 56
Import 100
Inheritance 21, 38
Installation 8
Instant Messenger 60
Internet Explorer 6
Interval 86
Introduction 16
IP 87, 88, 92
IPCheck Server Monitor V5 8, 100
iphone 27, 35
- L -Licenses 16
Lists 32
live graphs 88
local IP 92
local probe 19, 96
log 88, 92
Login Name 82
- M -Main Menu 28, 29
Manual Sensor Creation 39
Maps 23, 65
Memory Usage 88
MIB 46
MIB Import 46
mobile 35
MS SQL 54
MSN 60, 84, 87
My Account 82
MySQL 54
- N -NET SEND 84, 87
NetFlow 53, 57
network broadcast 60, 84, 87
Notification 22, 60, 84, 87
- O -Operating System Requirements 6
Oracle SQL 54
- P -Packet Sniffer 51
Packet Sniffing 51, 57
Page Header 29
pager message 60
password 82, 88
PDF 72
PING 56
placeholders 86
POP3 56
port 56, 87, 88, 92
POST 49
Powershell 56
Priority 24
probe 19, 20, 87, 88, 92, 96
probe access key 87, 88, 92
probe connection 87, 88, 92
Probe Server Admin Tool 92
Probes 21
Proxy 49
PRTG Traffic Grapher V6 8, 100
PS1 56, 105
Public URL 65
- Q -Quick Search 28, 29
- R -RDP 56
Remote Desktop Protocol 56
remote probe 19, 96
Remove PRTG 13
Reports 23, 72
Requirements 6
Root Group 38

Index 109
© 2008 Paessler AG
- S -samba 55
Scheduled Reports 72
schedules 22, 83
Search Box 28, 29
Security 79, 103
Sensor 42, 46, 48, 49, 51, 53, 54, 56, 57
Sensor Intervals 86
Sensor Setup 38
Sensors 20, 21, 39
server 56
service control 88, 92
Setup 8, 82
share 55
Sharing Monitoring Data 65
site name 86
smb 55
SMS 60, 84, 87
SMTP 56, 84, 87
SMTP Relay 84, 87
Sniffing 51
SNMP 46, 57, 103
SNMP Helper 46, 103
SNMP Library 46
Software Requirements 6
Sound 60, 84, 87
SQL 102
static images 82
Status Bar 29
Storage 102
System log 60
System Requirements 6
System Setup 82, 86, 87
system tray 34
- T -Tabs 28, 29
Timezone 82
Todo delivery 86
Todos 23, 77
Traffic Sensor 46, 51
Transaction 49
tray 27, 34
Trial 16
Triggers 60
- U -Uninstallation 13
Unusual Detection 86
Upgrading 8, 100
URL 86
User 79
User Accounts 79
user interface 27, 34, 35
- V -virtual 56
virtual machine 56
vmware 56
vpn 96
- W -Web Interface 28, 29, 31, 32
web server 86, 88
Website Header Area 29
Windows 34
Windows Management Instrumentation 48
WMI 48, 56, 57
WQL 56
- X -XML 102
- Y -Yahoo 60, 84, 87