provost’s annual report on cases of academic discipline
TRANSCRIPT

Provost’s Annual Report on Cases of Academic Discipline 2019‐20
Academic integrity lies at the heart of the University’s academic mission. U of T’s academic integrity strategy is led institutionally by the tri‐campus Provostial Advisory Group on Academic Integrity. Responsibility for academic integrity, however, is shared with the divisions. Dean’s Offices, dedicated offices within the larger divisions, as well as faculty, instructors, librarians, writing centre instructors, and academic advisors all work together to support students to meet our expectations around academic integrity. The Centre for Teaching Support and Innovation also plays a significant role in supporting instructors to design assignments and syllabus structures that facilitate students’ ability to showcase their knowledge and skills while meeting our expectations with respect to academic integrity.
Professional development workshops for faculty and staff engaged in academic integrity processes are also held biannually, with approximately 50 individuals typically attending. The workshops include advice on meeting a division’s obligations under the Code of Behaviour on Academic Matters (the ‘Code’), as well as best practices for meeting with students whose actions are being considered as an offence under the Code.
The Code establishes two sets of procedures for addressing offences: one process for cases that are able to be managed entirely within the divisions, and one for those that proceed to the University Tribunal. Cases proceed to the Tribunal based on the seriousness of the type of offence, the relative weight of an assessment in which an offence has been alleged to be committed with respect to the course grade, or the fact that a student has not admitted to the behavior being charged. The Provost’s Annual Report on Cases of Academic Discipline contains two Appendices that reflect these two processes, with Appendix A outlining statistics and trends pertaining to cases which are overseen completely by the divisions, and Appendix B providing statistics and timeliness of cases brought before the University Tribunal. The reporting of these statistics enables the Provost’s Office and Dean’s Offices to assess statistical trends pertaining to academic misconduct across the University.
The current pandemic has presented universities across North America with new challenges to academic integrity and assessments. In mid‐March, both classes and assessments moved almost entirely online at the University, and continued in this format through the last day of the 2019‐20 academic year (June 30, 2020). Regrettably, there were some students who took advantage of the move to online assessments to commit offences under the Code, primarily through the use of unauthorized aids while writing assessments that were intended to be completed individually and without any form of outside assistance.
It is important to note that the vast majority of U of T students continue to uphold our academic integrity standards. However, as a result of this change in the landscape, the total number of student offenders by division increased in 2019‐20 to a total of 2.3% of the total student population. This increase in the number of offenders was not seen uniformly across the divisions, with many
1
Provost’s Annual Report on Cases of Academic Discipline, 2019-20
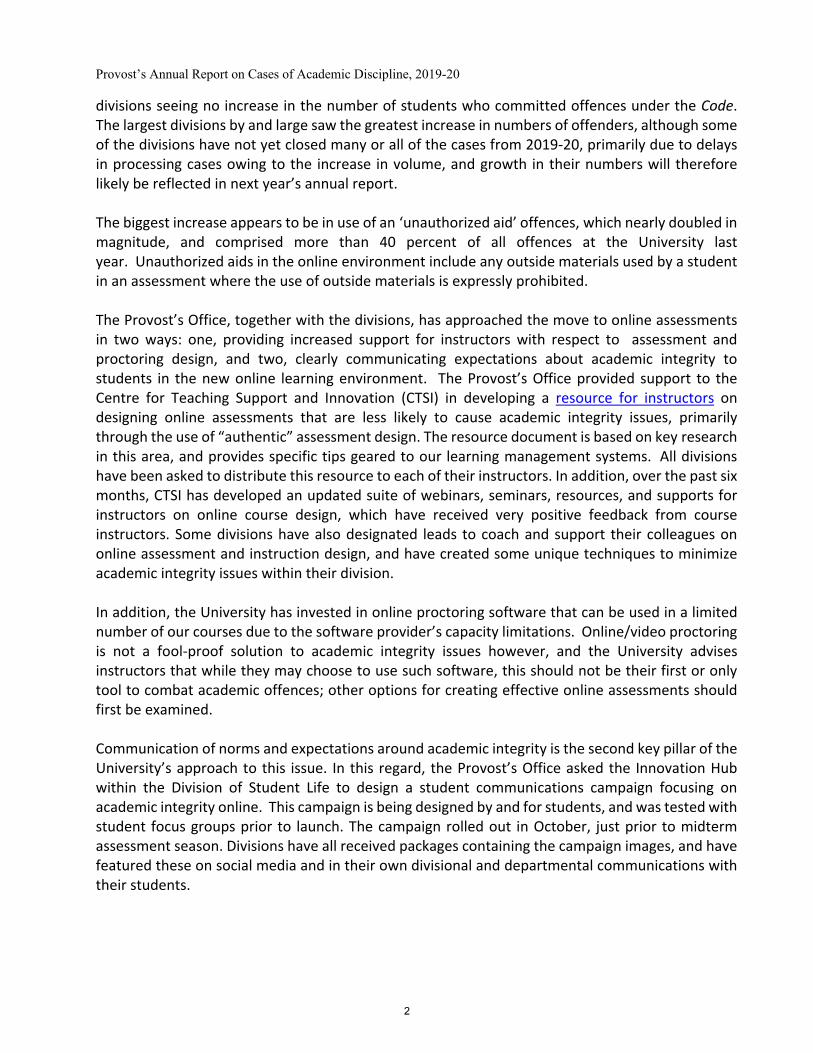
divisions seeing no increase in the number of students who committed offences under the Code. The largest divisions by and large saw the greatest increase in numbers of offenders, although some of the divisions have not yet closed many or all of the cases from 2019‐20, primarily due to delays in processing cases owing to the increase in volume, and growth in their numbers will therefore likely be reflected in next year’s annual report.
The biggest increase appears to be in use of an ‘unauthorized aid’ offences, which nearly doubled in magnitude, and comprised more than 40 percent of all offences at the University last year. Unauthorized aids in the online environment include any outside materials used by a student in an assessment where the use of outside materials is expressly prohibited.
The Provost’s Office, together with the divisions, has approached the move to online assessments in two ways: one, providing increased support for instructors with respect to assessment and proctoring design, and two, clearly communicating expectations about academic integrity to students in the new online learning environment. The Provost’s Office provided support to the Centre for Teaching Support and Innovation (CTSI) in developing a resource for instructors on designing online assessments that are less likely to cause academic integrity issues, primarily through the use of “authentic” assessment design. The resource document is based on key research in this area, and provides specific tips geared to our learning management systems. All divisions have been asked to distribute this resource to each of their instructors. In addition, over the past six months, CTSI has developed an updated suite of webinars, seminars, resources, and supports for instructors on online course design, which have received very positive feedback from course instructors. Some divisions have also designated leads to coach and support their colleagues on online assessment and instruction design, and have created some unique techniques to minimize academic integrity issues within their division.
In addition, the University has invested in online proctoring software that can be used in a limited number of our courses due to the software provider’s capacity limitations. Online/video proctoring is not a fool‐proof solution to academic integrity issues however, and the University advises instructors that while they may choose to use such software, this should not be their first or only tool to combat academic offences; other options for creating effective online assessments should first be examined.
Communication of norms and expectations around academic integrity is the second key pillar of the University’s approach to this issue. In this regard, the Provost’s Office asked the Innovation Hub within the Division of Student Life to design a student communications campaign focusing on academic integrity online. This campaign is being designed by and for students, and was tested with student focus groups prior to launch. The campaign rolled out in October, just prior to midterm assessment season. Divisions have all received packages containing the campaign images, and have featured these on social media and in their own divisional and departmental communications with their students.
2

Provost’s Annual Report on Cases of Academic Discipline, 2019-20
The Provostial Advisory Group on Academic Integrity, consisting of Vice Deans from each of the divisions, recently met to discuss this report, providing a forum for sharing of best practices and support to divisions on this issue as the new academic year progresses.
University Tribunal hearings have also been impacted by the pandemic. Hearings were paused for approximately six weeks to allow for guidance from public health officials, and to consult with Discipline Counsel, Downtown Legal Services, and the Tribunal chairs regarding the possible move to electronic hearings. Towards the end of April, the Tribunal moved to electronic hearings, and is now conducting such hearings for all types of cases, including those that are contested. This move has been seamless, and the Tribunal was one of the first tribunals in Ontario to move to electronic hearings for all types of cases.
The Provost’s Office, together with colleagues across the divisions, will continue to actively monitor academic integrity issues across the University as they do every year, but with particular attention this year to the online learning context. Academic Integrity remains integral to all students’ education and learning at the University of Toronto.
3

Provost’s Annual Report on Cases of Academic Discipline
Appendix A: Summary of Divisional Academic Discipline Cases 2019-2020
Table 1: Total Number of Student Offenders by Division (only where a sanction is imposed and the case is closed by the division) Division 2015-16 2016-17 2017-18 2018-19 2019-20
Total # of Student
Offenders by
Division
% of Offenders based on Student
Population
Total # of Student
Offenders by
Division
% of Offenders based on Student
Population
Total # of Student
Offenders by
Division
% of Offenders based on Student
Population
Total # of Student
Offenders by
Division
% of Offenders based on Student
Population
Total # of Student
Offenders by
Division
% of Offenders based on Student
Population
Applied Science & Engineering
99 1.7% 75 1.3% 57 1.1% 70 1.3% 226 4.2%
Architecture 7 0.8% 13 1.4% 29 2.8% 10 0.9% 11 1.1%
Arts & Science
590 2.1% 718 2.6% 535 1.9% 657 2.4% 751 2.7%
Dentistry 11 2.6% 7 1.6% 2 0.5% 3 0.7% 5 1.1%
Graduate Studies
44 0.3% 41 0.2% 51 0.3% 34 0.2% 39 0.2%
Law 2 0.3% 0 0% 2 0.3% 0 0% 0 0%
Medicine 2 0.04% 4 0.1% 0 0% 0 0% 1 0%
Music 4 0.7% 0 0% 8 1.5% 19 3.5% 24 4.3%
Nursing 4 1.1% 1 0.3% 3 0.9% 3 0.9% 1 0.3%
OISE1 1 0.3% 0 0% 0 0% N/A N/A N/A N/A Pharmacy 12 1.1% 21 1.9% 7 0.6% 4 0.4% 7 0.6%
Faculty of Kinesiology and Physical Education
4 0.4% 21 2.0% 7 0.7% 16 1.5% 7 0.7%
U of T Mississauga
432 3.2% 503 3.6% 511 3.6% 582 4.0% 460 3.0%
U of T Scarborough
218 1.7% 414 3.2% 493 3.6% 192 1.4% 608 4.4%
Total 1430 1.6% 1818 2.1% 1705 1.9% 1590 1.8% 2140 2.3%
1 From 2018-19 onwards, OISE became a solely graduate division, and its statistics were reported under the Graduate Studies entry. 4

Table 2: Total Number of Repeat Student Offenders by Division (only where sanction is imposed)
Division 2015-16 2016-17 2017-18 2018-19 2019-20
Applied Science & Engineering 12 10 14 4 23 Architecture 0 0 2 3 4 Arts & Science 61 58 49 57 75 Dentistry 0 0 0 1 0 Graduate Studies 1 0 1 5 2 Law 0 0 0 0 0 Medicine 0 0 0 0 0 Music 0 0 0 0 1 Nursing 0 0 0 0 0 OISE 0 0 0 N/A N/A Pharmacy 0 0 0 0 0 Faculty of Kinesiology and Physical Education
0 0 0 1 0
U of T Mississauga 62 54 79 94 60 U of T Scarborough 17 11 79 29 35
Total 153 133 224 194 200
0
500
1000
1500
2000
2500
2015‐16 2016‐17 2017‐18 2018‐19 2019‐20
Total # of Offenders
Total # of Repeat Offenders
Total Number of Offenders and Repeat Offenders Per Year ‐ All Divisions
5

Table 3: Total Number of Offences by Type – All Divisions
Charge Code Charge Text 2015-16 2016-17 2017-18 2018-19 2019-20
B.i.1(a) Forgery (documents, not transcripts)
53 46 28 64 40
B.i.1(b) Unauthorized aid 585 649 600 578 953 B.i.1(c) Personation 15 13 3 5 0 B.i.1(d) Plagiarism 840 1002 1082 935 1124 B.i.1(e) Re-submission of work 33 31 14 21 25 B.i.1(f) Concoction 20 5 14 13 15 B.i.3(a) Forgery (academic records) 2 6 0 0 1 B.i.3(b) Cheating for academic
advantage 55 66 46 43 45
Total 1603 1818 1787 1659 2203
0
200
400
600
800
1000
1200
2015‐16 2016‐17 2017‐18 2018‐19 2019‐20
Forgery (documents)
Unauthorized Aid
Personation
Plagiarism
Re‐submission of Work
Concoction
Forgery (academic records)
Cheating for Academic Advantage
Total Number of Offences by Type Per Year ‐ All Divisions
6

0
200
400
600
800
1000
1200
2015‐16 2016‐17 2017‐18 2018‐19 2019‐20
Plagiarism
Unauthorized Aid
Total Top Two Offences Per Year ‐ All Divisions
Plagiarism ‐ 51%
Unauthorized Aid ‐ 43%
Cheating for Academic Advantage ‐2%
Forgery (Academic Records) ‐ 0%
Re‐submission of Work ‐ 1%
Concoction ‐ 1 %
Personation ‐ 0%
Forgery (Documents) ‐ 2%
Total Number of Offences by Type for 2019‐20 ‐ All Divisions *
7

Table 4A: Timeliness between Date of Offence and Case Resolved
Table 4B: Timeliness between Date Academic Integrity Office Became Aware and Case Resolved
Table 4C: Timeliness for 2019-2020- By Division 2019-20
Division Time between Date of Offence and Case Resolved
6 months 6-9 months 9-12 months 12-15 months Total
Applied Science & Engineering 100% 0% 0% 0% 100% Architecture 0% 25% 8% 0% 33.3% Arts & Science 85.9% 11.3% 2.6% 0.3% 100.1% Dentistry 100% 0% 0% 0% 100% Graduate Studies 97.5% 0% 0% 0% 97.5% Law N/A N/A N/A N/A N/A Medicine 100% 0% 0% 0% 100% Music 100% 0% 0% 0% 100% Nursing 100% 0% 0% 0% 100% Pharmacy 100% 0% 0% 0% 100% Kinesiology & Physical Education 0% 71% 0% 0% 71% U of T Mississauga 70.7% 9.9% 7.9% 4.9% 93.4% U of T Scarborough 94.6% 3.9% 0.9% 0.6% 100%
Total 86.5% 7.5% 2.9% 1.3% 98.2%
Year July 1-June 30
Time between Date of Offence and Case Resolved
Within 6 months
6-9 months 9-12 months12-15
monthsTotal
2015-16 86.1% 7.8% 3.3% 2.8% 100 %
2016-17 89.2% 6.3% 1.9% 2.5% 99.9%
2017-18 77.5% 8% 5.3% 9% 99.8%
2018-19 79.5% 8.7% 5.5% 6.3% 99.9%
2019-20 86.5% 7.5% 2.9% 1.3% 98.2%
Year July 1-June 30
Time between Date Academic Integrity Office Became Aware and Case Resolved
Within 6 months
6-9 months 9-12 months12-15
monthsTotal
2015-16 93% 4.3% 1.5% 1.2% 100 %
2016-17 94.7% 2.9% 1.2% 1.2% 100 %
2017-18 81% 6.3% 2.2% 10.2% 99.7%
2018-19 86.6% 5.2% 4.2% 3.9% 99.9%
2019-20 92.1% 4.7% 1.4% 0.4% 98.6%
8
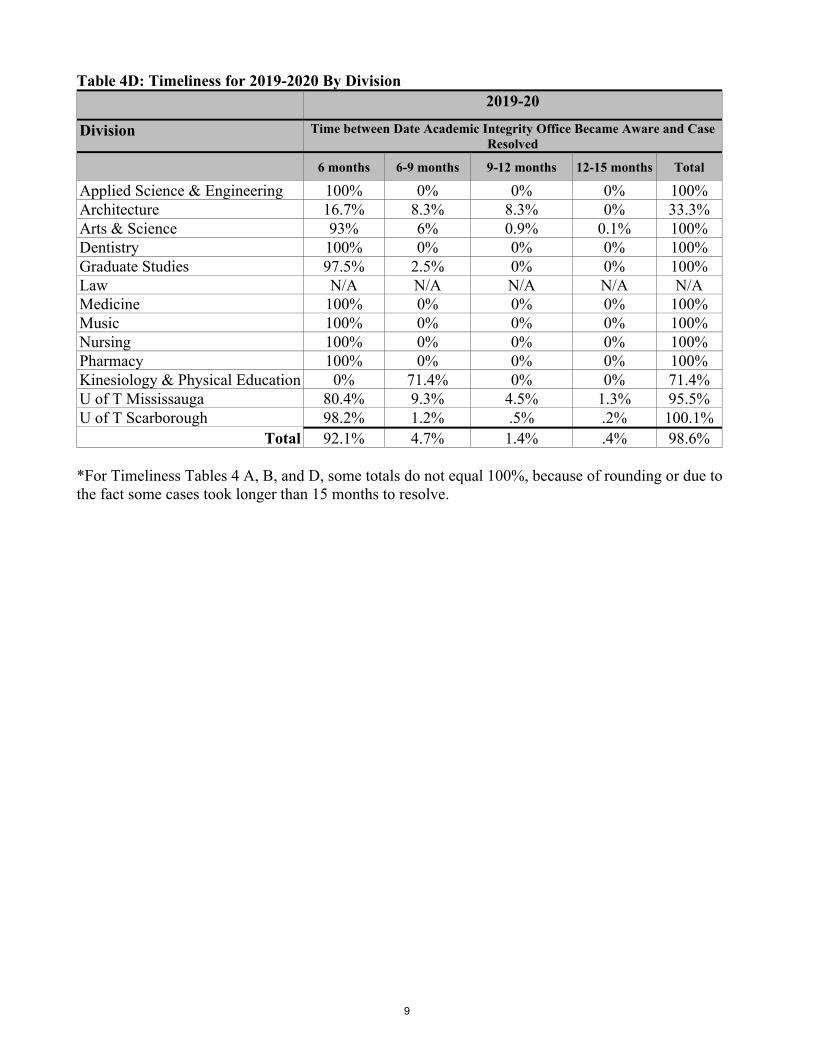
Table 4D: Timeliness for 2019-2020 By Division 2019-20
Division Time between Date Academic Integrity Office Became Aware and Case Resolved
6 months 6-9 months 9-12 months 12-15 months Total
Applied Science & Engineering 100% 0% 0% 0% 100% Architecture 16.7% 8.3% 8.3% 0% 33.3% Arts & Science 93% 6% 0.9% 0.1% 100% Dentistry 100% 0% 0% 0% 100% Graduate Studies 97.5% 2.5% 0% 0% 100% Law N/A N/A N/A N/A N/A Medicine 100% 0% 0% 0% 100% Music 100% 0% 0% 0% 100% Nursing 100% 0% 0% 0% 100% Pharmacy 100% 0% 0% 0% 100% Kinesiology & Physical Education 0% 71.4% 0% 0% 71.4% U of T Mississauga 80.4% 9.3% 4.5% 1.3% 95.5% U of T Scarborough 98.2% 1.2% .5% .2% 100.1%
Total 92.1% 4.7% 1.4% .4% 98.6%
*For Timeliness Tables 4 A, B, and D, some totals do not equal 100%, because of rounding or due tothe fact some cases took longer than 15 months to resolve.
9
Provost’s Annual Report on Cases of Academic Discipline
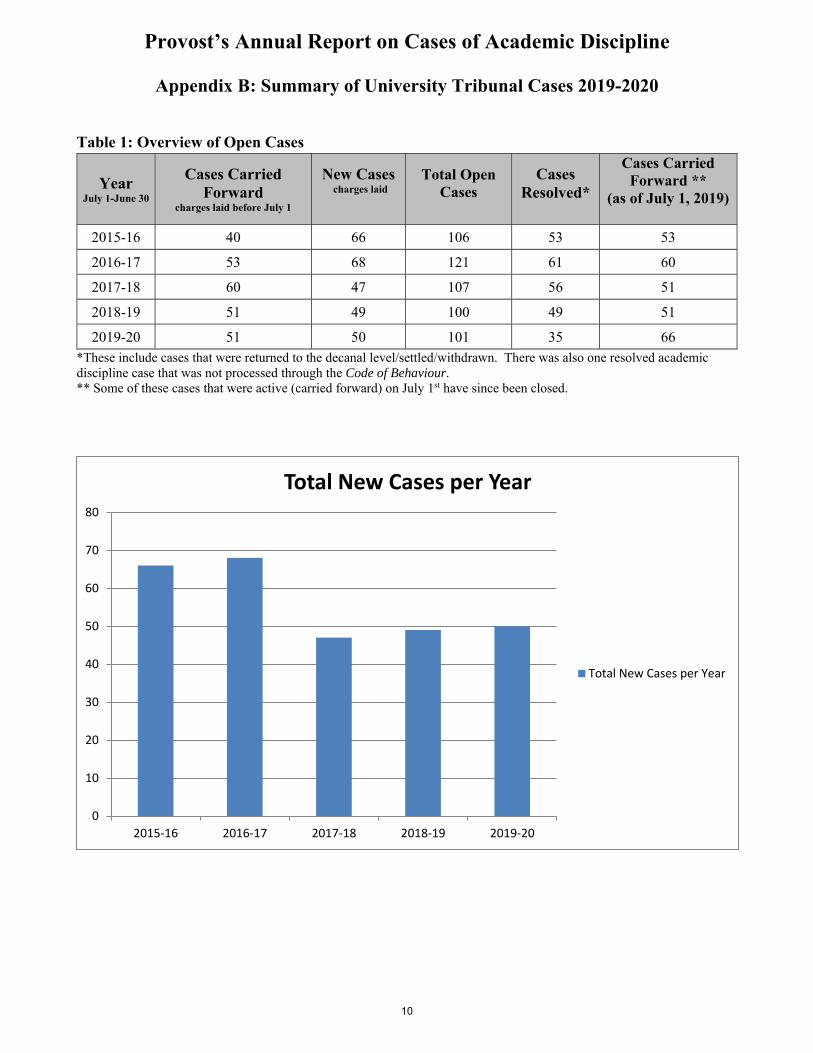
Appendix B: Summary of University Tribunal Cases 2019-2020
Table 1: Overview of Open Cases
*These include cases that were returned to the decanal level/settled/withdrawn. There was also one resolved academicdiscipline case that was not processed through the Code of Behaviour.** Some of these cases that were active (carried forward) on July 1st have since been closed.
0
10
20
30
40
50
60
70
80
2015‐16 2016‐17 2017‐18 2018‐19 2019‐20
Total New Cases per Year
Total New Cases per Year
Year July 1-June 30
Cases Carried Forward
charges laid before July 1
New Cases charges laid
Total Open Cases
Cases Resolved*
Cases Carried Forward **
(as of July 1, 2019)
2015-16 40 66 106 53 53
2016-17 53 68 121 61 60
2017-18 60 47 107 56 51
2018-19 51 49 100 49 51
2019-20 51 50 101 35 66
10
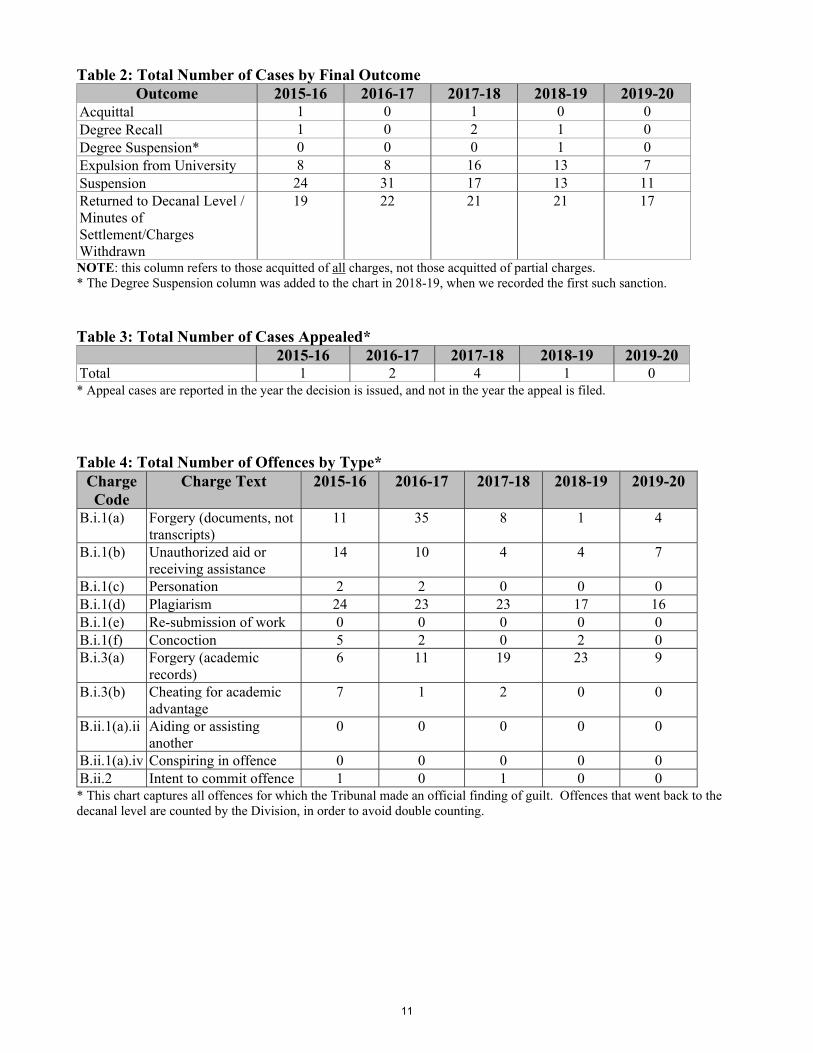
Table 2: Total Number of Cases by Final Outcome Outcome 2015-16 2016-17 2017-18 2018-19 2019-20
Acquittal 1 0 1 0 0 Degree Recall 1 0 2 1 0 Degree Suspension* 0 0 0 1 0 Expulsion from University 8 8 16 13 7 Suspension 24 31 17 13 11 Returned to Decanal Level / Minutes of Settlement/Charges Withdrawn
19 22 21 21 17
NOTE: this column refers to those acquitted of all charges, not those acquitted of partial charges. * The Degree Suspension column was added to the chart in 2018-19, when we recorded the first such sanction.
Table 3: Total Number of Cases Appealed* 2015-16 2016-17 2017-18 2018-19 2019-20
Total 1 2 4 1 0 * Appeal cases are reported in the year the decision is issued, and not in the year the appeal is filed.
Table 4: Total Number of Offences by Type* Charge Code
Charge Text 2015-16 2016-17 2017-18 2018-19 2019-20
B.i.1(a) Forgery (documents, not transcripts)
11 35 8 1 4
B.i.1(b) Unauthorized aid or receiving assistance
14 10 4 4 7
B.i.1(c) Personation 2 2 0 0 0 B.i.1(d) Plagiarism 24 23 23 17 16 B.i.1(e) Re-submission of work 0 0 0 0 0 B.i.1(f) Concoction 5 2 0 2 0 B.i.3(a) Forgery (academic
records) 6 11 19 23 9
B.i.3(b) Cheating for academic advantage
7 1 2 0 0
B.ii.1(a).ii Aiding or assisting another
0 0 0 0 0
B.ii.1(a).iv Conspiring in offence 0 0 0 0 0 B.ii.2 Intent to commit offence 1 0 1 0 0 * This chart captures all offences for which the Tribunal made an official finding of guilt. Offences that went back to thedecanal level are counted by the Division, in order to avoid double counting.
11
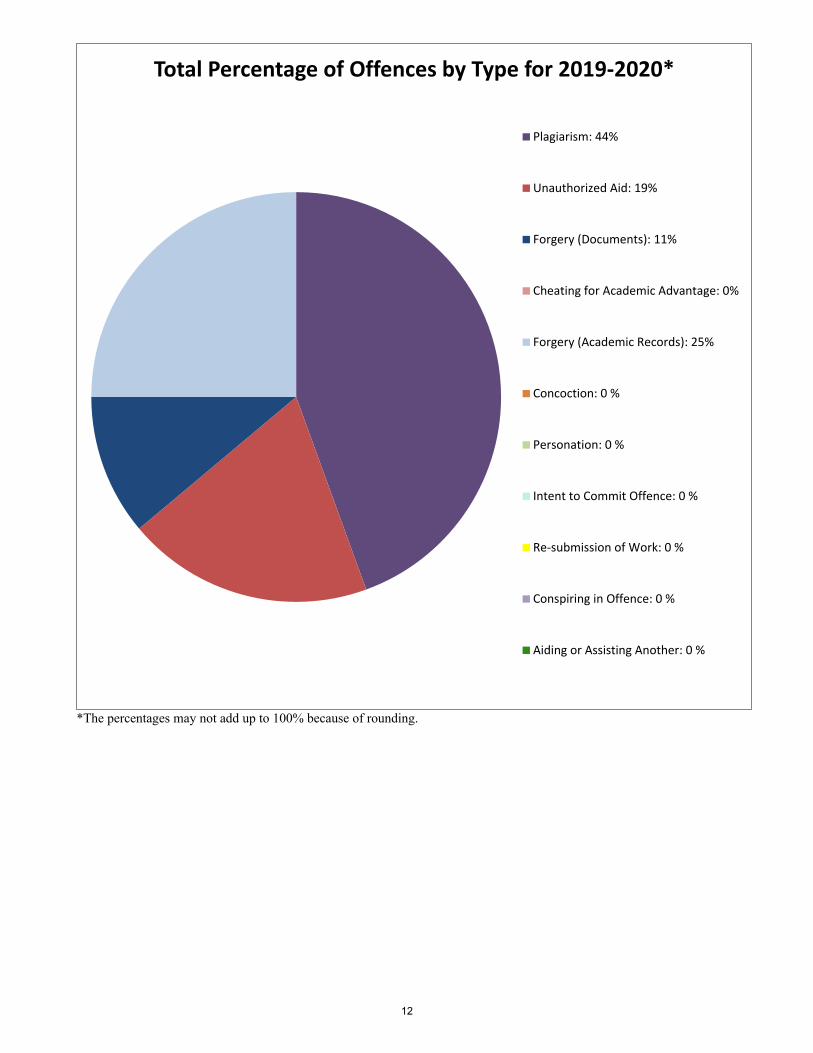
*The percentages may not add up to 100% because of rounding.
Total Percentage of Offences by Type for 2019‐2020*
Plagiarism: 44%
Unauthorized Aid: 19%
Forgery (Documents): 11%
Cheating for Academic Advantage: 0%
Forgery (Academic Records): 25%
Concoction: 0 %
Personation: 0 %
Intent to Commit Offence: 0 %
Re‐submission of Work: 0 %
Conspiring in Offence: 0 %
Aiding or Assisting Another: 0 %
12

0123456789
10111213141516171819202122232425262728293031323334353637383940414243444546474849505152535455
2015‐16 2016‐17 2017‐18 2018‐19 2019‐20
Forgery (Documents)
Unauthorized Aid
Personation
Plagiarism
Re‐submission of Work
Concoction
Forgery (Academic Records)
Cheating for Academic Advantage
Aiding or Assisting Another
Conspiring in Offence
Intent to Commit Offence
Total Number of Offences by Type per Year
13

Table 5: Total Number of Offenders by Division* Division* 2015-16 2016-17 2017-18 2018-19 2019-20
Applied Science & Engineering 2 2 0 2 0 Architecture, Landscape, Design 2 0 1 1 Arts & Science 17 12 14 10 13 Dentistry 0 0 0 0 0 Graduate Studies 1 4 7 8 1 Law 0 0 0 0 1 Medicine 1 0 0 0 1 Music 0 0 0 0 0 Nursing 0 0 0 0 0 OISE / UT 0 0 0 0 0 Pharmacy 0 1 3 0 0 Kinesiology & Physical Education
0 0 0 0 0
U of T Mississauga 24 34 19 21 13 U of T Scarborough 8 6 13 7 5 * This chart includes offenders whose cases went back to decanal level for resolution/settlement/withdrawal.
Table 6a: Timeliness between Charges Laid and Order Issued
* The total is calculated based on the total number of cases where an Order was issued. For 2019-20, an Order was issuedin all but three cases that went to a hearing.
Table 6b: Timeliness between Charges Laid and Written Reasons
NOTE: Tables 6a and 6b do not include offenders whose cases went back to decanal level for resolution or were settled, but it does include decisions that were appealed. Also, in 89% of cases that proceeded to a hearing, either an Order or written reasons were issued within 15 months. There were two cases where the process took longer than 15 months, either because of multiple sets of charges or multiple hearing dates.
Year July 1-June 30
Time between Charges Laid and Order Issued
Within 6 months
6-9 months 9 -12 months
12-15months
Total*
2015-16 78% 13% 3% 6% 100%
2016-17 74.3% 20% 3% 0% 97%
2017-18 50% 30% 13% 3% 96%
2018-19 70% 11% 15% 4% 100%
2019-20 53% 33% 13% 0% 99%
Year July 1-June 30
Time between Charges Laid and Written Reasons
Within 6 months
6-9 months9-12 months 12-15
monthsTotal
2015-16 47% 26% 12% 3% 88%
2016-17 33% 31% 31% 0% 95%
2017-18 17% 26% 29% 11% 83%
2018-19 36% 43% 4% 14% 97%
2019-20 22% 39% 17% 11% 89%
14