provisional upper colorado river basin consumptive uses ... · eastern slope of the wasatch plateau...
TRANSCRIPT

U.S. Department of the Interior July 2019 Bureau of Reclamation
PROVISIONAL Upper Colorado River Basin Consumptive Uses and Losses Report
2016-2020


PROVISIONAL Upper Colorado River Basin Consumptive Uses and Losses Report 2016-2020 (Currently updated through 2018)

UPPER COLORADO RIVER BASIN
CONSUMPTIVE USES AND LOSSES
2016-2020
Provisional Data (Subject to change)

iv Consumptive Uses and Losses
FOREWORD
This report reflects the Department of the Interior's best estimate of actual consumptive uses and losses within the Upper Colorado River Basin. The reliability of the estimate is affected by the availability of data and the current capabilities of data evaluation.

Consumptive Uses and Losses v
Reporting Areas for Upper Colorado River basin Consumptive Uses and Losses Report, Public Law 90-537

vi Consumptive Uses and Losses
SUMMARY
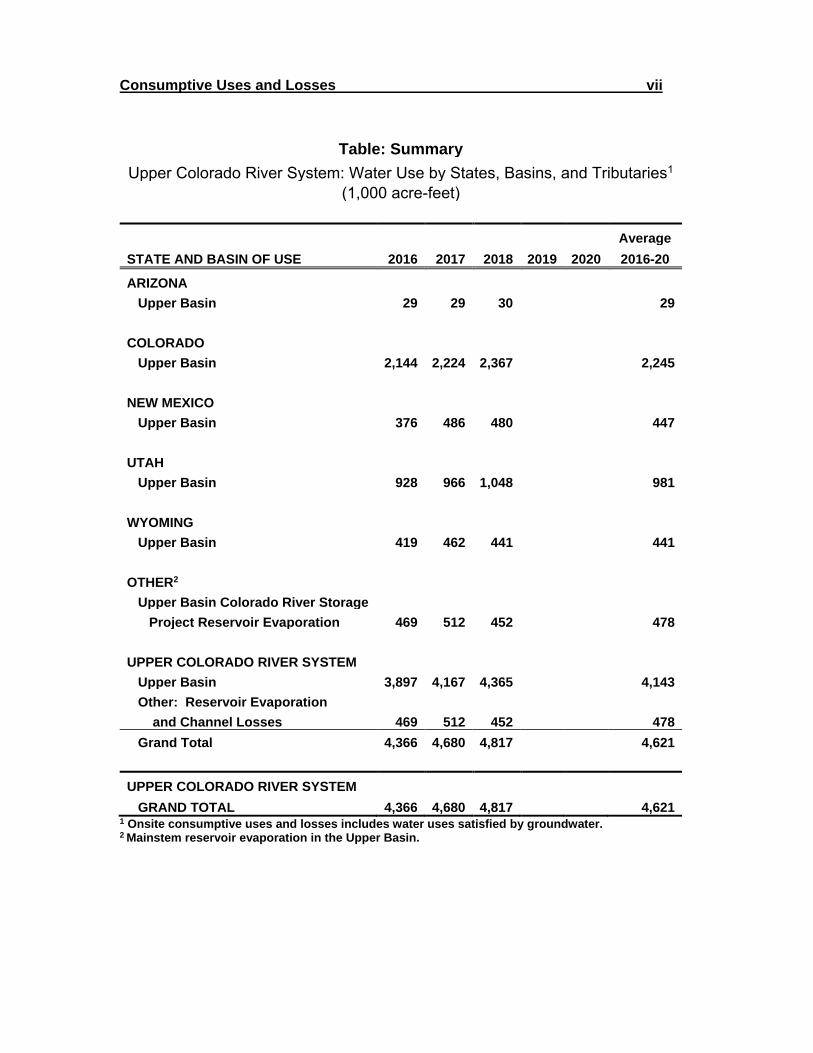
This report shall present the provisional estimates of the consumptive uses and losses from the Upper Colorado River System for each calendar year from 2016 through 2020. Currently, this report contains data through 2018. As further data are available this report shall be updated. This report includes a breakdown of the beneficial consumptive use by major types of use, by major tributary streams, and, where possible, by individual States. The Colorado River rises in the Rocky Mountains of Colorado, flows southwesterly about 1,400 miles and terminates in the Gulf of California. Its drainage area of 242,000 square miles in this country represents one-fifteenth of the area of the United States. Its water is used for irrigation, municipal and industrial purposes, electric power generation, mineral activities, livestock, fish and wildlife, and recreation. Large amounts are exported from the system to adjoining areas. The following tables summarize annual water use from the system by basins and States. Distribution of water use by types of use from the various reporting areas is contained within the body of the report.
Consumptive Uses and Losses vii
Table: Summary
Upper Colorado River System: Water Use by States, Basins, and Tributaries1 (1,000 acre-feet)
Average
STATE AND BASIN OF USE 2016 2017 2018 2019 2020 2016-20
ARIZONA Upper Basin 29 29 30 29
COLORADO Upper Basin 2,144 2,224 2,367 2,245
NEW MEXICO
Upper Basin 376 486 480 447
UTAH
Upper Basin 928 966 1,048 981
WYOMING
Upper Basin 419 462 441 441
OTHER2
Upper Basin Colorado River Storage
Project Reservoir Evaporation 469 512 452 478
UPPER COLORADO RIVER SYSTEM
Upper Basin 3,897 4,167 4,365 4,143
Other: Reservoir Evaporation and Channel Losses 469 512 452 478
Grand Total 4,366 4,680 4,817 4,621
UPPER COLORADO RIVER SYSTEM
GRAND TOTAL 4,366 4,680 4,817 4,621 1 Onsite consumptive uses and losses includes water uses satisfied by groundwater. 2 Mainstem reservoir evaporation in the Upper Basin.

viii Consumptive Uses and Losses
CONTENTS Page
FOREWORD ....................................................................................................................... iv
SUMMARY .......................................................................................................................... vi INTRODUCTION .................................................................................................................. 1
STUDY REPORTING AREAS .............................................................................................. 1
Upper Colorado River Basin ............................................................................................. 2
Green River (Wyoming-Colorado-Utah) ........................................................................ 2
Upper Main Stem (Colorado-Utah) ................................................................................ 2
San Juan-Colorado (Colorado-New Mexico-Utah-Arizona)........................................... 3
TERMINOLOGY ................................................................................................................... 4
METHODOLOGY AND DATA ADEQUACY ......................................................................... 5
Colorado River Basin Tributaries ...................................................................................... 5
Agriculture ..................................................................................................................... 5
Reservoir Evaporation ................................................................................................... 7
Groundwater .................................................................................................................. 7
Stockpond Evaporation and Livestock .......................................................................... 8
Mineral Resources ........................................................................................................ 8
Thermal Electric Power ................................................................................................. 8
Municipal and Industrial ................................................................................................. 8
Transbasin Diversions ................................................................................................... 9
BENEFICIAL CONSUMPTIVE USES AND LOSSES........................................................... 9
Upper Colorado River Tributaries ..................................................................................... 9

Consumptive Uses and Losses ix
TABLES Colorado River Basin
Page Summary Colorado River Basin: Water Use by States, and Tributaries…. vii
Upper Colorado River
UC-1 Estimated Main Stem Reservoir Evaporation, 2016-2020………… 11
UC-2 Estimated Water Use Within States, by Major Tributaries,
and Types of Use, 2016…………………………….……………. 12
UC-3 Estimated Water Use Within States, by Major Tributaries,
and Types of Use, 2017…………..……………………………… 13
UC-4 Estimated Water Use Within States, by Major Tributaries,
and Types of Use, 2018…………………………..……………… 14
UC-5 Estimated Water Use Within States, by Major Tributaries,
and Types of Use, 2019……………………..…………………… 15
UC-6 Estimated Water Use Within States, by Major Tributaries,
and Types of Use, 2020…………………………..……………… 16
UC-7 Irrigated Acreage 2016-2020…………………………………………. 17
UC-8 Population Estimates 2016-2020…………………………………….. 18
UC-9 Shortage Water Estimates 2016-2020………………………………. 19


1 Consumptive Uses and Losses
PROVISIONAL
UPPER COLORADO RIVER BASIN CONSUMPTIVE USES AND LOSSES
2016-2020
INTRODUCTION The Colorado River System is composed of portions of seven States--Arizona, California, Colorado, Nevada, New Mexico, Utah, and Wyoming. It has a drainage area of about 242,000 square miles and represents about one-fifteenth of the area of the United States. This report incorporates provisional annual estimates of consumptive uses and losses of water from the Upper Colorado River Basin from 2016 through 2020. Currently, this report contains data through 2018, and will be updated when data is available. Wherever available, water use reports prepared in accordance with legal requirements concerning the operation of the Colorado River were utilized. Base data needed to estimate onsite consumptive uses were taken largely from existing reports and studies and from ongoing programs. Where current data were not available, estimated values were developed by various techniques and reasoned judgment. In general, methodology followed the techniques normally used within the system for estimating water use. Nothing in this report is intended to interpret the provisions of the Colorado River Compact (45 Stat. 1057), the Upper Colorado River Basin Compact (63 Stat. 31), the Water Treaty of 1944 with the United Mexican States (Treaty Series 994; 59 Stat. 1219), the decree entered by the Supreme Court of the United States in Arizona vs. California, et al. (376 U.S. 340), the Boulder Canyon Project Act (45 Stat. 1057), the Boulder Canyon Project Adjustment Act (54 Stat. 774; 43 U.S.C. 618a), the Colorado River Storage Project Act, (70 Stat. 105; 43 U.S.C. 620), or the Colorado River Basin Project Act (82 Stat. 885; 43 U.S.C. 1501).
STUDY REPORTING AREAS
The drainage area of the Upper Colorado River Basin in the United States is approximately 110,000 square miles. The river originates in the Rocky Mountains of Colorado and Wyoming, flows southwest about 640 miles, and terminates at Lee Ferry, Arizona. The system consists of portions of five states: Arizona, Colorado, New Mexico, Utah, and Wyoming. The drainage area was divided into three subbasins for the purposes of this report. The Colorado River Compact, signed November 24, 1922, was established because the Upper Basin States were concerned that any storage on the river would be put to use more rapidly by the Lower Basin States, thus allowing them to claim prior appropriative rights. The Upper Basin States wanted provisions for their future development.
Consumptive Uses and Losses 2
The term "Upper Basin States" refers to the States of Colorado, New Mexico, Utah, and Wyoming. "Lower Basin States" refers to the States of Arizona, California, and Nevada. However, the Upper Colorado River Basin refers to the hydrologic boundaries. Lee Ferry is the division point between the Upper Colorado River Basin and the Lower Colorado River Basin. The major tributary streams selected as reporting areas in the Upper Colorado River Basin are: Green River (Wyoming, Colorado, Utah), Upper Main Stem (Colorado, Utah), and San Juan-Colorado (Colorado, New Mexico, Utah, Arizona). The boundaries of the reporting areas are shown on the map on page v. A brief description of each reporting area follows. Upper Colorado River Basin Green River (Wyoming-Colorado-Utah)
The Green River reporting area comprises approximately 44,800 square miles in southwestern Wyoming, northwestern Colorado, and northeastern and east-central Utah. Principal tributaries of the Green River are Blacks Fork, New Fork, and Big Sandy Creek in southwestern Wyoming, Yampa and White Rivers on the western slope of the Continental Divide in northwestern Colorado, and the Price, Duchesne, and San Rafael Rivers in eastern Utah. These streams are fed by numerous headwater lakes. The largest towns in the reporting area are Rock Springs and Green River in Wyoming, Vernal and Price in Utah, and Craig, Steamboat Springs, and Meeker in Colorado. Mineral production is the major industry. Oil and natural gas are of primary importance, as are coal, gilsonite, asphalt, and trona (soda ash). Thermal electric power production is becoming an increasingly important industry. Agriculture ranks near mineral production in importance to the local economy. Agricultural development is centered around livestock production, primarily beef cattle and sheep. Because of a short growing season, crop production is limited largely to small grains, hay, and pasture. These crops are used as winter livestock feed and complement the vast areas of public grazing lands. Irrigation consumptive use accounts for about 75 percent of the total water use in the Green River reporting area exclusive of any share of main stem evaporation. Nearly 717,300 acres of land are irrigated on average during the reporting period (2016-2018). Some exports of water are made to the Great Basin in Utah. Upper Main Stem (Colorado-Utah)
The Upper Main Stem reporting area is drained by the Colorado River and its tributaries above the mouth of the Green River. Principal tributaries are the Roaring Fork, Gunnison, and the Dolores Rivers. The Upper Main Stem reporting area consists of 26,200 square miles, with about 85 percent of the area in Colorado and the remainder in Utah.

3 Consumptive Uses and Losses
Grand Junction, Montrose, and Glenwood Springs are the principal towns in the Colorado portion of the upper main stem of the Colorado River. Moab is the only major community in the Utah portion of the upper main stem of the Colorado River. Mineral production is the predominant industry. This area is the Nation's chief source of molybdenum and is a major source of vanadium, uranium, lead, zinc, coal, and gilsonite. On the Upper Main Stem reporting area, as in that of the Green River, agriculture centers around production of livestock which feeds on irrigated lands to complement the large areas of rangeland. Somewhat increased diversification of crops occurs in the Upper Main Stem, however, with some major land areas devoted to corn, beans, potatoes, table vegetables, and fruit. This diversification is made possible by climatic and topographic conditions that create favorable air drainage and minimize frost damage. Irrigation consumptive use accounts for about 64 percent of the water use in the Upper Main Stem reporting area exclusive of any share of main stem evaporation. Approximately 514,900 acres of land were irrigated on average during the reporting period (2016-2018). Approximately 28 percent of the water is exported to serve agricultural and municipal needs on the Eastern slope of the Continental Divide in Colorado. San Juan-Colorado (Colorado-New Mexico-Utah-Arizona)
The San Juan reporting area is drained by the Colorado River and its tributaries below the mouth of the Green River and above Lee Ferry, Arizona. The largest of the tributary streams is the San Juan River which heads on the western slope of the Continental Divide in southwestern Colorado. Principal tributaries of the San Juan River are the Navajo, Piedra, Los Pinos, Animas, and La Plata Rivers. The other main tributaries in the basin are the Dirty Devil, Escalante, and Paria Rivers, which drain a portion of the Eastern slope of the Wasatch Plateau in Utah. The reporting area includes about 38,600 square miles in portions of Utah, New Mexico, Arizona, and Colorado. The largest towns are Durango and Cortez in Colorado, Monticello and Blanding in Utah, Farmington in New Mexico, and Page in Arizona. Mining and agriculture form the economic base for the San Juan-Colorado reporting area. The agricultural development is similar to that of the Upper Main Stem where most of the cropland is devoted to livestock feeds except for the production of diversified market crops on lands with favorable air drainage. The main market crops are fruit, vegetables, and dry beans. Oil, natural gas, and coal are the most important minerals produced. Thermal electric power production is increasingly important to the economy of the area. Irrigation accounts for the largest use of water, about 68 percent of the San Juan reporting area use, exclusive of any share of main stem evaporation. About 296,100 acres of land are irrigated on average during the reporting period (2016-2018).

Consumptive Uses and Losses 4
TERMINOLOGY
The Colorado River is not only one of the most highly controlled rivers in the world, but is also one of the most institutionally encompassed. A multitude of legal documents, known collectively as the "Law of the River," effect and dictate its management and operation. Major documents include: Colorado River Compact--1922 Boulder Canyon Project Act--1928 California Limitation Act--1929 California Seven Party Agreement--1931 Mexican Water Treaty--1944 Upper Colorado River Basin Compact--1948 Colorado River Storage Project Act--1956 United States Supreme Court Decree in Arizona vs. California--1964 Colorado River Basin Project Act--1968 Minute 242 of the International Boundary and Water Commission, United States and Mexico--1973 Colorado River Basin Salinity Control Act--1974, amended 1984, 1995, and 1996 Grand Canyon Protection Act—1992 Minute 319 242 of the International Boundary and Water Commission, United States and Mexico—2012 Minute 323 of the International Boundary and Water Commission, United States and Mexico--2017 The Colorado River System is defined in the Colorado River Compact of 1922 as "...that portion of the Colorado River and its tributaries within the United States,", whereas the Colorado River Basin is defined as "...all of the drainage area of the Colorado River System and all other territory within the United States of America to which waters of the Colorado River System shall be beneficially applied.". The compact divided the Colorado River Basin into two subbasins--the "Upper Basin" and the "Lower Basin," with Lee Ferry as the division point on the river. Lee Ferry, located in Arizona, is a point in the main stem 1 mile below the mouth of the Paria River. For the purpose of this report, the Great Divide Basin, a closed basin in Wyoming, and the White River, also a closed basin, in Nevada have not been considered as part of the Colorado River System since flows from these basins never reach the Colorado River. Diversions from the system to areas outside its drainage area are considered herein as exports and have not been classified by types of use. Beneficial consumptive use is normally construed to mean the consumption of water brought about by human endeavors and in this report includes use of water for municipal, industrial, agricultural, power generation, export, recreation, fish and wildlife, and other purposes, along with the associated losses incidental to these uses. The storage of water and water in transit may also act as losses on the system although normally such water is recoverable in time. Qualitatively, what constitutes beneficial consumptive use is fairly well understood; however, an inability to exactly quantify these uses has led to various differences of opinion. The practical necessity of administering the

5 Consumptive Uses and Losses
various water rights, apportionments, etc., of the Colorado River has led to definitions of consumptive use or depletions generally in terms of "how it shall be measured." The Upper Colorado River Basin Compact provides that the Upper Colorado River Commission is to determine the apportionment made to each State by "...the inflow- outflow method in terms of manmade depletions of the virgin flow at Lee Ferry...”. There is further provision that the measurement method can be changed by unanimous action of the Commission. Nearly all the water exported from the Upper Colorado River System is measured; however, the remaining beneficial consumptive use, for the most part, must be estimated using theoretical methods and techniques. Reservoir evaporation loss is a consumptive use associated with the beneficial use of water for other purposes. For the purpose of this report, main stem reservoir evaporation is carried as a separate item for the Upper Basin. Channel losses within the system are normally construed to be the consumptive use by riparian vegetation along the stream channel (or conveyance route) and the evaporation from the stream's water surface and wetted materials. Seepage from the stream normally appears again downstream or reaches a groundwater aquifer where it may be usable again. A decided lack of data and acceptable methodology, along with the intermittent flow characteristics of many Southwest streams, combine to make a reasonable determination of channel loss difficult. Channel losses have not been estimated for this report within the Upper Basin.
METHODOLOGY AND DATA ADEQUACY
This report is based almost entirely on data obtained from ongoing programs and current reports. Quantitative measurements of water use were used wherever available, but the majority of the basin water use was theoretically calculated. The following sections describe these calculations for the Upper and Lower Colorado River Basin. Colorado River Basin Tributaries
In the tributary areas of the basin, records of diversions and return flows are not complete enough to allow direct calculation of consumptive water use. Theoretical and indirect methods of estimating consumptive use must then be relied upon. In the New Mexico portion of the Colorado River Basin, the annual consumptive use of water is reported by the New Mexico Interstate Stream Commission. For the Arizona, Colorado, Utah and Wyoming portions of the Colorado River Basin, the annual consumptive use of water was estimated using the following methodologies. Agriculture
The percent of irrigation consumptive use is 62 percent for the Upper Basin tributaries. The percent includes main stem evaporation. The annual irrigated acreage of most crops grown within each reporting area was estimated from Geographic Information Systems (GIS) data obtained from each of the three northern states (Colorado, Utah, Wyoming). The annual irrigated acreage for the State of New Mexico was estimated by the New

Consumptive Uses and Losses 6
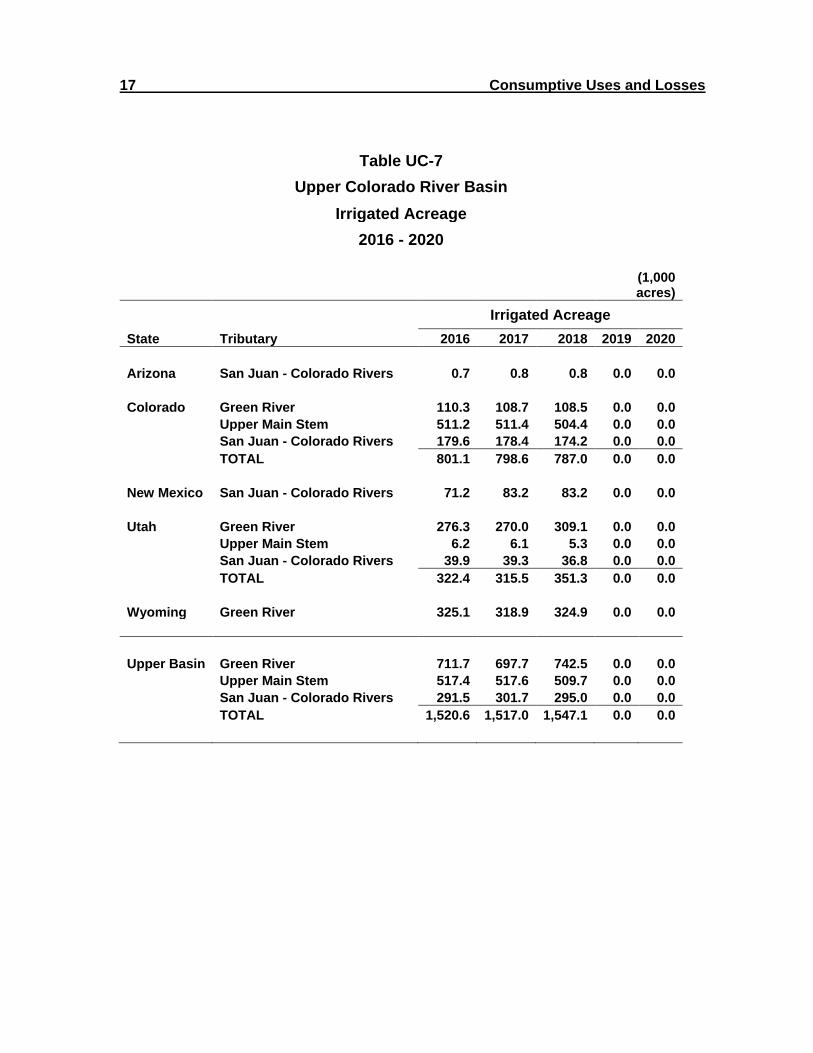
Mexico Interstate Stream Commission using their GIS data. Arizona’s annual irrigated acreage values were determined from previous direct field examination by a party composed of representatives from the State of Arizona and the Navajo Nation. These reporting areas generally follow tributary stream basin and State boundaries. A representative climatic station was selected for each subbasin. Using historical frost dates and National Weather Service Cooperative Observer Program (COOP) records of temperature and precipitation a consumptive use rate was computed for each major crop in each of the reporting years. Crop specific consumptive use rates were computed using the modified Blaney Criddle evapotranspiration, without an elevation adjustment, formula in the version described in the Soil Conservation Service Technical Release No. 21, "Irrigation Water Requirements," revised September 1970. Irrigation consumptive use rates were determined by subtracting the effective precipitation from the consumptive use rates. Effective precipitation for the Upper Basin was computed using the Soil Conservation Service method. This method is referenced in "SCS Technical Release No. 21." The monthly values of irrigation consumptive use rates are applied to the estimates of irrigated acreage to yield the final values of irrigation consumptive use. These theoretical consumptive use calculations were based on the assumption of full water supply during the crop growing season. However, it is estimated that in an average year, about 37 percent of the irrigated lands in the Upper Basin receive less than a full supply of water, either due to lack of distribution facilities or junior water rights. The degree to which these lands suffer shortages varies widely from year to year, depending in large part on the magnitude of runoff. An estimate of the short supply service lands was made for each subbasin, primarily on the basis of reports and investigations collected for the 1971 comprehensive framework study. A streamflow gauging station was selected within each subbasin and the magnitude of the recessional portion of the annual hydrograph was used as an index to select the date at which consumptive use calculations should be terminated for the short supply lands. Estimates of total shortage water volumes (the volume of water that would have been consumed by crops if the shortage criteria were not in place) are displayed in table UC-9. Comprehensive framework studies of the incidental consumptive use of water associated with irrigation indicated that this use varied between 5 and 29 percent of the irrigation consumptive use, depending upon the location of the study area within the Colorado Basin. These percentages were used in the Upper Basin to adjust the calculated consumptive use. The agricultural data is generally adequate for use in this report. Other areas of agricultural data collection that need to be updated and verified are: (1) the consumptive water use of lands that receive less than a full seasonal supply of irrigation water and the aerial extent of these lands, and (2) the amount of incidental seepage and phreatophytic losses associated with irrigation. Total irrigated acreages used in the preparation of this report are listed in table UC-7.

7 Consumptive Uses and Losses
Reservoir Evaporation
A comprehensive listing was developed of all reservoirs in the Upper Colorado River Basin primarily based on the National Inventory of Dams database, which included the latitude, longitude, elevation, and surface area at total capacity for each reservoir. Monthly water-surface area was obtained for those reservoirs for which records are available. For those reservoirs lacking records (unmeasured), a "fullness factor" was estimated on the basis of reservoir use and historical hydrologic conditions. These "fullness factors" were then used to obtain estimates of average annual water surface area for the unreported reservoirs. For all reservoirs without monthly evaporation estimates, annual free water surface (FWS) evaporation rates were used to determine reservoir evaporation. The FWS evaporation value was taken from NOAA Technical Report NWS 33, “Evaporation Atlas for the Contiguous 48 United States”, June 1982, Map 3 of 4: Annual FWS Evaporation based on the reservoir location information. An account was taken of precipitation and runoff salvage to determine net evaporation rates. The annual FWS evaporation rates were distributed monthly based on an average basin monthly distribution. For unmeasured reservoirs, the annual net evaporation rates were applied to the estimates of average annual water-surface area to yield the values of annual reservoir evaporation. An exception to this procedure was the determination of evaporation from what are called the main stem reservoirs shown in table UC-1 and a few additional reservoirs operated by Reclamation. For these reservoirs monthly reservoir evaporation was taken from Reclamation’s hydrologic data base. Records of monthly evaporation rates applied at these sites are typically based on past pan evaporation studies and maintained by Reclamation’s Upper Colorado Region water operations group. Groundwater
Currently, all groundwater pumping is counted as consumptive use charged against the Colorado River Basin. Obviously, this is not necessarily true. Depending on the location and depth of the well and what types of soils are present in the area, it is possible that little or none of the water pumped would have contributed to the Colorado River System for hundreds or even thousands of years. If changes to this groundwater accounting structure are desired, a team consisting of personnel from various State Engineers Offices, Bureau of Reclamation, and any other pertinent agencies should be established. This team would establish guidelines for computing what amounts of ground water pumped should be charged against the Colorado River Basin on an area by area basis. The recommendations of this team could then be incorporated in future Consumptive Uses and Losses calculations. Until these guidelines are established, the Consumptive Uses and Losses Reports will continue to report all groundwater pumping as depletion from the system. Currently, the Arizona portion of the Upper Basin is the only part of the basin that reports (see the Arizona portion of the Upper Colorado River basin Consumptive Uses and Losses Reports) the portion of consumptive use served via groundwater pumpage.

Consumptive Uses and Losses 8
Stockpond Evaporation and Livestock
Stockpond surface areas were estimated from the May 1975 Soil Conservation Service (SCS) publication, "Livestock Water Use." The subbasin stockpond areas were subdivided by county using the livestock population distribution. The livestock population distribution was further subdivided to State and basin by the irrigated lands average distribution. The same procedure used to calculate the unmeasured reservoir evaporation was used to estimate the stockpond evaporation. Livestock population data was taken from annual State Agriculture Statistics and the 2002 and 2007 Census of Agriculture. Livestock population data included cattle, sheep, horses, and hogs. Consumption rates for the various livestock were derived from various reports, including the SCS publication, "Livestock Water Use," May 1975. Stockpond and livestock data are adequate to prepare an estimate of this consumptive use. Considering the small amount of water use, any refuting effort would be best spent on the irrigation or evaporation categories. Mineral Resources
The Upper Basin uses water in the production of numerous minerals in addition to energy-related materials such as oil and natural gas. Estimates of the water consumptively used were based largely on phone surveys conducted by the U.S. Geological Survey and summarized in “Estimated Use of Water in the United States”. These data were reported at an 8-digit HUC level in 1995 and unofficially in 2000. Estimates for 2016-2020 reporting relied on the unofficially reported 2000 water use estimates. Thermal Electric Power
The net use of water for the production of thermal electric energy from the tributaries of the Colorado River Basin was collected from records obtained from the various power companies in the Basin or estimates from historically reported records. These records have been becoming more difficult to collect and are primarily estimated based on historically reported records. Municipal and Industrial
The basis for estimating municipal and industrial uses was the urban and rural population within the reporting areas. Preparation of annual population estimates was guided by the 2010 census and the growth rates between 2000 and 2010. Historically, municipal and industrial consumptive uses were collected by the USGS and summarized in the “Estimated Use of Water in the United States” reporting series (published every 5 years) at an 8-digit HUC watershed scale. These reports have not included consumptive use estimates at this scale since 1995. To estimate 2016-2020 municipal and industrial consumptive use a per capita use rate was derived from data summarized in “Estimated Use of Water in the United States in 1995", USGS Circular

9 Consumptive Uses and Losses
1200, where estimates were last published at the 8-digit HUC watershed scale. The data used included a combination of water supply withdrawal and consumptive use estimates from the domestic, commercial, industrial, and public use categories along with population data. The estimates for 2016-2020 reporting period were computed based on the 1995 per capita use estimates coupled with the 2016-2020 reporting period urban and rural population. The population of the Upper Colorado River Basin, estimated at nearly 929 thousand in 2010, has increased to just over 1.05 million in 2018 (table UC-8). Twenty percent of the Upper Basin population was classified as rural with a significantly smaller per capita use of water. Both the urban and rural areas have the mutual problem of providing an adequate current and future water supply for a growing population in a water-short area. As a result of almost continuous studies concerning these problems, adequate production and effluent records are usually available to adequately assess water use. Transbasin Diversions
The principal transbasin diversions both out of and into the Colorado River System were measured and reported by the Geological Survey, state agencies or local water commissioners and users. The remainder was estimated on the basis of past records and capacity of facilities. Due to the high degree of measurement, this area of basin consumptive use is considered to be quite accurately determined.
BENEFICIAL CONSUMPTIVE USES AND LOSSES
A summary table of the Upper Colorado River System total annual water uses, 2016 through 2020, by states is shown on page vii. Water use within the selected reporting areas is discussed below. Upper Colorado River Tributaries
Summaries of estimated annual consumptive uses and losses in the Upper Colorado River Basin for each of the reporting years, broken down by State, reporting area, and type of use are shown in tables UC-2 through UC-6. The subtotals and totals may not add appropriately because totals were computed before rounding all values to 100 acre-feet. Totals were computed before rounding to ensure values reported, including subtotals and totals, are representative of the values utilized for computation of natural flow in the Upper Colorado Basin. Estimated main stem reservoir evaporation is shown in table UC-1. Technically, these are not all main stem reservoirs but are reservoirs that participate in the Colorado River Storage Project (CRSP). The Upper Colorado River Commission designates which reservoirs in the CRSP have evaporation losses charged to the State and which have losses charged to the basin as a whole. Reservoirs listed in table UC-1 are those to be charged to the basin as a whole. These reservoir evaporation losses amount to about 10.3 percent of all Upper Basin losses.

Consumptive Uses and Losses 10
Upper Basin consumptive use averaged 4.6 million acre-feet per year for the reporting period 2016-2020. Agricultural uses accounted for about 62 percent of the total Upper Basin consumptive uses and losses (including Main Stem Reservoir Evaporation). Variation in consumptive use during the reporting period was largely due to year-to-year changes in climatic conditions and irrigated acreages. Transbasin exports, the second largest Upper Basin use, on the average accounted for approximately 16 percent of Upper Basin total use, showed year by year variation during the reporting period. Water uses for thermal electric power generation averaged 144,000 acre-feet per year, which represents about 3 percent of consumptive use in the Upper Basin.

11 Consumptive Uses and Losses
Table UC-1
Upper Colorado River Basin
Estimated Main Stem Reservoir Evaporation1
2016 - 2020
(1,000 acre-
feet)
Evaporation
Reservoir 2016 2017 2018 2019 2020 Average
Flaming Gorge 79.7 81.5 81.8 81.0
Blue Mesa 8.6 8.9 6.9 8.1
Morrow Point 0.8 0.8 0.8 0.8
Lake Powell 379.5 421.2 362.8 387.8
TOTAL 468.7 512.4 452.2 477.8
1 Undistributed by States. Evaporation determined using average historical evaporation rates.

Consumptive Uses and Losses 12
Table UC-2
Upper Colorado River Basin
Estimated Water Use within States, by Major Tributaries and Types of Use 2016 - Provisional data (subject to change)
(1,000 acre-feet)
Agriculture Municipal and Industrial Export
Stockpond Thermal
Reservoir Evaporation & Mineral Electric Outside Within
State Tributary Evaporation1 Irrigation Livestock Subtotal Resources Power Other2 Subtotal System System TOTAL
Arizona San Juan - Colorado Rivers 3.5 1.1 1.5 2.6 0.0 18.1 5.3 23.4 0.0 0.0 29.5
Colorado Green River 8.2 172.3 3.1 175.4 0.2 17.9 3.8 21.9 0.0 3.3 208.8
Upper Main Stem 78.7 1,014.5 6.4 1,021.0 3.1 1.6 38.5 43.2 450.9 249.6 1,843.5
San Juan - Colorado Rivers 11.7 316.7 5.4 322.2 0.2 0.0 7.1 7.3 3.5 (252.9) 91.7
TOTAL 98.6 1,503.6 14.9 1,518.6 3.5 19.5 49.4 72.4 454.5 0.0 2,144.0
New Mexico San Juan - Colorado Rivers 29.7 201.3 4.3 205.6 1.3 33.5 12.0 46.7 94.3 0.0 376.3
Utah Green River 66.7 564.5 4.5 569.1 0.6 34.4 14.6 49.6 126.9 0.0 812.3
Upper Main Stem 1.5 16.5 0.2 16.7 0.4 0.0 1.8 2.2 0.0 0.0 20.4
San Juan - Colorado Rivers 6.6 81.6 3.8 85.4 2.4 0.0 4.0 6.4 (3.1) 0.0 95.2
TOTAL 74.7 662.7 8.5 671.2 3.4 34.4 20.4 58.2 123.8 0.0 927.9
Wyoming Green River 37.9 322.5 4.9 327.4 0.7 37.7 7.1 45.6 8.5 0.0 419.4
Upper Basin Green River 112.7 1,059.4 12.5 1,071.9 1.6 90.0 25.5 117.1 135.4 3.3 1,440.5
Upper Main Stem 80.2 1,031.1 6.6 1,037.7 3.5 1.6 40.3 45.4 450.9 249.6 1,863.9
San Juan - Colorado Rivers 51.4 600.7 15.0 615.7 3.8 51.6 28.4 83.8 94.7 (252.9) 592.7
TOTAL 244.3 2,691.2 34.2 2,725.4 8.9 143.2 94.2 246.3 681.1 0.0 3,897.1
1 Excludes reservoir evaporation from Colorado River main stem reservoirs listed in Table UC-1. 2 Includes rural, urban, and other industrial uses.

13 Consumptive Uses and Losses
Table UC-3
Upper Colorado River Basin
Estimated Water Use within States, by Major Tributaries and Types of Use 2017 - Provisional data (subject to change)
(1,000 acre-feet)
Agriculture Municipal and Industrial Export
Stockpond Thermal
Reservoir Evaporation & Mineral Electric Outside Within
State Tributary Evaporation1 Irrigation Livestock Subtotal Resources Power
Other2 Subtotal System System TOTAL
Arizona San Juan - Colorado Rivers 3.8 1.1 1.5 2.6 0.0 17.6 5.3 22.9 0.0 0.0 29.3
Colorado Green River 8.2 164.8 3.1 168.0 0.2 17.9 3.9 21.9 0.0 3.3 201.4
Upper Main Stem 74.9 1,036.8 6.7 1,043.4 3.1 1.6 39.3 44.0 500.5 265.4 1,928.2
San Juan - Colorado Rivers 11.8 335.2 5.5 340.7 0.2 0.0 7.2 7.4 3.4 (268.7) 94.6
TOTAL 94.9 1,536.8 15.3 1,552.1 3.5 19.5 50.4 73.4 503.9 0.0 2,224.2
New Mexico San Juan - Colorado Rivers 29.5 235.1 4.4 239.5 1.1 35.0 15.0 51.1 165.7 0.0 485.7
Utah Green River 70.6 597.9 4.5 602.4 0.6 34.4 14.9 49.9 123.9 0.0 846.8
Upper Main Stem 1.5 16.5 0.2 16.7 0.4 0.0 1.8 2.2 0.0 0.0 20.4
San Juan - Colorado Rivers 6.6 85.0 3.8 88.7 2.4 0.0 4.0 6.4 (3.1) 0.0 98.6
TOTAL 78.7 699.3 8.5 707.8 3.4 34.4 20.7 58.5 120.8 0.0 965.8
Wyoming Green River 38.1 365.2 4.9 370.1 0.7 37.7 7.1 45.6 8.5 0.0 462.3
Upper Basin Green River 116.9 1,127.9 12.5 1,140.4 1.6 90.0 25.9 117.4 132.4 3.3 1,510.5
Upper Main Stem 76.3 1,053.3 6.9 1,060.1 3.5 1.6 41.1 46.3 500.5 265.4 1,948.6
San Juan - Colorado Rivers 51.7 656.4 15.1 671.5 3.6 52.6 31.5 87.7 166.0 (268.7) 708.2
TOTAL 244.9 2,837.5 34.5 2,872.0 8.8 144.2 98.5 251.4 798.9 0.0 4,167.2
1 Excludes reservoir evaporation from Colorado River main stem reservoirs listed in Table UC-1. 2 Includes rural, urban, and other industrial uses.

Consumptive Uses and Losses 14
Table UC-4
Upper Colorado River Basin
Estimated Water Use within States, by Major Tributaries and Types of Use 2018 - Provisional data (subject to change)
(1,000 acre-feet)
Agriculture Municipal and Industrial Export
Stockpond Thermal
Reservoir Evaporation & Mineral Electric Outside Within
State Tributary Evaporation1 Irrigation Livestock Subtotal Resources Power
Other2 Subtotal System System TOTAL
Arizona San Juan - Colorado Rivers 3.8 1.0 1.4 2.4 0.0 18.1 5.3 23.4 0.0 0.0 29.6
Colorado Green River 8.4 201.2 3.2 204.4 0.2 17.9 3.9 22.0 0.0 0.4 235.2
Upper Main Stem 67.1 1,148.9 6.9 1,155.8 3.1 1.6 40.1 44.9 494.1 208.8 1,970.7
San Juan - Colorado Rivers 8.9 346.1 5.9 352.0 0.2 0.0 7.3 7.5 1.5 (209.2) 160.7
TOTAL 84.4 1,696.2 16.1 1,712.3 3.5 19.5 51.4 74.3 495.6 0.0 2,366.6
New Mexico San Juan - Colorado Rivers 24.4 235.1 4.4 239.5 1.1 35.0 15.0 51.1 165.1 0.0 480.0
Utah Green River 71.9 686.4 4.4 690.8 0.6 34.4 15.1 50.2 127.2 0.0 940.0
Upper Main Stem 1.5 11.4 0.2 11.6 0.4 0.0 1.8 2.2 0.0 0.0 15.3
San Juan - Colorado Rivers 6.6 79.2 3.8 83.0 2.4 0.0 4.0 6.4 (3.1) 0.0 92.9
TOTAL 80.0 776.9 8.4 785.3 3.4 34.4 21.0 58.8 124.1 0.0 1,048.2
Wyoming Green River 35.7 345.1 4.8 350.0 0.7 37.7 7.1 45.6 9.4 0.0 440.7
Upper Basin Green River 115.9 1,232.7 12.4 1,245.1 1.6 90.0 26.2 117.8 136.7 0.4 1,615.9
Upper Main Stem 68.5 1,160.3 7.2 1,167.4 3.5 1.6 41.9 47.1 494.1 208.8 1,986.0
San Juan - Colorado Rivers 43.8 661.4 15.4 676.8 3.6 53.1 31.6 88.4 163.4 (209.2) 763.2
TOTAL 228.2 3,054.4 35.0 3,089.4 8.8 144.7 99.8 253.2 794.2 0.0 4,365.0
1 Excludes reservoir evaporation from Colorado River main stem reservoirs listed in Table UC-1. 2 Includes rural, urban, and other industrial uses.

15 Consumptive Uses and Losses
Table UC-5
Upper Colorado River Basin
Estimated Water Use within States, by Major Tributaries and Types of Use 2019 - Provisional data (subject to change)
(1,000 acre-feet)
Agriculture Municipal and Industrial Export
Stockpond Evaporation &
Livestock
Thermal Electric Power
Reservoir
Evaporation1
Mineral
Resources
Outside System
Within System
State Tributary Irrigation Subtotal Other2 Subtotal TOTAL
Arizona San Juan - Colorado Rivers 0.0 0.0 0.0 0.0 0.0 0.0 0.0 0.0 0.0 0.0 0.0
Colorado Green River 0.0 0.0 0.0 0.0 0.0 0.0 0.0 0.0 0.0 0.0 0.0
Upper Main Stem 0.0 0.0 0.0 0.0 0.0 0.0 0.0 0.0 0.0 0.0 0.0
San Juan - Colorado Rivers 0.0 0.0 0.0 0.0 0.0 0.0 0.0 0.0 0.0 0.0 0.0
TOTAL 0.0 0.0 0.0 0.0 0.0 0.0 0.0 0.0 0.0 0.0 0.0
New Mexico San Juan - Colorado Rivers 0.0 0.0 0.0 0.0 0.0 0.0 0.0 0.0 0.0 0.0 0.0
Utah Green River 0.0 0.0 0.0 0.0 0.0 0.0 0.0 0.0 0.0 0.0 0.0
Upper Main Stem 0.0 0.0 0.0 0.0 0.0 0.0 0.0 0.0 0.0 0.0 0.0
San Juan - Colorado Rivers 0.0 0.0 0.0 0.0 0.0 0.0 0.0 0.0 0.0 0.0 0.0
TOTAL 0.0 0.0 0.0 0.0 0.0 0.0 0.0 0.0 0.0 0.0 0.0
Wyoming Green River 0.0 0.0 0.0 0.0 0.0 0.0 0.0 0.0 0.0 0.0 0.0
Upper Basin Green River 0.0 0.0 0.0 0.0 0.0 0.0 0.0 0.0 0.0 0.0 0.0
Upper Main Stem 0.0 0.0 0.0 0.0 0.0 0.0 0.0 0.0 0.0 0.0 0.0
San Juan - Colorado Rivers 0.0 0.0 0.0 0.0 0.0 0.0 0.0 0.0 0.0 0.0 0.0
TOTAL 0.0 0.0 0.0 0.0 0.0 0.0 0.0 0.0 0.0 0.0 0.0
1 Excludes reservoir evaporation from Colorado River main stem reservoirs listed in Table UC-1. 2 Includes rural, urban, and other industrial uses.

Consumptive Uses and Losses 16
Table UC-6
Upper Colorado River Basin
Estimated Water Use within States, by Major Tributaries and Types of Use 2020 - Provisional data (subject to change)
(1,000 acre-feet)
Agriculture Municipal and Industrial Export
Stockpond Evaporation &
Livestock
Thermal Electric Power
Reservoir
Evaporation1
Mineral
Resources
Outside System
Within System
State Tributary Irrigation Subtotal Other2 Subtotal TOTAL
Arizona San Juan - Colorado Rivers 0.0 0.0 0.0 0.0 0.0 0.0 0.0 0.0 0.0 0.0 0.0
Colorado Green River 0.0 0.0 0.0 0.0 0.0 0.0 0.0 0.0 0.0 0.0 0.0
Upper Main Stem 0.0 0.0 0.0 0.0 0.0 0.0 0.0 0.0 0.0 0.0 0.0
San Juan - Colorado Rivers 0.0 0.0 0.0 0.0 0.0 0.0 0.0 0.0 0.0 0.0 0.0
TOTAL 0.0 0.0 0.0 0.0 0.0 0.0 0.0 0.0 0.0 0.0 0.0
New Mexico San Juan - Colorado Rivers 0.0 0.0 0.0 0.0 0.0 0.0 0.0 0.0 0.0 0.0 0.0
Utah Green River 0.0 0.0 0.0 0.0 0.0 0.0 0.0 0.0 0.0 0.0 0.0
Upper Main Stem 0.0 0.0 0.0 0.0 0.0 0.0 0.0 0.0 0.0 0.0 0.0
San Juan - Colorado Rivers 0.0 0.0 0.0 0.0 0.0 0.0 0.0 0.0 0.0 0.0 0.0
TOTAL 0.0 0.0 0.0 0.0 0.0 0.0 0.0 0.0 0.0 0.0 0.0
Wyoming Green River 0.0 0.0 0.0 0.0 0.0 0.0 0.0 0.0 0.0 0.0 0.0
Upper Basin Green River 0.0 0.0 0.0 0.0 0.0 0.0 0.0 0.0 0.0 0.0 0.0
Upper Main Stem 0.0 0.0 0.0 0.0 0.0 0.0 0.0 0.0 0.0 0.0 0.0
San Juan - Colorado Rivers 0.0 0.0 0.0 0.0 0.0 0.0 0.0 0.0 0.0 0.0 0.0
TOTAL 0.0 0.0 0.0 0.0 0.0 0.0 0.0 0.0 0.0 0.0 0.0
1 Excludes reservoir evaporation from Colorado River main stem reservoirs listed in Table UC-1. 2 Includes rural, urban, and other industrial uses.
17 Consumptive Uses and Losses
Table UC-7
Upper Colorado River Basin
Irrigated Acreage
2016 - 2020
(1,000 acres)
Irrigated Acreage
State Tributary 2016 2017 2018 2019 2020
Arizona San Juan - Colorado Rivers 0.7 0.8 0.8 0.0 0.0
Colorado Green River 110.3 108.7 108.5 0.0 0.0
Upper Main Stem 511.2 511.4 504.4 0.0 0.0
San Juan - Colorado Rivers 179.6 178.4 174.2 0.0 0.0
TOTAL 801.1 798.6 787.0 0.0 0.0
New Mexico San Juan - Colorado Rivers 71.2 83.2 83.2 0.0 0.0
Utah Green River 276.3 270.0 309.1 0.0 0.0
Upper Main Stem 6.2 6.1 5.3 0.0 0.0
San Juan - Colorado Rivers 39.9 39.3 36.8 0.0 0.0
TOTAL 322.4 315.5 351.3 0.0 0.0
Wyoming Green River 325.1 318.9 324.9 0.0 0.0
Upper Basin Green River 711.7 697.7 742.5 0.0 0.0
Upper Main Stem 517.4 517.6 509.7 0.0 0.0
San Juan - Colorado Rivers 291.5 301.7 295.0 0.0 0.0
TOTAL 1,520.6 1,517.0 1,547.1 0.0 0.0

Consumptive Uses and Losses___________________________________________18
Table UC-8
Upper Colorado River Basin
Population Estimates
2016 - 2020
(1,000's)
Population
State Tributary 2016 2017 2018 2019 2020
Arizona San Juan - Colorado Rivers 46.3 46.2 46.0 45.9 45.8
Colorado Green River 46.8 47.4 48.0 48.6 49.2
Upper Main Stem 473.6 483.6 493.7 503.7 513.8
San Juan - Colorado Rivers 97.1 98.5 99.8 101.2 102.6
TOTAL 617.4 629.5 641.5 653.6 665.6
New Mexico San Juan - Colorado Rivers 151.7 155.4 159.2 162.9 166.6
Utah Green River 94.0 95.8 97.5 99.2 100.9
Upper Main Stem 10.0 10.1 10.2 10.2 10.3
San Juan - Colorado Rivers 21.4 21.5 21.6 21.7 21.8
TOTAL 125.4 127.4 129.3 131.2 133.1
Wyoming Green River 71.1 74.3 77.4 80.6 83.8
Upper Basin Green River 211.9 217.4 222.9 228.4 234.0
Upper Main Stem 483.6 493.7 503.9 514.1 524.1
San Juan - Colorado Rivers 316.5 321.6 326.6 331.7 336.8
TOTAL 1,011.9 1,032.7 1,053.4 1,074.2 1,094.9

19 Consumptive Uses and Losses
Table UC-9
Upper Colorado River Basin
Agricultural Water Shortage Estimates
2016 - 2020
(1,000 acre-feet)
Shortage
State Tributary 2016 2017 2018 2019 2020
Arizona1 San Juan - Colorado Rivers
Colorado Green River 2.9 2.9 1.3 0.0 0.0
Upper Main Stem 5.8 5.8 9.4 0.0 0.0
San Juan - Colorado Rivers 4.2 4.4 6.6 0.0 0.0
TOTAL 12.9 13.1 17.3 0.0 0.0
New Mexico1 San Juan - Colorado Rivers
Utah Green River 98.5 105.0 161.8 0.0 0.0
Upper Main Stem 1.7 1.8 3.9 0.0 0.0
San Juan - Colorado Rivers 13.0 14.2 10.7 0.0 0.0
TOTAL 113.2 121.0 176.4 0.0 0.0
Wyoming Green River 67.4 27.0 69.7 0.0 0.0
Upper Basin Green River 168.8 135.0 232.8 0.0 0.0
Upper Main Stem 7.5 7.6 13.3 0.0 0.0
San Juan - Colorado Rivers 17.2 18.6 17.3 0.0 0.0
TOTAL 193.5 161.1 263.4 0.0 0.0
1 Shortages not reported.