provincial council elections 2014 - verité research
TRANSCRIPT
Provincial Council Elections 2014 Reading into the marginsWestern and Southern Provinces
Daniel Alphonsus
Aloka Kumarage
Verité Research aims to be a leader in the provision of information and analysis for negotiations and
policy making in Asia, while also promoting dialogue and education for social development in the region.
The firm contributes actively to research and dialogue in the areas of economics, sociology, politics, law,
and media, and provides services in data collection, information verification, strategy development, and
decision analysis.
Produced by the Politics Research Team
Email comments to [email protected]
Copyright © 2014 Verité Research Pvt Ltd.
All rights reserved. Intended for recipient only and not for further distribution without the consent of Verité Research Pvt Ltd

page 1 | 15
Provincial Council Elections 2014
[Western -11.4%, Southern -9.8%] In contrast to last Sep-tember’s Central and North-Western province elections, in which the governing UPFA’s vote share declined only marginally from its post-war 2009 high, the UPFA’s vote share decreased sub-stantially in this election. West-ern province UPFA vote share fell by 11.4%, a little more than the Southern province decline of 9.8%. The UPFA decline in east-ern Colombo suburbs, including Maharagama and Homagama, is significant as this region is the core support base for its influen-tial Sinhala nationalist JHU and NFF coalition partners.
[Western -3%, Southern +0.7 %] Despite the overall opposi-tion gain, the UNP’s vote share fell by 3% in Western province compared to 2009. Interrogat-ing the data, the UNP’s core vote remains constant. The losses originate from the DPF contest-ing separately in this election. In Southern province, the UNP’s position improved only margin-ally, largely in electorates repre-sented by Sajith Premadasa and his allies.
Minority parties performed well in this election. The ACMC, which is a UPFA coalition partner, and the DPF both performed strongly. The DPF won two seats and the ACMC, contesting for the first time, won one. The SLMC main-tained its position - despite con-siderable criticism for remaining in government.
Table of Contents
Western Province UPFA losing nationalist voters?Minorities leaving UNP?
Western Province Fact Sheet
Southern Province UPFA’s steep coastal decline Sajith bucks UNP decline
Southern Province Fact Sheet
Governance, Princelings & MediaGovernance and parents matterMaharajah media victory
Definitions and Disclaimers
Annexures
2
4
5
7
8
9
10
UPFA
UNP
DP & JVP
DPF, SLMC & ACMC
Sri Lanka’s Western and Southern provinces went to the polls on 29 March 2014. The Western province (pop. 5,822,507), the largest by population, is also the most ethnically diverse. The Southern province (pop. 2,465,474) is the ruling UPFA’s core constituency. Together, these provinces contain 40.9% of the is-land’s population and account for over half its GDP.
[DP: Western 8%, Southern 6.3%; JVP: Western +3.7%, Southern +2.9%] The Demo-cratic Party, led by General Sarath Fonseka, and the JVP performed well. The Democratic Party con-tested independently in the prov-ince for the first time, gaining an impressive 8% of the Western vote and 6.3% of the Southern vote. After losing vote share in last year’s provincial elections in the Central and North-West-ern provinces, the JVP tripled its vote share in the Western prov-ince, while also gaining ground in its traditional Southern base. Together the two parties well exceeded the DNA’s 2010 vote share, of which they were the two main coalition members.
Highlights

The UPFA campaigned on a na-tionalist platform, asking voters to demonstrate that they reject the UNHRC resolution on Sri Lanka by voting for the UPFA. This message, as analysed in Verité Research’s Media Analysis, a weekly analysis of the Sinhala and Tamil press, is losing credibility, and in this elec-tion failed to galvanize voters in Colombo’s Eastern suburbs – the core support base for the JHU and NFF, the UPFA’s nationalist coali-tion partners. The UPFA decline in these polling divisions was greater than its 12.4% average decline across the district. Pref-erential data tells a similar story. Compared to 2009, the strongly Sinhala nationalist (UPFA coali-tion partner) National Freedom Front’s Roger Seneviratne lost 8400 votes, a 15.9% decline. The JHU’s second most popular can-didate, Nishantha Sri Warnasin-ghe, was fourth from the bottom among the elected UPFA candi-dates.
Provincial Council Elections 2014
The UPFA and UNP decline was greater in urban polling divisions than rural polling divisions. For details on the method used for ur-ban/rural classification please see Annexure III.
The Western province, due to its affluence and Colombo district’s ethnic diversity, has historically tended to favour the UNP. But the UNP was unable to capitalize on rising economic discontent, gov-ernance issues and the incum-bency disadvantage to increase its vote.
Post-war, in 2009, the UPFA polled a record high 64.7% in the West-ern Province. Since then its vote share has gradually declined, fall-ing to 58.6% in 2010 and 53.4% this year. UPFA vote share declined in all three Western province dis-tricts, but Colombo’s decline was especially pronounced at 12.4% (almost 100,000 votes).
The JHU’s Udaya Gammampila was an exception to this trend. He was able to maintain his prefer-
The UNP’s vote share declined by 3%, leading to a loss of 4 seats. However, the actual decline in the UNP’s core vote was marginal. Its
vote share only declined by 1% – the remaining 2% decline oc-
ence vote share, losing less than a thousand votes compared to 2009.
UPFA
UNP
page 2 | 15
UPFA decline less in rural electorates
Sinhala nationalists abandoning UPFA? UPFA % UNP % JVP % DP %
Homagama -13.8 +1.4 +5.8 6
Kaduwela -12.9 -5.2 +7.2 10
Kesbewa -16.4 +2.2 +6.1 7.3
Kotte -14.3 -8.3 +7.4 11.8
Maharagama -15.2 -5.8 +7.9 11.9
COLOMBO -12.4 -6.5 -10 7.3
UPFA % UNP % JVP % DP %
Urban -12.2 -5.3 +4.3 7.7
Rural -9.6 -1.1 +2.4 8
UPFA decline, UNP core vote steady
curred as the DPF, its former coa- lition partner, contested this elec-tion alone.
Western Province

JVP
Provincial Council Elections 2014
A similar pattern occurs in Kalu-tara district, where its vote share was highest in urbanizing, semi-urban electorates including Kalu-tara, Panadura and Horana polling divisions.
With an important leadership change and overall re-grouping, including fielding a chief ministe-rial candidate for the first time, the JVP won 6.1% of the vote in this election, 3.7% more compared to 2009. The +5.2% swing in Co-lombo district was particularly impressive – the JVP succeeded in gaining over 52,000 voters com-pared to 2009.
The last few years have been somewhat tumultuous for the JVP. The party experienced two major defections: the first led by the na-tionalist Wimal Weerawansa and the second by a group that formed the Frontline Socialist Party (which did not contest). Its vote share also declined in last year’s provincial elections.
page 3 | 15
UPFA dominates outside Colombo
Ethnic composition 2012
DPF, SLMC, ACMC & CWC
Parties with ethnic voter bases performed reasonably well in this election. The DPF, contesting pro-vincial elections for the first timeunder its own banner since 2004, gained two seats and 2% of vote share. The SLMC, despite criticism of its tempered position on mi-nority issues, maintained its posi-tion. Rishad Bathiudeen’s ACMC, a UPFA coalition partner contesting in the Western province for the first time, gained one seat. Un-like at the Central province polls, the CWC performed poorly in this election.
coastal divisions and above aver-age in mostly Sinhala-Buddhist in-land electorates.
DP
The DP’s success is especially impressive as the DP received relatively little media coverage compared to other political par-ties. The party fared well in the strongholds of nationalist parties (JHU, NFF), gaining an average vote share of 9.4%. However, it underperformed in ethnically di-verse inner-city polling divisions, gaining less than 3% in the Co-lombo North and Central polling divisions.
Outside Colombo, the JVP’s suc-cess appears to have been greater in the suburbs and urbanizing provincial areas, where the UP-FA’s decline was the greatest. For example, in Gampaha, in the sub-urban and relatively industrial inland electorates of Kelaniya, Ja-Ela, Gampaha, Biyagama and Ma-haragama, the JVP averaged 4.7%, compared to its 2.5% average in the Attanagalla, Mirigama, Divu-lapitiya, Dompe and Minuwango-da electorates.
Quick examination of the data re-veals a similar pattern in Gampa-ha and to some extent in Kalutara: Western Province DP vote share is below average in (usually eth-nically and religiously diverse)
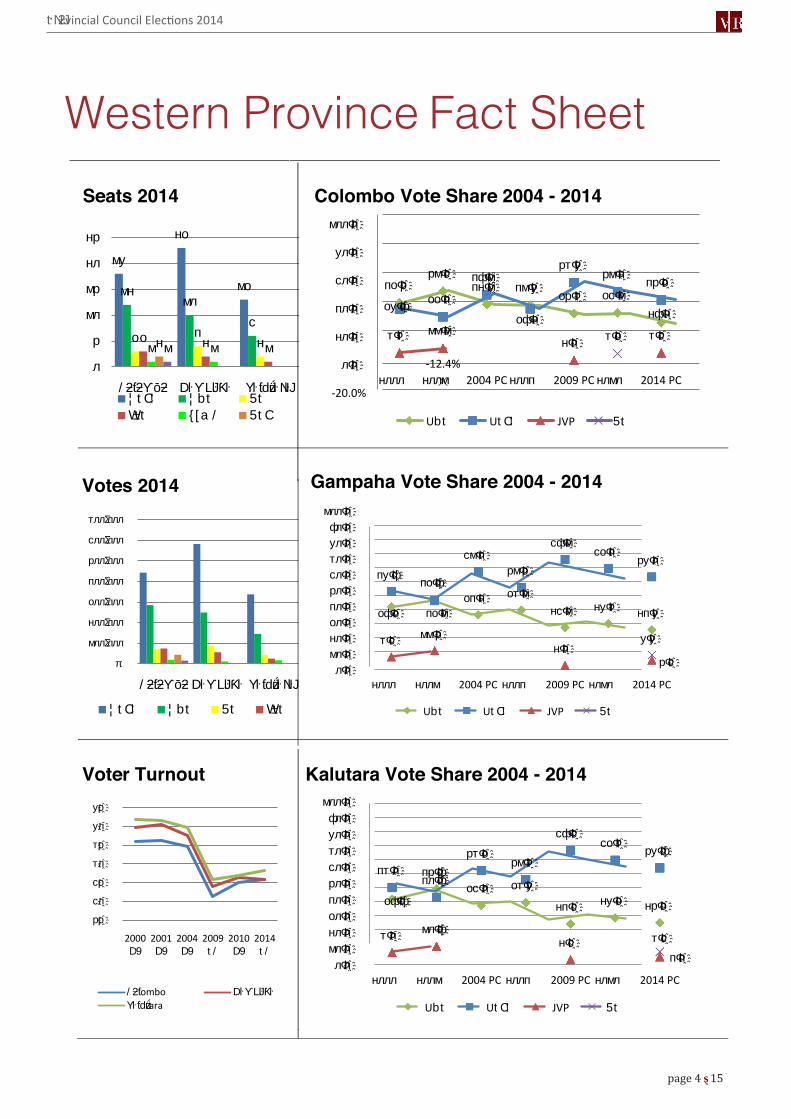
page 4 ȿ 15
му
но
момнмл
со п
нмнмомнм
л
р
мл
мр
нл
нр
/ƻƭƻƳōƻ DŀƳLJŀƘŀ YŀƭdzǘŀNJŀ
Seats 2014
¦tC! ¦bt 5tW±t {[a/ 5tC
Colombo Vote Share 2004 - 2014
π
мллΣллл
нллΣллл
оллΣллл
пллΣллл
рллΣллл
сллΣллл
тллΣллл
/ƻƭƻƳōƻ DŀƳLJŀƘŀ YŀƭdzǘŀNJŀ
Votes 2014
¦tC! ¦bt 5t W±t
Gampaha Vote Share 2004 - 2014
рр҈
сл҈
ср҈
тл҈
тр҈
ул҈
ур҈
2000 D9
2001 D9
2004 D9
2009 t/
2010 D9
2014 t/
Voter Turnout
/ƻƭombo DŀƳLJŀƘŀYŀƭdzǘara
Kalutara Vote Share 2004 - 2014
офΦо҈
поΦф҈опΦн҈ отΦм҈
нсΦм҈ нуΦт҈ нпΦу҈
пуΦф҈
поΦм҈
смΦп҈рмΦр҈
сфΦм҈соΦп҈
руΦл҈
тΦс҈ ммΦр҈нΦп҈
рΦс҈
уΦу҈
лΦл҈млΦл҈нлΦл҈олΦл҈плΦл҈рлΦл҈слΦл҈тлΦл҈улΦл҈флΦл҈
мллΦл҈
нллл нллм 2004 PC нллп 2009 PC нлмл 2014 PC
Ubt UtC! JVP 5t
поΦр҈рмΦс҈
пнΦм҈ пмΦу҈орΦт҈ осΦм҈
нфΦн҈оуΦф҈ ооΦп҈
пфΦм҈
офΦн҈
ртΦу҈рмΦн҈
прΦо҈
тΦт҈ ммΦм҈нΦп҈ тΦс҈
-‐12.4%
тΦо҈
-‐20.0%
лΦл҈
нлΦл҈
плΦл҈
слΦл҈
улΦл҈
мллΦл҈
нллл нллм 2004 PC нллп 2009 PC нлмл 2014 PC
Ubt UtC! JVP 5t
офΦф҈
прΦф҈осΦл҈ отΦу҈
нпΦс҈ нуΦо҈ нрΦо҈
птΦл҈плΦф҈
ртΦо҈рмΦт҈
сфΦс҈соΦт҈
руΦф҈
тΦл҈ млΦф҈нΦс҈ тΦс҈
лΦл҈млΦл҈нлΦл҈олΦл҈плΦл҈рлΦл҈слΦл҈тлΦл҈улΦл҈флΦл҈
мллΦл҈
пΦп҈
нллл нллм 2004 PC нллп 2009 PC нлмл 2014 PC
Ubt UtC! JVP 5t
tNJƻvincial Council Elections 2014
Western Province Fact Sheet

Provincial Council Elections 2014
UPFA UNP
The UNP fared better in the South than in the Western Province, in-creasing its vote share by 0.7%. Its performance in the Rajapaksa’s Hambantota district was better than in the rest of the province, gaining 4.6%. In Galle and Matara, its vote share remained steady or decreased. In Hambantota, UNP
Post-war, the UPFA polled a re-cord high 67.9% in the Southern Province, 2009. Since then its vote share declined, falling to 65% in 2010 and 58.1% this year. It now has 33 of the provincial council’s 55 seats, compared to 38 in 2009.
Overall, the UPFA performed bet-ter in poorer, monoethnic rural electorates than in more diverse, wealthy urban electorates. For ex-ample, the UNP won a plurality in the Galle polling division, but the UPFA won 59.1% in the rural, in-land Baddegama polling division.
Interestingly, ‘development’ does-n’t seem to be ensuring votes. In the Rajapaksa’s home district, the site of signficant infrastruc-ture investment, UPFA vote share declined by 9.5%. Hambantota is still the district with the lowest UPFA vote share in Southern Prov-ince, 57.4%, compared to Matara’s 59.2% and Galle’s 57.6%.
The overall 9.8% UPFA decline in the Southern province was not as steep as its 11.4% decline in the Western province, but was still close. The decline in the relatively urban Galle electorate was close to the 12% Western province fall.
page 5 | 15
Vote Share Comparison: 2009 vs 2014
UNP % JVP %
Galle -10.8 -0.7 +2.1 8.9
Matara -8.8 -0.3 +4.6 5.2
Hambantota -9.5 +4.6 +1.9 3.1
UPFA decline, JVP & DP gain
UPFA % DP %
The UPFA’s share in all three dis-tricts has declined between 9% and 11% between 2009 and now.
Southern Provincevote share declined in Beliatta and increased marginally in Mul-kirigala. However, in Tangalle and Tissamaharama, its vote share increased by 6.3% and 9.7% respectively. It is probably no coincidence that Sajith Pre-madasa MP’s office and locus of operations is in Tissamaharama.

The DP performed less strongly than in Western Province, win-ning 6.3% rather than 8%. Also, in contrast to the JVP the DP’s support is less pronounced in the deep South. In Galle, Sarath Fon-seka’s home district, the DP won 8.9% of the vote, but in Hamban-tota it only won 3.1%.
DP
Provincial Council Elections 2014
Taking a more long-term view, this election brings the JVP closer to its immediate postmillennial highs. Its results in this election are not only a substantial improvement on its 2009 performance but also its performance in the 2010 gen-eral election. The JVP’s 9.1% alone is also greater than the results of the DNA, which was essentially a JVP and DP alliance, which polled 6.9% in 2010.
JVP
The DP tends to perform poorly in electorates where the UNP and JVP do well. Southern province results in particular indicate that the DP and JVP are competing for the protest vote.
The JVP increased its vote share by a third compared to 2009 to win 9.1% of the vote, which trans-lates into 5 seats.
page 6 | 15
Hambantota District 2009 - 2014
UPFA % UNP % JVP % DP %
Beliatta 64.9 (-2.4) 19.4 (-1.8) 11.1 (0) 4.4
Mulkirigala 61 (-3.2) 25.4 (+0.6) 10.3 (-0.1) 3
Tangalle 56.2 (-13.9 ) 23.1 (+5.5) 16.3 (+4.5) 4
UPFA, UNP Steady | DP, JVP Inverse Link
Tissamaharama 51.9 (-13.5) 33.5 (+9.7) 13 (+2.4) 1.5
JVP vote share changes varied from -1% to +8%. JVP gains were above average on the coastal belt south of Galle. With the exception of Akuressa, all the polling divi-sions where the JVP exceeded a 4% increase in vote share were on the coastal belt south of Galle.
Preliminary correlation analy-sis between vote gains/losses by the DP, JVP, UNP and UPFA sug-gest that voter defection from the UPFA to the JVP was stronger than from the UNP to the JVP. And, con-versely, that the defection from the UNP to the DP was stronger than from the UPFA to the DP.
In Galle district, the DP performed better in coastal electorates e.g. Ratgama, Habaraduwa, than in inland electorates e.g. Hiniduma, Bentara-Elpititya. One possible explanation is that the DP led by the non-Govigama caste Fonseka, was better able to mobilize non-Govigama voters, who comprise a greater share of voters in coastal electorates compared to inland electorates.

page 7 | 15
13
108
64 4
2112 2
02468
101214
Seats 2014
UPFA UNP DP PLF
Galle Vote Share 2000 - 2014
-
50,000
100,000
150,000
200,000
250,000
300,000
350,000
Votes 2014
UPFA UNP DP JVP
Matara Vote Share 2000 - 2014
55%
60%
65%
70%
75%
80%
85%
2000GE
2001GE
2004GE
2009PC
2010GE
2014 PC
Voter Turnout
Galle Hambantota Matara
Hambantota Vote Share 2000 - 2014
43.1%� 40.0%�28.9%�
35.4%�
21.6%�29.9%� 26.2%�
39.9%� 37.4%�
70.1%�64.0%� 66.9%� 62.9%�
57.4%�
15.2%� 21.2%�11.0%� 12.9%�
3.1%�0.0%�
10.0%�20.0%�30.0%�40.0%�50.0%�60.0%�70.0%�80.0%�90.0%�
100.0%�
2000��� � 2001��� � 2004 PC 2004��� � 2009 PC 2010��� � 2014 PC
� � UNP� �� UPFA� JVP� DP�
37.1%� 33.4%� 34.9%�25.0%� 27.8%� 24.7%�
51.5%�42.42.5%4%��
64.3%� 60.3%�68.0%� 65.3%�
59.2%�
9.8%� 13.5%�5.5%� 10.0%�
5.2%�0.0%�
10.0%�20.0%�30.0%�40.0%�50.0%�60.0%�70.0%�80.0%�90.0%�
100.0%�
2000��� � 2001��� � 2004 PC 2004��� � 2009 PC 2010��� � 2014 PC
� � UNP� �� UPFA� JVP� DP�
40.1%�44.1%�
36.5%� 38.7%�27.1%� 26.0%� 26.3%�
50.1%�
62.5%�56.6%�
68.3%� 66.2%�57.6%�
43.0%�
8.7%� 11.4%� 3.9%�6.0%�
8.90%�
0.0%�10.0%�20.0%�30.0%�40.0%�50.0%�60.0%�70.0%�80.0%�90.0%�
100.0%�
2000��� � 2001��� � 2004 PC 2004��� � 2009 PC 2010��� � 2014 PC
� � UNP� �� UPFA� JVP� DP�
Provincial Council Elections 2014
Southern Province Fact Sheet
Provincial Council Elections 2014
Princelings & Media Governance in the Wanthamulla issue, did do unusually well in Borella and Kol-lonawa, compared to surrounding electorates, which is perhaps an indication of discontent translat-ing into JVP support.
New entrants from political fami-lies did well both in the Southern and Western provinces. Hirunika Premachandra, Senal Welgama and Pasanda Yapa Abeywardene, all the children of prominent poli-ticians won the highest number of preference votes in Colombo, Kalutara and Matara districts re-spectively. Further down the list there were also many others who had ‘inherited’ constituencies from politically successful rela-tions.
In Borella and Kolonnawa, the UPFA and UNP decline, and the JVP and DP increase were roughly equivalent to their district aver-age change, indicating that the Wanathamulla issue may not have had a significant effect. However, the JVP, which was closely involved
Governance issues appear to have played a role in this election. Con-sider the Borella and Kollonawa, Gampaha and Mahara polling di-visions: these polling divisions are the site of the Wanathamulla and Weliweriya crises (see definitions section for details).
In Gampaha and Mahara polling divisions, the results are a little more conclusive. The UPFA’s de-cline was greater than the district average decline of 11.1%. The JVP and DP both exceeded their average district gains, 3.2% and 8.9% respectively. This co-uld indicate that the Weliweriya crisis did have some effect on UPFA voting, especially in the Ga-mpaha district.
page 8 | 15
Governance Matters: 2009 to 2014
UPFA % UNP % JVP % DP %
Borella -11.8 -8.1 +6.2 4.9
Kollonawa -13.8 -4.2 +6 7.3
Gampaha -15.7 -1.5 +4.8 12
Mahara -12 -2 +4 10
Princelings, Media & Governance
S. M. Marrikar and Susil Kindel-pitiya, Capital Maharajah media employees, topped the UNP and DP parties preference lists respec-tively in the districts they were contesting. Susara Dinal, another Capital Maharajah media employ-ee, also performed well. As noted the UNP did well in Buddhika Pathirana MP’s Akuressa elector-ate, increasing its vote share by 3.9%. Buddhika Pathirana is a Capital Maharajah political pro-gramme host.

Provincial Council Elections 2014
page 9 | 15
Data for this analysis was sourced from Sri Lanka’s Elections Department. 2011 local government data was sourced online.1 2014 preference vote data was sourced from the News-First media network.
Party Abbreviations
CWC
ACMC UPFA UNP DP DPF
All Ceylon Makkal CongressUnited People's Freedom Alliance United National Party Democratic Party Democratic People's Front
SLMC
Jathika Hela Urumaya National Freedom Front Democratic National Alliance Ceylon Workers Congress Sri Lanka Muslim Congress
Definitions & Key Information
Polling Division, District and ProvinceThe polling division is the smallest electoral unit – they do not correspond to administrative units. An electoral district is comprised of a number of polling divisions, electoral districts correspond to administrative districts.
Provincial CouncilsEstablished in 1987, by the 13th Amendment to the Constitution. Minority Tamil community demands for decentralizing and devolving political power were the driving force for reform. Councils have a five year term limit.
Voting SystemPreferential voting where electors first choose the party, and then select up to three candidates from the party.
Seat AssignmentBased on a system of proportional representation. Each party gets seats in proportion to the votes received. The party with the highest number of votes gets 2 bonus seats in addition.
WanathamullaThe site of the abduction and release of a watte (urban low income housing) resident, allegedly for resis-ting urban renewal efforts. See http://newsfirst.lk/english/2014/02/may-seen-happened-cardboard-hero-wanathamulla-susil-kindelpitiya/21562 for some background.
WeliweriyaThe region where a significant environmental crisis led to protests and the Army shooting protestors. For further details see http://www.thesundayleader.lk/2013/08/11/the-cry-for-water-at-weliweriya/
DNAJHU
1 http://en.wikipedia.org/wiki/Results_of_the_2011_Sri_Lankan_local_government_elections_by_province,_district_and_local_authority
Definitions and Disclaimers

Provincial Council Elections 2014
page 10 | 15
UPFA % UNP % JVP % DP % WESTERN PROVINCE -‐11.4 -4 +3.8 7.8 Agallawatta -‐5.9 -‐1.4 +1.3 5.2 Attanagalla -‐4.8 +0.2 +3.3 7.9 Avissawella -‐8.6 -‐5.6 +3.7 6.1 Bandaragama -‐9.8 -‐3.8 +1.5 10.6 Beruwela -‐8.9 +10.1 +1.2 4.3 Biyagama -‐12.5 -‐0.4 +4.3 9 Borella -‐11.8 -‐8.1 +6.2 4.9 Colombo-‐Central -‐10.1 -‐7.6 +1.8 2.5 Colombo-‐East -‐11.5 -‐16 +5 6.2 Colombo-‐North -‐10.7 -‐24.2 +1.4 2.6 Colombo-‐West -‐5.3 -‐28.7 +2.8 5.1 Dehiwela -‐15 -‐9.0 +4.8 9.6 Divulapitiya -‐7.4 -‐1.5 +1.5 7.3 Dompe -‐13 +3.4 +1.9 7.3 Horana -‐13 -‐0.9 +3.5 7.4 Gampaha -‐15.7 -‐1.5 +4.8 12 Homagama -‐13.8 +1.4 +5.8 6 Ja-‐Ela -‐11.5 -‐1.1 +4.1 8.5 Kaduwela -‐12.9 -‐5.2 +7.2 10 Kalutara -‐13.9 +3.2 +2.3 7.2 Katana -‐13.1 -‐3.7 +2.6 10 Kelaniya -‐11.6 -‐4.8 +5.2 10.6 Kesbewa -‐16.4 +2.2 +6.1 7.3 Kolonnawa -‐13.8 -‐4.2 +6 7.3 Kotte -‐14.3 -‐8.3 +7.4 11.8 Matugama -‐9.8 -‐1.8 +0.9 9 Mahara -‐11.7 -‐2.4 +3.9 10.2 Maharagama -‐15.2 -‐5.8 +7.9 11.9 Minuwangoda -‐11.2 -‐0.8 +3.9 8.2 Mirigama -‐6.9 -‐2.5 +2 7.8 Moratuwa -‐11.1 -‐2.7 +4.1 7.9 Negambo -‐13.2 +3.8 +2.3 5.3 Panadura -‐15.2 +1.3 +2.9 9.1 Ratmalana -‐13.2 -‐7.3 +6.4 10 Wattala -‐7.8 -‐5 +2.6 7.4
Annexure I: Vote share change 2009-2014

Provincial Council Elections 2014
page 11 | 15
UPFA % UNP % JVP % DP % SOUTHERN PROVINCE -‐9.5 +0.1 +2.8 6.6 Galle -‐12.6 -‐0.7 +8.2 8.9 Weligama -‐10.2 +0.9 +8 5.3 Matara -‐9.9 -‐4.4 +7.9 6.7 Akmeemana -‐9.7 -‐9.1 +6.6 11.2 Akuressa -‐11.7 +3.9 +5.5 2.5 Devinuwara -‐5.3 -‐5.4 +5.1 5.8 Tangalle -‐13.9 +5.5 +4.5 4 Hakmana -‐9.3 +1.7 +2.5 5.2 Kamburupitiya -‐6.4 -‐1.7 +2.5 5.9 Habaraduwa -‐7.6 -‐7.3 +2.4 10.3 Tissamaharama -‐13.5 +9.7 +2.4 1.5 Ratgama -‐12.1 -‐2.4 +2.1 11.1 Ambalangoda -‐12.8 -‐5.3 +1.4 16.1 Deniyaya -‐7.8 +2.5 +1.1 4.2 Balapitiya -‐15.9 +3.2 +1 11.2 Baddegama -‐9.7 +1.9 +0.8 6.3 Bentara-‐Elpitiya -‐11.2 +5.4 +0.6 4.9 Bulathsinhala -‐5.8 -‐1.3 +0.4 5.2 Beliatta -‐2.4 -‐1.8 0 4.4 Mulkirigala -‐3.2 +0.6 -‐0.1 3 Karandeniya -‐11.1 +3.2 -‐0.2 7.6 Hiniduma -‐6.9 +4.3 -‐1.0 3.2
Annexure I: Vote share change 2009-2014
Provincial Council Elections 2014
page 12 | 15
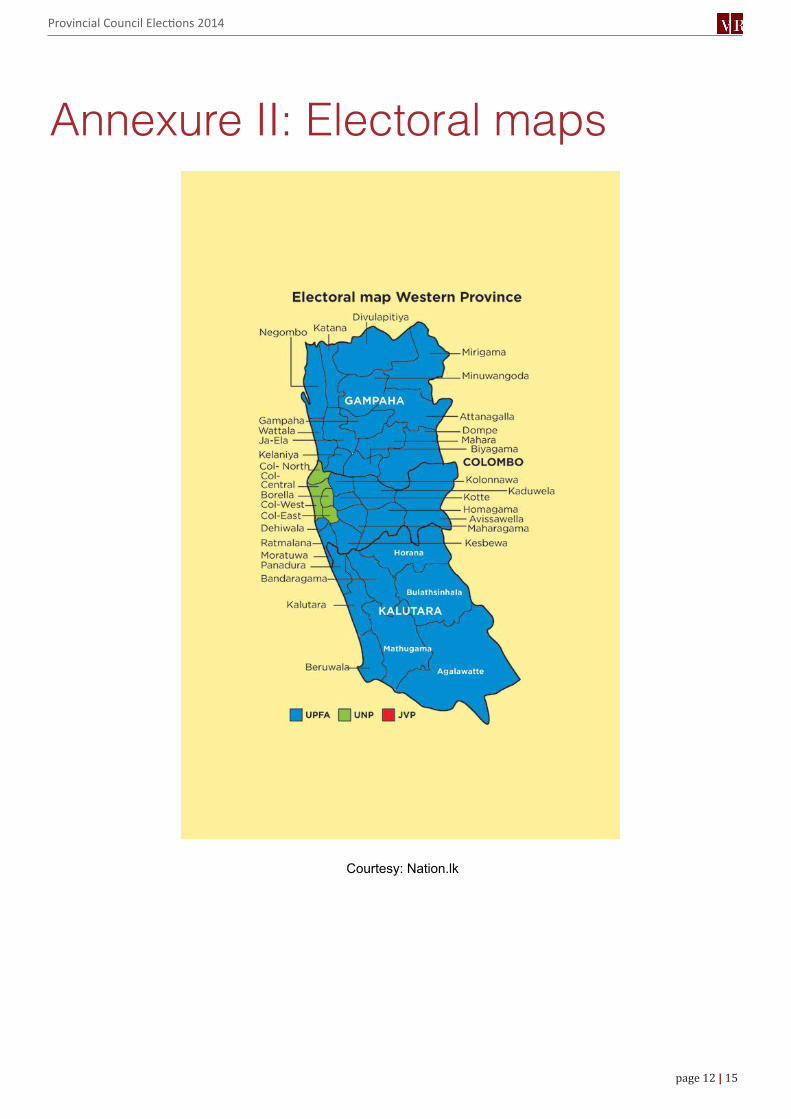
Courtesy: Nation.lk
Annexure II: Electoral maps

Provincial Council Elections 2014
page 13 | 15
Courtesy: Nation.lk
Annexure II: Electoral maps

Provincial Council Elections 2014
page 14 | 15
Urban Polling Divisions
Polling Division UPFA % UNP % JVP % DP % Avissawella� �8.6� � 5.6� 3.7� 6.1�Beruwela� �8.9� 10.1� 1.2� 4.3�Borella� � 11.8� � 8.1� 6.2� 4.9�
1.8� 2.5�5� 6.2�1.4� 2.6�
Colombo-Central� � 10.1 � 7.6 �Colombo�-East� � 11.5� � 16 �Colombo-North� � 10.7 � � 24.2 �Colombo�-West� � 5.3� � 28.7� 2.8� 5.1�Dehiwela� � 15� � 9� 4.8� 9.6�Horana� � 13� � 0.9� 3.5� 7.4�Gampaha� � 15.7� � 1.5� 4.8� 12�Ja� Ela� � 11.5� � 1.1� 4.1� 8.5�Kaduwela� � 12.9� � 5.2� 7.2� 10�Kalutara� � 13.9� 3.2� 2.3� 7.2�Kelaniya� � 11.6� � 4.8� 5.2� 10.6�Kesbewa� � 16.4� 2.2� 6.1� 7.3�Kolonnawa� � 13.8� � 4.2� 6� 7.3�Kotte� � 14.3� � 8.3� 7.4� 11.8�Maharagama� � 15.2� � 5.8� 7.9� 11.9�Minuwangoda� � 11.2� � 0.8� 3.9� 8.2�Moratuwa� � 11.1� � 2.7� 4.1� 7.9�Negambo� � 13.2� 3.8� 2.3� 5.3�Panadura� � 15.2� 1.3� 2.9� 9.1�Ratmalana� � 13.2� � 7.3� 6.4� 10�Wattala� �7.8� � 5� 2.6� 7.4�
URBAN -12.2 -5.3 4.3 7.7
Polling divisions are classified using the schema outlined in the Department of Census and Statis-tics Household Income and Expenditure Survey. The schema classifies geographical locations as urban or rural depending on the local government level the location comes under. Locati-ons under municipal and urban councils are categorised as urban, and those under prade-shiya sabhas are categorized as rural.
Polling division were classified under this schema using data from the Ministry of Local Gov-ernment and Provincial Councils to map polling divisions onto local government units. As polling divisions do not correspond to local government units perfectly, the mapping is an approximation.
Annexure III: Western provincegeographic vote share change2009-2014

Provincial Council Elections 2014
page 15 | 15
Rural Polling Divisions
Polling Division UPFA % UNP % JVP % DP % Agalawatta� � 6� � 1� 1� 5�Attanagalla� � 5� 0� 3� 8�Bandaragama� � 10� � 4� 2� 11�Biyagama� � 13� 0� 4� 9�Divulapitiya� � 7� � 1� 1� 7�Dompe� � 13� 3� 2� 7�Homagama� � 14� 1� 6� 6�Katana� � 13� � 4� 3� 10�Matugama� � 10� � 2� 1� 9�Mahara� � 12� � 2� 4� 10�Mirigama� � 7� � 3� 2� 8�Bulathsinhala� � 6� � 1� 0� 5�RURAL -9.6 -1.1 2.4 8
Annexure III: Western provincegeographic vote share change2009-2014

CONTACT: V E R I T É R E S E A R C H , N O . 5 A P O L I C E P A R K P L A C E , C O L O M B O 0 5 , S R I LA N K A
T EL : + 9 4 1 1 2 0 5 5 5 4 4 | EM A I L : RE C E P T I O N@V E R I T E RE S E A R C H . O R G