providence seaside hospital
TRANSCRIPT

Community Health Needs Assessment Executive Summary
Providence Seaside Hospital Creating healthier communities, together
As health care continues to evolve and systems of care become more complex, Providence is responding with dedication to its Mission and a core strategy to create healthier communities, together. Partnering with many community organizations, we are committed to addressing the most pressing health needs in our community. Providence Seaside Hospital is a 25-bed critical access hospital situated in Clatsop County, Oregon, providing primary care, surgical services, obstetrics and gynecology, diagnostic imaging, pediatrics, intensive care, and emergency care for residents of the rural north coast.
Our starting point: Gathering community health data and input
Through a formal community health needs assessment process in partnership with Columbia Memorial Hospital, Providence identified several key areas of need for Clatsop County:
21.5 percent of adults use tobacco products Nearly 30 percent of adults are obese 8.2 percent of grade 11 students attempted suicide one or more times during the past
12 months Over 40 percent of survey respondents have been diagnosed with a behavioral health
condition Two out of three survey respondents experienced at least one adverse life event 20 percent of the population is age 65 or over
These findings and more are helping us develop collaborative solutions to fulfill unmet needs for some of the most vulnerable groups of people in communities we serve. Our work is also informed by population demographics, which have been diversifying in Clatsop County, though the total population has remained relatively stable. The county is presently 83 percent white non-Hispanic, and by 2021 is expected to shift slightly to 81 percent white non-Hispanic. The current county population is 37,500, which represents slightly more than 5 percent growth since 2000.
Identifying top health priorities, together
There were several information sources used for this report, including State and County Public Health data, hospital utilization data, a Community Health Survey, key stakeholder interviews, and community listening sessions.

2 | P a g e
Community health measures in 2016
Prioritized need Measures for 2016
Access to care Fewer primary care providers per population than Oregon’s average Dental conditions are the second-most common reason adults and
children come to the Emergency Department Nearly 20 percent of survey respondents went without needed dental
care in the past year A growing need for culturally and linguistically appropriate services
Behavioral health Over 26 percent of adults suffer from depression A need for timely, affordable, and local substance use treatment services Over 25 percent of survey respondents experienced three or more
adverse life events
Chronic conditions Nearly 30 percent of adults are obese Hypertension and diabetes are the top two reasons vulnerable adults
use the Emergency Department Access to healthy, affordable food
Social determinants of health and well-being
Homelessness/affordable housing were top needs Many families struggle with a lack of living-wage jobs
Measuring our success: Results from our 2013 CHNA
This report also evaluates results from our most recent CHNA in 2013. Identified prioritized needs were: access to preventive and primary care; mental health and substance use treatment services; chronic conditions prevention and management; and oral health. Providence responded by making investments of time, resources and funding to programs that were most likely to have an impact on these needs. This summary includes just a few highlights from across the Clatsop County area.
Name Type of program Outcomes Our support
Greater Oregon Behavioral Health/ Clatsop Behavioral Healthcare
North Coast Crisis Respite Center
A new 16 bed crisis respite center to reduce burden on local law enforcement and unnecessary hospitalizations
In-kind technical assistance, grant funding
Helping Hands Re-Entry Outreach Centers
Housing and recovery services
413 individuals served (5,123 person-nights and 9,150 meals)
Funding, referral partnership
Project Access NOW Patient support program
Over 370 individuals served in Clatsop County since 2015
Funding, co-development of referral platform
Way to Wellville Community health improvement
500 families provided free access to parks, 130 health screenings conducted
Grant funding
This assessment helps and guides our community benefit investments, not only for our own programs but also for many nonprofit partners. Please join us in making our communities healthier.
Providence top priority health needs for
2016-2018
Access to care Behavioral health Chronic conditions
Social determinants of health and well-being

CLATSOP COUNTY, OREGON 2016 COMMUNITY HEALTH NEEDS ASSESSMENT

2
Table of Contents
A Letter from our Chief Executives ............................................................................................. 3
Our Intent ................................................................................................................................... 4
Purpose of collaboration ......................................................................................................... 4
Hospital Information ................................................................................................................ 4
Columbia Memorial Hospital ............................................................................................... 4
Providence Seaside Hospital .............................................................................................. 4
Sources of Information ............................................................................................................... 5
Primary Data .......................................................................................................................... 5
Secondary Data ...................................................................................................................... 5
Overview: Clatsop County .......................................................................................................... 5
Demographic Information ....................................................................................................... 5
Key Findings: Unmet Needs....................................................................................................... 7
Access to Care ....................................................................................................................... 8
Behavioral Health ................................................................................................................... 9
Chronic Conditions ................................................................................................................11
Social Determinants of Health and Well-Being ......................................................................12
Key Community Strengths and Assets ......................................................................................13
Next Steps ................................................................................................................................13
Appendix ...................................................................................................................................14
1: Letter of Agreement 2: Methods 3: CORE Community Health Survey report 4: Key stakeholder interview guide and participants 5: Community listening session guide (English) 6: Progress since last CHNA-Columbia Memorial Hospital 7: Progress since last CHNA-Providence Seaside Hospital
Cover Photo: Gary Halvorson, Oregon State Archives

3
A Letter from our Chief Executives
To our community:
It is with great pleasure we present the results of our 2016 Community Health Needs
Assessment. Our work to produce a shared assessment began in late 2015 and continued
through 2016 culminating in a shared resource for our county.
The following document is the result of a robust process that included surveys, public health
data, listening sessions, and interviews with many community members. Our hospitals are
proud of our work together in Clatsop County, and prouder still to serve you. Through listening
and partnership, our hospitals will use this assessment as the basis for our community benefit
activities and community health improvement plans over the next three years to address the key
areas of identified need:
• Access to Care • Behavioral Health • Chronic Conditions • Social Determinants of Health and Well-Being
Please read on to learn more about each of these areas and the categories within them. Our Thanks
Lastly, let us again express our gratitude to those of you who participated in this process. We
are grateful that so many in our county have a shared commitment to our community, and look
forward to addressing the needs discussed here over the next several years.
Sincerely,
Erik Thorsen Kendall Sawa Chief Executive Chief Executive Columbia Memorial Hospital Providence Seaside Hospital

4
Our Intent
Purpose of collaboration As noted in the Letter from our Executives, leaders from CMH and Providence began conversations in late 2015 regarding the opportunity to produce a shared Community Health Needs Assessment (CHNA). Historically, both hospitals have conducted and produced separate assessment documents, as did Public Health and the CCO. These assessments are mandated by different accrediting bodies, but there are many areas in which they overlap. Rather than having two separate CHNAs conducted for a shared geographic area, with different methods and criteria, CMH and Providence decided to work together to produce a shared assessment. This provides a shared set of priority issues that most impact health in Clatsop County, and prevents duplication of efforts.
Hospital Information
Columbia Memorial Hospital Columbia Memorial Hospital (CMH) is a full-service, 25-bed, critical access, not-for-profit, Level IV trauma center located at the mouth of the mighty Columbia River on the North Coast of Oregon. We have been serving the healthcare needs of our community for more than 135 years. Combined, our hospital and clinics employ over 600 caregivers and a diverse professional medical staff, including specialists ranging from cardiology to obstetrics. CMH is HFAP accredited and a Planetree-Designated Patient-Centered health system.
Providence Seaside Hospital Providence Health & Services is a Catholic health system founded by the Sisters of Providence with a Mission to “reveal God’s love for all, especially the poor and vulnerable, through our compassionate service.” Providence’s North Coast Service Area (NCSA) serves residents and visitors in Seaside, Warrenton and surrounding communities. Providence is the third largest employer in the county, with 360 employees. Providence Seaside Hospital is a full-service, 25-bed critical access hospital with: a 24-hour, seven-bed Emergency Department; four-bed Intensive Care Unit; three operating rooms; diagnostic imaging; and telehospitalist, eICU and telestroke services that receive additional clinical support from Providence’s Portland Service Area. Providence provides over $8,600,000 of Community Benefit in Clatsop County, including free and reduced cost care for families unable to pay and grants to community partners who are addressing unmet health needs.
Providence Medical Group operates three clinics in Clatsop County: PMG-Seaside, PMG-Cannon Beach, and PMG-Warrenton. Other programs include Providence Heart Clinic in Seaside and Astoria, Providence Oncology Cancer Care and Hematology clinic in Seaside, as well as Providence Rehabilitation Services and Providence Home Health Services in Gearhart. In 2015 Providence ElderPlace began offering Program for All-Inclusive Care of the Elderly (PACE) Services in the North Coast, and Providence Seaside Pharmacy.

5
Sources of Information The following provides high-level information of the data sources and process for constructing this document. It is intended to be a shared resource for the community and provided the basis for a shared Community Health Improvement Plan for the two hospital partners, Clatsop County Public Health, and Columbia Pacific CCO. Additional information regarding the methods and inclusion criteria for all of these sources is included in Appendix 2.
Primary Data Primary data is information that has been collected by the partners specifically for use in this assessment. They include hospital utilization data, a community health survey, key stakeholder interviews, and community listening sessions.
Secondary Data Secondary data is information that has been collected by other parties for purposes other than this assessment, but that provide important context or other data points. These include Clatsop County Public Health, Columbia Pacific CCO, County Health Rankings, Annie E. Casey Kids COUNT report, and others.
Overview: Clatsop County Initially home to the Chinook, Clatsop, and Kathlamet tribes, Clatsop County has held an important role in the history of Oregon and the Pacific Northwest. The Columbia River, with Washington State on its northern banks and Oregon to its south, feeds in to the Pacific Ocean here. Astoria, a major port city, was once a fur trading post and served as Lewis & Clark’s end point to their journey across the country. American farmers began settling the area in 1840, and shortly after that, the timber industry began and the Hume brothers opened the first of many fish canneries.
Demographic Information As of 2016, Clatsop County is home to just under 38,000 permanent residents, though the population swells to more than twice that during the summer months. The area’s median household income is $36,300 and the per capita income was below $20,000, substantially less than the State of Oregon as a whole ($49,260 and $26,171, respectively). Many houses in the county serve as second homes for families that live elsewhere, and are often used to generate a second income through vacation rental firms.
Findings from this assessment often refer to 200 percent Federal Poverty Guidelines (FPG) as a marker for household income. The table below provides a reference point for those values.
Household Size
100% FPG 200% FPG 201% FPG
1 11,880$ 23,760$ 23,879$ 4 24,300$ 48,600$ 48,843$
2016 Federal Poverty Guidelines

6
The county has an older population than average, with nearly 20 percent over the age of 65. Across the United States, individuals over the age of 65 make up about 15 percent of the population. The distribution is approximately even between females and males up until the age of 75 and above, at which point there are more surviving females than males. There is a “bubble” of the population between ages 55 and 64, suggesting that older populations may come to Clatsop County to retire, or purchase second homes in the area around that age. Clatsop County also has a lower birth rate than Oregon’s average, which contributes to the proportion of older residents being so high.
The vast majority (83 percent) of residents identify as white non-Hispanic. This percentage is expected to decrease to 81 percent by 2021 as the county diversifies. The greatest percentage change will be amongst Hispanic/Latino individuals and non-Hispanic Asian Pacific Islanders.
4000 2000 0 2000 4000
0-910-1718-2425-3435-4445-5455-6465-7475-84
85+
Clatsop County Population Structure, 2016
Female
Male
0 10000 20000 30000 40000 50000
2016
2021
Self-Reported Race/Ethnicity of Clatsop County Residents
White non-Hispanic
Black non-Hispanic
AI non-Hispanic
API non-Hispanic
Other non-Hispanic
2+ races non-Hispanic
Hispanic/Latino

7
Key Findings: Unmet Needs Based upon the various sources of information in this assessment, items that were corroborated by two or more sources were identified as key unmet health needs. These needs were then grouped into four actionable categories, which will guide our efforts in developing the Community Health Improvement Plan (CHIP). Due to the nature of initial identification of needs, this prioritization included worsening trends, values worse than state averages, and a disproportionate impact on communities of color, low-income, or otherwise marginalized groups.
Additional prioritization regarding feasibility, effectiveness of interventions, and ability to partner with community organizations will be applied during CHIP development.
The findings below are listed in alphabetical order; there is no prioritization based upon the way that they are listed. It important to note that there are many strengths that already exist within the community to address these challenges, which will also be noted in the respective sections. The major areas of need include:
Access to care—primary care, dental care, and culturally responsive care
Behavioral health—including access to mental health services, substance use treatment services, and trauma prevention
Chronic conditions—such as diabetes, obesity, and hypertension
Social determinants of health and well-being—including living wage jobs, affordable housing, and healthy food access
-2.0% -1.0% 0.0% 1.0%
% Change (2016-2021)
White non-Hispanic
Black non-Hispanic
AI non-Hispanic
API non-Hispanic
Other non-Hispanic
2+ races non-Hispanic
Hispanic/Latino

8
Access to care
Primary Care Clatsop County consistently ranks in the bottom fifth of counties in Oregon for Clinical Care as assessed by County Health Rankings. There are fewer physicians per capita than elsewhere in the state. Participants in the Community Listening Sessions recognized access to primary care as a challenge, particularly for low-income individuals. They did reflect that access has improved with the expansion of Medicaid, since more people now have access to insurance. The lack of access to primary care is also reflected through the hospital utilization data, which looks at conditions that should not require emergency care if primary care were available.
Additionally, over 6.3 percent of respondents to the Community Health Survey were uninsured and over 20 percent of respondents did not have a personal doctor. Approximately 20 percent of respondents reported needing care in the past 12 months but not getting all of the care they needed, with the major barrier being cost—particularly for individuals at or below 200 percent FPG.
Dental Care One of the major challenges and reasons for emergency department utilization continues to be dental conditions, including dental pain and dental caries (cavities). A 2015 study by Oregon Health & Science University found that dental pain and cavities are one of the top reasons students miss school in Oregon, and is the most prevalent chronic condition for children. Participants in the Community Listening Sessions also recognized the need for more dental services, particularly for individuals who are not covered by OHP.
19.4 percent of survey respondents reported having to go without dental care over the past 12 months due to concerns about meeting basic needs. This was true for nearly 35 percent of respondents who reported being at or below 200 percent FPG.
0%10%20%30%40%50%60%70%80%90%
100%
Insured No insurance Got all careneeded
Did not get all careneeded
Insurance Needed Care
Community Health Survey Respondents

9
Culturally responsive care While Clatsop County is majority White non-Hispanic, individuals from other cultures and lifestyles discussed the need for more culturally sensitive care, including Spanish-speaking providers. Some participants from the Community Listening Sessions also mentioned the need for increased understanding and sensitivity from providers for individuals who are homeless or suffer from addictions disorders.
Behavioral health
Mental Health Services There is a shortage of mental health providers in Clatsop County, but this need is specifically recognized as more than an access issue due to the depth of the challenge. There are fewer mental health professionals per capita than the state average, and a slightly higher than average age-adjusted rate of depression (26.6 percent in Clatsop County compared to 24.8 percent in Oregon).
The Community Health Survey identified 12 percent of respondents currently experiencing symptoms of anxiety, and 11 percent of depression. Low-income and Medicaid or uninsured individuals were far more likely than their counterparts to be experiencing symptoms of depression. Over 30 percent of survey respondents noted having been diagnosed with depression and nearly 27 percent with anxiety.
The majority of respondents noted that they received behavioral health services through a primary care clinic, and 8 percent of those who needed it noted being unable to receive all of the
0.0% 5.0% 10.0% 15.0% 20.0% 25.0%
<200% FPL
>200% FPL
Medicaid/Other/Uninsured
Medicare
Private
Inco
me
Insu
ranc
e
Current Symptoms of Depression or Anxiety
Depression
Anxiety
What do we need? We need more opportunities for this. We need people to listen
to us, and talk to us, and recognize that we know more about our experience than
textbooks teach you.

10
mental health care they needed. The primary barrier in these cases were people not knowing where to go and not having a regular provider.
Substance use services This challenge came up as a need during the key stakeholder interviews, listening sessions, and through the survey. While a small portion of the survey population noted needing substance abuse treatment services, of those who needed it over 36 percent reported not being able to get all the care they needed. This was also a theme in the key stakeholder interviews, particularly a lack of access to in-patient treatment programs.
Participants in the listening sessions discussed the need for local medication-assisted treatment (i.e. methadone) as well as affordable treatment options and diversion programs. Participants specifically discussed that going into Portland for treatment almost always resulted in relapse due to accessibility and lack of supportive systems. Key stakeholders noted that demand for services has increased over 60 percent in the past 3 years, particularly for recovery programs.
Adverse Experiences and Trauma Prevention The Community Health Survey was one of the first tools to be able to provide information on the prevalence of trauma exposure in Clatsop County. Adverse life experiences and exposure to trauma at any point in the life-course, particularly childhood, are known to impact health outcomes, educational attainment, chronic conditions, and likelihood of substance use. Over 66 percent of survey respondents have experienced one adverse life event, and just over 25 percent have experienced three or more. Key stakeholders interviewed discussed intergenerational trauma as a key concern.
Survey respondents were assessed for their access to social support systems, which have been shown to build resilience and increase well-being. Individuals who were at or below 200 percent FPG and those who are on Medicaid or uninsured were less likely to have support systems in place.
33%
50%
19%
Adverse life experience prevalance amonst survey respondents
None
One or two
Three or more

11
Chronic conditions Chronic conditions is a broad category of need that is influenced by environment and individual health behaviors. Clatsop County Public Health found in their CHIP that residents have higher rates of cancer, asthma, and high blood pressure, as well as increased risk for developing heart disease. Individuals in Clatsop County are 7 percent more likely to have one or more chronic conditions when age-adjusted and compared with other counties.
Diabetes Diabetes is one of the top diagnosed conditions for Columbia Pacific CCO members, and had the most patient encounters in their service region in 2014 based upon their most recent assessment. 14.5 percent of survey respondents reported having been told by a doctor that they had diabetes. The 2010-2013 Oregon Behavioral Risk Factor Surveillance Survey (BRFSS) found that age-adjusted rate of diabetes was higher than the state average (9.7 percent in Clatsop County, 8.5 percent across the state).Type 2 Diabetes is the second most common reason for preventable Emergency Department visits in Clatsop County, indicating opportunities for education and outreach regarding diabetes management.
Obesity 29.1 percent of Clatsop County residents are obese, compared to 25.9 percent in Oregon according to Public Health data. Based upon responses to the survey, approximately 28 percent of respondents were overweight and nearly 43 percent were obese.
Childhood obesity was of particular concern to several key stakeholders that participated in interviews, particularly due to its life-course impacts. Many stakeholders connected obesity prevalence with sugar intake, lack of physical activity, and limited access to nutritious food.
Hypertension Hypertension (high blood pressure) is the most common reason for preventable emergency department utilization amongst uninsured and Medicaid-enrolled adults in Clatsop County, accounting for over 550 visits and nearly 300 unique patients during the study period. Nearly 45 percent of survey respondents reported that they had been told by a doctor that they had high blood pressure, including approximately 64 percent of Medicare-enrolled respondents and 40 percent of those enrolled in private insurance. Nationally, approximately 29 percent of adults have hypertension.
I heard we can’t expect our children to live any longer than we will these days. It’s our job to help them be healthy…that means more time outside and less time with screens. Heck, that would be better for everyone, not just kids.

12
I wish we could get to know each other, especially the homeless, and realize we
are all human beings living together.
Social determinants of health and well-being This is a broad category that looks at the environment and other factors that helps keep people well. The social determinants of health is a model for looking at opportunities for health wherever people live, work, learn, and play. These issues are generally referred to as “upstream” solutions, in that they help keep people well and can help prevent chronic illnesses.
Affordable housing The top need discussed in the key stakeholder interviews and listening sessions was the need for more affordable housing. Of particular concern were the number of privately-owned rental properties that sit unoccupied, limited apartment rentals, and need for felony-friendly housing. Through recent studies across the nation, there has been a clear connection drawn between housing and health outcomes, particularly related to chronic condition management and
incidence of asthma.
Over 15 percent of survey respondents noted having housing and being worried about losing it or not having stable housing. These responses were particularly common amongst households that are at or below 200 percent FPG and those enrolled in Medicare, Medicaid, or are currently uninsured.
Healthy food access This is a challenge that crosses over between healthy living and diet-related chronic conditions, and falls within the social determinants. Just over 50 percent of survey respondents reported having fewer than two servings of fruit per day, which disproportionately impacts Medicaid and Medicare enrollees, as well as uninsured. 42 percent of respondents reported consuming fewer than two servings of vegetables per day, but there was no statistical difference between the sub-populations assessed. As a whole, BRFSS results suggest Clatsop County’s age-adjusted rate of fruit and vegetable consumption is actually slightly higher than the state average.
Living wage jobs As previously noted in the demographics section, the median household income in Clatsop County is 34 percent below the State’s median household income. This need was also made apparent in the listening sessions and stakeholder interviews, as well as through the Community Health Survey. Many people work multiple jobs in the service industry but still struggle to make ends meet. Participants also expressed the need for affordable child care, which would allow them to work more or go back to school to continue their education.
I wish I could find work with consistent hours so that I could spend time with my family. Some days I don’t even get to see
my kids, and I never know what hours I’ll be scheduled to work ahead of time. It makes planning very hard.

13
Most people noted that jobs simply were not available, particularly after the turn of the timber industry. One listening session participant noted that “almost always, there will be someone willing to work more cheaply than you. That’s the person they’ll take.” Without living wage jobs, families struggle to contribute productively to the local economy.
Key Community Strengths and Assets Throughout the assessment process, we asked about the strengths that already exist within Clatsop County. We heard about many resources and assets that are working to meet some of the needs listed above. Some of the most common resources discussed were:
• Astoria Warming Center • Clatsop Behavioral Health and the crisis respite center • Clatsop Community Action • Clatsop County Sherriff and the police departments • Coast Guard • Community colleges • DHS • Food pantries • Head Start • Helping Hands Re-Entry Outreach Centers • Local community leaders and elected officials • Lower Columbia Hispanic Council • Medical Teams International mobile dental program • Parks and Recreation • Transportation Services • Way to Wellville programs • Women, Infants & Children (WIC) program
Next Steps Based upon the results of this report, partners will produce a Community Health Improvement Plan. Because this is a shared assessment, partner organizations have agreed to use these same categories to set priorities for community benefit investment and coordinated community outreach. The improvement plans will be available no later than Summer 2017.

Appendix 1: Letter of Agreement


Appendix 2: Methods and acknowledgements Based upon the various sources of information in this assessment, items that were corroborated by two or more sources were identified as key unmet health needs. These needs were then grouped into four actionable categories, which will guide our efforts in developing the Community Health Improvement Plan. Due to the nature of initial identification of needs, this prioritization included worsening trends, values worse than state averages, and a disproportionate impact on communities of color, low-income, or otherwise marginalized groups.
Additional prioritization regarding feasibility, effectiveness of interventions, and ability to partner with community organizations will be applied during CHIP development.
Primary Data Collection This is information that has been collected by either CMH or PSH for the purposes of this assessment.
Hospital Utilization Data In order to help assess major barriers to care, both hospitals looked at a list of diagnostic codes called “Ambulatory Care Sensitive Conditions” (ACSCs). These are conditions that should not require a hospital visit with improved access to primary care. Both hospitals provided the top five diagnosed conditions for uninsured (self-pay) and Medicaid individuals using the Emergency Department between April 1, 2014 and March 31, 2015. These individuals had to have an address in Clatsop County in order to be included. This information is not generalizable to the full population as it is a specific sub-population with a specific set of diagnostic codes recorded, but it does provide important perspective into some of the conditions that could benefit from public service campaigns, partnership with public health, or other prevention activities.
Community Health Survey Providence’s Community Health Division contracted with the Center for Outcomes Research and Education (CORE) to conduct a Community Health Survey as part of this CHNA. CMH leadership provided feedback and requested some additional sections be added to the survey before it was administered. A copy of the full survey can be found in Appendix 3. The survey was mailed to 875 households in Clatsop County based on a random sample of residential addresses and included questions relating to health behaviors, health care access, barriers to care, social cohesion, and others. 206 surveys were returned, a 23.5 percent response rate. Based upon the self-reported demographics of respondents, a sample weight was applied to make responses representative of the county based on age distribution. A complete report of CORE’s findings is included in Appendix 3, with many of the findings from the survey highlighted throughout this report.
Key Stakeholder Interviews Representatives from PSH and CMH met with leaders across Clatsop County to conduct structured interviews. These representatives included business owners, school representatives, social service agency leaders, and elected officials. These individuals were able to speak on behalf of the population they serve through their professional career and provide additional

perspective on the most pressing needs of the community. A complete list of interview participants and the question guide used is available in Appendix 4.
Community Listening Sessions Over the course of the fall, CMH and PSH hosted four community listening sessions. These were most often co-hosted by social service agencies and provided an opportunity to hear directly from some of the most marginalized members of the county. A copy of the discussion guide is attached in Appendix 5. Host organizations included Helping Hands Re-Entry Outreach Centers, Columbia Memorial Hospital’s Patient and Family Advisory Council, Lower Columbia Hispanic Council, Astoria High School Health Occupation Students, and Astoria Warming Center. The key themes from these sessions are highlighted in the Key Findings section of this report.
Secondary Data Collection Secondary data is information that has already been collected and analyzed by different groups or people for reasons other than this needs assessment. Sources of secondary data include Clatsop County Public Health data and information, Columbia Pacific Coordinated Care Organization’s most recent Community Health Assessment, and other public data sources such as the Oregon Healthy Teens Survey, Annie E. Casey Foundation Kids COUNT, and Oregon Department of Education.
Clatsop County Public Health In 2013, Clatsop County Public Health (CCPH) produced a Community Health Improvement Plan (CHIP) as part of its accreditation process. Where appropriate, information from that document has been included or updated. Other public health data available through the Oregon Health Authority includes the Behavioral Risk Factor Surveillance Survey (BRFSS) noted in this report.
Columbia Pacific CCO In 2014, Columbia Pacific CCO conducted a Community Health Assessment. Where appropriate, information from that assessment is included and/or updated in this report. CPCCO provides health insurance coverage for individuals in Clatsop and Columbia counties that are enrolled in the Oregon Health Plan (Medicaid). These individuals are at or below 138 percent FPG and make up 30 percent of the county’s population.
Acknowledgements
This report was prepared by Megan McAninch-Jones (Providence) and Randy McClelland (Columbia Memorial). We are grateful for the support of Mary Stoneman and Cindy Nemlowill for their facilitation of key stakeholder interviews and community listening sessions.

Appendix 3: CORE Community Health Survey and Report

PAGE COMMUNITY HEALTH SURVEY: NORTH COAST SERVICE AREA—9/30/16
PREPARED BY:
JB Rinaldi
Lindsay Dickey
Kris n Brown
Keri Vartanian
Cassandra Robinson
Bill Wright
COMMUNITY HEALTH SURVEY 2016:
NORTH COAST SERVICE AREA
TABLE OF CONTENTS:
Execu ve Summary…………….. p. 2
Methods……………………………...p. 3
Demographics…………………….. p. 4
Health Status………………………. p. 6
Access to Care……...………..…...p. 9
Social Determinants……………..p. 14
Trauma………………………….……. p. 17
Health Behaviors .…………..….. p. 18
Summary of Findings…………...p. 20
Appendix……………………………..p. 21

PAGE 2 COMMUNITY HEALTH SURVEY: NORTH COAST SERVICE AREA—9/30/16
EXECUTIVE SUMMARY
COMMUNITY HEALTH SURVEY: NORTH COAST SERVICE AREA
PROJECT OVERVIEW
This report gives an overview of results from the North Cost Service Area community health survey. The Center for Outcomes
Research and Educa on (CORE) fielded the surveys in May ‐ June 2016. We sent the survey to a random sample of 875 house‐
holds in the North Coast Service Area; 206 surveys were returned, giving a response rate of 23.5% . The survey was designed to
assess community needs within the following key domains of interest: Health Status, Access to Care, Social Determinants of
Health, Trauma, and Health Behaviors.
Results from the North Coast Service Area Community Health Survey depicts a popula on that faces a high disease burden and a
significant lack of access to care— especially behavioral health care. Addi onally, a sizeable por on of the community struggles
to make ends meet, and do not always have social support to assist them in that struggle. In a community where so many are sick,
health care can become a catalyst for community‐level change. Primary care homes can become gathering spaces— hubs for
wellness programming, peer support, and community involvement.
A random address‐based sample for a mail survey is an excellent means of ensuring that survey responses can be generalized —
but those generaliza ons apply best to people who have stable addresses and who speak English. Addi onal outreach in priority
popula ons — including transi onal youth, the Hispanic/La no community, and those facing housing insecurity — is cri cal for
future needs assessments and improvement planning.
KEY FINDINGS
ACCESS TO
CARE
6.3% of respondents are uninsured; 21.4% do not have a
personal provider. 20.1% went without needed health
care in the past year. 40.0% of those who needed behav‐
ioral health care in the last year did not get all the care
they needed. The primary reason for going without need‐
ed care was not having a usual source of care.
SOCIAL
DETERMI‐
NANTS
15.2% of respondents do not have stable housing. 7.3%
of low‐income respondents had gone without food within
the past 12 months and 11.7% had gone without u li es.
Social support was lower among low‐income respondents.
66.1% of respondents had experienced at least one trau‐
ma c event.
HEALTH
STATUS
67.2% of respondents have a chronic physical health con‐
di on and 40.3% have a behavioral health condi on. High
blood pressure and high cholesterol are the most common
diagnoses. 27.8% of respondents are overweight, and
42.7% are obese. 12.2% report current symptoms of anxi‐
ety, and 11.1% report current symptoms of depression.
RECOMMENDATIONS
Enrolling and engaging community members in primary
care homes could facilitate access to needed care. Increas‐
ing the number of providers may also improve access. Con‐
sidering the prevalence of chronic disease, peer support
programs may be a feasible method of improving access and
social support.
Programs to promote and support physical ac vity and
healthy ea ng habits may reduce the impact of chronic dis‐
ease in the North Coast service area. Integra ng behavioral
health care and primary care could help serve those who
currently face mul ple comorbidi es.
Trauma‐informed care could support the needs of a popula‐
on with a significant trauma and mental health burden.
Integra ng health care with social services (e.g. the Commu‐
nity Resource Desk model) could simultaneously improve
engagement in health homes and support community
members in mee ng basic needs.

PAGE 3 COMMUNITY HEALTH SURVEY: NORTH COAST SERVICE AREA—9/30/16
METHODS
This report summarizes results from a community health survey. The purpose of this survey was to assess health status and health
needs throughout the community, including needs related to the social determinants of health. The survey was conducted by
CORE in May and June 2016.
SURVEY DESIGN AND SAMPLE
Community Health Division worked with CORE to design a base survey consis ng of 36 ques ons. The team also created a list of
91 op onal survey ques ons; North Coast Service Area leadership including representa ves from Clatsop County Public Health
and Columbia Memorial Hospital, selected an addi onal 9 ques ons to add to the survey. The added ques ons collected infor-
ma on about access to behavioral health care services, access to health care for children, and neighborhood cohesion. Most sur-
vey items were selected from na onally validated tools; a copy of the survey is available in the appendix. Spanish transla on was
performed by a cer fied translator. Surveys and invita on le ers went under plain-language review.
MAIL SURVEY SAMPLE. We used address-based sampling to capture a representa ve group of households in the community.
Beginning with a list of all deliverable residen al addresses in the community, we randomly selected 875 households to receive
the survey. We referred to Census data from 2010-2014 to iden fy zip codes where at least 10% of households reported that
Spanish was spoken at home. Addresses within these zip codes received surveys in both English and Spanish. Because the survey
used a random sample of households in the North Coast Service Area, mail survey results should be broadly representa ve of
health care needs for those who have addresses. No Spanish-language mail surveys were returned. 206 mail surveys were re-
turned in total, for a response rate of 23.5%.
FIELDING
The mail survey was fielded between May and June 2016 using two waves of fielding supported by automated phone calls.
For par cipants with valid phone numbers, we sent an automated phone message asking par cipants to look for the survey in the mail and call us with any ques-
ons.
INITIAL AUTO CALL
An ini al survey was sent with a le er explaining the purpose of the study, the survey and a postage-paid return envelope and a $5 cash compensa on. Areas with a high enough Spanish popula on also re-ceived a Spanish le er and survey.
INITIAL SURVEY
A second automated phone message was sent to par ci-pants who did not return the ini al survey and had a valid phone number informing them we did not receive their survey and we were sending a second one.
SECOND AUTO CALL
A second survey was sent to par cipants that did return the ini al survey. Fielding closed on July 1st, 2016.
SECOND SURVEY
MULTI‐STAGE MAIL SURVEY PROCESS
1 2 3 4

PAGE 4 COMMUNITY HEALTH SURVEY: NORTH COAST SERVICE AREA—9/30/16
RESPONDENT DEMOGRAPHICS
The table below gives the un-weighted distribu on of respondents to the mail survey.
RESPONDENT DEMOGRAPHICS % NUMBER OF
SURVEYS
RESPONDENT DEMOGRAPHICS %
NUMBER OF
SURVEYS
GENDER HOUSEHOLD INCOME
Male 43.7% 90 100% FPL or lower 14.6% 30
Female 54.4% 112 101% to 200% FPL 15.5% 32
Transgender 0.0% 0 201% FPL or higher 48.5% 100
AGE EDUCATION
18 to 39 years 9.2% 19 Less than high school 2.9% 6
40 to 64 years 30.1% 62 High school diploma or GED 31.1% 64
65 to 79 years 38.8% 80 Voca onal or two year degree 30.6% 63
80+ years 18.4% 38 4-year college degree or more 32.0% 66
RACE & ETHNICITY EMPLOYMENT STATUS
White, non-Hispanic 92.7% 186 Employed 36.3% 73
Hispanic or La no 1.0% 2 Not Employed 4.9% 10
Na ve American 0.5% 1 Re red 57.3% 118
Mul ple Race 3.4% 7 EMPLOYMENT LEVEL
PREFERRED LANGUAGE Less than 20 hours per week 12.3% 9
English 99.0% 204 20 or more hours per week 80.8% 59
Other 0.5% 1
These response pa erns are not uncommon in mail surveys. Enhanced outreach into diverse communi es, where language or
cultural barriers may serve to suppress response rates, could reduce these discrepancies. Future survey efforts could build in
enhanced outreach to ensure be er overall representa veness.
NOTE: Due to non‐responses, some sec ons do not add up to 100%.

PAGE 5 COMMUNITY HEALTH SURVEY: NORTH COAST SERVICE AREA—9/30/16
METHODS
WEIGHTING OF RESULTS
The racial/ethnic profile of respondents was primarily older and non-Hispanic white, compared to census es mates for the overall
popula on (below). Respondents who iden fied as Hispanic or La no could also iden fy as white; the categories are not mutually
exclusive.
DEMOGRAPHICS CENSUS
ESTIMATE DIFFERENCE
DEMOGRAPHICS
CENSUS
ESTIMATE DIFFERENCE
RACE & ETHNICITY AGE
White 91.1% +1.6% 18 to 39 years 33.0% -23.8%
Hispanic 8.6% -7.6% 40 to 64 years 44.0% -13.9%
Black or African-0.7% -0.7% 65 to 79 years 17.0% +21.8%
Mul ple Race 4.1% -0.7% 80+ years 7.0% +11.4%
MAIL SURVEY
RESPOND‐
ENTS
92.7%
1.0%
0.0%
3.4%
MAIL SURVEY
RESPONDENTS
9.2%
30.1%
38.8%
18.4%
ANALYSIS
We entered all data in tabular form and analyzed it with a sta s cal so ware package (SAS). To test for sta s cally significant
differences between subgroups in our data, we used two-tailed chi-square tests of associa on adjusted for weigh ng, with a p-
value of .10 or less considered as “sta s cally significant.” The significance test is not valid for variables where expected cell sizes
are small; in these cases the table cells have been shaded gray.
For each survey ques on, we report the total weighted percentage of respondents who indicated a par cular answer. We then
report response rates by race/ethnicity, income, and insurance.
Because few respondents iden fied as Na ve American, Black or African-American, Na ve Hawaiian or Other Pacific Islander, or
Asian, we were not able to break down results further than Non-Hispanic White and Hispanic/La no/Other. For similar reasons,
we combine several types of respondents — including dual-eligible and those with military insurance— into the “Medicaid/Other/
Uninsured” category. We present results broken down by income in two categories: “lower-income,” defined as at or below 200%
of the Federal Poverty Level (FPL) based on household size and self-reported income and “higher-income,” defined as at or higher
than 201% FPL.
For each subpopula on, we report the actual number of survey respondents in that category who responded to each ques on.
Not all respondents answered every ques on; for that reason, the n for a subpopula on varies by ques on.
MAIL SURVEY RESPONDENTS

PAGE 6 COMMUNITY HEALTH SURVEY: NORTH COAST SERVICE AREA—9/30/16
HEALTH STATUS
OVERALL HEALTH & DISEASE PREVALENCE
OVERALL HEALTH: 20.2% of respondents rated their overall health as “Fair” or “Poor” (as opposed to Good, Very Good, or Ex-
cellent). We saw evidence of sta s cally significant differences in subjec ve health based on income and insurance status.
Q17: Self‐Reported Overall Health
(Fair or Poor vs Good, Very Good, or
Excellent)
TOTAL
RACE/ETHNICITY INCOME INSURANCE
Non-
Hispanic
White
Hispanic/
La no/
Other
200% FPL
or lower
201% FPL
or higher
Medicaid/
Other/
Uninsured
Medicare Private
n=182 n=10 n=60 n=99 n=48 n=97 n=52
Percent Fair or Poor 20.2% 18.8% 63.8% 34.8% 11.7% 25.8% 29.7% 11.3%
CHRONIC DISEASE: 67.2% of respondents reported having been diagnosed with a chronic physical condi on, and 40.3% report a
chronic behavioral health condi on. The most common chronic condi ons reported by the North Coast Service Area popula on
were high blood pressure (44.7%) and high cholesterol (36.4%). Low-income respondents were more likely (33.6%) to have asth-
ma than those with incomes above 200% FPL. Medicare beneficiaries were more likely to have a physical health condi on, espe-
cially high blood pressure and high cholesterol. All prevalence es mates are age-adjusted.
DISPARITY FLAG: An orange box indicates a sta s cally significant disparity in results by subgroup. (two‐tailed chi‐square test, p<0.10)
Differences among subgroups should not be considered sta s cally significant unless indicated by an orange box. The significance test is not
valid for variables where expected cell sizes are small; in these cases the table cells have been shaded blue‐gray.
Q18. Have you ever been told by a
doctor or other health professional
that you have any of the following?
Mark all that apply.
TOTAL
RACE/ETHNICITY INCOME INSURANCE
Non-
Hispanic
White
Hispanic/
La no/
Other
200% FPL
or lower
201% FPL
or higher
Medicaid/
Other/
Uninsured
Medicare Private
n=184 n=10 n=62 n=99 n=48 n=98 n=52
High Blood Pressure 44.7% 44.1% 23.5% 41.8% 43.9% 37.2% 63.7% 39.7%
High Cholesterol 36.4% 34.4% 27.3% 35.3% 33.8% 30.8% 57.1% 29.2%
Depression 29.4% 29.0% 46.8% 31.4% 27.2% 34.2% 29.5% 23.8%
Anxiety 26.9% 28.1% 16.5% 31.4% 25.8% 34.7% 21.3% 23.8%
Asthma 16.0% 15.7% 38.6% 33.6% 7.0% 16.5% 17.4% 15.5%
Diabetes 14.5% 14.0% 3.8% 17.7% 10.4% 17.1% 14.7% 12.7%
PTSD 9.6% 8.8% 12.6% 11.7% 6.6% 11.9% 11.8% 5.5%
Another mental health condi on 6.5% 5.3% 12.6% 12.3% 3.0% 6.9% 12.5% 3.2%
At least 1 physical condi on 67.2% 66.4% 74.7% 67.4% 65.0% 58.0% 88.8% 62.6%
At least 1 mental health condi on 40.3% 41.1% 50.6% 45.0% 38.2% 47.8% 34.4% 36.5%
At Least 1 mental health condi on
AND physical chronic condi on 27.4% 27.4% 38.0% 36.5% 21.1% 32.6% 30.6% 21.5%

PAGE 7 COMMUNITY HEALTH SURVEY: NORTH COAST SERVICE AREA—9/30/16
HEALTH STATUS
ANXIETY AND DEPRESSION SYMPTOMS
The survey included a short series of ques ons designed to assess whether a respondent might currently be experiencing symp-
toms of anxiety or depression (as opposed to having received a diagnosis of depression). We found that 12.2% of respondents
reported currently experiencing symptoms of anxiety, and 11.1% reported ac ve symptoms of depression. Low-income respond-
ents and those in the Medicaid/Other/Uninsured category were more likely to report current symptoms of depression.
Q19: Symptoms of Anxiety or De‐
pression (GAD‐2 and PHQ‐2 Screen‐
ing Tools).
TOTAL
RACE/ETHNICITY INCOME INSURANCE
Non-
Hispanic
White
Hispanic/
La no/
Other
200% FPL
or lower
201% FPL
or higher
Medicaid/
Other/
Uninsured
Medicare Private
n=167 n=9 n=56 n=95 n=42 n=91 n=49
12.2% 13.3% 0.0% 17.9% 10.1% 12.7% 14.6% 10.8% Current symptoms of anxiety
Current symptoms of depression 11.1% 12.0% 0.0% 21.9% 3.5% 21.6% 12.3% 3.3%
DISPARITY FLAG: An orange box indicates a sta s cally significant disparity in results by subgroup. (two‐tailed chi‐square test, p<0.10)
Differences among subgroups should not be considered sta s cally significant unless indicated by an orange box. The significance test is not
valid for variables where expected cell sizes are small; in these cases the table cells have been shaded blue‐gray.
OBESITY/BMI
The survey asked respondents to report their height and weight, which allowed us to calculate self-reported Body Mass Index
(BMI). We used these data to es mate age-adjusted es mates of overweight and obesity rates. More than two-thirds (70.5%) of
survey respondents reported BMIs that put them in the overweight or obese categories. Medicare beneficiaries were more likely
to fall into the overweight category; those in the Medicaid/Other/Uninsured category were more likely to be obese.
Q35‐36: Body Mass Index (Based on
Self Reported Height and Weight) TOTAL
RACE/ETHNICITY INCOME INSURANCE
Non-
Hispanic
White
Hispanic/
La no/
Other
200% FPL
or lower
201% FPL
or higher
Medicaid/
Other/
Uninsured
Medicare Private
n=178 n=10 n=60 n=97 n=44 n=97 n=48
42.7% 40.5% 67.1% 45.0% 43.8% 46.2% 34.3% 45.2% Obesity (BMI 30+)
Overweight (BMI 25‐29) 27.8% 29.2% 25.3% 32.6% 24.6% 26.7% 46.4% 18.4%

PAGE 8 COMMUNITY HEALTH SURVEY: NORTH COAST SERVICE AREA—9/30/16
HEALTH STATUS
CHRONIC DISEASE AMONG CHILDREN
We also asked respondents about the health of their children. Overall, 25.5% of respondents reported that they had children un-
der 18 years of age (n=24); of those, 25.3% reported that at least one of their children had a chronic physical health condi on and
30.5% reported either a behavioral/mental health or developmental delay diagnosis. The most common physical illness among
children was asthma, with 24.7% of respondents who have children under 18 repor ng a diagnosis for at least one of their chil-
dren. The most common mental health diagnosis among children was anxiety; 17.1% of respondents with children report that at
least one of their children had received an anxiety diagnosis. Low-income parents were more likely (45.3%) than parents with in-
comes above 200% FPL to report that at least one of their children had a physical health condi on. Those with private insurance
were more likely (39.2%) to report that their child had a physical health condi on than those in the Medicaid/Other/Uninsured
category or those with Medicare. The difference in asthma rates by income was also significant: 45.3% of low-income parents re-
ported that at least one of their children had asthma, compared to 10.8% of those with incomes above 200% FPL.
* We did not report results when five or fewer respondents from a subgroup answered the ques on.
DISPARITY FLAG: An orange box indicates a sta s cally significant disparity in results by subgroup. (two‐tailed chi‐square test, p<0.10)
Differences among subgroups should not be considered sta s cally significant unless indicated by an orange box. The significance test is not
valid for variables where expected cell sizes are small; in these cases the table cells have been shaded blue‐gray.
Q28. Have you ever been told by
a doctor or other health profes‐
sional that any of your children
have the following? Mark all that
apply.
TOTAL
RACE/ETHNICITY INCOME INSURANCE
Non-
Hispanic
White
Hispanic/
La no/
Other
200% FPL
or lower
201% FPL
or higher
Medicaid/
Other/
Uninsured
Medicare Private
n=52 n=4 n=19 n=27 n=14 n=21 n=21
Asthma 24.7% 17.6% * 45.3% 10.8% 9.5% 0.0% 39.2%
A behavioral health or mental
health diagnosis 17.7% 12.7% * 30.2% 10.8% 0.0% 19.5% 25.7%
Anxiety 17.1% 12.0% * 24.9% 14.4% 7.3% 15.9% 22.3%
A developmental delay or learn‐
ing disability 14.3% 8.8% * 24.9% 7.2% 2.2% 31.2% 15.4%
Depression 11.8% 5.9% * 19.7% 7.2% 7.3% 31.7% 8.5%
Another ongoing health condi on 9.3% 5.2% * 18.1% 3.6% 7.3% 3.7% 11.9%
Diabetes 6.0% 1.4% * 14.4% 1.1% 2.2% 3.7% 8.5%
PTSD 4.8% 0.0% * 12.8% 0.0% 0.0% 0.0% 8.5%
At least 1 physical condi on 25.3% 18.3% * 45.3% 11.9% 9.5% 3.7% 39.2%
At least 1 mental health condi on 30.5% 27.6% * 42.2% 25.1% 16.7% 47.0% 32.6%

PAGE 9 COMMUNITY HEALTH SURVEY: NORTH COAST SERVICE AREA—9/30/16
ACCESS TO CARE
Q1: Do you currently
have any kind of health
insurance?
TOTAL
RACE/ETHNICITY INCOME
Non-
Hispanic
White
Hispanic/
La no/
Other
200% FPL
or lower
201% FPL
or higher
n=181 n=10 n=62 n=99
No 6.3% 6.4% 12.6% 7.4% 5.8%
INSURANCE COVERAGE
The rate of uninsured was 6.3% among survey respondents: 93.7% of respondents reported that they are currently insured;
43.0% are privately insured ,24.0% are on Medicare, 14.9% are on Medicaid or are dual-eligible, and 11.9% report having mili-
tary or other insurance. Of those who reported that they are not currently insured, three out of four (75.3%) said that cost was a
key barrier.
DISPARITY FLAG: An orange box indicates a sta s cally significant disparity in results by subgroup. (two‐tailed chi‐square test, p<0.10)
Differences among subgroups should not be considered sta s cally significant unless indicated by an orange box. The significance test is not
valid for variables where expected cell sizes are small; in these cases the table cells have been shaded blue‐gray.
Q4 and Q6: Usual Place of Care, Per‐
sonal Health Care Provider TOTAL
RACE/ETHNICITY INCOME INSURANCE
Non-
Hispanic
White
Hispanic/
La no/
Other
200% FPL
or lower
201% FPL
or higher
Medicaid/
Other/
Uninsured
Medicare Private
n=185 n=10 n=62 n=99 n=50 n=97 n=52
5.5% 5.7% 0.0% 9.0% 3.2% 12.4% 0.0% 3.7% Do not have a place for care that is
not an emergency
Do not have a personal doctor 21.4% 19.0% 12.6% 24.8% 20.7% 28.5% 14.9% 20.3%
CONNECTION TO CARE
Most respondents had a usual source of care: only 5.5% of respondents reported that they do not have a place to go for health
care when it is not an emergency. However, more than one in five (21.4%) of all respondents reported that they do not have a
person that they think of as their personal doctor or health care provider. We did not find significant differences in connec on to
care by subpopula on.
Q2: What kind of insurance do you
have? (n=201)
Private Insurance 43.0%
Medicare 24.0%
Medicaid/Dual‐Eligible 14.9%
Uninsured 6.3%
Military/ Other Insurance 11.9%

PAGE 10 COMMUNITY HEALTH SURVEY: NORTH COAST SERVICE AREA—9/30/16
ACCESS TO CARE
USUAL SOURCE OF CARE—ADULT PRIMARY CARE
Nearly two out of three (60.4%) respondents reported that their usual source of care was a private doctor’s office or clinic. The
next most common answers were an urgent care clinic (12.3%) and a public health clinic or community clinic (11.2%). While we
did observe different trends in usual source of care by subpopula on, these differences were not sta s cally significant.
Q5: Usual source of primary care for
adults TOTAL
RACE/ETHNICITY INCOME INSURANCE
Non-
Hispanic
White
Hispanic/
La no/
Other
200% FPL
or lower
201% FPL
or higher
Medicaid/
Other/
Uninsured
Medicare Private
n=160 n=9 n=51 n=90 n=41 n=85 n=46
60.4% 59.3% 66.7% 54.3% 60.6% 32.1% 71.6% 71.8% Private doctor’s office or clinic
Urgent care clinic 12.3% 11.5% 4.4% 14.4% 14.1% 8.9% 6.9% 18.0%
Public health or community health
clinic 11.2% 11.8% 14.5% 20.8% 5.0% 25.5% 8.0% 4.2%
Hospital‐based clinic 7.9% 8.1% 14.5% 3.9% 10.1% 8.8% 9.6% 6.0%
VA clinic 5.5% 6.2% 0.0% 0.7% 8.9% 18.2% 1.0% 0.0%
Some other place 2.4% 2.7% 0.0% 5.9% 0.9% 6.6% 2.0% 0.0%
Hospital emergency room 0.2% 0.3% 0.0% 0.0% 0.4% 0.0% 1.0% 0.0%
Q11: Usual source of behavioral
health care for adults TOTAL
RACE/ETHNICITY INCOME INSURANCE
Non-
Hispanic
White
Hispanic/
La no/
Other
200% FPL
or lower
201% FPL
or higher
Medicaid/
Other/
Uninsured
Medicare Private
n=25 n=1 n=11 n=10 n=9 n=11 n=6
50.0% 49.3% * 63.6% 45.5% 76.4% 54.7% 33.3% Primary care clinic
County clinic 14.0% 15.0% * 33.4% 0.0% 13.7% 40.3% 0.0%
Hospital emergency room 4.1% 4.4% * 0.0% 0.0% 0.0% 0.0% 0.0%
Other 32.0% 31.3% * 2.9% 54.5% 9.8% 5.0% 66.7%
USUAL SOURCE OF CARE—ADULT BEHAVIORAL HEALTH CARE
Half (50.0%) of respondents reported that their usual source of behavioral health care was a primary care clinic. 14.0% received
behavioral health care at a county clinic, and 4.1% used a hospital emergency room. While we observe different trends in usual
source of care by subpopula on, these differences were not sta s cally significant.
* We did not report results when five or fewer respondents from a subgroup answered the ques on.
DISPARITY FLAG: An orange box indicates a sta s cally significant disparity in results by subgroup. (two‐tailed chi‐square test, p<0.10)
Differences among subgroups should not be considered sta s cally significant unless indicated by an orange box. The significance test is not
valid for variables where expected cell sizes are small; in these cases the table cells have been shaded blue‐gray.

PAGE 11 COMMUNITY HEALTH SURVEY: NORTH COAST SERVICE AREA—9/30/16
ACCESS TO CARE
ACCESS TO HEALTH CARE
Most respondents (82.3%) reported needing some kind of health care in the preceding 12 months. We found evidence of unmet
need in the popula on—across all respondents. Overall, 20.1% reported needing care but not ge ng all of the care they needed
during the last 12 months. We did not see significant differences in unmet need by subgroup.
REASONS FOR UNMET NEED
If a respondent indicated that they were not able to access all the care they needed, we asked them to tell us why. The most com-
mon reason given was cost. Addi onally, 12.7% reported that they could not get an appointment quickly enough and 11.6% said
that they went without needed care because they did not have a regular provider. Low-income respondents were more likely to
report cost as a barrier and less likely to report that appointment availability was a barrier.
Q7‐8: Access to Needed Care in the
last 12 months TOTAL
RACE/ETHNICITY INCOME INSURANCE
Non-
Hispanic
White
Hispanic/
La no/
Other
200% FPL
or lower
201% FPL
or higher
Medicaid/
Other/
Uninsured
Medicare Private
n=179 n=10 n=57 n=98 n=46 n=96 n=52
17.7% 13.3% 43.6% 16.2% 20.0% 13.0% 19.6% 20.3% Did not need any kind of health care
Needed care; got all the care they
needed 62.2% 67.3% 23.5% 49.3% 66.5% 50.4% 69.2% 65.5%
Needed care; did not get all the care
they needed 20.1% 19.4% 32.9% 34.5% 13.5% 36.6% 11.1% 14.2%
Q9: The most recent me you went
without needed health care, what
were the main reasons? Mark all
that apply.
TOTAL
RACE/ETHNICITY INCOME INSURANCE
Non-
Hispanic
White
Hispanic/
La no/
Other
200% FPL
or lower
201% FPL
or higher
Medicaid/
Other/
Uninsured
Medicare Private
n=154 n=8 n=53 n=81 n=44 n=78 n=43
Cost 25.8% 26.1% 0.0% 39.5% 15.3% 25.3% 24.8% 24.1%
Couldn’t get an appointment quickly 12.7% 10.8% 58.3% 5.2% 17.4% 18.5% 14.5% 7.6%
Not having a regular provider 11.6% 12.6% 0.0% 16.7% 7.9% 10.2% 10.8% 13.9%
Not knowing where to go 8.8% 9.2% 6.8% 8.2% 10.0% 8.2% 7.2% 10.5%
DISPARITY FLAG: An orange box indicates a sta s cally significant disparity in results by subgroup. (two‐tailed chi‐square test, p<0.10)
Differences among subgroups should not be considered sta s cally significant unless indicated by an orange box. The significance test is not
valid for variables where expected cell sizes are small; in these cases the table cells have been shaded blue‐gray.

PAGE 12 COMMUNITY HEALTH SURVEY: NORTH COAST SERVICE AREA—9/30/16
ACCESS TO CARE
ACCESS TO MENTAL HEALTH CARE
20.0% of respondents reported needing some kind of mental health care in the preceding 12 months. We found evidence of un-
met need in the popula on—across all respondents. Overall, 8.0% reported needing mental health care but not ge ng all of the
care they needed during the last 12 months. We did not see significant differences in unmet need by subgroup.
REASONS FOR UNMET NEED
If a respondent indicated that they were not able to access all the mental health care they needed, we asked them to tell us why.
29.6% said that they did not know where to go for care, and 29.0% said that they did not have a regular provider. 23.0% reported
that cost was a barrier, and 22.7% said that they could not get an appointment quickly enough..
Q10 and Q12: Access to Needed
Mental Health Care in the last 12
months
TOTAL
RACE/ETHNICITY INCOME INSURANCE
Non-
Hispanic
White
Hispanic/
La no/
Other
200% FPL
or lower
201% FPL
or higher
Medicaid/
Other/
Uninsured
Medicare Private
n=181 n=9 n=59 n=99 n=49 n=94 n=52
80.0% 78.6% 86.9% 75.4% 82.3% 78.7% 80.6% 81.3% Did not need any kind of mental
health care
Needed mental health care; got all
the care they needed 12.0% 12.9% 13.1% 8.5% 14.1% 6.0% 9.1% 17.1%
Needed mental health care; did not
get all the care they needed 8.0% 8.5% 0.0% 16.1% 3.6% 15.3% 10.3% 1.6%
Q13: The most recent me you went
without needed mental health care,
what were the main reasons? Mark
all that apply.
TOTAL
RACE/ETHNICITY INCOME INSURANCE
Non-
Hispanic
White
Hispanic/
La no/
Other
200% FPL
or lower
201% FPL
or higher
Medicaid/
Other/
Uninsured
Medicare Private
n=31 n=1 n=15 n=12 n=11 n=13 n=8
I didn’t know where to go 29.6% 31.5% * 10.8% 54.3% 10.0% 4.6% 63.3%
Not having a regular provider 29.0% 24.6% * 21.2% 36.2% 22.8% 19.8% 42.2%
Cost 23.0% 21.9% * 21.2% 25.5% 22.8% 0.0% 38.3%
Couldn’t get an appointment quickly
enough 22.7% 17.8% * 48.8% 0.0% 31.7% 52.3% 0.0%
DISPARITY FLAG: An orange box indicates a sta s cally significant disparity in results by subgroup. (two‐tailed chi‐square test, p<0.10)
Differences among subgroups should not be considered sta s cally significant unless indicated by an orange box. The significance test is not
valid for variables where expected cell sizes are small; in these cases the table cells have been shaded blue‐gray.
* We did not report results when five or fewer respondents from a subgroup answered the ques on.

PAGE 13 COMMUNITY HEALTH SURVEY: NORTH COAST SERVICE AREA—9/30/16
ACCESS TO CARE
ACCESS TO SUBSTANCE ABUSE TREATMENT
3.8% of respondents reported needing some kind of substance abuse treatment in the preceding 12 months. Only 1.4% of the
survey respondents reported not ge ng all the substance abuse care that they needed.
REASONS FOR UNMET NEED
If a respondent indicated that they were not able to access all the substance abuse treatment they needed, we asked them to tell
us why. Since only four respondents replied to this ques on, we did not report results by subgroup. The three reasons indicated
by respondents were cost, not knowing where to go, and not having a regular provider.
Q14‐15: Access to Needed Substance
Abuse Treatment in the last 12
months
TOTAL
RACE/ETHNICITY INCOME INSURANCE
Non-
Hispanic
White
Hispanic/
La no/
Other
200%
FPL or
lower
201%
FPL or
higher
Medicaid/
Other/
Uninsured
Medicare Private
n=182 n=10 n=62 n=98 n=48 n=99 n=51
96.2% 95.7% 100.0% 93.2% 97.3% 92.5% 97.1% 98.4% Did not need any kind of substance
abuse treatment
Needed treatment; got all the care
they needed 2.4% 2.7% 0.0% 6.8% 0.0% 7.5% 0.0% 0.0%
Needed treatment; did not get all the
care they needed 1.4% 1.6% 0.0% 0.0% 2.7% 0.0% 2.9% 1.6%
DISPARITY FLAG: An orange box indicates a sta s cally significant disparity in results by subgroup. (two‐tailed chi‐square test, p<0.10)
Differences among subgroups should not be considered sta s cally significant unless indicated by an orange box. The significance test is not
valid for variables where expected cell sizes are small; in these cases the table cells have been shaded blue‐gray.
PAGE 14 COMMUNITY HEALTH SURVEY: NORTH COAST SERVICE AREA—9/30/16
SOCIAL DETERMINANTS OF HEALTH
BASIC NEEDS
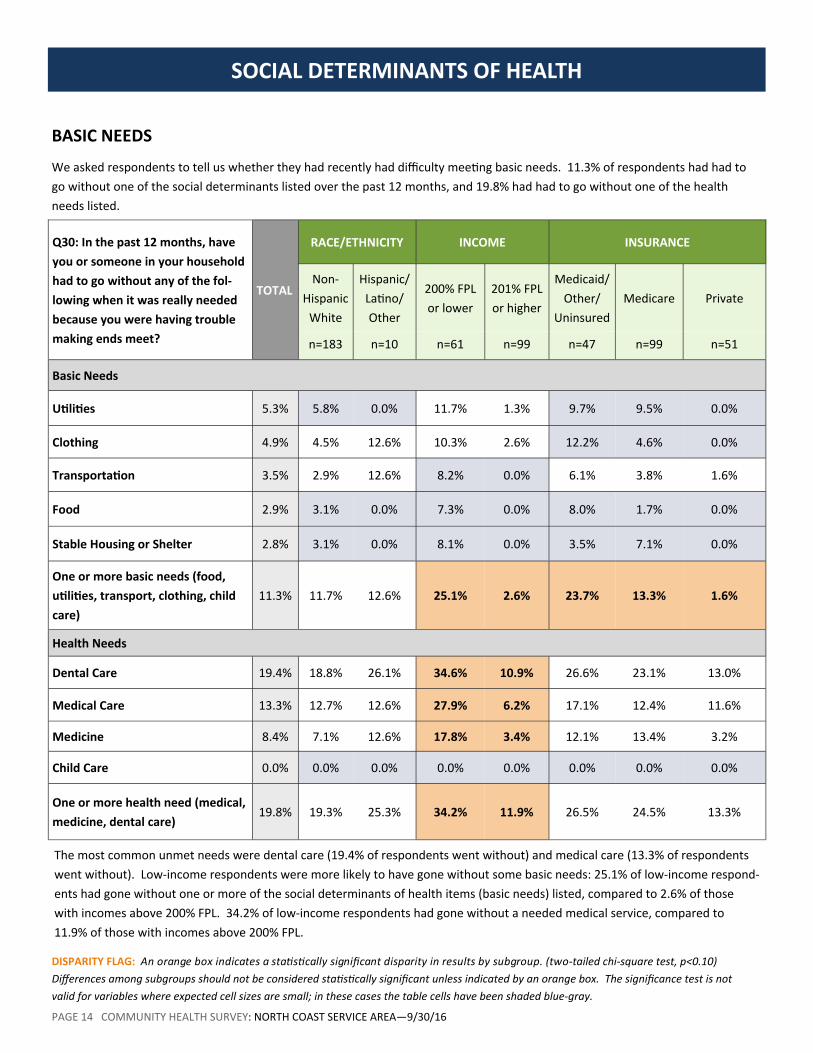
We asked respondents to tell us whether they had recently had difficulty mee ng basic needs. 11.3% of respondents had had to
go without one of the social determinants listed over the past 12 months, and 19.8% had had to go without one of the health
needs listed.
The most common unmet needs were dental care (19.4% of respondents went without) and medical care (13.3% of respondents
went without). Low-income respondents were more likely to have gone without some basic needs: 25.1% of low-income respond-
ents had gone without one or more of the social determinants of health items (basic needs) listed, compared to 2.6% of those
with incomes above 200% FPL. 34.2% of low-income respondents had gone without a needed medical service, compared to
11.9% of those with incomes above 200% FPL.
DISPARITY FLAG: An orange box indicates a sta s cally significant disparity in results by subgroup. (two‐tailed chi‐square test, p<0.10)
Differences among subgroups should not be considered sta s cally significant unless indicated by an orange box. The significance test is not
valid for variables where expected cell sizes are small; in these cases the table cells have been shaded blue‐gray.
Q30: In the past 12 months, have
you or someone in your household
had to go without any of the fol‐
lowing when it was really needed
because you were having trouble
making ends meet?
TOTAL
RACE/ETHNICITY INCOME INSURANCE
Non-
Hispanic
White
Hispanic/
La no/
Other
200% FPL
or lower
201% FPL
or higher
Medicaid/
Other/
Uninsured
Medicare Private
n=183 n=10 n=61 n=99 n=47 n=99 n=51
Basic Needs
U li es 5.3% 5.8% 0.0% 11.7% 1.3% 9.7% 9.5% 0.0%
Clothing 4.9% 4.5% 12.6% 10.3% 2.6% 12.2% 4.6% 0.0%
Transporta on 3.5% 2.9% 12.6% 8.2% 0.0% 6.1% 3.8% 1.6%
Food 2.9% 3.1% 0.0% 7.3% 0.0% 8.0% 1.7% 0.0%
Stable Housing or Shelter 2.8% 3.1% 0.0% 8.1% 0.0% 3.5% 7.1% 0.0%
One or more basic needs (food,
u li es, transport, clothing, child
care)
11.3% 11.7% 12.6% 25.1% 2.6% 23.7% 13.3% 1.6%
Health Needs
Dental Care 19.4% 18.8% 26.1% 34.6% 10.9% 26.6% 23.1% 13.0%
Medical Care 13.3% 12.7% 12.6% 27.9% 6.2% 17.1% 12.4% 11.6%
Medicine 8.4% 7.1% 12.6% 17.8% 3.4% 12.1% 13.4% 3.2%
Child Care 0.0% 0.0% 0.0% 0.0% 0.0% 0.0% 0.0% 0.0%
One or more health need (medical,
medicine, dental care) 19.8% 19.3% 25.3% 34.2% 11.9% 26.5% 24.5% 13.3%

PAGE 15 COMMUNITY HEALTH SURVEY: NORTH COAST SERVICE AREA—9/30/16
SOCIAL DETERMINANTS OF HEALTH
HOUSING STABILITY
15.2% of respondents reported that they do not have secure housing. 9.8% have housing, but are worried about losing it; 5.4% do
not have stable housing. Housing stability varied significantly by income and insurance status. Because the survey sample was
based on residen al addresses, housing security may be under-reported. Future data collec on efforts could include outreach
designed to capture responses from those in less-secure housing situa ons. Respondents with higher income were significantly
more likely to have housing and not be worried about losing it.
Q29: Housing Insecurity TOTAL
RACE/ETHNICITY INCOME INSURANCE
Non-
Hispanic
White
Hispanic/
La no/
Other
200% FPL
or lower
201% FPL
or higher
Medicaid/
Other/
Uninsured
Medicare Private
n=182 n=10 n=61 n=100 n=46 n=98 n=52
84.9% 86.0% 53.2% 61.4% 98.9% 73.2% 85.1% 92.4% Have housing, not worried about
losing it
Have housing, but worried about 9.8% 10.0% 12.6% 23.5% 1.1% 15.5% 14.2% 3.7%
Do not have stable housing 5.4% 3.9% 34.2% 15.1% 0.0% 11.3% 0.7% 3.9%
SOCIAL SUPPORT
We asked par cipants a series of ques ons designed to measure the extent to which they had adequate social support. These
ques ons were drawn from the Social Support Index (SSI). Respondents could indicate whether they had certain kinds of support
all of the me, most of the me, some of the me, or none of the me. Results for those indica ng “some” or “none” of the me
are reported below; we did observe dispari es in social support by income and insurance status. Though results for social support
varied by race/ethnicity, these differences were not sta s cally significant. Lower percentages indicate be er social support.
DISPARITY FLAG: An orange box indicates a sta s cally significant disparity in results by subgroup. (two‐tailed chi‐square test, p<0.10)
Differences among subgroups should not be considered sta s cally significant unless indicated by an orange box. The significance test is not
valid for variables where expected cell sizes are small; in these cases the table cells have been shaded blue‐gray.
Q31: Social Support
% repor ng that they would have
someone to do the following “some
of the me” or “none of the me”
TOTAL
RACE/ETHNICITY INCOME INSURANCE
Non-
Hispanic
White
Hispanic/
La no/
Other
200% FPL
or lower
201% FPL
or higher
Medicaid/
Other/
Uninsured
Medicare Private
n=175 n=10 n=58 n=97 n=46 n=92 n=52
Get together with for relaxa on 31.7% 32.7% 38.6% 40.7% 24.2% 40.0% 30.9% 25.4%
Confide in or talk to about your
problems 22.4% 22.2% 38.6% 32.2% 12.8% 33.9% 21.0% 15.5%
Give you good advice about a crisis 20.0% 20.4% 34.7% 34.8% 8.4% 34.2% 15.9% 12.2%
Love you and make you feel wanted 14.6% 16.4% 0.0% 20.1% 7.6% 22.9% 17.6% 7.3%

PAGE 16 COMMUNITY HEALTH SURVEY: NORTH COAST SERVICE AREA—9/30/16
SOCIAL DETERMINANTS OF HEALTH
NEIGHBORHOOD COHESION
We asked par cipants a series of ques ons designed to measure neighborhood cohesion within their community. In general, most
respondents agreed that people in their community are willing to help each other, that people in their community can be trusted,
and that adults in the community can be counted on to watch over children. 93.8% of respondents either agreed or strongly
agreed with the statement, “I feel safe in my community.”
We did not find sta s cally significant differences by subgroup.
TOTAL
RACE/ETHNICITY INCOME INSURANCE
Non-
Hispanic
White
Hispanic/
La no/
Other
200% FPL
or lower
201% FPL
or higher
Medicaid/
Other/
Uninsured
Medicare Private
You can count on adults in this
community to watch out that
children are safe and don’t get in
trouble
(% Disagree or Strongly Disa‐
gree)
N 184 166 10 56 93 43 85 51
% 17.5% 15.2% 47.4% 24.7% 12.9% 26.2% 16.6% 13.2%
People in my community can be
trusted
(% Disagree or Strongly Disa‐
gree)
N 186 167 10 55 94 42 89 51
% 16.9% 14.0% 60.0% 20.5% 14.3% 27.2% 12.1% 13.4%
People in my community are
willing to help each other
(% Disagree or Strongly Disa‐
gree)
N 192 173 10 58 96 46 90 51
% 10.4% 8.2% 47.4% 16.5% 6.6% 15.4% 12.0% 6.6%
I feel safe in my community
(% Disagree or Strongly Disa‐
gree)
N 193 175 9 56 98 45 93 50
% 6.2% 4.8% 39.8% 11.3% 3.2% 13.2% 1.9% 4.1%
Q32: Neighborhood Cohesion
DISPARITY FLAG: An orange box indicates a sta s cally significant disparity in results by subgroup. (two‐tailed chi‐square test, p<0.10)
Differences among subgroups should not be considered sta s cally significant unless indicated by an orange box. The significance test is not
valid for variables where expected cell sizes are small; in these cases the table cells have been shaded blue‐gray.

PAGE 17 COMMUNITY HEALTH SURVEY: NORTH COAST SERVICE AREA—9/30/16
TRAUMA
ADVERSE LIFE EXPERIENCES
Because adverse life experiences have been associated with poor health outcomes, we asked par cipants to tell us the extent to
which they had experienced hardship, difficulty, or trauma c events. Two out of three (66.1%) respondents reported experiencing
at least one trauma c event; one in four (25.3%) have experienced three or more. The most common adverse life experiences re-
ported were a life-changing illness or injury (42.8%), witnessing or experiencing violence (29.3%), and living with someone with
mental illness of substance abuse (27.9%). No significant differences by subgroup were evident.
DISPARITY FLAG: An orange box indicates a sta s cally significant disparity in results by subgroup. (two‐tailed chi‐square test, p<0.10)
Differences among subgroups should not be considered sta s cally significant unless indicated by an orange box. The significance test is not
valid for variables where expected cell sizes are small; in these cases the table cells have been shaded blue‐gray.
Q20. To what extent have you
experienced hardship, difficulty or
trauma c events in your life?
TOTAL
RACE/ETHNICITY INCOME INSURANCE
Non-
Hispanic
White
Hispanic/
La no/
Other
200% FPL
or lower
201% FPL
or higher
Medicaid/
Other/
Uninsured
Medicare Private
n=181 n=10 n=61 n=98 n=48 n=96 n=51
Life‐changing illness or injury 42.8% 41.4% 53.2% 43.6% 41.5% 43.6% 53.9% 35.9%
Witnessed or experienced violence 29.3% 28.6% 60.0% 32.5% 25.7% 36.4% 26.3% 23.2%
Lived with someone with mental
illness or substance abuse 27.9% 27.8% 47.4% 32.1% 25.0% 20.8% 26.2% 32.2%
Abuse of any kind 21.1% 20.1% 56.2% 29.3% 14.3% 22.1% 22.7% 17.1%
Other trauma c event 14.5% 13.2% 29.1% 10.6% 15.8% 10.6% 15.3% 14.3%
Neglect of any kind 12.2% 12.0% 12.6% 16.6% 10.1% 13.7% 12.3% 9.8%
Forced to do something sexual
that you didn’t want to do 12.0% 12.5% 16.5% 9.8% 12.0% 7.8% 15.3% 10.5%
Physically hurt or threatened by
an in mate partner 11.7% 10.1% 47.4% 17.3% 6.1% 6.9% 15.6% 10.5%
At least one trauma c event 66.1% 65.4% 84.1% 60.8% 69.1% 69.1% 63.3% 64.8%
3 or more trauma c events 25.3% 23.9% 60.0% 31.9% 20.6% 24.2% 24.5% 24.4%

PAGE 18 COMMUNITY HEALTH SURVEY: NORTH COAST SERVICE AREA—9/30/16
HEALTH & LIFESTYLE BEHAVIORS
DISPARITY FLAG: An orange box indicates a sta s cally significant disparity in results by subgroup. (two‐tailed chi‐square test, p<0.10)
Differences among subgroups should not be considered sta s cally significant unless indicated by an orange box. The significance test is not
valid for variables where expected cell sizes are small; in these cases the table cells have been shaded blue‐gray.
DIETARY INDICATORS
About half (50.4%) of respondents get less than two servings of fruit per day, and 42.4% get less than two servings of vegetables
per day. Those in the Medicaid/Other/Uninsured category were more likely (63.7%) to get less than two servings of fruit per day
than Medicare beneficiaries (59.9%) or those with private insurance (35.7%).
Q21‐22: Fruit and Vegetable Con‐
sump on TOTAL
RACE/ETHNICITY INCOME INSURANCE
Non-
Hispanic
White
Hispanic/
La no/
Other
200% FPL
or lower
201% FPL
or higher
Medicaid/
Other/
Uninsured
Medicare Private
n=158 n=7 n=50 n=87 n=39 n=85 n=45
50.4% 49.4% 30.0% 54.4% 47.1% 63.7% 59.9% 35.7% Less than two servings of fruit per
day
Less than two servings of vegetables
per day 42.4% 43.5% 19.3% 47.7% 39.4% 53.9% 49.4% 31.4%
Q23: Smoking rates TOTAL
RACE/ETHNICITY INCOME INSURANCE
Non-
Hispanic
White
Hispanic/
La no/
Other
200% FPL
or lower
201% FPL
or higher
Medicaid/
Other/
Uninsured
Medicare Private
n=184 n=10 n=62 n=99 n=49 n=99 n=51
Currently smoke cigare es or e‐
cigare es 7.5% 8.1% 7.1% 7.7% 6.8% 13.8% 6.7% 3.4%
SMOKING
7.5% of respondents report that they currently use tobacco at least some days. There were no significant differences in the smok-
ing rate by race, income, or insurance type.

PAGE 19 COMMUNITY HEALTH SURVEY: NORTH COAST SERVICE AREA—9/30/16
HEALTH & LIFESTYLE BEHAVIORS
DISPARITY FLAG: An orange box indicates a sta s cally significant disparity in results by subgroup. (two‐tailed chi‐square test, p<0.10)
Differences among subgroups should not be considered sta s cally significant unless indicated by an orange box. The significance test is not
valid for variables where expected cell sizes are small; in these cases the table cells have been shaded blue‐gray.
ALCOHOL
More than one in four (26.3%) respondents drinks alcohol four or more mes per week. 24.6% of respondents said that they con-
sume three or more drinks per day on the days when they do drink alcohol. We did not find significant differences in alcohol con-
sump on by subgroup.
Q25‐26: Alcohol Consump on TOTAL
RACE/ETHNICITY INCOME INSURANCE
Non-
Hispanic
White
Hispanic/
La no/
Other
200% FPL
or lower
201% FPL
or higher
Medicaid/
Other/
Uninsured
Medicare Private
Drink alcohol four or more mes
per week
N 140 127 6 35 76 30 66 42
% 26.3% 27.2% 5.0% 29.5% 23.2% 19.5% 22.8% 33.4%
Three or more drinks per day
N 135 122 6 33 77 29 65 40
% 24.6% 28.4% 0.0% 27.7% 25.3% 35.3% 19.1% 20.5%

PAGE 20 COMMUNITY HEALTH SURVEY: NORTH COAST SERVICE AREA—9/30/16
CONCLUSIONS
KEY FINDINGS
HEALTH Most (79.8%) respondents report that they are in good, very good, or excellent health. 67.2% have a chronic physi-
cal condi on and 40.3% have a behavioral health condi on. For adults, high blood pressure and high cholesterol are the most
common diagnoses. Among children, asthma and anxiety are the most common diagnoses. 24.7% of parents with children un-
der 18 have a child with asthma, and 17.1% have a child with anxiety. 17.7% of parents have a child with a behavioral health
condi on. 12.2% of respondents report currently experiencing symptoms of anxiety, and 11.1% report current symptoms of
depression. 27.8% of respondents are overweight, and 42.7% are obese. Dispari es related to income were present; low-
income respondents were more likely (21.9%) to report current symptoms of depression than those with incomes above 200%
FPL (3.5%). 80.7% of Medicare beneficiaries were overweight or obese, compared with 72.9% of those in the Medicaid/Other/
Uninsured category and 63.6% of those with private insurance.
ACCESS TO CARE Only 6.3% of respondents do not have health insurance, and only 5.5% do not have a place to go for care
that is not an emergency. S ll, one in five (21.4%) do not have someone they think of as their personal provider. 82.3% of re-
spondents needed some kind of health care in the last year; 20.1% of all respondents said they did not get all the care they
needed. 19.4% of respondents reported going without needed dental care. Cost was the most common barrier to care, but not
being able to get a mely appointment and not having a personal provider were also common challenges. 8.0% report going
without needed mental health care, and 1.4% report going without needed substance abuse treatment.
SOCIAL DETERMINANTS OF HEALTH 11.3% of respondents report having to go without one or more basic needs (food, u li-
es, transporta on, clothing, housing, or child care). Most (84.9%) respondents report having stable housing, though 9.8% are
concerned that their housing might not be stable, and 5.4% do not have stable housing. Low-income respondents and those in
the Medicaid/Other/Uninsured category were less likely to have stable housing. Roughly one in four respondents reported in-
adequate social support; these rates were higher among low-income respondents and those in the Medicaid/Other/Uninsured
category. 66.1% had experienced a trauma c event during their life me; 25.3% had experienced three or more such adverse
life experiences.
HEALTH BEHAVIORS Fruit and vegetable intake varied by insurance type, with Medicaid and Medicare recipients ea ng few-
er fruits and vegetables. 7.5% currently smoke cigare es or e-cigare es at least some days. 26.3% report that they drink alco-
hol four or more mes per week, and 24.6% say that they have more than three or more drinks per day on the days when they
drink alcohol.
PATTERNS & TRENDS
The North Coast Service Area Community Health Survey popula on faces a high chronic disease burden. 67.2% have a chronic
physical condi on, and 40.3% have a mental health condi on. 44.7% have high blood pressure, and 42.7% are obese. Within
this context, access to care becomes par cularly important— and yet, a significant por on of the popula on is facing barriers to
care. 20.1% report not ge ng all the care they needed in the past 12 months. 21.4% do not have a personal doctor, and 12.3%
named an urgent care clinic as their “usual source of care.” 19.4% report going without needed dental care. While it is true
that survey respondents were dispropor onately older than the general popula on in the service area, all of these results are
age-adjusted.
In addi on to challenges related to morbidity and access to care, a por on of the survey popula on is struggling with the social
determinants of health. 15.2% do not have stable housing, and 11.3% went without some basic need (food, housing, clothing,
u li es, or transporta on) in the last year. Two-thirds of the popula on (66.1%) have experienced at least one trauma c
event, and 25.3% have experienced three or more trauma c events.
These findings suggest that the impact of ini a ves designed to improve access might be enhanced by complementary efforts
to address social determinants of health.

CHS-NORTH COAST PAGE 1 OF 4 PLEASE CONTINUE ON THE NEXT PAGE
COMMUNITY HEALTH SURVEYINSTRUCTIONS: For each question, please fill in the circle that best represents your answer. Your results are completely private, and you can skip any question you do not want to answer. When you are finished, place the survey in the postage-paid envelope we have provided and drop it in the mail. If you have questions about this survey, please read the included letter or call us at 1-877-215-0686.
PART 1
YOUR HEALTH CAREThese questions help us understand your health and health care.
1 Do you currently have any kind of health insurance? Yes No (Skip to Question 3)
2 What kind of health insurance do you have? Mark all that apply.
Medicaid/Oregon Health Plan (OHP) Medicare VA, TRICARE or other military health care Private coverage through an employer or family
member’s employer A private plan I pay for myself Other (tell us): ___________________________ I don’t have any insurance now I don’t know
3 If you don’t currently have any kind of health insurance, what are the main reasons why? Mark all that apply.
It costs too much I don’t think I need insurance I am waiting to get coverage through a job Signing up is too confusing I haven’t had time to deal with it Other (tell us): ___________________________
4 Do you have a place to go for health care when it is not an emergency?
Yes No (Skip to Question 6)
5 Where do you usually go to receive health care when it is not an emergency? Mark only one.
A private doctor’s office or clinic A public health clinic or community health center A tribal health clinic A VA facility A hospital-based clinic A hospital emergency room An urgent care clinic Other (tell us): ___________________________ I don’t have a usual place
6 Do you have one person you think of as your personal doctor or health care provider?
Yes No
7 Was there a time in the last 12 months when you needed any type of health care?
Yes No (Skip to Question 10)
8 If you needed health care in the last 12 months, did you get all the care you needed?
I got all the care I needed
I got some but not all needed care
I got no care at all I don’t know
9 The most recent time you went without needed health care, what were the main reasons? Mark all that apply.
Cost
Not having a regular provider
Not knowing where to go
Couldn’t get appointments quickly enough
Offices aren’t open when I can go
Needed childcare
Needed transportation
Not having a provider that understands my culture or speaks my language
Other reasons (tell us): _____________________
10 In the last 12 months have you needed treatment or counseling for a mental health condition or personal problem?
Yes No (Skip to Question 14)
11 If you did receive treatment or counseling for a mental health condition or personal problem in the last 12 months, where did you mostly go to get care? Mark only one.
My primary care doctor’s office A county clinic Hospital emergency room Other (tell us): ___________________________

CHS-NORTH COAST PAGE 2 OF 4 PLEASE CONTINUE ON THE NEXT PAGE
YOUR HEALTH & LIFESTYLEThese questions give us a picture of your overall health.
PART 2
17 In general, would you say your health is: Excellent Fair Very Good Poor Good
18 Have you ever been told by a doctor or other health professional that you have any of the following?
Yes No
Diabetes or sugar diabetes . . . . . . . . Asthma . . . . . . . . . . . . . . . . . . . . . . . High blood pressure . . . . . . . . . . . . . . High cholesterol . . . . . . . . . . . . . . . . . Depression . . . . . . . . . . . . . . . . . . . . . Post-traumatic stress disorder . . . . . . Anxiety . . . . . . . . . . . . . . . . . . . . . . . . Another mental health condition . . . .
19 During the past 2 weeks, about how often have you been bothered by the following problems:
Not Several Over half Nearly at all days the days every day
Little interest or pleasure in doing things . . . . . . . . . . . . . Feeling down, depressed or hopeless . . . . . . . . . . . . . . . . Feeling nervous, anxious or on edge . . . . . . . . . . Not being able to stop or control worrying . . . . . . . . . .
20 To what extent have you experienced hardship, difficulty or traumatic events in your life? Not Some A lot at all
Life changing illness or injury . . . . . . Neglect of any kind . . . . . . . . . . . . . Lived with someone with mental illness or substance abuse. . . . . . . . . . . . . . . . . . . . . . . . Witnessed or experienced violence . . . . . . . . . . . . . . . . . . . . . . Forced to do something sexual that you didn’t want to do . . . . . . . . . . . . . . . . . . . . . . . . Physically hurt or threatened by an intimate partner . . . . . . . . . . . Abuse of any kind . . . . . . . . . . . . . . Other traumatic event (tell us):______________________
12 In the last 12 months, when you needed treatment or counseling for a mental health condition or personal problem did you get all the care you needed?
I got all the care I needed
I got some but not all needed care
I got no care at all I don’t know
13 The most recent time you went without needed mental health care, what were the main reasons? Mark all that apply.
Cost
Not having a regular provider
Not knowing where to go
Couldn’t get appointments quickly enough
Offices aren’t open when I can go
Needed childcare
Needed transportation
Not having a provider that understands my culture or speaks my language
Other reasons (tell us): _____________________
14 In the last 12 months have you needed treatment or counseling for your use of alcohol or any drug, not counting cigarettes?
Yes No (Skip to Question 17)
15 In the last 12 months, when you needed treatment or counseling for your use of alcohol or drugs, did you get all the care you needed?
I got all the care I needed
I got some but not all needed care
I got no care at all I don’t know
16 The most recent time you went without needed drug or alcohol abuse treatment, what were the main reasons? Mark all that apply.
Cost
Not having a regular provider
Not knowing where to go
Couldn’t get appointments quickly enough
Offices aren’t open when I can go
Needed childcare
Needed transportation
Not having a provider that understands my culture or speaks my language
Other reasons (tell us): _____________________

CHS-NORTH COAST PAGE 3 OF 4 PLEASE CONTINUE ON THE NEXT PAGE
21 During a typical day, how many servings of fruit do you usually eat? A serving is one piece of fruit or about a cup of cut-up fruit. Don’t count juices.
__________ servings per day
22 During a typical day, how many servings of vegetables do you usually eat? A serving is about a cup of vegetables like green beans, salad or potatoes. Don’t include fried foods like french fries.
__________ servings per day
23 Do you currently smoke cigarettes or e-cigarettes? Every day Some days Not at all
24 How often did you have a drink containing alcohol in the past year?
Never (Skip to Question 27) Monthly or less 2-4 times a month 2-3 times a week 4 or more times a week
25 How many days per week do you drink alcohol? 0 to 1 4 to 5 2 to 3 6 to 7
26 On the days when you did drink alcohol, how many drinks did you usually have per day? A ‘drink’ is one beer, one glass of wine or one shot of liquor.
1 or 2 7 to 9 3 or 4 10 or more 5 or 6
27 Do you have any children (under 18 years of age)? Yes No (Skip to Question 29)
28 Have you ever been told by a doctor or other health care professional that any of your children have any of the following?
Yes No
Diabetes or sugar diabetes . . . . . . . . Asthma . . . . . . . . . . . . . . . . . . . . . . . A behavioral or mental health diagnosis (such as depression, anxiety or ADHD) . A developmental delay or learning disability (such as Autism or Dyslexia) Depression . . . . . . . . . . . . . . . . . . . . . Post-traumatic stress disorder . . . . . . Anxiety . . . . . . . . . . . . . . . . . . . . . . . . Another ongoing health condition . . . . . (tell us): _____________________
YOUR HOUSEHOLD FINANCESThese questions help us understand finances for you and your family.
PART 3
29 Which of the following best describes your housing situation today? Mark all that apply.
I have housing of my own, and I’m NOT worried about losing it
I have housing of my own, but I AM worried about losing it
I’m staying in a hotel I’m staying with friends or family I’m staying in a shelter, in a car or on the street Other (tell us): ___________________________
30 In the past 12 months, have you or someone in your house-hold had to go without any of the following when it was really needed because you were having trouble making ends meet?
Yes No
Food . . . . . . . . . . . . . . . . . . . . . . . . . . Utilities . . . . . . . . . . . . . . . . . . . . . . . . Transportation . . . . . . . . . . . . . . . . . . Clothing . . . . . . . . . . . . . . . . . . . . . . . Stable Housing or Shelter . . . . . . . . . . Medical Care . . . . . . . . . . . . . . . . . . . Medicine . . . . . . . . . . . . . . . . . . . . . . Child Care . . . . . . . . . . . . . . . . . . . . . Dental Care . . . . . . . . . . . . . . . . . . . .
ABOUT YOU & YOUR FAMILYThese questions help us understand more about you, your living situation and your family.
PART 4
31 How often do you think you would have someone available to do each of the following? None of Some of Most of All of the time the time the time the time
Love you and make you feel wanted? . . . . . . . .
Give you good advice about a crisis? . . . . . . . . . .
Get together with for relaxation? . . . . . . . . . . . . .
Confide in or talk to about your problems?. . . . .
Help you if you were confined to a bed?. . . . . . . .

CHS-NORTH COAST PAGE 4 OF 4 PLEASE CONTINUE ON THE NEXT PAGE
32 Please tell us about the community where you currently live:
Strongly Strongly Disagree Agree Disagree Agree
People in my community are willing to help each other . . . .
People in my community can be trusted . . . . . . . . . . . . .
You can count on adults in this community to watch out that children are safe and don’t get in trouble . . . . . . . . .
I feel safe in my community . .
33 Are you male, female or transgender?
Male Female Transgender
34 What year were you born? 19______
35 What is your height? _____ Feet ______ Inches
36 About how much do you currently weigh? ______ pounds
37 Are you Hispanic or Latino? Yes No
38 Which one or more of the following would you say is your race? Mark all that apply.
White Black or African-American Asian Native Hawaiian or Other Pacific Islander American Indian or Alaska Native Don’t know / Not sure Prefer not to answer
39 What language do you speak best? Mark only one. English Spanish Vietnamese Russian Other (tell us): ___________________________
40 What is the highest level of education you have completed? Mark only one.
Less than high school High school diploma or GED Vocational training or 2-year degree A 4-year college degree An advanced or graduate degree
41 Are you currently employed or self-employed? Yes, employed by someone else Yes, self-employed Not currently employed Retired
42 About how many hours per week, on average, do you work at your current job(s)? Your best estimate is fine.
I don’t currently work Less than 20 hours per week 20-39 hours per week 40 or more hours per week
43 What is your gross household income (before taxes and deductions are taken out) for last year (2015)? Your best estimate is fine.
$0 $50,001 to $60,000 $1 to $10,000 $60,001 to $70,000 $10,001 to $20,000 $70,001 to $80,000 $20,001 to $30,000 $80,001 to $90,000 $30,001 to $40,000 $90,001 to $100,000 $40,001 to $50,000 $100,001 or more
44 Altogether, how many people currently live in your home? Count adults and children under 18.
Me, plus ___ other adults and ___ children.
45 We may ask some participants to participate in listening sessions or other research (and be compensated for their time). Would you be interested in participating?
No Yes Is there a good phone number to
reach you? (include area code):
_____________________________
and/or E-mail:
_____________________________
———————————— STOP HERE ————————————Thank you very much for taking time to complete this survey.
Please place the survey in the postage-paid envelope and mail it. Contact us at 1-877-215-0686 or [email protected] with any questions.
03/31/16

Appendix 4: Key Stakeholder Interview Guide and Participants

Key Community Stakeholder Interview Hospital Representatives Date and Time Of Interview Location
(please list all attendees)
Key Community Stakeholder Names/Titles (please list all attendees)
Organization Name
Address
Phone(s)/Email
How would you describe your organization’s role within the community?
How would you describe the geographic area your organization serves?
Please identify and discuss specific unmet health needs in your community for the persons you serve: Can you prioritize these issues? What are your top concerns?
Please identify and discuss specific gaps in community services for the persons you serve that contribute to the unmet health needs cited above. We have a particular concern for those that are low income, vulnerable or are experiencing health inequities. What existing community health initiatives or programs in your community are helpful in addressing the health needs of the persons you serve, especially with identifying health needs earlier? Can you rank them in terms of effectiveness? What other things do you think we should hear about?
Other comments:
2016 Clatsop County CHNA Key Stakeholders Interviewed:
Elaine Bruce, Executive Director, Clatsop Community Action Alan Evans, Executive Director, Helping Hands Re-Entry Outreach Centers Craig Hoppes, Superintendent, Astoria School District Mark Kujala, Mayor, City of Warrenton Viviana Matthews, Deputy Director, Clatsop Community Action Debbie Morrow, Co-Chair, Columbia Pacific CCO Matt Phillips, Jail Commander, Clatsop County Sheriff’s Office Joyce Stuber, Development Director, Helping Hands Re-Entry Outreach Centers Sydney van Dusen, Coordinator, Way to Wellville

Appendix 5: Community Listening Session Guide

Clatsop County Collaborative Needs Assessment: Listening Session Discussion Guide (Adapted from Healthy Columbia Willamette Collaborative, 2016)
Preface with purpose of conversation, context of overall flow and topics to be covered, and why their participation is important.
INTRODUCTION We have a little over an hour to talk, and I’d like to start with a creative activity. I’d like you to start by thinking about your community. People might think of “community” in different ways. Maybe it’s family, or maybe it’s neighbors, or maybe it’s coworkers or friends. For the next 5 minutes, draw a picture that represents your community.
Pause, give people ~5 minutes to draw. Facilitator should draw too.
So let’s go around in a circle—tell me your name, and tell us something about the community represented in your drawing. We will each have about thirty seconds to share. I’ll start.
Facilitator introduces self, models talking about community.
Then everyone goes in a circle, introducing self and saying a few words about their community.
Thank you all for sharing. That leads into what we’re going to talk about next: the health of your community. This is going to be an informal discussion. We want to hear about your ideas, experiences and opinions. Everyone's comments are important. They might be similar or very different, but they all should be heard. The goal today is to record everyone’s opinions.
CONTEXT What we were hoping to talk about today is: What makes a healthy community?
That’s a difficult question, because it involves two ideas. First, there’s HEALTH. What do we mean by health? Do we mean freedom from disease? Having enough to eat? Feeling generally good about life? Being financially healthy?
Then there’s the idea of COMMUNITY. What do we mean by community? Are we talking about each one of you, individually? Are we talking about your friends and family? Your neighborhood? Your church? Your racial or ethnic group? Your city or town?

Clatsop County Collaborative Needs Assessment: Listening Session Discussion Guide (Adapted from Healthy Columbia Willamette Collaborative, 2016)
We’re not going to define these things for you. We’re going to keep it open.
QUESTION 1. VISION . Now take a minute to think about your community—that community that is represented in your drawing. How can you tell when your community is healthy?
Instructions: write ideas on the poster.
QUESTION 2. NEEDS.
So we’ve talked about what a healthy community looks like. Now let’s talk about what’s not there or what you need more of.
What’s needed? What more could be done to help your community be healthy?
Instructions: write ideas on the poster.
QUESTION 3. STRENGTHS. So you’ve told us what a healthy community looks like and what the needs are in your community. Let’s explore this idea a little more. Communities have certain resources that can help them be healthy. It might be programs. It might be a park or a community center. It might be a really great teacher at your local school. It might be a local business or a local organization that helps people be healthy.
My question for you is:
What’s working? What are the resources that CURRENTLY help your community to be healthy?
Instructions: write ideas on the poster.
Wrap-Up: Thank participants for coming, describe any next steps. Make sure folks signed in for an appropriate count, and distribute gift cards/incentives as they leave.

Appendix 6: Progress since last CHNA (CMH)
As a not-for-profit, independent hospital, Columbia Memorial Hospital (CMH) is committed to providing excellence, leadership and compassion in the enhancement of health for those we serve. The annual Community Benefits Report is an opportunity for CMH to share just a handful of the ways it helps to enhance the health of our neighbors in the Lower Columbia Region.
"Community benefit" takes many forms. It's providing concussion testing, taping classes and the services of a certified athletic trainer to area high schools at no cost to schools or athletes. It's hosting public seminars about heart health, joint replacement surgery and other health concerns. It's sponsoring local arts, athletic events, community events and charitable organizations. It's covering the cost of medical care for neighbors who can't pay.
CMH's community benefits programs promote health and help us be an asset to our communities. CMH is a community benefit leader among Oregon hospitals.
Through programs and donations, health education, free and discounted care, and more, CMH provided more than $29.3 million in community benefit in 2015.
Type of Community
Benefit 2015 Definitions (Oregon Health Authority)
Cash and In-Kind Giving $96,482
Funds and services donated to individuals or groups of the community. Typical contributions include grants, scholarships, staff hours, hospital space, food, and equipment.
Charity Care $961,398
Charity care consists of healthcare services provided to people who are determined by the hospital to be unable to pay for the cost of healthcare services. Hospitals will typically determine a patient's inability to pay by examining a variety of factors, such as individual and family income, assets, employment status, family size, or availability of alternative sources of payment. A hospital may establish inability to pay at the time care is provided or through later efforts to gather adequate financial information to make an eligibility determination. Hospitals may use different methodologies to estimate the costs of charity care.
Community Benefit Operations
$161,742 Costs associated developing and maintaining community benefit programs, such as staff hours, grant writing, needs assessments, and fundraising.
Community Health $497,433 Costs associated with activities geared towards improving
the health of the community including educational

Community Benefit Operations
$161,742 Costs associated developing and maintaining community benefit programs, such as staff hours, grant writing, needs assessments, and fundraising.
Community Health Improvement
$497,433
Costs associated with activities geared towards improving the health of the community including educational lectures/presentations, special community health screening events, clinics, telephone information services, poison control services, and hotlines.
Health Professions Education
$104,609 Costs associated with training future healthcare professionals by providing a clinical setting for training, internships, vocational training, and residencies.
Medicaid Unreimbursed $1,959,603
An estimate of the costs not reimbursed by Medicaid, the federal health insurance program that provides health and long-term care services to low-income populations.
Medicare Unreimbursed $17,907,349
An estimate of the costs not reimbursed by Medicare, the federal health insurance program for citizens over 65 and those determined disabled by the Social Security Administration.
Other Public Programs $522,587
An estimate of the costs not reimbursed by public health programs other than Medicaid and Medicare, such as Tricare, Champus, Indian Health Service, or other federal, state, or local programs.
Accomplishments
1. Collaboration with Crisis Respite Center ensuring a successful launch. • In 2016, CMH provided oversight & support for the development of operations,
licensure, & successful implementation of the Crisis Respite Center in Warrenton, Oregon.
• CMH developed an internal and external communications plan. 2. CMH work towards opiate and substance abuse.
• In 2016, CMH leaders Dr Katrina McPherson and Dr Chris Laman have played a major role in the effort to combat prescription drug abuse in Clatsop, Pacific and Tillamook counties. Both sit on the Clinical Advisory Panel for the Clatsop Pacific CCO. Both are also members of the CPCCO Opiate Task Force. In 2016 this task force organized a Community Opiate Summit to increase awareness about the opiate epidemic, developed new clinical prescribing guidelines for local providers, helped to expand access to treatment for opioid use disorders, and provided opportunities for better disposal of medications. CMH now offers the only medication disposal location in Clatsop County located outside of a law enforcement building.
• CMH has agreed to partner with the CPCCO to provide funding for naloxone to local law enforcement. This medication can reverse opiate overdose and save

lives. The Opiate Task Force is also planning another Opiate Summit to discuss improvements made over the past year and create goals for the next.
3. Increase in primary and urgent care services in Warrenton • Increased providers adding 1.0 FTE Physician and 2.5 FTE mid level providers • Increase patient visits from average 575 visits per month in 2014 to average
1,452 visits per month in 2016. 4. Increased # of specialists in our organization.
• Recruited 2nd Orthopedic Surgeon • Recruited Full Time Podiatrist • Recruited 2nd Physician Assistant for Orthopedic Clinic • Recruited 2 General Surgeons and 1 Transition to Practice General Surgeon • Recruited Full Time Cardiologist (Electrophysiology) • Recruited Full Time Oncology NP-PP • Recruited Full Time Pulmonology PA-C
Upcoming Initiatives
Initiative 1. Service Growth: Focus efforts on growing key service lines and continued collaboration with OHSU to strengthen our strategic roots. This initiative and supporting deliverables are linked to CHNA Key Findings: Unmet Needs – Access to Care.
• Deliverable 1. Improve the foundation of primary care through partnership with independent PCPs and growth of existing clinics
• Deliverable 2. Expand capabilities for increasingly complex surgeries to be performed at CMH
• Deliverable 3. Implement Programs to increase our ability to manage healthcare at a distance (Telehealth)
Initiative 2. Strengthen Quality: We will grow our culture of clinical excellence with a continued commitment to quality and safety in order to be the preferred healthcare organization for our community in a rapidly changing environment. This initiative and supporting deliverables are linked to CHNA Key Findings: Unmet Needs – Behavioral Health and Chronic Conditions.
• Deliverable 1. Implement medical home elements of care coordination and chronic care management
• Deliverable 2. Implement an integrated care transitions management program for identified high risk populations

Appendix 7: Progress since last CHNA (PSH)

Evaluation of impact from 2014-2016 Community Health Improvement Plan
Following the prior CHNA, Providence collaborated with community partners to develop a community health improvement plan (CHIP) to address the needs identified below. The top health issues for the 2014-2016 CHNA/CHIP were:
1. Access to preventive and primary care 2. Mental health and substance use treatment services 3. Chronic conditions prevention and management 4. Oral health
The following is an overview evaluating some of the major CHIP efforts and their impact on the identified needs. Prioritized Need #1: Access to preventive and primary care Data Point Previous CHNA Current CHNA Primary care providers 1,373:1 1,330:1 Insurance coverage (percent uninsured) 15.1 percent 2.1 percent
Key activities to improve access to preventive and primary care have included expansion of services available at Providence Seaside, particularly regarding geriatric programs and hiring advanced practice providers. Providence has maintained its commitment to serving the poor and vulnerable by offering fully discounted care for families at or below 300% FPL, and has financial counselors and insurance enrollment assisters available for patients at any time. There are more primary care providers serving Clatsop County than there were in 2013, and insurance coverage has increased substantially. Insurance coverage estimates vary by source, with these values from OHSU’s February 2015 report, “The Impact of the Affordable Care Act on Insurance Coverage in Oregon.” To address access needs of the senior population, Providence opened an ElderPlace location in Seaside, which is a Program for All-inclusive Care for the Elderly (PACE). Prioritized Need #2: Mental health and substance use services Data Point Previous CHNA Current CHNA
Mental health providers* 7,419:1 470:1
Depression (adults) * 26.6 percent Prescription drug use (11th grade students; not prescribed)
9.3 percent 15.2 percent
Suicidal ideation (11th grade students) 17.8 percent 21.5 percent *an asterisk indicates source or measure methodology for the indicator has changed since previous CHNA and the results are not directly comparable.
This section discusses actions taken and their impact to address the significant health needs identified in the prior community health needs assessment and associated implementation strategy
(i.e. community health improvement plan).

As one of the greatest challenges in 2013, many partners in Clatsop County came together to conduct a mental health gap analysis, led with in-kind resource from Providence. After convening several times and mapping out the continuum of care across behavioral health services, community organizations recognized the need for a crisis respite center. In partnership, Providence Seaside, Columbia Memorial, Clatsop Behavioral Health, and others developed a scope of work, budget, and identified a location for the North Coast Crisis Respite Center in Warrenton, OR. The 16-bed facility includes 8 beds for residential services and 8 beds for temporary crisis respite, with the goals of reducing burden on local law enforcement and unnecessary Emergency Department utilization. Internally, Providence has integrated a psychologist into primary care through Providence Medical Group to increase access to outpatient mental health services. Providers have also worked to increase screening for mental health conditions. Prioritized Need #3: Chronic conditions prevention and management Data Point Previous CHNA Current CHNA Hypertension (adults) 31.2 percent 27.5 percent Obesity (adults) 31.4 percent 29.1 percent Diabetes (adults) 7.5 percent 9.7 percent Obese (11th grade students) 12.1 percent 17.9 percent
Providence Medical Group has invested in increased efforts to prevent, manage, and support patients with chronic conditions who are accessing primary care services. These efforts include increased screening, tracking, and referral to services for those who are at-risk or have been diagnosed. Providence opened a retail pharmacy that is open extended hours and allows easier access to prescription medication by offered reduced costs and extended hours. Providence has partnered with other organizations to address chronic conditions as well. Way to Wellville is a community collaborative effort that began in 2014 with funding from the Esther Dyson Foundation. Providence and other organizations have partnered in efforts to increase access to health screenings, physical activity and nutrition, and trauma-informed care initiatives. Over 130 children have received health screenings and 500 families received passes to parks to increase opportunity for recreation. Other programs Clatsop Community Action’s regional food bank and recent co-location at Providence Seaside Hospital to begin piloting a Community Resource Desk model. This program began in fall 2016 and provides a site for CCA in Seaside, as well as a referral resource for patients and community members. Helping Hands Re-Entry Outreach Centers is another important partner that has helped house 413 individuals in the past year, providing over 5,000 person-nights of shelter and more than 9,000 meals. Prioritized Need #4: Oral health Data Point Previous CHNA Current CHNA Dental conditions (Emergency Department) 167 visits 186 visits Medical Teams Intl dental van utilization 277 patients 246 patients Providence was a funding partner for the Oregon Community Foundation’s Children’s Dental Health Initiative, and Providence Seaside Foundation has been an implementing partner to help increase access to preventive oral health services in schools. Providence continues to support Medical Teams International mobile dental van program to provide services in Clatsop County and has training initiatives in place for providers.

Community Health Improvement Plan 2017-2019 Providence Seaside Hospital Clatsop County, Oregon

2 | P a g e
Table of contents Community Health Improvement Plan 2017-2019
Executive summary….………………….... page 4 Introduction….…………………………...... page 5 Purpose of this plan...…………………..... page 6
Community profile ………………………… page 7 Summary of Providence prioritized needs and page 9 associated action plans Prioritized health needs
Access to care………….. page 11 Behavioral health………………….. page 12 Chronic conditions……………………….. page 14 Social determinants of health and well-being page 15
Healthier Communities Together .................. page 17
Plan approval .......................................... page 19
Providence Seaside Hospital 725 S. Wahanna Road
Seaside, OR 97138

3 | P a g e
TO OUR COMMUNITY MEMBERS,
It is with great pleasure that we present the findings of our Community Health Needs Assessment and resulting Community Health Improvement Plan. Over 160 years ago, the Sisters of Providence came to the Northwest with the goal of addressing the most pressing needs of the time. Today, through their Hopes and Aspirations document, the Sisters call us to “be open to the call of those who suffer by addressing emerging needs with wise and discerning responses”. Providence is pleased to partner with many agencies in our communities to address the most pressing health and social determinant needs in each of our service areas. We are uniquely positioned to use our role as a primary, acute, and specialty care provider, insurer, and the largest employer in the state to truly impact the health of our communities.
We are grateful for the partnership of community organizations, survey respondents, listening session participants, interviewees, and many others in the development of these needs assessments and plans. We know that addressing these challenges will require long-term commitment, systemic change, and expertise outside of the health system. Our communities have many strengths, and it is our privilege to support programs and organizations actively addressing these needs, as well as generating momentum to think differently about these services within our own organization.
Finally, let us thank you for your interest in reviewing this plan and engaging in our community health improvement efforts. We believe that this work is central to our strategic vision of creating healthier communities, together.
Sincerely,
Pamela Mariea-Nason, RN, MBA Executive, Community Health Division Providence Health & Services – Oregon

4 | P a g e
Executive summary
PURPOSE This Community Health Improvement Plan is based upon the findings of our 2016 Community Health Needs Assessment. This plan is specifically designed to serve the Jackson County area, which is ProvidenceMedford Medical Center’s primary service area. Each of these interventions will be prioritized based upon relative needs and opportunities, particularly those that serve identified high needs ZIP codes and neighborhoods.
This plan is intended to serve as a guiding document for community investment, community building and development, and community health efforts through 2019. It will be reviewed and updated annually or as needed to recognize new partners, initiatives, and metrics as they are available. Importantly, this plan is not intended to be an exhaustive inventory of all of Providence’s efforts to address these needs. Rather, this document highlights those efforts that are measurable and community-based. This plan should be reviewed in conjunction with our annual Community Benefit report, which will provide additional narrative and will be updated in June of each year.
SUMMARY OF PRIORITIZED NEEDS ACCESS TO CARE
• Primary care • Dental care • Culturally-responsive care
BEHAVIORAL HEALTH • Mental health services (including youth and adolescent suicide) • Substance use treatment • Trauma/adverse experience prevention and building resilience
CHRONIC CONDITIONS • Diabetes • Hypertension • Obesity (particularly amongst youth and adolescents)
SOCIAL DETERMINANTS OF HEALTH AND WELL-BEING • Affordable housing • Healthy food access • Living wage jobs • Transportation
Many of these needs will be directly addressed through internal initatives and community partnerships over the next three years. You will find additional information about our specific actions and how we will measure our success in the following sections .

5 | P a g e
Introduction
CREATING HEALTHIER COMMUNITIES, TOGETHER As health care continues to evolve, Providence is responding with dedication to its Mission and a core strategy to create healthier communities, together. Partnering with others of goodwill, we conduct a formal community health needs assessment to learn about the greatest needs and assets from the perspective of some of the most marginalized groups of people in communities we serve. This assessment helps us develop collaborative solutions to fulfill unmet needs while continuing to strengthen local resources. It guides our community benefit investments, not only for our own programs but also for many partners, toward improving the health of entire populations. Through strategic programs and donations, health education, charity care, medical research and more, Providence Health & Services provided over $1.1 billion in community benefit across Alaska, California, Montana, Oregon and Washington during 2016.
Serving our communities About us Providence Health & Services is a not-for-profit Catholic health care ministry committed to providing for the needs of the communities it serves – especially for those who are poor and vulnerable. Providence's combined scope of services includes 34 hospitals, 475 physician clinics, senior services, supportive housing and many other health and educational services. The health system and its affiliates employs more than 76,000 people across five states – Alaska, California, Montana, Oregon and Washington – with its system office located in Renton, Washington. Our community health activities are rooted in the charitable work the Sisters of Providence started nearly 160 years ago when they answered a call for help from a new pioneer community in the West.
Mission As people of Providence, we reveal God’s love for all, especially the poor and vulnerable, through our compassionate service. Vision Together, we answer the call of every person we serve: Know me, Care for me, Ease my way. ® Values Respect, Compassion, Justice, Excellence, Stewardship

6 | P a g e
Purpose of this plan In 2016 Providence Seaside Hospital conducted a community health needs assessment in partnership with Columbia Memorial Hospital. This community health improvement plan is designed to address key health needs identified in that assessment. The prioritized needs were chosen based on community health data and identifiable gaps in available care and services. In the course of our work, we determined that emphasis on these needs would have the greatest impact on the community’s overall health with significant opportunities for collaboration. These are:
Providence prioritized needs Access to care
• Primary care • Dental care • Culturally-responsive care
Behavioral health • Mental health services • Substance use treatment • Trauma/adverse experience prevention and resilience building
Chronic conditions • Diabetes • Hypertension • Obesity (particularly youth and adolescents)
Social determinants of health and well-being • Affordable housing • Healthy food access • Living wage jobs • Transportation
Our overall goal for this plan As we work to create healthier communities, together, the goal of this improvement plan is to measurably improve the health of individuals and families living in the areas served by Providence Seaside Hospital and across Clatsop County. The plan’s target population includes the community as a whole, and specific population groups including minorities, low-income, and other underserved demographics living in high needs areas. This plan includes components of education, outreach, prevention, and treatment, and features collaboration with other community organizations working in alignment with the Providence Mission to address these identified needs. The plan’s implementation will be facilitated by the hospital through the regional Community Health Division, hospital executive leadership, and members of the Service Area Advisory Council. This plan is intended to serve as a guiding document for community investment, community building and development, and community health efforts through 2019. It will be reviewed and updated annually or as needed to recognize new partners, initiatives, and metrics as they are available. Importantly, this plan is not intended to be an exhaustive inventory of all of Providence’s efforts to address these needs. Rather, this document highlights those efforts that are measurable and community-based. This plan should be reviewed in conjunction with our annual Community Benefit report, which will provide additional narrative and will be updated in June of each year.

7 | P a g e
Community Profile Clatsop County, Oregon
Providence Seaside Hospital primarily serves Clatsop County in Oregon. Providence has one hospital in neighboring Washington County and six others serving the state.
POPULATION AND DEMOGRAPHICS As of 2016, Clatsop County is home to just under 38,000 permanent residents, though the population swells to more than twice that during the summer months. The county has an older population than average, with nearly 20 percent over the age of 65. Across the United States, individuals over the age of 65 make up about 15 percent of the population. The distribution is approximately even between females and males up until the age of 75, at which point there are more surviving females than males. There is a “bubble” of the population between ages 55 and 64, suggesting that older populations may come to Clatsop County to retire, or purchase second homes in the area around that age. Clatsop County also has a lower birth rate than Oregon’s average, which contributes to the proportion of older residents being so high.
4000 2000 0 2000 4000
0-910-1718-2425-3435-4445-5455-6465-7475-84
85+
2016 Population StructureClatsop County, Oregon
Female
Male

8 | P a g e
ETHNICITY The vast majority (83 percent) of residents identify as white non-Hispanic. This percentage is expected to decrease to 81 percent by 2021 as the county diversifies. The greatest percentage change will be amongst Hispanic/Latino individuals and non-Hispanic Asian Pacific Islanders.
INCOME The area’s median household income is $36,300 and the per capita income was below $20,000, substantially less than the State of Oregon as a whole ($49,260 and $26,171, respectively).
HEALTH AND WELLBEING In Clatsop County, nearly 30 percent of adults are obese and there are fewer primary care providers than the state average. Nearly 20 percent of survey respondents went without needed dental care, and dental conditions are the second-most common reason that vulnerable populations come to the Emergency Department. Over 26 percent of adults suffer from depression.
0 10000 20000 30000 40000 50000
2016
2021
Self-Reported Race/Ethnicity of Clatsop County Residents
White non-Hispanic
Black non-Hispanic
AI non-Hispanic
API non-Hispanic
Other non-Hispanic
2+ races non-Hispanic
Hispanic/Latino

9 | P a g e
SUMMARY OF PROVIDENCE PRIORITIZED NEEDS
AND ASSOCIATED ACTION PLANS The prioritized needs were chosen based on various community health data and identifiable gaps in available care and services. These health needs were those that had worsened over time, are worse than the state or national average, or have a disproportionate impact on those who are low-income, communities of color, or otherwise marginalized populations. In the course of our work, we determined that emphasis on these needs would have the greatest impact on the community’s overall health with significant opportunities for collaboration. These interventions will be prioritized based upon relative needs and opportunities, particularly those that serve identified high needs ZIP codes and neighborhoods including low-income and minority populations.
ACCESS TO CARE • Timely and consistent access to primary care remains a challenge, particularly for those on the Oregon
Health Plan (Mediciad) and the remaining uninsured. • Dental conditions are among the top preventable reasons uninsured individuals access the Emergency
Department, which is rarely the best point of care for these conditions. This presents opportunity for prevention education and increasing access to preventive services.
• As the population is diversifying, it is increasingly important that community members feel welcome, safe, and respected in healthcare settings. One of the greatest opportunities to improve health amongst low-income and minority communities is to increase access to culturally-responsive care.
BEHAVIORAL HEALTH • Mental health services remain a barrier for many community members. There is need to reduce stigma
associated with mental health treatment and increase availability of providers and treatment services. This is particularly true amongst youth and adolescents, presenting opportunities to partner with school-based health centers.
• Access to substance use treatment continues to be a challenge for many. This includes alcohol and drug addiction services, both residential and outpatient treatment options. Oregon has relatively high rates of death from drug overdose, drug use (heroin, methamphetamines, and narcotics), and binge drinking.
• As we continue to learn about adverse childhood experiences (ACES) and the impacts of trauma on health later in life (i.e. child abuse, neglect, domestic violence, sexual assault, etc), increasing community resilience and preventing exposure to these events in the first place has become increasingly important.

10 | P a g e
CHRONIC CONDITIONS • Diabetes continues to be one of the top reasons uninsured adults seek care in an Emergency Department,
though the condition is likely better managed in a primary care setting. This suggests opportunities regarding prevention, education, and nutrition support.
• Similarly, hypertension is among the top three diagnosed conditions in uninsured adults using the Emergency Department. The fact that emergency care was required suggests need for primary care, education regarding self-management, medication access, and nutrition support.
• Obesity is a public health challenge, for both youth and adults. The current generation of youth may be the first to have a shorter life expectancy than their parents due to complications from obesity and its associated conditions.
SOCIAL DETERMINANTS OF HEALTH AND WELL-BEING • Affordable housing (or housing accessibility) is a major challenge for low and moderate income families in
the area, particularly for those in recovery. Housing and rental prices are increasing faster than the median income, making it difficult for people to stay close enough to their places of employment, care, and children’s school. Safe, secure housing has been proven to improve health outcomes.
• A key barrier for many of Oregon’s families continues to be healthy food access. More than half of the state’s students are on free or reduced price lunch, with the Seaside School District serving populations where over 58 percent of the students qualify. Improvements in nutrition can further improve oral health and chronic conditions.
• Economic development and living-wage jobs are key opportunities to improve the health and well-being of our communities. Families expressed concern about working full-time or multiple jobs and still not being able to afford healthy food or housing. Adverse experiences and trauma are more likely in low-income households, particularly those in which the parents are stressed about resources. This also speaks to the challenge in Oregon of the “benefits cliff,” whereby families lose many of their social service benefits at the same point.
• Transportation is a challenge for some populations, particularly for the elderly and those in more rural areas. Many are dependent on others for rides to work, medical appointments, or other basic errands.

11 | P a g e
ACCESS TO CARE
Goals
• Community members will have improved access to timely, consistent primary care • Community members will experience more accessible preventive and primary dental care and improved
oral health • Community members will be able to receive healthcare services in a culturally-responsive and welcoming
setting
Objectives
• Providence Medical Group will continue to provide care for over 1,500 Oregon Health Plan members • Support federally-qualified health centers (FQHC) and school-based health centers (SBHC) to extend hours
and services to improve primary care access • Support at least 10 free- or reduced-cost dental clinics per year and reduce Emergency Department visits
for dental conditions • Improve access to preventive oral health care services for school-aged youth
Action plan and baseline or proposed measurement
Action plan 2016 baseline or proposed measurement
Improve access by providing primary care homes for Oregon Health Plan members in Providence Medical Group Current CCO enrollment (December 2016): 1,718
Partner with Medical Teams International to provide mobile dental services 174 adults received dental care
Implement the Children’s Dental Health Initiative grant through Providence Seaside Foundation in partnership with Clatsop County schools
Number served; sealants provided
Existing partners Partners listed above are highlighted here to note the specific area their program(s) address. A more complete list of potential partners is provided at the end of this document.
Organization Primary Care
Dental Care
Culturally-Responsive
Children’s Dental Health Initiative x x x Columbia Pacific CCO x Medical Teams International x

12 | P a g e
BEHAVIORAL HEALTH
Goals
• Community members will have increased access to timely and affordable mental health treatment, including supportive services and therapy
• Stigma associated with mental health and substance use will be reduced • Community members will have improved access to substance use treatment when needed, including
residential or outpatient services as appropriate • Fewer children will experience abuse, neglect, racism, discrimination, and other adverse experiences that
are harmful throughout life and negatively impact health outcomes. Adults with traumatic experiences will be supported in their recovery through resilient communities.
Objectives
• At least three Mental Health First Aid trainings will be provded in a train-the-trainer model • Implement stigma reduction training and social media campaign through high schools and school-based
health centers beginning Fall 2018 • All providers will have access to trauma-informed care training; at least 80% of Emergency Department
providers will have received training in trauma-informed care by December 2019
Action plan and baseline or proposed measurement
Action plan 2016 baseline or proposed measurement
Implement mental wellness and anti-stigma campaign in partnership with local schools
Number of youth reached by peer-generated messages; uptake of mental health/crisis services
Partner with Foster Club to provide peer support services for foster youth
Number served; curriculum developed; peers serving
Partner with NAMI Oregon to support Mental Health First Aid training (train-the-trainer) Number of trainees certified as trainers
Provide training in trauma-informed care for Emergency Department and other providers Number of staff trained (ED and other)
Partner with Restoration House to provide safe housing for individuals re-entering the community Number trained; students reached
Partner with The Harbor to support mothers and children escaping domestic violence and support them in recovery 197 youth and 460 adults served (6 months)
Support ongoing operations of Caring for Clatsop Respite Center to improve behavioral health access Number served

13 | P a g e
Existing partners
Partners listed above are highlighted here to note the specific area their program(s) address. A more complete list of potential partners is provided at the end of this document.
Organization Mental health services
Substance use treatment
Trauma prevention
Caring for Clatsop Respite Center x x x Foster Club x x NAMI Oregon x x Restoration House x x The Harbor x x x

14 | P a g e
CHRONIC CONDITIONS
Goals
• Community members will have improved access to education and self-management cirriculums for chronic disease in both English and Spanish
• Chronic disease burden will be reduced, particularly within communities of color • Community members will have increased opportunity for physical acticity and nutritious eating,
particularly youth and adolescents
Objectives
• Emergency department utilization for chronic conditions, particularly diabetes and hypertension, will be reduced through increased access to primary care and meeting social determinant needs
• Patients with diagnosed conditions will have access to chronic condition self-management education • Individuals with diagnosed chronic conditions will have unmet social needs addressed as part of care • More youth will report adequate physical activity and healthy behaviors due to Providence’s Healthier
Kids, Together Initiative
Action plan and baseline or proposed measurement
Action plan 2016 baseline or proposed measurement
Partner with Way to Wellville on Clatsop County Kids Go and Rx Play programs
Participation; behavior change; health status
Partner with Sunset Empire Parks and Recreation District to implement childhood obesity prevention project
Number served; behavior change
Implement 5-2-1-0 messaging in clinics and with community partners
Clinics providing 5-2-1-0 messaging; health behavior change
Explore opportunities to offer subsidized chronic conditions self-management education
Project plan complete
Existing partners
Partners listed above are highlighted here to note the specific area their program(s) address. A more complete list of potential partners is provided at the end of this document.
Organization Diabetes Hypertension Obesity Sunset Empire Parks and Recreation District x
Way to Wellville x

15 | P a g e
SOCIAL DETERMINANTS OF HEALTH AND WELL-BEING
Goals
• Community members will have improved access to safe, stable housing • Community members will have increased access to affordable healthy food • Community members will be able to support themselves and their families on one full-time job (or
equivalent) • Community members, particularly elderly and those in rural communities, will have access to convenient,
frequent public transit or ride share services
Objectives
• Provide safe and secure discharge for at least 250 individuals needing short-term social service support annually
• Fewer working families will report having to work multiple jobs to make ends meet • Fewer elderly adults and community members will recognize transportation as a barrier to receiving
needed primary care and safe discharge • Community members and providers will have increased awareness of and access to available social
service resources
Action plan and baseline or proposed measurement
Action plan 2016 baseline or proposed measurement Partner with Clatsop Community Action to implement Community Resource Desk program
230 served (6 months)
Partner with Project Access NOW to connect eligible clients to Patient Support Program
288 patients supported with social needs for safe discharge
Partner with Helping Hands Re-entry Outreach Centers to provide emergency shelter, food, and services
2,027 person-nights provided
Support the Oregon Business Council's Poverty Reduction Task Force, including policy reform for working families
Legislation that supports working families and eases the "benefits cliff"
Partner with Partners for a Hunger-Free Oregon to support summer meal sites
Number served; enrichment activities
Support 211-info to provide community and provider trainings on local social service resources
Trainings completed; number of attendees

16 | P a g e
Existing partners
Partners listed above are highlighted here to note the specific area their program(s) address. A more complete list of potential partners is provided at the end of this document.
Organization Housing Food Jobs Transportation 211-info x x x
Clatsop Community Action x x x x
Helping Hands Re-entry x x x
Oregon Business Council x
Partners for a Hunger-Free Oregon x Project Access NOW x x x

17 | P a g e
Healthier Communities Together
As outlined, Providence is working to address each of the identified needs in a variety of ways over the next three years. That said, it is important to note that some of this work will be completed in more indirect ways than others. To address systematic issues, like living wage jobs, Providence will work with a diverse coalition of stakeholders to move this issue forward. Utilizing our relationships with elected officials, business leaders and union representatives – we are well positioned to promote public policy changes that support Oregon families.
Although the built environment was not specifically called out, we recognize that it is an important component of the health and well-being of our communities. Our priority areas and initiatives were selected based on our findings from relevant data, conversations with people living in our community and the opportunities we have to make marked improvements in the coming years. We will seek out opportunities to support local jurisdictions and community organizations focused on access to safe parks, pedestrian and bicycle-friendly transportation, and other components of the built environment that lead to improved health outcomes.
Providence cannot address the significant community health needs independently. Improving community health requires collaboration across community stakeholders. Below outlines a list of community resources potentially available to address identified community needs.
Organization Associated Community Need(s)*
211-info SDH Cannon Beach Food Pantry SDH Caring for Clatsop Respite Center BH Children’s Dental Health Initiative AC City of Seaside SDH Clatsop Behavioral Health BH Clatsop Community Action SDH Clatsop Commnity College SDH Coastal Family Health Center AC, CC Columbia Memorial Hospital Funding/coordinating partner Columbia Pacific CCO AC, Funding/coordinating partner Foster Club BH Lower Columbia Hispanic Council AC Helping Hands Re-entry AC, BH, CC, SDH Medical Teams International AC NAMI Oregon BH Northwest Senior and Disability Services AC, BH, SDH Oregon Business Council SDH Partners for a Hunger-Free Oregon SDH Project Access NOW AC, SDH Restoration House SDH Seaside School District BH, SDH South County Community Food Bank SDH

18 | P a g e
St. Vincent de Paul SDH Sunset Empire Parks and Recreation District CC The Harbor BH, SDH Way to Wellville CC, SDH
*Legend: AC=Access to care, BH=Behavioral health, CC=chronic conditions, SDH=social determinants of health and well-being
