provenancematrix: a visualization tool for multi-taxonomy ...ceur-ws.org/vol-1456/paper2.pdf ·...
TRANSCRIPT

ProvenanceMatrix: A Visualization Tool forMulti-Taxonomy Alignments
Tuan Dang1, Nico Franz2, Bertram Ludascher3, and Angus Graeme Forbes1
1University of Illinois at Chicago, Chicago, IL, USA2Arizona State University, Tempe, AZ, USA
3University of Illinois at Urbana-Champaign, IL, USA
Abstract. Visualizing and analyzing the relationships between taxonomic enti-ties represented in multiple input classifications is both challenging and requireddue to recurrent new discoveries and inferences of taxa and their phylogeneticrelationships. Despite the availability of numerous visualization techniques, thelarge size of hierarchical classifications and complex relations between taxo-nomic entities generated during a multi-taxonomy alignment process requiresnew visualizations. This paper introduces ProvenanceMatrix, a novel tool allow-ing end users (taxonomists, ecologists, phylogeneticists) to explore and compre-hend the outcomes of taxonomic alignments. We illustrate the use of Provenance-Matrix through examples using taxonomic classifications of various sizes, from afew to hundreds of taxonomic entities and hundreds of thousands of relationships.
Keywords: Taxonomic classification, multi-taxonomy alignment, phylogeneticrelationship, matrix representation, glyph-based visualization
1 Introduction
Visualization tools developed for the field of biological taxonomy (herein broadly de-fined to include phylogenetics) may focus on representing the information content ofone comprehensive classification, or provide visual information on the relationshipsbetween taxonomic entities represented in multiple, alternative classifications [9, 11].The latter visualization services are useful in particular for illustrating important sim-ilarities and differences in taxonomic perspective, which may be empirically rooted inthe discovery of new taxonomic entities, new evidence of phylogenetic relationship, orin the differential sampling and weighting of phylogenetic evidence [10]. Such multi-taxonomy comparisons can be viewed as a solution to the challenge of representingtaxonomic provenance [11], i.e., linking a taxonomy T1 to another (pre- or postced-ing) taxonomy T2. To achieve this, taxonomic concepts endorsed by each alternativeclassification are individuated using taxonomic concept labels with the syntax: taxo-nomic name sec. (according to) taxonomic source [8]. Linkage of same-sourced con-cepts via parent-child (is-a) relationships permits the assembly of multiple independentclassifications, and therefore presents new opportunities for inferring and visualizingtaxonomic provenance across multiple classifications.
Here were describe ProvenanceMatrix, a novel tool for visualizing some of theknowledge products of EULER/X, a multi-taxonomy alignment toolkit [1]. EULER/X is
13

a logic-based reasoning software capable of aligning (or “merging”) two or more taxo-nomic concept hierarchies, using different underlying inference mechanisms, in partic-ular, answer sets [12] and qualitative reasoning using RCC-5 constraints [15]. The rea-soning process models taxonomies T1 and T2 as sets of is-a constraints, together with aset A of expert-asserted input articulations that relate concepts in T1 with those in T2,typically at the leaf level. Using RCC-5 (Region Connection Calculus) relations, the ex-pert can express through the articulations in A which relation holds between a conceptT1.X and a concept T2.Y , i.e., equals, includes, is included in, overlaps, or disjoint.If the precise relationship is not known, then one of the non-elementary 25 = 32 dis-junctive combinations of the 5 base relations can be used to express this uncertainty[17].
Fig. 1(a) shows two input taxonomies and the expert articulations. The alignment(or merge) result is depicted in Fig. 1(b). Further below (e.g., see Fig. 4), we propose toreplace this view with a more dynamic ProvenanceMatrix view, juxtaposing conceptsof T1 (as rows) and of T2 (as columns). In principle, we could also do this for the inputdata in Fig. 1(a), but it is primarily the alignment result in Fig. 1(b) that a user will wantto visualize and explore.
The toolkit workflow iteratively guides the expert user towards identifying sets of in-put articulations that are both logically consistent and sufficiently specific to yield onlya limited number of consistent alignments [2]. An important product of the alignmentprocess is the set of Maximally Informative Relations (MIR): for any pair (C1, C2) ofconcepts from T1, T2, the MIR of (C1, C2) is the unique relation in the powerset latticeR32 over the RCC-5 base relations which implies all other relations that hold betweenC1 and C2, given T1, T2 and A.
The MIR play a critical role in generating the set of consistent alignments (“possi-ble worlds”), in diagnosing undesired ambiguities in the input or output articulations,and generally in understanding the toolkit reasoning outcomes. Visualization tools areimportant in this context because the number of MIR for two taxonomies with m and nconcepts, respectively, is m × n. For instance, the alignment use case of Primates sec.Groves (1993; T1) and Primates sec. Groves (2005; T2) contains 317× 483 taxonomicconcepts and hence 153,111 MIR relations [11]. Displaying the MIR in list format isnot an effective method for exploration. Instead users need dynamically rendered, scal-able visualization solutions to navigate the large and semantically complex reasoningoutcomes and adjust the input accordingly to achieve the desired alignments.
Key visualization challenges for multi-taxonomy alignment outcomes include thefollowing scenarios. Frequently the alternative taxonomies have unequal sets of leaf-level children. For instance, recently published taxonomies may include new species-level concepts for which there are no corresponding entities in preceding classifica-tions [9]. Additionally, the visualization must display large numbers of data points(> 150,000 in the medium-sized Primate use case), where each point can be constitutedby any subset of RCC-5 articulations in the R32 lattice. In order to empirically assessthe reasoner-inferred articulations, users may also need to access taxonomic provenanceinformation such as feature-based diagnoses, illustrations, and other taxonomic infor-mation.
ProvenanceMatrix: A Visualization Tool for Multi-Taxonomy Alignments
14

Using ProvenanceMatrix, we can visualize alignments of large taxonomies with upto hundreds of concepts. Our technique uses matrix representation and glyphs in eachcell to highlight RCC-5 articulation sets and alignments. In Section 4, we demonstratehow our technique effectively facilitates the exploration of multi-taxonomy alignmentswith varying sizes and levels of alignment ambiguity.
2 Related Work
An overview of the EULER/X multi-taxonomy alignment approach is provided in [9].Fig. 1 shows the current visualizations of two related concept taxonomies, plus artic-ulations among the respectively entailed taxonomic concepts. The aim is to visualizethe input taxonomies T1 and T2 and the resulting merged visualizations (rendered withGraphViz [6]). In the figure, “==” means equals, “<” means is included in, “>” meansincludes, “><” means overlaps, and “|” means disjoint. The final product is a mergedtaxonomy (as depicted in Fig. 1(b)) that represents the concept-level similarities and dif-ferences among the aligned input trees. However, current GraphViz visualizations arenot interactive and do not facilitate efficient exploration of ambiguous (under-specified)articulations which generate multiple possible world solutions. Resolving ambiguity isa critical aspect of the alignment process.
Fig. 1. Abstract toolkit input and output example rendered with GraphViz: (a) Representation oftwo input taxonomies T1 (left) and T2 (right) and articulations in the toolkit input file. (b) Single,consistent alignment of the input shown as a containment with overlap graph.
Tanglegrams are widely used in biology, for instance to represent the inferred evolu-tionary histories of rooted phylogenetic networks [16] and to highlight common struc-tures as well as differences in multiple DNA sequences [18]. A tanglegram draws tworooted trees with the leaves opposing each other and uses auxiliary lines to connectmatching taxonomic entities at the leaf-level. These auxiliary lines can be rendered indifferent styles or colors to encode different types of relationships (e.g., host-parasiteassociations).
The Concept Relationship Editor [3] extends the alignment process to support as-sertions of relationships between taxonomic classifications at all levels of each alignedhierarchy. Concept Relationship Editor adopts a space-filling adjacency layout whichallows users to expand multiple lists of taxonomic concepts with common parents. The
ProvenanceMatrix: A Visualization Tool for Multi-Taxonomy Alignments
15

lens mode and scroll mode are two different ways to navigate across the hierarchy ofeither classification while ensuring that the text strings in focus remain legible. Linesare used to connect the related taxa with symbols at either end to indicate the relation-ship type. Similar to tanglegrams, this technique can introduce visual clutter due to edgecrossings as the number of taxa increases.
Fig. 2. An example of the icicle treerepresentation and colored bands tohighlight articulations between pairs oftaxonomic concepts. (credit MichaelMcGuffin)
An alternative visualization approach utilizesicicle tree representations [14]. The RCC-5 rela-tionships are colored bands to connect pairs oftaxonomic concepts. Neighboring bands of thesame color are bundles that reduce cognitive load.Spaces between concepts of one taxonomy maybe used to better align the two trees and reducecrossed bans. In addition, nodes may be color-coded to indicate what percentage of a node’s de-scendants are congruent or not. Figure 2 shows anexample of the icicle tree representation. In the di-agram shown, purple means equals or congruent(==), black means is included in or subset (<),blue means overlaps (><). However, this tech-nique is only suitable for smaller numbers of con-cepts or aggregate views of large classifications.When we try this technique on a large number oftaxonomic concepts, and especially when multi-ple articulations between paired concepts must be displayed, the visualization becomescluttered due to band crossings.
3 Design Motivation
In this section, we review the primary challenges inherent in displaying RCC-5-based,multi-taxonomy alignments. Addressing these challenges has motivated us to create anew visualization technique that better supports the visual exploration tasks relevant tosuch taxonomic reasoning products.
The EULER/X input (constraint) and output (alignment) visualizations as depictedin Figure 1 present slightly different sets of challenges. They are currently produced bytoolkit-native stylesheets that translate the user input and reasoner output into GraphViz-compatible data files. While there is some limited flexibility in tweaking the GraphVizoutput using EULER/X stylesheet options1, the ranked graph layout computed by Graph-Viz may not reflect the user’s intuitions regarding the spatial arrangement of conceptsand relationships. For example, the ordering of children of a parent concept computedby GraphViz is different from the order in which they appear in the source publicationsfor that taxonomy. This can create unintuitive experiences for the user.
Smaller scale visualization enhancement goals is improving usability for annotat-ing/editing the GraphViz output data files. Larger scale goals entail acquiring the ability
1 The stylesheet options result in different GraphViz attribute settings, e.g.,“constraint=false” ignores certain edges for layout purposes.
ProvenanceMatrix: A Visualization Tool for Multi-Taxonomy Alignments
16

to export/edit EULER/X visualizations in other (phylo-visualizing) platforms (however,a related challenge is that the most popular programs may not support EULER/X se-mantics which mandate the use of taxonomic concept labels, parent/child relationship[same taxonomy], RCC-5 relationships [across taxonomies], and merge concepts labels[AB, Ab, aB]).
Here, we provide an overview of some of the main visualization tasks for visualizingrelated concept taxonomies (hierarchies), as well as the relations between the conceptsin the input taxonomies. Given two or more taxonomies:
T1. Focus on specific articulations.T2. Provide different ways to organize hierarchies. This helps to compare structure
of the input taxonomies.T3. Highlight taxonomic concepts in one classification that stand in various specific
and incongruent relations to concepts in the other classification.T4. Find related concepts and subtrees of one taxonomic classification to the other
taxonomic classification.T5. Display details on demand. In particular, users want to be able to overlay
distinctions between user-provided and toolkit-inferred articulations (i.e., articulationsource), and display additional domain-relevant information (such as characters, im-ages) when mousing over a concept label.
T6. Collapse and expand a subtree to simplify or fully explore a branch. This featureis particularly useful when dealing with large taxonomies.
4 Methods
Matrix representation is a useful tool for visualizing networks in many application do-mains, such as protein-protein biological interactions [5] and social networks [7]. Thistechnique is superior to using node-link diagrams when the networks are dense, giventhat edge-crossings are the main limitation of node-link diagrams in visualizing thesenetworks. A drawback of matrix representation is the inability to represent the flow ofthe networks [4]. However, since network flow is irrelevant in multi-taxonomy align-ments, we found matrix representation to be best suited for visualizing the data productsdiscussed above. Moreover, matrix representation enables the display of multiple (dis-junct) relationships that may exist between a pair of elements from both dimensions ina matrix [5].
Figure 3 shows an example of ProvenanceMatrix for the Perelleschus classifica-tions [9]. Each side of the matrix displays an input taxonomy. The arcs are used toindicate hierarchical information, directed from parent to subordinate child concepts.MatLink [13] also uses arcs to indicate relationships but only considers undirected net-works. Moreover, the taxonomic concept labels are also indented appropriately to high-light hierarchical arrangement of each input classification. In each cell of the matrix weuse circular sectors, divided similarly into a pie-chart, to indicate the articulations thathold true between two taxonomic concepts, where each sector (pie-slice) in the circleis given a color to consistently indicate the articulation type. The more pie-slices areshown, the less we know about the pair of concepts. Thus, a “full circle” (with all 5 pie-slices) means we know nothing about a relation. These “full circle” can act as “alerts”
ProvenanceMatrix: A Visualization Tool for Multi-Taxonomy Alignments
17

to the user that the alignment is problematic (too ambiguous). Conversely, a single sliceis the best case, specifying a unique (fully specified) relationship between two concepts.Color legend is depicted on the right of Figure 3. For example, green represents equalsand blue represents includes. We use the same color coding for articulations in the therest of this paper. Users can enable or disable an articulation type as desired (T1).
Fig. 3. An example showing the use of Prove-nanceMatrix for the Perelleschus classifications.
ProvenanceMatrix supports three waysof ordering taxonomic concepts, de-signed to highlight different aspects ofthe input hierarchies as well as theirRCC-5 articulations. (1) Ordering thematrix with respect to the structure of theinput trees. Figure 4 shows Provenance-Matrix with different orderings of taxo-nomic concepts (T2). (1.1.) Breadth-firstordering in Figure 4(a) lists all siblingtogether before diving into their respec-tive child-level concepts. (1.2.) Depth-first ordering in Figure 4(b) lists the chil-dren right after each taxonomic concept.The hierarchy is more readable in this or-dering since there are no crossing arcs in the same taxonomic classification. To avoid theoverlapping between arcs and glyphs in the matrix, we can replace arcs by straight linesconnecting parent to child concepts. (2) In Figure 4(c), we order the taxonomic con-cepts based on the similarity of their articulation sets. (The details of how we computesimilarity and the ordering algorithm are described in [5].) This ordering brings con-cepts with multiple alignments to the top left corner of the matrix; these multiple align-ments generate the 160 possible worlds in the taxonomy alignment of Gymnospermaesec. Weakley (2010) versus RAB (Radford, Ahles and Bell) (1968) [9]. The exampleshows ambiguities in the multi-taxonomy alignment which our visualization softwarecan readily identify and isolate to facilitate user-mediated diagnosis and resolution ofsuch ambiguities. In addition, congruent relations (in green) are pushed further to thebottom right of the matrix.
Due to the discovery and/or inclusion of new taxonomic entities in the later (2010)classification, the alternative taxonomies have unequal sets of leaf-level children. Inother words, recently published taxonomies may include new species-level conceptsfor which there are no corresponding entities in preceding classifications. Accordingly,in ProvenanceMatrix, we classify taxonomic concepts into three different categories(T3):
– Neither the concept nor any of its children of one taxonomy have congruent rela-tionships with entities in the other taxonomy. In other words, a (set of) concept(s)has no match whatsoever (“bad apples”). Such concepts are highlighted in red inFigure 5.
– A parent-level concept is incongruent but entails one or more congruent child-levelconcepts. In other words, the higher-level concepts is a unique conglomerate of
ProvenanceMatrix: A Visualization Tool for Multi-Taxonomy Alignments
18

Fig. 4. Visualizing the alignment of Gymnospermae sec. Weakley (2010) vs. RAB (1968) [9]:(a) Breadth-first ordering (b) Depth-first ordering (c) Order by similarity.
ProvenanceMatrix: A Visualization Tool for Multi-Taxonomy Alignments

variously congruent subentities, some of which have matching entities in the othertaxonomy. Such parent-level concepts are the dark green entities in Figure 5.
– A concept has at least one congruent relationship with a concept in the other tax-onomy. Such concepts are highlighted in green.
In Figure 5, we also show brushing and linking to highlight the corresponding sub-trees of the aligned taxonomic classifications (T4). An associated subtree is discoveredbased on the presence of congruent relationships which are connected by green lines. Inthis example, the associated subtree (on the left) of Pinus sec. 2010/1968 (in the box)is discovered in light of its aligned children, not the selected (higher-level) taxonomicconcept itself. Notice that half of the children (in red) of Pinus sec. Weakley (2010)have no congruent match in the RAB (1968) classification.
Fig. 5. Brushing Pinus sec. 2010/1968 in the Gymnospermae use case [9]. Red are incongruentconcepts, dark green are incongruent but (some of) the children are congruent, green are congru-ent.
Additional information and sample images (e.g., from Wikipedia pages of whichmay entail taxonomic concept information) can be displayed on demand when mousingover a taxonomic concept label (T5). Moreover, users can request to overlay the sourceof articulations (i.e., user input, reasoner inference). Figure 6 shows an example ofoverlaying such articulation sources in a non-domain demonstration alignment of U.S.regional classifications from National the Diversity Council and Big Data Hubs, respec-tively. In particular, black cells indicate user input whereas light blue and pink cells arededuced and inferred articulations. Notice that articulation types (circular sectors) arestill visible in each cell.
ProvenanceMatrix offers two ways navigate and comprehend larger classificationsof hundreds of taxonomic concepts: (a) lensing and (b) collapsing a subtree of the input
ProvenanceMatrix: A Visualization Tool for Multi-Taxonomy Alignments
20

Fig. 6. Visualizing a non-domain, demonstration alignment of U.S. regional classifications. Blackcells are user input whereas light blue and pink cells are deduced and inferred articulations.
hierarchies (T6). Figure 7 shows a use case of aligning the Primates sec. Groves (1993)and sec. Groves (2005) that contains 317*483 taxonomic concepts and hence 153,111MIR [11]. Figure 7(a) shows lensing on a sub-section of the matrix, where only theconcept labels (about 20 labels) in the lensing area are printed out. Figure 7(b) showscollapsing of a section of the input hierarchies. A plus sign appears in front of thosetaxonomic concept labels which are collapsed. ProvenanceMatrix also provides search-ing capability. When users input a concept name into a textbox, ProveanceMatrix onlyexpands the subtree of the search concept and collapses other irrelevant subtrees. At thesame time, only related concepts in the other taxonomic classification are expanded.
The ProvenanceMatrix application, source code, and an accompanying video tuto-rial are available online via our project repository.2
5 Expert User Feedback
The herein provided use cases were provided by EULER/X user and co-author NMF,whose feedback has driven the optimization of the new visualizations. ProvenanceMa-trix confers two immediate and new visualization services:
2 https://github.com/CreativeCodingLab/ProvenanceMatrix.
ProvenanceMatrix: A Visualization Tool for Multi-Taxonomy Alignments
21
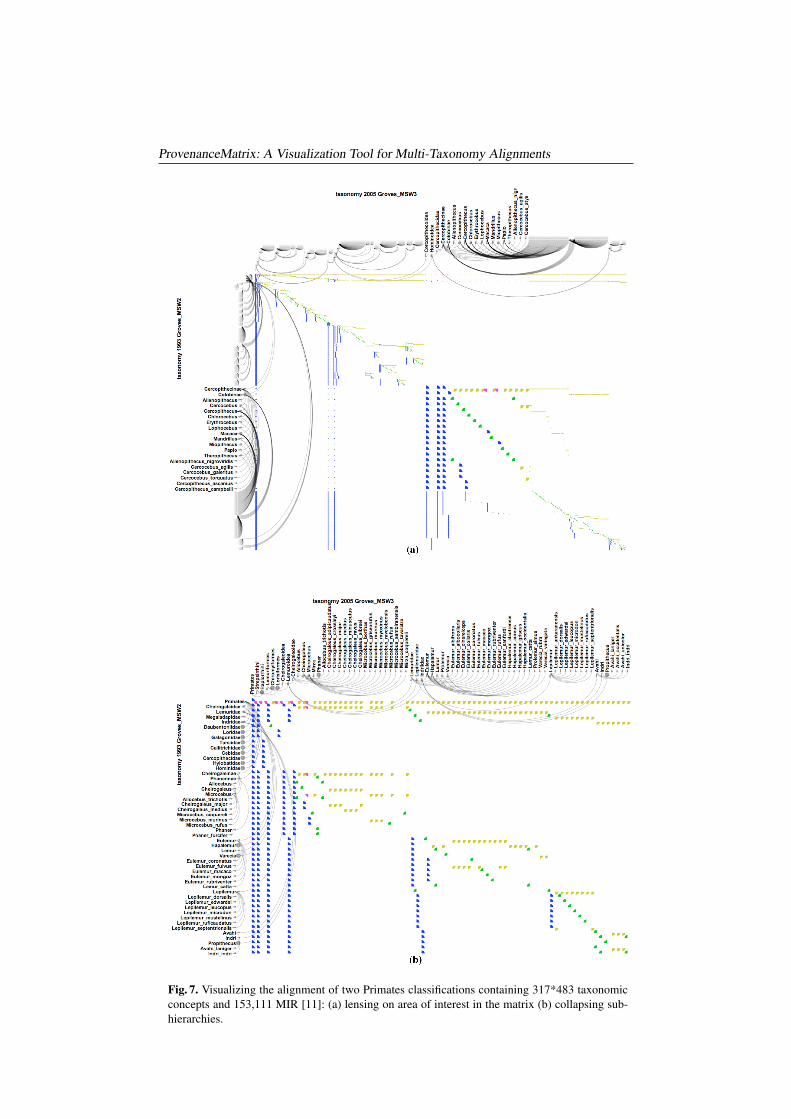
Fig. 7. Visualizing the alignment of two Primates classifications containing 317*483 taxonomicconcepts and 153,111 MIR [11]: (a) lensing on area of interest in the matrix (b) collapsing sub-hierarchies.
ProvenanceMatrix: A Visualization Tool for Multi-Taxonomy Alignments

(1) In cases where certain concept-to-concept articulations are ambiguous (RCC-5disjunctions) in the output, the corresponding concepts can be spatially aggregated andthus identified very easily by the user. This can lead to an accelerated understandingand subsequent removal of the ambiguity issues. Without the visualization, one has toinstead “comb through” a spreadsheet that may contain many thousands of rows ofdata. We have succeeded in scaling ProvenanceMatrix to this level, even with 153,111articulations in the Primates sec. 2005/1993 use case [11].
(2) We can show “information expression” that is newly acquired through the EU-LER/X toolkit reasoning process. For instance, in the Primates use case the expert userprovided 402 pairwise input articulations. The reasoning process produces from this153,111 pairwise MIR relations, i.e., about 380 times as many articulations are logi-cally implied by the input but were not explicitly stated therein. The differential levelsof information expression before and after the reasoning process are correspondinglyvisualized with ProvenanceMatrix through two matrix versions, and thus show the pow-ers of the reasoning approach.
In summary, ProvenanceMatrix provides speedy and interactive identification ofambiguous input and newly inferred output information, presenting a major improve-ment over existing visualizations.
6 Conclusion and Future Work
This paper introduces a novel technique, ProvenanceMatrix, for visualizing the prod-ucts of a multi-taxonomy alignments generated with the reasoning toolkit EULER/X.Using ProvenanceMatrix, users (taxonomists, ecologists, phylogeneticists) can visual-ize alignments of large taxonomies with up to hundreds of input concepts. Glyphs ineach cell highlight RCC-5 articulations for a pair of taxonomic concepts. Provenance-Matrix supports a range of desirable user interactions, such as filtering the matrix byarticulations, ordering taxonomic entities with respect to the structure of the input hier-archies, brushing and linking concepts, and collapsing/expanding sub-hierarchies. Wehave demonstrated how our application effectively facilitates the exploration of multi-taxonomy alignments with different levels of alignment ambiguity and varying sizes,from a few to hundreds of taxonomic entities (and hundreds of thousands of relation-ships). This technique can be extended to visualize more than two taxonomic classifica-tions – a feature in development for the corresponding reasoning toolkit. In particular,we can have multiple input classifications aligned by rows and columns, where eachpair of taxonomic classifications forms a new ProvenanceMatrix. In other words, wecan create a matrix of ProvenanceMatrix matrices, where each cell contains a matrix(similar to the idea of a scatterplot matrix). Future work will investigate this strategy toenable multi-dimensional alignments.
Acknowledgements
This work was funded by the DARPA Big Mechanism Program under ARO contractWF911NF-14-1-0395, and in part by the National Science Foundation through NSFDEB-1155984, DBI-1342595, NSF IIS-118088, and DBI-1147273.
ProvenanceMatrix: A Visualization Tool for Multi-Taxonomy Alignments
23

References
1. M. Chen, S. Yu, N. Franz, S. Bowers, and B. Ludascher. Euler/x: A toolkit for logic-basedtaxonomy integration. CoRR, abs/1402.1992, 2014.
2. M. Chen, S. Yu, N. Franz, S. Bowers, and B. Ludascher. A hybrid diagnosis approachcombining black-box and white-box reasoning. In A. Bikakis, P. Fodor, and D. Roman,editors, Rules on the Web. From Theory to Applications, volume 8620 of Lecture Notes inComputer Science, pages 127–141. Springer International Publishing, 2014.
3. P. Craig and J. Kennedy. Concept relationship editor: a visual interface to support the asser-tion of synonymy relationships between taxonomic classifications, 2008.
4. T. N. Dang, P. Murray, J. Aurisano, and A. G. Forbes. ReactionFlow: Visualizing relation-ships between proteins and complexes in biological pathways. BMC Proceedings, 9(6):S6,August 2015.
5. T. N. Dang, P. Murray, and A. G. Forbes. PathwayMatrix: Visualizing binary relationshipsbetween proteins in biological pathways. BMC Proceedings, 9(6):S3, August 2015.
6. J. Ellson, E. R. Gansner, E. Koutsofios, S. C. North, and G. Woodhull. Graphviz - OpenSource Graph Drawing Tools. Graph Drawing, pages 483–484, 2001.
7. N. Elmqvist, T.-N. Do, H. Goodell, N. Henry, and J. Fekete. Zame: Interactive large-scalegraph visualization. In Visualization Symposium, 2008. PacificVIS ’08. IEEE Pacific, pages215–222, March 2008.
8. N. Franz and R. Peet. Perspectives: towards a language for mapping relationships amongtaxonomic concepts. Systematics and Biodiversity, 7(1):5–20, 2009.
9. N. M. Franz, M. Chen, S. Yu, P. Kianmajd, S. Bowers, and B. Ludascher. Reasoningover taxonomic change: Exploring alignments for the Perelleschus use case. PLoS ONE,10(2):e0118247, 02 2015.
10. N. M. Franz, R. K. Peet, and A. S. Weakley. On the use of taxonomic concepts in support ofbiodiversity research and taxonomy. Systematics Association Special Volume, 76:63, 2008.
11. N. M. Franz, N. M. Pier, D. M. Reeder, M. Chen, S. Yu, P. Kianmajd, S. Bowers, andB. Ludascher. Taxonomic Provenance: Two Influential Primate Classifications LogicallyAligned. ArXiv e-prints, Dec. 2014.
12. M. Gelfond. In Handbook of Knowledge Representation, chapter Answer Sets. ElsevierScience, 2007.
13. N. Henry and J.-D. Fekete. Matlink: Enhanced matrix visualization for analyzing socialnetworks. In C. Baranauskas, P. Palanque, J. Abascal, and S. Barbosa, editors, Human-Computer Interaction INTERACT 2007, volume 4663 of Lecture Notes in Computer Science,pages 288–302. Springer Berlin Heidelberg, 2007.
14. J. B. Kruskal and J. M. Landwehr. Icicle plots: Better displays for hierarchical clustering.The American Statistician, 37(2):162–168, 1983.
15. D. A. Randell, Z. Cui, and A. G. Cohn. A spatial logic based on regions and connection. InProceedings of the 3rd international conference on Knowledge Representation and Reason-ing, 1992.
16. C. Scornavacca, F. Zickmann, and D. H. Huson. Tanglegrams for rooted phylogenetic treesand networks. Bioinformatics, 27(13):i248–i256, 2011.
17. D. Thau. Reasoning about taxonomies and articulations. In Proceedings of the 2008 EDBTPh. D. workshop, pages 11–19. ACM, 2008.
18. W. N. W. Zainon and P. Calder. Visualising phylogenetic trees. In Proceedings of the 7th Aus-tralasian User Interface Conference - Volume 50, AUIC ’06, pages 145–152, Darlinghurst,Australia, Australia, 2006. Australian Computer Society, Inc.
ProvenanceMatrix: A Visualization Tool for Multi-Taxonomy Alignments
24