prove it - timi 22 late breaking clinical trials acc...
TRANSCRIPT

Jorge Plutzky, MD Director, Preventive Cardiology
Cardiovascular Division Brigham and Women’s Hospital
Harvard Medical School Boston, Massachusetts
Lipid Update

Overview of Cholesterol Transport

Triglycerides: Energy Resource
Fatty Acid
Fatty Acid
Fatty Acid
Glycerol Backbone
TRI - glyceride
LIPASE (Lipoprotein Lipase)
Fatty Acid
Fat
Energy
VLDL: Liver
Chylo’s: Gut

CHO/LDL/Triglycerides
VLDL = 20% of all triglycerides
LDL = TC - HDL - VLDL
LDL = TC - HDL - TG/5 Friedewald Equation
Valid through TG ~ < 400 mg/dL

Function and Life Cycle of the LDL Receptor
Clustering
LDL Binding
Transport ER
Synthesis
Recycling
LDL Receptor Defects: Span biologic function
LDL-R Defects: Variable function
Variable rx response

2.0
1.0 0.8
0.5 0.5 0.5 0.5 0.4 0.4
0.3
0
0.5
1
1.5
2
2.5
FH Dominant otosclerosis
Adult PCKD Sickle cell disease
Multiple exostoses
Huntington's disease
Fragile X syndrome
Neuro-fibromatosis
Cystic fibrosis
Duchenne muscular dystrophy
Familial Hypercholesterolemia: A Common Inherited Disorder
6
FH prevalence is 2x the next most common?
5x more common
4x more common
Sickle Cell
Cystic Fibrosis
Increased prevalence New England: French Canadians
Familial combined hyperlipidemia has a frequency of 1:200 births; genetic cause is unknown. Sickle cell disease varies greatly by ethnicity. PCKD = polycystic kidney disease.
Genetic Alliance UK. Available at http://www.geneticalliance.org.uk/education3.htm. Streetly A et al. J Clin Pathol. 2010;63:626-629.
FH

Tendonous Xanthomas
Achilles Tendon Extensor Tendons

Dutch Lipid Clinic Criteria
https://www.mdcalc.com/dutch-criteria-familial-hypercholesterolemia-fh
Simon Broome
FH Dx
Clinical Dx

2013 AHA/ACC Cholesterol Guidelines Four main statin benefit groups • Age < 75 – High-intensity statin†
• Age > 75 – Moderate-intensity statin ASCVD
• High-intensity statin LDL>190
• 10-year risk >7.5% - High-intensity statin • 10-year risk <7.5% - Moderate-intensity statin
Age 40-75 with diabetes
LDL 70-189
• Moderate- to high-intensity statin Age 40-75 without ASCVD or diabetes 10-year risk >7.5%
JACC 2014;63(25 Pt B):2889-934.
Increased likelihood genetic hypercholesterolemia:
FH

0
5
10
15
20
25
30
(2.60) (3.25) (3.90) (4.50) (5.15) (5.80) (6.45) (7.10) (7.75) (8.40) (9.05)
Cholesterol and CHD: Seven Countries Study
TC mg/dL (mmol/L)
CHD mortality
rates (%)
Verschuren WMM et al. JAMA. 1995;274:131-136.
100 125 150 175 200 225 250 275 300 325 350
Northern Europe United States Southern Europe, Inland Southern Europe, Mediterranean Siberia Japan

4S: Total Mortality/Overall Survival
% A
LIVE

% ∆
TC LDL-C
HDL-C
MI C UA RV
Subjects: 6,605
85% men, 45-73 yr
15% women, 55-73 yr
Baseline lipids:
TC: 221 mg/dL
LDL-C: 150 mg/dL
HDL-C: men, 36 mg/dL
women, 40 mg/dL
Intervention: Lovastatin 20-40 mg/day
C=coronary events defined as fatal/nonfatal myocardial infarction, sudden death, and unstable angina; MI=fatal/nonfatal myocardial infarction; UA=unstable angina; RV=revascularizations.
Downs JR et al. JAMA. 1998;279:1615-1622.
P<0.001 P=0.002
P=0.02 P=0.001
AFCAPS: LDL-Lowering in PEOPLE With No HX OF CAD and Average Cholesterol Levels

70% of AFCAPS subjects untreated under ATPII

Primary prevention
The Statin Decade – Benefit across full Spectrum of CAD
Patients at high risk of CHD (high cholesterol or BP)
WOSCOPS (pravastatin)
ASCOT (atorvastatin)
Patients at low risk of CHD or low HDL-C
AFCAPS/TexCAPS (lovastatin)
Majority of CHD patients (broad range of cholesterol levels)
LIPID (pravastatin)
CARE (pravastatin)
Secondary prevention
Continuum of risk
22.6
15.9 13.2
7.9
2.8
Plac
ebo
MI
rate
/100
sub
ject
s/5
yrs
4S (simvastatin)
High-risk CHD patients (high cholesterol)
HPS (simvastatin) 11.8
4.5
12
34
46
50
30
NNT

2013 AHA/ACC Cholesterol Guidelines Four main statin benefit groups • Age < 75 – High-intensity statin†
• Age > 75 – Moderate-intensity statin ASCVD
• High-intensity statin LDL>190
• 10-year risk >7.5% - High-intensity statin • 10-year risk <7.5% - Moderate-intensity statin
Age 40-75 with diabetes
LDL 70-189
• Moderate- to high-intensity statin Age 40-75 without ASCVD or diabetes 10-year risk >7.5%
JACC 2014;63(25 Pt B):2889-934. Don’t treat to LDL target

Conceptual Changes In Guidelines

LDL-C Lowering and Benefit of Statins
NCEP 2004
WOSCOPS - PBO AFCAPS - PBO
AFCAPS - Rx WOSCOPS - Rx
4S - Rx
LIPID - Rx
4S - PBO
CARE - Rx
LIPID - PBO
CARE - PBO
AFCAPS - Rx
0
10
20
30
40 (1.0)
60 (1.6)
80 (2.1)
100 (2.6)
120 (3.1)
140 (3.6)
160 (4.1)
180 (4.7)
Secondary Prevention
Primary Prevention 200 (5.2)
ASCOT - PBO
ASCOT - Rx
PROVE-IT - PRA PROVE-IT - ATV80
TNT - ATV10
LDL-C achieved mg/dL (mmol/L)
70 (1.8)
Adapted from Rosensen, Exp Opin Emerg Drugs 2004;9:269; LaRosa J et al, N Engl J Med,2005;352:1425
HPS - PBO
HPS - Rx TNT - ATV80
NCEP 2001 Eur Joint 2003

Is even lower LDL better
In high risk population:
acute coronary syndrome?
PROVE-IT

PROVE-IT: Changes from Post-ACS Baseline LDL-C
Note: Changes in LDL-C may differ from prior trials: • 25% of patients on statins prior to ACS event • ACS response lowers LDL-C from true baseline
LDL-C (mg/dL)
20
40
60
80
100
120
Rand. 30 Days 4 Mos. 8 Mos. 16 Mos. Final
Pravastatin 40mg
Atorvastatin 80mg 49% ↓
21%↓
P<0.001
Median LDL-C (Q1, Q3)
95 (79, 113)
62 (50, 79)
<24h

All-Cause Death or Major CV Events in All Randomized Subjects
0 3 18 21 24 27 30 6 9 12 15
% with Event
Months of Follow-up
Pravastatin 40mg (26.3%)
Atorvastatin 80mg (22.4%)
16% RR (P = 0.005)
30
25
20
15
10
5
0
Cannon CP et al. NEJM 2004

Overview of Cholesterol Transport
NPC1L1: Ezetimibe
Non-statin

Ezetimibe + Statin: ~10-20% LDL Reduction With All Tested Statins
Lovastatin Mono.+ Ezet (n=220) (n=192)
Pravastatin Mono.+ Ezet
(n=205) (n=204)
Simvastatin Mono.+ Ezet
(n=263) (n=274)
Atorvastatin Mono.+ Ezet
(n=248) (n=255)
Mean % Change in
LDL-C From
Untreated Baseline
*
All data are pooled across doses. *P<0.01 for ZETIA + statin vs statin alone.

Patients stabilized post ACS ≤ 10 days: LDL-C 50–125*mg/dL (or 50–100**mg/dL if prior lipid-lowering Rx)
Standard Medical & Interventional Therapy
Ezetimibe / Simvastatin 10 / 40 mg
Simvastatin 40 mg
Follow-up Visit Day 30, every 4 months
Duration: Minimum 2 ½-year follow-up (at least 5250 events)
Primary Endpoint: CV death, MI, hospital admission for UA, coronary revascularization (≥ 30 days after randomization), or stroke
N=18,144
Uptitrated to Simva 80 mg if LDL-C > 79 (adapted per
FDA label 2011)
Study Design *3.2mM
**2.6mM
Cannon CP AHJ 2008;156:826-32
90% power to detect ~9% difference

LDL-C and Lipid Changes 1 Yr Mean LDL-C TC TG HDL hsCRP Simva 69.9 145.1 137.1 48.1 3.8 EZ/Simva 53.2 125.8 120.4 48.7 3.3 Δ in mg/dL -16.7 -19.3 -16.7 +0.6 -0.5
Median Time avg 69.5 vs. 53.7 mg/dL

Primary Endpoint — ITT
Simva — 34.7% 2742 events
EZ/Simva — 32.7% 2572 events
HR 0.936 CI (0.887, 0.988) p=0.016
Cardiovascular death, MI, documented unstable angina requiring rehospitalization, coronary revascularization (• 30 days), or stroke
7-year event rates
NNT= 50
‘Guideline’ change? No concern on cancer

PCSK9 Loss of Function Mutations: Decreased Plasma LDL-C and CHD
81% of PCSK9Y142X and PCSK9C679X subjects had mean plasma LDL-C below 50th percentile
30
20
10
0 0 50 100 150 200 250 300
No Nonsense Mutation
(N = 3,278)
←50th Percentile
Freq
uenc
y (%
)
30
20
10
0 0 50 100 150 200 250 300
PCSK9Y142X or PCSK9C679X
(N = 85)
←50th Percentile
Adapted from Cohen JC, et al. New Engl J Med. 2006;354:1264-1272.
Plasma LDL-C Distribution
Intact PCSK9
PCSK9 LOF
Coronary Heart Disease

4 Genes Associated with Familial Hypercholesterolemia
Mutant Gene Product
Pattern of Inheritance (chromosome)
Prevalence Mutation Effect
Aver LDL-C (mg/dL)
LDL receptor Auto Dom (19p13.2)
HTZs: 1/500 HMZs: 1/106
Loss of function HTZs: 350 HMZs: 700
Apolipoprotein B-100
Auto Dom (2p24)
HTZs: 1/1000* HMZs: 1/106*
Loss of function HTZs: 270 HMZs: 320
ARH adaptor Auto Rec (1p36-p35)
Very rare Loss of function HMZs: 470
PCSK9 protease Auto Rec (1p34.1-p32 )
Very rare Gain of function HTZs: 225

Poirier S & Mayer G, Drug Des Dev Ther 7:1135, 2013
Effect of Human PCSK9 mutations on Plasma LDL-C
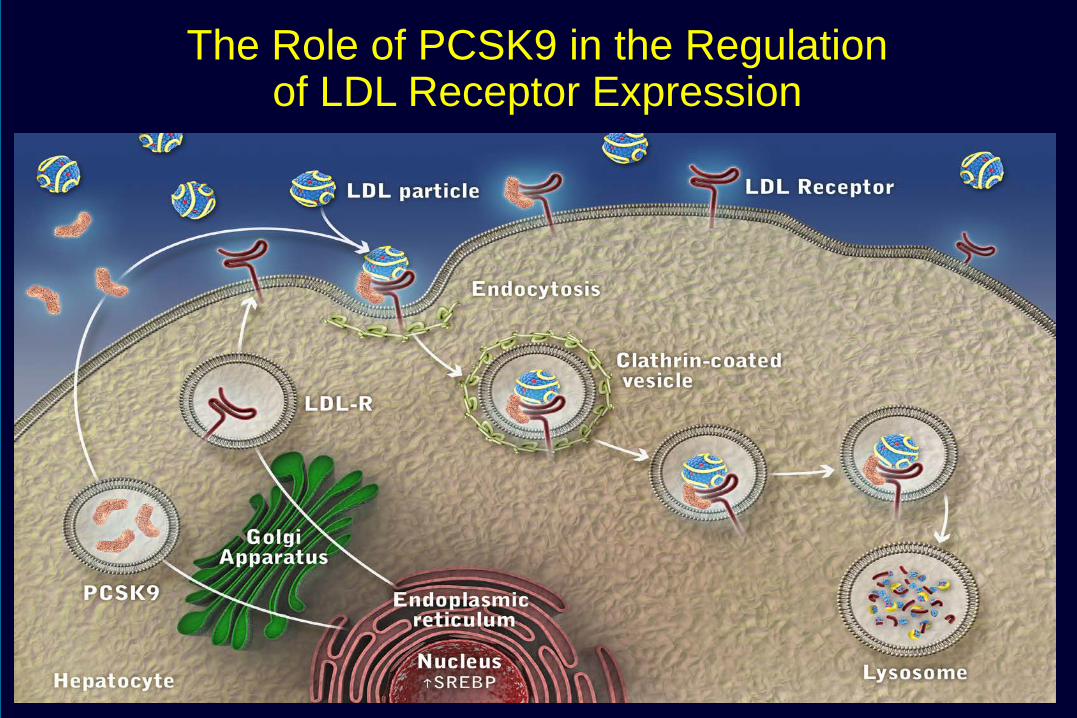
The Role of PCSK9 in the Regulation of LDL Receptor Expression

FOURIER: Study Design, Evolocumab
30 Sabatine MS et al. N Engl J Med 2017

FOURIER: Baseline Characteristics
31

Sabatine MS et al. N Engl J Med 2017. DOI: 10.1056/NEJMoa1615664
FOURIER: Evolocumab effects on LDL-C Over Time.

Sabatine MS et al. N Engl J Med 2017
FOURIER: Evolocumab decreases recurrent CV events in patients with known CAD

FOURIER: Primary Endpoint

FOURIER: Adverse Events

ODYSSEY OUTCOME Trial (3/2018) Alirocumab (Praluent)

ODYSSEY OUTCOME Trial, Alirocumab (Praluent)

ODYSSEY OUTCOME Trial, Alirocumab (Praluent)

ODYSSEY OUTCOME Trial, Alirocumab (Praluent)

ODYSSEY OUTCOME Trial, Alirocumab (Praluent)


More aggressive LDL lowering: LDLs < 70 high risk patients Use of ezetimibe endorsed PCSK9 inhibitors endorsed

• Diabetes • <3 months)ASCVD event • ASCVD event on a statin • Poorly controlled other major CVD RF (incl cigs) • Elevated LP (a) • CKD • Symptomatic CHF • Maintenance hemodialysis • > 65 yo • Prior MI or non-hemorrhagic stroke • Symptomatic PAD, • Hx non-MI related cor revascularization • Residual CAD (> 40% stenosis in > 2 large ca) • HDL-C men <40 mg/dL, women <50 mg/dL • hs-CRP >2 mg • Metabolic syndrome

4S: Total Mortality/Overall Survival
% A
LIVE
More people quit the placebo
than quit the statin
Statin intolerance?

GAUSS3 Design: Two Double-Blind Phases
511 patients with a history of intolerance to multiple statins due to muscle-related adverse effects
Atorvastatin 20 mg Placebo
Placebo Atorvastatin 20 mg
Participants entered Phase B only if they had muscle symptoms on atorvastatin, but not placebo, or CK ≥ 10 x ULN during statin treatment
Phase A
Phase B
Daily oral ezetimibe 10 mg Monthly SC evolocumab 420 mg
2 1
10 weeks
10 weeks
24 weeks

GAUSS3 Phase A
statin-placebo blinded challenge
Intolerable Muscle Symptoms N = 491
On atorvastatin, but not placebo 209 (42.6%)*
On placebo, but not atorvastatin 130 (26.5%)
On both placebo and atorvastatin 48 (9.8%)
No symptoms on either treatment 85 (17.3%)
Did not complete Phase A 20/511

Statin Discontinuation without Adverse Reaction
Zhang H, et al (2013). Annals of Internal Medicine; 158(7):526-34
98.0% of patients who restarted statins were on a
statin at 12 months
Statin Discontinuation after Adverse Reaction

Statin Intolerance
Clinical trials: ~5 % subjects Clinical experience: Higher? 15-20%?
Increased LFTs
Increased CKs
Up to 3x ULN
Up to 10x ULN
Myalgias With or without CK changes
Serious adverse event: Rare
Rhabdomyolysis 1.5 cases per 1000,000 exposures

What do we do about the patient with ‘statin intolerance’?
• It may not be the statin. Try education. • It may be dose related. Start lowest possible.
Half lowest dose? QOD? M W F? • It may be statin specific. Try different one.
Rosuva? Pitavastatin?

What about triglycerides?

PROVE IT-TIMI 22 Trialb
TG ≥150 mg/dL Predicts Higher CHDa Risk in Statin Takers with LDL-C <70 mg/dL
CH
D E
vent
Rat
e af
ter 3
0 D
aysc
(%)
aDeath, MI, and recurrent ACS. bACS patients on atorvastatin 80 mg or pravastatin 40 mg. cAdjusted for age, gender, low HDL-C, smoking, hypertension (HTN), obesity, diabetes, prior statin therapy, prior ACS, peripheral vascular disease, and treatment. CHD=coronary heart disease; HR=hazard ratio; PROVE IT-TIMI=Pravastatin or Atorvastatin Evaluation and Infection Therapy Thrombolysis In Myocardial Infarction. Miller M et al. J Am Coll Cardiol. 2008;51:724-30.
(N=4162)
11.7%
16.5%
TG <150 mg/dL TG ≥150 mg/dL
LDL-C <70 mg/dL
HR: 0.72 P=0.017
HR: 0.84 P=0.192
Referent LDL-C ≥70 mg/dL TG ≥150 mg/dL
Event Rate=17.9%
0
10
15
20
5

Most Hypertriglyceridemia Is Secondary
Cause Clinically Aspects Primary Genetic susceptibility ~10-15%*
Positive energy balance ↑Saturated fat, ↑glycemic index content, alcohol
↑ Carbohydrate intake ↑Simple sugars (fructose, sucrose, etc.)
Obesity Especially ↑ visceral (abdominal) obesity
Diabetes mellitus More so if poorly controlled
Hypothyroidism Only if not adequately controlled therapy Other conditions Nephrotic syndrome, pregnancy, polycystic ovarian syndrome
Medications
Antiretroviral regimens (for HIV) Some phenothiazines and 2nd-generation antipsychotics Thiazide diuretics, bile acid sequestrants, beta-blockers Oral estrogen, tamoxifen Glucocorticoids and isotretinoin
Recreational drugs Marijuana (↑ApoC-III), tobacco * Depends on classification/cut point, population studied. HIV=human immunodeficiency virus Bays HE. In: Kwiterovich PO Jr, ed. The Johns Hopkins Textbook of Dyslipidemia. 1st ed. Lippincott Williams & Wilkins;2010:245-57.
Often Pro-Atherogenic

Lifestyle and Diet Can Have Big Impacts on Hypertriglyceridemia
Diet / Lifestyle Change Lipid Profile Change
Weight loss (5–10%) ↓TG (20%), ↓LDL-C (15%) & ↑HDL-C (10%)
Diet ↑Fruits, vegetables & low-fat dairy; ↓ added sugar ↓Total carb; ↓Fat (to 33–50% of calories)
Exercise Brisk 30-min walk, 3x/wk
↓TG (variable, depends on baseline TG)
Miller M et al. J Am Coll Cardiol. 2008;51:724-30. Sampson UK et al. Curr Atheroscler Rep. 2012;14:1-10.
↓TG (10-20%)
~50% Reduction in TG with Lifestyle
Interventions

Fatty liver
Lipid Consequences of Hypertriglyceridemia
HDL-C, HDL-P, + Apo A-I
3 TG
VLDL-C 1
LDL size Apo B + LDL-P
2
CE
CETP HDL
Hepatic Lipase
Kidney
Rapid Loss of Apo A-I
SD HDL
TG
VLDL
FFA/TG and
Fructose (glucose)
Central Adiposity
FFA /TG
↑VLDL Synthesis
Apo=apolipoprotein; CETP=CE transfer protein; FFA=free fatty acid; HDL=high-density lipoprotein; HDL-C=HDL cholesterol; HDL-P=HDL particle; LDL=low-density lipoprotein; LDL-P=LDL particle; SD=small dense; VLDL=very-low-density lipoprotein; VLDL-C=VLDL cholesterol.
Atherogenic Dyslipidemia • ↑ TG / VLDL-C • ↑ SD LDL / ↑ LDL-P • ↓ HDL-C + Apo A-I
Fatty liver
CE
TG CETP
SD LDL
Hepatic Lipase
LDL
LPL Fatty liver + ↑ VLDL synthesis
Promote ↑ TG

VA-HIT: Fibrate Decreases CVD Events in
CHD Patients With Low HDL-C
-30
-25
-20
-15
-10
-5
0
5
10
%+
*
* †
‡
4 ~6
-30
LDL HDL TG
*P<0.01; †P=0.006; ‡P=0.05 P=placebo group; Rx=treated group. HB Rubins et al NEJM 1999
-22 -21 -27
-10
Nonfatal MI/CHD
death CHD death
All-cause mortality Stroke
Subjects: 2,531 men Age: ≤74 (avg 64) yr Baseline LDL-C: 111 mg/dL Baseline HDL-C: 32 mg/dL Baseline TG: 161 mg/dL Duration: 7 yr Intervention: Gemfibrozil 600 mg bid
25% diabetes 50% insulin resistant

VA-HIT CVD Risk Reduction in Diabetics Compared With Nondiabetics
Rubins HB, et al. Arch Intern Med. 2002;162:2597-2604.
40 35 30 25 20 15 10 5 0
Cum
ulat
ive
Even
t Rat
e C
hang
e, %
Combined End Point
Nonfatal MI CHD Death Stroke
45
18 21
10
3
No DM
P=.67
P=.88
P=.09
P=.004 22 P=.17
32
40 41
P=.004
P=.046 P=.02 P=.26
DM

FIELD: Design
FIELD Study Investigators. Cardiovasc Diabetol. 2004;3:9-24.
Fenofibrate (200 mg daily)
n=4895
Endpoints: g Primary – Composite of CHD death or nonfatal MI at 5 year follow-up g Secondary – Composite of total CV events, CV mortality, total mortality, stroke,
coronary revascularization and all revascularization at 5 year follow-up
Placebo N=4900
9795 patients, age 50-75 years, type 2 diabetes diagnosed after age 35 years, no clear indication for cholesterol-lowering therapy at baseline (total cholesterol 116-251 mg/dL, plus either total cholesterol to HDL ratio ≥4.0 or
triglyceride >88.6 mg/dL

FIELD: Primary Endpoint
• The primary composite endpoint of CHD death or nonfatal MI was not significantly lower in the fenofibrate group compared to the placebo group.
Composite CHD death or nonfatal MI at 5 years (% of treatment arm)
Data from FIELD Study Investigators. Lancet. 2005;366:1849-1861.
P=0.16
5.2% 5.9%
0%
2%
4%
6%
Fenofibrate Placebo

FIELD: Fenofibrate
Primary and Secondary End Points
Lancet. 2005;366:1849
11% Reduction
P=.16 24% Reduction
P=.01
11% Reduction
P=.035
21% Reduction
P=.003
CHD Events* Nonfatal MI Total CVD
Events†
Coronary
Revasc
CHD Death
19% Increase
P=.22
Placebo Fenofibrate
*Primary: Nonfatal MI and CHD death †Secondary: CHD events, stroke, CVD death, revasc

Statin Drop In’s in FIELD

ACCORD - Lipid Objective: To test whether, in the context of good glycemic and LDL-C control, a strategy targeting triglycerides and HDL-C levels provides any additional macrovascular and/or microvascular benefits
* 20 mg for primary prevention patients, 40 mg for secondary prevention patients
** 160 mg if baseline GFR ≥50 ml/min/1.73 m2; 54 mg if baseline GFR between 30 and 50 ml/min/1.73 m2
Buse JB et al. Am J Cardiol. 2007;99(12A):21i-33i.
ACCORD Study Group. N Engl J Med March 14, 2010. Epub.
Mean 4.7 year follow-up

Baseline lipids Simvastatin + Fenofibrate (n=2,765)
Simvastatin + Placebo (n=2,753)
Overall (n=5,518)
Mean total cholesterol 175 (4.5) 176 (4.5) 175 (4.5)
Mean LDL-C 100 (2.6) 101 (2.6) 101 (2.6)
Mean HDL-C 38 (1.0) 38 (1.0) 38 (1.0)
Median triglycerides 164 (1.9) 160 (1.8) 162 (1.8)
Baseline characteristics: Lipids
Data presented as mg/dL (mmol/L)
ACCORD Study Group. N Engl J Med March 14, 2010. Epub.

Reduction in triglycerides was significantly greater in the combination arm
Increase in HDL-C was significantly greater in the combination arm
0 1 2 3 4 5 6 7
Mea
n (m
g/dL
)
Years
0 37
38
39
40
41
42
43
Placebo
Fenofibrate
p = 0.01
ACCORD Study Group. N Engl J Med March 14, 2010. Epub.
Change in mean HDL-C
No. of Patients
Fenofibrate
Placebo
2747
2735
2593
2591
2505
2484
2417
2375
2361
2364
1477
1480
796
801
248
243
Change in mean triglycerides
No. of Patients
Fenofibrate
Placebo
2747
2735
2593
2591
2505
2484
2417
2375
2361
2364
1478
1480
796
801
248
243
ACCORD Lipid: Changes in HDL-C and triglycerides during the study
0 1 2 3 4 5 6 7
Mea
n (m
g/dL
)
Years
0 100
120
140
160 Placebo
Fenofibrate
p < 0.0001

ACCORD Lipid primary macrovascular outcome (CV death + nonfatal MI + nonfatal stroke)
0
20
40
60
80
100
Prop
ortio
n w
ith E
vent
(%)
0 1 2 3 4 5 6 7 8
2765 2753
2644
2634
2565
2528
2485
2442
1981
1979
1160
1161
412
395
249
245
137
131
No. At Risk
Fenofibrate
Placebo
Years
p=0.32
0
10
20
0 1 2 3 4 5 6 7 8
Placebo
Fenofibrate
ACCORD Study Group. N Engl J Med March 14, 2010. Epub.

ACCORD Lipid 31% reduction in events in patients with atherogenic dyslipidemia
Subgroup Simvastatin + Fenofibrate
Simvastatin + Placebo
Hazard ratio (95% CI)
p value for interaction
% of event (no. in group)
Overall 10.5 (2765) 11.3 (2753)
Triglyceride – HDL-C combination
0.06
TG ≥204 mg/dL + HDL-C ≤34 mg/dL All others
12.4 (485)
10.1 (2264)
17.3 (456)
10.1 (2284)
ACCORD Study Group. N Engl J Med March 14, 2010. Epub.
20 patients with type 2 diabetes and atherogenic dyslipidemia needed to be treated for 5 years to prevent one CV event
1 2 0
Simvastatin + Fenofibrate better
Simvastatin alone better

ACCORD Lipid Comparison of subgroup results with those from prior landmark trials with fibrates
Trial (drug) Primary endpoint:
entire cohort (p value)
Lipid subgroup criterion
Primary endpoint: subgroup (p value)
HHS (gemfibrozil) -34% (0.02) TG > 200 mg/dL
LDL-C/HDL-C > 5.0 Post-hoc
-71% (0.005)
BIP (bezafibrate) -7.3% (0.24) TG ≥ 200 mg/dL Post-hoc
-39.5% (0.02)
FIELD (fenofibrate) -11% (0.16) TG ≥ 204 mg/dL
HDL-C < 42 mg/dL Post-hoc
-27% (0.005)
ACCORD (fenofibrate) -8% (0.32) TG ≥ 204 mg/dL
HDL-C ≤ 34 mg/dL Prespecified
-31%

*Pre-specified. MACE=major adverse CV event. Saito Y et al. Atherosclerosis. 2008;200:135-40.
JELIS: Larger Decrease in MACE in those with TG >150 mg/dL & HDL-C <40 mg/dL*
HR and P-value adjusted for age, gender, smoking, diabetes, and HTN
No. of patients Control 475 444 432 414 400 392 EPA 482 455 443 427 413 403
0 1 2 3 4 5 Years
Cum
ulat
ive
inci
denc
e of
maj
or
coro
nary
eve
nts
(%)
EPA 1.8 gm/day group
Control group –53%
HR: 0.47 95% CI: 0.23–0.98 P=0.043
5.0
4.0
3.0
2.0
1.0
0

FDA-Approved Prescription Omega-3 FAs
EPA+DHA EE1,2
EPA only EE3
EPA+DHA FFA4
Brand Name Lovaza, Omtryg Vascepa Epanova Generic available? Yes No No EPA/DHA 55/45 100/0 73/27
Regimen, capsules 2 BID w/ meals or 4 QD w/ meals2 2 BID w/ meals 2 or 4 QD, meal
independent
Adverse reactions taste perversion,
eructation, dyspepsia
arthralgia
abdominal pain or discomfort, eructation,
diarrhea, nausea
1Lovaza prescribing information, generics available. 2 Omtryg prescribing information 3Vascepa prescribing information. 4Epanova prescribing information. EE: Ethyl Ester; FFA: Free Fatty Acid
Expensive to manufacture; variable insurance reimbursement; may incur greater out-of-pocket costs.

What about triglycerides?
64 yo man, T2D, 3V CAD, CABG 2009
Meds: atorva 80, ASA, lisinopril 10, HCTZ 25, metoprolol
Lipid profile:
LDL 68, HDL 34, TG 380

Think meds: stop HCTZ, substitute as needed Lifestyle matters: Slightly more active. Decrease simple carbs Consider fibrate (fenofibrate) if significant risk: - CVD, high TG, low HDL, LDL at goal - Pancreatitis level TG (> ~500 mg/dL) Alternatives: fish oil, weight loss

CHO/LDL/Triglycerides LDL = TC - HDL - VLDL
LDL = TC - HDL - TG/5 Friedewald Equation
Valid through TG ~ < 400 mg/dL
Non-HDL = TC - HDL

Cholesterol, Trig, Non-HDL
72
HDL LDL IDL VLDL Chylomicron remnant
APO A-1 APO B APO B APO B APO B 48
Cholesterol Triglyceride
All atherogenic lipoproteins
non-HDL
Non-HDL-C = Total cholesterol − HDL-C
Non-HDL Target: 30 points > LDL target Therapeutic intervention? Intensify statin Add 2nd LDL agent Add fibrate

What about HDL?

HDL Cholesterol Levels and CHD Risk Framingham Study
4.0
3.0
2.0
1.0
25 45 65 HDL-C (mg/dL)
CH
D ri
sk ra
tio
Kannel WB. Am J Cardiol 1983;52:9B–12B 1989;118(5 Pt 1):1012–1021
2.0
1.0
0
4.0

1o Endpoint: CHD Death, nonfatal MI, ischemic stroke, high-risk ACS, hospitalization for coronary or cerebrovascular revascularization
Boden WE. N Engl J Med. epub 15 Nov 2011; doi 10.1056/NEJMoa1107579.
AIM-HIGH: Niacin Primary Outcome
Niacin: No evidence for benefit. Poorly tolerated.

Key Points: LDL lowering with statins: unequivocal data demonstrating safe, effective reduction in CV events. Clear indications for statin use: ASCVD, CV risk > 7.5%/10 yrs, Diabetes, LDL > 190 mg/dL Target LDLs likely matter, stay tuned for guideline updates. - Ezetimibe lowers LDL ~20%, well tolerated, has CV benefit data, is underused. - PCSK9 inhibitors: use as needed (LDL still too high, true statin intolerance). Caution before declaring patient statin intolerant: - Use different statin, lowest doses, education. Rhabdo very rare. Triglycerides matter: - R/O secondary causes - Lifestyle important - Consider fibrates if elevated TG/low HDL, significant CV risk Best Next Steps: Help a patient overcome statin intolerance. Get a patient approved for PCSK9 inhibitor use. Help a patient with elevated triglycerides lose 5-10 lbs.

Lipoprotein (a)
• First identified 1963 • Lipoprotein macromolecule • Evolutionarily conserved:
– Likely conveyed some advantage – Arose in two separate gene duplications
• Constituents: – an LDL-like molecule, containing apo B – apolipoprotein a structire

Lipoprotein (a)
• First identified 1963 • Lipoprotein macromolecule • Constituents:
– an LDL-like molecule, containing apo B – apolipoprotein a structire
LDL

Lipoprotein (a) Genotype, Level and CHD Risk
Clarke R et al, NEJM 361:2518, 2009
1.51
2.57

Lp (a): Current Therapeutic Options • Niacin
- Lowers Lpa ~30% - No effect on outcomes - Poorly tolerated
•Statins: - No LP (a) effect - Lower LDL component - Lower apoB component
PCSK9 Inhibitors - 30% decrease - Not a likely basis for approval
• Increased/earlier platelet rx? • Stay tuned… • Limit other risk factors