profits and balance sheet developments at u.s ...¬ts and balance sheet developments at u.s....
TRANSCRIPT

Profits and Balance Sheet Developmentsat U.S. Commercial Banks in 2000
William F. Bassett and Egon Zakrajsek, of the Board’sDivision of Monetary Affairs, prepared this article.Thomas C. Allard assisted in developing the databaseused in this article and is responsible for maintainingit. James E. Cypert, Jr., and Alice Memminger pro-vided research assistance.
The profitability of the U.S. commercial bankingindustry remained robust in 2000, but returns onequity and on commercial bank assets fell back some-what from the peaks reached in 1999 (chart 1).Aggregate earnings were depressed in 2000 by asubstantial one-time charge at a single large bank andby the ongoing restructuring at one of the nation’slargest bank holding companies. Even after account-ing for those special factors, however, overall profit-ability was still down in 2000. The major factors inthe decline were a continuation of the narrowing innet interest margin that dates from the extraordinarilyhigh levels of the early 1990s, a significant increasein loan-loss provisions, and a notable slowing in thegrowth of noninterest income.
During the first half of last year, the FederalReserve raised the intended level of the federal fundsrate three times—twice by 25 basis points and onceby 50 basis points (chart 2). Longer-term interestrates also moved up over that period, particularly onhigh-yield debt. By June, however, signs that theeconomy was cooling from its frenetic pace of the
Note. Except where otherwise indicated, data in this article arefrom the quarterly Reports of Condition and Income (Call Reports) forinsured domestic commercial banks and nondeposit trust companies(hereafter, banks). The data consolidate information from foreign anddomestic offices and have been adjusted to take account of mergers(see the appendix). For additional information on the adjustments tothe data, see the appendix in William B. English and William R.Nelson, ‘‘Profits and Balance Sheet Developments at U.S. Commer-cial Banks in 1997,’’ Federal Reserve Bulletin, vol. 84 (June 1997),p. 408.
Size categories, based on assets at the start of each quarter, are asfollows: the 10 largest banks, large banks (those ranked 11 through100), medium-sized banks (those ranked 101 through 1,000), andsmall banks. At the start of the fourth quarter of 2000, the approximateasset sizes of the banks in those groups were as follows: the 10 largestbanks, more than $84 billion; large banks, $6.94 billion to $82 billion;medium-sized banks, $331 million to $6.93 billion; small banks, lessthan $331 million.
Many of the data series reported here begin in 1985 because theCall Reports were significantly revised in 1984. Data for 1984 andearlier years are taken from Federal Deposit Insurance Corporation,Statistics on Banking (FDIC, 1999). The data reported here are alsoavailable on the Internet at www.fdic.gov/bank/statistical/statistics/index.html.
Data shown in this article may not match data published in earlieryears because of revisions and corrections. In the tables, componentsmay not sum to totals because of rounding.
1. Measures of commercial bank profitability, 1975–2000
1975 1980 1985 1990 1995 2000
.5
1.0
5
10
15
Percent
Return on equity
Return on assets
2. Selected interest rates, 1998–2001:Q1
1998 1999 2000
4
6
8
10
12
14
Percent
Moody’s Baa corporate bond
High-yield bonds
Thirty-year fixed mortgage
Intended federal funds rate
Source. For intended federal funds rate, Federal Reserve Board(www.federalreserve.gov/fomc/fundsrate.htm); for mortgage rate and Moody’sbond rates, Federal Reserve Board, Statistical Release H.15, ‘‘Selected InterestRates’’ (www.federalreserve.gov.releases/h15); for high-yield bond rates,Merrill Lynch Master II index.

previous six quarters prompted market participants tolower the odds of further tightening by the FederalReserve; longer-term interest rates started levelingoff or falling, and they generally continued to declineover the second half of the year. By December, theBaa corporate bond rate had fallen more than 1 per-centage point from a peak of 9.02 percent in May,and rates on thirty-year fixed-rate mortgages haddropped even more, to 7.13 percent. By contrast, theslowing economy and rising default rates led to prob-lems for below-investment-grade business borrowers;yields on junk bonds rose 296 basis points over theyear, to 14.08 percent.
The growth of both loans and securities on banks’books picked up in 2000. The acceleration in loangrowth resulted mainly from a marked decline in
securitizations, which boosted the growth of con-sumer loans in bank portfolios. In addition, businessand real estate lending was robust. The faster growthof securities was due to a surge in trading accounts,as runoffs of U.S. Treasury securities damped growthof investment accounts.
Following a lull in 1999, bank merger activitybounced back a bit in 2000, but the number of dealsremained well below the 1994–98 average of about575 per year. A spate of bank holding companyconsolidations of formerly independent bank subsidi-aries helped boost to 474 the number of banks thatmerged, were bought outright, or otherwise changedtheir charters in 2000. Only five banks failed, twofewer than in 1999. Meanwhile, 215 new banks werecreated, down from 255 in 1999; the result was a net
1. Annual rates of growth of balance sheet items, 1991–2000Percent
Item 1991 1992 1993 1994 1995 1996 1997 1998 1999 2000
Memo:Dec.2000
(billionsof
dollars)
Assets . . . . . . . . . . . . . . . . . . . . . . . . . . . . . . . . . .Interest-earning assets . . . . . . . . . . . . . . . . .
Loans and leases (net) . . . . . . . . . . . . . . .Commercial and industrial . . . . . . . .Real estate . . . . . . . . . . . . . . . . . . . . . . .
Booked in domestic offices . . . . . .One- to four-family
residential . . . . . . . . . . . . . .Other . . . . . . . . . . . . . . . . . . . . . . .
Booked in foreign offices . . . . . . .Consumer . . . . . . . . . . . . . . . . . . . . . . . .Other loans and leases . . . . . . . . . . . .Loan-loss reserves and
unearned income . . . . . . . . . . . . .Securities . . . . . . . . . . . . . . . . . . . . . . . . . . .
Investment account . . . . . . . . . . . . . . .U.S. Treasury . . . . . . . . . . . . . . . . . .U.S. government agency and
corporation obligations . . . . .Other . . . . . . . . . . . . . . . . . . . . . . . . . .
Trading account . . . . . . . . . . . . . . . . . .Other . . . . . . . . . . . . . . . . . . . . . . . . . . . . . .
Non-interest-earning assets . . . . . . . . . . . . .
Liabilities . . . . . . . . . . . . . . . . . . . . . . . . . . . . . . .Core deposits . . . . . . . . . . . . . . . . . . . . . . . . .
Transaction deposits . . . . . . . . . . . . . . . .Savings and small time deposits . . . . . .
Managed liabilities1 . . . . . . . . . . . . . . . . . . .Deposits booked in foreign
offices . . . . . . . . . . . . . . . . . . . . . . . . .Large time . . . . . . . . . . . . . . . . . . . . . . . . . .Subordinated notes and
debentures . . . . . . . . . . . . . . . . . . . . .Other managed liabilities . . . . . . . . . . . .
Other . . . . . . . . . . . . . . . . . . . . . . . . . . . . . . . . .
Equity capital . . . . . . . . . . . . . . . . . . . . . . . . . . .
MemoCommercial real estate loans 2 . . . . . . . . . . . .Mortgage-backed securities . . . . . . . . . . . . . .
Note. Data are from year-end to year-end.1. Measured as the sum of deposits in foreign offices, large time deposits in
domestic offices, federal funds purchased and securities sold under repurchaseagreements, demand notes issued to the U.S. Treasury, subordinated notes anddebentures, and other borrowed money.
2. Measured as the sum of construction and land development loans securedby real estate; real estate loans secured by nonfarm nonresidential properties;real estate loans secured by multifamily residential properties; and loans tofinance commercial real estate, construction, and land development activitiesnot secured by real estate.
1.33 2.19 5.68 8.06 7.55 6.10 9.23 8.25 5.42 8.75 6,1701.98 2.53 6.56 5.30 7.69 5.68 8.88 8.18 5.98 8.69 5,335
−2.65 −1.04 6.05 9.83 10.53 8.12 5.33 8.90 8.01 9.36 3,711−9.10 −4.10 .52 9.33 12.26 7.24 12.02 12.94 8.07 8.00 1,042
2.73 1.94 6.13 7.90 8.32 5.45 9.30 7.98 12.18 10.74 1,6582.90 2.57 6.17 7.64 8.47 5.51 9.52 7.96 12.32 11.01 1,626
7.76 7.53 11.08 10.09 10.05 4.66 9.67 6.35 9.65 9.28 909−1.93 −2.86 .22 4.35 6.24 6.75 9.32 10.30 16.03 13.29 718−2.35 −17.80 4.67 18.35 2.81 3.18 .34 8.79 6.28 −1.62 32−2.55 −1.66 9.06 16.01 9.50 4.90 −2.19 .99 −1.48 8.65 588−4.91 −4.24 9.97 5.29 14.23 22.28 −7.91 14.07 6.28 8.33 489
−3.78 −4.85 −5.82 −2.21 .25 −.06 −.50 3.49 2.33 7.96 6616.23 12.29 12.26 −4.14 .57 .86 8.85 8.39 5.09 6.37 1,21914.42 11.44 8.11 −1.73 −1.58 −1.10 8.66 12.05 6.66 2.87 1,05832.01 23.95 7.24 −8.46 −19.21 −14.28 −8.86 −25.17 −1.88 −32.72 74
15.88 12.77 9.62 .87 6.43 3.63 14.18 16.98 1.82 3.75 618−2.56 −5.20 6.09 2.49 4.20 1.83 11.21 26.97 20.83 13.42 36638.88 21.01 51.84 −20.46 18.51 14.44 9.97 −13.30 −6.93 37.16 161
2.82 1.57 −7.90 3.25 7.64 −0.90 45.13 2.34 −7.58 9.73 405−3.10 −.32 −.86 30.22 6.61 8.88 11.47 8.64 1.93 9.18 835
1.01 1.35 5.12 8.31 7.17 5.96 9.12 8.12 5.55 8.59 5,6485.25 5.09 1.49 −.17 3.96 4.13 4.52 7.05 .20 7.53 2,8763.38 14.62 5.47 −.32 −3.09 −3.44 −4.55 −1.41 −8.99 −1.23 6716.24 .18 −.85 −.07 8.37 8.35 9.03 10.73 3.77 10.51 2,206
−6.19 −6.07 12.30 17.58 10.44 9.66 13.83 9.60 15.50 8.80 2,369
3.81 −5.85 15.06 30.89 5.13 4.27 11.13 8.71 14.60 7.84 707−19.73 −26.20 −9.21 8.72 19.61 21.17 20.14 9.10 14.18 19.39 564
4.69 34.90 10.82 9.23 6.61 17.74 21.05 17.00 5.07 13.98 86−1.39 6.94 22.18 12.91 11.24 8.21 12.23 9.87 17.68 3.91 1,012−4.18 −1.02 15.30 79.17 20.46 2.60 23.79 8.54 −6.38 15.45 403
5.98 13.75 12.58 5.24 12.00 7.73 10.45 9.61 3.92 10.51 522
−2.58 −4.03 −.60 4.01 6.34 7.67 10.12 11.37 15.39 12.14 71719.27 10.37 9.66 −3.12 .67 2.06 14.15 22.09 −3.34 3.29 464
368 Federal Reserve Bulletin June 2001

reduction of 264 in the number of commercial banksoperating in the United States, to 8,356 as of Decem-ber 31, 2000 (chart 3, top panel).1
Mergers enlarged the share of bank assets held bythe 100 largest commercial banks, from 71 percent in1999 to 73 percent in 2000 (chart 3, bottom panel).The combination of Fleet Bank and BankBoston cre-ated the nation’s fourth largest commercial bank, andas a result, the share of assets held by the 10 largestbanks increased more than 2 percentage points, to38 percent. Adjusted to reflect the effects of mergers,however, assets at the 10 largest banks grew only4.5 percent, about half the rate of growth of allcommercial bank assets.
The number of mergers between bank holdingcompanies (BHCs) declined from 211 in 1999 to 179in 2000, the lowest level of merger activity since1992. The number of BHCs declined a net of only 23over the year, to 5,931. The share of banking andnonbanking assets held by the top 50 BHCs remainedat just over 76 percent for the third consecutive year,even though the share was bolstered by the Decem-ber 31 union of J.P. Morgan and Chase Manhattan.
BALANCE SHEET DEVELOPMENTS
The growth of total bank assets accelerated from5.4 percent in 1999 to 8.8 percent in 2000 (table 1),
the second highest pace since 1985. A vigorousexpansion of total loans and leases reflected stronggrowth in business loans, continued rapid expansionin residential and commercial real estate lending, anda sharp rebound in the growth of consumer loans onbanks’ books. Despite a record contraction in hold-ings of U.S. Treasury securities that in part reflected areduced supply of such instruments, overall growthof securities picked up, especially for those held intrading accounts.
Business lending was supported by merger-relatedfinancing and by the rapid pace of business outlayson plant and equipment, which both continued ata vigorous pace well into 2000 despite the rise inmarket interest rates over much of 1999. During thesecond half of 2000, however, merger activity andbusiness fixed investment fell off a great deal. More-over, mounting concerns about a more uncertain andless favorable economic outlook led banks to tightenlending standards and terms. Thus squeezed by afalloff in demand and a crimp in supply, the growthof commercial and industrial (C&I) and commercialreal estate loans had slowed appreciably by the end ofthe year.
Declining mortgage rates over much of 2000maintained the growth of residential mortgages atabout the robust pace of 1999. Generally strong con-sumer spending also supported lending to house-holds. However, a sharp rebound in consumer loanson banks’ books came mainly from a slowdown insecuritizations.
Core deposits accelerated smartly in 2000 after avirtual cessation of inflows during 1999. The pickupmay have reflected an increased demand for safe and
1. This count of commercial banks, derived from Call Report data,may vary slightly from measures, such as those in the FederalReserve’s Annual Report that are based on the definition of a bankgiven in the Bank Holding Company Act and implemented in theFederal Reserve’s Regulation Y.
3. Number of commercial banks and share of assetsat the largest banks, 1984–2000
1984 1988 1992 1996 2000
20
40
60
80
Percent
8
10
12
14
16
Thousands
Number
Share of assets
Largest 100
Largest 10
4. Financing gap at nonfarm nonfinancial corporations,1990–2000
1990 1992 1994 1996 1998 2000
50
100
150
200
Billions of dollars
Note. The data are four-quarter moving averages. The financing gap is thedifference between capital expenditures and internally generated funds.
Source. Federal Reserve Board, Statistical Release Z.1, ‘‘Flow of FundsAccounts of the United States,’’ table L. 101 (www.federalreserve.gov/releases/z1).
Profits and Balance Sheet Developments at U.S. Commercial Banks in 2000 369
liquid assets in the face of declining and sometimesvolatile equity markets.
Loans to Businesses
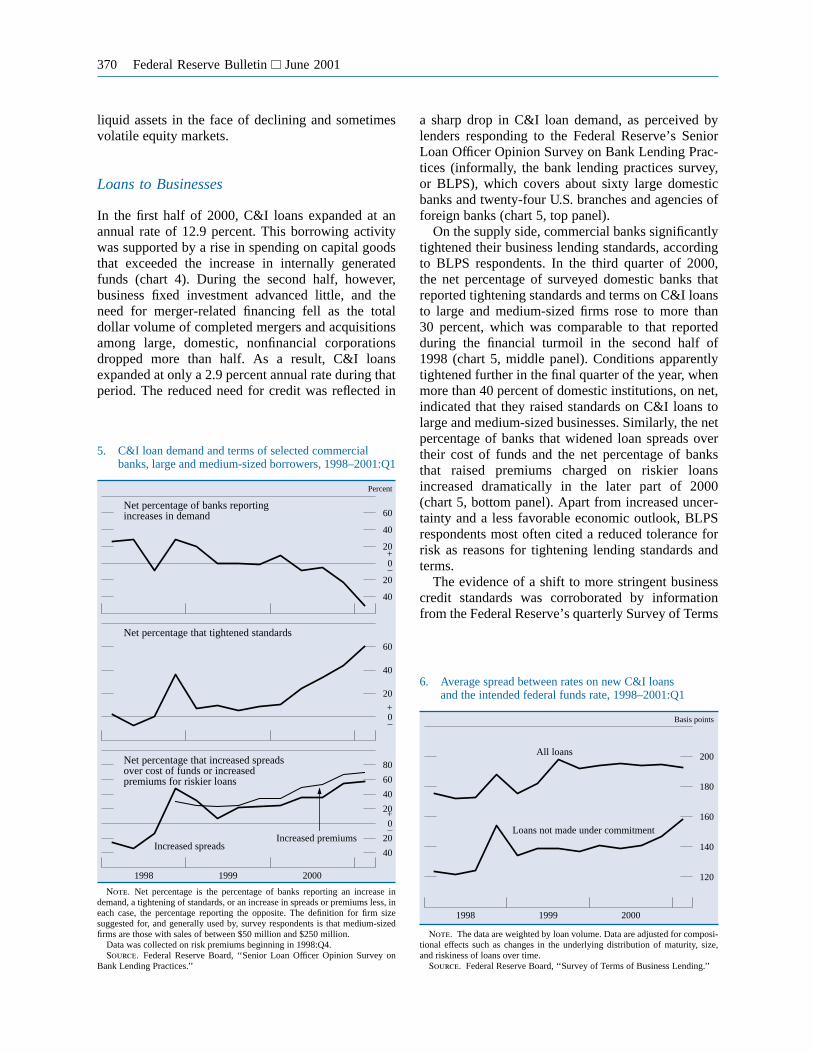
In the first half of 2000, C&I loans expanded at anannual rate of 12.9 percent. This borrowing activitywas supported by a rise in spending on capital goodsthat exceeded the increase in internally generatedfunds (chart 4). During the second half, however,business fixed investment advanced little, and theneed for merger-related financing fell as the totaldollar volume of completed mergers and acquisitionsamong large, domestic, nonfinancial corporationsdropped more than half. As a result, C&I loansexpanded at only a 2.9 percent annual rate during thatperiod. The reduced need for credit was reflected in
a sharp drop in C&I loan demand, as perceived bylenders responding to the Federal Reserve’s SeniorLoan Officer Opinion Survey on Bank Lending Prac-tices (informally, the bank lending practices survey,or BLPS), which covers about sixty large domesticbanks and twenty-four U.S. branches and agencies offoreign banks (chart 5, top panel).
On the supply side, commercial banks significantlytightened their business lending standards, accordingto BLPS respondents. In the third quarter of 2000,the net percentage of surveyed domestic banks thatreported tightening standards and terms on C&I loansto large and medium-sized firms rose to more than30 percent, which was comparable to that reportedduring the financial turmoil in the second half of1998 (chart 5, middle panel). Conditions apparentlytightened further in the final quarter of the year, whenmore than 40 percent of domestic institutions, on net,indicated that they raised standards on C&I loans tolarge and medium-sized businesses. Similarly, the netpercentage of banks that widened loan spreads overtheir cost of funds and the net percentage of banksthat raised premiums charged on riskier loansincreased dramatically in the later part of 2000(chart 5, bottom panel). Apart from increased uncer-tainty and a less favorable economic outlook, BLPSrespondents most often cited a reduced tolerance forrisk as reasons for tightening lending standards andterms.
The evidence of a shift to more stringent businesscredit standards was corroborated by informationfrom the Federal Reserve’s quarterly Survey of Terms
5. C&I loan demand and terms of selected commercialbanks, large and medium-sized borrowers, 1998–2001:Q1
1998 1999 2000
40
20
0–
+20
40
60
80
0–
+
20
40
60
40
20
0–
+20
40
60
Percent
Net percentage of banks reportingincreases in demand
Net percentage that tightened standards
Net percentage that increased spreadsover cost of funds or increasedpremiums for riskier loans
Increased premiumsIncreased spreads
Note. Net percentage is the percentage of banks reporting an increase indemand, a tightening of standards, or an increase in spreads or premiums less, ineach case, the percentage reporting the opposite. The definition for firm sizesuggested for, and generally used by, survey respondents is that medium-sizedfirms are those with sales of between $50 million and $250 million.
Data was collected on risk premiums beginning in 1998:Q4.Source. Federal Reserve Board, ‘‘Senior Loan Officer Opinion Survey on
Bank Lending Practices.’’
6. Average spread between rates on new C&I loansand the intended federal funds rate, 1998–2001:Q1
1998 1999 2000
120
140
160
180
200
Basis points
All loans
Loans not made under commitment
Note. The data are weighted by loan volume. Data are adjusted for composi-tional effects such as changes in the underlying distribution of maturity, size,and riskiness of loans over time.
Source. Federal Reserve Board, ‘‘Survey of Terms of Business Lending.’’
370 Federal Reserve Bulletin June 2001

of Business Lending (STBL).2 The average spread ofrates charged on new C&I loans over the intendedfederal funds rate (adjusted for changes in the compo-sition of loan originations) remained in a narrow,elevated range during all of last year (chart 6). Theoverall average spread, however, encompasses loansextended under previous commitments, and suchloans were less likely to have been affected by theconcerns about the pricing of credit risk that intensi-fied during the latter part of the year. Indeed, in theSTBL, the average spread of rates charged on newC&I loan extensions that were not made under pre-vious commitments (adjusted for changes in the com-position of loan originations) trended up notably lastyear (chart 6).
Credit flow patterns from the STBL also suggestedtighter financial conditions for business borrowers,particularly for higher-risk loans not made undercommitment; such loans fell significantly in 2000,bottoming out at about 6 percent as a share oftotal C&I loan originations reported in the STBL(chart 7).3 By contrast, a marked rise late in the year
in the share of lower-risk loans made under previouscommitments suggested that domestic commercialbanks continued to extend credit to their better-ratedcustomers. As noted below, in the section on profit-ability, such shifts apparently held down interestearnings on business loans last year.
The growth of commercial real estate loans slowedfrom 15.4 percent in 1999 to a still impressive12.1 percent in 2000. The within-year pattern of thislending resembled that of C&I lending. Commercialreal estate loans expanded at an average annual rateof more than 15 percent for the first half of 2000 asthe growth of investment in nonresidential structuresaccelerated notably. All categories of commercialreal estate loans—multifamily housing, constructionand land development, and nonfarm, nonresidentialreal estate—followed the pattern. Buoyed by a stronghousing market, multifamily housing loans advancedmost rapidly, maintaining the 23 percent rate ofgrowth posted in 1999. Construction and land devel-opment loans grew 21 percent, on average, in the firsthalf of 2000, about the same pace as in 1999, andnonfarm, nonresidential real estate loans acceleratedfrom about 12 percent in 1999 to 14 percent over thesame period.
In the second half of 2000, however, as the pace ofnonresidential investment moderated and as banksstarted to tighten standards, the average growth ofcommercial real estate loans slowed to about an8 percent annual rate (chart 8). The most abruptslowdown was in multifamily housing, where loangrowth dropped more than 20 percentage points toabout 2.5 percent. The deceleration in the other twocategories was considerably less pronounced.
2. The STBL data are based on a representative sample of up to348 insured domestic commercial banks and up to 50 foreign-relatedbanking institutions. The sample data are used to estimate the termsof loans extended during the survey period at all domestic banksand at all foreign-related institutions. The data are available atwww.federalreserve.gov/releases/E2/.
3. Loans in the STBL receive risk ratings ranging from 1 to 5,which correspond, respectively, to minimal risk, low risk, moderaterisk, acceptable risk, and classified. For more information on loanrating categories in the STBL, see Thomas F. Brady, William B.English, and William R. Nelson, ‘‘Recent Changes to the FederalReserve’s Survey of Terms of Business Lending.’’ Federal ReserveBulletin, vol. 84 (August 1998), p. 604–15.
7. Lower-risk and higher-risk C&I loans as a shareof all C&I loans, 1998–2001:Q1
1998 1999 2000
10
20
30
Percent
Lower-risk
Higher-risk
Note. Lower-risk loans are rated 1 or 2; those shown were made underprevious commitment. Higher-risk loans are rated from 3 to 5; those shownwere not made under commitment. For definitions of risk ratings, see text note 3.
Source. Federal Reserve Board, ‘‘Survey of Terms of Business Lending.’’
8. Net percentage of selected banks that tightened standardsfor commercial real estate loans, 1990–2001:Q1
1990 1992 1994 1996 1998 2000
0–
+
20
40
60
Percent
Note. Net percentage is the percentage of banks that reported a tightening ofstandards less the percentage that reported an easing.
Source. Federal Reserve Board, ‘‘Senior Loan Officer Opinion Survey onBank Lending Practices.’’
Profits and Balance Sheet Developments at U.S. Commercial Banks in 2000 371
Loans to Households
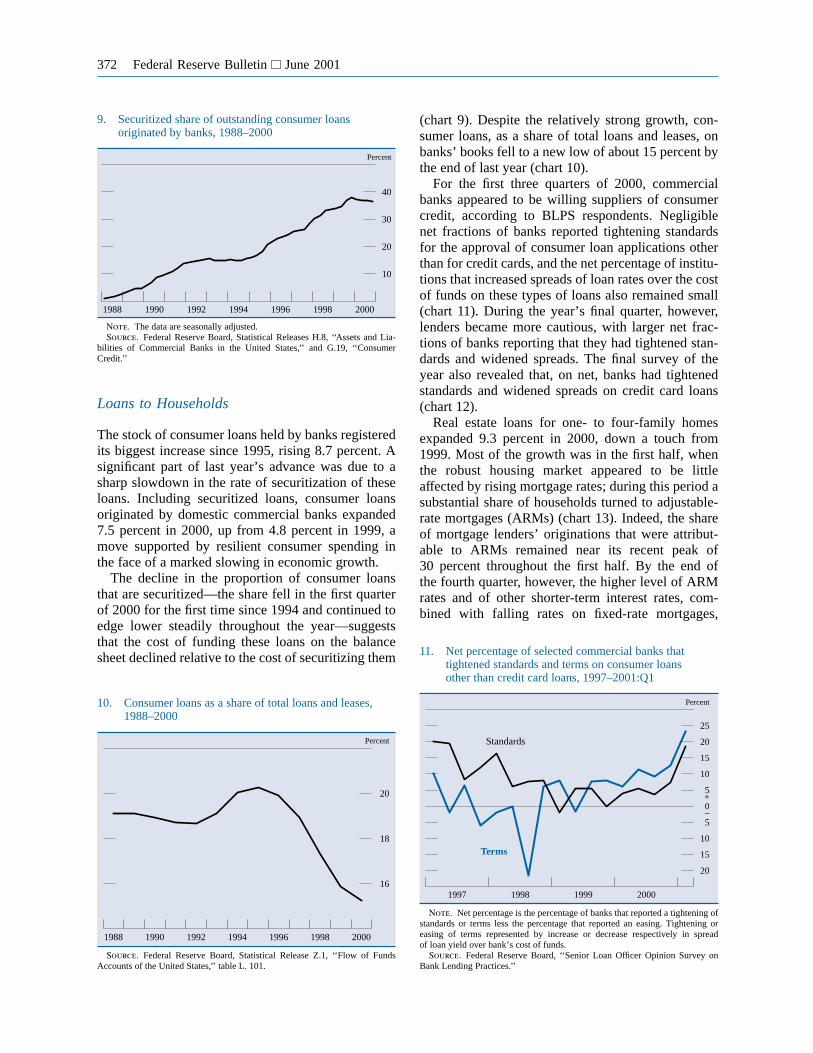
The stock of consumer loans held by banks registeredits biggest increase since 1995, rising 8.7 percent. Asignificant part of last year’s advance was due to asharp slowdown in the rate of securitization of theseloans. Including securitized loans, consumer loansoriginated by domestic commercial banks expanded7.5 percent in 2000, up from 4.8 percent in 1999, amove supported by resilient consumer spending inthe face of a marked slowing in economic growth.
The decline in the proportion of consumer loansthat are securitized—the share fell in the first quarterof 2000 for the first time since 1994 and continued toedge lower steadily throughout the year—suggeststhat the cost of funding these loans on the balancesheet declined relative to the cost of securitizing them
(chart 9). Despite the relatively strong growth, con-sumer loans, as a share of total loans and leases, onbanks’ books fell to a new low of about 15 percent bythe end of last year (chart 10).
For the first three quarters of 2000, commercialbanks appeared to be willing suppliers of consumercredit, according to BLPS respondents. Negligiblenet fractions of banks reported tightening standardsfor the approval of consumer loan applications otherthan for credit cards, and the net percentage of institu-tions that increased spreads of loan rates over the costof funds on these types of loans also remained small(chart 11). During the year’s final quarter, however,lenders became more cautious, with larger net frac-tions of banks reporting that they had tightened stan-dards and widened spreads. The final survey of theyear also revealed that, on net, banks had tightenedstandards and widened spreads on credit card loans(chart 12).
Real estate loans for one- to four-family homesexpanded 9.3 percent in 2000, down a touch from1999. Most of the growth was in the first half, whenthe robust housing market appeared to be littleaffected by rising mortgage rates; during this period asubstantial share of households turned to adjustable-rate mortgages (ARMs) (chart 13). Indeed, the shareof mortgage lenders’ originations that were attribut-able to ARMs remained near its recent peak of30 percent throughout the first half. By the end ofthe fourth quarter, however, the higher level of ARMrates and of other shorter-term interest rates, com-bined with falling rates on fixed-rate mortgages,
9. Securitized share of outstanding consumer loansoriginated by banks, 1988–2000
1988 1990 1992 1994 1996 1998 2000
10
20
30
40
Percent
Note. The data are seasonally adjusted.Source. Federal Reserve Board, Statistical Releases H.8, ‘‘Assets and Lia-
bilities of Commercial Banks in the United States,’’ and G.19, ‘‘ConsumerCredit.’’
10. Consumer loans as a share of total loans and leases,1988–2000
1988 1990 1992 1994 1996 1998 2000
16
18
20
Percent
Source. Federal Reserve Board, Statistical Release Z.1, ‘‘Flow of FundsAccounts of the United States,’’ table L. 101.
11. Net percentage of selected commercial banks thattightened standards and terms on consumer loansother than credit card loans, 1997–2001:Q1
1997 1998 1999 2000
20
15
10
5
0–
+5
10
15
20
25
Percent
Standards
Terms
Note. Net percentage is the percentage of banks that reported a tightening ofstandards or terms less the percentage that reported an easing. Tightening oreasing of terms represented by increase or decrease respectively in spreadof loan yield over bank’s cost of funds.
Source. Federal Reserve Board, ‘‘Senior Loan Officer Opinion Survey onBank Lending Practices.’’
372 Federal Reserve Bulletin June 2001

drove down the share of mortgage lenders’ origina-tions attributable to ARMs, to below 20 percent.Because ARM cash flows match those of banks’liabilities better than do those of fixed-rate mort-gages, the shift away from ARMs likely contributedto increased securitization of household real estateloans later in the year; the share of such loans onbank balance sheets shrank 1.6 percent in the lastquarter of 2000.
Home equity loans jumped 24.6 percent in 2000,the largest increase since 1989 and a significant accel-eration from the 5.9 percent growth in 1999. Thepickup actually began in the final two quarters of1999 and continued through the third quarter of2000. Growth slowed appreciably in the fourth quar-ter, in part because of a pickup in home mortgagerefinancing, spurred by the drop in the rate on fixed-
-rate mortgages (chart 14). In addition, householdsresponded to declining equity prices and concernsabout the future course of the economy by scalingback their purchases of consumer durable goods inthe fourth quarter. The ratio of outstanding homeequity loans to total commitments remained stable atabout 40 percent in 2000.
Other Loans and Leases
Other loans and leases grew 8.3 percent in 2000, up2 percentage points from the pace of the previousyear. However, the lease component, which had beenexpanding at an average rate of about 25 percentsince 1994, decelerated to 9.3 percent in 2000.
The increase in lease financing since the mid-1990s has resulted largely from the rapid expansionof outlays on equipment that businesses typicallylease, according to BLPS respondents. A shift ofleasing activities from nonbank affiliates to banksalso contributed to the growth of these assets atdomestic banks. Banks reported that more than60 percent of their leases have been made to non-financial corporations and that such leases have beenan important source of growth in this component overthe past several years. The slowdown in 2000, whichwas concentrated in the second half of the year,reflected a notable slackening in the growth of out-lays on equipment that businesses typically lease.Most of the remaining leases held by banks are toconsumers, primarily for automobiles.
Loans to depository institutions jumped 22.4 per-cent in 2000, up substantially from the sluggish 2 per-cent growth in 1999. The surge was concentratedin loans made to depository institutions other than
12. Net percentage of selected commercial banks thattightened standards and terms on credit card loans,1997–2001:Q1
1997 1998 1999 2000
0–
+
10
20
30
40
Percent
Standards
Terms
Note. See notes to chart 11.
13. Share of home mortgages originatedwith adjustable rates, 1991–2000
1992 1994 1996 1998 2000
10
20
30
40
50
60
Percent
Source. Federal Home Loan Bank Board.
14. Index of home mortgage refinancing activity,1991–2000
1992 1994 1996 1998 2000
5
10
15
January 4, 1991 = 1
Source. Mortgage Bankers Association.
Profits and Balance Sheet Developments at U.S. Commercial Banks in 2000 373

banks, although the growth of loans to banks—bothin the United States and abroad—remained stronglast year. In part, the growth of loans to depositoryinstitutions last year may have reflected a significantslowdown in advances from the Federal Home LoanBank System, which had grown rapidly during the1998–99 period.
Securities
Banks’ holdings of securities in combined investmentand trading accounts expanded 6.4 percent in 2000,up from 5.1 percent in 1999. The pickup was entirelyin trading accounts, where holdings jumped 37.2 per-cent after having contracted in 1998 and 1999.
Trading account assets surged, in domestic as wellas in foreign trading operations. As a result, the shareof assets held in trading accounts moved up in 2000,to 2.6 percent, after having fallen to the lowest levelin eight years at the end of 1999. Probably becauseof the deteriorating environment for stocks, however,the acquisition of equity investments in tradingaccounts slowed greatly—these investments had beenexpanding rapidly in recent years but are still a tinyfraction of total assets.
Securities held in investment accounts grew only2.9 percent, down markedly from the 6.7 percentadvance in 1999. Most of the slowdown was duringthe first half of the year, when, as noted, loan growthwas strongest. In the second half, falling interest ratescaused the value of investment account securities torise because 87 percent of these assets were classifiedas available for sale and were therefore carried atmarket value. For the year as a whole, the differencebetween the market and book values of securitiesheld in investment accounts rose from a loss ofmore than $18 billion to a loss of only $5.5 billion.Abstracting from the effect of this reevaluation,investment account securities grew only about1.5 percent last year.
The growth of securities in investment accountswas held down by the largest drop on record in bankholdings of U.S Treasury securities, 32.7 percent.The runoff was likely caused by soaring federal bud-get surpluses, which lower the supply of these securi-ties, driving up their prices and thus reducing theiryields in relation to other securities.
Holdings of other securities in investment accountsgrew 13.4 percent in 2000, down from the previoustwo years. This category, however, was boosted sig-nificantly in the second half of the year by ongoingshifts of funds by Merrill Lynch from cash manage-ment accounts held at its brokerages to money market
deposit accounts at two affiliated banks. The twoaffiliates appear to have used the funds to acquireprivate securities and to expand their lending to otherbanking institutions.
Liabilities
After changing little in 1999, core deposits advanced7.5 percent in 2000, the fastest rate of increasesince 1990. As noted, the growth of core depositsduring the second half of 2000 was boosted byMerrill Lynch’s money fund shifts; abstractingfrom this special factor, core deposits grew 6.2 per-cent last year. In addition, a good portion of theincrease in core deposits was in the final quarterof the year, when transaction deposits surged31.9 percent (annual rate). The jump likely reflecteddeclining market interest rates, falling and often vola-tile equity prices, and increased economic uncer-tainty, which apparently made liquid bank assetsmore attractive.
Although bank funding needs picked up last year,the stronger flows into core deposits allowed banks torely relatively less on managed liabilities. Managedliabilities grew 8.8 percent in 2000, down consider-ably from the 15.5 percent pace in 1999. Foreigndeposits slowed markedly, with most of the decele-ration coming in the second half of the year. Theother-managed-liabilities category, which had beengrowing at a rapid pace over the past several yearsand accounts for about 18 percent of total liabilities,also slowed appreciably last year, to about 4 percent.Large time deposits, in contrast, expanded a hefty19.4 percent in 2000, with a sharp acceleration duringthe final quarter.
Capital
Equity capital at banks rose 10.5 percent in 2000after eking out an advance of less than 4 percent in1999. The rebound was larger than that for assets,and as a result, the share of assets funded by equitycapital moved up 13 basis points, to 8.5 percent.Commercial banks added slightly more than $17 bil-lion to retained earnings in 2000, about $2 billion lessthan in 1999, as dividend payments were about un-changed even as net income slipped. They also addedabout $18 billion to paid-in capital, the other sourceof equity capital. Approximately half of the $18 bil-lion was attributable to new capital, a large portion ofwhich represented capital injections from parentholding companies. The remainder came primarily
374 Federal Reserve Bulletin June 2001

from the amount by which equity issued to fundmergers exceeded the value of the shares retired inthose mergers. Equity capital was also boosted by aswing, on an end-of-period basis, from a $13 billionloss in net unrealized gains on available-for-salesecurities in 1999 to a $1 billion gain last year.
The percentage of assets held by well-capitalizedbanks inched up for the second consecutive year, toalmost 98 percent (chart 15, top panel). However, theaverage margin by which domestic commercial banksremained well capitalized narrowed slightly afterhaving firmed a bit in 1999 (chart 15, bottom panel).4
Tier 1 capital expanded 7.8 percent last year, a ratesubstantially below the increase in equity capital. As
noted, the latter measure was boosted last year byunrealized gains on securities held in investmentaccounts; such gains and losses are excluded fromregulatory capital.
The ratio of tier 1 capital to risk-weighted assetsedged down 8 basis points, to 9.4 percent, as risk-weighted assets expanded 8.7 percent, up markedlyfrom 6 percent in 1999 (chart 16). A smaller drop inthe ratio of total capital to risk-weighted assets—3 basis points, to just over 12 percent—reflected a10.6 percent jump in tier 2 capital. The leverage ratiofell nearly 10 basis points, as the growth of averagetangible assets more than doubled.5
TRENDS IN PROFITABILITY
Total net income of commercial banks declined2 percent, to $69.8 billion, in 2000. After a strongfirst quarter, in which profits advanced 8.5 percentcompared with the first quarter of 1999, profits fellbelow year-earlier levels for the rest of the year. Inparticular, profits dropped considerably in the second
4. The average margin by which banks remained well capitalizedwas computed as follows. First, among the leverage, tier 1, and totalcapital ratios of each well-capitalized bank, the institution’s tightestcapital ratio is defined as the one closest to the regulatory standardfor being well capitalized. The bank’s margin is then defined as thepercentage-point difference between its tightest capital ratio and thecorresponding regulatory standard. The average margin among allwell-capitalized banks—the measure referred to in the text—is theweighted average of all the individual margins, with the weights beingeach bank’s share of the total assets of well-capitalized banks.
5. The tier 1 ratio is the ratio of tier 1 capital to risk-weightedassets, and the total ratio is the ratio of the sum of tier 1 and tier 2capital to risk-weighted assets. Tier 1 capital consists primarily ofcommon equity (excluding intangible assets such as goodwill andexcluding net unrealized gains on investment account securities classi-fied as available for sale) and certain perpetual preferred stock. Tier 2capital consists primarily of subordinated debt, preferred stock notincluded in tier 1 capital, and loan-loss reserves. Risk-weighted assetsare calculated by multiplying the amount of assets and the credit-equivalent amount of off-balance-sheet items (an estimate of thepotential credit exposure posed by the item) by the risk weight foreach category. The risk weights rise from zero to one as the credit riskof the assets increases. The leverage ratio is the ratio of tier 1 capitalto average tangible assets. Tangible assets are equal to total assetsless assets excluded from common equity in the calculation of tier 1capital.
15. Assets and regulatory capital at well-capitalized banks,1994–2000
1994 1996 1998 2000
1.8
2.0
2.2
Percentage points
96
98
100
Percent
Share of industry assetsat well-capitalized banks
Average margin by whichbanks were well capitalized
Note. For the definition of well capitalized and of the margin by whichbanks remain well capitalized, see text note 4.
16. Regulatory capital ratios, 1990–2000
1990 1992 1994 1996 1998 2000
8
10
12
14
Percent
Total (tier 1 + tier 2) ratio
Tier 1 ratio
Leverage ratio
Note. For the definition of capital ratios, see text note 5.
Profits and Balance Sheet Developments at U.S. Commercial Banks in 2000 375

quarter, when First Union Bank and several banks inthe Bank One holding company booked substantialrestructuring charges. After having peaked in 1999,industrywide return on assets fell 13 basis points, to1.18 percent (table 2). Return on equity fell 139 basispoints, to 14.0 percent. A sharp increase in loan-lossprovisioning, a slowdown in the growth of noninter-est income, and an increase in the cost of funds thatexceeded the rise in earning asset yields all contrib-uted to the decline in profitability last year.
Despite reduced profitability, dividends remainedfairly stable, growing about 1 percent. These pay-ments, made primarily to parent holding companies,decreased only 7 basis points as a percentage ofassets after having risen by 16 basis points in 1999.Partly as a result, retained income fell to 0.29 percentof assets, the lowest level in a decade.
The number of banks that had negative net incomedeclined to 605 in 2000 from 658 the previous year,reversing an upward trend that had begun in 1995.On the other hand, banks that lost money held4.5 percent of industry assets last year, a sharp rise
from 1.7 percent in 1999 and the largest share since1992, when banks holding more than 11 percent ofthe industry’s assets lost money. About half of lastyear’s increase in assets of banks losing money wasat several large commercial bank subsidiaries of asingle large bank holding company.
In 1999, the small-bank size group was the onlyone to show a decline in profitability; in 2000, thisgroup was alone in posting profitability gains(chart 17). The difference between the two yearsreflects loss provisioning, which was concentrated atthe larger banks last year. The largest 1,000 bankssuffered from a 40 percent increase in loan-loss provi-sions, whereas the smaller banks increased provision-ing only 10 percent. The ten largest banks also expe-rienced a big increase in noninterest expense, morethan 20 percent of which was the result of the afore-mentioned restructuring charges at First Union; atsmall banks this item declined.
Despite some earnings pressure, bank holdingcompany stocks rose in 2000, significantly outper-forming the S&P 500, primarily because of gainsregistered during the second half of the year(chart 18). The Dow Jones bank index advanced14 percent for the year, boosted substantially by theperformance of some of the largest regional bankholding companies. By affecting investors’ percep-tions, falling market interest rates likely offset moder-ate declines in actual profitability and increasing con-cerns about asset quality.
Interest Income and Expense
Although market interest rates fell in the latter part of2000, in many cases to below the levels prevailing asthe year began, they were higher on average for theyear than in 1999. Gross interest income rose 46 basispoints as a percentage of assets, but gross interestexpense increased more, 54 basis points. As a result,
2. Selected income and expense items as a proportion of assets, 1992–2000Percent
Item 1992 1993 1994 1995 1996 1997 1998 1999 2000
Net interest income . . . . . . . . . . . . . . . . . . . . . . . . . . . . . . . . . . 3.89 3.90 3.78 3.72 3.73 3.67 3.52 3.52 3.43Noninterest income . . . . . . . . . . . . . . . . . . . . . . . . . . . . . . . . . . 1.95 2.13 2.00 2.02 2.18 2.23 2.40 2.65 2.57Noninterest expense . . . . . . . . . . . . . . . . . . . . . . . . . . . . . . . . . 3.86 3.94 3.75 3.64 3.71 3.61 3.76 3.76 3.65Loss provisioning . . . . . . . . . . . . . . . . . . . . . . . . . . . . . . . . . . . .78 .47 .28 .30 .37 .41 .41 .39 .49Realized gains on investment account securities . . . . . . . .11 .09 −.01 .01 .03 .04 .06 .00 −.04
Income before taxes and extraordinary items . . . . . . . 1.32 1.70 1.73 1.81 1.85 1.93 1.81 2.03 1.81
Taxes and extraordinary items . . . . . . . . . . . . . . . . . . . . . . . .41 .50 .58 .63 .65 .67 .61 .72 .63Net income (return on assets) . . . . . . . . . . . . . . . . . . . . . . .91 1.20 1.15 1.18 1.20 1.25 1.19 1.31 1.18
Dividends . . . . . . . . . . . . . . . . . . . . . . . . . . . . . . . . . . . . . . . . . . . .41 .62 .73 .75 .90 .90 .80 .96 .89
Retained income . . . . . . . . . . . . . . . . . . . . . . . . . . . . . . . . . . . . .49 .58 .42 .43 .30 .35 .39 .35 .29
17. Return on equity, by size of bank, 1985–2000
1985 1990 1995 2000
10
0–
+
10
20
Percent
Large
Small
10 largest
Medium
Note. For definition of bank size, see text note 1.
376 Federal Reserve Bulletin June 2001
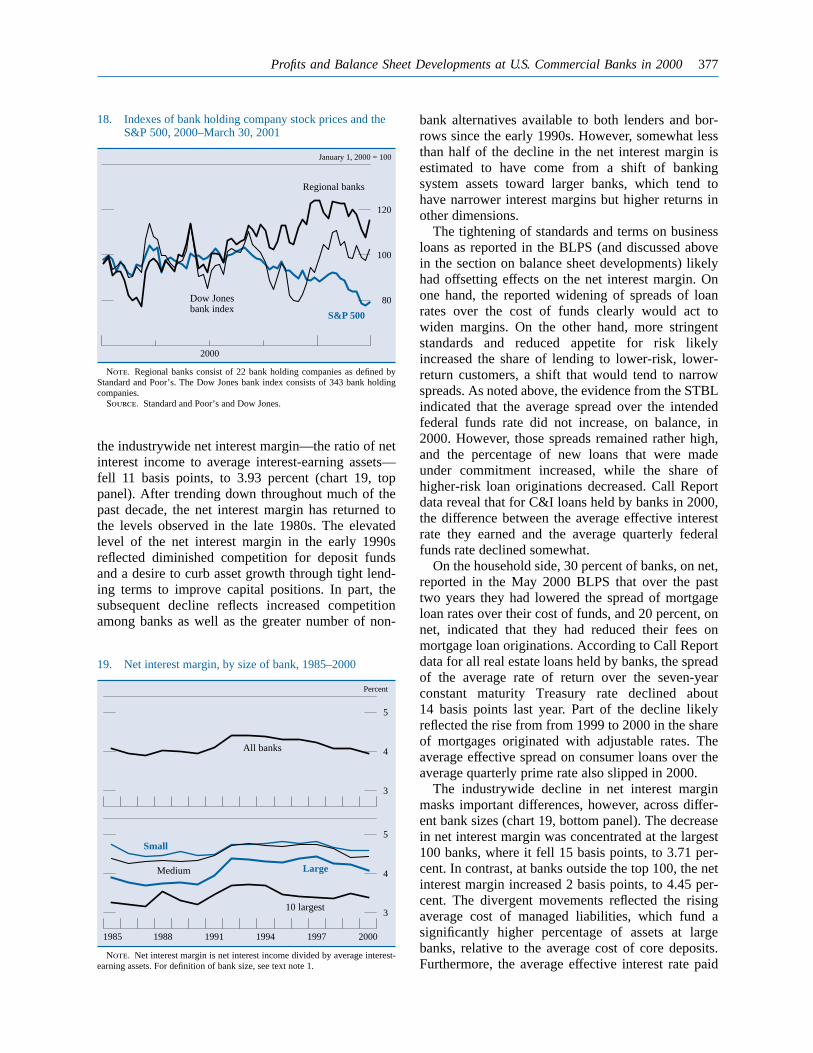
the industrywide net interest margin—the ratio of netinterest income to average interest-earning assets—fell 11 basis points, to 3.93 percent (chart 19, toppanel). After trending down throughout much of thepast decade, the net interest margin has returned tothe levels observed in the late 1980s. The elevatedlevel of the net interest margin in the early 1990sreflected diminished competition for deposit fundsand a desire to curb asset growth through tight lend-ing terms to improve capital positions. In part, thesubsequent decline reflects increased competitionamong banks as well as the greater number of non-
bank alternatives available to both lenders and bor-rows since the early 1990s. However, somewhat lessthan half of the decline in the net interest margin isestimated to have come from a shift of bankingsystem assets toward larger banks, which tend tohave narrower interest margins but higher returns inother dimensions.
The tightening of standards and terms on businessloans as reported in the BLPS (and discussed abovein the section on balance sheet developments) likelyhad offsetting effects on the net interest margin. Onone hand, the reported widening of spreads of loanrates over the cost of funds clearly would act towiden margins. On the other hand, more stringentstandards and reduced appetite for risk likelyincreased the share of lending to lower-risk, lower-return customers, a shift that would tend to narrowspreads. As noted above, the evidence from the STBLindicated that the average spread over the intendedfederal funds rate did not increase, on balance, in2000. However, those spreads remained rather high,and the percentage of new loans that were madeunder commitment increased, while the share ofhigher-risk loan originations decreased. Call Reportdata reveal that for C&I loans held by banks in 2000,the difference between the average effective interestrate they earned and the average quarterly federalfunds rate declined somewhat.
On the household side, 30 percent of banks, on net,reported in the May 2000 BLPS that over the pasttwo years they had lowered the spread of mortgageloan rates over their cost of funds, and 20 percent, onnet, indicated that they had reduced their fees onmortgage loan originations. According to Call Reportdata for all real estate loans held by banks, the spreadof the average rate of return over the seven-yearconstant maturity Treasury rate declined about14 basis points last year. Part of the decline likelyreflected the rise from from 1999 to 2000 in the shareof mortgages originated with adjustable rates. Theaverage effective spread on consumer loans over theaverage quarterly prime rate also slipped in 2000.
The industrywide decline in net interest marginmasks important differences, however, across differ-ent bank sizes (chart 19, bottom panel). The decreasein net interest margin was concentrated at the largest100 banks, where it fell 15 basis points, to 3.71 per-cent. In contrast, at banks outside the top 100, the netinterest margin increased 2 basis points, to 4.45 per-cent. The divergent movements reflected the risingaverage cost of managed liabilities, which fund asignificantly higher percentage of assets at largebanks, relative to the average cost of core deposits.Furthermore, the average effective interest rate paid
18. Indexes of bank holding company stock prices and theS&P 500, 2000–March 30, 2001
2000
80
100
120
January 1, 2000 = 100
Regional banks
S&P 500
Dow Jonesbank index
Note. Regional banks consist of 22 bank holding companies as defined byStandard and Poor’s. The Dow Jones bank index consists of 343 bank holdingcompanies.
Source. Standard and Poor’s and Dow Jones.
19. Net interest margin, by size of bank, 1985–2000
1985 1988 1991 1994 1997 2000
3
4
5
3
4
5
Percent
All banks
Large
Small
10 largest
Medium
Note. Net interest margin is net interest income divided by average interest-earning assets. For definition of bank size, see text note 1.
Profits and Balance Sheet Developments at U.S. Commercial Banks in 2000 377
on large time deposits increased at large banks bymore than it did at small banks, and the spreads (overcomparable-maturity Treasury debt) on the subordi-nated debt issues of several large bank holding com-panies also rose. Perhaps contributing to the higherfunding costs at large banks relative to small bankswas the significantly larger increase in delinquencyrates at large banks, which may have created the
perception that they had become relatively morerisky.
Noninterest Income and Expense
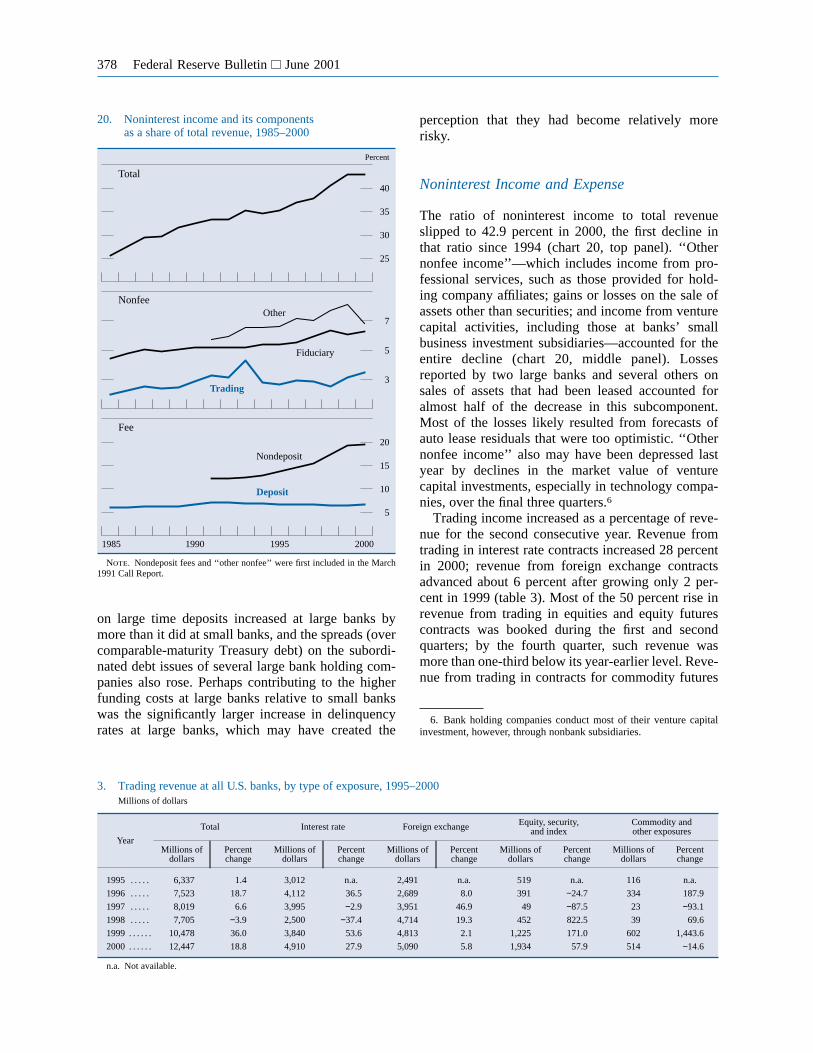
The ratio of noninterest income to total revenueslipped to 42.9 percent in 2000, the first decline inthat ratio since 1994 (chart 20, top panel). ‘‘Othernonfee income’’—which includes income from pro-fessional services, such as those provided for hold-ing company affiliates; gains or losses on the sale ofassets other than securities; and income from venturecapital activities, including those at banks’ smallbusiness investment subsidiaries—accounted for theentire decline (chart 20, middle panel). Lossesreported by two large banks and several others onsales of assets that had been leased accounted foralmost half of the decrease in this subcomponent.Most of the losses likely resulted from forecasts ofauto lease residuals that were too optimistic. ‘‘Othernonfee income’’ also may have been depressed lastyear by declines in the market value of venturecapital investments, especially in technology compa-nies, over the final three quarters.6
Trading income increased as a percentage of reve-nue for the second consecutive year. Revenue fromtrading in interest rate contracts increased 28 percentin 2000; revenue from foreign exchange contractsadvanced about 6 percent after growing only 2 per-cent in 1999 (table 3). Most of the 50 percent rise inrevenue from trading in equities and equity futurescontracts was booked during the first and secondquarters; by the fourth quarter, such revenue wasmore than one-third below its year-earlier level. Reve-nue from trading in contracts for commodity futures
6. Bank holding companies conduct most of their venture capitalinvestment, however, through nonbank subsidiaries.
20. Noninterest income and its componentsas a share of total revenue, 1985–2000
1985 1990 1995 2000
5
10
15
20
3
5
7
25
30
35
40
Percent
Other
Fiduciary
Trading
Deposit
Nondeposit
Total
Nonfee
Fee
Note. Nondeposit fees and ‘‘other nonfee’’ were first included in the March1991 Call Report.
3. Trading revenue at all U.S. banks, by type of exposure, 1995–2000Millions of dollars
Year
Total Interest rate Foreign exchange Equity, security,and index
Commodity andother exposures
Millions ofdollars
Percentchange
Millions ofdollars
Percentchange
Millions ofdollars
Percentchange
Millions ofdollars
Percentchange
Millions ofdollars
Percentchange
1995 . . . . . 6,337 1.4 3,012 n.a. 2,491 n.a. 519 n.a. 116 n.a.
1996 . . . . . 7,523 18.7 4,112 36.5 2,689 8.0 391 −24.7 334 187.9
1997 . . . . . 8,019 6.6 3,995 −2.9 3,951 46.9 49 −87.5 23 −93.1
1998 . . . . . 7,705 −3.9 2,500 −37.4 4,714 19.3 452 822.5 39 69.6
1999 . . . . . . 10,478 36.0 3,840 53.6 4,813 2.1 1,225 171.0 602 1,443.6
2000 . . . . . . 12,447 18.8 4,910 27.9 5,090 5.8 1,934 57.9 514 −14.6
n.a. Not available.
378 Federal Reserve Bulletin June 2001
and options declined. Fiduciary income, primarilyfees received for services rendered by bank trustdepartments, resumed its upward trend as a share ofrevenue after dipping in 1999.
Nondeposit fee income—which consists of feesearned on credit cards, mortgage servicing andrefinancing, the sale and servicing of mutual fundsand annuities, ATM surcharges, and securitized loansand securities lending—continued to increase as ashare of total revenue (chart 20, bottom). Althoughno data are available on most of the individual ele-ments of this income category, fees from the sale andservicing of mutual funds grew 11 percent in 2000.The gain also likely reflects, in part, the continuedrise in securities lent by the trust departmentsof commercial banks (chart 21). Deposit fees alsoincreased as a percentage of revenue after havingdeclined fairly continuously throughout the 1990s;the turnaround perhaps reflected some results frombanks’ reported efforts to increase the profitability oftransactions accounts.
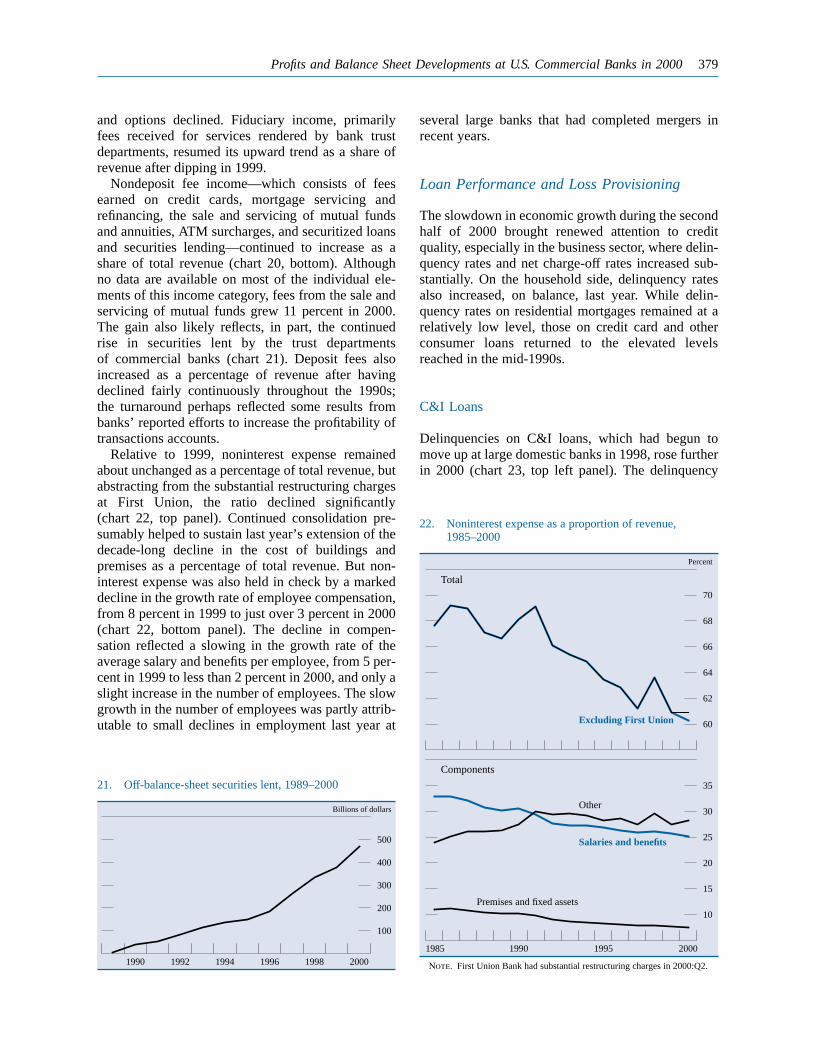
Relative to 1999, noninterest expense remainedabout unchanged as a percentage of total revenue, butabstracting from the substantial restructuring chargesat First Union, the ratio declined significantly(chart 22, top panel). Continued consolidation pre-sumably helped to sustain last year’s extension of thedecade-long decline in the cost of buildings andpremises as a percentage of total revenue. But non-interest expense was also held in check by a markeddecline in the growth rate of employee compensation,from 8 percent in 1999 to just over 3 percent in 2000(chart 22, bottom panel). The decline in compen-sation reflected a slowing in the growth rate of theaverage salary and benefits per employee, from 5 per-cent in 1999 to less than 2 percent in 2000, and only aslight increase in the number of employees. The slowgrowth in the number of employees was partly attrib-utable to small declines in employment last year at
several large banks that had completed mergers inrecent years.
Loan Performance and Loss Provisioning
The slowdown in economic growth during the secondhalf of 2000 brought renewed attention to creditquality, especially in the business sector, where delin-quency rates and net charge-off rates increased sub-stantially. On the household side, delinquency ratesalso increased, on balance, last year. While delin-quency rates on residential mortgages remained at arelatively low level, those on credit card and otherconsumer loans returned to the elevated levelsreached in the mid-1990s.
C&I Loans
Delinquencies on C&I loans, which had begun tomove up at large domestic banks in 1998, rose furtherin 2000 (chart 23, top left panel). The delinquency
21. Off-balance-sheet securities lent, 1989–2000
1990 1992 1994 1996 1998 2000
100
200
300
400
500
Billions of dollars
22. Noninterest expense as a proportion of revenue,1985–2000
1985 1990 1995 2000
10
15
20
25
30
35
60
62
64
66
68
70
Percent
Total
Components
Excluding First Union
Salaries and benefits
Other
Premises and fixed assets
Note. First Union Bank had substantial restructuring charges in 2000:Q2.
Profits and Balance Sheet Developments at U.S. Commercial Banks in 2000 379

rate on business loans at small banks, which hadbeen relatively stable over the past several years, alsoincreased in 2000. Although the delinquency rateshave risen from exceedingly low levels, about half ofthe banks participating in the November 2000 BLPSindicated that they had been surprised by the extentof deterioration in the credit quality of their C&I loanportfolio since the middle of 1998. During the firsthalf of last year, respondents often noted problemsrelated to specific industries, such as health care andcompanies exposed to asbestos-related litigation; butby year-end, problem loans reportedly were spreadover a wider variety of industries.
Net charge-off rates on C&I loans—which hadbegun increasing more than a year before delin-quency rates—continued to move up in 2000, mark-edly so in the fourth quarter (chart 23, bottom leftpanel). In part, net charge-offs increased becauserecovery rates—defined as gross recoveries dividedby total business loans—declined to decade-lowlevels in 2000. The sustained decline in the C&Irecovery rate over the past several years probablyarises from the relatively easier bank lending environ-
ment, particularly the less restrictive loan covenantsand lower collateral requirements, that prevailedbefore the market turmoil in the second half of 1998.Despite the rise in charge-offs, the fraction of C&Iloans that are classified as ‘‘nonaccrual’’ has alsorisen, reaching 1.52 percent in 2000; many non-accrual loans are later charged off. The ratio of netcharge-offs to average delinquencies rose for thesixth consecutive year, to 34 percent, a level higherthan it was during the recession of 1990–91.
Commercial Real Estate Loans
In contrast to C&I loans, commercial real estate loanscontinued to perform well, with delinquency ratesremaining below 2 percent and net charge-off ratesstill almost negligible (chart 23, top and bottom leftpanels). These loans benefited from low vacancyrates for commercial office space and rising commer-cial rents even as economic growth slowed in thesecond half. Nevertheless, many of the largest banksin this sector apparently have not forgotten the heavy
23. Delinquency and charge-off rates for loans to businesses and households, by type of loan, 1991–2000
1992 1994 1996 1998 2000
0–
+
1
2
4
8
12
Percent
1992 1994 1996 1998 2000
0–
+
1
2
3
4
5
2
3
4
5
Percent
Delinquencies, businesses
Net charge-offs, businesses
Delinquencies, households
Net charge-offs, households
Commercial real estate
C&I
Credit card
Other consumer
Residential real estate
Note. The data are seasonally adjusted. Delinquent loans are loans that arenot accruing interest and those that are accruing interest but are more than thirtydays past due. The delinquency rate is the end-of-period level of delinquent
loans divided by the end-of-period level of outstanding loans. The net charge-offrate is the annualized amount of charge-offs over the period, net of recoveries,divided by the average level of outstanding loans over the period.
380 Federal Reserve Bulletin June 2001
losses suffered in the commercial real estate marketduring the early 1990s. On net, about 40 percent ofbanks responding to the BLPS indicated that they hadtightened standards on commercial real estate loansat some point in 2000. Also, in the January 2001survey, 49 percent of domestic banks, on net, indi-cated that they had increased spreads of loan ratesover their cost of funds during 2000, and 42 percentreported that they required higher debt-service-coverage ratios.
Loans to Households
A period of improving quality in consumer loanscame to an end in the first quarter of 2000, withdelinquency and net charge-off rates on credit cardloans and consumer installment loans rising over therest of the year (chart 23 top and bottom right pan-els). The delinquency rate on consumer installmentloans rose 7 basis points in 2000, to 3.06 percent,although that on credit card loans edged up only2 basis points, to 4.57 percent. The deterioration inconsumers’ servicing of their debt probably reflectsthe pressures brought to bear by the slowdown ineconomic activity as the year progressed and thecontinued rise in household debt-service payments asa fraction of disposable income, which reached itshighest level in fifteen years (chart 24). In the Janu-ary 2001 BLPS, 19 percent of banks, on net, reporteda tightening of lending standards on all types of
consumer loans, a significantly higher fraction thanin previous surveys.
The delinquency rate on residential mortgage loanscrept up and then rose sharply in the fourth quarter.A fairly recent trend toward relatively easier lendingconditions in this market may have added to theeffect of a weakening economy and rising debt-service burdens. In the May 2000 BLPS, for exam-ple, almost half of the banks surveyed, on net, indi-cated that over the past two years they had increasedthe maximum size of their residential mortgage loans.Moreover, about one-fourth, on net, had eased theirrequirements for down payments, a change reflectedin the fraction, albeit small, of mortgage loansextended with no down payment. The easier terms onresidential real estate loans have negative implica-tions for the average credit quality in this sector andfor the recovery rate on foreclosed properties. Never-theless, the net charge-off rate on residential mort-gages remained very low in 2000, likely as a resultof continued strength in existing home sales, whichcontributed to solid growth in median home prices.
24. Debt burden of businesses and households, 1985–2000
1985 1990 1995 2000
10
12
14
16
18
20
Percent
Households
Nonfinancial corporations
Note. The debt burden for nonfinancial corporations is calculated as interestpayments as a percentage of cash flow. The debt burden for households is anestimate of the ratio of debt payments to disposable personal income; debtpayments consist of the estimated required payments on outstanding mortgageand consumer debt.
Source. National income and product accounts and the Federal ReserveSystem.
25. Reserves, provisioning, and charge-offsfor loan and lease losses, 1985–2000
1985 1990 1995 2000
100
200
300
400
.5
1.0
1.5
2.0
2.5
3.0
Percent
As a percentage of loans and leases
Loss reserves
Loss reserves
Loss provisioning
Net charge-offs
Relative to net charge-offs
Relative to delinquencies
Note. For definitions of delinquencies and net charge-offs, see note tochart 23.
Profits and Balance Sheet Developments at U.S. Commercial Banks in 2000 381
Loss Provisioning
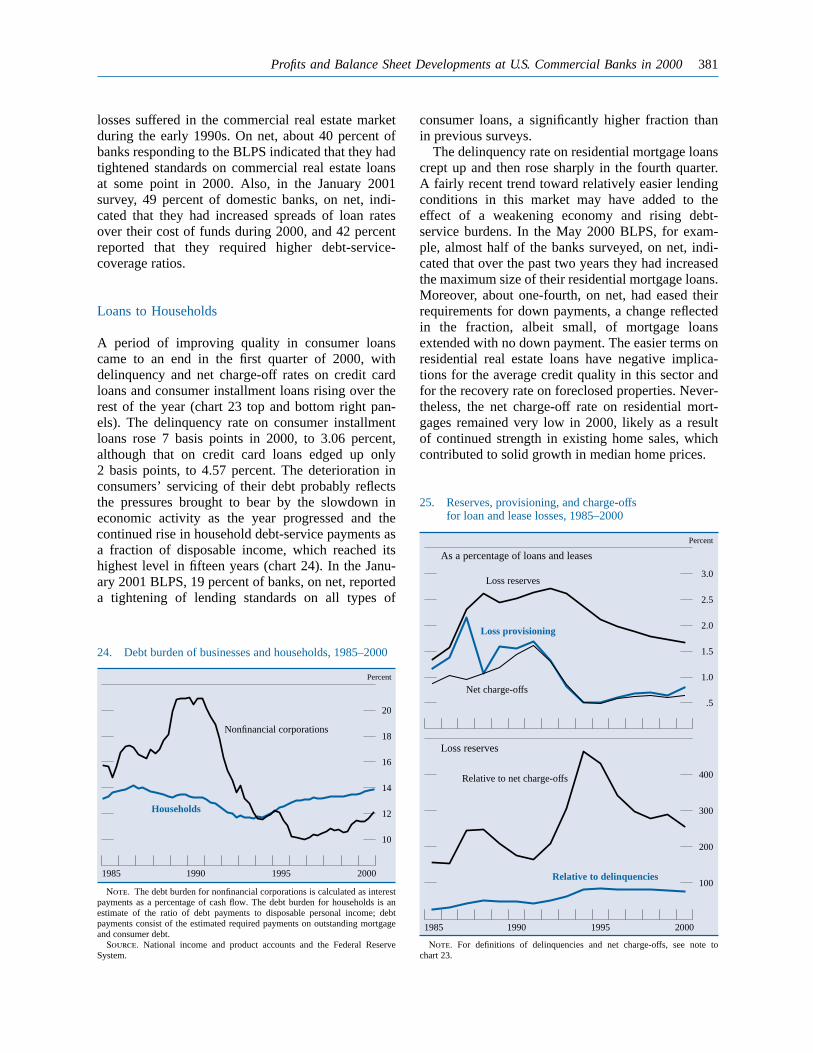
In response to higher delinquency and charge-offrates overall, commercial banks aggressively steppedup loan-loss provisioning in 2000 (chart 25, toppanel). Almost 80 percent of the increase was attrib-utable to the largest 100 banks, and among those,much of it was concentrated at the commercial banksubsidiaries of a few large bank holding companies.Nevertheless, because of the increase in net charge-offs, the sharp rise in loss provisioning resulted inonly an 8 percent increase in loan-loss reserves—lessthan the advance in total loans and leases. As a result,the ratio of loan-loss reserves to total loans and leasesfell 7 basis points, to 1.66 percent, the lowest levelsince 1986.
Other measures of the adequacy of loan-lossreserves also fell but remained at fairly high levelsrelative to historical norms (chart 25, bottom panel).The ratio of loan-loss reserves to delinquent loansdropped 10 percentage points, to 70 percent, still justbelow the elevated range of the past several yearsand above its level of the late 1980s and early 1990s.Similarly, the ratio of loan-loss reserves to netcharge-offs declined significantly last year butremained above its level of the late 1980s and early1990s.
INTERNATIONAL OPERATIONSOF U.S. COMMERCIAL BANKS
The share of assets at domestically chartered banksthat were booked at foreign offices fell for the third
consecutive year in 2000, reaching 12.3 percent. Thedecline reflected strong U.S. economic growth andthe associated rise in lending to U.S. entities over thefirst half of 2000. Nevertheless, rising income fromforeign operations during the first two quarters ofthe year boosted the share of income attributableto such operations to 10.3 percent, up from 9.9 per-cent in 1999. The increase in income reflected arise in interest income, which rebounded notablyafter slipping in 1999, and—in contrast to domes-tic operations—a notable reduction in loan-lossprovisioning.
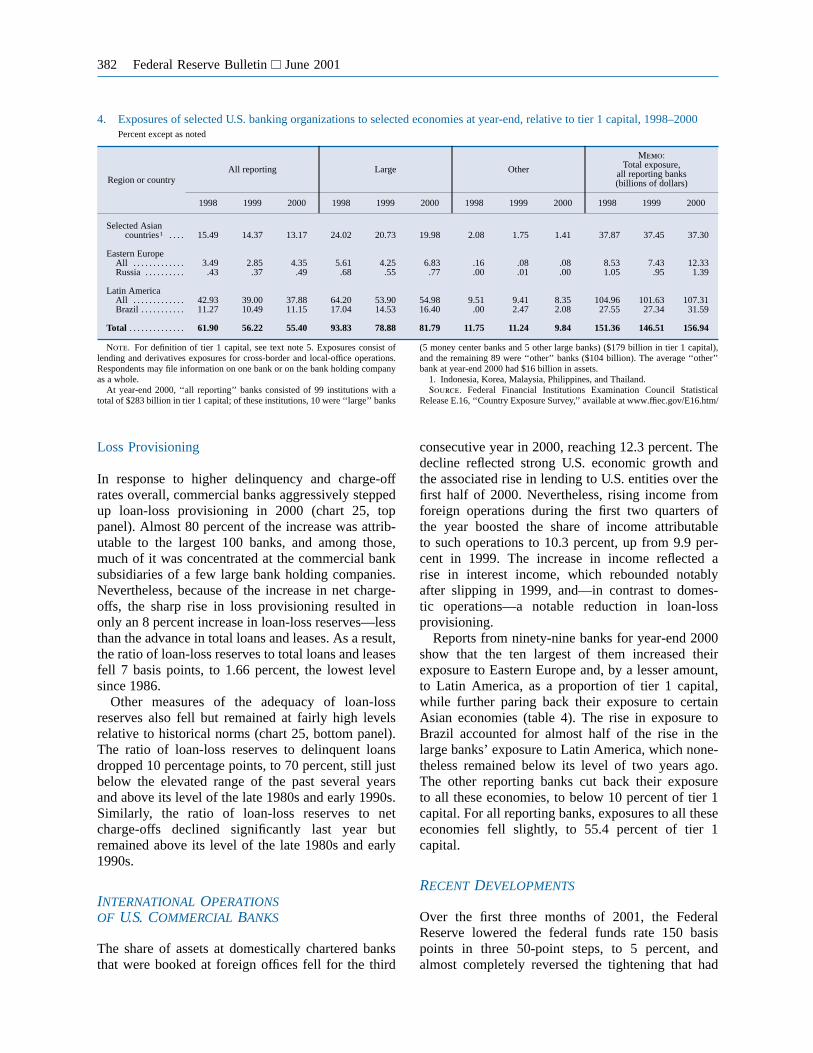
Reports from ninety-nine banks for year-end 2000show that the ten largest of them increased theirexposure to Eastern Europe and, by a lesser amount,to Latin America, as a proportion of tier 1 capital,while further paring back their exposure to certainAsian economies (table 4). The rise in exposure toBrazil accounted for almost half of the rise in thelarge banks’ exposure to Latin America, which none-theless remained below its level of two years ago.The other reporting banks cut back their exposureto all these economies, to below 10 percent of tier 1capital. For all reporting banks, exposures to all theseeconomies fell slightly, to 55.4 percent of tier 1capital.
RECENT DEVELOPMENTS
Over the first three months of 2001, the FederalReserve lowered the federal funds rate 150 basispoints in three 50-point steps, to 5 percent, andalmost completely reversed the tightening that had
4. Exposures of selected U.S. banking organizations to selected economies at year-end, relative to tier 1 capital, 1998–2000Percent except as noted
Region or countryAll reporting Large Other
Memo:Total exposure,
all reporting banks(billions of dollars)
1998 1999 2000 1998 1999 2000 1998 1999 2000 1998 1999 2000
Selected Asiancountries1 . . . . 15.49 14.37 13.17 24.02 20.73 19.98 2.08 1.75 1.41 37.87 37.45 37.30
Eastern EuropeAll . . . . . . . . . . . . . 3.49 2.85 4.35 5.61 4.25 6.83 .16 .08 .08 8.53 7.43 12.33Russia . . . . . . . . . . .43 .37 .49 .68 .55 .77 .00 .01 .00 1.05 .95 1.39
Latin AmericaAll . . . . . . . . . . . . . 42.93 39.00 37.88 64.20 53.90 54.98 9.51 9.41 8.35 104.96 101.63 107.31Brazil . . . . . . . . . . . 11.27 10.49 11.15 17.04 14.53 16.40 .00 2.47 2.08 27.55 27.34 31.59
Total . . . . . . . . . . . . . . 61.90 56.22 55.40 93.83 78.88 81.79 11.75 11.24 9.84 151.36 146.51 156.94
Note. For definition of tier 1 capital, see text note 5. Exposures consist oflending and derivatives exposures for cross-border and local-office operations.Respondents may file information on one bank or on the bank holding companyas a whole.
At year-end 2000, ‘‘all reporting’’ banks consisted of 99 institutions with atotal of $283 billion in tier 1 capital; of these institutions, 10 were ‘‘large’’ banks
(5 money center banks and 5 other large banks) ($179 billion in tier 1 capital),and the remaining 89 were ‘‘other’’ banks ($104 billion). The average ‘‘other’’bank at year-end 2000 had $16 billion in assets.
1. Indonesia, Korea, Malaysia, Philippines, and Thailand.Source. Federal Financial Institutions Examination Council Statistical
Release E.16, ‘‘Country Exposure Survey,’’ available at www.ffiec.gov/E16.htm/
382 Federal Reserve Bulletin June 2001
begun in the second half of 1999. Despite the changein the stance of monetary policy, responses to asupplementary survey of bank lending practices inMarch 2001 indicated that banks, on net, continued totighten standards and strengthen terms on commer-cial and industrial loans during the first two monthsof 2001. The equity prices of bank holding compa-nies declined moderately, on balance, over the firstquarter of 2001, although bank share prices contin-ued to perform better than the S&P 500.
The net income of a sample of twenty-five largebank holding companies declined more than 10 per-
cent in the first quarter of 2001 relative to the samequarter last year. Profitability was restrained sig-nificantly by continued increases in loan-loss provi-sioning arising from ongoing deterioration in creditquality; according to several banks, the deteriorationremains concentrated in commercial loan portfolios.The decline in net income also reflected reducedrevenues from capital market activities, particularlyat banking organizations that have substantial venturecapital operations.
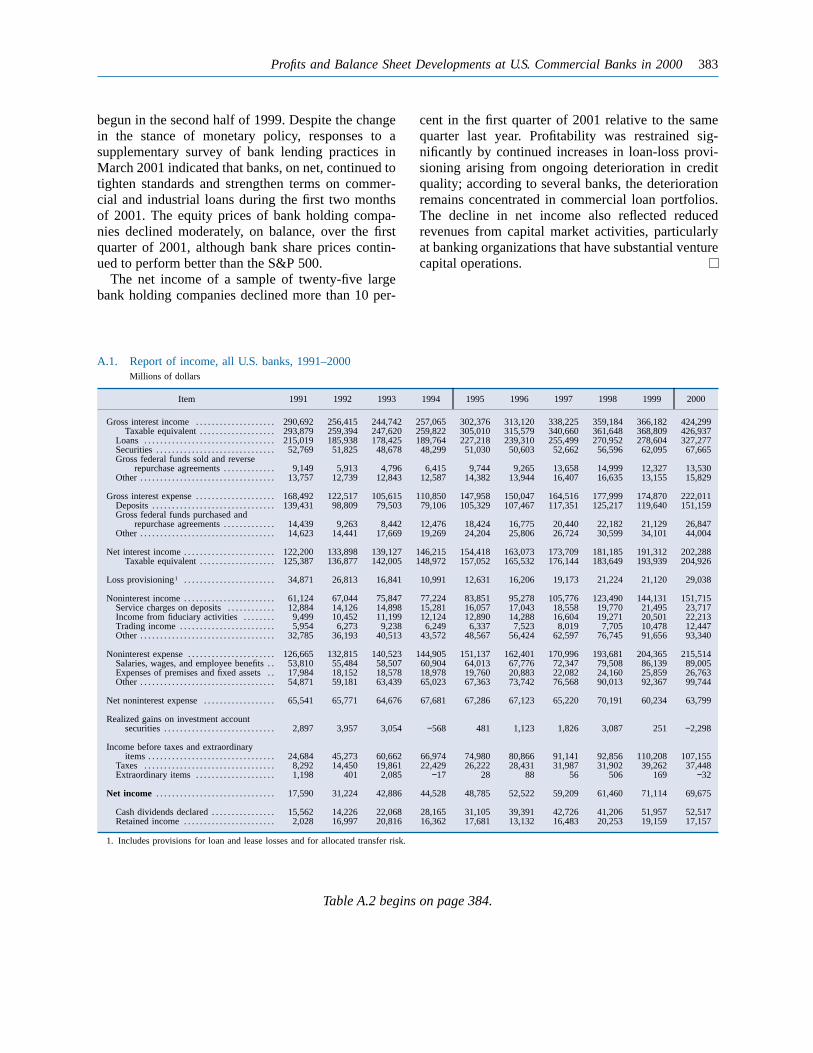
A.1. Report of income, all U.S. banks, 1991–2000Millions of dollars
Item 1991 1992 1993 1994 1995 1996 1997 1998 1999 2000
Gross interest income . . . . . . . . . . . . . . . . . . . .Taxable equivalent . . . . . . . . . . . . . . . . . . .
Loans . . . . . . . . . . . . . . . . . . . . . . . . . . . . . . . . .Securities . . . . . . . . . . . . . . . . . . . . . . . . . . . . . .Gross federal funds sold and reverse
repurchase agreements . . . . . . . . . . . . .Other . . . . . . . . . . . . . . . . . . . . . . . . . . . . . . . . . .
Gross interest expense . . . . . . . . . . . . . . . . . . . .Deposits . . . . . . . . . . . . . . . . . . . . . . . . . . . . . . .Gross federal funds purchased and
repurchase agreements . . . . . . . . . . . . .Other . . . . . . . . . . . . . . . . . . . . . . . . . . . . . . . . . .
Net interest income . . . . . . . . . . . . . . . . . . . . . . .Taxable equivalent . . . . . . . . . . . . . . . . . . .
Loss provisioning1 . . . . . . . . . . . . . . . . . . . . . . .
Noninterest income . . . . . . . . . . . . . . . . . . . . . . .Service charges on deposits . . . . . . . . . . . .Income from fiduciary activities . . . . . . . .Trading income . . . . . . . . . . . . . . . . . . . . . . . .Other . . . . . . . . . . . . . . . . . . . . . . . . . . . . . . . . . .
Noninterest expense . . . . . . . . . . . . . . . . . . . . . .Salaries, wages, and employee benefits . .Expenses of premises and fixed assets . .Other . . . . . . . . . . . . . . . . . . . . . . . . . . . . . . . . . .
Net noninterest expense . . . . . . . . . . . . . . . . . .
Realized gains on investment accountsecurities . . . . . . . . . . . . . . . . . . . . . . . . . . . .
Income before taxes and extraordinaryitems . . . . . . . . . . . . . . . . . . . . . . . . . . . . . . . .
Taxes . . . . . . . . . . . . . . . . . . . . . . . . . . . . . . . . .Extraordinary items . . . . . . . . . . . . . . . . . . . .
Net income . . . . . . . . . . . . . . . . . . . . . . . . . . . . . .
Cash dividends declared . . . . . . . . . . . . . . . .Retained income . . . . . . . . . . . . . . . . . . . . . . .
1. Includes provisions for loan and lease losses and for allocated transfer risk.
Table A.2 begins on page 384.
290,692 256,415 244,742 257,065 302,376 313,120 338,225 359,184 366,182 424,299293,879 259,394 247,620 259,822 305,010 315,579 340,660 361,648 368,809 426,937215,019 185,938 178,425 189,764 227,218 239,310 255,499 270,952 278,604 327,277
52,769 51,825 48,678 48,299 51,030 50,603 52,662 56,596 62,095 67,665
9,149 5,913 4,796 6,415 9,744 9,265 13,658 14,999 12,327 13,53013,757 12,739 12,843 12,587 14,382 13,944 16,407 16,635 13,155 15,829
168,492 122,517 105,615 110,850 147,958 150,047 164,516 177,999 174,870 222,011139,431 98,809 79,503 79,106 105,329 107,467 117,351 125,217 119,640 151,159
14,439 9,263 8,442 12,476 18,424 16,775 20,440 22,182 21,129 26,84714,623 14,441 17,669 19,269 24,204 25,806 26,724 30,599 34,101 44,004
122,200 133,898 139,127 146,215 154,418 163,073 173,709 181,185 191,312 202,288125,387 136,877 142,005 148,972 157,052 165,532 176,144 183,649 193,939 204,926
34,871 26,813 16,841 10,991 12,631 16,206 19,173 21,224 21,120 29,038
61,124 67,044 75,847 77,224 83,851 95,278 105,776 123,490 144,131 151,71512,884 14,126 14,898 15,281 16,057 17,043 18,558 19,770 21,495 23,717
9,499 10,452 11,199 12,124 12,890 14,288 16,604 19,271 20,501 22,2135,954 6,273 9,238 6,249 6,337 7,523 8,019 7,705 10,478 12,447
32,785 36,193 40,513 43,572 48,567 56,424 62,597 76,745 91,656 93,340
126,665 132,815 140,523 144,905 151,137 162,401 170,996 193,681 204,365 215,51453,810 55,484 58,507 60,904 64,013 67,776 72,347 79,508 86,139 89,00517,984 18,152 18,578 18,978 19,760 20,883 22,082 24,160 25,859 26,76354,871 59,181 63,439 65,023 67,363 73,742 76,568 90,013 92,367 99,744
65,541 65,771 64,676 67,681 67,286 67,123 65,220 70,191 60,234 63,799
2,897 3,957 3,054 −568 481 1,123 1,826 3,087 251 −2,298
24,684 45,273 60,662 66,974 74,980 80,866 91,141 92,856 110,208 107,1558,292 14,450 19,861 22,429 26,222 28,431 31,987 31,902 39,262 37,4481,198 401 2,085 −17 28 88 56 506 169 −32
17,590 31,224 42,886 44,528 48,785 52,522 59,209 61,460 71,114 69,675
15,562 14,226 22,068 28,165 31,105 39,391 42,726 41,206 51,957 52,5172,028 16,997 20,816 16,362 17,681 13,132 16,483 20,253 19,159 17,157
Profits and Balance Sheet Developments at U.S. Commercial Banks in 2000 383

A.2. Portfolio composition, interest rates, and income and expense, all U.S. banks, 1991–2000A. All banks
Item 1991 1992 1993 1994 1995 1996 1997 1998 1999 2000
Balance sheet items as a percentage of average net consolidated assets
Interest-earning assets . . . . . . . . . . . . . . . . . . . . . . . . . . . .Loans and leases, net . . . . . . . . . . . . . . . . . . . . . . . . . .
Commercial and industrial . . . . . . . . . . . . . . . . . . .U.S. addressees . . . . . . . . . . . . . . . . . . . . . . . . . . . .Foreign addressees . . . . . . . . . . . . . . . . . . . . . . . .
Consumer . . . . . . . . . . . . . . . . . . . . . . . . . . . . . . . . . . .Credit card . . . . . . . . . . . . . . . . . . . . . . . . . . . . . . . .Installment and other . . . . . . . . . . . . . . . . . . . . . .
Real estate . . . . . . . . . . . . . . . . . . . . . . . . . . . . . . . . . .In domestic offices . . . . . . . . . . . . . . . . . . . . . . . .
Construction and land development . . . . . .Farmland . . . . . . . . . . . . . . . . . . . . . . . . . . . . . . .One- to four-family residential . . . . . . . . . . .
Home equity . . . . . . . . . . . . . . . . . . . . . . . . .Other . . . . . . . . . . . . . . . . . . . . . . . . . . . . . . . .
Multifamily residential . . . . . . . . . . . . . . . . . .Nonfarm nonresidential . . . . . . . . . . . . . . . . .
In foreign offices . . . . . . . . . . . . . . . . . . . . . . . . . .Depository institutions . . . . . . . . . . . . . . . . . . . . . . .Foreign governments . . . . . . . . . . . . . . . . . . . . . . . .Agricultural production . . . . . . . . . . . . . . . . . . . . . .Other loans . . . . . . . . . . . . . . . . . . . . . . . . . . . . . . . . . .Lease-financing receivables . . . . . . . . . . . . . . . . . .Less: Unearned income on loans . . . . . . . . . . . . .Less: Loss reserves1 . . . . . . . . . . . . . . . . . . . . . . . . .
Securities . . . . . . . . . . . . . . . . . . . . . . . . . . . . . . . . . . . . . .Investment account . . . . . . . . . . . . . . . . . . . . . . . . . .
Debt . . . . . . . . . . . . . . . . . . . . . . . . . . . . . . . . . . . . . .U.S. Treasury . . . . . . . . . . . . . . . . . . . . . . . . . . .U.S. government agency and
corporation obligations . . . . . . . . . . . . .Government-backed mortgage pools . . .Collateralized mortgage obligations . . . .Other . . . . . . . . . . . . . . . . . . . . . . . . . . . . . . . .
State and local government . . . . . . . . . . . . . .Private mortgage-backed securities . . . . . . .Other . . . . . . . . . . . . . . . . . . . . . . . . . . . . . . . . . . .
Equity . . . . . . . . . . . . . . . . . . . . . . . . . . . . . . . . . . . .Trading account . . . . . . . . . . . . . . . . . . . . . . . . . . . . .
Gross federal funds sold and reverse RPs . . . . . . .Interest-bearing balances at depositories . . . . . . . . .
Non-interest-earning assets . . . . . . . . . . . . . . . . . . . . . . . .Revaluation gains on off-balance-sheet items 2 . . .Other . . . . . . . . . . . . . . . . . . . . . . . . . . . . . . . . . . . . . . . . . .
Liabilities . . . . . . . . . . . . . . . . . . . . . . . . . . . . . . . . . . . . . . . .Interest-bearing liabilities . . . . . . . . . . . . . . . . . . . . . . .
Deposits . . . . . . . . . . . . . . . . . . . . . . . . . . . . . . . . . . . .In foreign offices . . . . . . . . . . . . . . . . . . . . . . . . . .In domestic offices . . . . . . . . . . . . . . . . . . . . . . . .
Other checkable deposits . . . . . . . . . . . . . . . .Savings (including MMDAs) . . . . . . . . . . . .Small-denomination time deposits . . . . . . .Large-denomination time deposits . . . . . . .
Gross federal funds purchased and RPs . . . . . . .Other . . . . . . . . . . . . . . . . . . . . . . . . . . . . . . . . . . . . . . .
Non-interest-bearing liabilities . . . . . . . . . . . . . . . . . .Demand deposits in domestic offices . . . . . . . . . .Revaluation losses on off-balance-sheet items2 .Other . . . . . . . . . . . . . . . . . . . . . . . . . . . . . . . . . . . . . . .
Capital account . . . . . . . . . . . . . . . . . . . . . . . . . . . . . . . . . .
MemoCommercial real estate loans . . . . . . . . . . . . . . . . . . . . . .Other real estate owned . . . . . . . . . . . . . . . . . . . . . . . . . . .Managed liabilities . . . . . . . . . . . . . . . . . . . . . . . . . . . . . . .Average net consolidated assets
(billions of dollars) . . . . . . . . . . . . . . . . . . . . . . . . . .
88.04 88.33 88.50 86.60 86.47 86.80 86.58 86.26 86.54 86.6659.55 57.30 56.25 56.07 58.37 59.89 58.69 58.33 59.36 60.5117.33 15.78 14.88 14.51 15.20 15.60 15.78 16.37 17.09 17.2015.00 13.54 12.72 12.35 12.87 13.07 13.18 13.62 14.43 14.6782.33 2.24 2.16 2.16 2.33 2.53 2.60 2.75 2.66 2.5311.45 11.00 11.00 11.43 12.08 12.21 11.44 10.36 9.71 9.39
3.88 3.80 3.88 4.21 4.69 4.87 4.55 3.96 3.51 3.527.57 7.20 7.11 7.22 7.39 7.34 6.89 6.39 6.20 5.88
24.87 24.87 24.80 24.43 25.01 25.06 25.02 24.87 25.44 27.0424.11 24.18 24.18 23.80 24.36 24.43 24.41 24.30 24.87 26.49
3.41 2.64 1.99 1.65 1.59 1.63 1.73 1.86 2.18 2.51.53 .56 .57 .56 .56 .56 .55 .55 .56 .56
12.27 12.91 13.49 13.74 14.42 14.43 14.42 14.26 14.10 14.951.95 2.09 2.07 1.91 1.88 1.85 1.94 1.89 1.76 1.96
10.32 10.83 11.42 11.84 12.54 12.57 12.48 12.37 12.34 13.00.66 .75 .79 .79 .81 .85 .83 .82 .88 .99
7.23 7.32 7.33 7.07 6.97 6.96 6.88 6.81 7.15 7.48.76 .69 .62 .63 .65 .63 .61 .57 .57 .54
1.42 1.24 1.08 1.42 1.88 2.29 1.89 1.88 1.94 1.85.75 .73 .67 .41 .30 .26 .18 .15 .16 .12
1.01 1.02 .99 1.00 .96 .92 .90 .89 .83 .783.60 3.50 3.56 3.34 3.15 3.36 2.84 2.81 2.76 2.561.09 1.03 .99 1.03 1.19 1.51 1.87 2.14 2.53 2.65−.36 −.28 −.21 −.16 −.14 −.12 −.09 −.07 −.06 −.05
−1.62 −1.60 −1.51 −1.36 −1.26 −1.21 −1.13 −1.07 −1.04 −1.0220.70 23.52 25.37 24.32 21.94 21.01 20.41 20.38 20.40 20.0218.93 21.18 22.50 21.60 19.39 18.20 17.25 17.49 18.33 17.5918.62 20.82 22.12 21.21 18.98 17.75 16.75 16.94 17.73 16.93
5.06 6.49 7.08 6.77 5.25 4.20 3.38 2.71 2.14 1.66
8.75 9.86 10.73 10.24 9.81 9.75 9.74 10.28 10.85 10.314.51 4.52 4.74 4.67 4.47 4.80 4.94 5.17 5.24 4.752.07 3.12 3.72 3.24 2.67 2.11 1.94 2.13 2.15 1.922.16 2.21 2.27 2.33 2.68 2.83 2.86 2.99 3.46 3.632.28 2.08 2.06 2.02 1.80 1.68 1.59 1.57 1.62 1.52
.94 .82 .73 .64 .62 .61 .50 .67 .88 .951.59 1.58 1.52 1.54 1.49 1.51 1.54 1.71 2.24 2.48
.31 .37 .38 .39 .41 .45 .50 .55 .61 .661.77 2.34 2.87 2.71 2.55 2.81 3.16 2.90 2.06 2.434.58 4.54 4.27 3.82 3.93 3.82 5.18 5.37 4.61 4.123.21 2.97 2.62 2.40 2.23 2.08 2.29 2.17 2.17 2.01
11.96 11.67 11.50 13.40 13.53 13.20 13.42 13.74 13.46 13.34n.a. n.a. n.a. 2.95 2.90 2.25 2.59 2.95 2.57 2.29
11.96 11.67 11.50 10.45 10.62 10.95 10.83 10.79 10.89 11.05
93.33 92.82 92.15 92.12 91.99 91.73 91.57 91.51 91.51 91.5876.58 75.32 73.92 71.86 71.86 71.62 71.36 71.33 72.51 73.2864.45 62.94 60.26 57.34 56.30 55.87 55.01 54.66 54.79 54.66
8.55 8.37 8.32 9.39 10.28 10.01 10.02 10.15 10.46 10.9055.90 54.56 51.94 47.96 46.03 45.86 44.99 44.51 44.33 43.75
6.72 7.65 8.24 7.80 6.63 4.75 3.62 3.11 2.81 2.4618.00 20.28 20.91 19.60 17.48 18.71 19.13 19.91 21.00 20.6421.30 19.21 16.98 15.33 16.14 15.97 15.17 14.15 13.10 12.49
9.89 7.42 5.81 5.23 5.77 6.42 7.08 7.33 7.42 8.167.09 7.02 7.47 7.60 7.71 7.18 8.13 7.99 7.97 7.845.03 5.36 6.19 6.92 7.85 8.56 8.21 8.68 9.75 10.79
16.75 17.50 18.23 20.26 20.13 20.11 20.21 20.18 19.00 18.3012.59 13.24 13.86 13.49 12.68 12.82 12.16 11.00 9.78 8.62n.a. n.a. n.a. 2.69 2.88 2.14 2.64 2.97 2.52 2.294.16 4.27 4.37 4.55 4.57 5.14 5.41 6.21 6.70 7.39
6.67 7.18 7.85 7.88 8.01 8.27 8.43 8.49 8.49 8.42
12.02 11.34 10.63 9.94 9.83 9.92 9.99 10.12 10.87 11.58.75 .82 .63 .36 .19 .14 .11 .08 .06 .05
31.05 28.70 28.28 29.61 32.08 32.73 34.09 34.94 36.58 38.82
3,379 3,442 3,566 3,863 4,148 4,376 4,733 5,144 5,438 5,904
384 Federal Reserve Bulletin June 2001
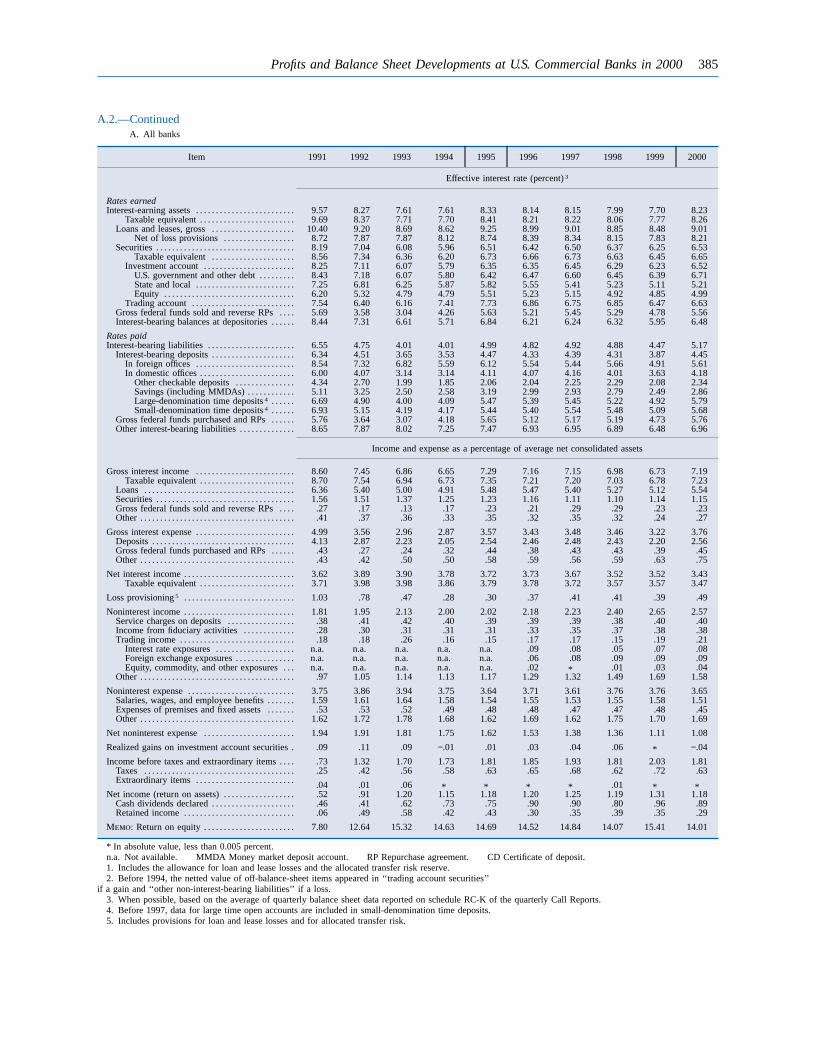
A.2.—ContinuedA. All banks
Item 1991 1992 1993 1994 1995 1996 1997 1998 1999 2000
Effective interest rate (percent) 3
Rates earnedInterest-earning assets . . . . . . . . . . . . . . . . . . . . . . . . .
Taxable equivalent . . . . . . . . . . . . . . . . . . . . . . . .Loans and leases, gross . . . . . . . . . . . . . . . . . . . . .
Net of loss provisions . . . . . . . . . . . . . . . . . .Securities . . . . . . . . . . . . . . . . . . . . . . . . . . . . . . . . . . .
Taxable equivalent . . . . . . . . . . . . . . . . . . . . .Investment account . . . . . . . . . . . . . . . . . . . . . . .
U.S. government and other debt . . . . . . . . .State and local . . . . . . . . . . . . . . . . . . . . . . . . .Equity . . . . . . . . . . . . . . . . . . . . . . . . . . . . . . . . .
Trading account . . . . . . . . . . . . . . . . . . . . . . . . . .Gross federal funds sold and reverse RPs . . . .Interest-bearing balances at depositories . . . . . .
Rates paidInterest-bearing liabilities . . . . . . . . . . . . . . . . . . . . . .
Interest-bearing deposits . . . . . . . . . . . . . . . . . . . . .In foreign offices . . . . . . . . . . . . . . . . . . . . . . . . .In domestic offices . . . . . . . . . . . . . . . . . . . . . . . .
Other checkable deposits . . . . . . . . . . . . . . .Savings (including MMDAs) . . . . . . . . . . . .Large-denomination time deposits 4 . . . . . .Small-denomination time deposits 4 . . . . . .
Gross federal funds purchased and RPs . . . . . .Other interest-bearing liabilities . . . . . . . . . . . . . .
Income and expense as a percentage of average net consolidated assets
Gross interest income . . . . . . . . . . . . . . . . . . . . . . . . .Taxable equivalent . . . . . . . . . . . . . . . . . . . . . . . .
Loans . . . . . . . . . . . . . . . . . . . . . . . . . . . . . . . . . . . . . .Securities . . . . . . . . . . . . . . . . . . . . . . . . . . . . . . . . . . .Gross federal funds sold and reverse RPs . . . .Other . . . . . . . . . . . . . . . . . . . . . . . . . . . . . . . . . . . . . . .
Gross interest expense . . . . . . . . . . . . . . . . . . . . . . . . .Deposits . . . . . . . . . . . . . . . . . . . . . . . . . . . . . . . . . . . .Gross federal funds purchased and RPs . . . . . .Other . . . . . . . . . . . . . . . . . . . . . . . . . . . . . . . . . . . . . . .
Net interest income . . . . . . . . . . . . . . . . . . . . . . . . . . . .Taxable equivalent . . . . . . . . . . . . . . . . . . . . . . . .
Loss provisioning 5 . . . . . . . . . . . . . . . . . . . . . . . . . . . .
Noninterest income . . . . . . . . . . . . . . . . . . . . . . . . . . . .Service charges on deposits . . . . . . . . . . . . . . . . .Income from fiduciary activities . . . . . . . . . . . . .Trading income . . . . . . . . . . . . . . . . . . . . . . . . . . . . .
Interest rate exposures . . . . . . . . . . . . . . . . . . . .Foreign exchange exposures . . . . . . . . . . . . . . .Equity, commodity, and other exposures . . .
Other . . . . . . . . . . . . . . . . . . . . . . . . . . . . . . . . . . . . . . .
Noninterest expense . . . . . . . . . . . . . . . . . . . . . . . . . . .Salaries, wages, and employee benefits . . . . . . .Expenses of premises and fixed assets . . . . . . .Other . . . . . . . . . . . . . . . . . . . . . . . . . . . . . . . . . . . . . . .
Net noninterest expense . . . . . . . . . . . . . . . . . . . . . . .
Realized gains on investment account securities .
Income before taxes and extraordinary items . . . .Taxes . . . . . . . . . . . . . . . . . . . . . . . . . . . . . . . . . . . . . .Extraordinary items . . . . . . . . . . . . . . . . . . . . . . . . .
Net income (return on assets) . . . . . . . . . . . . . . . . . .Cash dividends declared . . . . . . . . . . . . . . . . . . . . .Retained income . . . . . . . . . . . . . . . . . . . . . . . . . . . .
Memo: Return on equity . . . . . . . . . . . . . . . . . . . . . . .
* In absolute value, less than 0.005 percent.n.a. Not available. MMDA Money market deposit account. RP Repurchase agreement. CD Certificate of deposit.1. Includes the allowance for loan and lease losses and the allocated transfer risk reserve.2. Before 1994, the netted value of off-balance-sheet items appeared in ‘‘trading account securities’’
if a gain and ‘‘other non-interest-bearing liabilities’’ if a loss.3. When possible, based on the average of quarterly balance sheet data reported on schedule RC-K of the quarterly Call Reports.4. Before 1997, data for large time open accounts are included in small-denomination time deposits.5. Includes provisions for loan and lease losses and for allocated transfer risk.
9.57 8.27 7.61 7.61 8.33 8.14 8.15 7.99 7.70 8.239.69 8.37 7.71 7.70 8.41 8.21 8.22 8.06 7.77 8.26
10.40 9.20 8.69 8.62 9.25 8.99 9.01 8.85 8.48 9.018.72 7.87 7.87 8.12 8.74 8.39 8.34 8.15 7.83 8.218.19 7.04 6.08 5.96 6.51 6.42 6.50 6.37 6.25 6.538.56 7.34 6.36 6.20 6.73 6.66 6.73 6.63 6.45 6.658.25 7.11 6.07 5.79 6.35 6.35 6.45 6.29 6.23 6.528.43 7.18 6.07 5.80 6.42 6.47 6.60 6.45 6.39 6.717.25 6.81 6.25 5.87 5.82 5.55 5.41 5.23 5.11 5.216.20 5.32 4.79 4.79 5.51 5.23 5.15 4.92 4.85 4.997.54 6.40 6.16 7.41 7.73 6.86 6.75 6.85 6.47 6.635.69 3.58 3.04 4.26 5.63 5.21 5.45 5.29 4.78 5.568.44 7.31 6.61 5.71 6.84 6.21 6.24 6.32 5.95 6.48
6.55 4.75 4.01 4.01 4.99 4.82 4.92 4.88 4.47 5.176.34 4.51 3.65 3.53 4.47 4.33 4.39 4.31 3.87 4.458.54 7.32 6.82 5.59 6.12 5.54 5.44 5.66 4.91 5.616.00 4.07 3.14 3.14 4.11 4.07 4.16 4.01 3.63 4.184.34 2.70 1.99 1.85 2.06 2.04 2.25 2.29 2.08 2.345.11 3.25 2.50 2.58 3.19 2.99 2.93 2.79 2.49 2.866.69 4.90 4.00 4.09 5.47 5.39 5.45 5.22 4.92 5.796.93 5.15 4.19 4.17 5.44 5.40 5.54 5.48 5.09 5.685.76 3.64 3.07 4.18 5.65 5.12 5.17 5.19 4.73 5.768.65 7.87 8.02 7.25 7.47 6.93 6.95 6.89 6.48 6.96
8.60 7.45 6.86 6.65 7.29 7.16 7.15 6.98 6.73 7.198.70 7.54 6.94 6.73 7.35 7.21 7.20 7.03 6.78 7.236.36 5.40 5.00 4.91 5.48 5.47 5.40 5.27 5.12 5.541.56 1.51 1.37 1.25 1.23 1.16 1.11 1.10 1.14 1.15
.27 .17 .13 .17 .23 .21 .29 .29 .23 .23
.41 .37 .36 .33 .35 .32 .35 .32 .24 .27
4.99 3.56 2.96 2.87 3.57 3.43 3.48 3.46 3.22 3.764.13 2.87 2.23 2.05 2.54 2.46 2.48 2.43 2.20 2.56
.43 .27 .24 .32 .44 .38 .43 .43 .39 .45
.43 .42 .50 .50 .58 .59 .56 .59 .63 .75
3.62 3.89 3.90 3.78 3.72 3.73 3.67 3.52 3.52 3.433.71 3.98 3.98 3.86 3.79 3.78 3.72 3.57 3.57 3.47
1.03 .78 .47 .28 .30 .37 .41 .41 .39 .49
1.81 1.95 2.13 2.00 2.02 2.18 2.23 2.40 2.65 2.57.38 .41 .42 .40 .39 .39 .39 .38 .40 .40.28 .30 .31 .31 .31 .33 .35 .37 .38 .38.18 .18 .26 .16 .15 .17 .17 .15 .19 .21
n.a. n.a. n.a. n.a. n.a. .09 .08 .05 .07 .08n.a. n.a. n.a. n.a. n.a. .06 .08 .09 .09 .09n.a. n.a. n.a. n.a. n.a. .02 * .01 .03 .04
.97 1.05 1.14 1.13 1.17 1.29 1.32 1.49 1.69 1.58
3.75 3.86 3.94 3.75 3.64 3.71 3.61 3.76 3.76 3.651.59 1.61 1.64 1.58 1.54 1.55 1.53 1.55 1.58 1.51
.53 .53 .52 .49 .48 .48 .47 .47 .48 .451.62 1.72 1.78 1.68 1.62 1.69 1.62 1.75 1.70 1.69
1.94 1.91 1.81 1.75 1.62 1.53 1.38 1.36 1.11 1.08
.09 .11 .09 −.01 .01 .03 .04 .06 * −.04
.73 1.32 1.70 1.73 1.81 1.85 1.93 1.81 2.03 1.81
.25 .42 .56 .58 .63 .65 .68 .62 .72 .63
.04 .01 .06 * * * * .01 * *
.52 .91 1.20 1.15 1.18 1.20 1.25 1.19 1.31 1.18
.46 .41 .62 .73 .75 .90 .90 .80 .96 .89
.06 .49 .58 .42 .43 .30 .35 .39 .35 .29
7.80 12.64 15.32 14.63 14.69 14.52 14.84 14.07 15.41 14.01
Profits and Balance Sheet Developments at U.S. Commercial Banks in 2000 385

A.2. Portfolio composition, interest rates, and income and expense, all U.S. banks, 1991–2000B. Ten largest banks by assets
Item 1991 1992 1993 1994 1995 1996 1997 1998 1999 2000
Balance sheet items as a percentage of average net consolidated assets
Interest-earning assets . . . . . . . . . . . . . . . . . . . . . . . . . . . .Loans and leases, net . . . . . . . . . . . . . . . . . . . . . . . . . .
Commercial and industrial . . . . . . . . . . . . . . . . . . .U.S. addressees . . . . . . . . . . . . . . . . . . . . . . . . . . . .Foreign addressees . . . . . . . . . . . . . . . . . . . . . . . .
Consumer . . . . . . . . . . . . . . . . . . . . . . . . . . . . . . . . . . .Credit card . . . . . . . . . . . . . . . . . . . . . . . . . . . . . . . .Installment and other . . . . . . . . . . . . . . . . . . . . . .
Real estate . . . . . . . . . . . . . . . . . . . . . . . . . . . . . . . . . .In domestic offices . . . . . . . . . . . . . . . . . . . . . . . .
Construction and land development . . . . . .Farmland . . . . . . . . . . . . . . . . . . . . . . . . . . . . . . .One- to four-family residential . . . . . . . . . . .
Home equity . . . . . . . . . . . . . . . . . . . . . . . . .Other . . . . . . . . . . . . . . . . . . . . . . . . . . . . . . . .
Multifamily residential . . . . . . . . . . . . . . . . . .Nonfarm nonresidential . . . . . . . . . . . . . . . . .
In foreign offices . . . . . . . . . . . . . . . . . . . . . . . . . .Depository institutions . . . . . . . . . . . . . . . . . . . . . . .Foreign governments . . . . . . . . . . . . . . . . . . . . . . . .Agricultural production . . . . . . . . . . . . . . . . . . . . . .Other loans . . . . . . . . . . . . . . . . . . . . . . . . . . . . . . . . . .Lease-financing receivables . . . . . . . . . . . . . . . . . .Less: Unearned income on loans . . . . . . . . . . . . .Less: Loss reserves1 . . . . . . . . . . . . . . . . . . . . . . . . .
Securities . . . . . . . . . . . . . . . . . . . . . . . . . . . . . . . . . . . . . .Investment account . . . . . . . . . . . . . . . . . . . . . . . . . .
Debt . . . . . . . . . . . . . . . . . . . . . . . . . . . . . . . . . . . . . .U.S. Treasury . . . . . . . . . . . . . . . . . . . . . . . . . . .U.S. government agency and
corporation obligations . . . . . . . . . . . . .Government-backed mortgage pools . . .Collateralized mortgage obligations . . . .Other . . . . . . . . . . . . . . . . . . . . . . . . . . . . . . . .
State and local government . . . . . . . . . . . . . .Private mortgage-backed securities . . . . . . .Other . . . . . . . . . . . . . . . . . . . . . . . . . . . . . . . . . . .
Equity . . . . . . . . . . . . . . . . . . . . . . . . . . . . . . . . . . . .Trading account . . . . . . . . . . . . . . . . . . . . . . . . . . . . .
Gross federal funds sold and reverse RPs . . . . . . .Interest-bearing balances at depositories . . . . . . . . .
Non-interest-earning assets . . . . . . . . . . . . . . . . . . . . . . . .Revaluation gains on off-balance-sheet items 2 . . .Other . . . . . . . . . . . . . . . . . . . . . . . . . . . . . . . . . . . . . . . . . .
Liabilities . . . . . . . . . . . . . . . . . . . . . . . . . . . . . . . . . . . . . . . .Interest-bearing liabilities . . . . . . . . . . . . . . . . . . . . . . .
Deposits . . . . . . . . . . . . . . . . . . . . . . . . . . . . . . . . . . . .In foreign offices . . . . . . . . . . . . . . . . . . . . . . . . . .In domestic offices . . . . . . . . . . . . . . . . . . . . . . . .
Other checkable deposits . . . . . . . . . . . . . . . .Savings (including MMDAs) . . . . . . . . . . . .Small-denomination time deposits . . . . . . .Large-denomination time deposits . . . . . . .
Gross federal funds purchased and RPs . . . . . . .Other . . . . . . . . . . . . . . . . . . . . . . . . . . . . . . . . . . . . . . .
Non-interest-bearing liabilities . . . . . . . . . . . . . . . . . .Demand deposits in domestic offices . . . . . . . . . .Revaluation losses on off-balance-sheet items 2 .Other . . . . . . . . . . . . . . . . . . . . . . . . . . . . . . . . . . . . . . .
Capital account . . . . . . . . . . . . . . . . . . . . . . . . . . . . . . . . . .
MemoCommercial real estate loans . . . . . . . . . . . . . . . . . . . . . .Other real estate owned . . . . . . . . . . . . . . . . . . . . . . . . . . .Managed liabilities . . . . . . . . . . . . . . . . . . . . . . . . . . . . . . .Average net consolidated assets
(billions of dollars) . . . . . . . . . . . . . . . . . . . . . . . . . .
85.41 85.16 84.79 77.16 77.02 79.94 81.62 81.06 81.28 82.0262.14 58.34 55.57 49.91 50.05 53.51 50.91 50.76 53.37 55.2222.42 20.32 18.65 16.43 16.16 17.17 16.90 18.07 19.24 19.9513.44 12.00 10.75 9.16 8.66 9.59 10.24 11.76 13.14 13.94
8.97 8.32 7.90 7.27 7.50 7.59 6.66 6.31 6.10 6.017.20 7.31 7.33 6.59 6.60 6.22 6.40 6.04 5.94 5.452.53 2.61 2.50 2.28 1.96 1.23 1.34 1.30 1.36 1.344.67 4.70 4.83 4.31 4.65 4.99 5.06 4.74 4.58 4.11
21.68 19.93 18.54 16.21 15.82 16.53 17.42 16.51 16.96 19.8218.37 17.07 15.99 13.80 13.48 14.44 15.69 15.08 15.55 18.48
3.42 2.48 1.59 .84 .58 .51 .68 .77 .90 .98.08 .07 .07 .06 .06 .06 .09 .09 .10 .11
10.34 10.08 10.29 9.69 9.62 10.43 11.02 10.33 10.77 13.371.63 1.63 1.60 1.40 1.40 1.53 1.70 1.72 1.54 1.608.71 8.46 8.68 8.29 8.22 8.90 9.31 8.61 9.22 11.76
.57 .58 .53 .41 .38 .38 .39 .38 .43 .603.95 3.86 3.51 2.79 2.83 3.05 3.52 3.51 3.35 3.423.32 2.85 2.55 2.41 2.35 2.09 1.73 1.43 1.41 1.343.05 2.56 2.35 3.37 4.95 6.06 4.14 4.00 4.30 3.752.88 2.75 2.46 1.27 .90 .69 .45 .35 .38 .28
.31 .28 .27 .25 .21 .23 .31 .28 .26 .235.61 6.05 6.82 6.44 5.85 6.42 4.21 3.79 3.97 3.681.68 1.51 1.30 1.14 1.14 1.59 2.24 2.81 3.40 3.07−.35 −.27 −.21 −.16 −.14 −.11 −.07 −.06 −.05 −.04
−2.34 −2.08 −1.94 −1.63 −1.45 −1.30 −1.08 −1.01 −1.03 −.9715.58 19.13 22.74 20.61 19.53 19.83 20.00 19.72 18.34 18.98
9.38 10.70 12.45 11.68 10.65 10.60 10.97 12.12 13.08 13.719.08 10.36 12.08 11.30 10.27 10.22 10.55 11.64 12.57 13.031.35 2.30 2.39 2.17 2.03 1.93 1.56 1.70 1.98 1.96
3.46 4.45 6.14 5.16 4.46 4.59 5.34 6.31 6.35 6.592.26 2.43 3.30 2.79 2.89 3.58 4.26 5.13 5.03 4.881.12 1.97 2.76 2.31 1.50 .95 .93 .93 .79 .93
.08 .05 .08 .06 .08 .06 .15 .26 .52 .78
.77 .66 .59 .60 .49 .39 .51 .47 .45 .51
.48 .33 .38 .43 .32 .30 .32 .60 .57 .513.01 2.62 2.59 2.94 2.97 3.01 2.81 2.57 3.22 3.47
.30 .33 .36 .38 .38 .38 .42 .47 .51 .686.19 8.43 10.30 8.93 8.88 9.23 9.03 7.60 5.25 5.262.96 3.23 2.71 2.68 3.20 3.10 7.56 7.81 6.64 5.024.74 4.45 3.76 3.95 4.25 3.50 3.15 2.77 2.94 2.80
14.59 14.84 15.21 22.84 22.98 20.06 18.38 18.94 18.72 17.98n.a. n.a. n.a. 11.23 10.77 7.63 7.36 7.62 6.66 5.66
14.59 14.84 15.21 11.61 12.21 12.43 11.02 11.33 12.05 12.32
94.97 94.44 93.24 93.42 93.59 93.04 92.61 92.58 92.28 92.3674.62 73.08 71.56 64.33 63.37 64.45 65.83 65.81 66.87 67.8157.67 55.73 52.91 48.20 47.49 47.87 47.36 47.65 48.79 49.2728.47 27.16 25.51 26.10 28.36 26.41 22.18 20.17 21.04 21.6229.19 28.56 27.41 22.10 19.12 21.46 25.18 27.48 27.76 27.66
3.00 3.38 3.45 2.91 2.30 1.61 1.21 .99 .72 .7413.50 14.91 15.33 12.70 10.56 12.31 14.26 15.83 16.84 16.73
6.55 5.72 5.09 3.98 4.04 4.68 5.82 6.03 5.66 5.386.14 4.56 3.53 2.51 2.23 2.86 3.89 4.62 4.54 4.806.80 6.19 6.70 5.83 6.17 5.88 10.26 9.78 8.84 8.89
10.15 11.16 11.94 10.29 9.71 10.69 8.20 8.37 9.24 9.6520.35 21.36 21.68 29.09 30.22 28.59 26.78 26.77 25.41 24.5610.36 11.05 11.27 10.15 8.88 9.73 8.98 8.46 7.83 7.28n.a. n.a. n.a. 10.22 10.68 7.27 7.53 7.67 6.51 5.699.99 10.30 10.41 10.51 10.66 11.59 10.27 10.65 11.06 11.59
5.03 5.56 6.76 6.58 6.41 6.96 7.39 7.42 7.72 7.64
9.05 8.01 6.46 4.65 4.40 4.65 5.45 5.61 5.69 5.87.78 1.13 1.02 .58 .27 .18 .13 .09 .06 .04
53.23 50.82 49.23 46.21 47.94 47.39 46.02 44.42 45.49 46.84
717 775 818 949 1,051 1,189 1,514 1,820 1,935 2,234
386 Federal Reserve Bulletin June 2001

A.2.—ContinuedB. Ten largest banks by assets
Item 1991 1992 1993 1994 1995 1996 1997 1998 1999 2000
Effective interest rate (percent) 3
Rates earnedInterest-earning assets . . . . . . . . . . . . . . . . . . . . . . . . .
Taxable equivalent . . . . . . . . . . . . . . . . . . . . . . . .Loans and leases, gross . . . . . . . . . . . . . . . . . . . . .
Net of loss provisions . . . . . . . . . . . . . . . . . .Securities . . . . . . . . . . . . . . . . . . . . . . . . . . . . . . . . . . .
Taxable equivalent . . . . . . . . . . . . . . . . . . . . .Investment account . . . . . . . . . . . . . . . . . . . . . . .
U.S. government and other debt . . . . . . . . .State and local . . . . . . . . . . . . . . . . . . . . . . . . .Equity . . . . . . . . . . . . . . . . . . . . . . . . . . . . . . . . .
Trading account . . . . . . . . . . . . . . . . . . . . . . . . . .Gross federal funds sold and reverse RPs . . . .Interest-bearing balances at depositories . . . . . .
Rates paidInterest-bearing liabilities . . . . . . . . . . . . . . . . . . . . . .
Interest-bearing deposits . . . . . . . . . . . . . . . . . . . . .In foreign offices . . . . . . . . . . . . . . . . . . . . . . . . .In domestic offices . . . . . . . . . . . . . . . . . . . . . . . .
Other checkable deposits . . . . . . . . . . . . . . .Savings (including MMDAs) . . . . . . . . . . . .Large-denomination time deposits 4 . . . . . .Small-denomination time deposits 4 . . . . . .
Gross federal funds purchased and RPs . . . . . .Other interest-bearing liabilities . . . . . . . . . . . . . .
Income and expense as a percentage of average net consolidated assets
Gross interest income . . . . . . . . . . . . . . . . . . . . . . . . .Taxable equivalent . . . . . . . . . . . . . . . . . . . . . . . .
Loans . . . . . . . . . . . . . . . . . . . . . . . . . . . . . . . . . . . . . .Securities . . . . . . . . . . . . . . . . . . . . . . . . . . . . . . . . . . .Gross federal funds sold and reverse RPs . . . .Other . . . . . . . . . . . . . . . . . . . . . . . . . . . . . . . . . . . . . . .
Gross interest expense . . . . . . . . . . . . . . . . . . . . . . . . .Deposits . . . . . . . . . . . . . . . . . . . . . . . . . . . . . . . . . . . .Gross federal funds purchased and RPs . . . . . .Other . . . . . . . . . . . . . . . . . . . . . . . . . . . . . . . . . . . . . . .
Net interest income . . . . . . . . . . . . . . . . . . . . . . . . . . . .Taxable equivalent . . . . . . . . . . . . . . . . . . . . . . . .
Loss provisioning 5 . . . . . . . . . . . . . . . . . . . . . . . . . . . .
Noninterest income . . . . . . . . . . . . . . . . . . . . . . . . . . . .Service charges on deposits . . . . . . . . . . . . . . . . .Income from fiduciary activities . . . . . . . . . . . . .Trading income . . . . . . . . . . . . . . . . . . . . . . . . . . . . .
Interest rate exposures . . . . . . . . . . . . . . . . . . . .Foreign exchange exposures . . . . . . . . . . . . . . .Equity, commodity, and other exposures . . . .
Other . . . . . . . . . . . . . . . . . . . . . . . . . . . . . . . . . . . . . . .
Noninterest expense . . . . . . . . . . . . . . . . . . . . . . . . . . .Salaries, wages, and employee benefits . . . . . . .Expenses of premises and fixed assets . . . . . . .Other . . . . . . . . . . . . . . . . . . . . . . . . . . . . . . . . . . . . . . .
Net noninterest expense . . . . . . . . . . . . . . . . . . . . . . .
Realized gains on investment account securities .
Income before taxes and extraordinary items . . . .Taxes . . . . . . . . . . . . . . . . . . . . . . . . . . . . . . . . . . . . . .Extraordinary items . . . . . . . . . . . . . . . . . . . . . . . . .
Net income (return on assets) . . . . . . . . . . . . . . . . . .Cash dividends declared . . . . . . . . . . . . . . . . . . . . .Retained income . . . . . . . . . . . . . . . . . . . . . . . . . . . .
Memo: Return on equity . . . . . . . . . . . . . . . . . . . . . . .
* In absolute value, less than 0.005 percent.n.a. Not available. MMDA Money market deposit account. RP Repurchase agreement. CD Certificate of deposit.1. Includes the allowance for loan and lease losses and the allocated transfer risk reserve.2. Before 1994, the netted value of off-balance-sheet items appeared in ‘‘trading account securities’’
if a gain and ‘‘other non-interest-bearing liabilities’’ if a loss.3. When possible, based on the average of quarterly balance sheet data reported on schedule RC-K of the quarterly Call Reports.4. Before 1997, data for large time open accounts are included in small-denomination time deposits.5. Includes provisions for loan and lease losses and for allocated transfer risk.
9.92 8.67 8.16 8.15 8.20 7.72 7.55 7.54 7.35 7.779.95 8.72 8.20 8.18 8.22 7.74 7.60 7.57 7.39 7.78
10.46 9.36 9.07 8.89 8.84 8.32 8.25 8.21 7.99 8.468.58 7.51 7.95 8.38 8.62 8.11 7.93 7.62 7.50 7.848.52 7.38 6.69 7.09 7.41 6.80 6.70 6.79 6.52 6.528.63 7.54 6.77 7.19 7.47 6.85 6.85 6.89 6.65 6.558.99 7.96 6.90 6.57 7.06 6.71 6.61 6.71 6.50 6.459.29 8.13 6.99 6.70 7.22 6.86 6.80 6.92 6.68 6.707.67 7.40 6.99 6.35 6.23 5.73 5.55 5.50 5.65 5.694.22 4.04 3.72 3.27 4.03 3.84 3.47 2.98 2.93 2.557.84 6.69 6.45 7.79 7.83 6.90 6.81 6.92 6.56 6.705.60 3.65 3.02 4.52 5.20 4.92 5.45 5.20 4.52 4.93
10.05 9.29 8.34 7.27 7.15 6.71 6.91 7.16 7.22 7.43
7.71 6.17 5.60 5.43 5.88 5.44 5.41 5.29 4.79 5.377.09 5.33 4.50 4.32 4.99 4.57 4.54 4.40 3.82 4.408.76 7.55 6.87 6.04 6.07 5.62 5.52 5.83 4.99 5.675.47 3.25 2.36 2.35 3.42 3.32 3.69 3.39 3.04 3.513.93 1.97 1.28 1.10 1.29 1.32 1.97 1.67 1.44 1.615.09 2.95 2.14 2.35 3.11 2.76 2.68 2.45 2.11 2.436.50 4.66 3.55 3.12 3.73 4.62 5.17 4.53 4.36 5.356.09 3.81 3.01 2.80 5.08 4.58 5.45 5.21 4.95 5.505.98 4.04 3.26 4.05 5.22 4.93 5.02 5.18 4.53 5.47
11.20 10.40 11.16 10.87 9.80 8.86 9.13 8.85 8.61 8.15
8.77 7.69 7.22 6.37 6.42 6.26 6.31 6.21 6.01 6.398.80 7.72 7.25 6.40 6.43 6.27 6.33 6.22 6.03 6.416.77 5.65 5.22 4.49 4.44 4.48 4.31 4.27 4.35 4.74
.84 .85 .86 .77 .75 .71 .73 .81 .85 .88
.17 .14 .11 .15 .21 .18 .45 .42 .30 .25
.98 1.05 1.04 .97 1.00 .88 .82 .70 .51 .51
5.81 4.54 4.06 3.52 3.74 3.52 3.55 3.48 3.16 3.604.23 3.09 2.48 2.15 2.43 2.26 2.26 2.20 1.97 2.33
.43 .28 .24 .24 .35 .31 .54 .54 .40 .491.15 1.17 1.35 1.13 .95 .95 .75 .74 .79 .78
2.96 3.15 3.16 2.86 2.68 2.73 2.76 2.73 2.84 2.782.99 3.18 3.19 2.88 2.70 2.75 2.79 2.75 2.86 2.80
1.21 1.12 .64 .26 .11 .11 .16 .31 .26 .35
2.40 2.59 2.99 2.33 2.16 2.34 2.12 2.15 2.55 2.51.26 .30 .30 .26 .25 .28 .32 .33 .37 .40.33 .37 .39 .36 .30 .31 .34 .32 .31 .27.64 .66 .91 .53 .46 .52 .43 .33 .46 .48
n.a. n.a. n.a. n.a. n.a. .30 .23 .10 .17 .20n.a. n.a. n.a. n.a. n.a. .17 .20 .20 .19 .18n.a. n.a. n.a. n.a. n.a. .05 * .03 .09 .111.16 1.27 1.38 1.18 1.15 1.23 1.04 1.17 1.41 1.36
3.83 3.86 4.13 3.56 3.32 3.57 3.24 3.47 3.45 3.301.79 1.78 1.88 1.65 1.58 1.57 1.45 1.45 1.57 1.46
.66 .65 .66 .55 .50 .50 .47 .47 .50 .473.38 1.43 1.59 1.36 1.24 1.50 1.33 1.54 1.38 1.38
1.44 1.27 1.14 1.23 1.16 1.23 1.12 1.32 .90 .79
.04 .11 .13 .02 .03 .04 .08 .11 .03 −.03
.34 .87 1.50 1.39 1.44 1.44 1.56 1.22 1.71 1.60
.17 .26 .53 .48 .55 .52 .58 .44 .66 .60
.03 * .16 * * * * * * *
.21 .61 1.13 .91 .88 .92 .98 .78 1.05 1.00
.21 .18 .28 .58 .57 .70 .82 .53 .79 .86* .43 .85 .33 .31 .21 .15 .25 .26 .14
4.23 10.91 16.75 13.86 13.78 13.21 13.22 10.53 13.58 13.07
Profits and Balance Sheet Developments at U.S. Commercial Banks in 2000 387
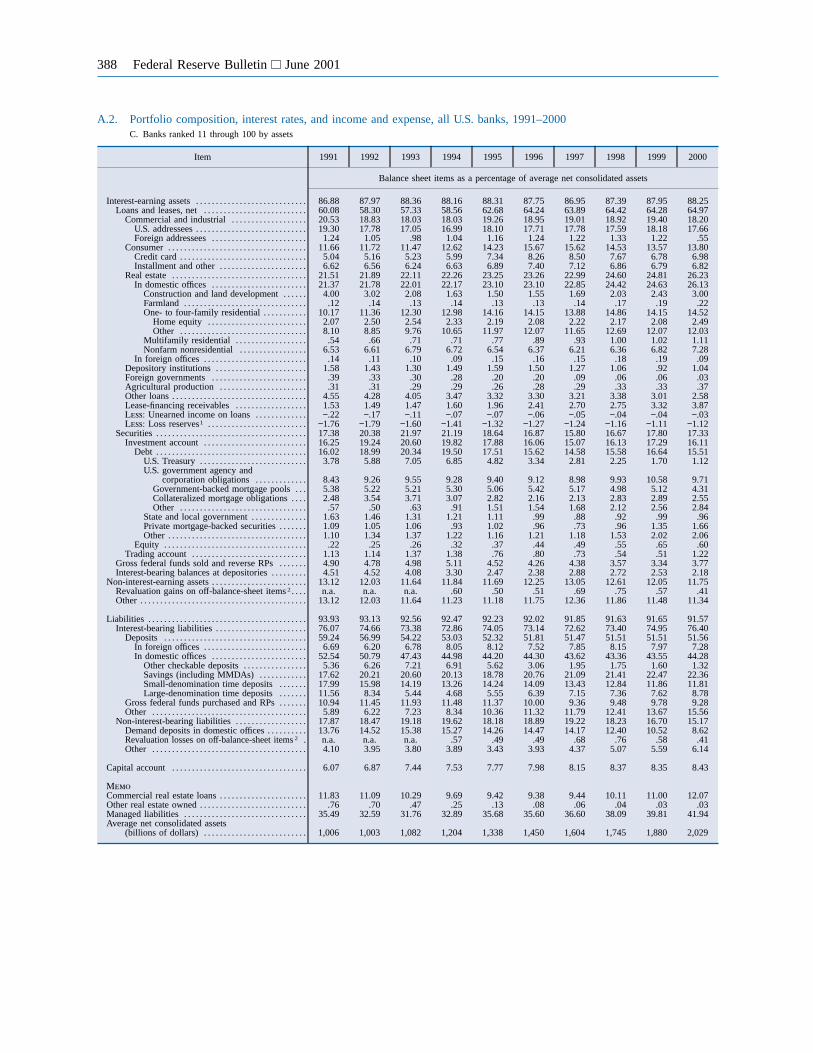
A.2. Portfolio composition, interest rates, and income and expense, all U.S. banks, 1991–2000C. Banks ranked 11 through 100 by assets
Item 1991 1992 1993 1994 1995 1996 1997 1998 1999 2000
Balance sheet items as a percentage of average net consolidated assets
Interest-earning assets . . . . . . . . . . . . . . . . . . . . . . . . . . . .Loans and leases, net . . . . . . . . . . . . . . . . . . . . . . . . . .
Commercial and industrial . . . . . . . . . . . . . . . . . . .U.S. addressees . . . . . . . . . . . . . . . . . . . . . . . . . . . .Foreign addressees . . . . . . . . . . . . . . . . . . . . . . . .
Consumer . . . . . . . . . . . . . . . . . . . . . . . . . . . . . . . . . . .Credit card . . . . . . . . . . . . . . . . . . . . . . . . . . . . . . . .Installment and other . . . . . . . . . . . . . . . . . . . . . .
Real estate . . . . . . . . . . . . . . . . . . . . . . . . . . . . . . . . . .In domestic offices . . . . . . . . . . . . . . . . . . . . . . . .
Construction and land development . . . . . .Farmland . . . . . . . . . . . . . . . . . . . . . . . . . . . . . . .One- to four-family residential . . . . . . . . . . .
Home equity . . . . . . . . . . . . . . . . . . . . . . . . .Other . . . . . . . . . . . . . . . . . . . . . . . . . . . . . . . .
Multifamily residential . . . . . . . . . . . . . . . . . .Nonfarm nonresidential . . . . . . . . . . . . . . . . .
In foreign offices . . . . . . . . . . . . . . . . . . . . . . . . . .Depository institutions . . . . . . . . . . . . . . . . . . . . . . .Foreign governments . . . . . . . . . . . . . . . . . . . . . . . .Agricultural production . . . . . . . . . . . . . . . . . . . . . .Other loans . . . . . . . . . . . . . . . . . . . . . . . . . . . . . . . . . .Lease-financing receivables . . . . . . . . . . . . . . . . . .Less: Unearned income on loans . . . . . . . . . . . . .Less: Loss reserves1 . . . . . . . . . . . . . . . . . . . . . . . . .
Securities . . . . . . . . . . . . . . . . . . . . . . . . . . . . . . . . . . . . . .Investment account . . . . . . . . . . . . . . . . . . . . . . . . . .
Debt . . . . . . . . . . . . . . . . . . . . . . . . . . . . . . . . . . . . . .U.S. Treasury . . . . . . . . . . . . . . . . . . . . . . . . . . .U.S. government agency and
corporation obligations . . . . . . . . . . . . .Government-backed mortgage pools . . .Collateralized mortgage obligations . . . .Other . . . . . . . . . . . . . . . . . . . . . . . . . . . . . . . .
State and local government . . . . . . . . . . . . . .Private mortgage-backed securities . . . . . . .Other . . . . . . . . . . . . . . . . . . . . . . . . . . . . . . . . . . .
Equity . . . . . . . . . . . . . . . . . . . . . . . . . . . . . . . . . . . .Trading account . . . . . . . . . . . . . . . . . . . . . . . . . . . . .
Gross federal funds sold and reverse RPs . . . . . . .Interest-bearing balances at depositories . . . . . . . . .
Non-interest-earning assets . . . . . . . . . . . . . . . . . . . . . . . .Revaluation gains on off-balance-sheet items 2 . . . .Other . . . . . . . . . . . . . . . . . . . . . . . . . . . . . . . . . . . . . . . . . .
Liabilities . . . . . . . . . . . . . . . . . . . . . . . . . . . . . . . . . . . . . . . .Interest-bearing liabilities . . . . . . . . . . . . . . . . . . . . . . .
Deposits . . . . . . . . . . . . . . . . . . . . . . . . . . . . . . . . . . . .In foreign offices . . . . . . . . . . . . . . . . . . . . . . . . . .In domestic offices . . . . . . . . . . . . . . . . . . . . . . . .
Other checkable deposits . . . . . . . . . . . . . . . .Savings (including MMDAs) . . . . . . . . . . . .Small-denomination time deposits . . . . . . .Large-denomination time deposits . . . . . . .
Gross federal funds purchased and RPs . . . . . . .Other . . . . . . . . . . . . . . . . . . . . . . . . . . . . . . . . . . . . . . .
Non-interest-bearing liabilities . . . . . . . . . . . . . . . . . .Demand deposits in domestic offices . . . . . . . . . .Revaluation losses on off-balance-sheet items 2 .Other . . . . . . . . . . . . . . . . . . . . . . . . . . . . . . . . . . . . . . .
Capital account . . . . . . . . . . . . . . . . . . . . . . . . . . . . . . . . . .
MemoCommercial real estate loans . . . . . . . . . . . . . . . . . . . . . .Other real estate owned . . . . . . . . . . . . . . . . . . . . . . . . . . .Managed liabilities . . . . . . . . . . . . . . . . . . . . . . . . . . . . . . .Average net consolidated assets
(billions of dollars) . . . . . . . . . . . . . . . . . . . . . . . . . .
86.88 87.97 88.36 88.16 88.31 87.75 86.95 87.39 87.95 88.2560.08 58.30 57.33 58.56 62.68 64.24 63.89 64.42 64.28 64.9720.53 18.83 18.03 18.03 19.26 18.95 19.01 18.92 19.40 18.2019.30 17.78 17.05 16.99 18.10 17.71 17.78 17.59 18.18 17.66
1.24 1.05 .98 1.04 1.16 1.24 1.22 1.33 1.22 .5511.66 11.72 11.47 12.62 14.23 15.67 15.62 14.53 13.57 13.80
5.04 5.16 5.23 5.99 7.34 8.26 8.50 7.67 6.78 6.986.62 6.56 6.24 6.63 6.89 7.40 7.12 6.86 6.79 6.82
21.51 21.89 22.11 22.26 23.25 23.26 22.99 24.60 24.81 26.2321.37 21.78 22.01 22.17 23.10 23.10 22.85 24.42 24.63 26.13
4.00 3.02 2.08 1.63 1.50 1.55 1.69 2.03 2.43 3.00.12 .14 .13 .14 .13 .13 .14 .17 .19 .22
10.17 11.36 12.30 12.98 14.16 14.15 13.88 14.86 14.15 14.522.07 2.50 2.54 2.33 2.19 2.08 2.22 2.17 2.08 2.498.10 8.85 9.76 10.65 11.97 12.07 11.65 12.69 12.07 12.03
.54 .66 .71 .71 .77 .89 .93 1.00 1.02 1.116.53 6.61 6.79 6.72 6.54 6.37 6.21 6.36 6.82 7.28
.14 .11 .10 .09 .15 .16 .15 .18 .19 .091.58 1.43 1.30 1.49 1.59 1.50 1.27 1.06 .92 1.04
.39 .33 .30 .28 .20 .20 .09 .06 .06 .03
.31 .31 .29 .29 .26 .28 .29 .33 .33 .374.55 4.28 4.05 3.47 3.32 3.30 3.21 3.38 3.01 2.581.53 1.49 1.47 1.60 1.96 2.41 2.70 2.75 3.32 3.87−.22 −.17 −.11 −.07 −.07 −.06 −.05 −.04 −.04 −.03
−1.76 −1.79 −1.60 −1.41 −1.32 −1.27 −1.24 −1.16 −1.11 −1.1217.38 20.38 21.97 21.19 18.64 16.87 15.80 16.67 17.80 17.3316.25 19.24 20.60 19.82 17.88 16.06 15.07 16.13 17.29 16.1116.02 18.99 20.34 19.50 17.51 15.62 14.58 15.58 16.64 15.51
3.78 5.88 7.05 6.85 4.82 3.34 2.81 2.25 1.70 1.12
8.43 9.26 9.55 9.28 9.40 9.12 8.98 9.93 10.58 9.715.38 5.22 5.21 5.30 5.06 5.42 5.17 4.98 5.12 4.312.48 3.54 3.71 3.07 2.82 2.16 2.13 2.83 2.89 2.55
.57 .50 .63 .91 1.51 1.54 1.68 2.12 2.56 2.841.63 1.46 1.31 1.21 1.11 .99 .88 .92 .99 .961.09 1.05 1.06 .93 1.02 .96 .73 .96 1.35 1.661.10 1.34 1.37 1.22 1.16 1.21 1.18 1.53 2.02 2.06
.22 .25 .26 .32 .37 .44 .49 .55 .65 .601.13 1.14 1.37 1.38 .76 .80 .73 .54 .51 1.224.90 4.78 4.98 5.11 4.52 4.26 4.38 3.57 3.34 3.774.51 4.52 4.08 3.30 2.47 2.38 2.88 2.72 2.53 2.18
13.12 12.03 11.64 11.84 11.69 12.25 13.05 12.61 12.05 11.75n.a. n.a. n.a. .60 .50 .51 .69 .75 .57 .41
13.12 12.03 11.64 11.23 11.18 11.75 12.36 11.86 11.48 11.34
93.93 93.13 92.56 92.47 92.23 92.02 91.85 91.63 91.65 91.5776.07 74.66 73.38 72.86 74.05 73.14 72.62 73.40 74.95 76.4059.24 56.99 54.22 53.03 52.32 51.81 51.47 51.51 51.51 51.56
6.69 6.20 6.78 8.05 8.12 7.52 7.85 8.15 7.97 7.2852.54 50.79 47.43 44.98 44.20 44.30 43.62 43.36 43.55 44.28
5.36 6.26 7.21 6.91 5.62 3.06 1.95 1.75 1.60 1.3217.62 20.21 20.60 20.13 18.78 20.76 21.09 21.41 22.47 22.3617.99 15.98 14.19 13.26 14.24 14.09 13.43 12.84 11.86 11.8111.56 8.34 5.44 4.68 5.55 6.39 7.15 7.36 7.62 8.7810.94 11.45 11.93 11.48 11.37 10.00 9.36 9.48 9.78 9.28
5.89 6.22 7.23 8.34 10.36 11.32 11.79 12.41 13.67 15.5617.87 18.47 19.18 19.62 18.18 18.89 19.22 18.23 16.70 15.1713.76 14.52 15.38 15.27 14.26 14.47 14.17 12.40 10.52 8.62n.a. n.a. n.a. .57 .49 .49 .68 .76 .58 .414.10 3.95 3.80 3.89 3.43 3.93 4.37 5.07 5.59 6.14
6.07 6.87 7.44 7.53 7.77 7.98 8.15 8.37 8.35 8.43
11.83 11.09 10.29 9.69 9.42 9.38 9.44 10.11 11.00 12.07.76 .70 .47 .25 .13 .08 .06 .04 .03 .03
35.49 32.59 31.76 32.89 35.68 35.60 36.60 38.09 39.81 41.94
1,006 1,003 1,082 1,204 1,338 1,450 1,604 1,745 1,880 2,029
388 Federal Reserve Bulletin June 2001

A.2.—ContinuedC. Banks ranked 11 through 100 by assets
Item 1991 1992 1993 1994 1995 1996 1997 1998 1999 2000
Effective interest rate (percent) 3
Rates earnedInterest-earning assets . . . . . . . . . . . . . . . . . . . . . . . . .
Taxable equivalent . . . . . . . . . . . . . . . . . . . . . . . .Loans and leases, gross . . . . . . . . . . . . . . . . . . . . .
Net of loss provisions . . . . . . . . . . . . . . . . . .Securities . . . . . . . . . . . . . . . . . . . . . . . . . . . . . . . . . . .
Taxable equivalent . . . . . . . . . . . . . . . . . . . . .Investment account . . . . . . . . . . . . . . . . . . . . . . .
U.S. government and other debt . . . . . . . . .State and local . . . . . . . . . . . . . . . . . . . . . . . . .Equity . . . . . . . . . . . . . . . . . . . . . . . . . . . . . . . . .
Trading account . . . . . . . . . . . . . . . . . . . . . . . . . .Gross federal funds sold and reverse RPs . . . .Interest-bearing balances at depositories . . . . . .
Rates paidInterest-bearing liabilities . . . . . . . . . . . . . . . . . . . . . .
Interest-bearing deposits . . . . . . . . . . . . . . . . . . . . .In foreign offices . . . . . . . . . . . . . . . . . . . . . . . . .In domestic offices . . . . . . . . . . . . . . . . . . . . . . . .
Other checkable deposits . . . . . . . . . . . . . . .Savings (including MMDAs) . . . . . . . . . . . .Large-denomination time deposits 4 . . . . . .Small-denomination time deposits 4 . . . . . .
Gross federal funds purchased and RPs . . . . . .Other interest-bearing liabilities . . . . . . . . . . . . . .
Income and expense as a percentage of average net consolidated assets
Gross interest income . . . . . . . . . . . . . . . . . . . . . . . . .Taxable equivalent . . . . . . . . . . . . . . . . . . . . . . . .
Loans . . . . . . . . . . . . . . . . . . . . . . . . . . . . . . . . . . . . . .Securities . . . . . . . . . . . . . . . . . . . . . . . . . . . . . . . . . . .Gross federal funds sold and reverse RPs . . . .Other . . . . . . . . . . . . . . . . . . . . . . . . . . . . . . . . . . . . . . .
Gross interest expense . . . . . . . . . . . . . . . . . . . . . . . . .Deposits . . . . . . . . . . . . . . . . . . . . . . . . . . . . . . . . . . . .Gross federal funds purchased and RPs . . . . . .Other . . . . . . . . . . . . . . . . . . . . . . . . . . . . . . . . . . . . . . .
Net interest income . . . . . . . . . . . . . . . . . . . . . . . . . . . .Taxable equivalent . . . . . . . . . . . . . . . . . . . . . . . .
Loss provisioning 5 . . . . . . . . . . . . . . . . . . . . . . . . . . . .
Noninterest income . . . . . . . . . . . . . . . . . . . . . . . . . . . .Service charges on deposits . . . . . . . . . . . . . . . . .Income from fiduciary activities . . . . . . . . . . . . .Trading income . . . . . . . . . . . . . . . . . . . . . . . . . . . . .
Interest rate exposures . . . . . . . . . . . . . . . . . . . .Foreign exchange exposures . . . . . . . . . . . . . . .Equity, commodity, and other exposures . . . .
Other . . . . . . . . . . . . . . . . . . . . . . . . . . . . . . . . . . . . . . .
Noninterest expense . . . . . . . . . . . . . . . . . . . . . . . . . . .Salaries, wages, and employee benefits . . . . . . .Expenses of premises and fixed assets . . . . . . .Other . . . . . . . . . . . . . . . . . . . . . . . . . . . . . . . . . . . . . . .
Net noninterest expense . . . . . . . . . . . . . . . . . . . . . . .
Realized gains on investment account securities .
Income before taxes and extraordinary items . . . .Taxes . . . . . . . . . . . . . . . . . . . . . . . . . . . . . . . . . . . . . .Extraordinary items . . . . . . . . . . . . . . . . . . . . . . . . .
Net income (return on assets) . . . . . . . . . . . . . . . . . .Cash dividends declared . . . . . . . . . . . . . . . . . . . . .Retained income . . . . . . . . . . . . . . . . . . . . . . . . . . . .
Memo: Return on equity . . . . . . . . . . . . . . . . . . . . . . .
* In absolute value, less than 0.005 percent.n.a. Not available. MMDA Money market deposit account. RP Repurchase agreement. CD Certificate of deposit.1. Includes the allowance for loan and lease losses and the allocated transfer risk reserve.2. Before 1994, the netted value of off-balance-sheet items appeared in ‘‘trading account securities’’
if a gain and ‘‘other non-interest-bearing liabilities’’ if a loss.3. When possible, based on the average of quarterly balance sheet data reported on schedule RC-K of the quarterly Call Reports.4. Before 1997, data for large time open accounts are included in small-denomination time deposits.5. Includes provisions for loan and lease losses and for allocated transfer risk.
9.30 7.97 7.35 7.29 8.31 8.16 8.31 8.10 7.84 8.479.39 8.07 7.45 7.37 8.37 8.23 8.36 8.17 7.88 8.499.96 8.75 8.25 8.22 9.10 8.87 9.03 8.82 8.50 9.157.98 7.45 7.46 7.68 8.49 8.05 8.11 8.01 7.68 8.138.23 7.00 6.05 5.70 6.38 6.42 6.50 6.21 6.34 6.718.57 7.30 6.32 5.92 6.56 6.66 6.70 6.46 6.46 6.778.37 7.12 6.14 5.70 6.34 6.41 6.52 6.22 6.36 6.748.51 7.16 6.14 5.69 6.38 6.50 6.63 6.31 6.47 6.867.23 6.80 6.30 6.04 6.05 5.84 5.58 5.36 5.21 5.257.36 6.71 5.20 5.00 5.68 4.84 5.07 5.26 5.33 6.366.46 4.73 4.74 5.75 7.27 6.53 6.05 5.86 5.58 6.255.80 3.70 3.11 4.31 5.91 5.31 5.45 5.46 5.12 6.048.15 6.76 6.50 4.69 6.78 5.82 5.77 5.67 4.81 5.49
6.41 4.43 3.76 3.72 4.94 4.70 4.79 4.76 4.38 5.226.27 4.30 3.51 3.25 4.35 4.15 4.22 4.15 3.76 4.428.39 7.26 7.37 4.60 6.30 5.29 5.23 5.22 4.70 5.386.01 3.96 2.98 3.03 4.01 3.96 4.04 3.96 3.60 4.264.21 2.43 1.70 1.62 1.89 1.78 2.01 2.41 2.03 2.575.04 3.07 2.33 2.46 3.10 2.91 2.84 2.76 2.49 2.946.77 5.10 4.30 4.21 5.70 5.50 5.47 5.32 4.96 5.886.96 5.07 4.06 4.18 5.35 5.26 5.43 5.35 5.03 5.735.75 3.57 3.04 4.28 5.86 5.19 5.29 5.22 4.87 6.026.55 5.77 5.97 5.24 6.43 5.95 5.85 5.81 5.41 6.36
8.24 7.12 6.58 6.46 7.40 7.24 7.26 7.16 6.99 7.568.31 7.19 6.64 6.51 7.45 7.28 7.30 7.20 7.02 7.596.15 5.23 4.84 4.91 5.79 5.80 5.87 5.79 5.57 6.071.36 1.37 1.26 1.13 1.13 1.03 .98 1.00 1.10 1.09
.28 .18 .15 .21 .27 .23 .22 .19 .18 .22
.45 .34 .32 .21 .21 .18 .19 .18 .14 .18
4.80 3.26 2.74 2.67 3.62 3.39 3.41 3.45 3.26 3.963.75 2.48 1.93 1.73 2.29 2.18 2.23 2.23 2.02 2.41
.67 .43 .38 .51 .67 .55 .51 .51 .51 .56
.38 .35 .43 .43 .66 .66 .68 .71 .73 .98
3.43 3.86 3.84 3.79 3.78 3.84 3.85 3.71 3.72 3.603.51 3.93 3.91 3.85 3.84 3.89 3.89 3.75 3.76 3.63
1.22 .78 .47 .32 .39 .54 .60 .53 .54 .68
2.05 2.25 2.29 2.25 2.38 2.61 2.76 3.07 3.35 3.14.41 .44 .46 .45 .44 .44 .44 .42 .42 .42.36 .38 .38 .39 .40 .43 .44 .49 .48 .52.10 .09 .14 .08 .09 .08 .08 .09 .08 .08
n.a. n.a. n.a. n.a. n.a. .03 .02 .03 .02 .02n.a. n.a. n.a. n.a. n.a. .04 .05 .06 .06 .05n.a. n.a. n.a. n.a. n.a. .01 * * * *1.19 1.33 1.32 1.33 1.45 1.67 1.79 2.07 2.37 2.13
3.77 3.98 3.95 3.86 3.79 3.85 3.85 4.03 4.11 3.961.52 1.53 1.52 1.50 1.47 1.51 1.51 1.53 1.53 1.44
.51 .49 .47 .47 .47 .48 .46 .46 .45 .431.74 1.95 1.95 1.89 1.85 1.86 1.88 2.04 2.13 2.10
1.73 1.73 1.65 1.61 1.41 1.24 1.10 .96 .76 .82
.14 .15 .09 −.01 .02 .02 .02 .03 −.01 −.05
.62 1.50 1.81 1.85 2.01 2.09 2.18 2.24 2.41 2.04
.19 .48 .56 .63 .70 .75 .77 .79 .87 .71
.03 .03 * * * * * * * *
.47 1.04 1.25 1.22 1.31 1.34 1.42 1.46 1.54 1.34
.47 .46 .76 .86 .85 1.07 .93 .96 1.16 .94* .58 .49 .36 .46 .26 .48 .50 .38 .40
7.71 15.16 16.86 16.27 16.84 16.78 17.36 17.38 18.48 15.85
Profits and Balance Sheet Developments at U.S. Commercial Banks in 2000 389

A.2. Portfolio composition, interest rates, and income and expense, all U.S. banks, 1991–2000D. Banks ranked 101 through 1,000 by assets
Item 1991 1992 1993 1994 1995 1996 1997 1998 1999 2000
Balance sheet items as a percentage of average net consolidated assets
Interest-earning assets . . . . . . . . . . . . . . . . . . . . . . . . . . . .Loans and leases, net . . . . . . . . . . . . . . . . . . . . . . . . . .
Commercial and industrial . . . . . . . . . . . . . . . . . . .U.S. addressees . . . . . . . . . . . . . . . . . . . . . . . . . . . .Foreign addressees . . . . . . . . . . . . . . . . . . . . . . . .
Consumer . . . . . . . . . . . . . . . . . . . . . . . . . . . . . . . . . . .Credit card . . . . . . . . . . . . . . . . . . . . . . . . . . . . . . . .Installment and other . . . . . . . . . . . . . . . . . . . . . .
Real estate . . . . . . . . . . . . . . . . . . . . . . . . . . . . . . . . . .In domestic offices . . . . . . . . . . . . . . . . . . . . . . . .
Construction and land development . . . . . .Farmland . . . . . . . . . . . . . . . . . . . . . . . . . . . . . . .One- to four-family residential . . . . . . . . . . .
Home equity . . . . . . . . . . . . . . . . . . . . . . . . .Other . . . . . . . . . . . . . . . . . . . . . . . . . . . . . . . .
Multifamily residential . . . . . . . . . . . . . . . . . .Nonfarm nonresidential . . . . . . . . . . . . . . . . .
In foreign offices . . . . . . . . . . . . . . . . . . . . . . . . . .Depository institutions . . . . . . . . . . . . . . . . . . . . . . .Foreign governments . . . . . . . . . . . . . . . . . . . . . . . .Agricultural production . . . . . . . . . . . . . . . . . . . . . .Other loans . . . . . . . . . . . . . . . . . . . . . . . . . . . . . . . . . .Lease-financing receivables . . . . . . . . . . . . . . . . . .Less: Unearned income on loans . . . . . . . . . . . . .Less: Loss reserves1 . . . . . . . . . . . . . . . . . . . . . . . . .
Securities . . . . . . . . . . . . . . . . . . . . . . . . . . . . . . . . . . . . . .Investment account . . . . . . . . . . . . . . . . . . . . . . . . . .
Debt . . . . . . . . . . . . . . . . . . . . . . . . . . . . . . . . . . . . . .U.S. Treasury . . . . . . . . . . . . . . . . . . . . . . . . . . .U.S. government agency and
corporation obligations . . . . . . . . . . . . .Government-backed mortgage pools . . .Collateralized mortgage obligations . . . .Other . . . . . . . . . . . . . . . . . . . . . . . . . . . . . . . .
State and local government . . . . . . . . . . . . . .Private mortgage-backed securities . . . . . . .Other . . . . . . . . . . . . . . . . . . . . . . . . . . . . . . . . . . .
Equity . . . . . . . . . . . . . . . . . . . . . . . . . . . . . . . . . . . .Trading account . . . . . . . . . . . . . . . . . . . . . . . . . . . . .
Gross federal funds sold and reverse RPs . . . . . . .Interest-bearing balances at depositories . . . . . . . . .
Non-interest-earning assets . . . . . . . . . . . . . . . . . . . . . . . .Revaluation gains on off-balance-sheet items 2 . . .Other . . . . . . . . . . . . . . . . . . . . . . . . . . . . . . . . . . . . . . . . . .
Liabilities . . . . . . . . . . . . . . . . . . . . . . . . . . . . . . . . . . . . . . . .Interest-bearing liabilities . . . . . . . . . . . . . . . . . . . . . . .
Deposits . . . . . . . . . . . . . . . . . . . . . . . . . . . . . . . . . . . .In foreign offices . . . . . . . . . . . . . . . . . . . . . . . . . .In domestic offices . . . . . . . . . . . . . . . . . . . . . . . .
Other checkable deposits . . . . . . . . . . . . . . . .Savings (including MMDAs) . . . . . . . . . . . .Small-denomination time deposits . . . . . . .Large-denomination time deposits . . . . . . .
Gross federal funds purchased and RPs . . . . . . .Other . . . . . . . . . . . . . . . . . . . . . . . . . . . . . . . . . . . . . . .
Non-interest-bearing liabilities . . . . . . . . . . . . . . . . . .Demand deposits in domestic offices . . . . . . . . . .Revaluation losses on off-balance-sheet items 2 .Other . . . . . . . . . . . . . . . . . . . . . . . . . . . . . . . . . . . . . . .
Capital account . . . . . . . . . . . . . . . . . . . . . . . . . . . . . . . . . .
MemoCommercial real estate loans . . . . . . . . . . . . . . . . . . . . . .Other real estate owned . . . . . . . . . . . . . . . . . . . . . . . . . . .Managed liabilities . . . . . . . . . . . . . . . . . . . . . . . . . . . . . . .Average net consolidated assets
(billions of dollars) . . . . . . . . . . . . . . . . . . . . . . . . . .
88.90 89.02 89.54 90.09 90.12 90.13 90.30 90.39 90.75 90.5461.03 58.49 57.93 59.75 62.19 62.63 62.22 61.13 61.49 62.1415.04 13.34 12.19 12.07 12.70 12.80 12.43 12.48 12.64 12.9714.88 13.16 12.03 11.91 12.54 12.61 12.19 12.16 12.32 12.61
.16 .18 .16 .16 .16 .18 .23 .32 .32 .3615.13 14.18 14.82 15.84 16.27 15.88 14.03 12.28 10.79 10.19
5.75 5.38 5.63 6.05 6.32 6.66 5.52 4.48 3.37 3.269.39 8.80 9.19 9.79 9.95 9.22 8.52 7.80 7.42 6.92
27.51 28.11 28.61 29.42 30.81 31.36 33.23 33.94 35.89 36.9127.47 28.07 28.58 29.39 30.79 31.34 33.21 33.92 35.87 36.89
3.67 2.86 2.26 2.08 2.21 2.38 2.69 2.88 3.48 4.16.28 .32 .34 .36 .40 .46 .53 .56 .58 .65
13.21 14.25 15.16 16.25 17.49 17.34 18.14 18.19 18.25 17.142.53 2.56 2.51 2.33 2.36 2.30 2.30 2.15 1.99 2.10
10.68 11.69 12.66 13.92 15.13 15.03 15.84 16.05 16.26 15.04.80 .95 1.07 1.13 1.21 1.29 1.29 1.26 1.43 1.57
9.50 9.68 9.75 9.57 9.48 9.87 10.56 11.03 12.12 13.36.05 .04 .02 .03 .02 .02 .02 .02 .02 .02.93 .80 .43 .40 .35 .48 .57 .50 .44 .36.07 .05 .03 .02 .02 .02 .02 .03 .03 .03.49 .54 .56 .62 .69 .71 .74 .80 .78 .82.81 2.47 2.16 2.00 1.80 1.70 1.50 1.33 1.27 1.24.85 .78 .77 .83 .90 1.01 .99 .99 .78 .75
−-.40 −.30 −.21 −.15 −.12 −.10 −.10 −.09 −.08 −.08−1.42 −1.49 −1.44 −1.30 −1.22 −1.22 −1.18 −1.13 −1.06 −1.0421.27 24.13 25.92 25.72 23.08 22.67 23.45 24.26 25.16 24.3220.91 23.78 25.63 25.40 22.88 22.55 23.35 24.15 25.09 24.2420.54 23.32 25.16 24.96 22.42 22.03 22.74 23.46 24.32 23.44
6.16 7.75 8.63 8.26 6.48 5.61 4.96 3.92 2.53 1.81
9.34 11.08 12.32 12.67 12.23 12.66 13.97 15.13 16.29 15.564.51 4.74 4.96 5.57 5.42 5.69 6.22 6.46 6.72 6.222.73 3.95 4.82 4.39 3.56 3.12 3.01 3.22 3.52 3.032.10 2.39 2.54 2.72 3.25 3.85 4.73 5.44 6.05 6.312.65 2.27 2.26 2.29 2.13 2.24 2.44 2.70 2.91 2.911.16 1.01 .84 .75 .68 .76 .59 .65 1.00 .991.23 1.21 1.10 .99 .89 .77 .78 1.06 1.60 2.18
.37 .46 .48 .44 .47 .52 .61 .69 .77 .79
.36 .35 .28 .31 .20 .12 .10 .11 .08 .094.71 4.92 4.49 3.64 3.92 3.87 3.60 4.17 3.35 3.411.89 1.47 1.20 .98 .93 .96 1.03 .83 .75 .67
11.10 10.98 10.46 9.91 9.88 9.87 9.70 9.61 9.25 9.46n.a. n.a. n.a. .02 .05 .02 * * .01 .02
11.10 10.98 10.46 9.89 9.83 9.84 9.69 9.61 9.24 9.44
92.90 92.47 91.85 91.62 91.36 91.06 90.78 90.55 90.90 90.9577.26 75.98 74.42 74.77 75.00 75.06 75.19 75.43 76.76 77.4266.34 65.65 63.05 60.38 59.67 59.99 61.47 62.40 61.94 62.68
1.76 1.56 1.43 1.69 1.71 1.33 1.23 1.31 1.20 1.2864.59 64.09 61.62 58.69 57.96 58.66 60.25 61.09 60.74 61.41
7.82 9.14 9.94 9.70 8.54 6.20 4.96 4.23 3.75 3.3320.79 23.34 24.06 22.92 20.75 22.50 23.59 25.65 27.35 27.0225.22 23.56 20.78 19.29 21.11 21.61 22.03 21.22 19.60 19.4410.76 8.06 6.84 6.78 7.56 8.34 9.66 9.99 10.04 11.62
7.46 7.18 7.43 8.45 8.31 8.19 7.09 6.16 6.90 6.323.46 3.15 3.94 5.94 7.02 6.88 6.62 6.86 7.92 8.42
15.64 16.49 17.43 16.85 16.36 16.00 15.60 15.12 14.14 13.5313.56 14.39 15.07 14.58 14.07 13.84 13.15 11.90 10.19 8.98n.a. n.a. n.a. .02 .05 .02 .01 .01 .01 *2.07 2.10 2.36 2.26 2.24 2.14 2.44 3.21 3.95 4.54
7.10 7.53 8.15 8.38 8.64 8.94 9.22 9.45 9.10 9.05
14.64 13.91 13.37 13.05 13.19 13.83 14.77 15.38 17.28 19.32.77 .80 .57 .28 .17 .13 .11 .09 .08 .07
23.48 20.00 19.68 22.89 24.62 24.78 24.66 24.46 26.32 28.00
962 967 978 1,031 1,092 1,076 968 935 972 986
390 Federal Reserve Bulletin June 2001

A.2.—ContinuedD. Banks ranked 101 through 1,000 by assets
Item 1991 1992 1993 1994 1995 1996 1997 1998 1999 2000
Effective interest rate (percent) 3
Rates earnedInterest-earning assets . . . . . . . . . . . . . . . . . . . . . . . . .
Taxable equivalent . . . . . . . . . . . . . . . . . . . . . . . .Loans and leases, gross . . . . . . . . . . . . . . . . . . . . .
Net of loss provisions . . . . . . . . . . . . . . . . . .Securities . . . . . . . . . . . . . . . . . . . . . . . . . . . . . . . . . . .
Taxable equivalent . . . . . . . . . . . . . . . . . . . . .Investment account . . . . . . . . . . . . . . . . . . . . . . .
U.S. government and other debt . . . . . . . . .State and local . . . . . . . . . . . . . . . . . . . . . . . . .Equity . . . . . . . . . . . . . . . . . . . . . . . . . . . . . . . . .
Trading account . . . . . . . . . . . . . . . . . . . . . . . . . .Gross federal funds sold and reverse RPs . . . .Interest-bearing balances at depositories . . . . . .
Rates paidInterest-bearing liabilities . . . . . . . . . . . . . . . . . . . . . .
Interest-bearing deposits . . . . . . . . . . . . . . . . . . . . .In foreign offices . . . . . . . . . . . . . . . . . . . . . . . . .In domestic offices . . . . . . . . . . . . . . . . . . . . . . . .
Other checkable deposits . . . . . . . . . . . . . . .Savings (including MMDAs) . . . . . . . . . . . .Large-denomination time deposits 4 . . . . . .Small-denomination time deposits 4 . . . . . .
Gross federal funds purchased and RPs . . . . . .Other interest-bearing liabilities . . . . . . . . . . . . . .
Income and expense as a percentage of average net consolidated assets
Gross interest income . . . . . . . . . . . . . . . . . . . . . . . . .Taxable equivalent . . . . . . . . . . . . . . . . . . . . . . . .
Loans . . . . . . . . . . . . . . . . . . . . . . . . . . . . . . . . . . . . . .Securities . . . . . . . . . . . . . . . . . . . . . . . . . . . . . . . . . . .Gross federal funds sold and reverse RPs . . . .Other . . . . . . . . . . . . . . . . . . . . . . . . . . . . . . . . . . . . . . .
Gross interest expense . . . . . . . . . . . . . . . . . . . . . . . . .Deposits . . . . . . . . . . . . . . . . . . . . . . . . . . . . . . . . . . . .Gross federal funds purchased and RPs . . . . . .Other . . . . . . . . . . . . . . . . . . . . . . . . . . . . . . . . . . . . . . .
Net interest income . . . . . . . . . . . . . . . . . . . . . . . . . . . .Taxable equivalent . . . . . . . . . . . . . . . . . . . . . . . .
Loss provisioning 5 . . . . . . . . . . . . . . . . . . . . . . . . . . . .
Noninterest income . . . . . . . . . . . . . . . . . . . . . . . . . . . .Service charges on deposits . . . . . . . . . . . . . . . . .Income from fiduciary activities . . . . . . . . . . . . .Trading income . . . . . . . . . . . . . . . . . . . . . . . . . . . . .
Interest rate exposures . . . . . . . . . . . . . . . . . . . .Foreign exchange exposures . . . . . . . . . . . . . . .Equity, commodity, and other exposures . . .
Other . . . . . . . . . . . . . . . . . . . . . . . . . . . . . . . . . . . . . . .
Noninterest expense . . . . . . . . . . . . . . . . . . . . . . . . . . .Salaries, wages, and employee benefits . . . . . . .Expenses of premises and fixed assets . . . . . . .Other . . . . . . . . . . . . . . . . . . . . . . . . . . . . . . . . . . . . . . .
Net noninterest expense . . . . . . . . . . . . . . . . . . . . . . .
Realized gains on investment account securities .
Income before taxes and extraordinary items . . . .Taxes . . . . . . . . . . . . . . . . . . . . . . . . . . . . . . . . . . . . . .Extraordinary items . . . . . . . . . . . . . . . . . . . . . . . . .
Net income (return on assets) . . . . . . . . . . . . . . . . . .Cash dividends declared . . . . . . . . . . . . . . . . . . . . .Retained income . . . . . . . . . . . . . . . . . . . . . . . . . . . .
Memo: Return on equity . . . . . . . . . . . . . . . . . . . . . . .
* In absolute value, less than 0.005 percent.n.a. Not available. MMDA Money market deposit account. RP Repurchase agreement. CD Certificate of deposit.1. Includes the allowance for loan and lease losses and the allocated transfer risk reserve.2. Before 1994, the netted value of off-balance-sheet items appeared in ‘‘trading account securities’’
if a gain and ‘‘other non-interest-bearing liabilities’’ if a loss.3. When possible, based on the average of quarterly balance sheet data reported on schedule RC-K of the quarterly Call Reports.3. Includes provisions for loan and lease losses and for allocated transfer risk.4. Before 1997, data for large time open accounts are included in small-denomination time deposits.5. Includes provisions for loan and lease losses and for allocated transfer risk.
9.56 8.15 7.43 7.58 8.44 8.41 8.50 8.32 7.84 8.519.70 8.26 7.55 7.68 8.53 8.50 8.59 8.44 7.93 8.57
10.44 9.12 8.57 8.64 9.45 9.39 9.48 9.37 8.75 9.438.72 7.83 7.77 8.11 8.77 8.60 8.60 8.61 8.13 8.598.11 6.89 5.78 5.69 6.23 6.32 6.42 6.22 6.02 6.508.54 7.19 6.10 5.93 6.50 6.60 6.69 6.57 6.29 6.718.12 6.90 5.79 5.69 6.24 6.32 6.42 6.21 6.01 6.508.29 6.95 5.76 5.68 6.29 6.41 6.55 6.35 6.15 6.687.25 6.84 6.29 5.92 5.81 5.51 5.35 5.14 4.98 5.106.02 5.06 4.94 5.29 6.06 6.29 6.35 6.34 5.98 6.817.19 5.62 4.74 5.29 5.55 5.94 6.37 6.84 7.33 9.305.64 3.48 3.02 4.05 5.45 5.29 5.42 5.31 4.98 6.156.81 4.62 3.52 4.28 6.09 5.72 5.49 5.77 5.06 5.78
6.11 4.20 3.33 3.57 4.65 4.58 4.66 4.60 4.19 4.936.06 4.17 3.26 3.31 4.26 4.27 4.34 4.28 3.84 4.466.38 4.25 3.35 4.31 5.94 5.72 5.42 5.55 5.07 6.136.05 4.17 3.26 3.28 4.21 4.24 4.32 4.25 3.82 4.434.28 2.67 2.02 1.86 2.02 1.97 2.16 2.15 1.99 2.275.14 3.34 2.58 2.64 3.24 3.11 3.08 2.97 2.65 3.076.64 4.78 3.90 4.23 5.62 5.48 5.56 5.50 5.17 6.017.08 5.35 4.40 4.40 5.53 5.57 5.57 5.64 5.11 5.745.62 3.46 2.95 4.12 5.61 5.16 5.21 5.14 4.83 5.946.80 5.28 4.44 4.93 6.32 5.89 6.09 6.00 5.36 6.39
8.64 7.36 6.74 6.90 7.69 7.68 7.75 7.63 7.19 7.798.76 7.46 6.84 6.99 7.78 7.76 7.83 7.71 7.27 7.876.52 5.46 5.06 5.26 5.99 5.99 6.00 5.85 5.48 5.971.70 1.64 1.48 1.45 1.43 1.42 1.50 1.50 1.51 1.57
.28 .17 .14 .14 .21 .20 .19 .22 .17 .21
.15 .08 .06 .06 .07 .06 .06 .06 .04 .04
4.68 3.17 2.46 2.65 3.46 3.41 3.47 3.44 3.20 3.794.02 2.75 2.07 2.01 2.56 2.58 2.70 2.71 2.44 2.88
.42 .25 .22 .35 .46 .43 .37 .32 .34 .38
.23 .17 .17 .29 .44 .40 .40 .41 .42 .53
3.96 4.20 4.28 4.25 4.24 4.28 4.28 4.19 3.99 4.014.08 4.30 4.37 4.34 4.32 4.35 4.36 4.27 4.07 4.08
1.07 .77 .47 .32 .43 .50 .56 .48 .39 .53
1.65 1.69 1.84 1.86 1.84 1.88 2.08 2.25 2.31 2.36.40 .44 .45 .42 .42 .41 .40 .39 .38 .36.27 .28 .29 .28 .27 .29 .32 .37 .38 .44.04 .02 .03 .02 .03 .02 .01 .02 .02 .01
n.a. n.a. n.a. n.a. n.a. .01 .01 .01 .01 .01n.a. n.a. n.a. n.a. n.a. .01 * * * *n.a. n.a. n.a. n.a. n.a. * * * * *
.95 .95 1.08 1.14 1.12 1.16 1.34 1.48 1.53 1.55
3.77 3.88 3.92 3.78 3.68 3.69 3.73 3.86 3.70 3.841.48 1.51 1.51 1.49 1.44 1.44 1.50 1.57 1.56 1.58
.49 .49 .48 .46 .45 .45 .46 .47 .47 .471.80 1.88 1.92 1.83 1.79 1.80 1.76 1.83 1.68 1.79
2.12 2.18 2.08 1.92 1.84 1.81 1.65 1.61 1.39 1.48
.09 .10 .06 −.05 −.01 .02 .02 .04 −.01 −.04
.86 1.34 1.78 1.96 1.96 1.98 2.10 2.14 2.20 1.96
.29 .44 .61 .67 .67 .69 .73 .73 .75 .68−.07 * .04 * * * * .06 .01 *
.49 .90 1.21 1.29 1.28 1.29 1.37 1.47 1.47 1.29
.33 .48 .79 .81 .87 1.04 1.09 1.01 1.06 .91
.16 .42 .43 .48 .41 .25 .28 .45 .41 .37
6.91 12.01 14.91 15.40 14.82 14.47 14.90 15.53 16.16 14.19
Profits and Balance Sheet Developments at U.S. Commercial Banks in 2000 391

A.2. Portfolio composition, interest rates, and income and expense, all U.S. banks, 1991–2000E. Banks not ranked among the 1,000 largest by assets
Item 1991 1992 1993 1994 1995 1996 1997 1998 1999 2000
Balance sheet items as a percentage of average net consolidated assets
Interest-earning assets . . . . . . . . . . . . . . . . . . . . . . . . . . . .Loans and leases, net . . . . . . . . . . . . . . . . . . . . . . . . . .
Commercial and industrial . . . . . . . . . . . . . . . . . . .U.S. addressees . . . . . . . . . . . . . . . . . . . . . . . . . . . .Foreign addressees . . . . . . . . . . . . . . . . . . . . . . . .
Consumer . . . . . . . . . . . . . . . . . . . . . . . . . . . . . . . . . . .Credit card . . . . . . . . . . . . . . . . . . . . . . . . . . . . . . . .Installment and other . . . . . . . . . . . . . . . . . . . . . .
Real estate . . . . . . . . . . . . . . . . . . . . . . . . . . . . . . . . . .In domestic offices . . . . . . . . . . . . . . . . . . . . . . . .
Construction and land development . . . . . .Farmland . . . . . . . . . . . . . . . . . . . . . . . . . . . . . . .One- to four-family residential . . . . . . . . . . .
Home equity . . . . . . . . . . . . . . . . . . . . . . . . .Other . . . . . . . . . . . . . . . . . . . . . . . . . . . . . . . .
Multifamily residential . . . . . . . . . . . . . . . . . .Nonfarm nonresidential . . . . . . . . . . . . . . . . .
In foreign offices . . . . . . . . . . . . . . . . . . . . . . . . . .Depository institutions . . . . . . . . . . . . . . . . . . . . . . .Foreign governments . . . . . . . . . . . . . . . . . . . . . . . .Agricultural production . . . . . . . . . . . . . . . . . . . . . .Other loans . . . . . . . . . . . . . . . . . . . . . . . . . . . . . . . . . .Lease-financing receivables . . . . . . . . . . . . . . . . . .Less: Unearned income on loans . . . . . . . . . . . . .Less: Loss reserves1 . . . . . . . . . . . . . . . . . . . . . . . . .
Securities . . . . . . . . . . . . . . . . . . . . . . . . . . . . . . . . . . . . . .Investment account . . . . . . . . . . . . . . . . . . . . . . . . . .
Debt . . . . . . . . . . . . . . . . . . . . . . . . . . . . . . . . . . . . . .U.S. Treasury . . . . . . . . . . . . . . . . . . . . . . . . . . .U.S. government agency and
corporation obligations . . . . . . . . . . . . .Government-backed mortgage pools . . .Collateralized mortgage obligations . . . .Other . . . . . . . . . . . . . . . . . . . . . . . . . . . . . . . .
State and local government . . . . . . . . . . . . . .Private mortgage-backed securities . . . . . . .Other . . . . . . . . . . . . . . . . . . . . . . . . . . . . . . . . . . .
Equity . . . . . . . . . . . . . . . . . . . . . . . . . . . . . . . . . . . .Trading account . . . . . . . . . . . . . . . . . . . . . . . . . . . . .
Gross federal funds sold and reverse RPs . . . . . . .Interest-bearing balances at depositories . . . . . . . . .
Non-interest-earning assets . . . . . . . . . . . . . . . . . . . . . . . .Revaluation gains on off-balance-sheet items 2 . . .Other . . . . . . . . . . . . . . . . . . . . . . . . . . . . . . . . . . . . . . . . . .
Liabilities . . . . . . . . . . . . . . . . . . . . . . . . . . . . . . . . . . . . . . . .Interest-bearing liabilities . . . . . . . . . . . . . . . . . . . . . . .
Deposits . . . . . . . . . . . . . . . . . . . . . . . . . . . . . . . . . . . .In foreign offices . . . . . . . . . . . . . . . . . . . . . . . . . .In domestic offices . . . . . . . . . . . . . . . . . . . . . . . .
Other checkable deposits . . . . . . . . . . . . . . . .Savings (including MMDAs) . . . . . . . . . . . .Small-denomination time deposits . . . . . . .Large-denomination time deposits . . . . . . .
Gross federal funds purchased and RPs . . . . . . .Other . . . . . . . . . . . . . . . . . . . . . . . . . . . . . . . . . . . . . . .
Non-interest-bearing liabilities . . . . . . . . . . . . . . . . . .Demand deposits in domestic offices . . . . . . . . . .Revaluation losses on off-balance-sheet items 2 .Other . . . . . . . . . . . . . . . . . . . . . . . . . . . . . . . . . . . . . . .
Capital account . . . . . . . . . . . . . . . . . . . . . . . . . . . . . . . . . .
MemoCommercial real estate loans . . . . . . . . . . . . . . . . . . . . . .Other real estate owned . . . . . . . . . . . . . . . . . . . . . . . . . . .Managed liabilities . . . . . . . . . . . . . . . . . . . . . . . . . . . . . . .Average net consolidated assets
(billions of dollars) . . . . . . . . . . . . . . . . . . . . . . . . . .
91.26 91.39 91.67 91.72 91.70 91.64 91.66 91.89 91.84 91.7754.05 53.03 52.95 54.64 56.61 57.38 58.75 59.11 59.75 62.3110.60 9.74 9.24 9.31 9.65 9.97 10.16 10.33 10.64 11.0910.56 9.69 9.20 9.26 9.59 9.90 10.08 10.25 10.56 11.02
.04 .04 .04 .05 .06 .07 .08 .08 .08 .0710.44 9.68 9.18 9.38 9.54 9.42 8.98 8.46 8.15 7.97
1.02 1.00 .92 .96 1.01 1.03 .85 .70 .68 .589.43 8.68 8.26 8.42 8.53 8.38 8.14 7.76 7.47 7.39
29.34 30.16 31.10 32.19 33.55 34.11 35.55 36.04 36.84 39.2929.33 30.15 31.09 32.19 33.55 34.10 35.55 36.04 36.83 39.29
2.18 1.97 1.93 2.14 2.39 2.61 2.82 3.02 3.28 3.701.93 2.06 2.20 2.34 2.48 2.55 2.69 2.83 2.96 3.06
16.01 16.44 16.82 16.94 17.45 17.48 18.16 18.04 17.65 18.431.29 1.34 1.27 1.21 1.20 1.20 1.24 1.21 1.17 1.28
14.72 15.10 15.56 15.73 16.26 16.28 16.92 16.83 16.48 17.15.71 .77 .84 .93 .95 .92 .95 .93 .98 1.04
8.50 8.91 9.30 9.83 10.28 10.54 10.92 11.21 11.97 13.06* * * * * * * * * *.20 .13 .12 .13 .16 .17 .17 .12 .13 .11.01 .01 .02 .01 * * * * .01 .01
3.48 3.55 3.58 3.89 3.95 3.93 4.05 4.28 4.06 3.851.24 .99 .86 .81 .76 .72 .70 .69 .69 .69
.18 .17 .18 .20 .22 .23 .25 .24 .26 .27−.51 −.43 −.36 −.31 −.30 −.27 −.24 −.20 −.15 −.11−.93 −.96 −.97 −.95 −.93 −.90 −.87 −.86 −.87 −.88
30.00 32.10 33.08 32.90 30.51 29.53 28.24 26.70 26.92 25.4129.95 32.04 33.01 32.86 30.48 29.50 28.21 26.66 26.88 25.3929.57 31.60 32.57 32.41 30.03 29.01 27.69 26.12 26.35 24.83
9.24 10.25 10.49 10.81 9.19 7.85 6.70 5.05 3.34 2.12
13.83 15.03 15.80 15.35 15.13 15.67 15.58 15.43 16.89 16.955.59 5.52 5.39 4.81 4.19 4.21 4.01 3.90 3.95 3.471.56 2.66 3.33 3.11 2.76 2.46 2.19 2.02 2.00 1.706.68 6.85 7.09 7.43 8.18 9.00 9.38 9.51 10.94 11.794.27 4.29 4.70 5.01 4.69 4.62 4.60 4.80 4.96 4.64
.89 .77 .47 .27 .20 .18 .19 .16 .26 .231.34 1.26 1.10 .97 .81 .68 .61 .68 .89 .88
.38 .44 .45 .44 .45 .49 .52 .54 .53 .56
.06 .05 .07 .04 .03 .03 .03 .03 .03 .025.64 5.10 4.67 3.42 3.91 4.04 3.95 5.13 4.17 3.221.57 1.16 .97 .76 .67 .69 .71 .96 1.00 .848.74 8.61 8.33 8.28 8.30 8.36 8.34 8.11 8.16 8.23n.a. n.a. n.a. * * * * * * *8.74 8.61 8.33 8.28 8.30 8.36 8.34 8.11 8.16 8.23
91.37 91.07 90.63 90.43 90.04 89.81 89.63 89.54 89.75 89.8978.39 77.83 76.88 76.19 75.74 75.59 75.47 75.35 75.89 76.0576.41 75.75 74.54 73.14 72.70 72.47 72.05 71.77 71.41 70.54
.08 .07 .08 .09 .11 .10 .09 .07 .07 .0576.34 75.68 74.45 73.05 72.59 72.37 71.96 71.70 71.34 70.4911.00 12.33 13.16 13.31 12.37 11.75 11.39 11.18 11.07 10.5819.34 22.10 23.55 23.23 20.41 19.57 18.98 19.01 19.69 19.0335.88 32.85 30.09 28.83 30.92 31.29 31.09 30.42 29.07 28.4210.12 8.40 7.66 7.68 8.89 9.77 10.50 11.10 11.51 12.46
1.31 1.36 1.44 1.89 1.78 1.70 1.67 1.49 1.79 2.06.67 .72 .90 1.16 1.25 1.41 1.74 2.08 2.69 3.45
12.97 13.24 13.74 14.24 14.30 14.23 14.16 14.19 13.86 13.8411.83 12.23 12.82 13.34 13.23 13.12 13.10 13.09 12.81 12.65n.a. n.a. n.a. * * * * * * *1.14 1.01 .93 .90 1.07 1.10 1.06 1.10 1.05 1.19
8.64 8.93 9.37 9.57 9.97 10.19 10.37 10.46 10.25 10.11
11.73 11.85 12.21 13.02 13.72 14.18 14.80 15.26 16.34 17.91.66 .65 .52 .35 .25 .20 .16 .13 .11 .11
12.18 10.56 10.09 10.83 12.05 12.99 14.02 14.76 16.08 18.06
694 697 687 679 666 661 647 644 651 654
392 Federal Reserve Bulletin June 2001

A.2.—ContinuedE. Banks not ranked among the 1,000 largest by assets
Item 1991 1992 1993 1994 1995 1996 1997 1998 1999 2000
Effective interest rate (percent) 3
Rates earnedInterest-earning assets . . . . . . . . . . . . . . . . . . . . . . . . .
Taxable equivalent . . . . . . . . . . . . . . . . . . . . . . . .Loans and leases, gross . . . . . . . . . . . . . . . . . . . . .
Net of loss provisions . . . . . . . . . . . . . . . . . .Securities . . . . . . . . . . . . . . . . . . . . . . . . . . . . . . . . . . .
Taxable equivalent . . . . . . . . . . . . . . . . . . . . .Investment account . . . . . . . . . . . . . . . . . . . . . . .
U.S. government and other debt . . . . . . . . .State and local . . . . . . . . . . . . . . . . . . . . . . . . .Equity . . . . . . . . . . . . . . . . . . . . . . . . . . . . . . . . .
Trading account . . . . . . . . . . . . . . . . . . . . . . . . . .Gross federal funds sold and reverse RPs . . . .Interest-bearing balances at depositories . . . . . .
Rates paidInterest-bearing liabilities . . . . . . . . . . . . . . . . . . . . . .
Interest-bearing deposits . . . . . . . . . . . . . . . . . . . . .In foreign offices . . . . . . . . . . . . . . . . . . . . . . . . .In domestic offices . . . . . . . . . . . . . . . . . . . . . . . .
Other checkable deposits . . . . . . . . . . . . . . .Savings (including MMDAs) . . . . . . . . . . . .Large-denomination time deposits 4 . . . . . .Small-denomination time deposits 4 . . . . . .
Gross federal funds purchased and RPs . . . . . .Other interest-bearing liabilities . . . . . . . . . . . . . .
Income and expense as a percentage of average net consolidated assets
Gross interest income . . . . . . . . . . . . . . . . . . . . . . . . .Taxable equivalent . . . . . . . . . . . . . . . . . . . . . . . .
Loans . . . . . . . . . . . . . . . . . . . . . . . . . . . . . . . . . . . . . .Securities . . . . . . . . . . . . . . . . . . . . . . . . . . . . . . . . . . .Gross federal funds sold and reverse RPs . . . .Other . . . . . . . . . . . . . . . . . . . . . . . . . . . . . . . . . . . . . . .
Gross interest expense . . . . . . . . . . . . . . . . . . . . . . . . .Deposits . . . . . . . . . . . . . . . . . . . . . . . . . . . . . . . . . . . .Gross federal funds purchased and RPs . . . . . .Other . . . . . . . . . . . . . . . . . . . . . . . . . . . . . . . . . . . . . . .
Net interest income . . . . . . . . . . . . . . . . . . . . . . . . . . . .Taxable equivalent . . . . . . . . . . . . . . . . . . . . . . . .
Loss provisioning 5 . . . . . . . . . . . . . . . . . . . . . . . . . . . .
Noninterest income . . . . . . . . . . . . . . . . . . . . . . . . . . . .Service charges on deposits . . . . . . . . . . . . . . . . .Income from fiduciary activities . . . . . . . . . . . . .Trading income . . . . . . . . . . . . . . . . . . . . . . . . . . . . .
Interest rate exposures . . . . . . . . . . . . . . . . . . . .Foreign exchange exposures . . . . . . . . . . . . . . .Equity, commodity, and other exposures . . .
Other . . . . . . . . . . . . . . . . . . . . . . . . . . . . . . . . . . . . . . .
Noninterest expense . . . . . . . . . . . . . . . . . . . . . . . . . . .Salaries, wages, and employee benefits . . . . . . .Expenses of premises and fixed assets . . . . . . .Other . . . . . . . . . . . . . . . . . . . . . . . . . . . . . . . . . . . . . . .
Net noninterest expense . . . . . . . . . . . . . . . . . . . . . . .
Realized gains on investment account securities .
Income before taxes and extraordinary items . . . .Taxes . . . . . . . . . . . . . . . . . . . . . . . . . . . . . . . . . . . . . .Extraordinary items . . . . . . . . . . . . . . . . . . . . . . . . .
Net income (return on assets) . . . . . . . . . . . . . . . . . .Cash dividends declared . . . . . . . . . . . . . . . . . . . . .Retained income . . . . . . . . . . . . . . . . . . . . . . . . . . . .
Memo: Return on equity . . . . . . . . . . . . . . . . . . . . . . .
* In absolute value, less than 0.005 percent.n.a. Not available. MMDA Money market deposit account. RP Repurchase agreement. CD Certificate of deposit.1. Includes the allowance for loan and lease losses and the allocated transfer risk reserve.2. Before 1994, the netted value of off-balance-sheet items appeared in ‘‘trading account securities’’
if a gain and ‘‘other non-interest-bearing liabilities’’ if a loss.3. When possible, based on the average of quarterly balance sheet data reported on schedule RC-K of the quarterly Call Reports.4. Before 1997, data for large time open accounts are included in small-denomination time deposits.5. Includes provisions for loan and lease losses and for allocated transfer risk.
9.63 8.42 7.62 7.57 8.38 8.33 8.50 8.33 8.05 8.499.81 8.58 7.78 7.72 8.53 8.48 8.63 8.49 8.18 8.59
11.01 9.81 9.13 9.00 9.80 9.72 9.80 9.69 9.28 9.5610.07 9.05 8.62 8.65 9.39 9.29 9.35 9.21 8.76 9.02
8.04 6.99 5.93 5.61 6.09 6.09 6.25 5.98 5.89 6.218.53 7.40 6.33 5.99 6.49 6.51 6.65 6.46 6.29 6.558.04 6.99 5.93 5.61 6.09 6.09 6.25 5.98 5.89 6.218.20 7.06 5.92 5.60 6.17 6.22 6.43 6.17 6.08 6.457.17 6.70 6.09 5.69 5.64 5.44 5.33 5.15 5.04 5.117.13 5.67 5.18 5.52 6.26 6.05 6.40 6.12 6.16 6.718.41 7.12 4.83 6.03 6.12 6.48 6.60 6.01 3.60 4.015.66 3.50 2.95 4.08 5.95 5.32 5.51 5.35 4.96 6.267.35 5.59 4.53 4.64 5.91 5.68 5.69 5.66 5.71 6.39
6.17 4.43 3.54 3.49 4.46 4.48 4.61 4.60 4.28 4.806.15 4.43 3.53 3.44 4.39 4.43 4.54 4.53 4.21 4.675.95 3.97 2.91 3.92 5.73 5.34 4.77 5.08 4.34 5.146.15 4.43 3.53 3.44 4.39 4.43 4.53 4.53 4.21 4.674.61 3.13 2.42 2.29 2.50 2.41 2.46 2.45 2.28 2.465.17 3.61 2.91 2.83 3.32 3.24 3.36 3.39 3.20 3.566.72 4.88 3.96 4.12 5.55 5.48 5.53 5.53 5.21 5.926.97 5.35 4.39 4.28 5.51 5.59 5.66 5.63 5.24 5.705.71 3.72 3.17 4.12 5.61 5.08 5.23 4.99 4.72 5.716.96 5.00 4.68 4.98 6.46 5.78 6.32 6.45 5.63 6.24
8.91 7.78 7.06 7.01 7.78 7.74 7.90 7.75 7.48 7.869.07 7.93 7.20 7.15 7.91 7.86 8.02 7.87 7.60 7.976.04 5.29 4.92 4.99 5.63 5.66 5.86 5.80 5.62 6.022.41 2.24 1.96 1.84 1.86 1.80 1.76 1.59 1.58 1.58
.34 .18 .14 .15 .25 .24 .24 .29 .22 .21
.12 .07 .05 .04 .04 .04 .04 .06 .06 .05
4.82 3.45 2.72 2.65 3.37 3.38 3.48 3.46 3.26 3.644.70 3.36 2.64 2.52 3.19 3.21 3.28 3.25 3.02 3.31
.07 .05 .04 .07 .10 .08 .08 .07 .08 .12
.05 .04 .04 .06 .08 .08 .11 .13 .15 .21
4.09 4.34 4.34 4.36 4.41 4.36 4.42 4.29 4.22 4.224.24 4.48 4.48 4.50 4.54 4.49 4.54 4.41 4.34 4.33
.51 .41 .27 .19 .24 .25 .27 .29 .31 .34
1.07 1.16 1.25 1.30 1.38 1.42 1.44 1.52 1.44 1.32.44 .45 .45 .44 .44 .44 .44 .42 .42 .43.14 .16 .16 .17 .22 .19 .20 .23 .26 .21.01 .01 .01 * .01 * * * * *
n.a. n.a. n.a. n.a. n.a. * * * * *n.a. n.a. n.a. n.a. n.a. * * * * *n.a. n.a. n.a. n.a. n.a. * * * * *
.49 .55 .64 .69 .71 .78 .79 .86 .75 .68
3.60 3.66 3.74 3.78 3.80 3.69 3.71 3.75 3.73 3.581.64 1.69 1.73 1.75 1.79 1.77 1.80 1.82 1.82 1.78
.49 .49 .49 .49 .50 .49 .49 .49 .49 .471.46 1.49 1.53 1.55 1.51 1.44 1.41 1.43 1.42 1.33
2.53 2.51 2.49 2.48 2.42 2.28 2.27 2.23 2.29 2.26
.06 .09 .07 −.03 * .01 .01 .02 * −.01
1.11 1.51 1.65 1.66 1.75 1.84 1.89 1.79 1.62 1.60.35 .47 .51 .51 .55 .59 .59 .53 .47 .45.19 .02 .05 * * * * * * *.96 1.05 1.19 1.15 1.20 1.25 1.30 1.26 1.15 1.16.89 .51 .56 .57 .62 .64 .73 .82 .68 .79.07 .54 .63 .58 .58 .62 .57 .44 .48 .37
11.06 11.78 12.67 12.03 12.06 12.31 12.57 12.02 11.27 11.44
Profits and Balance Sheet Developments at U.S. Commercial Banks in 2000 393