proteomics: the basic overview - …€¦ · pvp-40 polyvinylpyrrolidone ... vol. 47, no. 28,...
TRANSCRIPT

1
PROTEOMICS: THE BASIC OVERVIEW
Daniel Figeys
Department of Biochemistry, Microbiology, and Immunology, University of Ottawa, Ottawa, Canada
Introduction 2Deoxyribonucleic Acid to Ribonucleic Acid 4Ribonucleic Acid to Protein 6
Proteome Handling in Classical and Functional Proteomics 6Protein Purification 6
Cell Culture 8Other Source of Samples 8Subpopulation of Cells 10Subcellular Components 11
Protein Separation by Two-Dimensional Gel Electrophoresis 12Principles of Two-Dimensional Gel Electrophoretic Separation 13Detection of Proteins Separated by Two-Dimensional Gel Electrophoresis 15Software to Handle Two-Dimensional Gel Electropherogram 17
Potein Processing 17Blot Digestion of Proteins 18In-gel Digestion of Proteins 19
Protein Identification 19Edman Degradation 19
Industrial Proteomics: Applications for Biotechnology and Pharmaceuticals, edited by Daniel FigeysISBN 0-471-45714-0 Copyright © 2005 by John Wiley & Sons, Inc.
1

Protein Identification by Mass Spectrometry 20Hybrid Instruments 26Bioinformatics for the Identification of Proteins Based on MS/MS 46
Current Challenges in Proteomics 49Classical Proteomics 49Gel-Free Analysis: An Alternative Differential Display 50Fourier Transofrm Mass Spectrometery for Gel-Free Analysis and
Single-Peptide-Based Identification 53References 54
List of Abbreviations2D Two dimensionalb-gal b-galactosidasebp base pairCZE capillary zone electrophoresisESI electrospray ionizationEST expressed sequence tagFTMS Fourier transform mass spectrometerHPLC high-performance liquid chromatographyi.d. inner diameterICAT isotope-coded affinity tagIPG immobilized pH gradientMALDI matrix-assisted laser desorption ionizationMHC major histocompatibility complexMicro-ESI microelectrospray ionizationMS/MS tandem mass spectrumMS mass spectr(um/ometer)MW molecular weightNano-ESI nanoelectrospray ionizationo.d. outer diameterORF open reading frameppm parts per millionpsi pound per square inchPVP-40 polyvinylpyrrolidoneRF radio frequencySAGE serial analysis of gene expressionSNP single-nucleotide polymorphismSPE solid-phase extractionTOF time of flight
INTRODUCTION
The astonishing pace of scientific discovery in the twentieth century has had directimplications on our daily lives. The increase in quality of life and in life expectancy
2 PROTEOMICS: THE BASIC OVERVIEW

seen in the industrialized countries correlate with the discoveries made in medicine andbiological sciences (Fig. 1.1). At the onset of the twentieth century, medicine andbiology were descriptive sciences aimed at understanding macroscopic phenomena. Bythe end of the century, these sciences had accessed the micro and nanoscopic worldswith an increased understanding of the implications involved in the biological processesof our lives. The dawn of the new millennium is ushering in a new paradigm for under-standing system biology and complex multigenic diseases, as well as the accumulationof massive amounts of genomic information.
In the last quarter of the twentieth century, a few visionaries realized that all theparts were available to create a deoxyribonucleic acid (DNA) sequencing engine thatwould become capable of sequencing the human genome. Numerous sequencing proj-ects were started with the promise of creating technology to accelerate the pace ofsequencing. It took longer than expected to fill this promise, but by the end of the twen-tieth century new technologies were available to accelerate the pace of sequencing (Fig. 1.2).
In particular, instrumentation was developed to sequence large genomes in rea-sonable time periods (Dovichi, 1997). This instrumentation provided the framework fordeveloping comprehensive approaches to heighten our understanding of diseases andbiology. Furthermore, it was quickly realized that the complexity of biologicalprocesses could not be resolved only with genomic sequencing. It became apparent thatthe diseases remaining to be cured were increasingly more complex, were often trig-
INTRODUCTION 3
80
75
70
65
60
55
50
45
40
35
301900 1920 1940 1960
Year
1980 2000
Life
exp
ecta
ncy
in y
ear
Figure 1.1. Life expectancy in the United States from 1900 to 1999. The data were averaged
according to gender and race and smoothed for a 3-year period. Data were obtained from
the National Vital Statistics Report, Vol. 47, No. 28, December 13, 1999. US Department of
Health and Human Services.

gered by a series of genes, and were dependant on the genetic makeup of individuals.Genomic sequencing can rapidly provide the list of the parts of the genome, but itcannot provide the instruction on how these parts fit together. This insufficiency createda disproportion between the amount of information available and the tools available forlarge-scale studies of molecules involved in biological processes.
Conventional biochemical approaches were relied on to access the functions andinteractions of translated material. The key to capturing the value of the human genomeis to find approaches that can rapidly link the genomic information to drug discoveryand diagnostics. The development, however, of high-throughput tools for assessing theexpression levels and functions of transcripted and translated genetic materials hasglobalized the study of cellular processes that may provide the link between genomicinformation and drug discovery and diagnostics.
Deoxyribonucleic Acid to Ribonucleic Acid
A series of tools became available for the rapid and quantitative analysis of expressionlevels in ribonucleic acid (RNA). For example, the emergence of the DNA/RNA arraytechnology and the serial analysis of gene expression (SAGE) have facilitated the acqui-sition of quantitative expression profiles for complete sets or subsets of RNA (Desprezet al., 1998; Marshall and Hodgson, 1998; Ruan et al., 1998; Service, 1998; Velculescuet al., 1995; Madden et al., 1997; Matsumura et al., 1999, Neilson et al., 2000; Lal et al., 1999; Stein et al., 2004; Weeraratna et al., 2004). Different RNA expression pro-files can be acquired using these techniques, and genes that are “up”- or “down”-regulated when comparing different cells or different cell states can also be detected.
4 PROTEOMICS: THE BASIC OVERVIEW
30
25
20
15
10
5
01994 1995 1996 1997 1998 1999 2000 2001
year
num
ber
of c
ompl
eted
/exp
ecte
d ge
nom
es
Figure 1.2. Number of completed and expected to be completed genome sequencing pro-
jects from 1995 to 2004. The intensification of sequencing efforts is visible from 1999 forward.

Already, with one step away from the genomic sequence, a tremendous amount of infor-mation is extracted by studying RNA.
It is clear that these high-throughput DNA/RNA screening technologies provide arapid and quantitative overview of the genes that are differentially expressed. It turnsout, however, that the RNA expression on its own is not sufficient for understandingbiological processes and gene functions. Evidence has been collected from differentresearch groups (Gygi et al., 1999b; Gygi and Aebersold, 1999; Anderson and Seilhamer, 1997; Futcher et al., 1999) indicating that the expression of RNA has a poor linear relationship with the changes happening at the protein level (Fig. 1.3) whileother experiments indicate a good correlation for higher abundance proteins (Kern et al., 2003). This is due to the numerous regulation mechanisms in place during protein expression and postexpression.
Furthermore, a recent large-scale study of the yeast genome has clearly demon-strated a poor relationship between DNA chip results and protein expressions (Ross-Macdonald et al., 1999). This study, performed by transposon tagging and genedisruption, found 31 meiotic genes, which were detected at the protein level by “in-frame” lacZ fusion and assay for b-galactosidase (b-gal) activity. Out of the 31 meoticgenes, only 17 had been previously reported to be induced by at least twofold duringsporulation. This was achieved by detection based on the DNA microarray represent-ing all the annotated open reading frames (ORFs) in yeast. For the remainder of themeotic genes, the DNA microarray analysis failed to find any significant inductionduring meiosis. Therefore, not only is the relationship between the expression level ofRNA and the expression level of proteins a complex matter, but it is also misleading
INTRODUCTION 5
100
75
50
25
00.0 2.5 5.0 7.5 10.0
1000
750
500
250Pro
tain
ab
un
da
nce
(1
03 c
op
ics/
cell)
00 50 100 150 200 250 1 10 100
Adj. mRNA
106
105
104
Pro
tein
mRNA abundance (copies/cell)
(a) (b)
Figure 1.3. Correlation between protein and mRNA levels in S. Cerevisiea. (a) Correlation
between protein and mRNA levels for 106 genes in yeast. The inset shows the low-end portion
of the main figure. The Pearson product moment correlation for the entire data set was 0.935
and 0.356 for the inset. Reproduced with permission from Gygi et al. (1999). (b) Correlation
of protein abundance with adjusted mRNA abundance in yeast. The Pearson product moment
is 0.76. Reproduced with permission from Futcher et al. (1999).

to rely solely on the RNA expression patterns to predict cellular functions. Clearly, theamount of protein related to a gene can dramatically change without any change in the RNA expression level if this is achieved through downstream regulation mechanisms.
Ribonucleic Acid to Protein
Although serious efforts have been made to develop efficient genomic technologies,the study of proteins cannot be avoided in the quest to understand biological processes.The justification for studying proteins goes even deeper than just the lack of correla-tion between the expression levels of RNA and proteins. The presence of posttrans-lational modification, posttranslational truncation of proteins, and protein–ligand interactions are a few examples that illustrate the complexity at a protein level.
The study of proteins has always been done on a relatively small scale, partlybecause of the lack of methods to unambiguously and easily verify the protein iden-tity. Experiments had to be carried out with great care to ensure that only the proteinof interest was isolated. All of this has changed over the last 10 years with the devel-opment of technology capable of performing large-scale analyses and identification ofproteins (Issaq et al., 2002; Wang and Hanash, 2003). This achievement has opened thedoor for comprehensive studies of proteins related to a genome (proteome) (Wilkins etal., 1996a).
PROTEOME HANDLING IN CLASSICAL AND FUNCTIONAL PROTEOMICS
Two-dimensional (2D) gel electrophoresis is typically used in profiling proteomicstudies, and its most popular implementation is the differential displays of proteinsexpressed under different conditions. It turns out that conserving the proteome to obtaina truly representative 2D gel pattern is not trivial, and this is probably the most impor-tant experimental step in proteomic studies. For example, great care must be takenduring the extraction of cells from their environment and during cell lysis to reduce the influence of the sample extraction protocol on the observed state of the proteome.Mistakes are often made while manipulating a proteome, thus seriously affecting theconclusions from the experiments. Therefore, the history of the sample is a prerequi-site in order to assess the validity of a sample.
PROTEIN PURIFICATION
The extraction of protein from a cell lysate is a critical step for establishing a stableproteome. It is well known that once the cells are lysed the enzymes that would nor-mally be compartmentalized are brought in contact with other proteins and then rapidlydegrade the proteome. Fortunately, sets of well-characterized methods are available to
6 PROTEOMICS: THE BASIC OVERVIEW

cover the majority of the needs in protein extraction from cells. The harvesting ofsoluble proteins is simply performed by lysing the cells and collecting the supernatant.Different cell lysis methods are easily accessible (see www.expasy.ch). It is best tochoose the simplest approach that is directly compatible with the immobilized pH gradient (IPG) isoelectric (i.e., minimum salt and ionic surfactant contents).
The current protein extraction protocols are not universally applicable to all bio-logical samples, and they have limitations in terms of the protein representation in theextracted proteome. First, hydrophobic proteins are not easily extracted and representedon a 2D gel pattern (Wilkins et al., 1998). Figure 1.4 shows the number of proteinsvisualized on a 2D gel of Saccharomyces Cerevisiae versus the gravy hydrophobicityscale. Clearly, a significant portion of the predicted proteins in a proteome is hydropho-
PROTEIN PURIFICATION 7
0
200
400
600
800
1000
1200
1400
1600
1800
-2.5 -2.25 -2 -1.75 -1.5 -1.25 -1 -0.75
(a)
(b)
-0.5 -0.25 0 0.25 0.5 0.75 1
0
5
10
15
20
25
30
35
40
-0.75 -0.5 -0.25 0 0.25 0.5
gravy index
nu
mb
er o
f p
rote
ins
Figure 1.4. Hydrophobicity vs. protein observed. (a) The gravy index was calculated for all
the known yeast ORF. (b) The gravy index was calculated from some of the observed proteins
on a 2D gel electropherogram. Data were compiled from Gygi et al. (2000) and Perrot et al.
(1999). A negative gravy index indicates hydrophilicity while a positive gravy index indicates
hydrophobicity.

bic in nature; however, the compilation of the proteins that have been identified by 2Dgel electrophoresis and mass spectrometry indicate a serious lack of hydrophobic pro-teins. This means that 2D gel electrophoresis fails to display the hydrophobic portionof the proteome. In recent years, significant efforts from the group of Rabilloud (Adessiet al., 1997; Blisnick et al., 1998; Chevallet et al., 1998; Goldberg et al., 1996; Rabillout, 1998; Rabillout et al., 1999; Santoni et al., 1999; Tastet et al., 2003; Lucheet al., 2003) provided improved protocols and chemicals for the recovery of hydropho-bic proteins. The extraction of hydrophobic proteins, however, is still a considerablechallenge in proteomics. Comprehensive reviews have been published on the extrac-tion and solubilization of proteins from biological samples for 2D gel electrophoresis(Dunn and Corbett, 1996; Rabillout, 1996, 2002; Ramagli, 1999).
Current protein extraction protocols often fail to provide a unique proteome. This is particularly a problem when dealing with tissues that are composed of manydifferent cells at different stages and each having its own proteome. Classical protein extraction techniques would lyse the whole tissue or tissue fraction generatinga scrambled proteome composed of all the original proteomes. Recent proteomic studieshave clearly indicated that the cellular diversity within a biological sample, and theprotein localization within cells greatly impact the conclusion of a proteomic study. The present challenges related to the level of cellular mass complexity are presentedbelow.
Cell Culture
Cultured cells have been the most popular source of protein for proteomic studies. Theyare mainly used because they can provide a wealth of information that is often diffi-cult to obtain from tissues and primary cultures. Furthermore, cell cultures are easilyaccessible at large curated collections of cells, such as the American Type Culture Collection (www.atcc.org).
Another significant advantage of cell culture over tissue material is the controlla-bility of the environment and the growth conditions, as well as the potential to use dif-ferent stimulations. Furthermore, cultures are usually obtained from single colonies andare homogeneous, thus greatly reducing the complexity of the proteome. Moreover, theculture growth and the lysis conditions are also controllable, which significantly minimize batch-to-batch fluctuations and artifacts in the proteome. To date, cell cul-tures provide the most controllable environment to perform proteomic experiments.
Other Source of Samples
Proteomes have also been analyzed from more complex samples, such as clinicalsamples, plants, and animals (Ostergaard et al., 1997; Wimmer et al., 1996; Lubec etal., 2003; Aebersold and Mann, 2003). The conclusions, however, that can be reachedfrom such samples are often affected by many parameters that are not easily control-lable. Typically, large numbers of samples need to be studied for any hope of findingthe relevant proteins. Many factors increase the complexity of the analysis. The first
8 PROTEOMICS: THE BASIC OVERVIEW

factor is the methodology used to extract and store the clinical samples. The failure ofclinical samples in proteomics is often traced back to the first step in the study, that is,the extraction and storing of the clinical samples. The proteome can often be seriouslychanged due to extended storage at room temperature. Even though large collectionsof clinical samples have been established, they are often of limited value for proteomicstudies because they were not stored properly shortly after their extraction. Proteomicstudies often require the revision of methodology for clinical and other samples.
Once proper methodologies are in place to limit the effects of sample isolation on the proteome, other factors can still make the study difficult. Tissue samples are heterogeneous in nature (i.e., composed of different cell types, volumes, and cell ratiocompositions). This can cause large variations in the protein contents within the sametissues and for tissues of different sources. In reality, tissue samples are composed ofmany different proteomes. The lysis of these samples generates a scrambled mixtureof proteomes. Therefore, multiple experiments need to be performed in order to extractthe relevant proteins, or else the scrambling of proteomes will shadow the importantproteins, thus making it impossible to interpret the results.
Examples are available that demonstrate the feasibility of extracting valuable infor-mation from scrambled proteomes. In a proteomic study of bladder cancer, Ostergaardand co-workers (Ostergaard et al., 1997; Wimmer et al., 1996; Celis et al., 1999) havedemonstrated that new disease markers associated with the different cancer stages canbe determined. They processed hundreds of well-preserved bladder cancer. By apply-ing a proteomic approach, they found a handful of proteins that were differentiallyexpressed during the different progression stages of the disease. Antibodies were raisedagainst these protein markers (mainly keratinocyte markers) and were then used as adiagnostic tool to ascertain the different cancer stages within cryostat sections of biopsies from bladder cystectomies. Although the study was successful, the identifieddisease markers were actually high abundance proteins, and their changes in expres-sion would be noticeable in scrambled proteomes. In any case, it would have been significantly more difficult to identify low- to mid-abundance proteins involved in the disease.
Two-dimensional gel-based analysis also introduces a third limiting factor that isrelated to the sample capacity of the technique (See Table 1.1). Typically, up to 100 mgof proteins are used during 2D gel electrophoresis. It is known that 2D gel elec-trophoresis can at least separate up to 11,000 proteins. That would represent about 9ngfor every protein, which is in the low subfemtomole level for most proteins displayedby 2D gel electrophoresis. In most cells, however, about 10 percent of the proteins rep-resent 90 percent of the protein mass, while the remaining 90 percent of proteins rep-resent only 10 percent of the protein mass. Assuming that cells express about 10,000proteins, then the mid- to low-abundance proteins would only be, in the best case sce-nario, at about 1ng on the gel. In reality the number would be even less because of thesample losses associated with 2D gels and low-abundance proteins. In a recent study,Gygi et al. (2000) demonstrated that for a typical 2D gel of yeast, protein identifica-tion could not be achieved for proteins with a codon bias of less than 0.1, thus indi-cating the lack of identification of low-abundance proteins. Furthermore, theydemonstrated that they could discover low- to mid-abundance proteins on a 1D gel, but
PROTEIN PURIFICATION 9
only once the sample load had been significantly increased. The difference in sensitiv-ity of different proteomics approached applied to yeast was recently illustrated (Ghaemmaghami et al., 2003).
The technique of 2D gel separation of proteins isolated from complex tissuesamples has been performed for over 30 years, and recently, tools have been developedto allow the identification of these proteins. These tools have now been integrated inhigh-throughput platforms to allow serious study of proteomes. As proteomics movesfrom cell culture to primary cultures and tissues, it is important to keep in mind thatthese samples when used with conventional solubilization approaches produce complexmixtures of proteomes, each corresponding to an individual subpopulation of cells. Theresulting scrambled proteome can be very difficult to make any sense of even with largepopulation studies.
Subpopulation of Cells
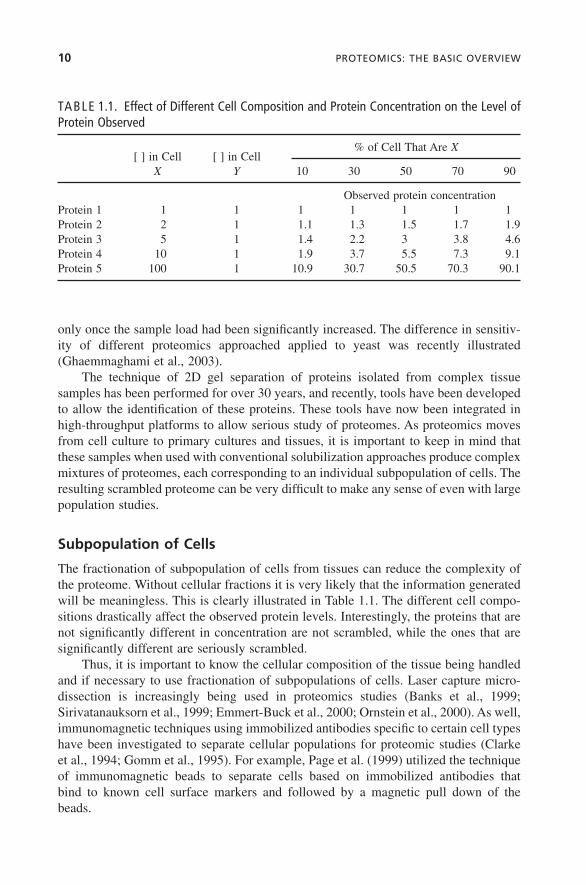
The fractionation of subpopulation of cells from tissues can reduce the complexity ofthe proteome. Without cellular fractions it is very likely that the information generatedwill be meaningless. This is clearly illustrated in Table 1.1. The different cell compo-sitions drastically affect the observed protein levels. Interestingly, the proteins that arenot significantly different in concentration are not scrambled, while the ones that aresignificantly different are seriously scrambled.
Thus, it is important to know the cellular composition of the tissue being handledand if necessary to use fractionation of subpopulations of cells. Laser capture micro-dissection is increasingly being used in proteomics studies (Banks et al., 1999; Sirivatanauksorn et al., 1999; Emmert-Buck et al., 2000; Ornstein et al., 2000). As well,immunomagnetic techniques using immobilized antibodies specific to certain cell typeshave been investigated to separate cellular populations for proteomic studies (Clarkeet al., 1994; Gomm et al., 1995). For example, Page et al. (1999) utilized the techniqueof immunomagnetic beads to separate cells based on immobilized antibodies that bind to known cell surface markers and followed by a magnetic pull down of the beads.
10 PROTEOMICS: THE BASIC OVERVIEW
TABLE 1.1. Effect of Different Cell Composition and Protein Concentration on the Level ofProtein Observed
[ ] in Cell [ ] in Cell% of Cell That Are X
X Y 10 30 50 70 90
Observed protein concentrationProtein 1 1 1 1 1 1 1 1Protein 2 2 1 1.1 1.3 1.5 1.7 1.9Protein 3 5 1 1.4 2.2 3 3.8 4.6Protein 4 10 1 1.9 3.7 5.5 7.3 9.1Protein 5 100 1 10.9 30.7 50.5 70.3 90.1

Subcellular Components
The complexity of specific proteome can also be reduced to the subcellular level. Theenrichment of subcellular components, such as the organelles and plasma membrane,reduces the complexity of the proteome while increasing the likelihood of observinglower abundance proteins (Howell et al., 1989; Jung et al., 2000; Brunet et al., 2003).We have come to realize that in many instances it would not be possible to distinguishcompartment proteins using conventional whole-cell protein displays by 2D gel elec-trophoresis due to dynamic range limitation.
Free-flow electrophoresis and density gradients are the classical approaches to sub-cellular fractionations. An interesting example of the utilization of density gradient separation in proteomics was provided by Fialka et al. (1997). They isolated subcellu-lar compartments from murine mammary epithelial cells (EpH4) by continuous sucrosegradient centrifugation. This was then followed by high-resolution 2D gel elec-trophoresis on the proteins recovered from the sucrose gradient centrifugation. Theywere able to obtain 2D gel electropherograms of the late endosomes, early endosomes,and the majority of the rough endoplasmic reticulum. This study did not utilize massspectrometry to systematically identify the isolated proteins.
Garin et al. (2001) utilized latex beads that are incubated with mouse macrophage-like cell line generating phagosomes that contain these latex beads. The phagosome canthen be easily purified using a simple flotation approach. The proteins contained in thephagosome were then separated by 2D gel electrophoresis and the isolated proteins analyzed by mass spectrometry. The end result was the discovery of over 140 proteinsassociated with the latex bead containing phagosomes.
PROTEIN PURIFICATION 11
TABLE 1.2. Cell Culture and Estimated Protein Levelsa
Number of Nanogram Expressed Total Mass ofCell Culture Copy/Cell Mole for a Protein of 70kDa Proteinb
107 10 0.16 fmol 0.01 6.5mg100 1.6 fmol 0.1
1,000 16 fmol 110,000 160 fmol 10
108 10 1.6 fmol 0.1 65 mg100 16 fmol 1
1,000 160 fmol 1010,000 1.6pmol 100
109 10 16 fmol 1 650 mg100 160 fmol 10
1,000 1.6pmol 10010,000 16pmol 1,000
a Gray area indicates level of proteins that can be detected on a silver-stained 2D gel.b Assumption 1: 90% of the protein mass is representing 10% of proteins highly expressed (>1000 copy/cell).About 10,000 proteins are expressed.Assumption 2: 60% of the protein mass is representing 10% of proteins. About 10,000 proteins are expressed.

An alternative approach was also presented for the recovery of specific compart-ments based on immunomagnetic purification (Perrin-Cocon et al., 1999; Sarto et al.,2002; Himeda et al., 2004). In their specific application, Perrin-Cocon et al. (1999) iso-lated intracellular compartments containing endocytosed antigens. The magnetic beadswere first covalently attached to a tetanus toxin. The beads were then incubated withU937 cells, allowing the antigen to bind to its receptor. The internalization of themicrobeads by the cell was achieved by means of pinocytosis or receptor-mediatedendocytosis. The compartments containing the beads were then isolated by the application of a magnetic field. After extensive washes, they were lysed, and theirprotein content was displayed by 2D gel electrophoresis. Figure 1.5 shows the 2D gelelectropherogram obtained for the magnetic purified fraction and for the postnuclearsupernatant. About 20 different proteins appeared to be enriched in the isolated compartments.
PROTEIN SEPARATION BY TWO-DIMENSIONAL GEL ELECTROPHORESIS
After carefully assessing the best method to extract the proteome from its medium, thesecond challenge is to extract information from the proteome, which generally starts
12 PROTEOMICS: THE BASIC OVERVIEW
(a) (b)
Figure 1.5. Subcellular localization: Magnetic purification. Tetanus-toxin-coated microbeads
were incubated with U937 cells for 15min at 37°C with chased 2h. Then, the compartments
that contained the magnetic beads were magnetically isolated. Two-dimensional gel electro-
pherograms were obtained for the magnetic fraction (a) and for the whole-cell lysate. Repro-
duced with permission from Perrin-Cocon et al. (1999).

by separating the proteins contained in the proteome. Some proteomes are relativelysmall, containing a few hundred proteins or less, while others contain thousands of pro-teins. One-dimensional (1D) separation techniques do not have the resolving power toseparate complex mixtures. The combination, however, of orthogonal separation tech-niques can provide the required resolving power. Furthermore, it is important that thequantitative aspect of the proteome be conserved through the separation technique.About 30 years ago, a technique called 2D gel electrophoresis was introduced, and thistechnique satisfied the resolving power requirement while conserving the quantitativeaspect of the proteome. Two-dimensional gel electrophoresis has been the method of choice for the large-scale purification of proteins in proteomic studies. The 2D gelelectrophoresis method can potentially separate several thousand proteins in a singleexperiment (Gorg et al., 1988; Klose and Kobalz, 1995). Although the predictions forthe number of genes in some genomes are high, it is generally believed that the numberof genes expressed is, on average, between 5000 and 15,000 per cell type. However,these genes can lead to many forms of proteins, greatly increasing the complexity ofthe proteome. Protein separation can now be achieved as low as 0.1 isoelectric point(pI) unit and 1kDa in molecular weight (MW).
Principles of Two-Dimensional Gel Electrophoretic Separation
Most people are not aware that 2D gel electrophoretic separation can be performed indifferent modes. In proteomics, the overwhelmingly popular implementation of 2D gelelectrophoresis is the separation of the proteins according to their pI in the first dimen-sion, followed by their separation according to the MW in the second dimension.Clearly, the combination of pI and MW separation offers a truly orthogonal separationtechnique, which is reflected by the unsurpassed resolving power of 2D gel electrophoresis.
Although 2D gel electrophoresis is a powerful separation technique, it was alsoinitially very tedious and irreproducible. In fact, it was not clear in the late 1970s andearly 1980s if the technique would become widely applied and if it would survive. For-tunately, the problems related with reproducibility were greatly reduced in the mid-1980s when the immobilized pH gradient was introduced, and it became commerciallyavailable (IPG strip) (Righetti and Gianazza, 1987; Righetti and Bossi, 1997a, 1997b;Righetti et al., 1983; Gorg, 1993; Fichmann, 1999; Matsui et al., 1999b; Sanchez et al.,1999). In the mid-1980s it was realized that the pH gradient could be immobilized and stabilized by copolymerizing different acrylamide monomers carrying ampholyteproperties with acrylamide and low levels of cross-linkers. Although the mixture ofampholytes can be relatively complex, a simple system and a computer algorithm wereused to, respectively, cast the IPG strip and to accurately predict the pH profile acrossthe strip. IPG strips with various pH gradients and integrated instruments to performisoelectric focusing became commercially available. The tediousness, however,involved in the technique is still present today, and, although the technique is definitelyapplied in proteomic groups, it has not been fully implemented in daily biologicalexperiments.
PROTEIN SEPARATION BY TWO-DIMENSIONAL GEL ELECTROPHORESIS 13

The commercial IPG strips are typically available in a dried form, sandwichedbetween two polymer cover sheets. The first step in using these strips is to remove oneof the polymer covers and to inspect the strip for uniformity of the IPG. The peelingof sections of the strips has caused a higher rate of IPG strip rejection in recent years.Once a suitable IPG strip is found, it is first reswelled using a mixture of the proteinextract with a loading buffer (Sanchez et al., 1999). This ensures that the protein mixtureis uniformly distributed across the whole IPG and limits precipitation due to the excessof proteins in specific areas of the gel. The addition of a small electric field across thestrip improves the transfer of the proteins to the IPG strip. Once the strip is reswelled,then an increasingly larger electric field is gradually applied across the IPG (Righettiand Gianazza, 1987) (Fig. 1.6). The proteins that are positively charged (i.e., in the areaof the strip with pH below their pI) move toward the cathode and encounter an increas-ing pH until reaching their pI, at which point they will be neutral. The proteins that arenegatively charged (i.e., in the area of the strip with pH above their pI) will move towardthe anode and encounter a decreasing pH until reaching their pI. Every protein is con-centrated and constantly focused at their respective pI. In theory, the higher the elec-tric field and the longer the focusing is performed, the better the separation. Practically,the power supply, the presence of salts in the sample, and electroosmotic pumping willlimit the performance of the separation. We have found that a separation involving50,000 to 75,000Vt ¥ hour is sufficient for the types of samples we have handled. These
14 PROTEOMICS: THE BASIC OVERVIEW
Low pH High pH+ voltage - voltage
pIBelow pI+ charged
Above pI- chargedNeutra
(a)
(b)
l
Immobilized pH gradient
pI (I)pI (II)
pI (III)
Protein IProtein II
Protein N
Low pI proteins High pI proteins
Focusing:
Focused:
Focusing:
Focused:
Low pH+ voltage
High pH- voltage
Figure 1.6. Isoelectric focusing on an immobilized pH gradient (IPG). (a) Focusing of a single
protein. (b) Focusing of a mixture of proteins.
numbers were typically achieved after 12 to 20h of focusing. It is important to remem-ber that these numbers need to be adjusted for different proteomes and to keep the timeframe of the experiment reasonable.
The second dimension for the 2D separation is typically prepared during the focus-ing of the first dimension; however, it can also be precast and stored in a fridge withan appropriate buffer for 2 to 3 weeks with no separation problems. The second dimen-sion is generally formed by pouring and polymerizing an acrylamide solution inbetween two glass plates, spaced using 1- to 1.5-mm spacers. After proper equilibra-tion of the IPG strip performed by in-gel reduction and alkylation of the proteins, thestrip is applied to the second dimension. Different systems are available for the seconddimension. Some systems provide gels that are slightly larger than a sheet of paper oreven larger. The strip can also be cut in different parts and applied to minigels. Regard-less of the size of the gel, it is necessary that a tight contact between the strip and thegel be maintained. An electric field is then applied across the gel and the proteinsmigrate into the second dimension where they are separated according to their MW.Again, systems are commercially available to run the second dimension, and precast,larger gels were recently introduced.
Detection of Proteins Separated by Two-Dimensional Gel Electrophoresis
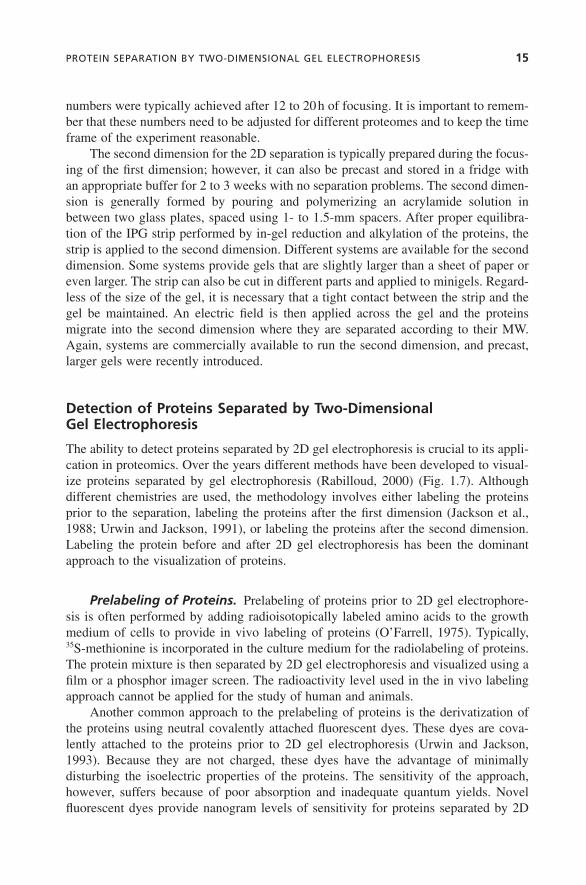
The ability to detect proteins separated by 2D gel electrophoresis is crucial to its appli-cation in proteomics. Over the years different methods have been developed to visual-ize proteins separated by gel electrophoresis (Rabilloud, 2000) (Fig. 1.7). Althoughdifferent chemistries are used, the methodology involves either labeling the proteinsprior to the separation, labeling the proteins after the first dimension (Jackson et al.,1988; Urwin and Jackson, 1991), or labeling the proteins after the second dimension.Labeling the protein before and after 2D gel electrophoresis has been the dominantapproach to the visualization of proteins.
Prelabeling of Proteins. Prelabeling of proteins prior to 2D gel electrophore-sis is often performed by adding radioisotopically labeled amino acids to the growthmedium of cells to provide in vivo labeling of proteins (O’Farrell, 1975). Typically,35S-methionine is incorporated in the culture medium for the radiolabeling of proteins.The protein mixture is then separated by 2D gel electrophoresis and visualized using afilm or a phosphor imager screen. The radioactivity level used in the in vivo labelingapproach cannot be applied for the study of human and animals.
Another common approach to the prelabeling of proteins is the derivatization ofthe proteins using neutral covalently attached fluorescent dyes. These dyes are cova-lently attached to the proteins prior to 2D gel electrophoresis (Urwin and Jackson,1993). Because they are not charged, these dyes have the advantage of minimally disturbing the isoelectric properties of the proteins. The sensitivity of the approach,however, suffers because of poor absorption and inadequate quantum yields. Novel fluorescent dyes provide nanogram levels of sensitivity for proteins separated by 2D
PROTEIN SEPARATION BY TWO-DIMENSIONAL GEL ELECTROPHORESIS 15

gel electrophoresis (Unlu et al., 1997; Tonge et al., 2001; Yan et al., 2002). One dis-advantage of this approach is the requirement for a fluorescence detection system andthe requirement for an automated spot picker for any further processing of the indi-vidual protein spots.
Postlabeling of Proteins. The postseparation detection of proteins has been by far the most preferred route for the visualization of 2D gel-separated proteins. Inparticular, colloidal coomassie staining and silver staining are the methods of choicebecause of their ease of use and sensitivity. Colloidal coomassie staining typically pro-vides a limit of detection (LOD) at about 25 to 50ng of protein (Smith, 1994; Matsui,1999a), while silver staining routinely provides limits of detection of about 5ng ofprotein (Rabilloud, 1990, 1999; Rabilloud et al., 1994; Blum et al., 1987; Richert et al.,2004).
16 PROTEOMICS: THE BASIC OVERVIEW
(a) (b)
(d ) (e)
(c)
Figure 1.7. Staining approaches for 2D gel electropherogram. Comparison of sensitivities for
different staining methods. A series of 2D gel electropherograms of 400mg of mitochondrial
proteins were stained with (a) Brilliant Blue G in acid alcohol medium, (b) colloidal Brilliant
Blue G, (c) imidazole zinc, (d) silver, and (e) Sypro Orange (detected with a fluorescence laser
scanner). Homologous spots are marked with arrows. Reproduced with permission from
Rabilloud (2000).

Silver staining is the most sensitive, direct visualization tool for proteins separatedby 2D gel electrophoresis; however, it is tedious to manually perform. Instruments havebeen developed to perform automated silver staining and to significantly reduce thetediousness of the approach. Recently, an improved protocol for silver staining has beenreported to provide limits of detection down into the subnanogram range. This wasachieved by carefully selecting the chemical utilized for silver staining and by per-forming an extended rinse of the gel to reduce the background. Each spot on the gelcan contain one or more proteins and can be manually or automatically excised fromthe gel for further analysis.
Fluorescence staining has also been reported for postseparation detection of gel-separated proteins. This technique typically provides a better sensitivity and a widerdynamic range than conventional colloidal coomassie and silver staining (Steinberg etal., 1996a, 1996b, 2000; Steinberg, 1997). The fluorescence-based approach, however,requires the access to a specialized fluorescence-based detection system and access togel cutting robots when postprocessing of the proteins is necessary. Systems are nowcommercially available to perform the scanning of fluorescently labeled gels and theextraction of spots for gels.
Software to Handle Two-Dimensional Gel Electropherogram
Differential displays by 2D gel electrophoresis can be extremely tedious and frustrat-ing when manually performed. The gel can display up to 10,000 spots, and from oneexperiment to another the spots can slightly shift on the pI and MW scale, dependingon post-translational modification (PTM), sample processing, and sample composition.These shifts can become a serious problem for studies that require differential expres-sion of proteins on an extended number of samples. To approach this problem, a fewsoftware packages have been developed for the alignment of multiple spots. The firstchallenge is to accurately detect and localize the positions of thousands of spots on agel. Poor spot detection will affect the number of spots detected and their quantitation.The second challenge is to align multiple gels. This is typically achieved by selectingmarker spots that are common to all the gels, and they are then used to realign the gelsand the position of the spots. Obviously, when more deviations are present from gel togel, then the number of markers required is higher. The issues of quantitation of mul-tiple spots and the display of massive amounts of information also need to be addressed.
Commercial software packages are now available to solve some of these problems. In particular, the Melanie package (Wilkins et al., 1996b) from the SwissInstitute of Bioinformatics (http://www.expasy.ch/ ), the Phoretix 2D software from Phoretix (http://www.nonlinear.com/ ), and Gellab II from Scanalytics (http://www.scanalytics.com/ ) can be used to analyze 2D gel patterns.
PROTEIN PROCESSING
The information provided by 1D and 2D gel electrophoresis is far from being adequateto identify proteins. The observed MW on a gel can be easily off by a few thousand
PROTEIN PROCESSING 17

Daltons. Furthermore, the posttranslation modifications of proteins and the truncationof proteins can drastically affect the observed MW and pI. Therefore, the informationcontained in gels is not conclusive for the identification of a protein, and more infor-mation needs to be extracted for unambiguous identification. How this extra informa-tion could be extracted from a protein stock in a gel spot was another challenge toovercome.
Blot Digestion of Proteins
Obviously, the first approach to the problem would be to remove the protein from thegel. A technique called electrotransfer, or electroblotting, was specifically designed forthis purpose (Patterson et al., 1996; Aebersold et al., 1986, 1987). Once proteins hadbeen separated by 1 or 2D gel electrophoresis, they could be readily transferred to abinding membrane, such as nitrocellulose, by simply sandwiching the gel with a receiv-ing membrane and applying an electric field perpendicular to the plane of the gel. Theproteins contained in the gel migrate toward the anode and encounter the binding mem-brane to which they become attached. The pattern of proteins present on the blot canthen be visualized using a staining method such as coomassie or silver staining. In thismanner, the separation profile on a gel can be transferred to a blot membrane withfidelity and be available for chemical/enzymatic treatment.
Electroblotting was initially used for protein identification using Edman degrada-tion. The works of Aebersold pioneered this approach (Aebersold et al., 1986, 1987).Edman degradation will be introduced below. Basically, the electroblotting approachlinked the gap between Edman degradation and the mainstream approaches for proteinseparation, that is, gel electrophoresis.
In the early to mid-1990s mass spectrometry (MS) became an attractive approachfor the identification of proteins using peptides derived from the protein. The MS tech-niques will be described below. Electroblotting became the method of choice for pro-cessing proteins for MS analysis. The method was modified to allow the enzymaticdigestion of the protein present on the blot. Once the spots of interest on a blot wereexcised, they were treated with a blocking agent such as polyvinglpyrrolidone-40 (PVP-40). The PVP-40 coats the membrane and allows the enzyme solution to freely accessthe blotted protein without binding to the membrane. Interestingly, the action mecha-nism of the enzyme is a combination of two reactions: a solid-phase reaction while theenzyme digests the attached proteins and a solution reaction for the further digestionof the released fragments. The end result is a solution of peptides that has been derivedfrom the blotted protein. This peptide solution is then directly compatible with MSanalysis.
The utilization of blots for protein identification was the technique of choice in themid-1990s; however, it had some obvious limitations. Its foremost limitation was the tediousness and time required to perform the experiment. First, the 2D gel of thelysate of interest had to be produced and then electrotransferred to a nitrocellulose fol-lowed by staining. It was then followed by the excision of the stained spots and the
18 PROTEOMICS: THE BASIC OVERVIEW

blocking of the spots using PVP-40, which involves a large number of repetitivewashes. Finally, the blotted proteins were digested with trypsin. Altogether, the processcould take about 3 to 4 days depending on the number of spots. To curb the tedious-ness, fluidic stations could be used to perform the majority of the postblot processingof the proteins.
The second limitation was the inconsistent quantitative transfer of proteins fromthe gel to the blot. This was apparent when comparing stained 2D gel with a similarstained blot. The rate of transfer of some proteins was high while the rate for other pro-teins was almost nil. The last important limitation was the carryover of PVP-40 duringthe analysis when not enough rinse steps were included after the blocking of the membrane.
In-gel Digestion of Proteins
The application of in-gel digestion of proteins for Edman sequencing had been devel-oped in the early 1990s (Rosenfeld et al., 1992). Its application to the field of proteinanalysis by mass spectrometry was first introduced by Wilm et al. (1996). It was aninstant success, and the method rapidly replaced the electroblotting approach. Its mainadvantage was the significant reduction in the number of processes required after gelelectrophoresis to obtain digest suitable for analysis. As in the blot approach, a lysateis separated by gel electrophoresis. The difference now is that the gel is fixed andstained to highlight the proteins, the spots of interest are excised from the gels, properly rinsed, and then the enzyme solution is added to the gel pieces. The trick tointroduce the enzyme into the gel is to shrink the gel pieces and let them swell in anenzyme solution. After digestion, only a few extraction steps are needed to obtain thepeptides. Obviously, the reduction in labor and the reduction in processes offered bythe in-gel digestion method made it the method of choice for the generation of peptidesfrom proteins separated by gel electrophoresis.
PROTEIN IDENTIFICATION
Edman Degradation
In the early 1960s a technique called the protein sequenator was presented by Edmanand Begg (1967) for the N-terminal sequencing of proteins. This chemical degradationtechnique allowed the extraction of individual amino acids in a cycle-dependant mannerfrom the N-termini of proteins. The retention time observed by high-performance liquidchromatography (HPLC) was then used to identify the individual amino acid sequences.By repeating the chemical degradation cycle, it was possible to obtain the amino acidsequence at the N-terminus of typically up to 20 amino acids. Using this approach, itis possible to painfully de novo sequence a protein or to sequence a sufficient lengthof the protein to be able to clone the gene. The availability of protein and DNA sequence
PROTEIN IDENTIFICATION 19

databases has now facilitated the work and allowed protein identification using limitedN-terminal amino acid sequencing.
Protein Identification by Mass Spectrometry
Mass spectrometry has been used in its different forms for the analysis of proteins aslong as the Edman degradation technique. By today’s standard, mass spectrometry wastedious, slow, and required large amounts of samples. Over the years, however, the ideaof using mass spectrometers to perform protein identification has evolved with theimprovement in instrumentation and in the changes occurring in genomic databases.The introduction of effective matrix-assisted laser desorption ionization and time-of-flight (MALDI-TOF) mass spectrometry and electrospray ionization (ESI) tandem massspectrometry has revolutionized the field. Manufacturers of these instruments have“beefed-up” their efforts to produce more instruments for proteomic purposes. There-fore, when assessing previous reports, it is important to keep in perspective the tremen-dous amount of change that has occurred in recent years (Table 1.3).
MALDI-TOF Mass SpeetrometryMALDI-TOF: An Evolving Instrument. Simultaneous development in the field
of mass spectrometry has allowed rapid and accurate mass measurements of analytesby a technique called matrix-assisted laser desorption ionization (MALDI) and time-of-flight (TOF) mass spectrometry. This technique allows the transfer of peptides froma solid state to the gas phase, while the TOF mass spectrometer rapidly separates pep-tides according to their m/z ratio (Fig. 1.8).
Proteins isolated from 2D gel electrophoresis are digested, desalted, and thenspotted on a MALDI plate for co-crystallization with a saturated matrix solution. Alter-natively, protein digests can be separated by HPLC and eluting peptides deposited ona MALDI plate. The target plate is then introduced in the vacuum chamber of the mass
20 PROTEOMICS: THE BASIC OVERVIEW
TABLE 1.3. Performances of Different Mass Spectrometers for Protein Identification
Sensitivity ID Based ID Based in MS/MS Resolution Cost on MS on M/MS
MALDI-TOF Low 5,000–10,000 Medium Yes Sometimes by PSD
MALDI-Pulsar High 10,000–15,000 Medium Yes YesESI-Triple Low 1,000 Medium No YesQuadrupole
Esi-Ion Trap Medium 1,000–3,000 Low No Yeshigher inzoom scan
ESI-FTMS High >50,000 High Yes Yes but slowESI-Pulsar High 10,000–15,000 Medium No Yesand Qtof

spectrometer. An automated translation stage positions individual spots on the axis ofthe mass spectrometer as well as at the focal point of a laser. A light pulse from a laserbeam (1- to 10-ns pulse) of a wavelength tuned to the absorbance of the matrix isfocused onto a limited area of the spot. The rapid transfer of energy ejects an ioniza-tion plume of material from the plate surface and brings along the peptides into the gasphase. The MALDI plate is biased to high voltages of +20 to +30kV, with respect toa grounded orifice. This induces the positively charged peptides to accelerate towardthe orifice of the flight tube. The peptides are affected by the electric field during thetime that they are between the plate and the orifice. They reach the orifice with a veloc-ity proportional to (z/m)1/2. Once they pass the orifice, the peptides have all the samekinetic energy but not the same velocity because of their different mass. Thus, mole-cules that have an identical charge will therefore have a velocity proportional to theirmasses. Generally, in MALDI the resulting peptide ions are singly charged. Once inthe field-free region of the flight tube, the peptides fly through the tube only accordingto their initial velocity at the orifice. The vacuum in the flight tube is such that the like-lihood of a collision with another molecule while in the flight tube is low. Because thepeptides are usually singly charged, they traverse the flight tube according to their massand hit the detector at different time intervals. The mass analyzer, triggered by the laserpulse, records the signal detected versus the time of flight, which can be readily trans-formed into m/z ratios if the mass spectrometer is properly calibrated.
In principle, a longer tube infers a better separation of the different masses. Colli-sions with gas molecules in the path of the analytes would effectively destroy the separation. Therefore, the longer the path, the larger the vacuum requirement is
PROTEIN IDENTIFICATION 21
Sampleplate
Laser
LensesDetector
Reflectron
(a)
(b)
Figure 1.8. Schematic of a MALDI-TOF mass spectrometer. (a) Schematic of the linear mode.
In the linear mode a portion of the sample is transferred to the gas phase by a pulsed laser.
Once in the gas phase, the charge molecules are accelerated for a short distance and enter
the field-free region of the tube, where they separate according to their m/z ratio. (b)
Schematic of the reflectron mode. The mechanisms are the same as in the linear mode, except
that a reflectron is placed to refocus the ions toward the detector leading to a higher
resolution.

imposed to maintain a path free of possible collisions. This is why you will see thesemass spectrometers equipped with sufficient pumping to achieve 10-9 to 10-10 torr.
A second factor that affects the resolution of the separation is the initial kineticenergy distribution due to the burst of analytes off the MALDI plate. The technique ofdelay extraction of the ion and the reflectron were added to the MALDI-TOF to improvethe resolution, based on a more uniform kinetic energy. The delay extraction acts onthe kinetic energy prior to the separation, while the reflectron acts on the kinetic energydistribution during the time of flight. The delay extraction is simply achieved by introducing a time delay prior to the high-voltage biasing of the MALDI plate. Thisallows the ions ejected from the plate to kinetically cool down providing improved resolution.
The reflectron allows the kinetic refocusing of the ions, which also results in betterresolution. It is normal to obtain a peptide mass accuracy down to 10 to 50ppm and toobtain a 5000 to 15,000 resolution. The reflectron is a piece of hardware that is placedin the path of the ions. Therefore, the design of a MALDI-TOF equipped with a reflec-tron is very different than the conventional MALDI-TOF instrument. Furthermore, different designs have been fabricated; however, the principle remains the same. Thereflectron is a set of ring lenses that are stacked together. Increasingly higher potentialsare applied to the rings. In the time of flight each peptide is represented by a pocket ofions that travel with a small range of kinetic energy (i.e., speed). The ions that are atthe front edge of the pocket have a higher kinetic energy, while the ions at the trailingedge of the pocket have a lower kinetic energy. The fast moving ions penetrate thereflectron first and start to feel the repulsing electric field imposed by the reflectron.Because of their high kinetic energy, they travel further into the reflectron before reach-ing a point of zero kinetic energy. Then they are reaccelerated by the repulsing fieldtoward the entrance of the reflectron. Meanwhile, the other ions also enter the reflec-tron in order of their decreasing kinetic energy. Those ions will travel less of a distanceinto the reflectron before their directions are reversed. As a result, the slow moving ionsare now at the front of the traveling pocket, while the fast moving ions are behind. Allthe ions then travel back in the field-free region of the TOF tube. While traveling, thepockets of ions become focused by the higher speed trailing ions catching up to theslower leading ions. Obviously, the resolution that is achieved is very dependant on the positioning of the detector at the focal point of the reflectron. The pocket of ionswill not have time to focus if the detector is positioned too close to the reflectron. Also, the pocket of ions will start defocusing if the detector is positioned too far from thereflectron.
Different Approaches to Sample Preparation for MALDI. Sample prepa-ration for MALDI is often an art. Numerous protocols have been reported for the spot-ting of the samples. Here we review the most utilized approaches.
Cleanup Prior to Spotting. The utilization of reverse-phase material, either ina column format or loosely packed into a pipet tip, has proven to be a useful approachfor the desalting of samples and their separation from polymers prior to MALDI-TOF
22 PROTEOMICS: THE BASIC OVERVIEW

analysis. The properties, however, of the reverse-phase material and the packing needto be carefully assessed. For example, Ziptips are pipet tips that have a small plug ofextraction material at their distal end. The plug of material is obtained by embeddingdispersed reverse-phase material in a polymeric support. To maintain easy flow of liquidthrough the tip, the reverse-phase beads are well dispersed into the embedding polymerresulting in a low back-pressure. The tips have proven useful for the cleanup of highto mid levels of peptide mixtures. The dispersion, however, of the reverse beads causesthe extraction efficiency to be diffusion limited, that is, the linear flow is too high com-pared with the distance that the peptides have to diffuse to reach the packing material.Therefore, the extraction efficiency drops significantly for lower concentrations ofpeptide mixtures, and it can therefore be a challenge to analyze lower amounts (<100 fmol) of peptide mixtures.
Spotting Approaches. Over the years different sample preparation methods havebeen developed for the analysis of minute amounts of peptides. The most popularmethod has been the dried droplet method (Karas and Hillenkamp, 1988). In thismethod the peptide mixture of interest is dried down and resuspended in an acidi-fied water : organic (acetonitrile or methanol) solution saturated with a-cyano-4-hydroxycinnamic acid. One microliter from this mixture is then deposited onto aMALDI plate and allowed to dry. Although this is a rapid way of preparing samples,it does not provide for the most sensitive analysis of peptides.
A second approach termed the two-layer method was recently introduced for theanalysis of peptides (Dai et al., 1999). First, a solution of a-cyano-4-hydroxycinnamicacid is pipetted on a MALDI plate and allowed to dry to form a microcrystal layer.Then a solution with the analytes and the matrix is pipetted on top of the first layer andallowed to dry. Although this approach is more tedious, it offers a better representationof the peptides, a cleaner spectra, and it can be automated.
Cleanup Post Spotting. A cleanup method can be directly applied on theMALDI plate either with the dried droplet method or the two layer method. The samplecleanup method consists of performing a cleanup procedure right after the spotting.Briefly, a drop of water is added to individual spots on the MALDI plate for a set timeperiod. The water droplet is then blown away, and the spot is allowed to dry againbefore being placed in the MALDI-TOF mass spectrometer. This rinse step allows theextraction of salts and other hydrophilic molecules from the dried crystal. This oftenleads to a decrease in background, therefore an increase in signal/noise ratio. The timingof the rinse is important to avoid unnecessary loss of hydrophilic peptides.
On-Plate Concentration. As mentioned previously, mass spectrometers areconcentration-dependant devices. MALDI is more complicated because the ionizationprocess and the involvement of the matrix are not clearly understood. It appears thatan increase in the analyte concentration on the surface of the MALDI plate mightimprove the signal observed; this, however, would only work well if the sample can besufficiently cleaned up. The amount of sample is limited, so the only way to increase
PROTEIN IDENTIFICATION 23

the concentration is to limit the size of the MALDI spot. MALDI plates were devel-oped with spotting sections of small diameters that are hydrophilic, while the rest ofthe plate is hydrophobic. When a drop of peptide solution is deposited onto the spot,the hydrophobic surroundings and the surface tension force the droplet to take a shapethat limits its contact with the surface. As the droplet dries, it focuses into the smallhydrophilic patch. The end result is the concentration of a large volume into a smallarea on the MALDI plate. In itself, this is not sufficient to provide significant improve-ment because the contaminants, usually salts, are similarly concentrated. The additionof an on-plate cleanup (drop of water method) helps to remove salts while retainingpeptides in the crystal. The drop of water is then blown away.
Protein Identification by MALDI-TOF: A Moving TargetUsing Accurate Protein Mass Measurement. It was believed that protein
identification could be achieved based on the accurate measurement of the protein MW.But, it was quickly realized that the growing size of databases and the accuracy of themass measurement limited the unambiguous identification of proteins based on theirMW. The information carried by the protein MW was insufficient to identify the protein.It was then realized that unambiguous identification of a protein could be readilyachieved by accurately measuring the masses of the peptides contained in a protelyticdigestion of the protein. Clearly, in itself, the mass of an individual peptide derivedfrom a protein is inadequate to identify the protein, although, the masses of a large setof peptides derived from the same protein is often sufficient to identify the protein.MALDI-TOF MS is the method of choice for the measurement of peptide masses;however, MALDI-TOF MS experiments must be carefully designed to preserve themass accuracy. In MALDI-TOF, the ions are accelerated for a short distance, and thenthey freely fly in the TOF tube, sometimes up to a few meters. It is generally assumedthat the acceleration space is constant; however, any errors on the acceleration spaceare propagated in the time of flight and thus affect the accuracy of the measured masses.In reality, the plate fidelity, the positioning, and tilt of the plate holder can slightlychange the acceleration space and, therefore, can affect the mass accuracy. Approacheshave been developed to reduce this phenomenon. This is normally achieved by addingan internal standard to the sample or correcting the masses by scanning an external calibrant near the sample spot on the MALDI plate.
Protein Identification by MALDI-TOF and Accurate Peptide Masses. Theidentification of proteins by MALDI-TOF mass spectrometry is generally achieved bymeasuring the m/z ratio of the peptides predominantly of charge +1. The combinationof accurate peptide mass measurement with the availability of protein sequence data-bases forms the basis of protein identification by MALDI-TOF. Figure 1.9 describesthe principle behind the identification of proteins by MALDI-TOF. This is often calledpeptide mass fingerprinting. The measured masses present in tryptic digests are tabu-lated, and the known contaminants are deleted from the list. The reduced mass list isthen used to search protein databases.
Different software packages have been developed for the identification of proteinsbased on the accurate measurement of peptide masses. The simplest method for scoring
24 PROTEOMICS: THE BASIC OVERVIEW

is to add the number of peptide masses that match with the predicted masses for eachentry in a protein database. The database entries are then ranked according to thenumber of hits. This forms the basis behind software such as PepSea and MS-Fit(http://prospector.ucsf.edu). Typically, these software packages work well for qualityexperimental data.
Mascot originated from the software called MOWSE (Pappin et al., 1993).MOWSE uses more information to make its decision on the score by taking into accountthe protein size and the relative abundance of peptides in the databases. Mascot furtherincorporates probability scoring for the probability that the match between the data andthe entry in the database will be a random event. This score is calculated for every entryin the database. The identification is then established by ordering the proteins with adecreasing probability of being a random match. Mascot can be freely accessed overthe web (http://www.matrixscience.com/) and is also available for commercial purposesthrough MatrixScience.
ProFound (Zhang and Chait, 2000) uses a different approach based on Bayesiantheory to rank the protein sequences in a database by their probability of occurrence.It is an expert system (i.e., it simulates what an expert in the field would do) that usesdetailed information about each protein sequence and empirical information about the
PROTEIN IDENTIFICATION 25
MS spectrum on MALDI-TOF
600 Da 840 Da 1044 Da
1236 Da 1650 Da
Trypsin
Database:MKALSPVRGCYEAVCCLSERSLAIARGRGKSPSAEEPLSLLDD MNHCYSRLRELVPGVPRGTQLSQVEILQRVIDYILDLQVVLAEPAPGPPDGPHLPIQVREGARPGSSERAGWDAAGLPHRVLEYLG
AVAKVELRGTVQPASNFNDDGDAQGLGTDEGAIIXVLTQRSNAQAVEGAGTDESTLIELMATRNNQEIAAINEAYSLEDDLSSDTSGHFRILVSLALGNRDEGPENLTQAVVAETLNKPAFFADRLLALXGGDD
MRWLTPFGMLFISGTYYGLIFFGLIMEVIHNALISLVLAFFVVFA WDLVLSLIYGLRFVKEGDYIALD WDGQFPDCYGLFASTCLSAVIWTYTDSLLLGLIVPVIIVFLGKQLMRGLYEKIKS
Protein
Extrac
t m/z Perform database searching
Figure 1.9. Scheme employed for the identification of proteins based on MALDI-TOF and
peptide mass fingerprinting. A protein of interest is digested with trypsin and the resulting
peptide mixture is analyzed by MALDI-TOF mass spectrometry. The measured m/z ratios are
then used to search protein/DNA databases leading to the identification of the protein. The
matching proteins are ranked according to the number of observed m/z ratios that match to
their predicted tryptic peptide patterns.

distribution of proteolytic peptides that are included in the scoring scheme. ProFoundis also free over the Internet (http://prowl.rockefeller.edu/).
Generally, all these software packages perform well when good-quality spectra areavailable. The ones that provide more advanced scoring schemes perform better whenless information is available or when the quality of the MS spectra is reduced. Regard-less of the software, the identification of the protein depends on the number of peptidesobserved, the accuracy of the measurement, and the size of the genome of the partic-ular species. For smaller genomes, such as yeast and Escherichia coli (E. coli), proteinidentification using the MALDI-TOF mass spectrometer is generally successful. Forlarger genomes the rate of success drops significantly using MALDI-TOF.
Postsource Decay. MALDI-TOF mass spectrometry also offers the possibilityof recording the fragmentation patterns obtained from a peptide. This is achieved usinga technique called postsource decay (PSD). PSD is achieved by increasing the laserpower beyond the value needed to generate ions. The precursor ions are transferredfrom the MALDI plate to the gas phase. The excess energy induces the precursor ions(peptides) to fragment along their backbone. Generally, these ions are not seen in con-ventional MALDI-TOF analysis because of their lower kinetic energy. Fortunately, onthe MALDI-TOF equipped with a reflectron, the lower kinetic energy of peptide frag-ments can be compensated by changing the settings on the reflectron. PSD is typicallyachieved by acquiring spectra for specific mass ranges with different settings on thereflectron. All the spectra are then stitched together to make a full PSD spectrum.
Although PSD seems to be a rapid way of obtaining fragmentation patterns of pep-tides, it seriously suffers in terms of sensitivity. Furthermore, the fragmentation pat-terns are often difficult to discern and are of poor quality. Therefore, PSD has not beenthe method of choice for the generation of peptide fragmentation patterns.
Hybrid Instruments
Conventional MALDI-TOF mass spectrometers can also provide fragmentation pat-terns related to the amino acid sequence of a peptide. This is also done using postsourcedecay; however, the mass selection of the peptide to be fragmented, the sensitivity ofthe approach, and the quality of the MS/MS spectra make it difficult to utilize post-source decay for the routine and rapid generation of MS/MS spectra. Recently, a set ofnovel MS/MS-capable mass spectrometers have been developed based on MALDI ion-ization. These instruments combine the MALDI ionization technique with the frag-mentation of ions by collision-induced dissociation (Shevchenko et al., 2000; Lobodaet al., 2000). For example, the recently introduced MALDI-Pulsar from Sciex is illus-trated in Figure 1.10. This instrument, as its name alludes to, includes a MALDI ion-ization interface followed by a set of quadrupoles and a collision cell. The firstquadrupole is used as an ion guide. It is followed by a second quadrupole, which iseither used as an ion guide, a precursor scan, or for a parent ion selection. The firstquadrupole is followed by a collision cell that can be used to fragment ions by collision-induced dissociation. A pulsing grid set at a 45° angle is positioned after thecollision cell and deflects the ions upward into a TOF mass analyzer equipped with a
26 PROTEOMICS: THE BASIC OVERVIEW

reflectron. Although a pulsing laser is still used to generate ions off the MALDI plate,it is not used for the timing and correction of the masses of the observed ions.
In this design, the ionization of the sample is decoupled from the acceleration ofthe ions into the TOF tubes. Furthermore, significant collisional cooling is present inthe first quadrupole, reducing the distribution of the kinetic energy of the ions. There-fore, the geometry of the plates does not affect the mass accuracy of the instrument.This is a significant difference over conventional MALDI-TOF in which great care mustbe taken regarding the plate geometry. This means that internal or close external cali-brants are not necessary to maintain the mass accuracy of the MALDI-Pulsar system.It also means that totally different plate designs can be constructed.
The Pulsar also allows peptide selection and efficient fragmentation by collision-induced dissociation in the collision cell. Collision-induced dissociation is more reli-able than postsource decay for generating fragmentation patterns. MALDI ionizationpredominantly provides peptides of charge 1+. The fragmentation of 1+ ions generateslower quality fragmentation patterns than what is usually obtained for 2+ and 3+ ions.Therefore, this hybrid approach offers significant advantages over the conventionalMALDI-TOF in terms of its efficient fragmentation patterns. It also offers advantagesover the ESI-MS/MS for the rapid screening of samples.
Electrospray Ionization Mass Spectrometry. Electrospray ionization is alsoa very popular approach to introduce protein and peptide mixtures to mass spectrom-eters. Typically, ESI is used in conjunction with a triple quadrupole, an ion trap, or ahybrid quadrupole-TOF mass spectrometer. ESI is mainly popular because it providesa direct interface between the mass spectrometer and the atmospheric pressure. It can
PROTEIN IDENTIFICATION 27
Sampleplate
Laser
Quadrupolemass filter
Collision cell
Pulsingaccelerator
Detector
Reflectron
Figure 1.10. Schematic of a MALDI-Pulsar mass spectrometer. A portion of the sample is
transferred from the MALDI plate to the gas phase by a pulsed laser. Once in the gas phase,
the charged molecules go through a quadrupole, which can be used as a mass filter, lenses,
or a mass analyzer. They then enter a collision cell followed by a pulsing plate, which pulse
part of the beam of ions into the perpendicular TOF. They enter the field-free region of the
TOF in which they separate according to their m/z ratio. A reflectron is employed to refocus
the ions and to provide better resolution. This instrument is capable of providing MS spectra
and good quality MS/MS spectra generated by collision-induced dissociation.

also be readily coupled to separation techniques such as HPLC, liquid chromatography(LC), and capillary zone electrophoresis (CZE), or it can be used for the continuousinfusion of samples. Until the introduction of the MALDI-Pulsar, the ESI-based massspectrometers were the only viable approach for the generation of MS/MS spectra. Fur-thermore, ESI produces more multiply charged ions that provide richer MS/MS spectra.
Principle. Electrospray ionization (Fenn, 1990) allows analytes to transfer fromthe liquid phase to the gas phase at atmospheric pressure. Generally, the ionizationprocess is achieved by applying an electric field between the tip of a small tube andthe entrance of a mass spectrometer. The electric field forces the charged liquid at theend of the tip to form a cone, called Taylor cone, that minimizes the charge/surfaceratio. Droplets form at the end of the cone and move toward the entrance of the massspectrometer. Different theories have been put forward to explain what happens afterthe droplets have been formed and how the transfer of the analytes to the gas phase isachieved. The most popular explanation is that the liberated droplets go through a repet-itive process of solvent evaporation, whereby they fragment into smaller droplets toreduce the charge density on them. This leads to a large number of droplets of shrink-ing sizes until the solvent has disappeared; thus the analytes are left in the gas phase.Furthermore, as the droplets shrink, the pH in the droplets decreases and facilitates theprotonation of the analytes.
Mass Spectrometer and Information. The most important advantage of ESIis that it can be readily coupled online with separation techniques. This has been illustrated over the years by the numerous development of methodologies based on separation techniques coupled to electrospray mass spectrometers. The variety of applications, separation techniques, and mass spectrometers utilized with ESI can beconfusing to those new to the field. Therefore, in the next few sections we will intro-duce the different mass spectrometers with their respective limitations, the differentseparation techniques that are specifically used for proteomics, and the generation oftandem mass spectra.
Mass Analyzers Utilized with Electrospray Ionization in Proteomics.There has been a flurry of novel commercial mass spectrometers over the last 5 years.This is in part related to the constant demand for newer and better mass spectrometersimposed by the biotechnology/pharmaceutical sectors. Even though the number of massspectrometers is increasing, and the confusion related to their application in proteomicsis building even faster, it is still possible to make a logical assessment of their func-tions, advantages, and limitations.
Triple Quadrupole Mass Spectrometer. The first mass analyzer that was utilizedfor proteomic studies is the triple quadrupole mass spectrometer. A quadrupole massanalyzer consists of four rods placed at equidistance as if they were placed on thesurface of a cylinder. The Mathieu equation was derived to describe the motion of acharged molecule in an electric field. It is also applicable to describe the motion ofcharge molecules in the triple quadrupole mass spectrometer. Electric fields can be con-
28 PROTEOMICS: THE BASIC OVERVIEW

stant [direct current (DC)] or variable [alternating current (AC); different amplitude andfrequency]. The Mathieu equation takes into account the combination of DC and ACfields. The combinations that are possible are such that the quadrupole can be used forthree functions. The combination of a DC and radio frequency (RF) potential trans-forms the quadrupole into a mass filter to transmit a specific m/z ratio. The applicationof a RF-only mode will set the quadrupole as an ion guide, while the application of aDC-only mode transforms the quadrupole into a lens element. For every mass, there isa region of stability for the DC, RF amplitude, and frequency. Therefore, the resolu-tion of the instrument and the ion transmission (sensitivity) are intimately linked.Increasing the resolution decreases the number of ions transmitted. Changing the shapeof the quadrupole rods affects the electric field and can also improve the resolution.The mass filter mode and the RF-only mode are the two most common applications ofthe quadrupole. Furthermore, most triple quadrupoles have been fabricated using cylin-drical rods for simplicity. More recently, designs for hyperbolic rods have allowedimproved resolution, and they have been introduced in the TSQ-quantum (Thermo-Finnigan):
(1.1)
where a and b are constant and the f(t) is the sinusoidal function of time. This equa-tion is called the Mathieu equation. In a quadrupole mass analyzer only two axis ofdirection are being affected by the field.
The triple quadrupole mass spectrometer consists of three subsequent sets ofquadrupoles, positioned one after the other in a linear fashion toward the detector (Fig.1.11). The functions of the first and third quadrupoles are either as mass filters or asion guides. The second quadrupole is typically run in the RF-only mode (i.e., ion guide)and modified to allow the introduction of gas. It is used for collision-induced dissoci-ation of charged molecules. This combination of quadrupole (q0), collision cell (q1),and quadrupole (q2) allows a multiplicity of experiments to be performed.
d x dt f t x2 2 0+ + ( )[ ] =a b
PROTEIN IDENTIFICATION 29
Figure 1.11. Triple quadrupole mass spectrometer for the analysis of peptides. A set of two
experiments is performed on the triple quadrupole mass spectrometer for peptide analysis.
In the first pass an MS spectrum is acquired to detect the m/z ratio of the analytes. Then, a
peptide corresponding to a specific m/z ratio is selected in a second experiment, isolated in
q1 and fragmented in the collision cell. The resulting fragments are separated in q3 leading
to an MS/MS spectrum.

Although numerous experiments can be concocted with a triple quadrupole massspectrometer, only two serial experiments are performed for peptide identification. Thefirst experiment consists of running q0 and q1 in RF-only mode while scanning the m/zon q2 (DC and RF). In this fashion, q0 and q1 let the positively charged analytes passthrough while q2 continuously scans the m/z, generating an MS spectra (signal versusm/z) for the positively charged ions present in a proteolytic digest.
The second set of experiments, called MS/MS, consists of selecting and frag-menting an ion followed by the separation of the generated daughter fragments. Thisis achieved using q0 as a mass filter to allow only a narrow m/z window around theselected ion to pass. A small amount of neutral gas is then added to q1, while the poten-tials, applied to lenses, are changed to provide increased kinetic energy to the ions enter-ing q1. The ions collide with the small gas molecules and fragment by collision-induceddissociation. The generated ions are then separated by q2. The end result is an MS/MSspectrum that contains the selected ion fragmentation patterns.
The combination of both experiments (MS and MS/MS) allows peptides to bedetected, selected, and fragmented. Typically, the triple quadrupole mass spectrometeris either manually or automatically cycled through MS and MS/MS acquisition.
The application of the triple quadrupole mass spectrometer in proteomics was sup-planted by the introduction of more sensitive instrumentation such as ion trap massspectrometers and hybrid mass spectrometers. The advantage of the triple quadrupolemass spectrometer with collision-induced dissociation is the efficient conversion of pre-cursor ions into product ions. The disadvantages of the triple quadrupole mass spec-trometer are its low resolution, the mass discrimination (i.e., peak height dependencyon mass), the narrow window, and the strong mass dependency on collision energy forefficient fragmentation of peptides. Generally, the information generated in MS modeis too low of a resolution to be useful for database searches. Furthermore, the massaccuracy is generally too low to allow adequate de novo sequencing of proteins whenthe identification by database searching fails.
Ion Trap Mass Spectrometer. The second analyzer introduced for proteomicstudies was the ion trap mass spectrometer. The ion trap mass spectrometer utilizes acombination of electrodes for the accumulation of ions in a space defined by the shapeof the electric field present in the trap. Similar to the triple quadrupole mass spec-trometer, the ion trap mass spectrometer follows the Mathieu equation. Because of theshape of the electrodes and the definition of the electric fields, the resolution obtainedon the trap can be higher than on conventional quadrupole instruments. An example ofa complete ion trap mass spectrometer is described in Figure 1.12. It consists of a heatedstainless steel capillary followed by a skimmer, an ion guide, by the ion trap, and adetector. All of these parts are maintained under vacuum. The ion guides have a dualfunction: to guide the ions toward the ion trap and to gate the ions into the trap. Thenumber of ions present in the trap is critical and needs to be controlled. Otherwise, aphenomenon called space charging can occur that causes the performance of theinstrument to be distorted. The ion optic is used to control the injection of ions into thetrap. The reversal of the polarity applied to the optics deviates the ions from their pathsand prevents the ions from entering the trap. In reality, a scan from an ion trap consists
30 PROTEOMICS: THE BASIC OVERVIEW

of at least two experiments. In the first experiment a short burst of ion is injected intothe trap and then ejected to the detector. The signal observed by the detector is used toautomatically calculate the maximum allowable injection time at which space charg-ing can still be avoided. Then the ion optics are open to inject the ions into the trap forthe calculated injection time. The ions injected into the trap are not stationary but havean orbit that resembles a boomerang shape. Depending on the m/z ratio of the ions, theorbit will occupy more or less space in the trap. Once enough ions have been accu-mulated, they can be sequentially ejected from the trap by changing the RF amplitudeapplied to the ring electrode. This creates instabilities in the orbits of specific ions,pushing them further away from the center of the trap, and finally drawn to the ejec-tion point toward the detector. The lower m/z ions are ejected at a lower RF amplitude,while the higher m/z ions require higher RF amplitudes. Typically, the RF amplitude iscalibrated using analytes of well-defined masses.
Ion ejection and ion fragmentation can be achieved by resonance excitation. Thisapproach consists of creating a resonance effect in the orbit of the ions to increase itsaxial kinetic energy and to increase the axial dimension of the orbit. Resonance exci-tation is achieved by applying a small DC voltage to the endcap electrodes at the sametime as applying an RF to the ring electrode. This creates a cumulative increase in the kinetic energy of the selected ions, thus leading to an unstable orbit and ejection. Furthermore, the increased kinetic energy can be funneled to fragment the selected ionsby introducing a small amount of inert gas into the trap.
The operation of the ion trap mass spectrometer in MS mode consists of a rapidscan for automatic gain control, followed by the timed injection of ions, and finally thescanning of the RF amplitude to successively eject the ions from the trap. The end resultis an MS spectrum with the RF amplitude on the bottom axis, which then can be con-verted into m/z by calibration.
The operation of the ion trap mass spectrometer in MS/MS mode consists of arapid injection/ejection for automatic gain control, a timed injection of ions and an ejec-
PROTEIN IDENTIFICATION 31
Figure 1.12. Schematic of the ion trap mass spectrometer. The schematic of the trap illus-
trates how the ions are guided to the trap and how the gating approach is used to suffi-
ciently fill the trap prior to MS and MS/MS experiments.

tion of undesirable ions (except a preselected mass window), followed by a resonanceexcitation of the selected peptide in the presence of small gas molecules, and, finally,by a scanning of the RF amplitude to successively eject the fragmented ions from thetrap. The end result is an MS/MS spectrum. Although the fragmentation of ions is alsoobtained by collision-induced dissociation, the quality of the MS/MS spectrum is dif-ferent than the one obtained on a triple quadrupole mass spectrometer. This can beexplained by the fact that only the selected ions are sensitive to the RF and to the res-onance excitation; therefore, once fragmentation occurs, the resulting fragments are ofdifferent m/z and are invisible to the RF/resonance excitation. This is not the case fortriple quadrupoles because all the generated charged fragments are still subjected to theacceleration voltage and can gain sufficient kinetic energy to proceed into further collision-induced dissociation.
The ion trap mass spectrometer has seen wide acceptance in proteomic applicationmainly due to its level of automation, sensitivity, and cost. The information providedin MS mode is insufficient for protein identification based solely on peptide masses.The information provided by MS/MS spectra is, however, generally sufficient to iden-tify proteins by database searching. De novo sequencing of peptides is also difficult onion trap mass spectrometers due to its low resolution and its lower mass cutoff inMS/MS mode.
More recently, new linear-type ion trap mass spectrometers have been introduced.These offer a larger trap space allowing wider dynamic range as well as better sensi-tivity and resolution over conventional traps. Furthermore, some of these instrumentscan be operated either as a trap or as a triple quadrupole mass spectrometer (QTrapfrom MDS-Sciex).
Ion Cyclotron Mass Spectrometer. The third analyzer is the ion cyclotron Fouriertransform mass analyzer (Comisarow and Marshall, 1974). At the basic level this analyzer is also an ion trap mass spectrometer. It typically consists of an ion source,followed by an ion guide, and, finally, by a Fourier transform cell contained in a super-conducting magnet (Fig. 1.13). As in the ion trap mass spectrometer, the purpose of theion guide is to focus the ions and transfer them into the Fourier transform cell. In somedesigns the ion guide is also utilized to perform the accumulation and selection of ions,for example, using a fragmented quadrupole before pulsing them into the trap. Thepurpose of the superconducting magnet is to provide a uniform magnetic field in thetrapping region of the cell. The cell itself forms a box made of two detector electrodesfacing each other, another set of two RF electrodes facing each other, and a third setconsisting of trapping plates. In the cyclotron, the ions have to pass through significantfringing fields created by the superconducting magnet before progressing into the trap.The ions that enter the Fourier transform cell are trapped by the magnetic field and thetrapping plates. Furthermore, once in the trap, they will be limited only to circularorbits. It turns out that every ion of a specific mass and charge has a different cyclotronfrequency, defined by:
(1.2)w zm= -b 1
32 PROTEOMICS: THE BASIC OVERVIEW

where w is the cyclotron frequency in radians per second, b is the magnetic fieldstrength in tesla, z is the charge, and m is the mass of the ion. This equation is onlyvalid once the ions are in orbits, but the ions do not spontaneously spring into the orbits.By applying an oscillating electric field that corresponds to the cyclotron frequency ofthe ions to the two opposite electrodes of the cell, a cyclotron resonance can be induced.This cyclotron resonance induces the ions to travel into an increasing circular orbit.After a short time, the electric field is turned off, and the ions reach a stable orbit deter-mined by their m/z ratios and the magnetic field. The stabilization and resolution of different circular orbits require a very homogeneous magnetic field created by a superconducting magnet. Typically, the cyclotron resonance is provided by a sine wavesignal generator. Ions of different m/z ratios have different resonance frequencies, andthey will only be accelerated if the right resonance frequency is applied to the electrodes.
The ions in orbit pass by the electrodes and induce a small, but detectable, currentat the electrode, called the image current. The end result of the motion is an alterna-tive current in phase with the frequency of the ion orbits. Furthermore, the amplitudeof the image current is proportional to the number of ions in orbit. An amplificationsystem is used to transform the small AC signal into a larger and easier signal to process.
Obviously, this would be a relatively useless approach if only one ion could betrapped and detected at a time. It turns out that in the beginning of the ion cyclotrondesign, the ions were individually detected, but it could take up to 20min to acquire afull MS scan. The twist around this problem is to careful look at Eq. (1.2). If all the
PROTEIN IDENTIFICATION 33
Figure 1.13. Schematic representation of a Fourier transform mass spectrometer. The
schematic illustrates the utilization of the quadrupole as ion guide. The trap consists of an
open penning trap inserted into the bore of a superconducting magnet. A set of electrodes
in the trap is used to bring the ions to their cyclotron frequency. A second set of electrodes
is used to measure the frequencies.

ions could be accelerated into their respective orbits, they would all have a resonancefrequency related to their m/z ratio. Therefore, the induced current would be a com-posite of all the currents induced by the ions at their respective frequencies. Clearlythis is a signal processing problem that can be handled by Fourier transform analysisto extract each individual signal from the composite.
Today, Fourier transform mass spectrometry (FTMS) spectra are rapidly acquiredby first activating all the ions with a sweep of the RF to accelerate all the ions. Thetransient image current (due to the multitude of m/z) is accumulated, and the MS spec-trum is reconstructed by the Fourier transform. Although the FTMS instrument is theultimate choice in terms of resolution and sensitivity, it has not seen widespread accept-ance in proteomics. In the past, most cells were designed to trap a defined fraction ofthe ion beam. This means that the dynamic range of the cell was limited. Methods weredeveloped to increase the ion density in the ion beam by trapping ions and by the pulsedinjection of ions using fragmented quadrupoles prior to the cyclotron. Again, the chal-lenge is to have enough ions for detection while avoiding space charging. For mostreal-life samples this can still be an issue forcing the mass accuracy to be above the 1to 1.5ppm level. The cost of FTMS instruments and their robustness have also beenserious issues. The information, however, provided in MS mode is often enough forprotein identification based solely on accurate peptide masses. The information provided in MS/MS mode can be used for database searches or for de novo sequenc-ing of proteins; however, the generation of MS/MS fragments by collision-induced dis-sociation in the trap is relatively slow in FTMS and precludes its utilization for rapidanalysis.
Recently, hybrid instruments that combine external selection and fragmentationsof ions have been developed. For example, Thermo-Finnigan developed a hybrid linearion trap coupled to an FTMS. The advantage of this approach is the rapid fragmenta-tion and analysis of peptides. As the fragmentation is performed in the linear trap, thereis no need to wait for long ion cooling period in the FTMS. Other types of hybrid FTMShave been introduced by IonSpec and Bruker.
Hybrid Mass Spectrometers. The last analyzer is the hybrid quadrupole time-of-flight mass spectrometer. The Pulsar mass spectrometer from Sciex and the Qtof massspectrometer from Micromass are two examples of hybrid instruments. The Pulsar uti-lized with ESI is the same as the one previously described for the MALDI-Pulsar. Itutilizes an ESI source instead of a MALDI source. Please refer to the MALDI sectionfor the description of the Pulsar instrument.
Techniques to Introduce Peptide Mixtures to ESI-MS/MS. The MALDI-TOF mass spectrometry is definitely a high-throughput platform for the identificationof proteins. So why rely on the more cumbersome and lower-throughput ESIapproaches? ESI provides multiply charged peptides that can be efficiently fragmentedby collision-induced dissociation. The MALDI-TOF provides singly charged peptidesthat are more difficult to fragment even when collision-induced dissociation is avail-able. Furthermore, ESI can be readily coupled with infusion and concentration/separa-tion techniques. Hence, intense efforts have been focused in recent years on the
34 PROTEOMICS: THE BASIC OVERVIEW

development of infusion and separation techniques for efficient analysis of proteindigests. These techniques differ in sensitivity, the handling of contamination, the qualityof the MS/MS spectra, and the throughput. In the following sections we will reviewthe different approaches to sample introduction, their disadvantages, and their advantages.
Continuous-Infusion ESI-MS/MS. Within the last 10 years, ESI has become com-patible with the analysis of low-level protein digests. The main challenge was to makethe flow and concentration detection of conventional electrospray approaches compat-ible with the volume and concentration that were obtained with blot, or in-gel diges-tion of separated proteins. Conventional electrospray requires a few microliters/minuteflow rate to be stable, while the final volume of a digest is in the low microliter levels.Therefore, efforts were placed in developing new “lower-flow” versions of the elec-trospray process. The microelectrospray (100 to 500nL/min), the nanoelectrospray (1to 100nL/min), and the picoelectrospray (<1nL/min) methods were developed. Theyall have the reduction of the flow requirement in common by reducing the internal and external diameter of the sprayer. The introduction of these novel electrosprayapproaches has greatly facilitated the analysis of protein digests by providing longer analytical time windows, better ionization, and better transfers to the mass spectrometer.
In particular, the “low-flow” requirement of the nanoelectrospray became rapidlyattractive for the identification of proteins based on the continuous infusion of a sample(Shevchenko et al., 1996a, 1996b, 1997). From as little as 1 ml, an analytical time of30min to 2h could be easily obtained. This would leave plenty of time to acquire good-quality MS spectra, to select large number of ions, and to successively generate theirMS/MS spectrum. Furthermore, when the nanoelectrospray technique was introduced,most mass spectrometers did not provide automated control of the different experiments(i.e., data-dependant experiments), thus frequent user interventions were required forthe analysis of peptides (Shevchenko et al., 1997). This means that on the mass spec-trometers, the operator had to generate and interpret the MS spectrum, select the peptides from the MS spectrum, switch the mass spectrometer to collision-induced dis-sociation, and then successively generate the MS/MS spectrum of the ions by manu-ally changing the parameters for every ion. Even for the most experienced user, thiscan easily take 5 to 15min to perform per peptide.
In the continuous-flow infusion nanoelectrospray, the peptide mixture of interestis inserted into a glass needle of 1mm in diameter that has been pulled to a closed andtapered end using a pipette puller. Furthermore, the pulled needles are also coated witha layer of conductive material such as gold, to which a high voltage is applied (Fig.1.14). The needle is installed in front of the mass spectrometer, and a slight pressure isapplied. Then, the end of the needle is opened by touching it against the front plate ofthe MS, producing an open tip of only 1- to 10-mm inner diameter and a slightly biggerouter diameter. Alternatively, a nanospray needle that is tapered down, but not closed,can also be purchased. The peptide mixture is then continuously delivered at the endof the needle by a gentle gas pressure. The peptide solution that reaches the tip of thenanoelectrospray needle is electrosprayed into the mass spectrometer at low flow rates
PROTEIN IDENTIFICATION 35

(few nanoliters/minute). Roughly 30min to 1.5h analysis can be performed on 1 ml ofsample.
Separation Coupled to ESI-MS/MS. Electrospary ionization can also be coupledwith separation techniques. This is often preferable for low levels of samples and forcontaminated samples. Furthermore, separation techniques are readily automatable,while the nanoelectrospray approach has evaded automation due to its inherent skillrequirement. Separation techniques offer the advantage of concentrating the analytesinto shorter and separated analytical windows. While nanoelectrospray presents all theanalytes at the same time to the mass spectrometer, separation systems subsequentlypresent the analytes to the mass spectrometer; however, a very narrow analyticalwindow (typically 1 to 30s) is available for every analyte, during which all mass spec-trometric measurements for an analyte must be performed.
Automated Mass Spectrometers. Evidently, the manual triggering of the massspectrometer, as conventionally done in nanoelectrospray, is not possible with separa-tion techniques. Therefore, the utilization of an automated mass spectrometer is essen-tial for the success of these experiments. A set of standard data-dependent features hasemerged. (1) The mass spectrometer should offer the automated selection of precursorions based on a threshold or a signal-to-noise ratio. (2) The nth-most intense ion shouldbe selectable for fragmentation as predefined by the user. (3) A static exclusion list ofions should be predefinable. The static exclusion list allows the exclusion of knowncontaminants, such as clusters, trypsin autolytic peptides, and other known peptides.(4) The ions for which m number of MS/MS spectra have been generated should beadded to a dynamic exclusion list until their intensity in MS mode falls below a thresh-old value or until a time period has elapsed. The dynamic exclusion of ions allows theselection of the next most intense ion for the next round of MS/MS spectra. (5) Thedynamic isotope exclusion is also an important option, especially for higher resolutioninstruments. This feature ensures that the isotope peaks from an ion do not trigger the
36 PROTEOMICS: THE BASIC OVERVIEW
Figure 1.14. Schematic representation of the nanoelectrospray analysis of peptide mixtures.
The samples of interest are pipetted into a nanoelectrospray needle. The needle is then
mounted in front of the mass spectrometer. The distal end of the needle is open by applying
a slight gas pressure at the other end of the column and gently touching the front plate of
the mass spectrometer. Once, the open needle is positioned to electrospray into the mass
spectrometer.

acquisition of an MS/MS spectrum. (6) The exclusion of charge states, such as the 1+ions, can also be convenient because it avoids the generation of MS/MS spectra for 1+ions, which are typically not very informative. (7) The automated selection of frag-mentation energy is an important aspect for adequate fragmentation of peptides.Although most mass spectrometers utilize collision-induced dissociation to fragmentpeptides, the ways in which the kinetic energy is ascribed to the precursor ion are dif-ferent. In triple quadrupole and hybrid quadrupole TOF mass spectrometers, the frag-mentation pattern is only adequate in a limited kinetic energy range. Excess energyincreases the internal fragmentation of the precursors and causes poor transmission ofions through the collision cell, thus resulting in a poor-quality MS/MS spectrum. There-fore, the automated adjustment of the collision energy is an important feature on thesemass spectrometers. The fragmentation pattern is less sensitive to the kinetic energy onthe ion trap and cyclotron mass spectrometers, as long as sufficient energy is provided.Therefore, the automated adjustment of the collision energy is less important in ion trapand cyclotron mass spectrometers.
High-Performance Liquid Chromatography–MS/MS. High-performance liquidchromatography has been the technique of choice for the separation of analytes onlinewith ESI mass spectrometers (LaCourse, 2000). In reverse-phase mode, HPLC con-centrates and separates analytes according to their hydrophobicity. Different approacheshave been developed to introduce peptides into a mass spectrometer by HPLC. Theyall have in common peptide solutions that are loaded and separated on an HPLC columnmade of C18-like material. They differ, however, in terms of their flow rates, theirsample paths, robustness, and sensitivity.
Conventional HPLC. Conventional microbore HPLC coupled to ESI-MS is awell-established approach for the identification of protein levels higher than picomoles(Hunt et al., 1981, 1986; Gibson and Biemann, 1984). Microbore HPLC is usuallyachieved using a 0.3-mm inner diameter (i.d.) HPLC column installed on a low-flowHPLC system. The flow rate generated through these columns is typically in the lowmicroliter per minute range. The integration of an autosampler capable of handling lessthan 10 mL of sample completes the automation of the procedure. Therefore, sequentialintroduction, separation, and analysis of protein digests on this automated system canbe routinely performed.
Microflow HPLC. High-performance liquid chromatography is a concentratingtechnique, while mass spectrometry is a concentration-dependent device for constantflow rates. Therefore, improving the concentration of analytes delivered to the massspectrometer provides better sensitivity. To improve the concentration when a limitedamount of analytes is available, only two approaches can be taken. The first approachconsists of improving the separation and decreasing the peak width of the eluting ana-lytes. Although this is feasible, practically it does not provide sufficient improvementin sensitivity. The second approach consists of decreasing the size and flow rate of thecolumn. For example, reducing the size of an HPLC column from 1mm to 100 mm indiameter offers an improvement by a factor of 100 in the concentration of the analytes.
PROTEIN IDENTIFICATION 37

This is a very attractive alternative for low-level samples. It is important to keep inmind that the HPLC theory also predicts that the volume amount of injected analytesshould be correspondingly reduced. In reality, there is a tendency to disregard thiswarning and to inject as much volume as possible at the price of losing the lower affin-ity analytes.
Although attractive, low-flow HPLC (<200nL/min) was not directly compatiblewith conventional electrospray. Earlier attempts to couple low-flow HPLC with con-ventional electrospray interfaces by using sheath liquid were successful; however, theydid not demonstrate the expected improvement in sensitivity. Fortunately, microelec-trospray interfaces compatible with the low-flow technique provided by m-HPLCcolumns were developed, and, these greatly improved the usefulness of this technique(Chervet et al., 1996; Yates et al., 1996).
Fabrication of Columns. Recently, microcolumns (150 mm i.d. or less) havebeen commercially available; however, the range of available packing materials andthe cost of these columns are often limited. Therefore, it is still common to fabricatein-house columns. Two standard techniques have been developed for the fabrication ofmicrocolumns.
The first technique consists of fabricating a column in a capillary tubing with aconstant inner diameter. In this design, small borosilicate beads are dry packed at theend of a capillary tubing of 50 to 150 mm i.d. by tapping the capillary in an aliquot ofbeads. Typically, about 1mm of the capillary tubing is filled with beads. The end thatcontains the beads is rapidly sintered in a Bunsen burner. This results in the formationof a small porous frit at the end of the capillary tubing. It takes some practice to appro-priately sinter the beads. The packing material for the column is pressure forced at theother end of the capillary in the form of a slurry. This requires the utilization of a bombthat can be pressurized up to a few 1000psi. Alternatively, the slurry can be installedin a large volume union and pushed into the column using an HPLC pump. The pres-sure is operated until the required length of column packing is achieved; then it is slowlyreduced to atmospheric pressure. It also helps to place the part of the column beingpacked in a sonification bath. The end result is a packed capillary column (typically 5-to 10-cm of packing) terminated by a frit. The disadvantage of this approach is that itdoes not include a microelectrospray needle. Typically, the fritted end of the column isinstalled in a low dead-volume union connected to a micro-ESI needle. To minimizethe band broadening, a short needle that has a smaller inner diameter than the capillarycolumn and a reduced diameter at the tip (5- to 15-mm opening) is utilized to generatethe electrospray (see Fig. 1.15).
The column can be directly formed in a microelectrospray needle to avoid the dead-volume issues of the packed capillary approach. This requires a frit of some sort to befabricated in the tip of a microelectrospray needle. Typically, a needle of 50 to 150 mmi.d., sharply terminated at the tip to 5 to 15 mm i.d., is used for the fabrication of thecolumn. These needles are made from a capillary tubing that is stretched using a laserpipette puller. Then again, the needle can be pulled by placing a capillary tubing in avertical position, attaching a weight to it, and heating a section of the capillary with aflame. Both of these needle pulling techniques can be tedious to perform, while creat-ing a frit at the end of the needle can be even more challenging. Therefore, the best
38 PROTEOMICS: THE BASIC OVERVIEW
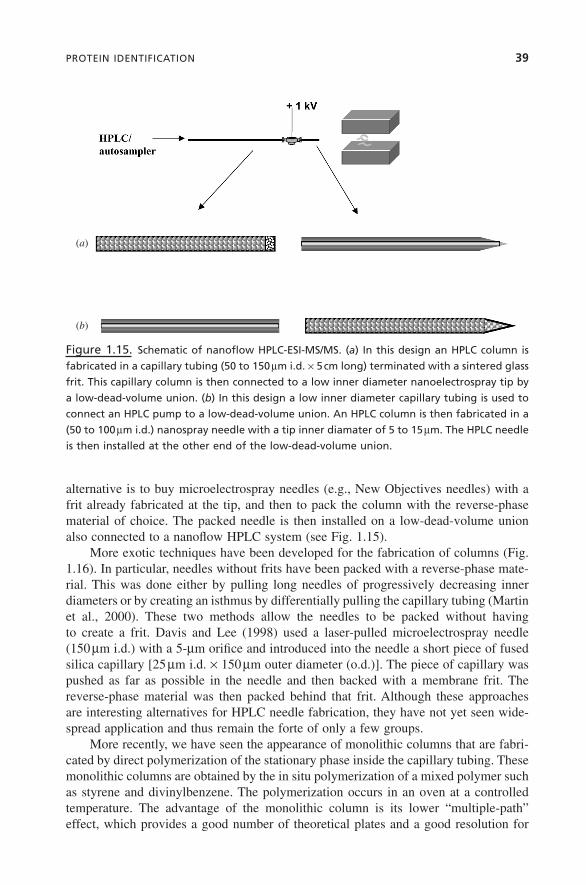
alternative is to buy microelectrospray needles (e.g., New Objectives needles) with afrit already fabricated at the tip, and then to pack the column with the reverse-phasematerial of choice. The packed needle is then installed on a low-dead-volume unionalso connected to a nanoflow HPLC system (see Fig. 1.15).
More exotic techniques have been developed for the fabrication of columns (Fig.1.16). In particular, needles without frits have been packed with a reverse-phase mate-rial. This was done either by pulling long needles of progressively decreasing innerdiameters or by creating an isthmus by differentially pulling the capillary tubing (Martinet al., 2000). These two methods allow the needles to be packed without having to create a frit. Davis and Lee (1998) used a laser-pulled microelectrospray needle (150 mm i.d.) with a 5-mm orifice and introduced into the needle a short piece of fusedsilica capillary [25mm i.d. ¥ 150mm outer diameter (o.d.)]. The piece of capillary waspushed as far as possible in the needle and then backed with a membrane frit. Thereverse-phase material was then packed behind that frit. Although these approaches are interesting alternatives for HPLC needle fabrication, they have not yet seen wide-spread application and thus remain the forte of only a few groups.
More recently, we have seen the appearance of monolithic columns that are fabri-cated by direct polymerization of the stationary phase inside the capillary tubing. Thesemonolithic columns are obtained by the in situ polymerization of a mixed polymer suchas styrene and divinylbenzene. The polymerization occurs in an oven at a controlledtemperature. The advantage of the monolithic column is its lower “multiple-path”effect, which provides a good number of theoretical plates and a good resolution for
PROTEIN IDENTIFICATION 39
(a)
(b)
Figure 1.15. Schematic of nanoflow HPLC-ESI-MS/MS. (a) In this design an HPLC column is
fabricated in a capillary tubing (50 to 150mm i.d. ¥ 5cm long) terminated with a sintered glass
frit. This capillary column is then connected to a low inner diameter nanoelectrospray tip by
a low-dead-volume union. (b) In this design a low inner diameter capillary tubing is used to
connect an HPLC pump to a low-dead-volume union. An HPLC column is then fabricated in a
(50 to 100mm i.d.) nanospray needle with a tip inner diamater of 5 to 15mm. The HPLC needle
is then installed at the other end of the low-dead-volume union.
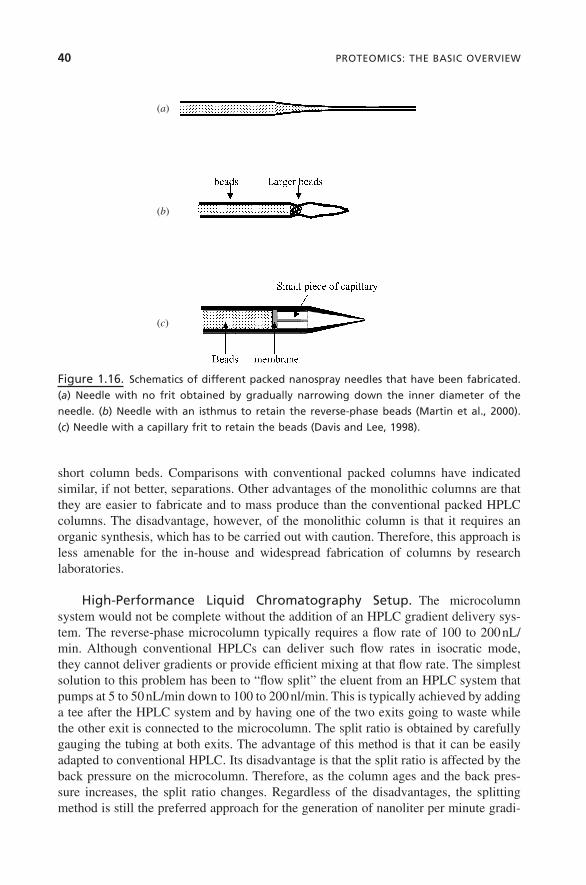
short column beds. Comparisons with conventional packed columns have indicatedsimilar, if not better, separations. Other advantages of the monolithic columns are thatthey are easier to fabricate and to mass produce than the conventional packed HPLCcolumns. The disadvantage, however, of the monolithic column is that it requires anorganic synthesis, which has to be carried out with caution. Therefore, this approach isless amenable for the in-house and widespread fabrication of columns by research laboratories.
High-Performance Liquid Chromatography Setup. The microcolumnsystem would not be complete without the addition of an HPLC gradient delivery sys-tem. The reverse-phase microcolumn typically requires a flow rate of 100 to 200nL/min. Although conventional HPLCs can deliver such flow rates in isocratic mode, they cannot deliver gradients or provide efficient mixing at that flow rate. The simplestsolution to this problem has been to “flow split” the eluent from an HPLC system thatpumps at 5 to 50nL/min down to 100 to 200nl/min. This is typically achieved by addinga tee after the HPLC system and by having one of the two exits going to waste whilethe other exit is connected to the microcolumn. The split ratio is obtained by carefullygauging the tubing at both exits. The advantage of this method is that it can be easilyadapted to conventional HPLC. Its disadvantage is that the split ratio is affected by theback pressure on the microcolumn. Therefore, as the column ages and the back pres-sure increases, the split ratio changes. Regardless of the disadvantages, the splittingmethod is still the preferred approach for the generation of nanoliter per minute gradi-
40 PROTEOMICS: THE BASIC OVERVIEW
(a)
(b)
(c)
Figure 1.16. Schematics of different packed nanospray needles that have been fabricated.
(a) Needle with no frit obtained by gradually narrowing down the inner diameter of the
needle. (b) Needle with an isthmus to retain the reverse-phase beads (Martin et al., 2000).
(c) Needle with a capillary frit to retain the beads (Davis and Lee, 1998).

ents. In fact today’s commercially available nanoflow HPLCs are based on the split-ting principle.
High-performance liquid chromatography systems can be divided into two broadtypes: low-pressure mixing systems that mix the solvents prior to a single pump andhigh-pressure mixing systems that mix the solvents in a static or dynamic mixer placedafter the pumps, or they can mix the solvents directly into the pump head. For bothsystems, the important parameters for m-HPLC-MS/MS are the delay time in the gra-dient, the prepressurization performance of the pump, and their performance at lowerpressures.
The low-pressure mixing systems can have low void volumes following the pump because no mixers are placed after the pump. Therefore, flow splitting can beperformed right after the pump, reducing the dead time of the experiment; however,low-pressure mixing systems have the disadvantage of obtaining the solvent ratios bymechanically proportioning the solvents. This happens either by switching valves or by proportional valves, using the vacuum action of the pump refill stroke. Theseapproaches can perform poorly for low and high solvent ratios, generating less reproducible gradients.
The more common HPLC systems are the ones that perform high-pressure mixingof solvents and have the mixer placed after the pump or directly in the pump head. Inthese systems, the pumps are driven at a few microliters per minute, and the flow split-ting required to achieve 100 to 200nL/min occurs after the mixer and the pressuredamper. Generally, the void volume is fairly large from the pumps to the column. Forexample, a void volume of 100 mL is not unusual and can represent 20min delay in thegradient, assuming a flow rate of 5 mL/min. Furthermore, the back pressure can be aslittle as 100 to 1000psi, which can cause some check valves used in HPLC to fail tooperate properly.
Coupling to the Electrospray Mass Spectrometers. In recent years threeapproaches have emerged for the coupling of m-HPLC columns to ESI-MS. The firstapproach consists of establishing an electrical contact directly at the end of the elec-trospray needle. This is typically achieved by gold coating a part of the tip. This allowsthe direct application of a high-voltage potential to the tip of the column, which is nec-essary for the generation of the ESI process. The direct application of the high voltagegenerates, by far, the most stable electrospray process; however, the thin gold layerapplied to the tip will be removed over time, and the electrical connection can be lost.
Alternatively, the high voltage can be indirectly applied to the electrospray needleby using a liquid junction before the needle. This is typically achieved using an ultra-low-dead-volume connector placed between the transfer line and the electrosprayneedle. This approach has the advantage of being more robust in terms of maintainingthe electrical connection; however, it has the disadvantage of generating a less stable,although still adequate, electrospray process.
The last approach is a combination of the previous two approaches, and it consistsof using a fully external gold-coated needle coupled to a ultra-low-dead-volume con-nector to which a high voltage is applied. In this fashion, the electric connection isalways maintained while an optimum electrospray process is obtained.
PROTEIN IDENTIFICATION 41

The electrical liquid junction in commercial connections or home-made connectionscan cause debilitating problems when used improperly. It is important to understand thatelectrolysis does occur in the liquid junction, generating a small amount of gas. Gener-ally, the linear flow is strong enough to carry the gas forward with no formation ofbubbles; however, in improperly fitted connections, the linear flow could be reducedwhen entering the liquid junction to a level that allows the formation of gas bubbles.
Application to Protein Identification Based on Peptide Mass Spectrom-etry. Once all the elements of the system are in place, the protein identification exper-iment can be performed. In a typical experiment, a few microliters of the protein digestis pressure loaded onto the m-HPLC column. Then, the HPLC system delivers a solventgradient of increasing hydrophobicity to the column. The peptides are eluted in orderof hydrophobicity, transferred to the microelectrospray interface, and then moved tothe MS. The eluting analytes successively trigger the MS to select one of the analytesand to generate the MS/MS spectra. The MS/MS spectra generated for the analytes arethen used to search protein databases.
This method has established itself over the years as the method of choice for proteinidentification by mass spectrometry. Although, the continuous infusion by nanoelec-trospray has been shown to provide exquisite sensitivity, it still remains a slow andmanual technique. HPLC offers the advantages of being rapid and automatable, whilestill providing comparable limits of detection. The most popular combination has beento couple m-HPLCs with ion trap mass spectrometers. Figure 1.17 shows the analysisof 50 fmol of bovine serum albumin (BSA) on such a system. The analysis was com-pleted in about 35min. The insert shows the typical quality of fragmentation patternsthat can be obtained at that level of protein. It has been reported that approximately100 fmol of protein present on the gel can be analyzed with this system.
Two-Dimensional HPLC-MS/MS Techniques. One-dimensional HPLC-MS/MSdoes not provide a high enough resolution for complex samples. Although longer gra-dients can be performed, one-dimensional HPLC has an inherent separation limitation.Historically, it has not been a significant problem because the complexity of the sampleswas always reduced through 1D and 2D gel electrophoresis. The limitations, however,of gel separation have pushed research toward novel two-dimensional separationsystems.
Jorgenson’s group has been pioneering the multidimensional separation from theanalytical point of view (Hooker and Jorgenson, 1997; Lewis et al., 1997; Moseley et al., 1989; Opiteck et al., 1997, 1998). Techniques have been recently developed foronline multidimensional chromatographic separation of peptides and their subsequentanalysis by mass spectrometry. In particular, multidimensional chromatographicapproaches, based on ion exchange chromatography, have been coupled to reverse-phase chromatography online with an ESI mass spectrometer for protein identification(Washburn et al., 2001). This system allows the analysis of complex peptide mixtures,such as the mixtures obtained by proteolytic digestion of whole-cell lysates.
Setup. A bed of reverse-phase material is packed in a capillary tubing followedby a second packing of a bed of ion exchange material. The end result is a column con-
42 PROTEOMICS: THE BASIC OVERVIEW
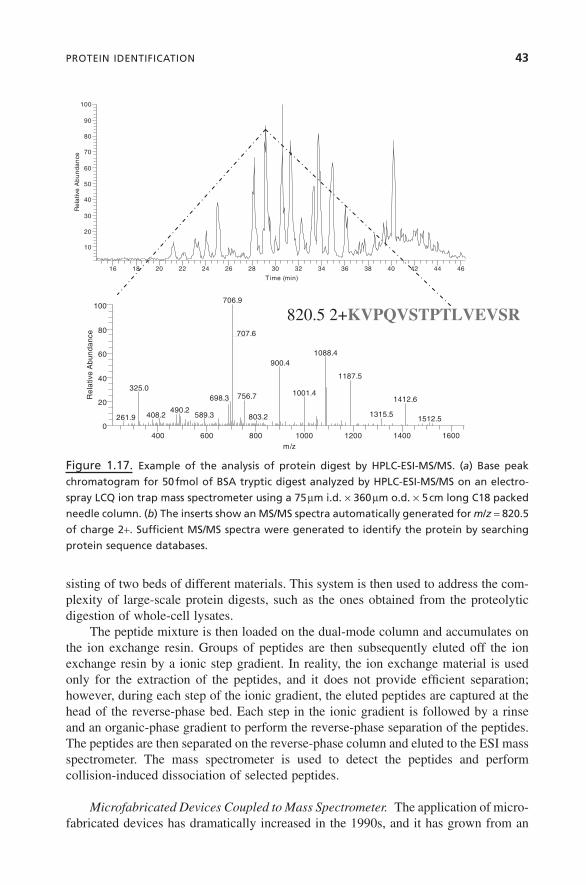
sisting of two beds of different materials. This system is then used to address the com-plexity of large-scale protein digests, such as the ones obtained from the proteolyticdigestion of whole-cell lysates.
The peptide mixture is then loaded on the dual-mode column and accumulates onthe ion exchange resin. Groups of peptides are then subsequently eluted off the ionexchange resin by a ionic step gradient. In reality, the ion exchange material is usedonly for the extraction of the peptides, and it does not provide efficient separation;however, during each step of the ionic gradient, the eluted peptides are captured at thehead of the reverse-phase bed. Each step in the ionic gradient is followed by a rinseand an organic-phase gradient to perform the reverse-phase separation of the peptides.The peptides are then separated on the reverse-phase column and eluted to the ESI massspectrometer. The mass spectrometer is used to detect the peptides and perform collision-induced dissociation of selected peptides.
Microfabricated Devices Coupled to Mass Spectrometer. The application of micro-fabricated devices has dramatically increased in the 1990s, and it has grown from an
PROTEIN IDENTIFICATION 43
16 18 20 22 24 26 28 30 32 34 36 38 40 42 44 46
Time (min)
10
20
30
40
50
60
70
80
90
100
Re
lativ
e A
bu
nd
an
ce
400 600 800 1000 1200 1400 1600m/z
0
20
40
60
80
100
Re
lativ
e A
bu
nda
nce
706.9
707.6
1088.4900.4
1187.5
325.01001.4756.7698.3 1412.6
490.2 1315.5589.3408.2 803.2261.9 1512.5
820.5 2+KVPQVSTPTLVEVSR
Figure 1.17. Example of the analysis of protein digest by HPLC-ESI-MS/MS. (a) Base peak
chromatogram for 50fmol of BSA tryptic digest analyzed by HPLC-ESI-MS/MS on an electro-
spray LCQ ion trap mass spectrometer using a 75mm i.d. ¥ 360mm o.d. ¥ 5cm long C18 packed
needle column. (b) The inserts show an MS/MS spectra automatically generated for m/z = 820.5
of charge 2+. Sufficient MS/MS spectra were generated to identify the protein by searching
protein sequence databases.

esoteric technique only applied in a few laboratories to a recognized technique. Itsapplication in the field of proteomics is more recent because of the difficulty to couplemicrofabricated devices to an external detector such as a mass spectrometer. In thissection, we will describe some of the microfabricated systems that have been used forthe identification of protein by mass spectrometry. It is, however, important to remem-ber that all these systems are far from being robust and still have some serious hurdlesto overcome. Therefore, at this point, use the information provided below as an eye opener to a novel technology that might, one day, be a strong platform for proteomics.
Microfabricated devices are typically made by photolithographic techniques tocreate various patterns of reservoirs, channels, and reaction chambers on a planar sub-strate such as glass or polymer. Then a second plate, with access ports for the reser-voirs, is bonded to seal the channels. These devices were originally designed to havein situ detection of the analytes. The analysis, however, by mass spectrometry requiresthe transfer of the analytes to the mass spectrometer. In the case of ESI mass spec-trometers the standard microelectrospray interface can be used for the transfer;however, the interface still needs to be connected to the microfabricated device througha transfer capillary. This is still the most challenging aspect of interfacing microfabri-cated devices to MS analyzers. Various ways of making the connectivity have beenpublished; however, they are mostly incompatible with the mass production of thedevices.
Continuous Infusion of Peptides for Protein Identification by Mass Spectrometry.The simplest application of microfabrication is the continuous infusion of peptidedigests to a mass spectrometer and the fragmentation of the individual peptides. Forexample, Figeys et al. (1997) performed protein identification via infusion from amicrofabricated device into an MS. In their design, a 12-cm pump capillary was con-nected to a simple three-reservoir device and to a micro-ESI source. The device contained two independent sample reservoirs and a buffer reservoir. The sample mobi-lization and their direction were done by controlling the voltage at each of the threereservoirs. In this fashion, one sample can be mobilized toward the MS, while the othersample is retained in its reservoir through an unfavorable electric field. The mass spec-trometer is then used to provide MS/MS analysis of the eluting peptides. They demon-strated that reasonable levels of standard peptides (33 fmol/mL) can be analyzed throughthis system while retaining a high signal-to-noise ratio.
In a subsequent implementation, Figeys et al. (1998b) put into practice a morecomplex nine-reservoir device with computer-controlled voltage applied to each reser-voir (Fig. 1.18). Furthermore, a software was developed to control the chip device andto trigger the mass spectrometer for automated acquisition of the peptide MS/MS. Theonly user intervention that was required was the manual pipetting of samples into theirindividual reservoirs on the microfabricated device before triggering the software. Thesystem sequentially mobilized the sample using directed electroosmotic pumping, whilethe MS software controlled the data acquisition and subsequent database searching. Thesystem was successfully used to identify yeast proteins previously separated by 2D gelelectrophoresis.
44 PROTEOMICS: THE BASIC OVERVIEW

Separation of Peptides on Microfabricated Devices Coupled to Mass Spectrome-ter. Electrophoresis has been the method of choice for the separation of analytes onchips. Furthermore, it is also compatible with the microelectrospray interface. The samelimitations, however, that were present in CZE are also present in the microfluidicsystem. Therefore, discontinuous methods such as sample stacking, isotachophoresis,and solid-phase extraction (SPE) are required to increase the amount of sample injectedon the microfabricated device.
Electrophoretic separations with offline sample concentration (Zhang et al., 1999)and online sample concentration (Figeys et al., 1998a; Li et al., 1999; Wang et al., 2000)have been reported. In particular, a microfabricated system for the separation of pep-tides by electrophoresis was coupled to a mass spectrometer by Li et al. (2000). In thisapproach, the protein digests of interest are introduced one at a time on the microfab-ricated device. An electric field is applied to fill an injection cross with the sample.Once the cross has been filled, an electric field is applied from the buffer reservoir tothe microelectrospray needle driving the separation of analytes toward a microelectro-spray interface. Rapid separation of protein digests has been obtained through thisapproach; however, the limit of detection for real samples still needs to be improved(Fig. 1.19).
PROTEIN IDENTIFICATION 45
Protein
Peptides
Protein sequence identity
MS entrance
Protein amino acid sequence:MKCLLLAKMDSPMDSPLALTCGAQALIVTQTMDISLLDAQSAPLRVYVEELKPTPEGDTPEGIRLQKWENGECAQKKIIAEKTKIPAVFKIDALNENKVLVLDTDYKKYLLFCMENSAEPE QSLACQCLVR
Peptide fragmentation patterns
Enzymaticfragmentation
Figure 1.18. Schematic of a nine-position microfabricated device coupled to an ESI-MS/MS
mass spectrometer for the automated analysis of protein digests. The protein digests of inter-
est are pipetted into the different reservoirs. Then, the samples are successively mobilized by
the application of a directed electric field from their specific reservoir toward the mass spec-
trometer where the peptides are analyzed by MS and MS/MS. The analysis proceeds until all
the samples have been successively analyzed. Reproduced with permission from Figeys et al.
(1998b).

The development in the field of microfluidics coupled to mass spectrometry hasbeen tremendous in the late 1990s. There are still, however, some serious challengesto the technology that still need to be addressed before it can become routinely appli-cable in a robust format.
Bioinformatics for the Identification of Proteins Based on MS/MS
All the ESI-based tandem mass spectrometers are generally used to perform MS andMS/MS spectra. Although the mass accuracy, resolution, sensitivity, and quality of thefragmentation patterns are different, they contain information that can be used to iden-tify a peptide provenance by protein/DNA database searching. The MS/MS spectracontain the fragmentation patterns related to the amino acid sequence of specific pep-tides. The analysis of MS/MS spectra is more intensive than the interpretation of MSdata. The approaches that are used for the interpretation of these spectra can be classi-fied into three subgroups according to the level of user intervention required.
No Interpretation. Clearly one would like to be able to identify proteins withouthaving to do any interpretation of the MS/MS spectra. For high-throughput analysis,
46 PROTEOMICS: THE BASIC OVERVIEW
Separation buffer
Waste
Sample
A
B
C D
E
1ml
0.5 1.0 1.5 2.0
Time (min)
Injection sectionI
IIIII
IVV
(a)
(b)
Figure 1.19. Schematic of a four-position device coupled to an ESI-MS/MS mass spectrometer
for the separation of peptide mixtures and their analysis by mass spectrometetry. (a) Schematic
of the device coupled to a triple quadrupole mass spectrometer. A portion of the sample is
mobilized from the sample reservoir toward the waste, filling a small injection line. Once the
injection section is filled, a potential is applied between reservoir B and the nanospray emitter
driving the separation and the electrosrpay process. (b) Example of a separation for a peptide
mixture in less than 2min. Separation of leu-enkephalin (I), LHRH (II), somatostatin (III),
angiotensin II (IV), and bradykinin (V) all at 10mg/mL. Reproduced with permission from Li
et al. (2000).

this becomes essential. A few algorithms have been developed to search protein/DNAdatabases with uninterpreted MS/MS spectra. They all have in common the require-ment for the partial or full sequence of the protein to be already known and includedin a database. All of the software packages provide a list of possible matches betweenindividual MS/MS spectrum and peptide sequences obtained from the database;however, the scoring algorithms used to determine the validity of the matches are verydifferent. These algorithms are explained in more detailed below.
Mascot by Matrix Sciences (www.matrixscience.com) can be freely accessed overthe web (for noncommercial entities) (Pappin et al., 1993). It was built based on theMOWSE scoring algorithm from Papin. The MOWSE algorithm computes a matrix ofprobability in which each row represents an interval of 100Da in peptide mass, andeach column represents an interval of 10kDa in intact protein mass. As each sequenceentry is processed, the appropriate matrix elements are increased to accumulate statis-tics on the size distribution of peptide masses as a function of the protein mass. There-fore, this matrix represents the peptide distribution by protein MW present in thedatabase. The matrix will change as the database increases. From this matrix, a scoreis ascribed based on the measured masses. The same algorithm is used for peptideMS/MS. In Mascot they have further incorporated a probability based on the proba-bility that a match is a random event. This allows the probabilistic evaluation and order-ing of all the potential matches, as well as a probabilistic evaluation of the best match.
ProteinProspector from UCSF (http://prospector.ucsf.edu/ ) is also an example of a web-based MS/MS search engine. The identification of the protein is typically un-ambiguous, achieved by the number of peptides that matches to the same protein.
Another algorithm that is popular is Sequest (Eng et al., 1994; McCormack et al.,1997; Yates et al., 1995). Sequest is not freely accessible over the web and must bepurchased. This algorithm performs a two-pass search of the database. In the first pass,for every MS/MS spectra submitted, Sequest searches protein/DNA databases for thetop 500 isobaric peptides using some of the information on immonium ions. In the second pass, the 500 predicted spectra corresponding to the isobaric peptides aregenerated and are rapidly matched against the measured spectra. This is achieved bymultiplying in the frequency domain of the fast-Fourier transformation, the measuredspectrum with each individual predicted spectrum for the 500 isobaric peptides, and bypairwise multiplication of the measured and predicted transforms.
The multiplication in the Fourier domain is the same as doing a convolution in thetime domain. This means that this approach verifies how well each predicted spectrummatches to the measured spectrum. Correlation parameters that indicate the quality ofthe match between predicted and measured spectra are then deduced from the resultsof the transform multiplication. A high cross-correlation indicates a good matchbetween the predicted spectrum and the measured spectrum. More importantly, thecross-correlation value is independent of the size and nature of the database. Therefore,the same peptide sequence found in a small database or a large database will return thesame correlation coefficient when matched against the measured spectrum. This is animportant aspect of Sequest that makes it unique. All the other approaches providescoring schemes that are very dependent on the size and nature of the database.
Furthermore, although protein identification has been performed with as little asone peptide using this algorithm, unambiguous identification of the provenance of a
PROTEIN IDENTIFICATION 47

protein is often achieved by the multitude of peptides that matches with the same entryin a database. The Sequest software is computing intensive, and for high-throughputdemand, it can rapidly paralyze the best dual-CPU server. In reality, the slowness ofSequest is due to the recurrent scans of the selected database to find the top 500 iso-baric peptides. The larger the database, the longer it takes to scan the databases. Animproved version of the software, called Turbo-Sequest, predigests and orders the data-bases and has greatly improved the search speed.
Sonars by Proteometrics can search uninterpreted MS/MS spectra of peptidesagainst protein and DNA databases (Field et al., 2002). This software uses Bayesiantheory to rank the protein sequences in a database by their probability of occurrence.It also provides a scoring scheme for the differentiation of the match. In our hands, ithas proven to be the most rapid system for the analysis of peptide digests. X!Tandem(http://www.proteome.ca/x-bang/tandem/tandem.html) (Graig and Beaivis, 2004).
Partial Interpretation. Although the fully automated approaches are favorablefor automation, historically the computing power was not available for the rapid iden-tification of proteins.
Another subgroup of database search engines, based on the partial interpretationof the MS/MS spectra, were developed to perform faster searches of databases, whilerequiring human intervention. The most popular partial interpretation of MS/MS spectrais the “sequence-tag” approach (Wilkins et al., 1996a; Mann and Wilm, 1994) (Fig.1.20). It consists of reading the mass spacing between specific fragments of an MS/MSspectrum. This allows the generation of a short peptide sequence (tag). The tag is thenused to pinpoint the possible peptide sequences from isobaric peptides in databases,while the residual mass information before and after the tag confirms one or a fewpeptide matches. Every MS/MS spectrum requires the generation of a tag followed bydatabase searching. Unambiguous identification of the protein is established by the multitude of peptides that matches to the same protein.
De novo Sequencing. Finally, the last option is the full interpretation of theMS/MS spectra, often called de novo sequencing (Papayannopoulos, 1995; Shevchenkoet al., 1997). Obviously, the other automated and semiautomated approaches are usedprior to this approach. Although many genomes have been recently sequenced, thegenomic data only represent a fraction of the world’s genomic pool, and often no data-bases are available for specific organisms. The requirements for de novo sequencingare more stringent. The MS/MS spectra must be of good quality in terms of intensityand coverage of the peptide sequence. The MS/MS spectra of peptides contain ladder-type information, which, in principle, indicates their amino acid sequence. Experiencedmass spectrometrists can manually extract the peptide sequence from the MS/MSspectra.
In large-scale proteomic studies, the throughput of analysis is a critical factor.Therefore, once enough MS/MS spectra have been generated to unambiguously iden-tify a protein, generating MS/MS spectra on the residual peptides can be a waste oftime. In some cases, however, like when dealing with expressed sequence tag (EST) orprotein mixtures, it is important to increase the number of MS/MS generated.
48 PROTEOMICS: THE BASIC OVERVIEW

CURRENT CHALLENGES IN PROTEOMICS
Classical Proteomics
There has been a lot of confusion in the field of proteomics on the issue of the com-plete proteome coverage and low-abundance proteins. This confusion is, in part, dueto a bit of propaganda about the power of the technology, as well as some confusionrelated to the definition of proteome and proteomics. The idea of the comprehensivestudy of the proteome is more an idealism than a reality.
Also, 2D gel-based proteomics is still facing a serious number of challenges. Inparticular, although 2D gel electrophoresis is a powerful technique, it still lacks thecapability for discovering hydrophobic proteins, basic proteins, and low-abundanceproteins.
The presence or absence of low-abundance proteins on 2D gels has been contro-versial. Fortunately, for S. cerevisiae and a few other species, indexes can be calculatedfor all the ORF entries in their corresponding database that reflects the abundance atthe protein level. One such index is the codon bias index. The codon bias index is calculated based on a compiled index for codon usage in messenger RNA (mRNA).The codon usage is typically measured for a few ORF that are translated into highlyexpressed proteins. The codon bias index is thought to be a good indication of theexpression levels of proteins. Codons that correspond to low-level transfer RNAs
CURRENT CHALLENGES IN PROTEOMICS 49
400 600 800 1000 1200 1400 1600m/z
0
40
80 GE
G
(Mass1 )+
Peptide mass
Nucleotide or ProteinDatabase
>143B_BOVIN 14-3-3 PROTEIN BETA...MDKSELVQKAKLAEQAERYDDMAA MKAVTEQGHELSNEERNLLSVAYKNYGARRSSWRVISSIEQKTERNEKKQQMGKEYREKIEAELQDICNVLQLLDK ...
GEG (Mass2)
Figure 1.20. Schematic of protein identification by sequence tag. A small stretch of an indi-
vidual peptide sequence is read from the MS/MS spectrum. The peptide mass, the short amino
acid sequence, and the residual masses before and after the sequence are used to search
protein/DNA databases.

(tRNAs) during translation decrease the potential yield of expression; on the other hand,codons that utilize higher abundance tRNA during translation will increase the poten-tial yield of the protein expression. Figure 1.21a shows the expected range of codonbias in yeast calculated using the predicted ORF. Clearly, a good portion of the yeastproteome is expected to fall in the low codon bias (<0.1) and therefore, has a lowexpression. Figure 1.21b shows a compilation of the codon bias index for the proteinsthat have been identified by 2D gel electrophoresis of S. cerevisiae [compiled fromGygi et al. (1999b) and Perrot et al. (1999)]. At a first glance, low-abundance proteinsappear to be detected; however, if we only plot the proteins that were identified by massspectrometry, the result is different. Furthermore, some of the reported proteins with0.1 codon biases are suspicious because they represent proteins that were present at thepicomole level on the yeast 2D gel, and this level is far from being low abundance.Therefore, they probably represent erroneous identifications (Fig. 1.21c). The lack ofidentification of low-abundance proteins has been reported to be caused by a limitedload capacity on 2D gel electrophoresis. In order to see low-abundance proteins, the amount of sample that needs to be loaded exceeds the capacity of 2D gel electrophoresis.
Hydrophobic proteins have also been a challenge for proteomics. Hydrophobic proteins have the tendency to precipitate once they reach their pI during the electro-focusing on an IPG, and therefore they do not transfer to the second dimension. Al-though, efforts have been made to improve the solubilization of hydrophobic proteins(Rabilloud, 1999; Santoni et al., 1999), the display of hydrophobic proteins by 2D gelelectrophoresis still remains a challenge.
The efficient gel digestion of low-level proteins can, as well, be a challenge forproteomics. The kinetic of digestion is dependent on the concentration of the substrate(protein to be digested). Therefore, as the concentration of substrate decreases, the effi-ciency of the digestion also decreases. Furthermore, sample loss is also a critical factorfor low-level proteins.
Gel-Free Analysis: An Alternative Differential Display
The limitations of 2D gel electrophoresis can be alleviated with the gel-free analysisof complex protein mixtures. The analysis of complex proteolytic mixtures is now pos-sible due to the improvement of online peptide separation and the improvement of massspectrometry software. In this approach, the lysate of interest is directly digested toprovide a complex mixture of proteins. This offers the advantage of reducing samplelost and contamination, therefore expanding the dynamic range of protein analysistoward lower abundance proteins. Characteristic hydrophilic peptides can also be foundfrom proteins that have a sequence in preponderance of hydrophobic amino acids. The
50 PROTEOMICS: THE BASIC OVERVIEW
Figure 1.21. Codon bias and the yeast proteome. (a) Distribution of codon bias calculated
for all the yeast ORF. (b) Compilation of the codon bias for the proteins that have been
observed on 2D gel electropherograms of yeast. (c) Compilation of the codon bias for the pro-
teins identified from a 2D gel electropherogram of yeast using only mass spectrometry.
�

0
500
1000
1500
2000
2500
nu
mb
er o
f O
RF
-0.6 -0.5 -0.4 -0.3 -0.2 -0.1 0 0.1 0.2 0.3 0.4 0.5 0.6 0.7 0.8 0.9 1
codon bias index
(a)
(b)
(c)
n=6310
0
10
20
30
40
50
60
70
80
90
-0.2 -0.1 0 0.1 0.2 0.3 0.4 0.5 0.6 0.7 0.8 0.9 1
codon bias
nu
mb
er o
f p
rote
in o
bse
rved
0
10
20
30
40
50
60
-0.2 -0.1 0 0.1 0.2 0.3 0.4 0.5 0.6 0.7 0.8 0.9 1
codon bias
nu
mb
er o
f p
rote
in o
bse
rved
51

complex mixture of proteins is then separated online either by one- or two-dimensionalHPLC and ESI mass spectrometry.
Quantitation. The relative quantitation of the proteins that are differentlyexpressed between two sets of proteins is an important aspect of proteomics. The gel-based separation of proteins provides direct visualization and relative quantitation ofseparated proteins based on the staining intensities on the gel. Therefore, choosing theproteins of interest is as simple as comparing two lanes, or two gels, and looking forchanges in staining intensity.
The gel-free analysis of proteins is typically a dynamic process, which also requiresthe relative quantitation of peptides. No staining is performed in gel-free approaches,and the quantitation relies on the mass spectrometric signal. Mass spectrometers havebeen used for many years to do quantitative studies; however, this is always done byestablishing response curves for particular analytes. This is hardly possible for a con-stantly changing set of analytes, such as peptides obtained from a proteolytic digestionof proteins. Furthermore, it is often difficult to compare even two experiments run oneafter the other in terms of peptide signal intensity.
The differential analysis of complex protein mixtures in a gel-free approach canbe achieved by using isotope tagging of peptides to allow a direct comparison of thechanges in peptide levels between two proteomes in a single experiment. Gygi et al.(1999a) have demonstrated a method called ICAT (isotope-coded affinity tag) thatallows the differential quantitation of proteomes using cystein-containing peptides.Munchbach et al. (2000) proposed a more general way for N-terminal labeling of peptides for the differential quantitation. Although the method by Munchbach et al. wasonly demonstrated for gel-separated proteins, it appears that the reaction would just beas valid for gel-free analysis of proteins.
Briefly, the ICAT (Gygi et al., 1999a) method consists of labeling cystein-containing peptides from different samples with a light and heavy form of a reactivechemical. The ICAT reagent consists of a biotin group followed by a linker and is terminated with a cystein reactive group. The only difference between the light and the heavy tag is the presence of hydrogen or deuterium. This results in a similarresponse at the mass spectrometer while a diagnostic m/z spacing occurs on the MSspectrum. Furthermore, because the heavy/light peptides are quasi co-elute and areidentical in sequence, their relative quantities can be obtained by the ratio of their intensity.
Typically, in the ICAT approach, a lysate sample first is reduced and reacted withthe light form of the ICAT reagent. A second lysate sample is also reduced and reactedwith the heavy form of the ICAT reagent. Both ICAT reagents preferentially react atthe sulfhydryl group present on the cysteins. Once both labeling reactions have beenperformed, the two protein lysates are combined and enzymatically cleaved to gener-ate peptide fragments. Then, the cystein-containing peptides are purified using amonomeric avidin column. The purified cystein-containing peptides are separated on ananoflow HPLC system, online with an ESI mass spectrometer. Pairs of peptides withidentical amino acid sequences that are tagged, respectively, with the light and heavyform of the ICAT are different in mass by 8 mass units. These are easily differentiatedon a mass spectrometer and eluted with just a slight delay from each other. Further-
52 PROTEOMICS: THE BASIC OVERVIEW

more, the automated generation of MS/MS fragmentation patterns of the peptides iden-tifies the peptide sequence and its protein provenance by database searching. The relative quantitation is extracted from the MS spectrum using the ratio of the signalintensity observed for the light/heavy labeled peptides.
Munchbach et al. (2000) have introduced a more generic approach for the label-ing of peptides at their N-termius using 1-(nicotinoyloxy)succinimide esters. They havesynthesized a heavier form of the 1-(nicotinoyloxy)succinimide ester and introducedfour deuteriums, which provide a 4 mass unit difference with the normal 1-(nicotinoy-loxy)succinimide ester. The light/heavy pair of chemicals can be used for the differen-tial labeling of proteins and their relative quantitation. Briefly, both samples areenzymatically digested to generate peptide fragments. The peptide fragments are thensuccinylated to block the e-amino group of lysines. Then the first sample is reacted witha light form of 1-(nicotinoyloxy)succinimide ester, and the second sample is labeledwith the heavy form of the 1-(nicotinoyloxy)succinimide ester. The two samples arethen combined and analyzed by MALDI-TOF mass spectrometry.
It is to be expected that many more pairs of chemicals will become available forthe relative quantitation of proteomes. It is important to realize that the expressionprofile of a proteome covers a few orders of magnitude. All the chemical taggingapproaches have a defined dynamic range. Therefore, it is important to keep in mindthat for low levels of proteins, these reactions can fail to provide linear responses.Therefore, although both of the labeled heavy and light forms of the peptide might beobserved, the calculated relative quantitation for the low-level proteins might be inac-curate. Side reactions can also provide significant challenges.
Fourier Transform Mass Spectrometery for Gel-Free Analysis andSingle-Peptide-Based Identification
The FTMS has attracted renewed attention from the proteomic community. The instru-mentation is now more robust, it offers fragmentation, it has a larger dynamic range,an improved sensitivity, and it has recently been coupled to MALDI. The FTMS is byfar the best mass spectrometer in terms of mass accuracy, resolution, and sensitivity.Peptide masses can be measured down to 1ppm or less, depending on the sample. Wehave come to appreciate the advantages that accurate mass measurement offers in termsof protein identification.
Depending on the size of the genome, it is possible to unambiguously identify aprotein solely based on the accurate mass measurement of one of its peptides (masstag). For example, Figure 1.22a shows the plot of the number of isobaric peptides versusthe peptide masses for a 10ppm tolerance and a 1ppm tolerance for the yeast proteome.This was predicted for all of the known yeast open-reading frames. Figure 1.22b alsoshows the percentage of unique peptides versus the peptide masses. It is clear that forsmall and medium genomes, protein identification based on a single peptide seems tobe a possibility. It is also clear that the homology level is low in yeast. We have per-formed an N ¥ N blast of the yeast genome and obtained about 20% of the protein inyeast with at least one homolog at an homology level of 80%. We expect this numberto be significantly larger for more complex organisms. Furthermore, the idea of iden-tifying a protein solely based on a single peptide does not take into account splicing
CURRENT CHALLENGES IN PROTEOMICS 53

and point mutation. Also, it is one thing to say that a specific peptide is unique to aprotein; however, it is another thing to find it.
One of the possible applications of this approach is the identification of proteincontained in complex mixtures in a gel-free manner based on HPLC-ESI-MS/MS.Smith et al. have demonstrated the potential of the protein identification based on asingle-peptide analysis by ESI-FTMS. Furthermore, they have also demonstrated thatthe addition of the ICAT reagent improves identification of peptides by restricting thesearch to the cystein-containing peptides. This also means that proteins can be identi-fied in complex mixtures, based only on the presence of one of their peptides. It is notclear yet if this approach will be useful for larger genomes, such as the human genome.
REFERENCES
Adessi, C., Miege, C., Albrieux, C., and Rabilloud, T. (1997). Two-dimensional electrophoresisof membrane proteins: A current challenge for immobilized pH gradients. Electrophoresis18(1):127–135.
54 PROTEOMICS: THE BASIC OVERVIEW
0
5
10
15
20
25
30
35
40
45
50
1000 1500 2000 2500 3000
peptide mass (bin at 25 amu)
(a)
(b)
% o
f u
niq
ue
pep
tid
e
20
30
40
50
60
70
80
90
1000 1500 2000 2500 3000
peptide mass (bin at 25 amu)
% o
f u
niq
ue
pep
tid
e
Figure 1.22. Effect of mass accuracy observed on the mass spectrometer on the probability
of unique identification.

Aebersold, R., and Mann, M.(2003). Mass spectrometry-based proteomics. Nature 422:198–207.
Aebersold, R., Leavitt, J., Saavedra, R., Hood, L., and Kent, S. (1987). Internal amino acidsequence analysis of proteins separated by one- or two-dimensional gel electrophoresis afterin situ protease digestion on nitrocellulose. Proc. Natl Acad. Sci. USA 84(20):6970–6974.
Aebersold, R., Teplow, D., Hood, L., and Kent, S. (1986). Electroblotting onto activated glass. High efficiency preparation of proteins from analytical sodium dodecyl sulfate-polyacrylamide gels for direct sequence analysis. J. Biol. Chem. 261(9):4229–4238.
Anderson, L., and Seilhamer, J. (1997). A comparison of selected mRNA and protein abundancesin human liver. Electrophoresis 18:533–537.
Banks, R., Dunn, M., Forbes, M., Stanley, A., Pappin, D., Naven, T., Gough, M., Harnden, P.,and Selby, P. (1999). The potential use of laser capture microdissection to selectively obtaindistinct populations of cells for proteomic analysis—preliminary findings. Electrophoresis20(4–5):689–700.
Bartel, P.L., Roecklein, J.A., SenGupta, D.J., and Fields, S. (1996). A protein linkage map ofEscherichia coli bacteriophage T7. Nat. Genet. 12:72–77.
Blanchard, A. (1998). Synthetic DNA arrays. Genet. Eng. (N Y) 20:111–23.
Blisnick, T., Morales-Betoulle, M.E., Vuillard, L., Rabilloud, T., and Braun Breton, C. (1998).Non-detergent sulphobetaines enhance the recovery of membrane and/or cytoskeleton-associated proteins and active proteases from erythrocytes infected by plasmodium falci-parum. Eur. J. Biochem. 252(3):537–541.
Blum, H., Beier, H., and Gross, H.J. (1987). Improved silver staining of plant proteins, RNA andDNA in polyacrylamide gels. Electrophoresis 8:93–99.
Brunet, S., Thibault, P., Gagnon, E., Kearney, P., Bergeron, J.J., and Desjardins, M. (2003).Organelle proteomics: Looking at less to see more. Trends Cell Boil. 13:629–638.
Celis, J.E., Celis, P., Ostergaard, M., Basse, B., Lauridsen, J.B., Ratz, G., Rasmussen, H.H., Orntoft,T.F., Hein, B., Wolf, H., Celis, A. (1999). Proteomics and immunohistochemistry define someof the steps involved in the squamous differentiation of the bladder transitional epithelium: Anovel strategy for idenfying metaplastic lesions. Cancer Res. 59(12):3003–3009.
Chervet, J.P., Ursem, M., and Salzmann, J.B. (1996). Instrumental requirements for nanoscaleliquid chromatography. Anal. Chem. 68(9):1507–1512.
Chevallet, M., Santoni, V., Poinas, A., Rouquie, D., Fuchs, A., Kieffer, S., Rossignol, M., Lunardi,J., Garin, J., and Rabilloud, T. (1998). New zwitterionic detergents improve the analysis ofmembrane proteins by two-dimensional electrophoresis. Electrophoresis 19(11):1901–1909.
Clarke, C., Titley, J., Davies, S., and O’Hare, M. (1994). An immunomagnetic separation methodusing superparamagnetic (Macs) beads for large-scale purification of human mammaryluminal and myoepithelial cells. Epithelial Cell Biol. 3(1):38–46.
Comisarow, M.B., and Marshall, A.G. (1974). Fourier transform ion cyclotron resonance spec-troscopy. Chem. Phys. Lett. 25:282–283.
Conrods, T.P., Anderson, G.A., Veenstra, T.D., Pasa-Tolic, L., and Smith, R.D. (2000). Utility ofaccurate mass tags for proteume-wide protein identification. Anal. Chem. 72:3349–3354.
Craig, R., and Beavis, R.C. (2004) TANDEM: Matching proteins with tandem mass spectra.Bioinformatics Feb. 19 [Epub ahead of print].
Dai, Y., Whittal, R.M., and Li, L. (1999). Two-layer sample preparation: A method for MALDI-MS analysis of complex peptide and protein mixtures. Anal. Chem. 71:1087–1091.
Davis, M.T., and Lee, T.D. (1998). Rapid protein identification using a microscale electrosprayLC/MS system on an ion trap mass spectrometer. J. Am. Soc. Mass Spectrom. 9(3):194–201.
REFERENCES 55

Desprez, T., Amselem, J., Caboche, M., and Hofte, H. (1998). Differential gene expression inArabidopsis monitored using CDNA arrays. Plant J. 14(5):643–652.
Dovichi, N.J. (1997). DNA sequencing by capillary electrophoresis. Electrophoresis 18(12–13):2393–2399.
Dunn, M.J., and Corbett, J.M. (1996). In Two-Dimensional Polyacrylamide Gel Electrophoresis.High Resolution Separation and Analysis of Biological Macromolecules. Part B, Applica-tions. Karger, B.L., and Hancook, W.S. (Eds.). San Diego, Academic Press, Vol. 271, pp.177–203.
Edman, P., and Begg, G. (1967). A protein sequenator. Eur. J. Biochem. 1(1):80–91.
Emmert-Buck, M.R., Gillespie, J.W., Paweletz, C.P., Ornstein, D.K., Basrur, V., Appella, E.,Wang, Q.H., Huang, J., Hu, N., Taylor, P., Petricoin, E.F. 3rd (2000). An approach to pro-teomic analysis of human tumors. Mol. Carcinog. 27(3):158–165.
Eng, J., McCormack, A.L., and Yates, J.R. III (1994). An approach to correlate tandem massspectral data of peptides with amino acid sequences in a protein database. J. Am. Soc. MassSpectrom. 5:976–989.
Fenn, J.B., Mann, M., and Meng, C.K. (1990). Electrospray ionization—principles and practice.Mass Spectro. Rev. 9(1):37.
Fialka, I., Pasquali, C., Lottspeich, F., Ahorn, H., and Huber, L.A. (1997). Subcellular fraction-ation of polarized epithelial cells and identification of organelle-specific proteins by two-dimensional gel electrophoresis. Electrophoresis 18(14):2582–2590.
Fichmann, J. (1999). Advantages of immobilized pH gradients. Methods Mol. Biol. 112:173–174.
Field, H.I., Fenyo, D., and Beavis, R.C. (2002). RADARS, a bioinformatics solution that auto-mates proteome mass spectral analysis, optimises protein identification, and archives data inrelational database. Proteomics 2:36–47.
Figeys, D., Zhang, Y., and Aebersold, R. (1998a). Optimization of solid phase microextraction–capillary zone electrophoresis–mass spectrometry for high sensitivity protein identification.Electrophoresis 19(13):2338–2347.
Figeys, D., Gygi, S., McKinnon, G., and Aebersold, R. (1998b). An integrated microfluidics–tandem mass spectrometry system for automated protein analysis. Anal. Chem. 70(18):3728–3734.
Figeys, D., Ning, Y., and Aebersold, R. (1997). A microfabricated device for rapid protein iden-tification by microelectrospray ion trap mass spectrometry. Anal. Chem. 69(16):3153–3160.
Futcher, B., Latter, G.I., Monardo, P., McLaughlin, C.S., and Garrels, J.I. (1999). A sampling ofthe yeast proteome. Mol. Cell. Biol. 19(11):7357–7368.
Garin, J., Diez, R., Kieffer, S., Demine, J.-F., Duclos, S., Gagnon, E., Sadoul, R., Rondeau, C.,and Desjardsins, M. (2001). The phagosome proteome: Insight into phagosome functions, J. Cell Biol. 152(1):165–180.
Ghaemmaghami, S., Huh, W.K., Bower, K., Howson, R.W., Belle, A., Dephoure, N., O’Shea,E.K., and Weissman, J.S. (2003). Global analysis of protein expression in year, Nature425:737–741.
Gibson, B.W., and Biemann, K. (1984). Strategy for the mass spectrometric verification and cor-rection of the primary structures of proteins deduced from their DNA sequences. Proc. Natl.Acad. Sci. U.S.A. 81:1956–1960.
Goldberg, M.E., Expert-Bezancon, N., Vuillard, L., and Rabilloud, T. (1996). Non-detergent sul-phobetaines: A new class of molecules that facilitate in vitro protein renaturation. Fold Des.1(1):21–27.
56 PROTEOMICS: THE BASIC OVERVIEW
Gomm, J.J., Browne, P., Coope, R., Liu, Q., Buluwela, L., and Coombes, R. (1995). Isolation ofpure populations of epithelial and myoepithelial cells from the normal human mammary glandusing immunomagnetic separation with dynabeads. Anal. Biochem. 226(1):91–99.
Gorg, A. (1993). Two-dimensional electrophoresis with immobilized PH gradients: Current state.Biochem. Soc. Trans. 21(1):130–132.
Gorg, A., Postel, W., and Gunther, S. (1988). The current state of two-dimensional electrophoresiswith immobilized pH gradients. Electrophoresis 9(9):531–546.
Gygi, S., and Aebersold, R. (1999). Absolute quantitation of 2-D protein spots. Methods Mol.Biol. 112:417–421.
Gygi, S., Corthals, G., Zhang, Y., Rochon, Y., and Aebersold, R. (2000). Evaluation of two-dimensional gel electrophoresis-based proteome analysis technology. Proc. Nat. Acad. Sci.97(17):9390–9395.
Gygi, S.P., Rist, B., Gerber, S.A., Turecek, F., Gelb, M.H., and Aebersold, R. (1999a). Quanti-tative analysis of complex protein mixtures using isotope-coded affinity tags. Nature Biotech.17:994–997.
Gygi, S., Rochon, Y., Franza, B., and Aebersold, R. (1999b). Correlation between protein andmRNA abundance in yeast. Mol. Cel. Biol. 19(3):1720–1730.
Himeda, C.L., Ranish, J.A., Angello, J.C., Maire, P., Aebersold, R., and Hauschka, S.D. (2004).Quantitative proteomic identification of six4 as the trex-binding factor in the muscle creatinekinase enhancer. Mol. Cell Biol. 24:2132–2143.
Hooker, T.F., and Jorgenson, J.W. (1997). A transparent flow gating interface for the coupling ofmicrocolumn LC with CZE in a comprehensive two-dimensional system. Anal. Chem.69:4134–4142.
Howell, K.E., Devaney, E., and Gruenberg, J. (1989). Subcellular fractionation of tissue culturecells. Trends Biochem. Sci. 14(2):44–47.
Hunt, D.F., Yates, J.R., Shabanowitz, J., Winston, S., and Hauer, C.R. (1986). Protein sequenc-ing by tandem mass spectrometry. Proc. Natl. Acad. Sci. U.S.A. 83:6233–6237.
Hunt, D.F., Bone, W.M., Shabanowitz, J., Rhodes, J., and Ballard, J.M. (1981). Sequence analy-sis of oliyopeptides by second ion/collision activated dissociation mass sepectrometry. Anal.Chem. 53:1704–1706.
Issaq, H.J., Conrads, T.P., Janini, G.M., and Veenstra, T.D. (2002). Methods for fractionation,separation and profiling of proteins and peptides. Electrophoresis 23:3048–3061.
Jackson, P., Urwin, V.E., and Mackay, C.D. (1988). Rapid imaging, using a cooled charge-coupled-device, of fluorescent two-dimensional polyacrylamide gels produced by labellingproteins in the first-dimensional isoelectric focusing gel with the fluorophore 2-methoxy-2,4-diphenyl-3(2h)furanone. Electrophoresis 9(7):330–339.
Jung, E., Heller, M., Sanchez, J.C., and Hochstrasser, D.F. (2000). Proteomics meets cell biology:The establishment of subcellular proteomes. Electrophoresis 21(16):3369–3377.
Karas, M., and Hillenkamp, F. (1988). Laser desorption ionization of proteins with molecularmasses exceding 10,000 daltons. Anal. Chem. 60:2299–2301.
Kern, W., Kohlmann, A., Wuchte, C., Schnittger, S., Schoch, C., Mergenthaler, S., Ratei, R.,Ludwig, W.D., Hiddemann, W., and Haferlach, T. (2003). Correlation of protein expressionand gene expression in acute leukemia. Cytometry 55B:29–36.
Klose, J., and Kobalz, U. (1995). “Two-dimensional electrophoresis of proteins: An updated protocol and implications for a functional analysis of the genome. Electrophoresis16(6):1034–1059.
LaCourse, W.R. (2002). Column liquid chromatography: Equipment and instrumentation. Analy.Chem. 72:37R–51R.
REFERENCES 57

Lal, A., Lash, A.E., Altschul, S.F., Velculescu, V., Zhang, L., McLendon, R.E., Marra, M.A.,Prange, C., Morin, P.J., Polyak, K., Papadopoulos, N., Vogelstein, B., Kinzler, K.W., Stansberg, R.L., and Riggins, G.L. (1999). A public database for gene expression in humancancers. Cancer Res 59(21):5403–5407.
Lewis, K.C., Opiteck, G.J., Jorgenson, J.W., and Sheeley, D.M. (1997). Comprehensive onlineRPLC-CZE-MS of peptides. J. Am. Soc. Mass Spectrom. 8(5):495–500.
Li, J., Kelly, J.F., Chernushevich, I., Jed Harrison, D.J., and Thibault, P. (2000). Separation andidentification of peptides from gel-isolated membrane proteins using a microfabricated devicefor combined capillary electrophoresis/nanoelectrospray mass spectrometry. Anal. Chem.72:599–609.
Li, I., Thibault, P., Bings, N.H., Skinner, C.D., Wang, C., Colyer, C., and Harrison, J. (1999).Integration of microfabricated devices to capillary electrophoresis–electrospray mass spec-trometry using a low dead volume connection: Application to rapid analyses of proteolyticdigests. Anal. Chem. 71(15):3036–3045.
Loboda, A.V., Krutchinsky, A.N., Bromirski, M., Ens, W., and Standing, K.G. (2000). A tandemquadrupole/time-of-flight mass spectrometer with a matrix-assisted laser desorption/ioniza-tion source: Design and performance. Rapid Commun. Mass Spectrom. 14(12):1047–1057.
Lubec, G., Krapfenbauer, K., and Fountoulakis, M. (2003) Proteomics in brain research: Poten-tials and limitations. Prog. Neurobiol. 69:193–211.
Luche, S., Santoni, V., and Rabilloud, T. (2003). Evaluation of nonionic and zwitterionic deter-gents as membrane protein solubilizers in two-dimensional electrophoresis. Proteomics3:249–253.
Madden, S.L., Galella, E.A., Zhu, J.S., Bertelsen, A.H., and Beaudry, G.A. (1997). Sage tran-script profiles for P53-dependent growth regulation. Oncogene 15(9):1079–1085.
Mann, M., and Wilm, M. (1994). Error-tolerant identification of peptides in sequence databasesby peptide sequence tags. Anal. Chem. 66(24):4390–4399.
Marshall, A., and Hodgson, J. (1998). DNA chips: An array of possibilities. Nature Biotech.16:27–31.
Martin, S.E., Shabanowitz, J., Hunt, D.F., and Marto, J.A. (2000). Subfemtomole MS and MS/MSpeptide sequence analysis using nano-HPLC micro-ESI Fourier transform ion cyclotron res-onance mass spectrometry. Anal. Chem. 72:4266–4274.
Matsui, N.M., Smith-Beckerman, D.M., and Epstein, L.B. (1999a). Staining of preparative 2-Dgels. Coomassie blue and imidazole-zinc negative staining. Methods Mol. Biol. 112:307–311.
Matsui, N.M., Smith-Beckerman, D.M., Fichmann, J., and Epstein, L.B. (1999b). Runningpreparative carrier ampholyte and immobilized pH gradient IEF gels for 2D. Methods Mol.Biol. 112:211–219.
Matsumura, H., Nirasawa, S., and Terauchi, R. (1999). Technical advance: Transcript profilingin rice (Oryza sativa L.). Plant J. 20(6):719–726.
McCormack, A.L., Schieltz, D.M., Goode, B., Yang, S., Barnes, G., Drubin, D., and Yates, J.R.(1997). Direct analysis and identification of proteins in mixtures by LC/MS/MS and databasesearching at the low-femtomole level. Anal. Chem. 69(4):767–776.
Moseley, M.A., Deterding, L.J., Tomer, K.B., and Jorgenson, J.W. (1989). Coupling of capillaryzone electrophoresis and capillary liquid chromatography with coaxial continuous-flow fastatom bombardment tandem sector mass spectrometry. J. Chrom. 480:197–209.
Munchbach, M., Quadroni, M., Miotto, G., and James, P. (2000). Quantitation and facilitated de novo sequencing of proteins by isotopic N-terminal labeling of peptides with a fragmentation-directing moiety. Anal. Chem. 72:4047–4057.
58 PROTEOMICS: THE BASIC OVERVIEW

Neilson, L., Andalibi, A., Kang, D., Coutifaris, C., Strauss, J.F., 3rd, Stanton, J.A., and Green, D.P.(2000). Molecular phenotype of the human oocyte by PCR-SAGE. Genomics 63(1):13–24.
O’Farrell, P.H. (1975). High resolution two-dimensional electrophoresis of proteins. J. Biol.Chem. 250(10):4007–4021.
Opiteck, G.J., Jorgenson, J.W., Moseley III, M.A., and Anderegg, R.J. (1998). Two-dimensionalmicrocolumn HPLC coupled to a single-quadrupole mass spectrometer for the elucidation ofsequence tags and peptide mapping. J. Microcolumn Separations 10(4):365–376.
Opiteck, G.J., Lewis, K.C., Jorgenson, J.W., and Anderegg, R.J. (1997). Comprehensive on-lineLC/LC/MS of proteins. Anal. Chem. 68:1518–1524.
Ornstein, D.K., Gillespie, J.W., Paweletz, C.P., Duray, P.H., Herring, J., Vocke, C.D., Topalian,S.L., Bostwick, D.G., Linehan, W.M., Petricoin III, E.F., and Emmert-Buck, M.R. (2000).Proteomic analysis of laser capture microdissected human prostate cancer and in vitro prostatecell lines. Electrophoresis 21(11):2235–2242.
Ostergaard, M., Rasmussen, H.H., Nielsen, H.V., Vorum, H., Orntoft, T.F., Wolf, H., and Celis,J.E. (1997). Proteome profiling of bladder squamous cell carcinomas: Identification ofmarkers that define their degree of differentiation. Cancer Res. 57(18):4111–4117.
Page, M.J., Amess, B., Townsend, R.R., Parekh, R., Herath, A., Brusten, L., Zvelebil, M.J., Stein,R.C., Waterfield, M.D., Davies, S.C., and O’Hare, M.J. (1999). Proteomic definition of normalhuman luminal and myoepithelial breast. Proc. Natl. Acad. Sci. U.S.A. 96(22):12589–12594.
Papayannopoulos, I.A. (1995). The interpretation of collision-induced dissociation tandem massspectra of peptides. Mass Spectrom. Rev. 14:49–73.
Pappin, D.J.C., Hojrup, P., and Bleasby, A.J. (1993). Rapid identification of proteins by peptide-mass fingerprinting. Curr. Biol. 3(6):327–332.
Patterson, S.D., Thomas, D., and Bradshaw, R.A. (1996). Application of combined mass spectrometry and partial amino acid sequence to the identification of gel-separated proteins.Electrophoresis 17(5):877–891.
Perrin-Cocon, L.A., Marche, P.N., and Villiers, C.L. (1999). Purification of intracellular compartments involved in antigen processing: A new method based on magnetic sorting.Biochem. J. 338:123–130.
Perrot, M., Sagliocco, F., Mini, T., Monribot, C., Schneider, U., Shevchenko, A., Mann, M., Jeno,P., and Boucherie, H. (1999). Two-dimensional gel protein database of Saccharomyces cere-visiae. Electrophoresis 20:2280–2298.
Rabilloud, T. (2002). Two-dimensional gel electrophoresis in proteomics: Old, old fashioned, bitit still climbs up the mountains. Proteomics 2:3–10.
Rabilloud, T. (2000). Detecting proteins. Separated by 2-D gel electrophoresis. Anal. Chem.72(1):48A–55A.
Rabilloud, T. (1999). Silver staining of 2-D electrophoresis gels. Methods Mol. Biol. 112:297–305.
Rabilloud, T. (1998). Use of thiourea to increase the solubility of membrane proteins in two-dimensional electrophoresis. Electrophoresis 19(5):758–760.
Rabilloud, T. (1996). Solubilization of proteins for electrophoretic analyses. Electrophoresis17(5):813–829.
Rabilloud, T. (1990). Mechanisms of protein silver staining in polyacrylamide gels: A 10-yearsynthesis. Electrophoresis 11(10):785–794.
Rabilloud, T., Blisnick, T., Heller, M., Luche, S., Aebersold, R., Lunardi, J., and Braun-Breton,C. (1999). Analysis of membrane proteins by two-dimensional electrophoresis: Comparison
REFERENCES 59

of the proteins extracted from normal or Plasmodium falciparum-infected erythrocyte ghosts.Electrophoresis 20(18):3603–3610.
Rabilloud, T., Vuillard, L., Gilly, C., and Lawrence, J.J. (1994). Silver-staining of proteins inpolyacrylamide gels: A general overview. Cell Mol. Biol. (Noisy-le-grand) 40(1):57–75.
Ramagli, L.S. (1999). Quantifying protein in 2-D page solubilization buffers. Methods Mol. Biol.112:99–103.
Richert, S., Luche, S., Chevallet, M., Van Dorsselaer, A., Leize-Wagner, E., and Rabilloud, T.(2004). About the mechanism of interference of silver staining with peptide mass spectro-metry. Proteomics 4:909–916.
Righetti, P.G., and Bossi, A. (1997a). Isoelectric focusing in immobilized pH gradients: Anupdate. J. Chromatogr. B Biomed. Sci. App. 699(1–2):77–89.
Righetti, P.G., and Bossi, A. (1997b). Isoelectric focusing in immobilized pH gradients: Recentanalytical and preparative developments. Anal. Biochem. 247(1):1–10.
Righetti, P.G., and Gianazza, E. (1987). Isoelectric focusing in immobilized pH gradients: Theoryand newer methodology. Methods Biochem. Anal. 32:215–278.
Righetti, P.G., Gianazza, E., and Bjellqvist, B. (1983). Modern aspects of isoelectric focusing:Two-dimensional maps and immobilized pH gradients. J. Biochem. Biophys. Methods 8(2):89–108.
Rosenfeld, J., Capdevielle, J., Guillemot, J.C., and Ferrara, P. (1992). In-gel digestion of proteinsfor internal sequence analysis after one- or two-dimensional gel electrophoresis. Anal.Biochem. 203(1):173–179.
Ross-Macdonald, P., Coelho, P.S., Roemer, T., Agarwal, S., Kumar, A., Jansen, R., Cheung, K.H.,Sheehan, A., Symoniatis, D., Umansky, L., Heidiman, M., Nelson, F.K., Iwasaki, H., Hager,K., Gerstein, M., Miller, P., Roeder, G.S., and Snyder, M. (1999). Large-scale analysis of theyeast genome by transposon tagging and gene disruption. Nature 402(6760):413–418.
Ruan, Y., Gilmore, J., and Conner, T. (1998). Towards arabidopsis genome analysis: Monitoringexpression profiles of 1400 genes using cDNA microarrays. Plant J. 15(6):821–833.
Sanchez, J.C., Hochstrasser, D., and Rabilloud, T. (1999). In-gel sample rehydration of immo-bilized pH gradient. Methods Mol. Biol. 112:221–225.
Santoni, V., Rabilloud, T., Doumas, P., Rouquie, D., Mansion, M., Kieffer, S., Garin, J., andRossignol, M. (1999). Towards the recovery of hydrophobic proteins on two-dimensional.Electrophoresis 20(4–5):705–711.
Sarto, C., Valsecchi, C., and Mocarelli, P. (2002). Renal cell carcinoma: Handling and treatment.Proteomics 2:1627–1629.
Service, R.F. (1998). Microchip arrays put DNA on the spot. Science 282(5388):396–401.
Shevchenko, A., Loboda, A., Shevchenko, A., Ens, W., and Standing, K.G. (2000). MALDIquadrupole time-of-flight mass spectrometry: A powerful tool for proteomic research. Anal.Chem. 72(9):2132–2141.
Shevchenko, A., Chernushevich, I., Ens, W., Standing, K.G., Thomson, B., Wilm, M., and Mann,M. (1997). Rapid “de novo” peptide sequencing by a combination of nanoelectrospray, iso-topic labeling and a quadrupole/time-of-flight mass spectrometer. Rapid Comm. Mass Spec-trom. 11(9):1015–1024.
Shevchenko, A., Jensen, O.N., Podtelejnikov, A.V., Sagliocco, F., Wilm, M., Vorm, O.,Mortensen, P., Shevchenko, A., Boucherie, H., and Mann, M. (1996a). Linking genome andproteome by mass spectrometry: Large-scale identification of yeast proteins from two dimen-sional gels. Proc. Nat. Acad. Sci. U.S.A. 93(25):14440–14445.
60 PROTEOMICS: THE BASIC OVERVIEW

Shevchenko, A., Wilm, M., Vorm, O., and Mann, M. (1996b). Mass spectrometric sequencing ofproteins silver-stained polyacrylamide gels. Anal. Chem. 68(5):850–858.
Sirivatanauksorn, Y., Drury, R., Crnogorac-Jurcevic, T., Sirivatanauksorn, V., and Lemoine, N.(1999). Laser-assisted microdissection: Applications in molecular pathology. J. Pathol.189(2):150–154.
Smith, B.J. (1994). Quantification of proteins on polyacrylamide gels (nonradioactive). MethodsMol. Biol. 32:107–111.
Stein, W.D., Litman, T., Fojo, T., and Bates, S.E. (2004). A serial analysis of gene expression(SAGE) database analysis of chemosensitivity: Comparing solid tumors with cell lines andcomparing solid tumors from different tissue origins. Cancer Res. 64:2805–2816.
Steinberg, T.H., Chernokalskaya, E., Berggren, K., Lopez, M.F., Diwu, Z., Haugland, R.P., andPatton, W.F. (2000). General—ultrasensitive fluorescence protein detection in isoelectricfocusing gels using a ruthenium metal chelate stain. Electrophoresis 21(3):486–496.
Steinberg, T.H., White, H.M., and Singer, V.L. (1997). Optimal filter combinations for photographing Sypro orange or Sypro red dye-stained gels. Anal. Biochem. 248(1):168–172.
Steinberg, T.H., Haugland, R.P., and Singer, V.L. (1996a). Applications of Sypro orange andSypro red protein gel stains. Anal. Biochem. 239(2):238–245.
Steinberg, T.H., Jones, L.J., Haugland, R.P., and Singer, V.L. (1996b). Sypro orange and Syprored protein gel stains: One-step fluorescent staining of denaturing gels for detection ofnanogram levels of protein. Anal. Biochem. 239(2):223–237.
Tan, D., Deeb, G., Wang, J., Slocum, H.K., Winsto, J., Wiseman, S., Beck, A., Sait, S., Anderson, T., Nwogu, C., Ramnath, N., and Loewen, G. (2003). HER-2/neu protein expres-sion and gene alteration in stage I-IIIA non-small-cell lung cancer: A study of 140 cases usinga combination of high throughput tissue microarray, immunohistochemistry, and fluorescentin situ hybridization. Diagn. Mol. Pathol. 12:201–211.
Tastet, C., Lescuyer, P., Diemer, H., Luche, S., van Dorsselaer, A., and Rabilloud, T. (2003). Aversatile electrophoresis system for the analysis of high- and low-molecular-weight proteins.Electrophoresis 24:1787–1794.
Tonge, R., Shaw, J., Middleton, B., Rowlinson, R., Rayner, S., Young, J., Pognan, F., Hawkins,E., Currie, I., and Davison, M. (2001). Validation and development of fluorescence two-dimensional differential gel electrophoresis proteomics technology. Proteomics 1:377–396.
Unlu, M., Morgan, M., and Minden, J. (1997). Difference gel electrophoresis: A single gel methodfor detecting changes in protein extracts. Electrophoresis 18(11):2071–2077.
Urwin, V.E., and Jackson, P. (1993). Two-dimensional polyacrylamide gel electrophoresis of pro-teins labeled with the fluorophore monobromobimane prior to first-dimensional isoelectricfocusing: Imaging of the fluorescent protein spot patterns using a cooled charge-coupleddevice. Anal. Biochem. 209(1):57–62.
Urwin, V., and Jackson, P. (1991). A multiple high-resolution mini two-dimensional polyacry-lamide gel electrophoresis system: Imaging two-dimensional gels using a cooled charge-coupled device after staining with silver or labeling with fluorophore. Anal. Biochem.195(1):30–37.
Velculescu, V.E., Zhang, L., Vogelstein, B., and Kinzler, K.W. (1995). Serial analysis of geneexpression. Science 270(5235):484–487.
Wang, H., and Hanash, S. (2003). Multi-dimensional liquid phase based separations in pro-teomics. J. Chromatogr. B Analyt Technol. Biomed Life Sci. 787:11–18.
REFERENCES 61

Wang, C., Oleschuk, R., Ouchen, F., Li, J., Thibault, P., and Harrison, J. (2000). Integration ofimmobilized trypsin bead beds for protein digestion within a microfluidic chip incorporatingcapillary electrophoresis separations and an electrospray ionization interface. Rap. Comm.Mass Spectrom. 14:1377–1383.
Washburn, M.P., Wolters, D., and Yates, J.R.I. (2001). Large-scale analysis of the yeast proteomeby multidimensional protein identification technology. Nature Biotech. 19:242–247.
Weeraratna, A.T., Becker, D., Carr, K.M., Duray, P.H., Rosenblatt, K.P., Yang, S., Chen, Y.,Bittner, M., Strausberg, R.L., Riggins, G.J., Wagner, U., Kallioniemi, O.P., Trent, J.M., Morin,P.J., and Meltzer, P.S. (2004). Generation and analysis of melanoma SAGE libraries: SAGEadvice on the melanoma transcriptome. Oncogene 23:2264–2274.
Wilkins, M.R., Gasteiger, E., Sanchez, J.C., Bairoch, A., and Hochstrasser, D.F. (1998). Two-dimensional gel electrophoresis for proteome projects: The effects of protein hydrophobicityand copy number. Electrophoresis 19(8–9):1501–1505.
Wilkins, M.R., Ou, K., Appel, R.D., Sanchez, J.C., Yan, J.X., Golaz, O., Farnsworth, V., Cartier,P., Hochstrasser, D.F., Williams, K.L., and Gooley, A.A. (1996a). Rapid protein identificationusing N-terminal “sequence tag” and amino acid analysis. Biochem. Biophys. Res. Commun.221(3):609–613.
Wilkins, M.R., Hochstrasser, D.F., Sanchez, J.C., Bairoch, A., and Appel, R.D. (1996b). Inte-grating two dimensional gel databases using the Melanie II software. Trends Biochem. Sci.21(12):496–497.
Wilm, M., Shevchenko, A., Houthaeve, T., Breit, S., Schweigerer, L., Fotsis, T., and Mann, M.(1996). Femtomole sequencing of proteins from polyacrylamide gels by nano-electrospraymass spectrometry. Nature 379(Feb. 1):466–469.
Wimmer, K., Kuick, R., Thoraval, D., and Hanash, S.M. (1996). Two-dimensional separationsof the genome and proteome of neuroblastoma cells. Electrophoresis 17(11):1741–1751.
Yan, J.X., Devenish, A.T., Wait, R., Stone, T., Lewis, S., and Fowler, S. (2002). Fluorescencetwo-dimensional difference gel electrophoresis and mass spectrometry based proteomic analy-sis of Escherichia coli. Proteomics 2:1682–1698.
Yates, J.R., McCormack, A.L., Link, A.J., Schieltz, D., Eng, J., and Hays, L. (1996). Futureprospects for the analysis of complex biological systems using micro-column liquid chro-matography electrospray tandem mass spectrometry. Analyst 121(7):R65–R76.
Yates, J.R. III, Eng, J.K., McCormack, A.L., and Schieltz, D. (1995). Method to correlate tandemmass-spectra of modified peptides to amino-acid-sequences in the protein database. Anal.Chem. 67:1426–1436.
Zhang, W., and Chait, B.T. (2000). Profound: An expert system for protein identification usingmass spectrometric peptide mapping information. Anal. Chem. 72:2482–2489.
Zhang, B., Liu, H., Karger, B.L., and Foret, F. (1999). Microfabricated devices for capillary electrophoresis–electrospray mass spectrometry. Anal. Chem. 71(15):3258–3264.
62 PROTEOMICS: THE BASIC OVERVIEW