proteomics as a tool for optimization of human -
TRANSCRIPT
1
Proteomics as a tool for optimization of human
plasma protein separation and characterization of preparations of plasma-
derived therapeutic proteins

2
Djuro JosicBrown Medical School
Proteomics CoreCOBRE Center for Cancer Research
DevelopmentProvidence, RI
USA
3
Douglas HixsonCOBRE CCRD & Brown University, Providence, RI, USA
Feilei Hung and Xinli Yang COBRE CCRD, Providence, RI, USA
Mari Kino Brown, Department of Biotechnology, Johns Hopkins University, Baltimore, MD, USA
James Clifton, Department of Molecular Pharmacology, Physiology and Biotechnology, Brown University, Providence, RI, USA
Yow-Pin Lim, ProThera Biologics, East Providence, RI, USA
Spomenka Kovac, Department of Chemistry, J. J. Strossmayer University, Osijek, Croatia.
Egbert Mueller, Tosoh Bioscience, Stuttgart, Germany
4
1. The use of proteomics techniques for characterization and validation of chromatographic separations and other down-steam processing steps.
2. Proteomics methods as an additional tool for characterization of final preparations and determination of batch-to-batch variations.
5
How to use proteomics in process development?
6
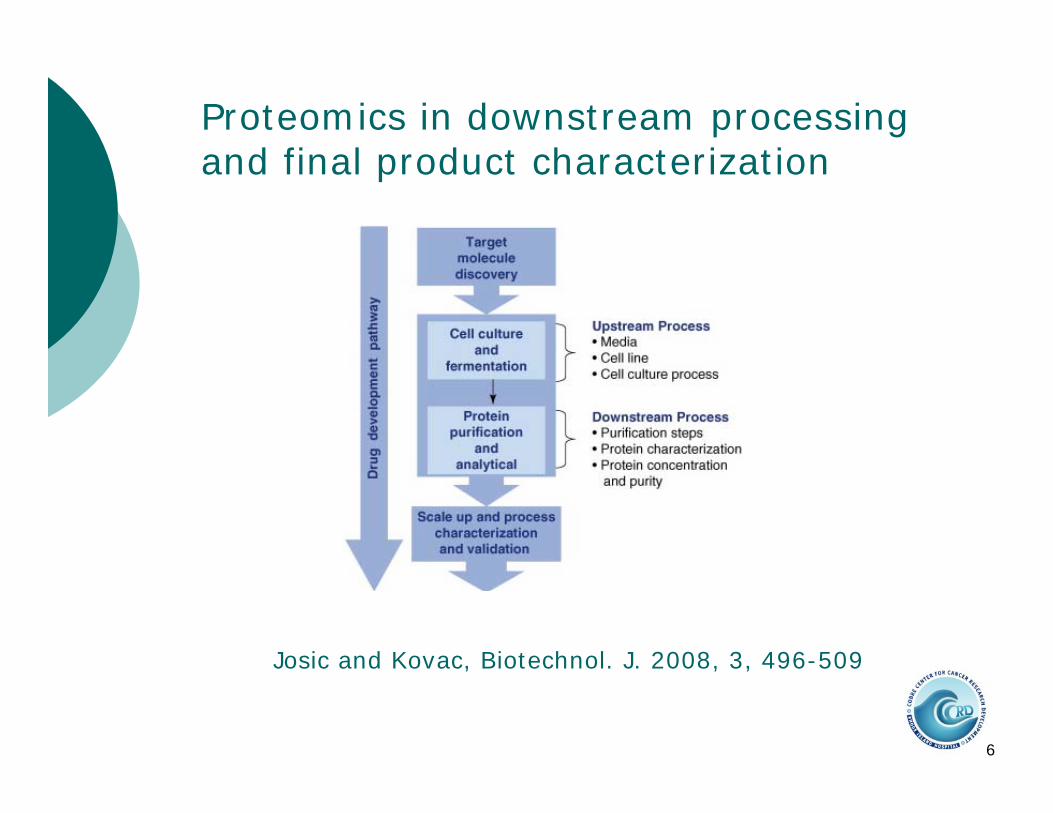
Josic and Kovac, Biotechnol. J. 2008, 3, 496-509
Proteomics in downstream processing and final product characterization
7
Development of a new separation process
8
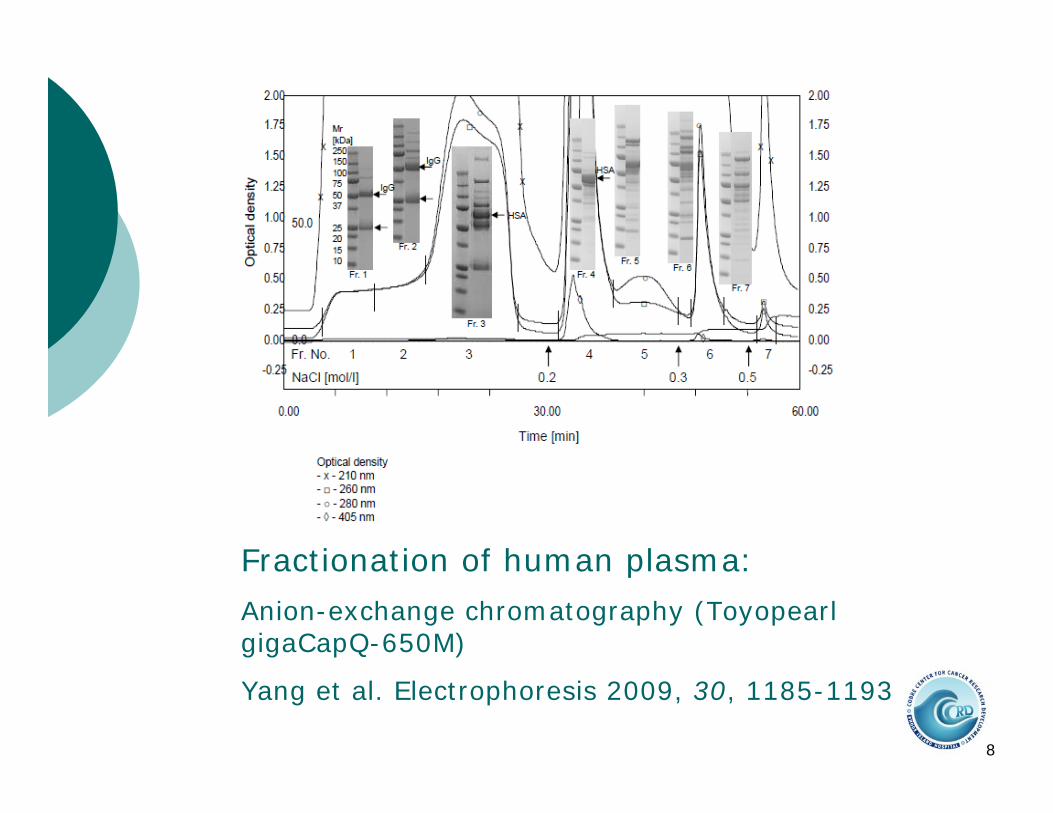
Fractionation of human plasma:
Anion-exchange chromatography (ToyopearlgigaCapQ-650M)
Yang et al. Electrophoresis 2009, 30, 1185-1193

9
SDS-PAGE of collected fractions. Protein bands were excised, tryptically digested and proteins were identified by RP-LC-ESI-MS/MS
Yang et al. Electrophoresis 2009, 30, 1185-1193
10
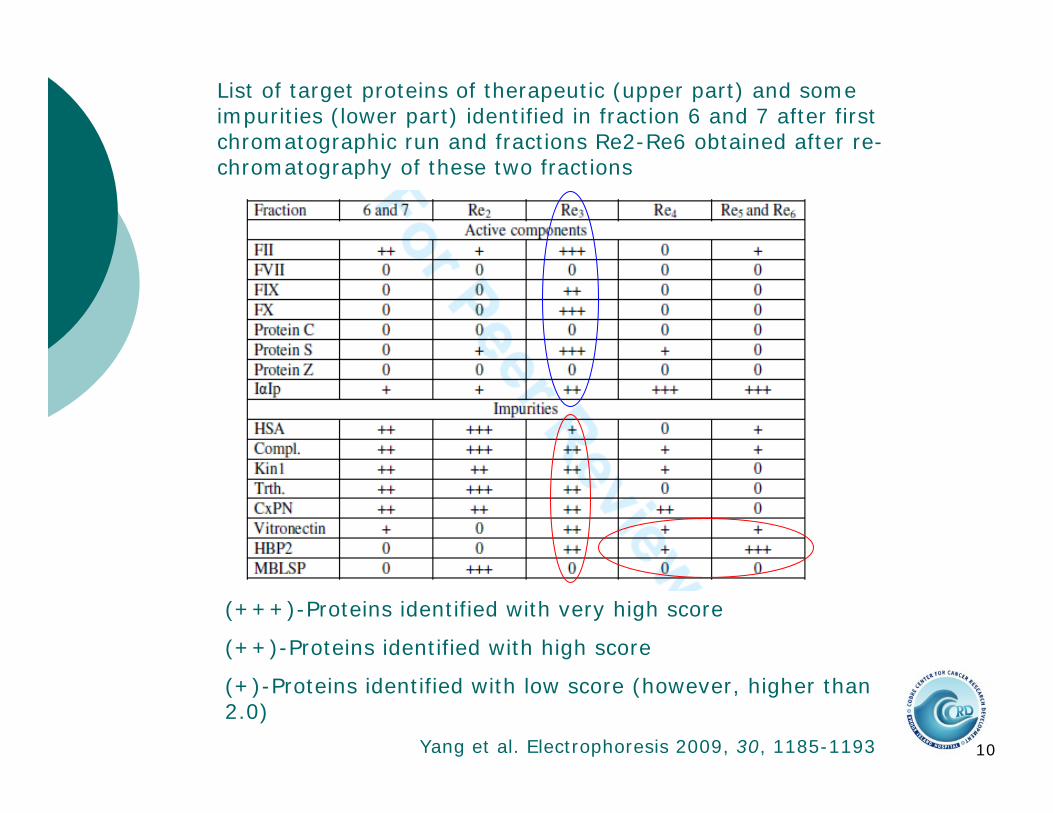
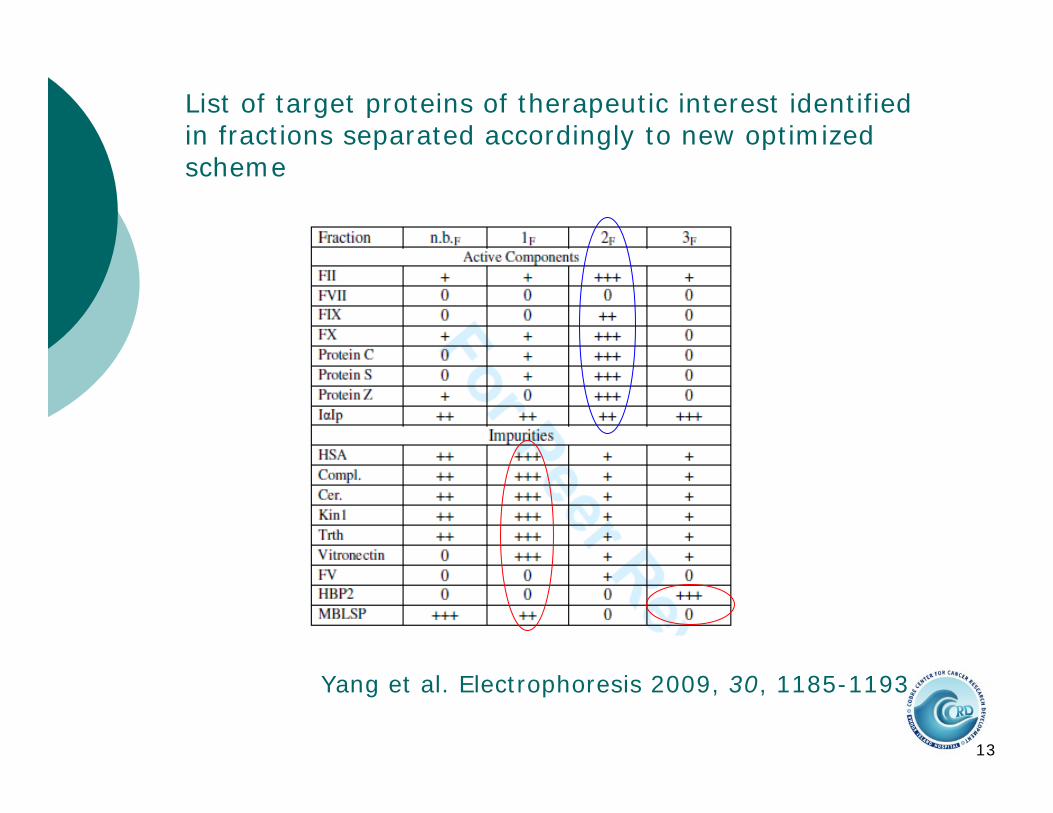
List of target proteins of therapeutic (upper part) and some impurities (lower part) identified in fraction 6 and 7 after first chromatographic run and fractions Re2-Re6 obtained after re-chromatography of these two fractions
(+++)-Proteins identified with very high score
(++)-Proteins identified with high score
(+)-Proteins identified with low score (however, higher than 2.0)
Yang et al. Electrophoresis 2009, 30, 1185-1193

11
Fractionation of human plasma:
Optimization of the separation on Toyopearl giga Cap Q-650M
Yang et al. Electrophoresis 2009, 30, 1185-1193
12
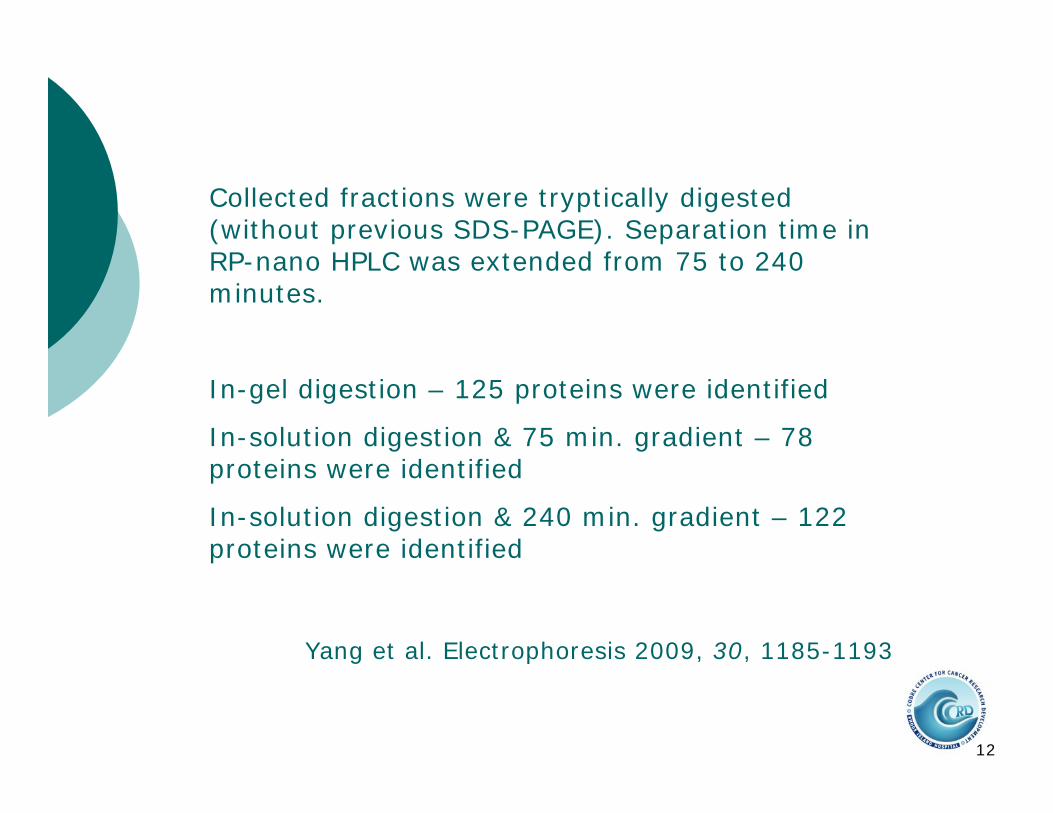
Collected fractions were tryptically digested (without previous SDS-PAGE). Separation time in RP-nano HPLC was extended from 75 to 240 minutes.
In-gel digestion – 125 proteins were identified
In-solution digestion & 75 min. gradient – 78 proteins were identified
In-solution digestion & 240 min. gradient – 122 proteins were identified
Yang et al. Electrophoresis 2009, 30, 1185-1193
13
List of target proteins of therapeutic interest identified in fractions separated accordingly to new optimized scheme
Yang et al. Electrophoresis 2009, 30, 1185-1193

14
Validation of an existing process isolation of clotting factor IX from human plasma

15Josic et al. J. Chrom B 2003, 750, 183-197
16
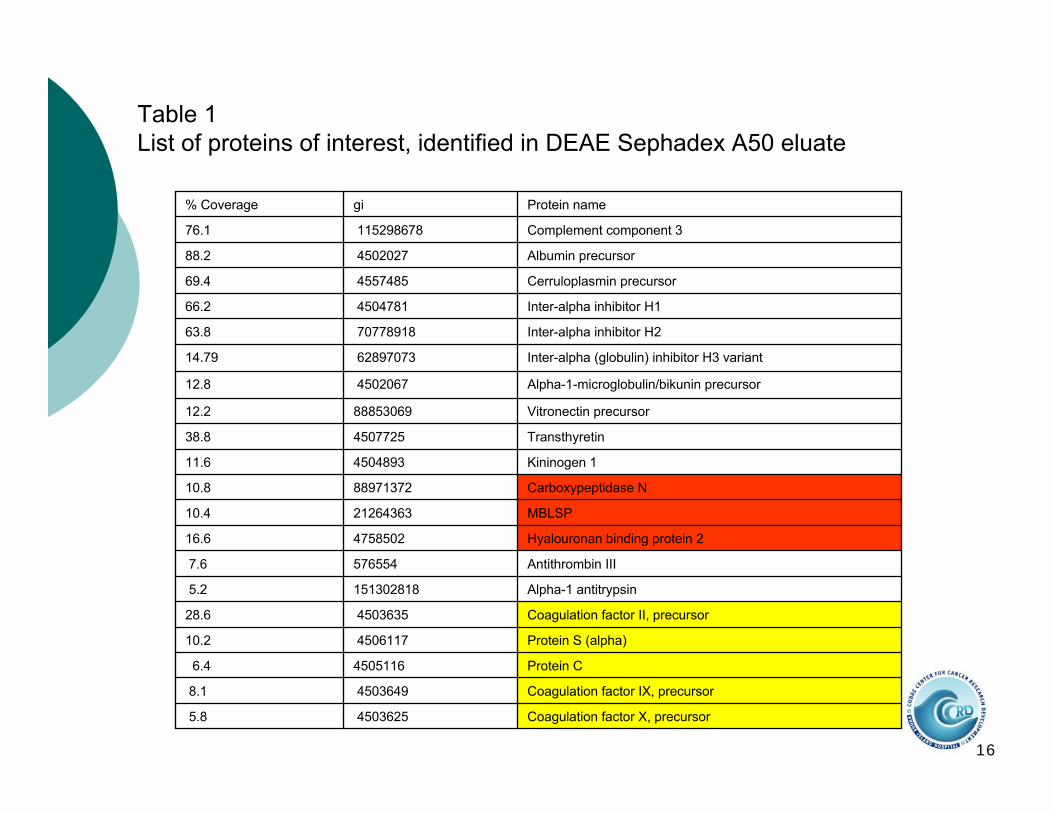
Table 1List of proteins of interest, identified in DEAE Sephadex A50 eluate
Coagulation factor X, precursor45036255.8
Coagulation factor IX, precursor45036498.1
Protein C45051166.4
Protein S (alpha)450611710.2
Coagulation factor II, precursor450363528.6
Alpha-1 antitrypsin1513028185.2
Antithrombin III5765547.6
Hyalouronan binding protein 2475850216.6
MBLSP2126436310.4
Carboxypeptidase N8897137210.8
Kininogen 1450489311.6
Transthyretin450772538.8
Vitronectin precursor8885306912.2
Alpha-1-microglobulin/bikunin precursor450206712.8
Inter-alpha (globulin) inhibitor H3 variant6289707314.79
Inter-alpha inhibitor H27077891863.8
Inter-alpha inhibitor H1450478166.2
Cerruloplasmin precursor455748569.4
Albumin precursor450202788.2
Complement component 311529867876.1
Protein namegi% Coverage
17
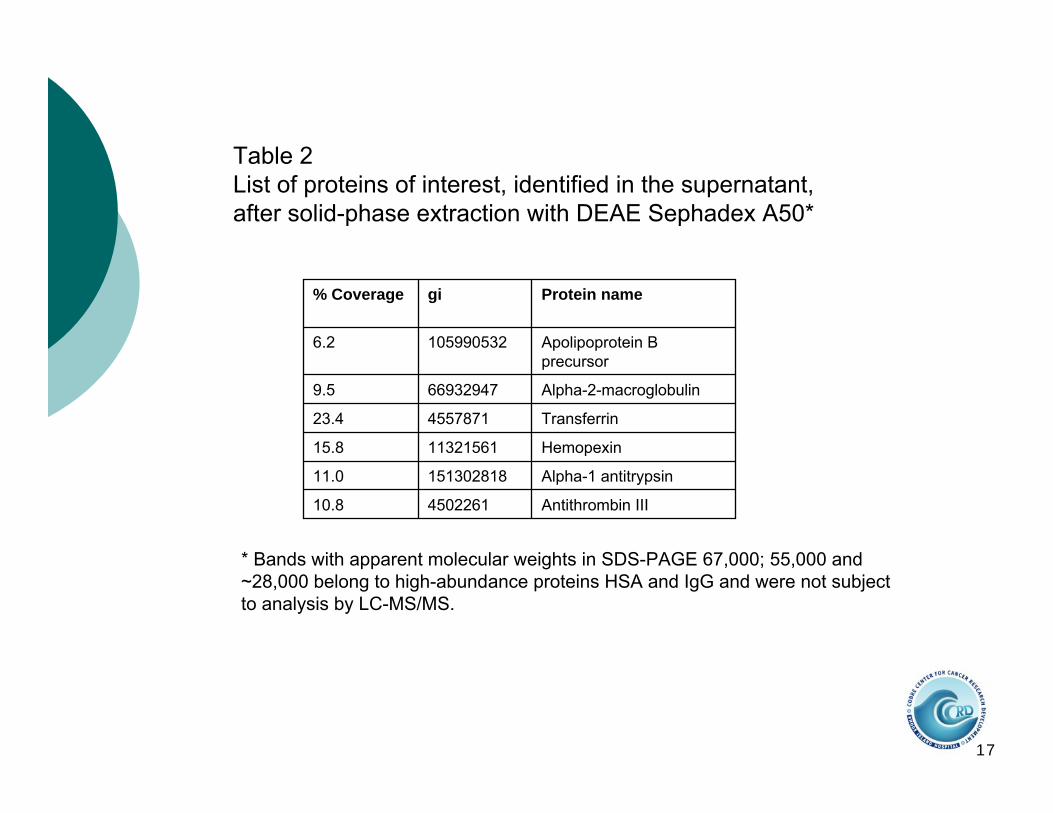
Table 2List of proteins of interest, identified in the supernatant, after solid-phase extraction with DEAE Sephadex A50*
Antithrombin III450226110.8
Alpha-1 antitrypsin15130281811.0
Hemopexin1132156115.8
Transferrin455787123.4
Alpha-2-macroglobulin669329479.5
Apolipoprotein B precursor
1059905326.2
Protein namegi% Coverage
* Bands with apparent molecular weights in SDS-PAGE 67,000; 55,000 and ~28,000 belong to high-abundance proteins HSA and IgG and were not subject to analysis by LC-MS/MS.
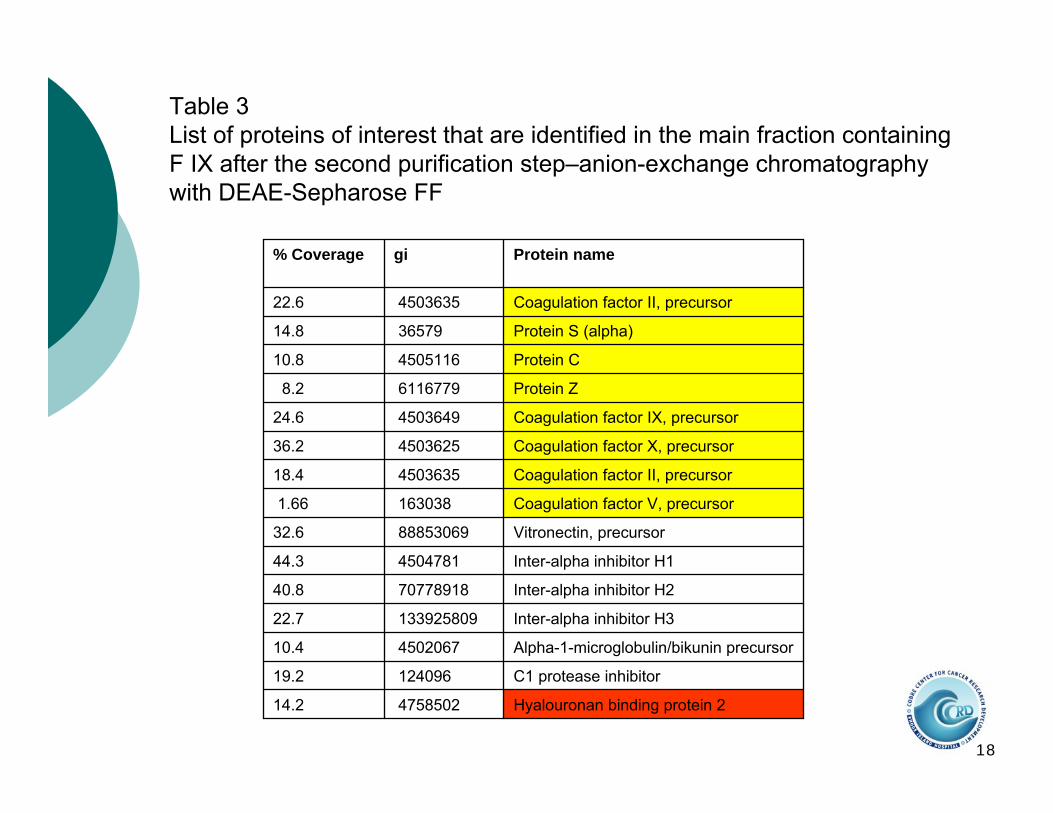
18
Table 3List of proteins of interest that are identified in the main fraction containing F IX after the second purification step–anion-exchange chromatography with DEAE-Sepharose FF
Hyalouronan binding protein 2475850214.2
C1 protease inhibitor12409619.2
Alpha-1-microglobulin/bikunin precursor450206710.4
Inter-alpha inhibitor H313392580922.7
Inter-alpha inhibitor H27077891840.8
Inter-alpha inhibitor H1450478144.3
Vitronectin, precursor8885306932.6
Coagulation factor V, precursor1630381.66
Coagulation factor II, precursor450363518.4
Coagulation factor X, precursor450362536.2
Coagulation factor IX, precursor450364924.6
Protein Z61167798.2
Protein C450511610.8
Protein S (alpha)3657914.8
Coagulation factor II, precursor450363522.6
Protein namegi% Coverage

19
Table 4Complete list of proteins identified in the eluate from the Heparin Sepharose FF column after “in-gel” digestion and LC-MS/MS.
Coagulation factor IXa precursor – human*675961.95
Coagulation factor IXa precursor - human6759618.44
Vitronectin (Homo sapiens)1347716920.04
Inter-alpha trypsin inhibitor heavy chain 1339897.68
Trypsin inhibitor (inter-alpha), complete protein
339855.81
Protein namegi% Coverage
*One peptide identified in low-molecular band-product of the proteolyticdigestion during the isolation process
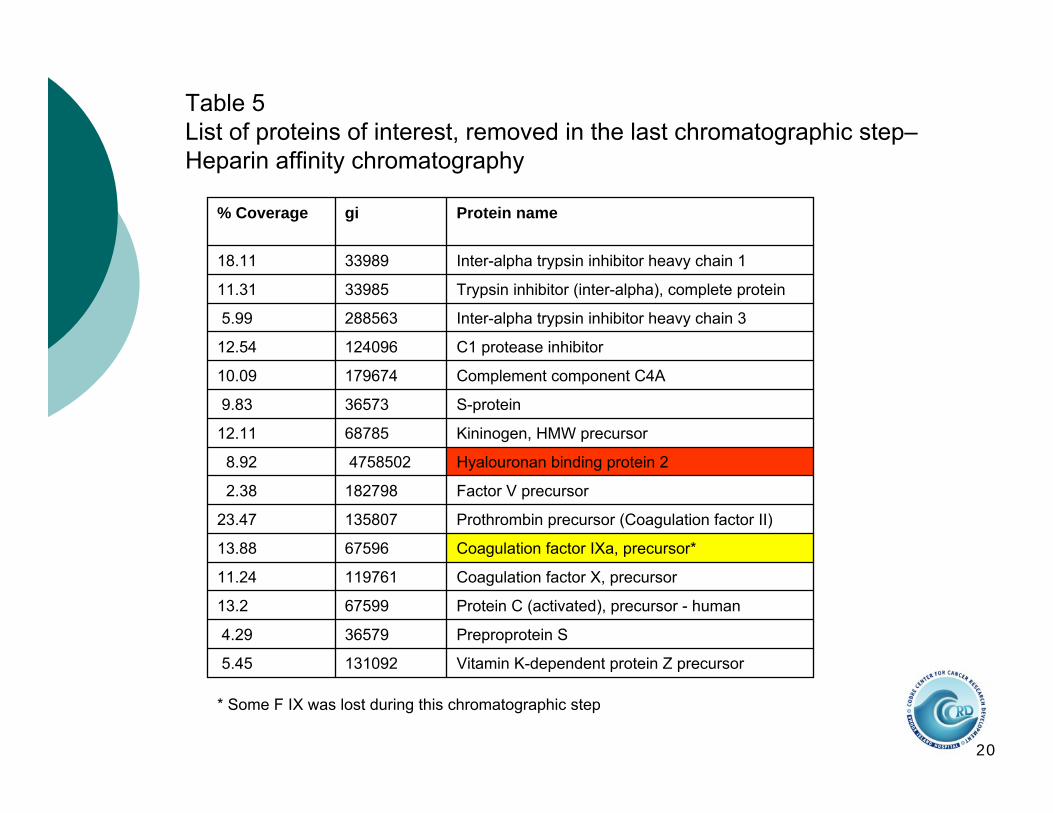
20
Vitamin K-dependent protein Z precursor1310925.45
Preproprotein S365794.29
Protein C (activated), precursor - human6759913.2
Coagulation factor X, precursor11976111.24
Coagulation factor IXa, precursor*6759613.88
Prothrombin precursor (Coagulation factor II)13580723.47
Factor V precursor1827982.38
Hyalouronan binding protein 247585028.92
Kininogen, HMW precursor6878512.11
S-protein 365739.83
Complement component C4A17967410.09
C1 protease inhibitor12409612.54
Inter-alpha trypsin inhibitor heavy chain 32885635.99
Trypsin inhibitor (inter-alpha), complete protein3398511.31
Inter-alpha trypsin inhibitor heavy chain 13398918.11
Protein namegi% Coverage
* Some F IX was lost during this chromatographic step
Table 5List of proteins of interest, removed in the last chromatographic step–Heparin affinity chromatography

21
NANOFILTRATION
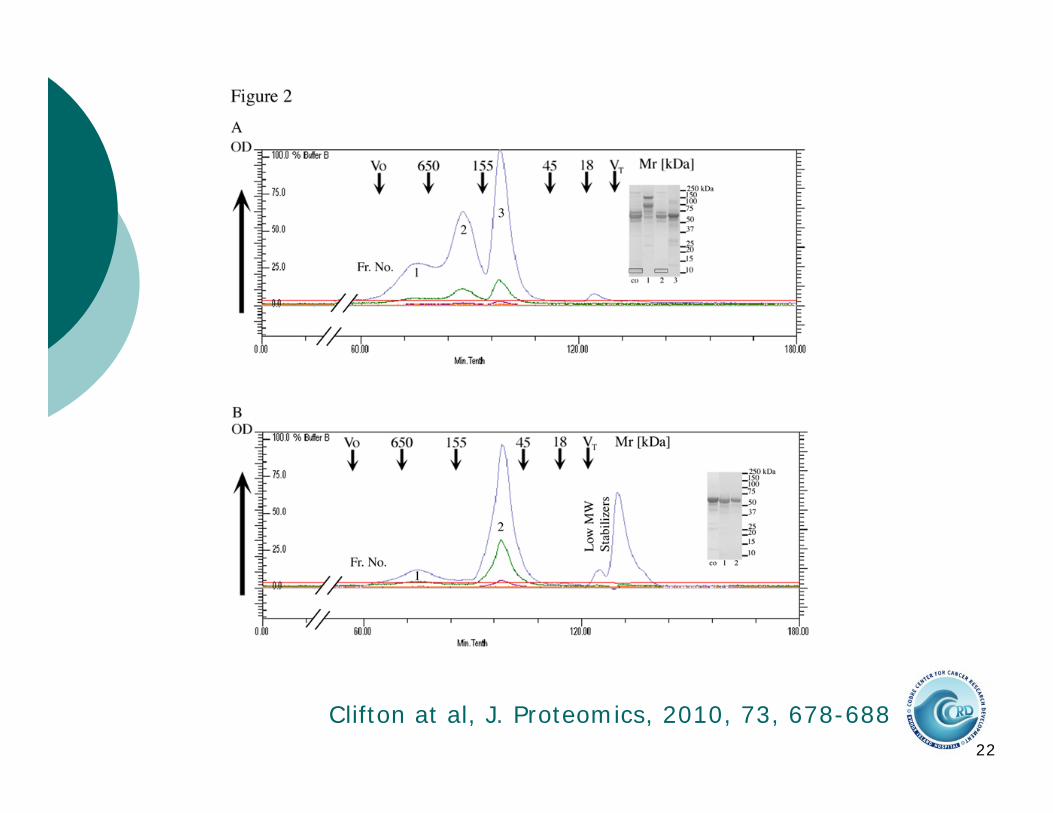
22
Clifton at al, J. Proteomics, 2010, 73, 678-688
23
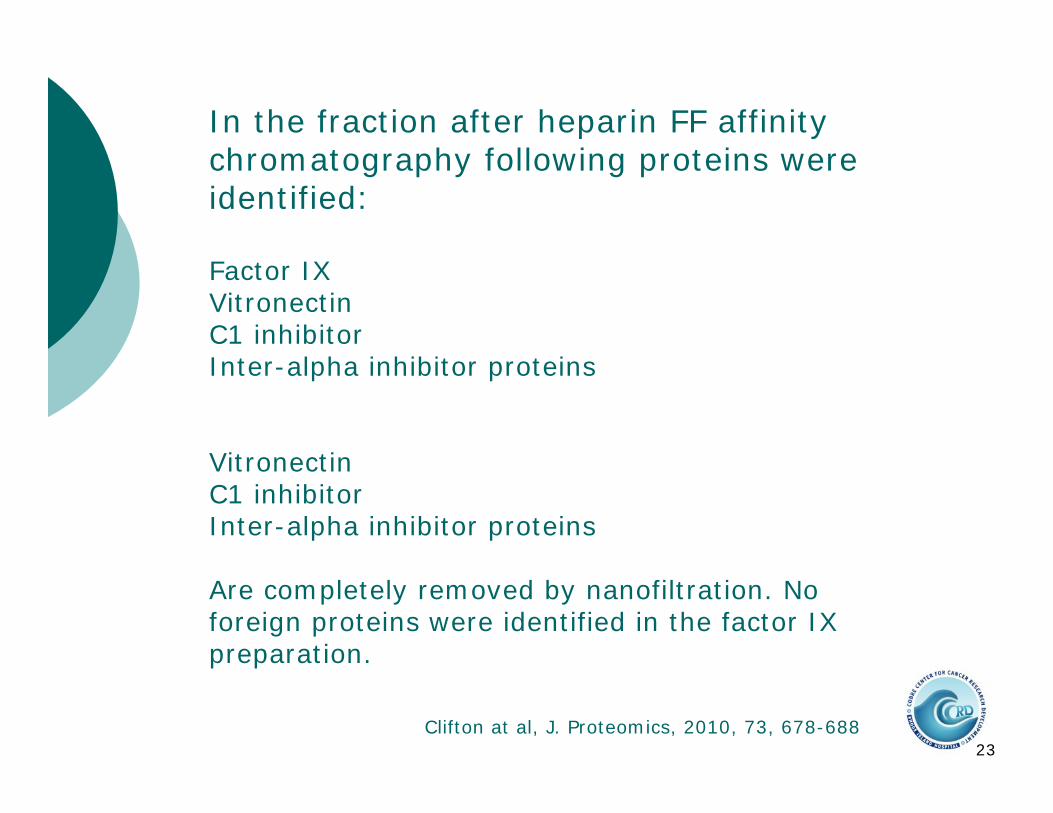
In the fraction after heparin FF affinity chromatography following proteins were identified:
Factor IXVitronectinC1 inhibitorInter-alpha inhibitor proteins
VitronectinC1 inhibitorInter-alpha inhibitor proteins
Are completely removed by nanofiltration. No foreign proteins were identified in the factor IX preparation.
Clifton at al, J. Proteomics, 2010, 73, 678-688

24
25
Quantitative proteomics iTRAQlabeling and comparison of main and side fractions in two last production steps
26
Method development and validation
27
Quantitative proteomics iTRAQ labeling--validation
28
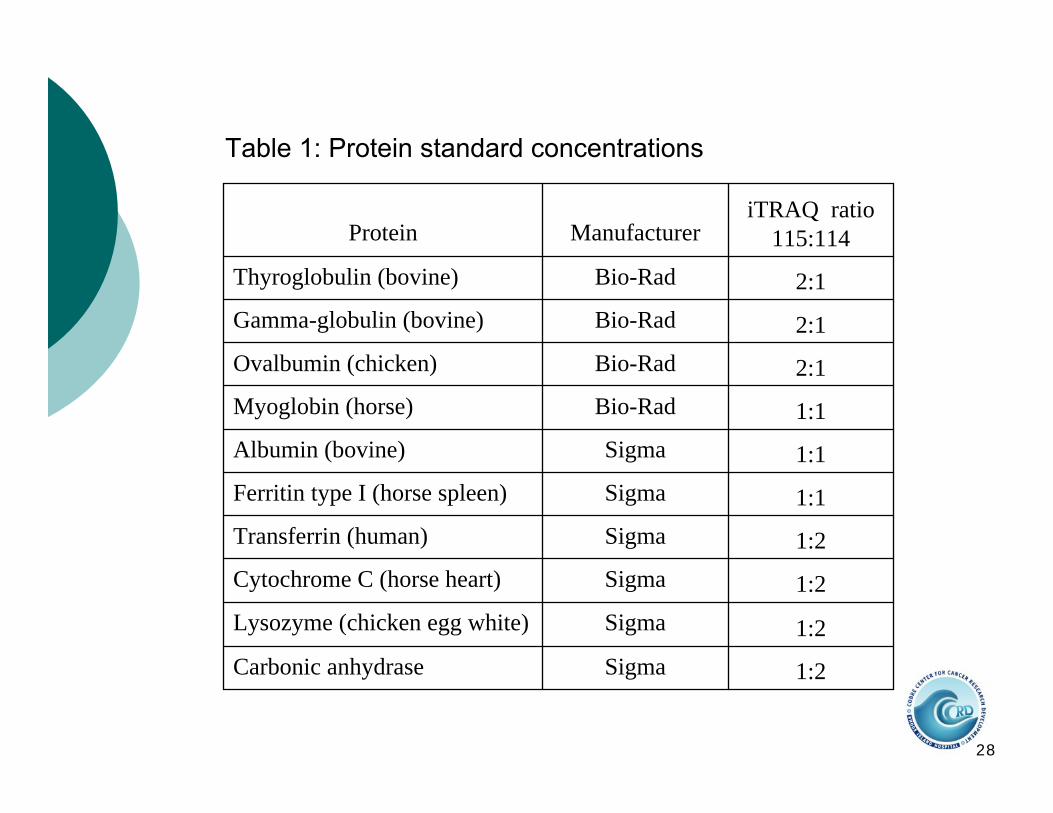
Table 1: Protein standard concentrations
1:2SigmaCarbonic anhydrase1:2SigmaLysozyme (chicken egg white)1:2SigmaCytochrome C (horse heart)1:2SigmaTransferrin (human)1:1SigmaFerritin type I (horse spleen)1:1SigmaAlbumin (bovine)1:1Bio-RadMyoglobin (horse)2:1Bio-RadOvalbumin (chicken)2:1Bio-RadGamma-globulin (bovine)2:1Bio-RadThyroglobulin (bovine)
iTRAQ ratio115:114ManufacturerProtein
29
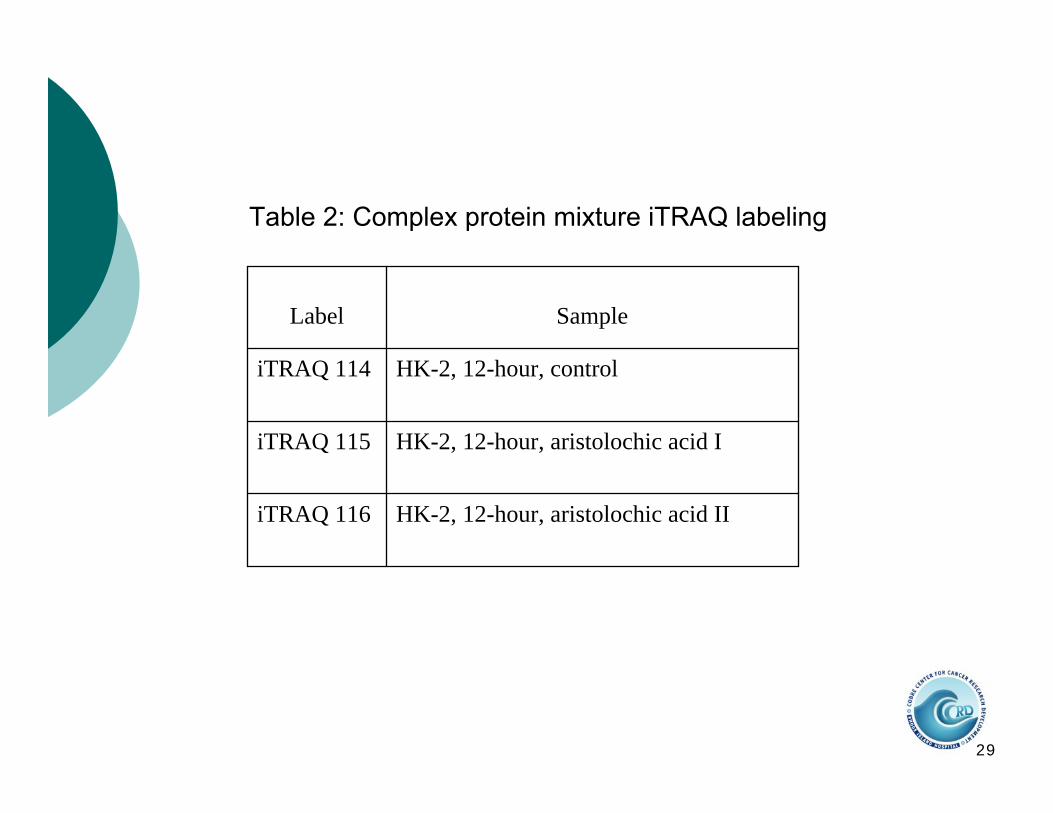
Table 2: Complex protein mixture iTRAQ labeling
HK-2, 12-hour, aristolochic acid IIiTRAQ 116
HK-2, 12-hour, aristolochic acid IiTRAQ 115
HK-2, 12-hour, controliTRAQ 114
SampleLabel
30
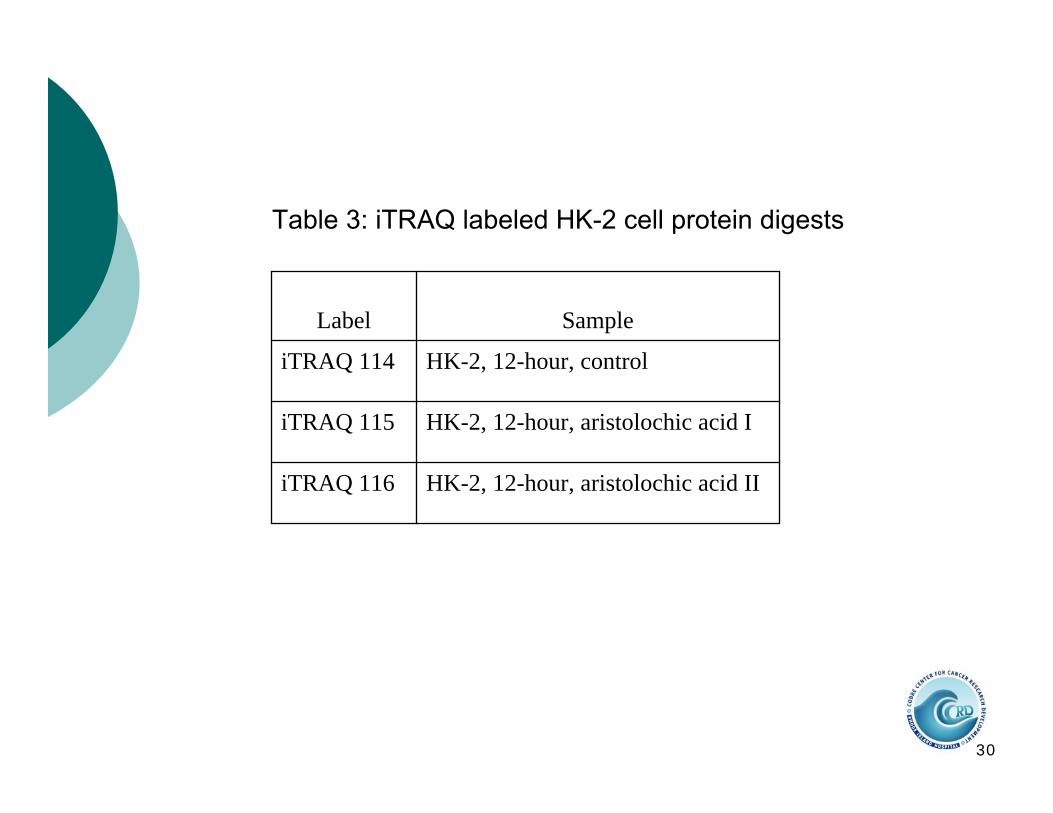
Table 3: iTRAQ labeled HK-2 cell protein digests
HK-2, 12-hour, aristolochic acid IIiTRAQ 116
HK-2, 12-hour, aristolochic acid IiTRAQ 115
HK-2, 12-hour, controliTRAQ 114
SampleLabel

31
LC/MS
All samples were injected to the QSTAR LC/MS/MS system (Applied Biosystems, Inc.). MS data was collected during 75 minute LC gradients. After each survey scan, four 2-second MS/MS scans were performed. Data was collected in centroid mode and the instrument assigned the parent charge states. Previously, 75 minute and 4 hour LC gradientswith four 2-second and eight 1-second scans were compared. There was not an appreciableadvantage to the longer run time in additional protein identifications.
32
Identification procedures
Protein identification was accomplished through a database search using ProteinPilot(Applied Biosystems, Inc.) and PEAKS (Bioinformatic Solutions, Inc.). The following criteria was applied: NCBInr database, trypticdigestion with a maximum of two missed cleavages, methionine oxidation, and iTRAQlabeling on N-terminal and lysines, iTRAQ 4-plex quantification, 0.3 Da tolerance for MS and MS/MS, peptide charges of +1, +2, +3, and monoisotopic masses. All species were searched for the protein mixture.
33
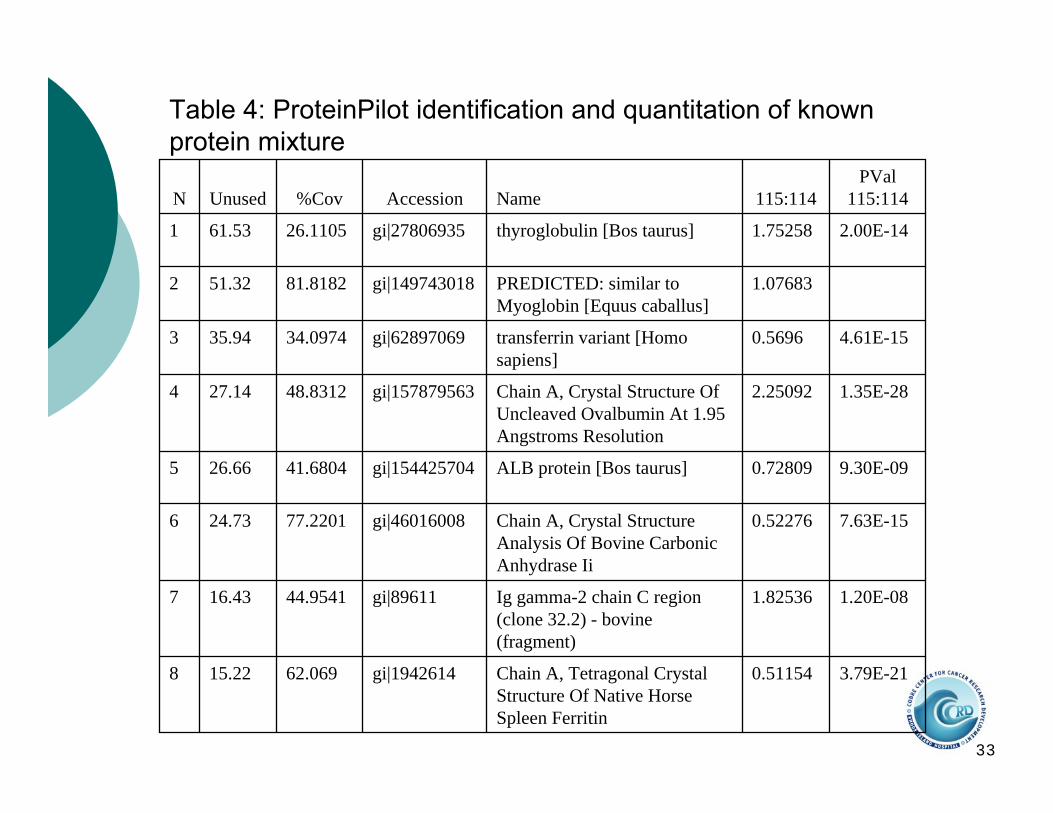
Table 4: ProteinPilot identification and quantitation of known protein mixture
3.79E-210.51154Chain A, Tetragonal Crystal Structure Of Native Horse Spleen Ferritin
gi|194261462.06915.228
1.20E-081.82536Ig gamma-2 chain C region (clone 32.2) - bovine (fragment)
gi|8961144.954116.437
7.63E-150.52276Chain A, Crystal Structure Analysis Of Bovine Carbonic Anhydrase Ii
gi|4601600877.220124.736
9.30E-090.72809ALB protein [Bos taurus]gi|15442570441.680426.665
1.35E-282.25092Chain A, Crystal Structure Of Uncleaved Ovalbumin At 1.95 Angstroms Resolution
gi|15787956348.831227.144
4.61E-150.5696transferrin variant [Homo sapiens]
gi|6289706934.097435.943
1.07683PREDICTED: similar to Myoglobin [Equus caballus]
gi|14974301881.818251.322
2.00E-141.75258thyroglobulin [Bos taurus]gi|2780693526.110561.531
PVal115:114115:114NameAccession%CovUnusedN
34
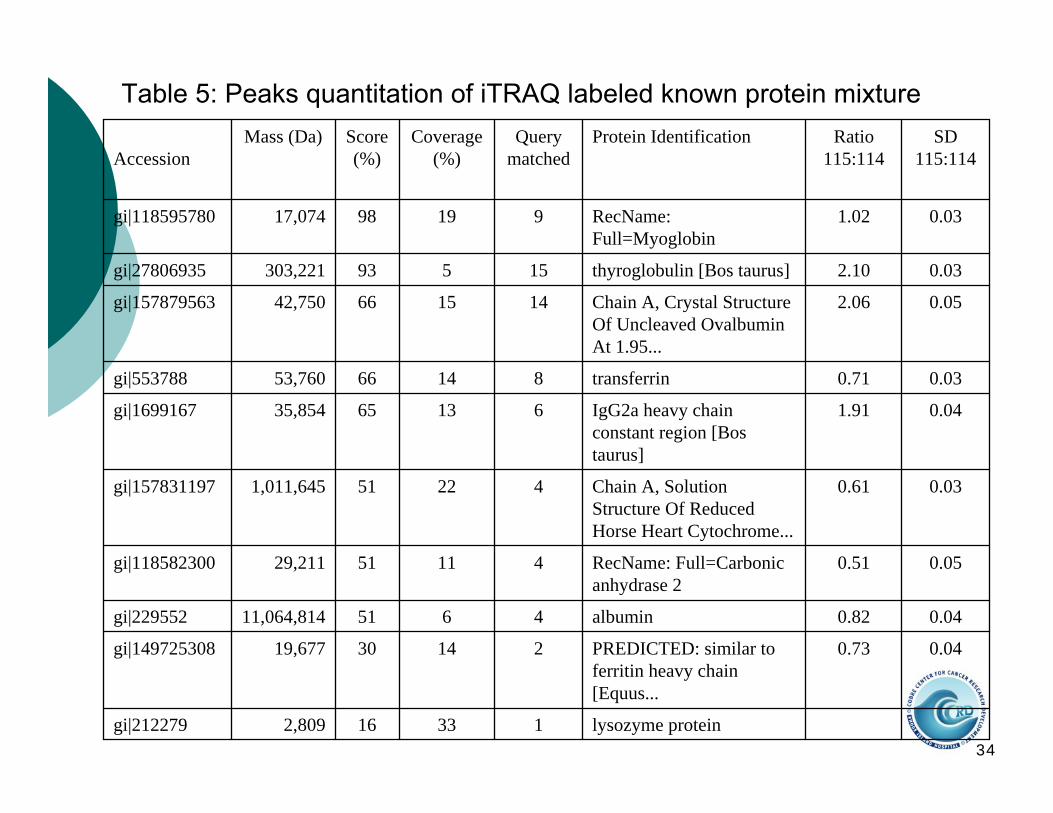
Table 5: Peaks quantitation of iTRAQ labeled known protein mixture
lysozyme protein133162,809gi|212279
0.040.73PREDICTED: similar to ferritin heavy chain [Equus...
2143019,677gi|149725308
0.040.82albumin465111,064,814gi|229552
0.050.51RecName: Full=Carbonic anhydrase 2
4115129,211gi|118582300
0.030.61Chain A, Solution Structure Of Reduced Horse Heart Cytochrome...
422511,011,645gi|157831197
0.041.91IgG2a heavy chain constant region [Bostaurus]
6136535,854gi|1699167
0.030.71transferrin8146653,760gi|553788
0.052.06Chain A, Crystal Structure Of Uncleaved OvalbuminAt 1.95...
14156642,750gi|157879563
0.032.10thyroglobulin [Bos taurus]15593303,221gi|27806935
0.031.02RecName: Full=Myoglobin
9199817,074gi|118595780
SD 115:114
Ratio 115:114
Protein IdentificationQuery matched
Coverage (%)
Score (%)
Mass (Da)Accession
35
Complex protein sample
ProteinPilotTM returned 30 protein identifications based upon the identification parameters provided in the methods section above. Twenty-three proteins with a confidence level of 90% or greater were identified.
36
PeaksTM returned 954 protein identifications with only 10 proteins returning a Peaks score of 60% or greater.
37
When the accession numbers for the identified proteins were compared, one match was identified: gi|62897681 (calreticulin precursor variant [Homo sapiens]). The ProteinPilot unused score was 0.85 and sequence coverage was 5.2%. The Peaks score was 3.78 with sequence coverage of 6.16%.
38
The identification scores and sequence coverage in both programs were low, indicating a lack of confidence in the protein identification. Only Peaks returned ratios for protein expression changes. The protein expression reduced to 0.28 from the control to the aristolochic acid I treated cells. The aristolochic acid II treated cells fell to 0.17 from the control cells.
39
CONCLUSION
The analysis of shotgun proteomics data presents a host of challenges. A major hurdle to surmount is the variability of results obtained by different software programs used for the identification and quantitation of proteins. Peaks 5.0 identified the proteins or a contributing part of the protein in the simple protein mixture.
40
ProteinPilot identified less protein but the identifications returned scores that indicate a strong confidence in the results. Both programs reported protein ratios within an acceptable range of the known ratio. The pvalues returned by ProteinPilot were very significant for the protein ratio changes.
41
Until there is greater consistency in protein identification and quantitationbetween software programs, the analysis of complex protein samples should be approached with care.

42
Quantitative validation:
Clotting factor IX
43
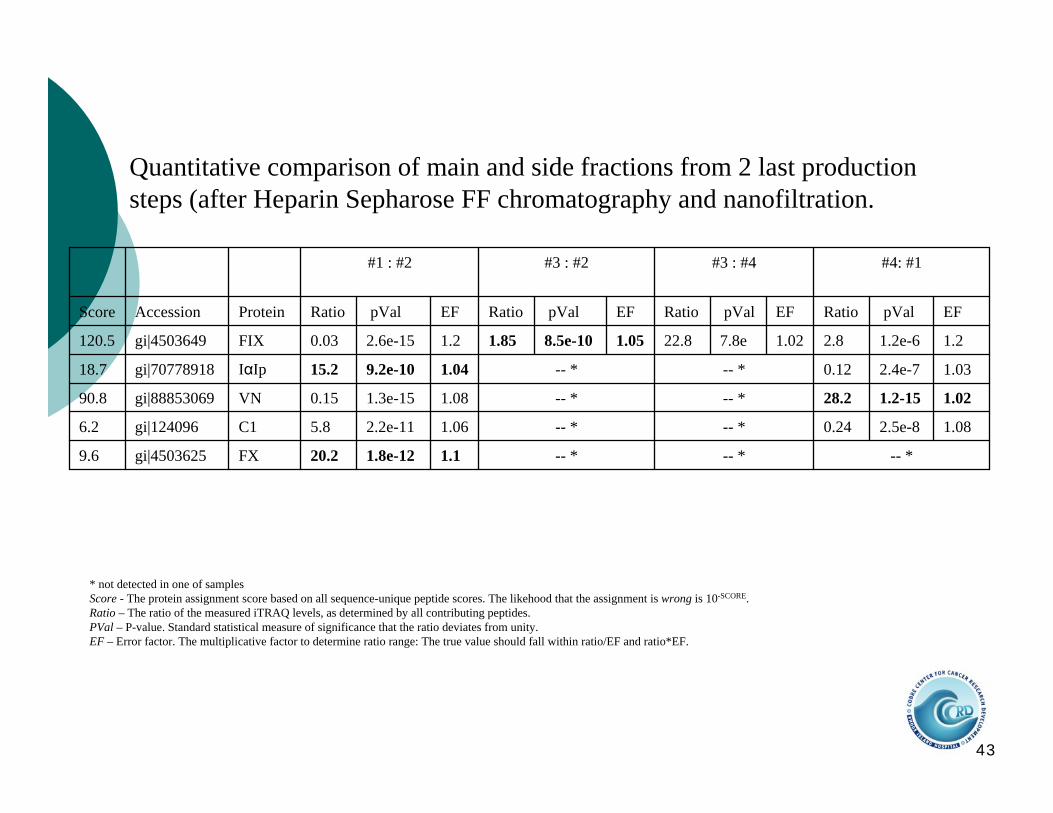
Quantitative comparison of main and side fractions from 2 last production steps (after Heparin Sepharose FF chromatography and nanofiltration.
-- *-- *-- *1.11.8e-1220.2FXgi|45036259.6
1.082.5e-80.24-- *-- *1.062.2e-115.8C1gi|1240966.2
1.021.2-1528.2-- *-- *1.081.3e-150.15VNgi|8885306990.8
1.032.4e-70.12-- *-- *1.049.2e-1015.2IαIpgi|7077891818.7
1.21.2e-62.81.027.8e22.81.058.5e-101.851.22.6e-150.03FIXgi|4503649120.5
EFpValRatioEFpValRatioEFpValRatioEFpValRatioProteinAccessionScore
#4: #1#3 : #4#3 : #2#1 : #2
* not detected in one of samplesScore - The protein assignment score based on all sequence-unique peptide scores. The likehood that the assignment is wrong is 10-SCORE.Ratio – The ratio of the measured iTRAQ levels, as determined by all contributing peptides.PVal – P-value. Standard statistical measure of significance that the ratio deviates from unity.EF – Error factor. The multiplicative factor to determine ratio range: The true value should fall within ratio/EF and ratio*EF.
44
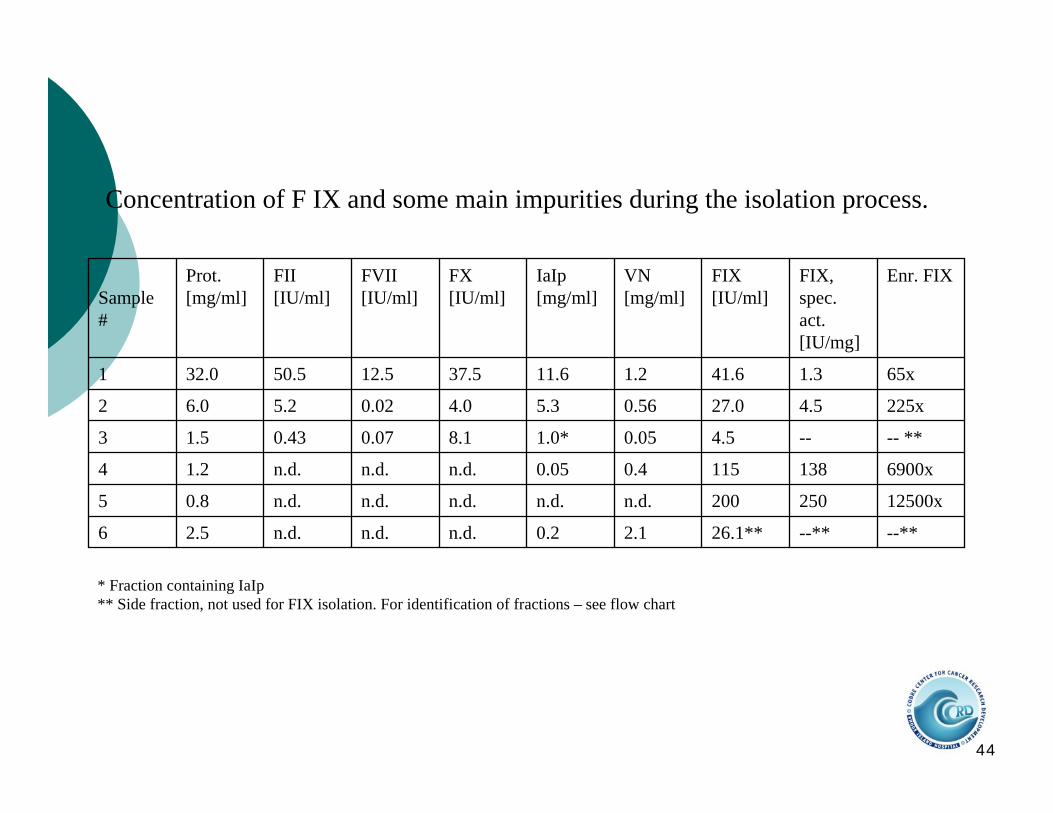
Concentration of F IX and some main impurities during the isolation process.
--**--**26.1**2.10.2n.d.n.d.n.d.2.56
12500x250200n.d.n.d.n.d.n.d.n.d.0.85
6900x1381150.40.05n.d.n.d.n.d.1.24
-- **--4.50.051.0*8.10.070.431.53
225x4.527.00.565.34.00.025.26.02
65x1.341.61.211.637.512.550.532.01
Enr. FIXFIX, spec. act. [IU/mg]
FIX [IU/ml]
VN [mg/ml]
IaIp[mg/ml]
FX [IU/ml]
FVII [IU/ml]
FII [IU/ml]
Prot. [mg/ml]Sample
#
* Fraction containing IaIp** Side fraction, not used for FIX isolation. For identification of fractions – see flow chart

45
Quantitative proteomics as a tool for determination of batch-to-batch variations and comparison of different clotting factor VIII concentrates

46
Clotting factor VIII concentrates
Octanate (Octapharma, Vienna, Austria), two different batches.Haemoctin (Biotest, Germany)-similar production process. Wilate (Octapharma)-new product, higher purity.
1.056.59e-011.071.073.25e-101.321.061.04e-060.85coagulation factor VIII isoform agi|450364720.07
1.080.002.341.033.37e-030.961.037.20e-151.11von Willebrand factorgi|89191868154.32
Active Components
EFPValRatioEFPValRatioEFPValRatioProteinAccessionScore
Wilate:OctanateHaemoctin:OctanateOctanate(2):Octanate(1)
1. Active concentrates

47
2.521.66e-0.60.061.084.34e-041.151.081.38e-080.78alpha-1-microglobulin/bikuningi|45020676.00
1.507.31e-130.181.061.6e-111.281.289.71e-110.59inter-alpha (globulin) inhibitor H3gi|5440075522.22
1.501.36e-160.131.067.3e-010.991.052.6e-370.68inter-alpha (globulin) inhibitor H1gi|450478131.41
1.200.000.091.021.00e+001.001.020.000.68inter-alpha globulin inhibitor H2 polypeptide
gi|7077891855.92
inter-alpha- inhibitor proteins
EFPValRatioEFPValRatioEFPValRatioProteinAccessionScore
Wilate:OctanateHaemoctin:OctanateOctanate(2):Octanate(1)
2. Inter-alpha-inhibitor proteins

48
1.522.20e-110.051.061.13e-140.571.042.76e-030.93kininogen 1gi|45048939.70
1.041.40e-451.191.020.00e+001.571.020.00e+000.79fibrinogen, beta chaingi|7090643572.86
1.100.00e+001.311.040.00e+001.591.030.00e+000.74fibrinogen, alpha polypeptidegi|450368973.19
1.070.00e+001.421.070.00e+001.591.030.00e+001.30fibronectin 1gi|4713255390.00
2.001.05e-040.091.127.62e-061.781.181.15e-050.46coagulation factor IIgi|45036355.00
Other impurities
EFPValRatioEFPValRatioEFPValRatioProteinAccessionScore
Wilate:OctanateHaemoctin:OctanateOctanate(2):Octanate(1)
3. Other impurities

49
Validation of iTRAQ resultsInter-alpha inhibitor proteins in FVIII samples (ELISA)
n.d.n.d.1.3980.40.0051.3170.20.0031.30616.90.4052.43519.70.3211.63416.50.2991.81318.60.4052.18220.00.3441.711
ITIp%
ITIpmg/ml
Proteinmg/ml
SampleNo.
Samples 4-5 –Octanate; 6-8 - Wilate
50
Conclusions
-Proteomic techniques can be used for optimization of down-stream processing and development of new purification schemes
- After thorough optimization and validation, quantitative proteomics are useful tool for final product characterization, determination of batch-to-batch variation and comparison of different therapeutic products based on physiologically active proteins.

51
Possible use of CIM monolithic supports in plasma fractionation and
sample preparation.

52
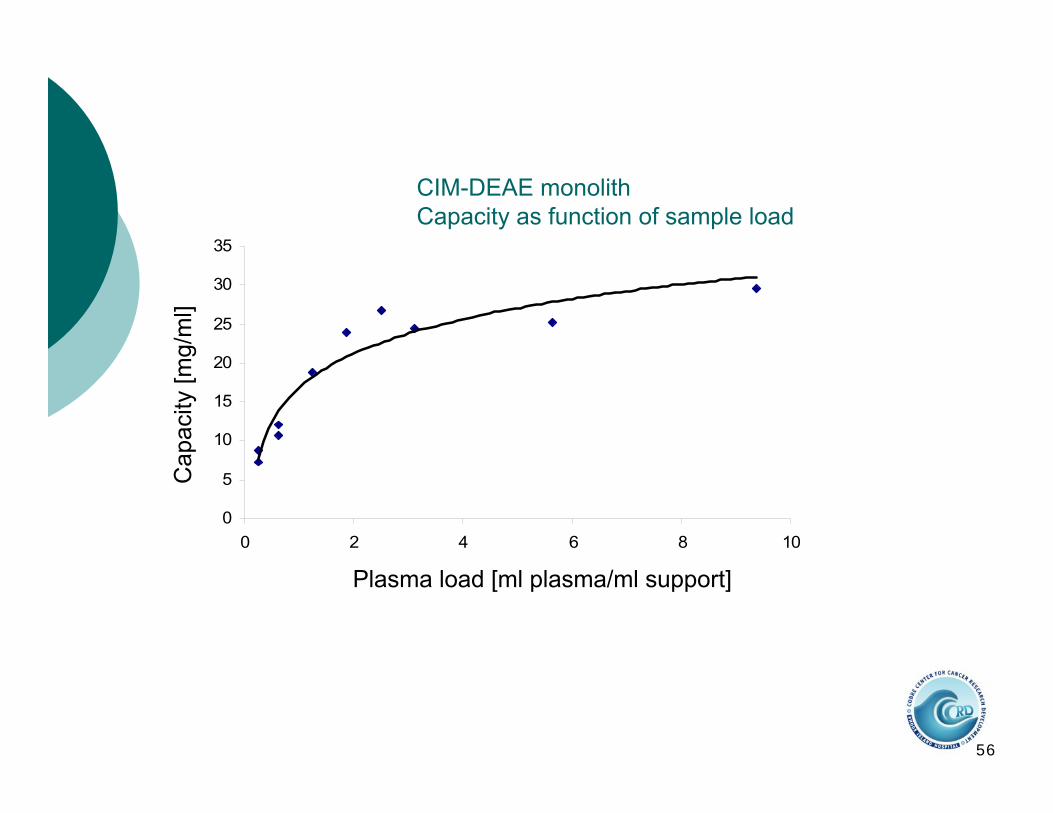
CIM DEAE, 8mL column
CIM DEAE, 0.34mL disk
Capacity – 23-25 mg BSA/mL support
And – About 8-10 mg proteins from plasma/mLsupport (0.25mL plasma/mL) support were applied.
CIM, 0.100mL disk

53
The selective of CIM monolithic supports for human plasma proteins
is a function of the sample load.

54
SDS PAGE
25015010075
5037
252015
10
MW[kDa]CP 1 2 3 4 5 6 7 8 CP
Loading (cryopoor plasma)
1. CIM disk – 85µl
2. CIM tube – 2ml
3. CIM tube – 5ml
4. CIM tube – 10ml
5. CIM tube – 15ml
6. CIM tube – 20ml
7. CIM tube – 25ml
8. CIM disk – 1.06ml
Elution with 0.155M NaCl (step 1)
55
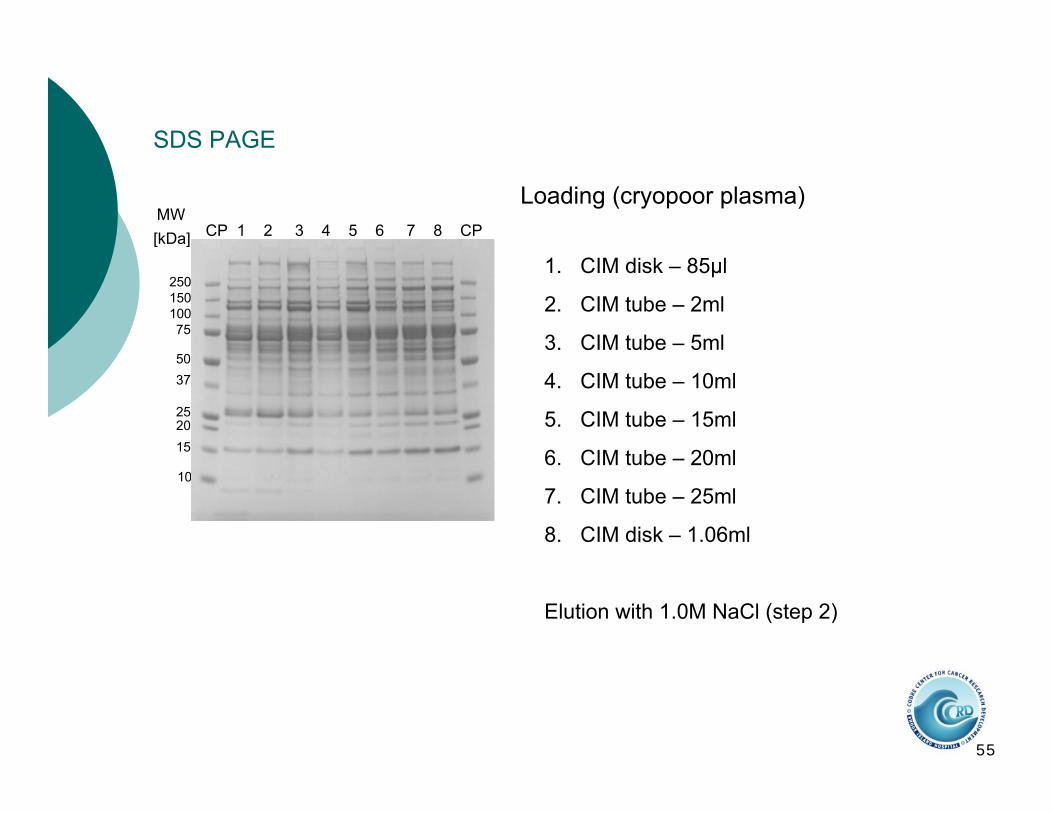
SDS PAGE
25015010075
5037
252015
10
MW[kDa] CP 1 2 3 4 5 6 7 8 CP
1. CIM disk – 85µl
2. CIM tube – 2ml
3. CIM tube – 5ml
4. CIM tube – 10ml
5. CIM tube – 15ml
6. CIM tube – 20ml
7. CIM tube – 25ml
8. CIM disk – 1.06ml
Elution with 1.0M NaCl (step 2)
Loading (cryopoor plasma)
56
0
5
10
15
20
25
30
35
0 2 4 6 8 10
Plasma load [ml plasma/ml support]
Cap
acity
[mg/
ml]
CIM-DEAE monolithCapacity as function of sample load
57
CIM monolithic supports can be used in plasma fractionation for removal of HAS and IgG.
CIM monolithic disks can be used for sample preparation in proteomic analysis of human plasma.
58
High throughput sample preparation and rapid method
development

59
MediaScout® 96 array technology
Setting of up to 96 individual pre-packed, ready-to-usecolumns on one platform according to the selectedapplication
Packed with any desired chromatography media
Professionally packed to manufacturers‘recommendation
MediaScout® MiniColumns are available in different volumesI.D. 5 mmBed height 2.5 – 30 mm (50 – 600 µl CV)
50 µl200 µl 100 µl
Column operational mode: liquid is forced through the column by1. elevated gravity / CentriColumnor positive liquid displacement (PLD) / continuous liquid feed2. Pipet / PipetColumn; 3. Robot / RoboColumn
1. 2. 3.
1. Small Scale Parallel Chromatography1.2 Concept / Experimental Setup
60
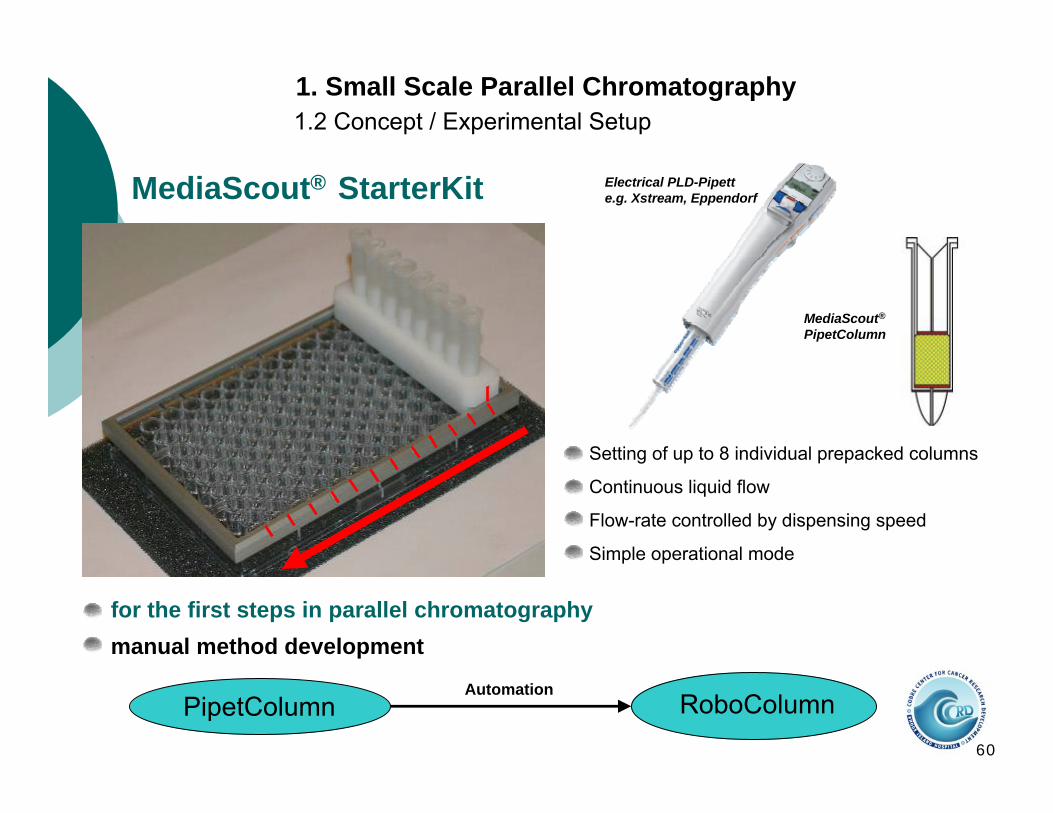
1. Small Scale Parallel Chromatography1.2 Concept / Experimental Setup
MediaScout® StarterKit
for the first steps in parallel chromatography
Electrical PLD-Pipette.g. Xstream, Eppendorf
MediaScout®
PipetColumn
Setting of up to 8 individual prepacked columns
Continuous liquid flow
Flow-rate controlled by dispensing speed
Simple operational mode
manual method development
PipetColumn RoboColumnAutomation
61
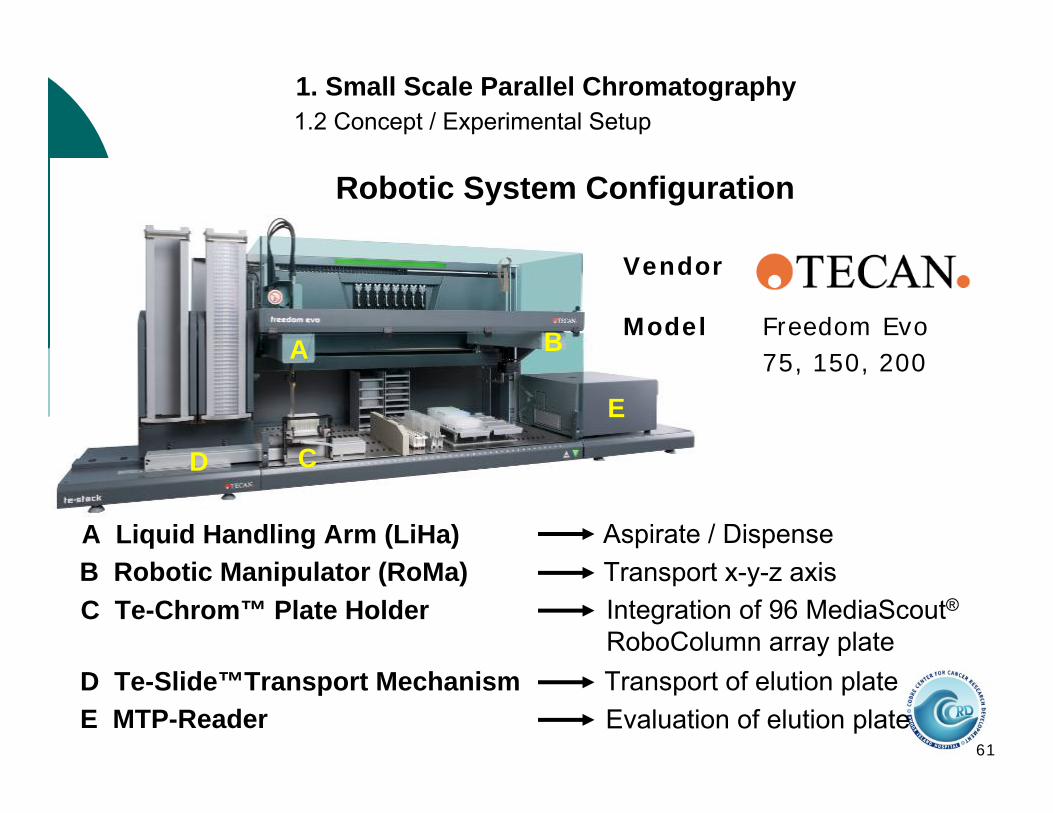
1. Small Scale Parallel Chromatography1.2 Concept / Experimental Setup
Robotic System Configuration
Freedom Evo75, 150, 200
Model
Vendor
E MTP-Reader
B Robotic Manipulator (RoMa)C Te-Chrom™ Plate Holder
A Liquid Handling Arm (LiHa)
D Te-Slide™Transport Mechanism
A B
CD
E
Aspirate / DispenseTransport x-y-z axisIntegration of 96 MediaScout®RoboColumn array plateTransport of elution plateEvaluation of elution plate
62
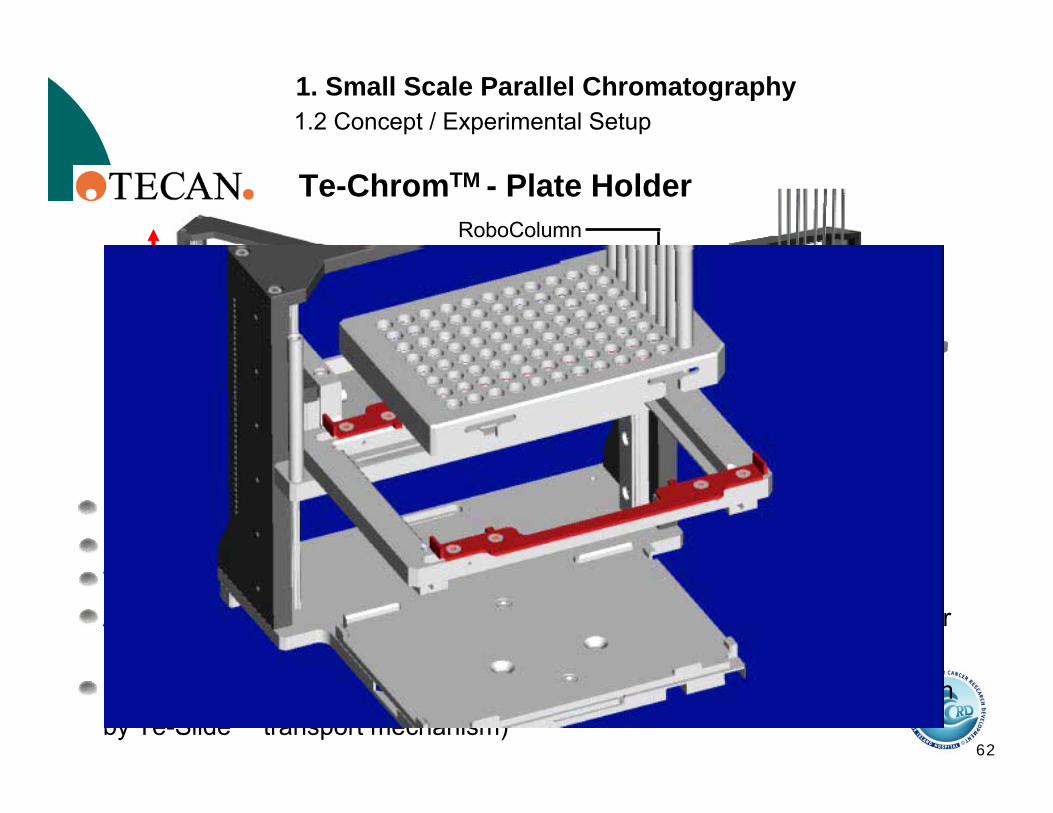
1. Small Scale Parallel Chromatography1.2 Concept / Experimental Setup
Te-ChromTM - Plate Holder
Integration of 96 MediaScout® RoboColumn array plateHeight adjustable for the use of different elution plates e.g. MTP, DWP, etc.Waste option to drain off equilibration-, washing buffer and inpuritiesAutomatic exchange of RoboColumn array plate by the Robotic Manipulator (RoMa)Stand alone option for simple chromatographic applications (without fractionby Te-SlideTM transport mechanism)
RoboColumnarray plate
Waste container
Elution plate
Adapter frame
Fixation

63
1. Small Scale Parallel Chromatography1.2 Concept / Experimental Setup
Te-SlideTM – Transport Mechanism
Transport of elution plate to fractioneluate
Te-SlideTM
Te-ChromTM Plate Holder
Sledge
Elution plate
RoboColumn array plate
64
Can monolithic discs be used instead of small columns packed with bulk support?

65
Yes
66
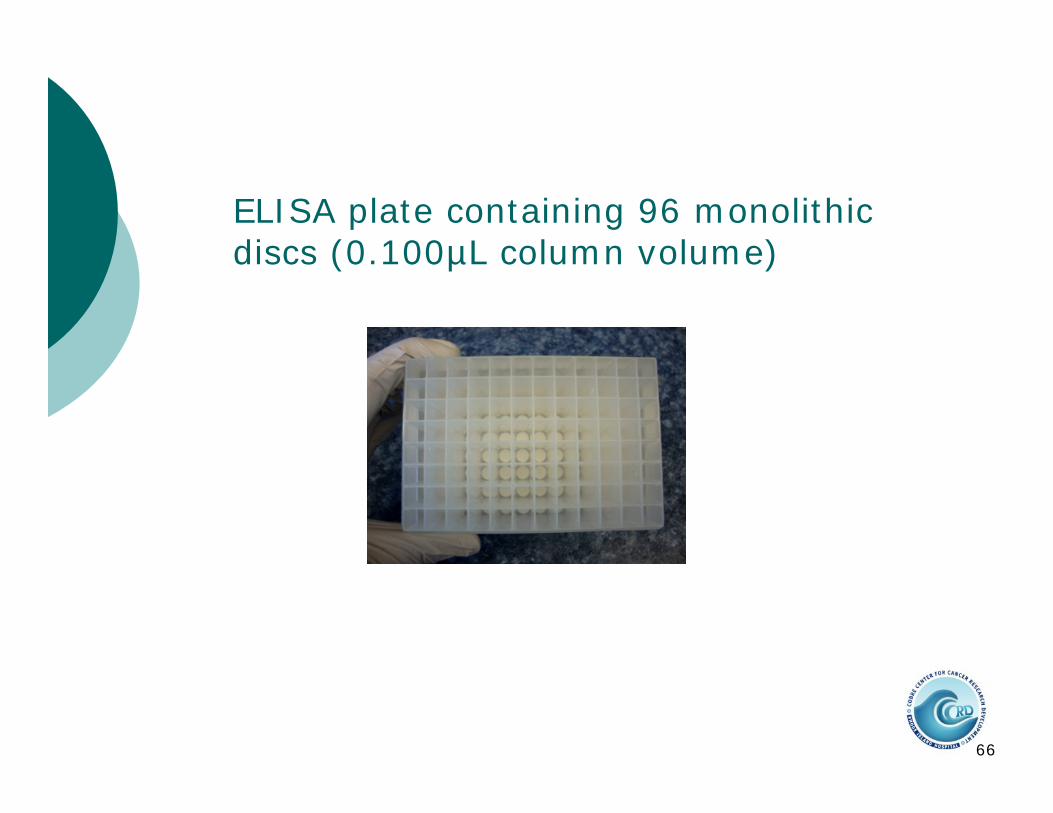
ELISA plate containing 96 monolithic discs (0.100µL column volume)

67
High-throughput screening

68
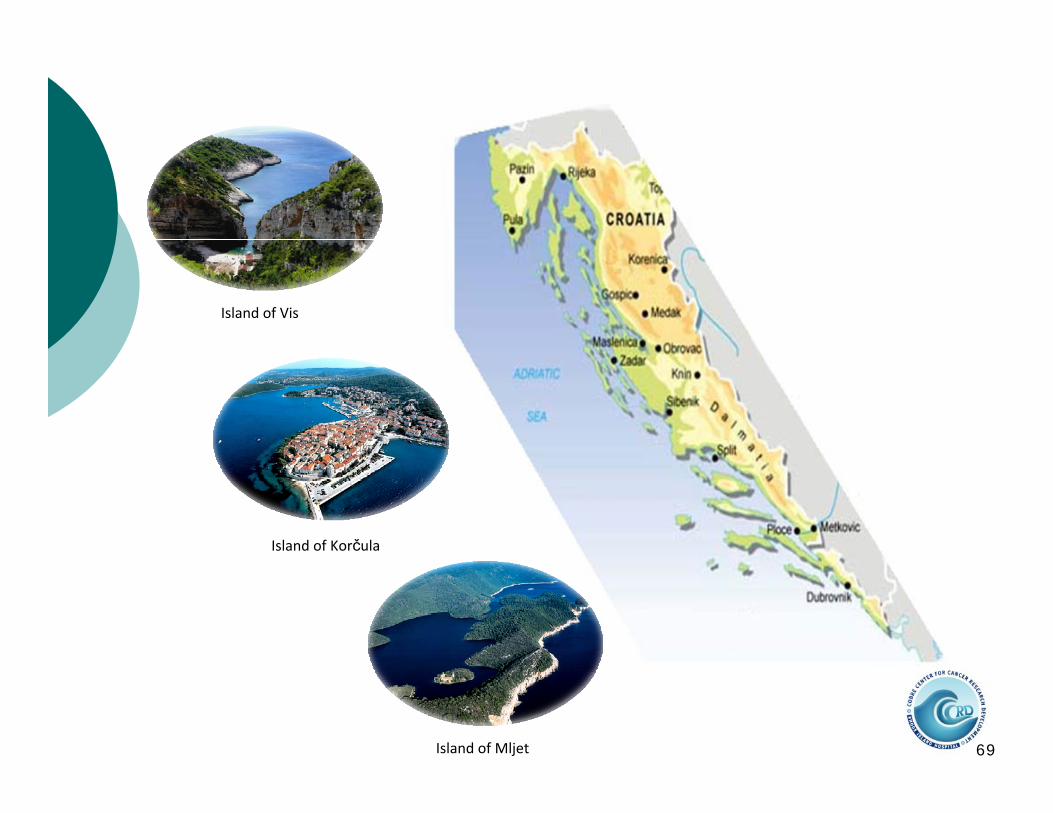
69
Island of Vis
Island of Mljet
Island of Korčula
70
Variability, Heritability and Environmental Determinants of Human Plasma N-Glycome
Journal of Proteome Research
2009, 8, 694-701
71
Plasma glycans were analyzed in 1008 individuals to evaluate variability and heritability, as well as the main environmental determinants that affect glycan structures.

72
PLEASE,
BE MORE SPECIFIC!
73
IgG glycosylation analysis
Proteomics 2009, 9, 882-913
Carolin Huhn, Maurice H. J. Selman, L. Renee Ruhaak, André M. Deelder and Manfred Wuhrer
Biomolecular Mass Spectrometry Unit, Department of Parasitology, Leiden University Medical Center, Leiden, The Netherlands
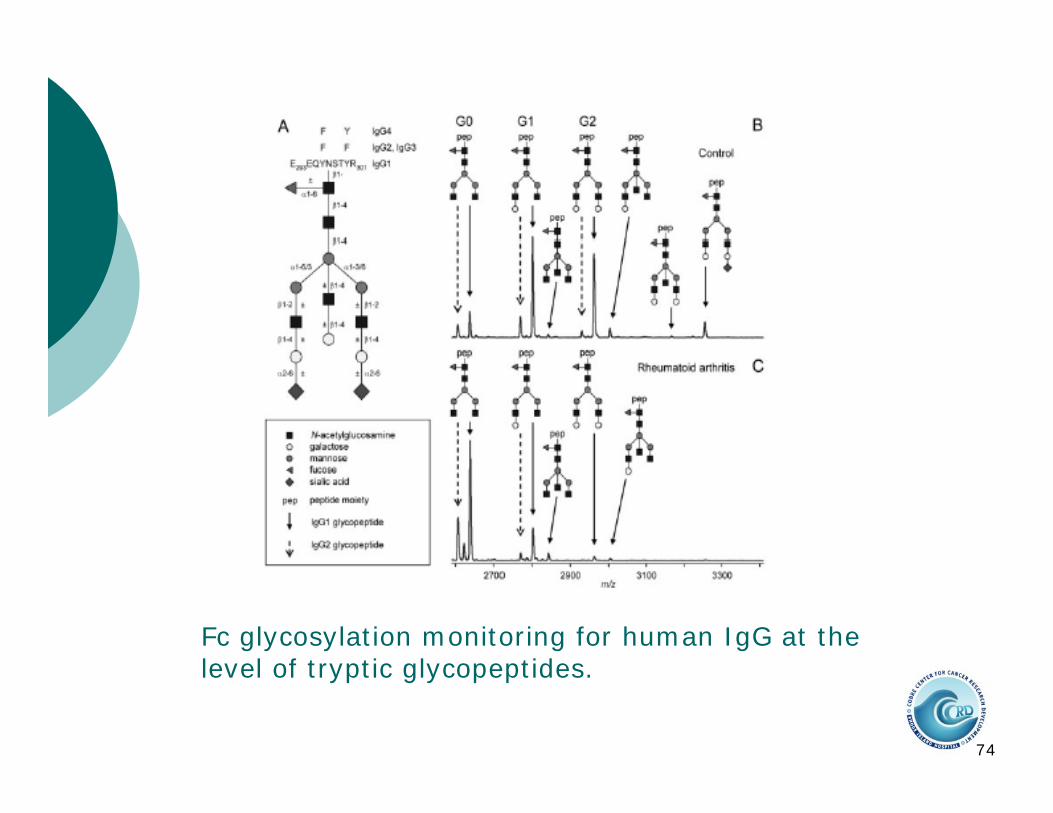
74
Fc glycosylation monitoring for human IgG at the level of tryptic glycopeptides.
75
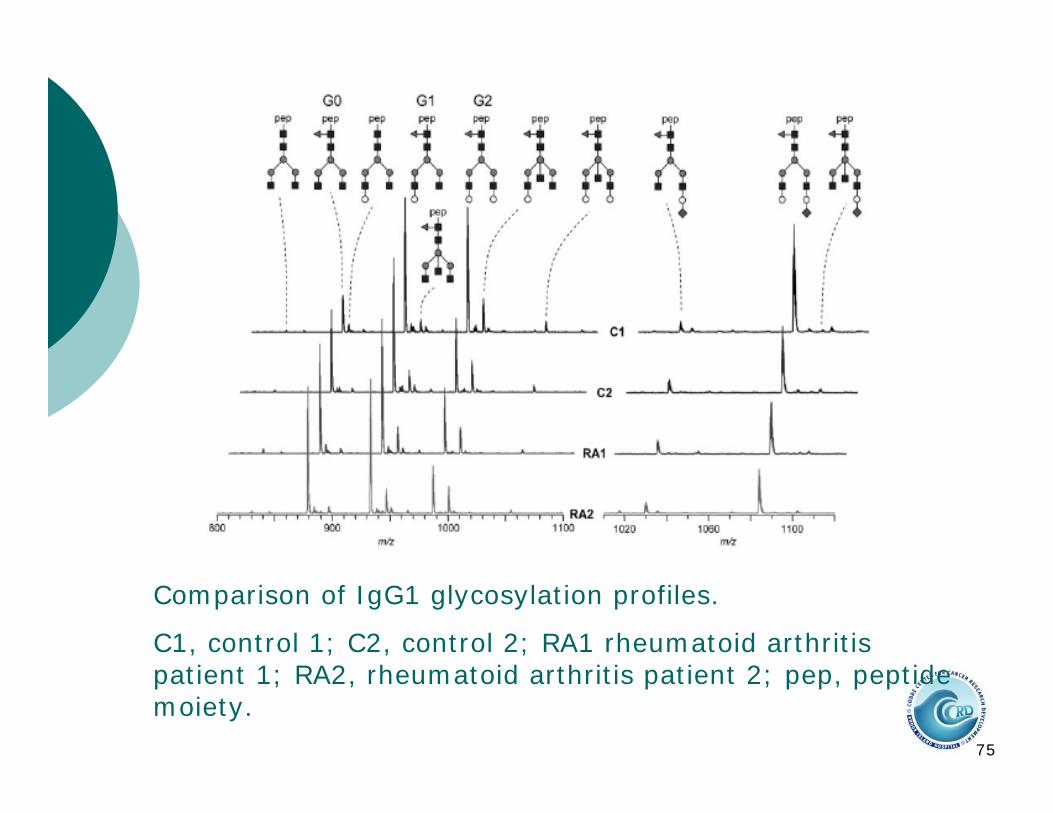
Comparison of IgG1 glycosylation profiles.
C1, control 1; C2, control 2; RA1 rheumatoid arthritis patient 1; RA2, rheumatoid arthritis patient 2; pep, peptide moiety.
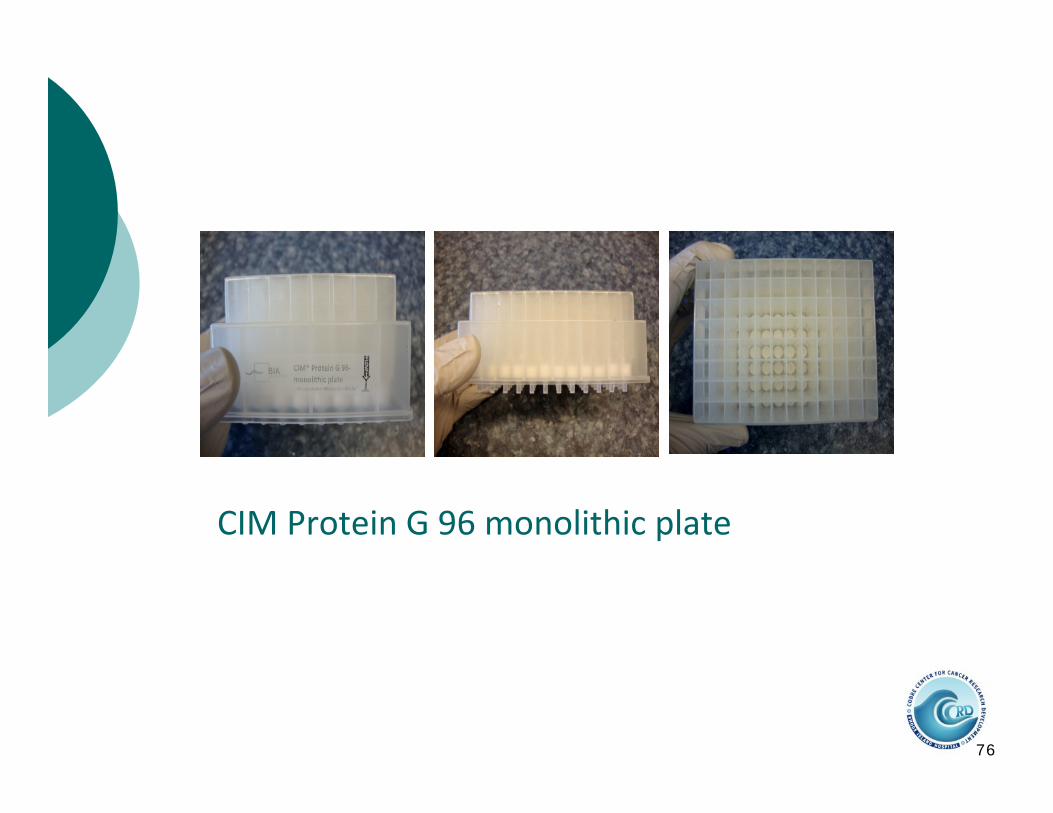
76
CIM Protein G 96 monolithic plate
77
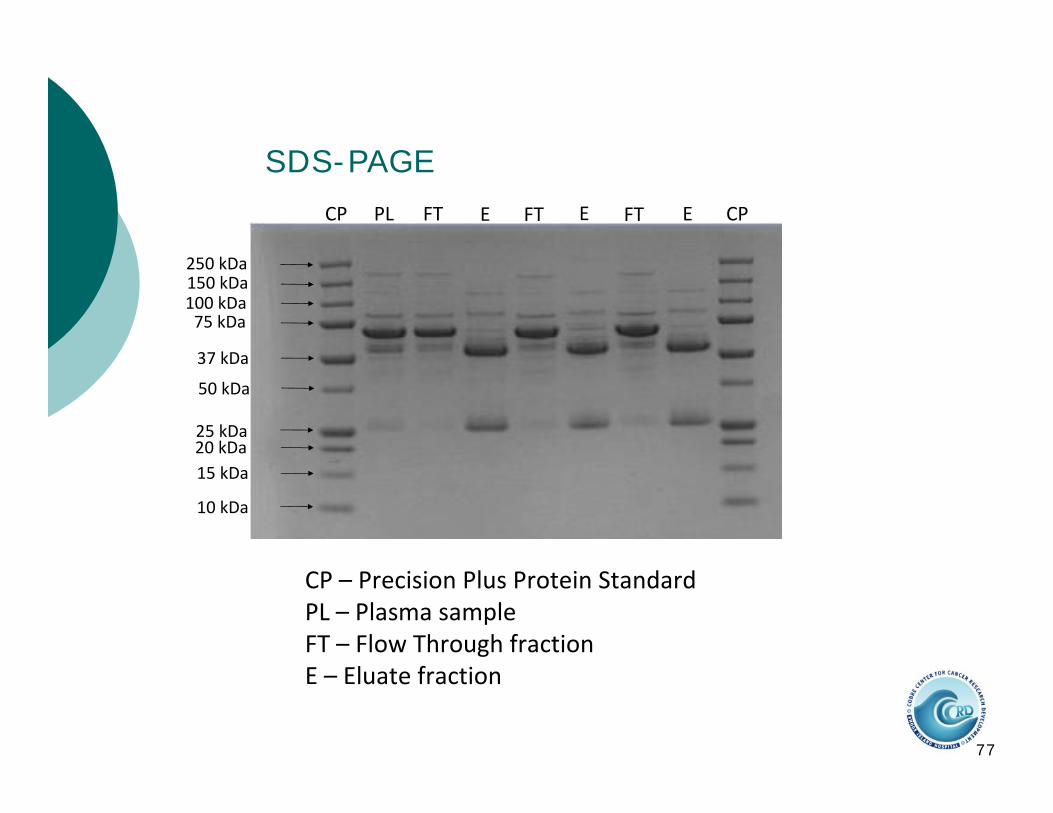
CP PL FT E FT E FT E CP
100 kDa
20 kDa
250 kDa150 kDa
75 kDa
37 kDa
50 kDa
25 kDa
15 kDa
10 kDa
CP – Precision Plus Protein StandardPL – Plasma sampleFT – Flow Through fractionE – Eluate fraction
SDS-PAGE

78
Maja Pucic & Gordon LaucGenes & Faculty of Pharmacy & Biochemistry, Zagreb, Croatia
79
Conclusions:
1. Proteomics technology is a useful tool for optimization of plasma protein separation
2. By use of proteomics technology, target proteins and potentially harmful impurities can be identified.
3. Monolithic and small columns packed with bulk chromatographic supports can be used in development of new methods for separation of complex mixtures and sample preparation for high-throughput analyses.