proteomic signature reveals modulation of human macrophage
TRANSCRIPT
HAL Id: inserm-01599605https://www.hal.inserm.fr/inserm-01599605
Submitted on 2 Oct 2017
HAL is a multi-disciplinary open accessarchive for the deposit and dissemination of sci-entific research documents, whether they are pub-lished or not. The documents may come fromteaching and research institutions in France orabroad, or from public or private research centers.
L’archive ouverte pluridisciplinaire HAL, estdestinée au dépôt et à la diffusion de documentsscientifiques de niveau recherche, publiés ou non,émanant des établissements d’enseignement et derecherche français ou étrangers, des laboratoirespublics ou privés.
Proteomic signature reveals modulation of humanmacrophage polarization and functions under differing
environmental oxygen conditionsMagali Court, Graciane Pètre, Michèle El-Atifi, Arnaud Millet
To cite this version:Magali Court, Graciane Pètre, Michèle El-Atifi, Arnaud Millet. Proteomic signature reveals mod-ulation of human macrophage polarization and functions under differing environmental oxygenconditions: Oxygen tension modulates macrophage polarization. Molecular and Cellular Pro-teomics, American Society for Biochemistry and Molecular Biology, 2017, Epub ahead of print.�10.1074/mcp.RA117.000082�. �inserm-01599605�
HAL Id: inserm-01599605http://www.hal.inserm.fr/inserm-01599605
Submitted on 2 Oct 2017
HAL is a multi-disciplinary open accessarchive for the deposit and dissemination of sci-entific research documents, whether they are pub-lished or not. The documents may come fromteaching and research institutions in France orabroad, or from public or private research centers.
L’archive ouverte pluridisciplinaire HAL, estdestinée au dépôt et à la diffusion de documentsscientifiques de niveau recherche, publiés ou non,émanant des établissements d’enseignement et derecherche français ou étrangers, des laboratoirespublics ou privés.
Proteomic signature reveals modulation of humanmacrophage polarization and functions under differing
environmental oxygen conditionsMagali Court, Graciane Pètre, Michèle El-Atifi, Arnaud Millet
To cite this version:Magali Court, Graciane Pètre, Michèle El-Atifi, Arnaud Millet. Proteomic signature reveals modula-tion of human macrophage polarization and functions under differing environmental oxygen conditions.Molecular and Cellular Proteomics (MCP Online), American Society for Biochemistry and MolecularBiology, 2017, <10.1074/mcp.RA117.000082>. <inserm-01599605>
1
Proteomic signature reveals modulation of human macrophage
polarization and functions under differing environmental oxygen
conditions.
Magali COURT1,2, Graciane PETRE1,2, Michèle EL ATIFI1,2, Arnaud MILLET1,2,3 *
1. Inserm U1205, Grenoble, France
2. Grenoble-Alpes University, Grenoble, France
3. ATIP/Avenir Team Mechanobiology, Immunity and Cancer, Grenoble, France
*Corresponding author; Address: ATIP/Avenir Team “Mechanobiology, Immunity and Cancer”,
Inserm U1205, CEA Grenoble Bat 40.23 17 rue des Martyrs 38054 Grenoble, France
phone : +33 4 38 78 06 43, e-mail: [email protected]
Keywords : Macrophages, Polarization, Oxygen, LC-MS/MS, Efferocytosis
Number of words: 7483
Running title: Oxygen tension modulates macrophage polarization
2
Abbreviations
ACN acetonitrile
PBMC Peripheral blood mononuclear cells
DXM Dexamethasone
FDR False discovery rate
HMDM Human Monocyte-Derived Macrophage
IC Immune complexes
IFNγ Interferon gamma
IL Interleukin
LFQ Label-Free Quantification
LPS Lipopolysaccharide
MerTK Mer tyrosine kinase
MFI Median fluorescence intensity
PCA Principal Component Analysis
QTOF Quadrupole Time-of-Flight
RT Reverse Transcription
TAM Tumor-associated macrophages
TLR Toll-like receptor
3
Summary
Macrophages are innate immune cells which can react to a large number of environmental stimuli
thanks to a high degree of plasticity. These cells are involved in a variety of tissue functions in
homeostasis, and they play essential roles in pathological contexts. Macrophages’ activation state,
which determines their functional orientation, is strongly influenced by the cellular environment. A
large body of macrophage literature is devoted to better defining polarizations from a molecular
viewpoint. It is now accepted that a multidimensional model of polarization is needed to grasp the
broad phenotype repertoire controlled by environmental signals. The study presented here aimed,
among other goals, to provide a molecular signature of various polarizations in human macrophages
at the protein level so as to better define the different macrophage activation states. To study the
proteome in human monocyte-derived macrophages as a function of their polarization state, we
used a label-free quantification approach on in-gel fractionated and LysC/Trypsin digested proteins.
In total, 5102 proteins were identified and quantified for all polarization states. New polarization-
specific markers were identified and validated. Because oxygen tension is an important
environmental parameter in tissues, we explored how environmental oxygen tension, at either
atmospheric composition (18.6% O2) or “tissue normoxia” (3% O2), affected our classification of
macrophage polarization. The comparative results revealed new polarization-specific makers which
suggest that environmental oxygen levels should be taken into account when characterizing
macrophage activation states. The proteomic screen revealed various polarization-specific proteins
and oxygen sensors in human macrophages. One example is arachidonate 15-lipoxygenase (ALOX15),
an IL4/IL13 polarization-specific protein, which was upregulated under low oxygen conditions and is
associated with an increase in the rate of phagocytosis of apoptotic cells. These results illustrate the
need to consider physicochemical parameters like oxygen level when studying macrophage
polarization, so as to correctly assess their functions in tissue.
Introduction
4
Macrophages are key elements of the innate immune system. Alongside their well known anti-
infection functions, they are involved in numerous homeostatic processes in tissues, including
removal of apoptotic cells and remodeling the extracellular matrix (1). Macrophages have been
progressively recognized to be involved in systemic metabolism, cold adaptation and development
(2). One of the peculiarities of these cells is their phenotypic plasticity (3), which is associated with a
broad spectrum of activation states termed polarizations. Polarization is linked to functional
phenotypes in specific physiological and pathological processes. A large body of literature related to
macrophages is devoted to better defining polarization states from a molecular point of view (4). An
M1/M2 dichotomy has been used to present the pro- and anti- inflammatory activation states of
macrophages. ‘Classical’ activation, M1, is associated with environments where IFNγ and LPS are
commonly found. An ‘alternative’ activation, M2 was then recognized, associated with upregulation
of the mannose receptor and increased MHC class II expression (5). M2 activation was subsequently
subdivided into three states(6): M2a (in response to IL-4 and IL-13), and M2c (induced by IL-10
and/or glucocorticoids or TGF-β) involved in matrix deposition and tissue remodeling; and a third
state: M2b (in response to immune complexes associated with a TLR agonist), which is implicated in
immune regulation (7). This M1/M2 model has been successfully used to describe macrophage
responses in multiple situations like acute infections, allergy or obesity (8). Despite this success, this
classification has failed to grasp the broad phenotypic repertoire produced by the environmental
signals received by macrophages in chronically inflamed tissues or in cancer (9–11). It is now
accepted that macrophage activation is best described by a multidimensional model integrating
specific microenvironmental signals (12). A recent transcriptome-based network analysis revealed
that it was impossible to describe polarization of human macrophages by a dichotomous model like
the M1/M2 model (13). The study presented here aimed, among other goals, to provide a molecular
signature of various polarizations in human macrophages at the protein level so as to better define
the different macrophage activation states.
5
Oxygen is an environmental parameter that has gained increasing attention since the recognition of
its role in the field of stem cell research (14). Tissue oxygen tension can vary significantly, ranging
from 3% to 18.6% O2, the highest concentrations corresponding to those commonly found in cell
culture incubators, and similar to the oxygen tension encountered by alveolar macrophages. Since
alveolar macrophages were found to present functional and morphological differences compared to
lung interstitial macrophages (15), it has been hypothesized that the differences are related to the
differing levels of oxygen exposure in these tissues (16). Furthermore, bone marrow-derived
macrophages exposed to low oxygen levels were shown to present an increased rate of bacterial
phagocytosis (16). Oxygen exposure also influenced THP1-differentiated macrophages, although by
decreasing phagocytosis (17), it therefore appears that oxygen tension is a fundamental modulator of
macrophage polarization that should be clarified at the molecular level in human macrophages.
In the present study, we applied a proteomics approach to address these issues. By measuring
expression levels for thousands of proteins simultaneously, we attempted to identify the key
molecular differences between different macrophage polarization states under high (18.6%) and low
(3%) oxygen conditions. The comparative results revealed new polarization-specific makers which
suggest that environmental oxygen levels should be taken into account when characterizing
macrophage activation states. This proteomic analysis highlighted the impact of oxygen on rates of
phagocytosis of apoptotic cells, linked to changes in expression levels for proteins such as
arachidonate15-lipoxygenase (ALOX15). We were able to demonstrate that upregulation of ALOX15
is associated with an increase in phagocytosis in IL4/IL13-polarized cells under low oxygen conditions.
As clearance of apoptotic cells by macrophages is an essential process in tissue homeostasis, and in
the active resolution of inflammation (18), these results demonstrated the importance of molecular
characterization of human macrophages in order to better understand their physiological functions.
Experimental procedures
6
Cell preparation and culture
Human blood samples from healthy de-identified donors were obtained from EFS (French national
blood service) as part of an authorized protocol (CODECOH DC-2015-2502). Donors gave signed
consent for use of their blood in this exploratory study. Peripheral blood mononuclear cells (PBMC)
were obtained from whole blood (buffy coat) by density gradient centrifugation (Histopaque 1077,
Sigma Aldrich). Monocytes were isolated from PBMCs using CD14 magnetic beads (Miltenyi Biotec)
according to the manufacturer’s instructions. Purity was assessed by flow cytometry for CD14hiCD45hi
cells and found to be > 98%. Monocytes were cultured in RPMI-Glutamax supplemented with 10%
human serum AB (Sigma Aldrich) and differentiation was induced by M-CSF (25 ng/mL) over five
days. Polarization was subsequently obtained by seeding cells in the same concentration of M-CSF
and adding specific stimulations for a total of 60 hours. Polarization states were induced as follows:
M(Ø): no stimulation; M(IFNγ+LPS): IFNγ 10ng/mL +LPS 1ng/mL; M(IL-4+IL-13): IL-4 20ng/mL + IL-13
20 ng/mL; M(IC+LPS): IC + LPS 1 ng/mL; and M(IL-10 + DXM): DXM 10 μM + IL10 25 ng/mL. We used
the current convention when describing the polarization induced by the different stimuli, rather than
the M1/M2 classification (19). Cells were counted in a Malassez chamber, using trypan blue exclusion
to identify live cells. All cytokines and growth factors were purchased from Miltenyi Biotec.
Dexamethasone (DXM) was purchased from Sigma Aldrich. LPS serogroup 0111 B4 was purchased
from Calbiochem. Immune complexes (IC) were obtained by mixing BSA (Bovine serum Albumin from
Sigma Aldrich) and antibodies directed against BSA (Invitrogen) at a molar ratio of 1:4 for 1 hour at
37 °C before use. Cells were either cultivated under “high oxygen” in an isobaric humidified incubator
under 18.6% O2, 5% CO2 or under “low oxygen” in an isobaric humidified incubator under 3% O2, 5%
CO2. For the low oxygen condition, medium was changed in a workstation under the same gas
conditions to ensure consistent oxygen exposure. Monocytes differentiation starting at day 0 and
polarization were performed under the same oxygen condition until cell analysis. Jurkat cells, for
7
phagocytosis assays, were cultured in RPMI with 10% FCS in an isobaric humidified incubator under
18.6% O2, 5% CO2.
Proteomics
Cells were directly lysed in Laemmli buffer (234 mM Tris-HCL (pH 6.8), 7.5% SDS, 37% glycerol, 33.3%
β-Mercaptoethanol, pinch bromophenol blue). The protein equivalent of 300 000 cells for each
sample was loaded on NuPAGE Bis-Tris 4-12% acrylamide gels (Life Technologies SAS).
Electrophoretic migration was controlled to allow each protein sample to be split into six gel bands.
Gels were stained with R-250 Coomassie blue (Biorad) before excising protein bands. Gel slices were
washed three times in 25mM ammonium bicarbonate (Sigma Aldrich) for 20 min at 37 °C, followed
by one wash in (50%/50%, v/v) 25 mM ammonium bicarbonate and acetonitrile (Sigma Aldrich). Gel
pieces were then dehydrated with 100% acetonitrile, incubated with 10 mM DTT (Dithiothreitol) in
25 mM ammonium bicarbonate for 45 min at 56 °C, followed by 55 mM iodoacetamide (Sigma) in 25
mM ammonium bicarbonate for 35 min in the dark. Alkylation was stopped by adding 10 mM DTT in
25 mM ammonium bicarbonate. Samples were then washed in 25 mM ammonium bicarbonate and
dehydrated with 100% acetonitrile. Proteins were digested overnight at 37 °C with Trypsin/Lys-C Mix
(Promega) according to manufacturer’s instructions. The resulting peptides were extracted from gel
pieces in three sequential extraction steps (each 15 min): 50 μl of 50% acetonitrile, 50 μl of 5% formic
acid, and finally 50 μl of 100% acetonitrile. After extraction fractions were pooled and dried in
‘‘Mμlti’’ low-absorption tubes (Dutscher) in line with published recommendations (20). Samples were
stored at -80 °C until further analysis.
Nano-LC-MS/MS Analyses
The dried extracted peptides were resuspended in 2% acetonitrile and 0.05% trifluoroacetic acid
(Sigma) and analyzed by online nano-LC (Ultimate 3000, Thermo Scientific) directly linked to an
impact IITM Hybrid Quadrupole Time-of-Flight (QTOF) instrument fitted with a CaptiveSpray ion
8
source (Bruker Daltonics). The flow rate for the nano-LC was set to 400 nL/min. Mobile phases were
(A) 0.1% formic acid, 99.9% water; and (B) 0.08% formic acid, 20% water in 79.92% ACN v/v/v. The
sample was loaded onto a precolumn (300 μm ID, 5 mm long, 5μm particles, 100 Å pores Thermo
Fisher) during a 5-min injection, peptides were transferred onto a PepMap nano-column (75 μm ID,
50 cm long, 2 μm particles, 100 Å pores, Thermo Fisher) for gradient separation. The gradient profile
was: from 2% to 35% B in 115 min; from 35% to 90% B in 5 min; constant 90% B for 10 min before
returning to 2% B in 1 min. As a compromise between deep proteome analysis and quantitative
analysis, we used a “dynamic method”, with a fixed cycle time of 3 s. The mass range of the MS scan
was set between m/z 150 and 2200. The duration of dynamic was 30 s. The collision energy was
adjusted to between 23–65 eV depending on the m/z value.
Analysis of Proteomic Data
All data were analyzed using MaxQuant software (version 1.5.2.8) and the Andromeda search engine
(21, 22). The false discovery rate (FDR) was set to 1% for both proteins and peptides, and a minimum
length of seven amino acids was set. MaxQuant scored peptide identifications based on a search with
an initial permissible mass deviation for the precursor ion of up to 0.07 Da after time-dependent
recalibration of the precursor masses. Fragment mass deviation was allowed up to 40 ppm. The
Andromeda search engine was used to match MS/MS spectra against the Uniprot human database
(downloaded in April 2015, containing 145,892 entries and 245 contaminants). Enzyme specificity
was set as C-terminal to Arg and Lys, cleavage at proline bonds and a maximum of two missed
cleavages were allowed. Carbamidomethylation of cysteine was selected as a fixed modification,
while N-terminal protein acetylation and methionine oxidation were selected as variable
modifications.
The “match between runs” feature of MaxQuant was used to transfer identifications information to
other LC-MS/MS runs based on ion masses and retention times (maximum deviation 0.7 min); this
9
feature was also used in quantification experiments. Quantifications were performed using the label-
free algorithms (22). A minimum peptide ratio count of two and at least one “razor peptide” was
required for quantification.
The LFQ metric was used to perform relative quantification between proteins identified in different
biological conditions, protein intensities were normalized based on the MaxQuant “protein
group.txt” output (reflecting a normalized protein quantity deduced from all peptide intensity
values). Potential contaminants and reverse proteins were strictly excluded from further analysis.
Experimental Design and Statistical Rationale
Three analytical replicates from three independent biological samples (donors) were analyzed for
each polarization in the two oxygen conditions, an additional donor was analyzed at 18.6% O2. For
comparisons between pairs of polarizations, only proteins which were quantified in all biological
samples in at least one polarization were considered for further processing and statistical analysis.
Missing values were deduced from a normal distribution (width: 0.3; down shift: 1.8) using the
Perseus (version 1.5.5.3) post data acquisition package contained in MaxQuant (www.maxquant.org).
Data were further analyzed using JMP software (v.13.0.0, SAS Institute Inc.). Proteins were classed
according to the paired Welch t-test difference (difference between the mean value for triplicate
MS/MS analyses for the two conditions compared), and the median fold-change between the two
conditions compared. All data are presented as mean +/- SEM. Flow cytometry, phagocytosis and
qPCR data were analyzed by a paired t-test to determine statistical significance of differences
between two groups, or by the Tuckey multiple comparison test when more than two groups were
compared. All statistical tests were run using GraphPad Prism (v 5.01). The threshold for statistical
significance was set to a p-value <0.05.
Bioinformatics analysis
10
Functional enrichment was analyzed using FunRich (23). Gene Ontology enrichment was determined
using DAVID software (https://david.ncifcrf.gov/) (24). A bibliographic search was performed in
Pubmed (https://www.ncbi.nlm.nih.gov/pubmed/) and GoogleScholar (https://scholar.google.fr/) for
proteins or genes identified as specific for a particular polarization in human monocytes using the
following keywords: ‘macrophages’, ‘polarization’, ‘Human’, ‘Protein name’ or ‘Gene name’.
Flow cytometry
Flow cytometry data was acquired on an Accuri C6 (BD) flow cytometer. The FcR blocking solution
(Miltenyi Biotec) was used to prevent non-specific labeling. The antibodies used were: CD40 FITC
(clone HB14), CD14 FITC (clone TÜK4), CD16 PE (clone 3G8, BD Pharmingen), CD206 PE (clone
DCN228), CD74 APC (clone 5-239), CD274 APC (clone MIH18), HLA-DR APC (clone AC122) and
corresponding isotypic controls (Miltenyi Biotec). Doublet cells were gated out by comparing forward
scatter signal height (FSC-H) and area (FSC-A). Dead cells were excluded based on 7AAD or FSC/SSC
profile. A least 10 000 events were collected in the analysis gate. Median fluorescence intensity (MFI)
was determined using Accuri C6 software (BD).
Immunofluorescence
Cells were cultured on Lab-Tek chambered coverglass (Thermo Fischer). After differentiation and
polarization, cells were fixed in paraformaldehyde 4% (Sigma Aldrich) for 10 minutes. Cells were then
permeabilized with Triton at 0.2% for 5 minutes. Non-specific binding was saturated by applying BSA
3% for 20 minutes. A mouse monoclonal antibody directed against STAT1 (Santa Cruz sc-464) was
used at 4 μg/mL, incubated for 1 hour at 37 °C. The secondary anti-mouse Alexa 594 antibody
(Invitrogen) was used at 1 μg/mL, incubated for 45 minutes at 37 °C. Nuclei were stained with
Hoechst 33342 at 1 μg/mL (Invitrogen) for 5 minutes. Images were acquired on a confocal
microscope (Fv 10 Olympus) and analyzed using Fiji software (NIH).
Phagocytosis assay
11
Apoptosis was induced in Jurkat cells by UV-C ( =254 nm, 7 mW/cm2) for 5 minutes. Apoptosis was
assessed 16 hours after irradiation by flow cytometry based on annexinV-FITC (Miltenyi Biotec) and a
7-AAD (BD bioscience) staining. Three groups of cells were identified: non-apoptotic cells (AnnexinV-
7AAD-), early apoptotic cells (AnnexinV+ 7AAD-), and late apoptotic cells (AnnexinV+ 7AAD+).
Apoptotic cells were stained with TAMRA (5-Carboxytetramethylrhodamine, Sigma Aldrich) and then
mixed with macrophage cultures (ratio 5:1) and incubated for one hour. Phagocytosis was assessed
by confocal microscopy (Fv 10 Olympus) after staining macrophages with phalloidin-Alexa 488
(Invitrogen) and nuclei with Hoescht 33342 (Invitrogen). Phagocytic events, the number of
macrophages containing an apoptotic cell in their cytoplasm, were counted on more than 100 cells
per condition using Fiji software. Stock solution (20mM) of ML351 (Sigma Aldrich) and PD146176
(Sigma Aldrich) were prepared in DMSO. Final solution of DMSO in cell culture medium did not
exceed 0.05%. Neither the vehicle nor ML351 or PD146176 modified cell viability. Exposition to
ALOX15 inhibitors was performed in parallel to cytokine (IL4, IL13) exposition.
Western blots
Cell lysates from HMDM were prepared in RIPA with protease inhibitors. Total amount of proteins
was determined by BCA Protein Assay kit (Pierce). A volume corresponding to 10 or 20μg was
deposited and run on SDS polyacrylamide gels according to standard SDS-PAGE protocols. The
primary antibodies used were anti-STAT1 (Santa Cruz sc-464), anti-HK2 (Cell Signaling #2867), anti-
ALOX15 (Abcam ab119774) and anti β-actin (Sigma Aldrich) as loading control. Signal was detected
by chemoluminiscence (Chemi-Doc Imaging System, Biorad) after incubation with horseradish
peroxide-conjugated secondary antibody.
RNA extraction and RT-qPCR
RNA was isolated from 106 cells for each polarization using the MirVana isolation kit™ (Ambion,
Applied Biosystems, Foster City, CA). Long RNA and small RNA(<200 pb) were collected separately.
12
RNA quality and quantity were assessed by performing an Agilent Eukaryote Total RNA Nano assay in
a 2100 Bioanalyzer (Agilent Technologies, Santa Clara, CA, USA). Long RNA (400 ng) was transcribed
into cDNA using the iScriptTM Reverse Transcription (RT) Supermix (BioRad Laboratories, Marnes-la-
Coquette, France). The volume of the RT reaction was made up to 100 μl by adding Tris buffer
(50 mM, pH 8). For each gene assayed by qPCR, 1 μl duplicate samples were analyzed on a CFX96
TouchTMReal-Time PCR Detection System (Biorad), using the SsoAdvancedTMUniversal SYBR® Green
Supermix kit (Biorad). The PCR protocol used was: 3 min at 95 °C; 40 cycles with 15 s at 95 °C and 15 s
at 60 °C. PCR primers were designed using the Universal Probe Library Assay Design Center
(https://lifescience.roche.com/en_fr/brands/universal-probe-library.html#assay-design-center). The
following primers were used: Homo sapiens arachidonate 15-lipoxygenase (ALOX15
NM_001140.3) Forward 5’GCAGCCTGATGGGAAACTC3’ and Reverse 5’GGGGATCCGTAGGCAAGA3’;
Homo sapiens ribosomal protein L6 (RPL6 NM_001024662.2) Forward 5’TCCATTCGTCAGAGCAAACA3’
and Reverse 5’TACGGAGCAGCGCAAGAT3’; Homo sapiens ribosomal protein L27 (RPL27
NM_000988.3) Forward 5’CGCAAAGCTGTCATCGTG3’ and Reverse 5’GTCACTTTGCGGGGGTAG3’;
Homo sapiens WAS protein family, member 2 (WASF2 NM_001201404.2) Forward
5’AAGAAAAGCTGGGACTTCTG3’ and Reverse 5’GCTACTTGCATCCACGTTTTC3’. Relative ALOX15 levels
were calculated using the relative standard curve method. Normalization was based on levels of
three reference genes, ribosomal protein L6 (RPL6), ribosomal protein L27 (RPL27) and WAS protein
family, member 2 (WASF2).
Results
Proteomic analysis reveals proteins specific for each polarization state
To study the proteome in human monocyte-derived macrophages as a function of their polarization
state, we used a label-free quantification approach on in-gel fractionated and LysC/Trypsin digested
proteins (Figure 1A). In total, 5102 proteins were identified and quantified for all polarization states,
13
with a dynamic range extending over five orders of magnitude according to LFQ (Figure 1B). Principal
component analysis (PCA) of differentially expressed proteins revealed specificities in each
polarization induced (PC1 30%, PC2 14.6%, PC3 8.9%) (Figure 1C). For macrophages differentiated
and polarized under 3% O2, the PCA analysis showed that M(IFNγ + LPS) and M(LPS+IC) polarizations
were very similar in terms of protein expression profile (Figure 1C). Using a fold-change threshold of
2 and a p-value <0.05, we determined the list of proteins over-expressed between two polarizations,
as illustrated by volcano-plots representing the comparison between M(IL10+DXM) vs. M(IFNγ+LPS)
at 18.6% O2 (Figure 1D). A Venn diagram representing over-expressed proteins in the different cases
was produced by comparing a particular polarization to all the other polarizations. A list of proteins
specific for each polarization was thus obtained. This analysis provided a list of specifically over-
expressed (Table 1 in red) or under-expressed (Table 1 in blue) proteins for each polarization state.
For example, 26 proteins were specifically over-expressed in M(IL10+DXM) cells (Figure 1E). Some of
these proteins have already been reported as specific for a polarization of HMDM at the protein or
mRNA level (Supplementary table S1 & Supplemental references). Proteomic identification details for
each specific protein can be found in Supplementary Tables S1 for M(Ø), M(IFNγ+LPS), M(IC+LPS),
M(IL4+IL13) and M(IL10+DXM), respectively. Proteomic identification details concerning all identified
proteins is present in Supplemental table S2.
Membrane proteins expressed on macrophages as polarization markers
Human monocyte-derived macrophages are usually characterized by examining the expression of
various surface markers (25). The following surface markers were identified in our proteomics
analysis: CD14, CD40, CD74, CD163, CD206 and CD274 (Supplemental Figure S1).These surface
markers could be used to identify the different polarizations: M(Ø) as
CD14hiCD40medCD74medCD163loCD206loCD274lo, M(IFNγ+LPS) as
CD14hiCD40hiCD74loCD163loCD206loCD274hi, M(IC+LPS) as CD14hiCD40hi
CD74loCD163loCD206loCD274med, M(IL4+IL13) as CD14loCD40medCD74hi CD163loCD206hiCD274med, and
14
M(IL10+DXM) as CD14hiCD40mediCD74med CD163hiCD206hiCD274lo. Modifying the partial pressure of
oxygen under which macrophage differentiation takes place causes modulation of various
macrophage functions (17). Nevertheless, no statistically significant differences in levels of surface
marker expression were noted in our hand between human macrophage populations grown under
3% and 18.6% O2. This result was confirmed by flow cytometry analysis of the expression levels of
these surface proteins (Supplementary Figure S2). In this analysis, a trend toward increased CD14
expression was noted in all polarization states, except for M(IL4+IL13), and a trend toward decreased
CD163 expression was noted for M(IL10+DXM) under low oxygen conditions (p=0.056, paired t-test,
n=18). Taken together, these results suggest that the surface markers commonly used to distinguish
between macrophage populations are not sufficiently sensitive to classify changes to macrophage
polarization induced by variations in oxygen levels (Supplemental Figure 2).
Proteins specific for unstimulated macrophages
Human monocytes exposed to M-CSF differentiate into macrophages. When no further stimulus is
added, these macrophages are considered unstimulated compared to other polarizations. A few
proteins were found to be specifically over-expressed in this cellular population. Two candidate
proteins were identified: Chitotriosidase-1, which has already been described at the transcriptomic
level in M(Ø) macrophages, and cystatin-C (Table 1, Supplementary Table S1). Some proteins were
also found to be specifically under-expressed in M(Ø) compared to other polarizations, these were
arachidonate 15-lipoxygenase B (ALOX15B) and Tropomyosin alpha-3 chain (Table 1 and
Supplementary Table S1). ALOX15B is the main element of human 12/15 lipoxygenase and has been
described as being inducible by multiple stimuli such as IL-4 and LPS (26). Moreover, we found the
strongest ALOX15B inducer to be glucocorticoids associated with IL-10 (Supplemental Figure S3) as
this protein was identified among the proteins specifically upregulated in M(DXM+IL-10)
macrophages (Table 1). The low partial pressure of oxygen (3% O2) by itself did not induce ALOX15B
15
expression, in contrast to reports of expression modulation under extreme hypoxic conditions (0.2%
O2) (26).
M(IFNγ+LPS) and M(IC+LPS) macrophages identify a group of LPS-induced proteins
Both the PCA analysis (Figure 1C) and hierarchical clustering indicate that M(IFNγ+LPS) and M(IC+LPS)
macrophages are closely related. These polarizations share a common stimulus, the TLR agonist LPS.
To identify the proteins specific to these two polarizations and separate them from LPS-related
proteins, we performed a subtractive analysis. This analysis revealed upregulation of proteins mainly
implicated in the inflammatory response, as expected (Table 2 in red, Supplemental Table S3). Using
DAVID software, the following Gene Ontology (GO) (GO-term)-BP (Biological Processes) were
associated with these proteins (Benjamini-Hochberg adjusted p-value <0.05): immune response,
response to virus, cell activation and defense response. These GO-terms were in line with general
macrophage function, and were identified in cells grown both under 18.6% O2 and under 3% O2. At
3% O2, the following GO-term was also identified: response to wounding. Analysis of downregulated
proteins (Table 2 in blue, Supplemental Table S3) identified MRC1 (CD206; Mannose receptor) a
protein known to be associated with alternative activation in human macrophages (6). Indeed,
CD206 is a surface protein mainly expressed in M(IL4+IL13) and M(IL10+DXM) macrophages
(Supplemental Figure S1), and this expression pattern was confirmed by flow cytometry
(Supplemental Figure S2).
Proteins associated with IFNγ/LPS activation
Proteins specifically upregulated in M(IFNγ + LPS) irrespective of oxygenation conditions were:
Apolipoprotein L2 (APOL2), Apolipoprotein L3 (APOL3), Indoleamine 2,3-dioxygenase 1 (IDO1),
Guanylate binding protein 1, Guanylate binding protein 5 (GBP5), Programmed cell death 1 ligand 1
(CD274), Signal transducer and activator of transcription 1-alpha/beta (STAT1), Signal transducer and
activator of transcription 2 (STAT2), Tryptophan-tRNA ligase (WARS) and Antigen peptide transporter
16
2 (TAP2) (Table 1). All these proteins have already been reported in human macrophages at the
protein or mRNA level (Supplementary Table S1). Two proteins emerged as candidate new markers
of human M(IFNγ + LPS): NEDD8 ultimate buster 1 and ADP-ribosyl cyclase/cyclic ADP-ribose
hydrolase 1 (CD38) which previously had only been reported to be induced by LPS in murine
macrophages (27). The transcription factor STAT1 has been described as a key molecular component
of the IFN-γ response of macrophages (19). When IFNγ binds to its receptor at the cell membrane, it
induces phosphorylation of STAT1 by members of the JAK (Janus kinase) family of protein tyrosine
kinases. p-STAT1 in a homodimer or a heterodimer with STAT2 then translocates to the nucleus
where it induces transcription of target genes (28). Our label-free quantification approach revealed
that overall expression of STAT1 is upregulated in M(IFNγ + LPS) macrophages (Figure 2A), as it has
been previously reported at 18.6% O2 (29) but also that 3% O2 exposure does not modify this
expression. This result was confirmed by western blot analysis of M(IFNγ + LPS) samples; STAT1 was
also detected by western blot at lower levels in M(IC + LPS), but it was undetectable in other
polarizations (Figure 2B) and in unpolarized macrophages (data not shown). Over-expression of
STAT1 was also confirmed by confocal microscopy and demonstrated its nuclear localization (Figure
2C). In M(IL-4 + IL-13) macrophages, STAT1 is expressed at lower levels and no nuclear localization
was detected (Figure 2C). These results indicate that IFNγ stimulation of macrophage is associated
with an increased overall expression of intracellular STAT1 60 hours after the start of the stimulation.
We also found that STAT1 is localized in the nucleus, which is known to occur when this transcription
factor is phosphorylated, demonstrating that this over-expression is functional (30). Our results
indicate that the STAT1 molecular pathway is unaffected by reduced oxygen levels, as no differences
were visible between 18.6% and 3% O2 conditions (Figure 2A & 2B). A similar result was found for
STAT2 using LFQ analysis (data not shown).
Analysis of the phenotype induced by immune complexes and LPS
17
Despite sharing LPS stimulation with M(IFNγ + LPS) macrophages, proteins specific for M(IC+LPS)
macrophages were identified (Table 1, Supplemental Table S1): hexokinase-2 and a glucose
transporter, SLC2A3 (Supplemental Table S1). Hexokinase-2 is involved in the first step of glycolysis
and has been described as elicited by LPS-driven reprogramming of ‘inflammatory’ macrophages
toward a glycolytic energy source (31). This protein is also upregulated in M(INFγ+LPS) macrophages
compared to other polarization states studied here (Figure 3 A & B). This result confirms the
glycolytic signature of human ‘M1’ macrophages when activated by LPS (32). This result indicates
that the metabolic signature generally used to distinguish classically activated and alternatively
activated macrophages is incompatible with the oxygen environment found in a majority of human
tissues. The modulatory role of this polarization is illustrated by the lower expression of the STAT1
transcription factor compared to M(IFNγ + LPS) (Figure 2 A & B).
Alternative activation induced by IL4/IL13
M(IL4+IL13) are classed as anti-inflammatory cells. Our results support this classification in particular
as TLR2 and CD14, implicated in the TLR4-mediated response to LPS (33), are downregulated (Table
1). This polarization is characterized by the over-expression of a large number of MHC class II
proteins: HLA-DRA, HLA-DRB1, HLA-DRB3, HLA-DPA1 and HLA-DPB1 (Table 1, Supplemental Table
S1). CD74, which helps guide the CD74–MHC-II complex to the endolysosomal compartment is also
upregulated in these macrophages, although the level of change was not statistically significant in
LFQ (Supplemental Figure S1). The result was nevertheless confirmed by flow cytometry
(Supplemental Figure 2). This MHC II expression was further investigated by flow cytometry analysis
of the different HLA-DR molecules (Figure 4), and once again the 3% O2 condition was associated with
a strong downregulation of HLA-DR in M(Ø) macrophages, and to a lesser extent in M(IL4+IL13)
macrophages (Supplemental Figure S4). The downregulation of HLA-DRB1, HLA-DRB3 and HLA-DRA in
M(Ø) at 3% O2 was confirmed by our LFQ analysis (data not shown).
18
General response to decreased partial pressure of oxygen in human macrophages
Hierarchical clustering of differentially expressed proteins was used to classify polarization states
(Figure 5). This analysis revealed four main protein clusters related to LPS-stimulated, IL4/IL13-
stimulated, and IL10/DXM-stimulated macrophages, as well as a cluster of proteins over-expressed in
all polarizations upon exposure to 3% O2 (Supplemental Table S4). To determine the molecular
pathways with which these proteins are mainly associated, we performed a FunRich enrichment
analysis of the biological pathways involved in this cellular response to a low-oxygen environment
(Figure 6A). The main categories of biological pathways identified were: metabolism, mitochondrial
citric acid cycle, respiratory electron transport, glycolytic metabolism and HIF-1α network. In a
complementary analysis, we used the GO-BP (Biological Processes) analysis available in DAVID
software (Figure 6B). Glycolytic processes and respiratory electron transport were the main biological
processes associated with the proteins induced under low oxygen conditions. These results describe
the general macrophage response to a low-oxygen environment, which corresponds to ‘normoxia’ in
a number of tissues. This response involves a large number of over-expressed proteins under the
control of the transcription factor HIF-1α and the reorientation of the cellular metabolism toward
glycolysis.
The “M1/M2 dichotomy” under low partial pressure of oxygen
The M1/M2 dichotomy is often used to compare pro- and anti-inflammatory activation states of
macrophages. This dichotomy equates M1 to IFNγ-stimulated macrophages (+/- LPS) and M2 to IL4-
polarized macrophages, possibly associated with IL13 (6). To characterize this classification using our
proteomics approach, we used an enrichment of GO-terms-BP analysis of over-expressed proteins in
the M(IFNγ+LPS) and M(IL4+IL13) samples at 3% compared to 18.6% O2 (Supplemental Figure S4).
M(IFNγ+LPS) macrophages were mainly involved in the anti-viral response and inflammatory
response mediated by the IFNγ signaling pathway. In contrast, M(IL4+IL13) macrophages were
19
associated with antigen presentation through MHC class II molecules. A similar profile of biological
process enrichment was observed when macrophages were exposed to a low-oxygen environment,
although some new GO-terms appeared at 3% O2. In particular, IFNγ/LPS polarization was associated
with the following terms: antigen presentation via TAP-independent MHC class I, positive regulation
of nitric oxide biosynthetic process, positive regulation of interleukin-6 production, leukocyte
migration and response to hypoxia (Supplemental Figure S4 A). IL4/IL13-polarized macrophages at
3% O2 also had new GO-terms, mainly in categories associated with MHC class II-mediated antigen
presentation, as well as translation and transcription regulation and response to hypoxia
(Supplemental Figure S4 B).
Polarization-specific proteins as sensors of environmental oxygen
Proteins specific for a particular polarization that maintain their specificity regardless of oxygen levels
could nevertheless display modulations in expression levels between 3% and 18.6% O2 (FC > 2, paired
Welch t-test p <0.05), making these proteins candidate polarization-specific oxygen sensors. The
following proteins fulfill these criteria for M(IL4+IL13) macrophages: ALOX15 (Arachidonate 15-
lipoxygenase), CRABP2 (Cellular retinoic acid-binding protein2), both of which are upregulated at 3%
O2; HLA-DPA1 and CD209 (DC-SIGN) which are downregulated at 3% O2. A single protein was found
upregulated at 3% O2 for M(IL10+DXM) macrophages: NAIP (Baculoviral IAP repeat-containing
protein 1).
Macrophage phenotype induced by IL10 and corticosteroids
Proteomic (Supplemental Figure S1) and flow cytometry (Supplemental Figure S2) analyses clearly
confirmed over-expression of the well known scavenger receptor CD163 in M(IL10+DXM)
macrophages. Proteomic analysis also confirmed other previously reported markers such as FPR1
(Formyl peptide receptor 1), VSIG4, coagulation factor XIII and FcγRIIa (CD32) (Table 1, Supplemental
20
Table S1). MHC II molecules (HLA-DRB1, HLA-DRA) were downregulated in this polarization (Table 1)
along with some HLA-associated proteins like TAPBP, SET and DERL1 (Supplemental Table S1).
Increased clearance of apoptotic cells by M(IL4+IL13) under low oxygen conditions is related to over-
expression of ALOX15
Our proteomic analysis revealed that ALOX15 is specifically expressed in M(IL4+IL13) macrophages,
with significantly increased expression at 3% O2 (Figure 7A). We were able to confirm this pattern of
expression by western blot analysis (Figure 7B). We found that this expression was regulated at the
transcriptomic level as the ALOX15 mRNA expression determined by qPCR at 18.6% O2 was 843.3+/-
205.1 (AU) vs. 5936+/- 1905 (AU) at 3% O2 (p < 0.05, paired t-test n=5). ALOX15 mRNA levels were
undetectable in other polarizations. We found that ALOX15 is implicated in the ability of M(IL4+IL13)
macrophages to phagocyte apoptotic cells using. Using ML351 and PD146176, which are known
specific inhibitors of ALOX15 activity (34), we were able to show that this inhibition significantly
decrease the phagocytosis rate of macrophages (Figure 7C). We then were able to show that
exposure to low oxygen levels, which is associated with an induction of ALOX15 expression, did
increase significantly M(IL4+IL13) macrophages efferocytic abilities (Figure 7D). This low oxygen
exposition was not associated with an altered rate of phagocytosis of apoptotic cells in other
polarization (Figure 7D). This result illustrates how the phagocytic capacity of polarized macrophages
could be altered in response to environmental variables like oxygen tension, even in the presence of
polarizing biochemical signals.
C1q is specific for M (IL10 + DXM) macrophages, and associated with extensive phagocytosis of
apoptotic cells
C1q is a component of the complement cascade which has been implicated in the phagocytosis of
apoptotic cells (35). One of the receptors associated with the C1q-dependant phagocytosis of
apoptotic cells is MerTK (mer tyrosine kinase), a member of the TAM (Tyro3, Axl, Mer) family of
21
receptors (36). It has been suggested that MerTK is over-expressed in response to IL10 stimulation,
and that this could explain the higher capacity of M(IL10) macrophages to internalize apoptotic cells
(36). Our results confirmed that M(IL10+DXM) macrophages display a higher rate of phagocytosis of
apoptotic cells compared to other polarizations in hyperoxic conditions (Figure 7D). This high rate of
phagocytosis is also associated with a high phagocytic index, translating the mean number of
apoptotic cells internalized by a single macrophage. In M(IL10+DXM) macrophages, this index was
greater than 1, whereas in other polarizations only one apoptotic cell was visible in each macrophage
engaged in efferocytosis. This phagocytic phenotype is associated with over-expression of MerTK in
M(IL10+DXM) macrophages, and expression of C1q by the macrophages themselves (Supplementary
Figure 5). Thus, M(IL10+DXM) phagocytic capacity is probably linked to the MerTK-C1q pathway, with
both of these proteins synthesized by macrophages. C1q by itself has also been shown to induce the
expression of MerTK (36). We were able to demonstrate that M(IL10+DXM) maintain their
phagocytic capacity at 3% O2 (Figure 7D), and that C1q expression was unaffected by changes to the
environmental oxygen tension (Supplemental Figure 5).
Discussion
Macrophages form a group of specialized innate immune cells found in all tissues. The ontogeny of
these cells is complex, and tissue-resident macrophage populations could originate in the yolk sac,
the fetal liver or the bone marrow (12). Circulating monocyte-derived from bone marrow progenitors
not only replenish some tissue-resident macrophage compartments (e.g. gut macrophages) but could
be recruited by various tissues in response to sterile or infection-related inflammation leading to
their differentiation into macrophages. This differentiation takes place under the influence of
multiple signals (e.g. cytokines, chemokines, growth factors and danger signals) which lead to
partially reversible polarization (1). Depending on the type of cytokines present in the tissue
microenvironment, in particular those secreted by T helper lymphocytes, it is common to describe a
‘classical’ activation (M1) under the control of interferon-γ (that may be associated with LPS) and an
22
‘alternative’ activation (M2a) induced by IL-4/IL-13. This classification, although useful, was rapidly
found to be inadequate to grasp the continuum of activation states observed in vivo (6).
Macrophage activation states are related to strong functional differences in their secretome, their
ability to synthesize and remodel the extracellular matrix and their phagocytic capacities.
Transcriptomic analysis has revealed a huge number of potential biomarkers associated with a
particular polarization (13, 37, 38). This approach also revealed important markers such as
tranglutaminase 2 (TGM2) for IL-4 polarized macrophages (39), and the partially shared
transcriptomic profile between human and murine macrophages (39). Less work has been done at
the proteomic level on human macrophages, and comparison with transcriptomic data indicated only
limited comparability between gene and protein levels (39). There is therefore a clear need to
explore the proteome of human macrophages in various polarization states to determine a molecular
signature and relate it to functional phenotypes. Because most tissues where monocytes undergo
differentiation present an environmental oxygen tension sometimes far below the atmospheric one,
we decided to study how this physicochemical parameter affected human macrophage polarization.
The influence of oxygen on macrophage phenotypes is illustrated by differences reported between
alveolar macrophages and lung interstitial macrophages (15). These morphological and functional
differences are believed to be related to the differing oxygen levels in which these two cell categories
are found (16). Phagocytosis of bacteria has been shown to increase in murine bone marrow-derived
macrophages when exposed to low levels of oxygen (16), and an opposite result was found in human
THP1-differentiated macrophages (17). These results illustrate the need to understand how oxygen
modulates macrophage polarization and functions.
Macrophage differentiation and polarization involves a range of metabolic pathways. LPS-activated
macrophages are associated with a glycolytic profile, whereas IL-4 macrophages tend to use
oxidative phosphorylation and the Krebs cycle to produce ATP (40). Our results indicate that human
macrophages are also effectively associated with a glycolytic profile when exposed to LPS, as in the
23
case of M(IC+LPS) and M(IFNγ+LPS) macrophages. Hexokinase-2, which is involved in the first step of
glycolysis, was identified as one of the over-expressed proteins in both polarizations (Figure 3 A & B).
This protein is strongly related to the ‘Warburg effect’, or aerobic glycolysis (41). In addition to
hexokinase-2, a similar expression profile was found for SLC2A3 (Solute carrier family 2, facilitated
glucose transporter member 3) a glucose transporter (data not shown). This result confirms the LPS-
driven metabolic reprogramming toward aerobic glycolysis under 18.6% O2. Because low O2 exposure
is associated with a switch toward anaerobic glycolysis, we studied how exposure to lower oxygen
levels modifies this metabolic signature. Despite the fact that 3% O2 exposure does not represent
profound hypoxia, but rather ‘tissue normoxia’, we found that all polarizations were associated with
the induction of HIF-1α-related genes, and their metabolic profiles were oriented toward glycolysis
(Figure 6A & B). We also found that the metabolic reprogramming of LPS-stimulated macrophages
was lost under 3% O2, as Hexokinase-2 was no longer specific to LPS-stimulated macrophages.
Indeed, its expression was increased in all polarizations in these conditions (Figure 3). Metabolism in
IFNγ/LPS-stimulated macrophages was also associated with over-expression of DPYD
(Dihydropyrimidine dehydrogenase [NADP(+)]) (Table 1, Supplemental Table S1), a protein
implicated in pyrimidine catabolism. This specific expression related to IFNγ/LPS was lost when
differentiation took place at 3% O2 (Supplemental Table S2). This protein appears to be a good low-
oxygen sensor in macrophages whatever their polarization (Supplemental Figure S6). DPYD is known
to degrade 5-Fluorouracil (5-FU), a standard chemotherapy drug. Over-expression of this protein by
cancer cells has been linked to resistance to this treatment in cancer patients (42). Because tumor-
associated macrophages (TAM) evolve in a low-oxygen environment, our results suggest that these
cells could be implicated in resistance to 5-FU if they express high levels of DPYD, opening up the
possibility to design a DPYD inhibitor-based therapeutic strategy to target macrophages.
Since the seminal work of Janeway et al (43), it is demonstrated that an inadequate low number of
MHC class II molecules at the surface antigen presenting cells would lead to a decreased antigen
24
presentation. In our results we found that M(IL4+IL13) macrophages present a down regulation of
the expression of HLA-DR at their surface when exposed to low oxygen condition (Figure 4). This
effect was also found for M(Ø) macrophages. The mechanism by which low oxygen down regulates
the expression of MHC class II molecules is not known. Despite this fact, it has been demonstrated
that during the 24 hours following a shock/trauma (especially when hemorrhagic), macrophage
expression of CMH II molecules and their capacity to present antigen is decreased associated with
the cell’s metabolic response to regional hypoxia (44). The main consequence of the down regulation
of MHC II molecules in macrophage exposed to low oxygen environment is the protumoral role of
tumor associated macrophages (TAM). In tumor mice models it has been demonstrated that low
MHC-II expression macrophages populate hypoxic areas whereas TAMs with high MHC-II expression
are found in normoxic areas (45). In a mouse lung carninoma model it has been reported that MHC-II
low macrophages express M2 markers such as mannose receptor or IL4-Rα (46). Our results reinforce
the importance of considering low oxygen environment impact on M(IL4+IL13) macrophage through
MHC-II molecules expression and immune-tolerance in a tumoral context. Under exposition to low
oxygen M(IL4+IL13) macrophages also down regulate their level of expression of DC-SIGN (CD209)
even if this protein is still only expressed in this polarization. DC-SIGN is a type II transmembrane C-
type lectin with a carbohydrate recognition domain. In vitro this protein is induced by M-CSF and IL-4
(37). In vivo this protein, expressed on macrophages, has been implicated in the inhibition of T-cell
proliferation and induction of the expansion of Foxp3+ Treg (47). DC-SIGN appears as an element
maintaining an immunosuppressive tissue environment favoring immune escape of tumors (48), but
is also a receptor of various pathogens notably in alveolar macrophages. The down regulation of this
protein under low oxygen in macrophage modulates the expected immune-suppressive phenotype
associated with MHC-II molecules down regulation. It could also be understood, in a inflammatory
context associated with hypoxia, as a controlled down regulation of a receptor used by pathogens
like mycobacteria to infest alveolar macrophages (49). M(IL4+IL13) macrophages are also associated
25
with the up regulation of the expression of CRABP2 under low oxygen, this protein is implicated in
the transport of retinoic acid to nucleus. Even if it needs further investigation the retinoic acid
signaling is of uttermost importance in macrophage biology, for example it has been demonstrated
that retinoid X receptor alpha deficient mice are associated with an autoimmune nephritis produced
by a defect of the clearance of apoptotic cells by macrophages (50). Genes implicated in the
clearance of apoptotic cells have their expression impaired in these mice: CD36, MERTK, C1Q and
TGM2. Our results also show that M(IL10+DXM) macrophages present an up regulation of NAIP
expression under low oxygen exposure. This protein acts as a sensor component of the NLRC4
inflammasome (51) specific to intracellular bacteria leading to the activation of caspase-1. Lowering
oxygen dispensability in a tissue appears to be sense by these macrophages as an inflammatory
signal.
Our proteomic approach identified several proteins known to be implicated in efferocytosis, the
phagocytosis of apoptotic cells. This process is a specific function of macrophages for the
maintenance of normal and inflammatory tissues. Many proteins have been described as receptors
for ‘eat-me’ signals presented by apoptotic cells, while others have been identified as involved in the
formation of the phagocytic cup (52). The fact that efferocytic activity could be modulated by the
macrophage activation state is highly important when seeking to design new therapeutic strategies
targeting the resolution phase of inflammation as part of treatment for chronic inflammatory
diseases (53). In our study, we identified the following proteins known to be induced in efferocytosis:
CD14 (54), TGM2 (55), C1q (35), ALOX15 (56), ICAM1(57), ITGAM (58).
Our results show that IL10/corticosteroid polarization is associated with a high efferocytic activity,
related to over-expression of C1q (Figure 7D). This protein is known to be a “bridging” molecule
linking apoptotic cells (through calreticulin interaction) to receptors present on the macrophage
membrane. One of these receptors is MerTK (Supplemental Figure 5), which is also expressed at the
surface of IL10/DXM-stimulated macrophages, and expression of which is at least partially controlled
26
by C1q (36). Our results confirm, at the protein level, those of transcriptomic studies suggesting that
C1q could be directly synthesized by macrophages in response to glucocorticoids (59). C1q is
therefore responsible for controlling the expression of its own receptors, like MerTK, at the surface
of macrophages. Data presented here also indicate that C1q is a molecular signature of M(IL10+DXM)
macrophages associated with their high efferocytic activity and that its expression is unaffected by
the environmental oxygen tension. ICAM1 (Inter Cellular Adhesion Molecule 1) has also been related
to apoptotic cell clearance; it is downregulated by IL10/DXM stimulus. Downregulation of this protein
is associated with activation of the PI3K/Akt signaling pathway, and with increased efferocytosis (57).
Transglutaminase 2 is a specific protein, the expression of which is controlled by IL-4. It has been
presented as a biomarker of M(IL4+IL13) macrophages (39). This protein is also known to increase
efferocytosis. Our results confirmed the specific expression of TGM2 in M(IL4+IL13) macrophages,
but its expression was not associated with high efferocytosis levels. This result could be related to
the fact that CD14 expression was downregulated in these macrophages. Indeed, CD14 is heavily
involved in the clearance of apoptotic cells and has been described as necessary for the efferocytic
activity of TGM2 (60). IL4/IL13 stimulation is also associated with downregulation of C1q (A
fragment) expression. The ITGAM (CD11b/CD18) receptor, also known as CR3 (complement receptor
3), is over-expressed under IL4/IL13 and has been implicated in the clearance of opsonized apoptotic
cells by iC3b. This process is inefficient when phagocytosis is performed with heat-inactivated serum
(35), as it was the case in our study. Data presented here indicate that ALOX15 (Arachidonate 15-
lipoxygenase) is specific to M(IL4+IL13) macrophages. This protein was significantly upregulated
under 3% O2 (Figure 7A & 7B). However, low oxygen exposure alone is insufficient to induce its
expression, as no expression was found in M(Ø) at 3% O2 (Figure 7A & 7B). This lipoxygenase is
responsible for macrophage production of lipoxin A4, a substance which has been shown to increase
efferocytosis (56). ALOX15 has also been implicated in orchestrating the clearance of apoptotic cells
by causing oxidized products of phosphatidylethalonamine to be exposed on the plasma membrane
27
of macrophages in which it is expressed. This effect increases the ability of these cells to internalize
dead cells and inhibits their capture by inflammatory monocytes (61). This over-expression of
ALOX15 was associated with a significant increase in efferocytic activity in macrophages polarized by
IL4/IL13 under low environmental oxygen (Figure 7D). This result reveals that a key function like the
clearance of apoptotic cells is strongly related to both macrophage polarization and the surrounding
physical microenvironment.
These results illustrate the importance of deciphering how the tissue context influences macrophage
phenotype, not just based on secreted biochemical signals. Our proteomic approach revealed the
molecular signatures of a number of polarizations, and the effect of oxygen modulation on these
signatures. The signatures themselves revealed a large number of proteins involved in efferocytosis,
and indicated how expression of these proteins is modulated by oxygen. This approach opens the
way for the exploration of other environmental parameters as modulators of macrophage function
and how these signals could be used to target these cells for therapeutic ends.
Footnotes
AM is supported by the Ligue contre le Cancer and by the ATIP/Avenir Young Group Leader Program
(Inserm Project number R15098CS). GP was supported by Inserm (ATIP/Avenir Program). All MS
proteomics data were deposited on the ProteomeXchange Consortium website
(http://proteomecentral.proteomexchange.org) via the PRIDE partner repository, data set identifier:
PXD006354. Annotated spectra for identification of individual peptides are provided as supplemental
data. We thank Maighread Gallagher-Gambarelli for editing services. We thank Pascale Tacnet-
Delorme for technical assistance and Philippe Frachet for discussion.
28
Author contributions
AM designed and supervised the research; MC, GP, MEA, AM performed the experiments; MC and
AM analyzed the data; AM wrote the paper.
References
1. Okabe, Y., and Medzhitov, R. (2016) Tissue biology perspective on macrophages. Nat. Immunol.17, 9–17
2. Wynn, T. A., Chawla, A., and Pollard, J. W. (2013) Macrophage biology in development,homeostasis and disease. Nature 496, 445–455
3. Sica, A., and Mantovani, A. (2012) Macrophage plasticity and polarization: in vivo veritas. J. Clin.Invest. 122, 787–795
4. Murray, P. J. (2017) Macrophage Polarization. Annu. Rev. Physiol. 79, 541–566
5. Stein, M., Keshav, S., Harris, N., and Gordon, S. (1992) Interleukin 4 potently enhances murinemacrophage mannose receptor activity: a marker of alternative immunologic macrophageactivation. J. Exp. Med. 176, 287–292
6. Martinez, F. O., and Gordon, S. (2014) The M1 and M2 paradigm of macrophage activation:time for reassessment. F1000prime Rep. 6, 13
7. Sironi, M., Martinez, F. O., D’Ambrosio, D., Gattorno, M., Polentarutti, N., Locati, M., Gregorio,A., Iellem, A., Cassatella, M. A., Van Damme, J., Sozzani, S., Martini, A., Sinigaglia, F., Vecchi, A.,and Mantovani, A. (2006) Differential regulation of chemokine production by Fcgammareceptor engagement in human monocytes: association of CCL1 with a distinct form of M2monocyte activation (M2b, Type 2). J. Leukoc. Biol. 80, 342–349
8. Chinetti-Gbaguidi, G., and Staels, B. (2011) Macrophage polarization in metabolic disorders:functions and regulation. Curr. Opin. Lipidol. 22, 365–372
9. Chow, A., Brown, B. D., and Merad, M. (2011) Studying the mononuclear phagocyte system inthe molecular age. Nat. Rev. Immunol. 11, 788–798
10. Mosser, D. M., and Edwards, J. P. (2008) Exploring the full spectrum of macrophage activation.Nat. Rev. Immunol. 8, 958–969
11. Murray, P. J., and Wynn, T. A. (2011) Protective and pathogenic functions of macrophagesubsets. Nat. Rev. Immunol. 11, 723–737
12. Ginhoux, F., Schultze, J. L., Murray, P. J., Ochando, J., and Biswas, S. K. (2015) New insights intothe multidimensional concept of macrophage ontogeny, activation and function. Nat. Immunol.17, 34–40
29
13. Xue, J., Schmidt, S. V., Sander, J., Draffehn, A., Krebs, W., Quester, I., De Nardo, D., Gohel, T. D.,Emde, M., Schmidleithner, L., Ganesan, H., Nino-Castro, A., Mallmann, M. R., Labzin, L., Theis,H., Kraut, M., Beyer, M., Latz, E., Freeman, T. C., Ulas, T., and Schultze, J. L. (2014)Transcriptome-based network analysis reveals a spectrum model of human macrophageactivation. Immunity 40, 274–288
14. Csete, M. (2005) Oxygen in the cultivation of stem cells. Ann. N. Y. Acad. Sci. 1049, 1–8
15. Johansson, A., Lundborg, M., Sköld, C. M., Lundahl, J., Tornling, G., Eklund, A., and Camner, P.(1997) Functional, morphological, and phenotypical differences between rat alveolar andinterstitial macrophages. Am. J. Respir. Cell Mol. Biol. 16, 582–588
16. Pfau, J. C., Schneider, J. C., Archer, A. J., Sentissi, J., Leyva, F. J., and Cramton, J. (2004)Environmental oxygen tension affects phenotype in cultured bone marrow-derivedmacrophages. Am. J. Physiol. Lung Cell. Mol. Physiol. 286, L354–362
17. Grodzki, A. C. G., Giulivi, C., and Lein, P. J. (2013) Oxygen tension modulates differentiation andprimary macrophage functions in the human monocytic THP-1 cell line. PloS One 8, e54926
18. Elliott, M. R., and Ravichandran, K. S. (2016) The Dynamics of Apoptotic Cell Clearance. Dev. Cell38, 147–160
19. Murray, P. J., Allen, J. E., Biswas, S. K., Fisher, E. A., Gilroy, D. W., Goerdt, S., Gordon, S.,Hamilton, J. A., Ivashkiv, L. B., Lawrence, T., Locati, M., Mantovani, A., Martinez, F. O., Mege, J.-L., Mosser, D. M., Natoli, G., Saeij, J. P., Schultze, J. L., Shirey, K. A., Sica, A., Suttles, J., Udalova,I., van Ginderachter, J. A., Vogel, S. N., and Wynn, T. A. (2014) Macrophage activation andpolarization: nomenclature and experimental guidelines. Immunity 41, 14–20
20. Kraut, A., Marcellin, M., Adrait, A., Kuhn, L., Louwagie, M., Kieffer-Jaquinod, S., Lebert, D.,Masselon, C. D., Dupuis, A., Bruley, C., Jaquinod, M., Garin, J., and Gallagher-Gambarelli, M.(2009) Peptide storage: are you getting the best return on your investment? Defining optimalstorage conditions for proteomics samples. J. Proteome Res. 8, 3778–3785
21. Cox, J., Neuhauser, N., Michalski, A., Scheltema, R. A., Olsen, J. V., and Mann, M. (2011)Andromeda: a peptide search engine integrated into the MaxQuant environment. J. ProteomeRes. 10, 1794–1805
22. Cox, J., Hein, M. Y., Luber, C. A., Paron, I., Nagaraj, N., and Mann, M. (2014) Accurate proteome-wide label-free quantification by delayed normalization and maximal peptide ratio extraction,termed MaxLFQ. Mol. Cell. Proteomics MCP 13, 2513–2526
23. Pathan, M., Keerthikumar, S., Ang, C.-S., Gangoda, L., Quek, C. Y. J., Williamson, N. A.,Mouradov, D., Sieber, O. M., Simpson, R. J., Salim, A., Bacic, A., Hill, A. F., Stroud, D. A., Ryan, M.T., Agbinya, J. I., Mariadason, J. M., Burgess, A. W., and Mathivanan, S. (2015) FunRich: An openaccess standalone functional enrichment and interaction network analysis tool. Proteomics 15,2597–2601
24. Huang, D. W., Sherman, B. T., and Lempicki, R. A. (2009) Systematic and integrative analysis oflarge gene lists using DAVID bioinformatics resources. Nat. Protoc. 4, 44–57
30
25. Vogel, D. Y. S., Glim, J. E., Stavenuiter, A. W. D., Breur, M., Heijnen, P., Amor, S., Dijkstra, C. D.,and Beelen, R. H. J. (2014) Human macrophage polarization in vitro: maturation and activationmethods compared. Immunobiology 219, 695–703
26. Wuest, S. J. A., Crucet, M., Gemperle, C., Loretz, C., and Hersberger, M. (2012) Expression andregulation of 12/15-lipoxygenases in human primary macrophages. Atherosclerosis 225, 121–127
27. Lee, C.-U., Song, E.-K., Yoo, C.-H., Kwak, Y.-K., and Han, M.-K. (2012) Lipopolysaccharide inducesCD38 expression and solubilization in J774 macrophage cells. Mol. Cells 34, 573–576
28. O’Shea, J. J., Gadina, M., and Schreiber, R. D. (2002) Cytokine signaling in 2002: new surprises inthe Jak/Stat pathway. Cell 109 Suppl, S121–131
29. Lehtonen, A., Matikainen, S., and Julkunen, I. (1997) Interferons up-regulate STAT1, STAT2, andIRF family transcription factor gene expression in human peripheral blood mononuclear cellsand macrophages. J. Immunol. Baltim. Md 1950 159, 794–803
30. Platanias, L. C. (2005) Mechanisms of type-I- and type-II-interferon-mediated signalling. Nat.Rev. Immunol. 5, 375–386
31. Newsholme, P., Curi, R., Gordon, S., and Newsholme, E. A. (1986) Metabolism of glucose,glutamine, long-chain fatty acids and ketone bodies by murine macrophages. Biochem. J. 239,121–125
32. Kelly, B., and O’Neill, L. A. J. (2015) Metabolic reprogramming in macrophages and dendriticcells in innate immunity. Cell Res. 25, 771–784
33. Zanoni, I., Ostuni, R., Marek, L. R., Barresi, S., Barbalat, R., Barton, G. M., Granucci, F., andKagan, J. C. (2011) CD14 controls the LPS-induced endocytosis of Toll-like receptor 4. Cell 147,868–880
34. Abrial, C., Grassin-Delyle, S., Salvator, H., Brollo, M., Naline, E., and Devillier, P. (2015) 15-Lipoxygenases regulate the production of chemokines in human lung macrophages. Br. J.Pharmacol. 172, 4319–4330
35. Mevorach, D., Mascarenhas, J. O., Gershov, D., and Elkon, K. B. (1998) Complement-dependentclearance of apoptotic cells by human macrophages. J. Exp. Med. 188, 2313–2320
36. Zizzo, G., Hilliard, B. A., Monestier, M., and Cohen, P. L. (2012) Efficient clearance of earlyapoptotic cells by human macrophages requires M2c polarization and MerTK induction. J.Immunol. Baltim. Md 1950 189, 3508–3520
37. Martinez, F. O., Gordon, S., Locati, M., and Mantovani, A. (2006) Transcriptional profiling of thehuman monocyte-to-macrophage differentiation and polarization: new molecules and patternsof gene expression. J. Immunol. Baltim. Md 1950 177, 7303–7311
38. Beyer, M., Mallmann, M. R., Xue, J., Staratschek-Jox, A., Vorholt, D., Krebs, W., Sommer, D.,Sander, J., Mertens, C., Nino-Castro, A., Schmidt, S. V., and Schultze, J. L. (2012) High-resolutiontranscriptome of human macrophages. PloS One 7, e45466
31
39. Martinez, F. O., Helming, L., Milde, R., Varin, A., Melgert, B. N., Draijer, C., Thomas, B., Fabbri,M., Crawshaw, A., Ho, L. P., Ten Hacken, N. H., Cobos Jiménez, V., Kootstra, N. A., Hamann, J.,Greaves, D. R., Locati, M., Mantovani, A., and Gordon, S. (2013) Genetic programs expressed inresting and IL-4 alternatively activated mouse and human macrophages: similarities anddifferences. Blood 121, e57–69
40. O’Neill, L. A. J., and Pearce, E. J. (2016) Immunometabolism governs dendritic cell andmacrophage function. J. Exp. Med. 213, 15–23
41. Wolf, A., Agnihotri, S., Micallef, J., Mukherjee, J., Sabha, N., Cairns, R., Hawkins, C., and Guha, A.(2011) Hexokinase 2 is a key mediator of aerobic glycolysis and promotes tumor growth inhuman glioblastoma multiforme. J. Exp. Med. 208, 313–326
42. Etienne, M. C., Chéradame, S., Fischel, J. L., Formento, P., Dassonville, O., Renée, N., Schneider,M., Thyss, A., Demard, F., and Milano, G. (1995) Response to fluorouracil therapy in cancerpatients: the role of tumoral dihydropyrimidine dehydrogenase activity. J. Clin. Oncol. Off. J.Am. Soc. Clin. Oncol. 13, 1663–1670
43. Janeway, C. A., Bottomly, K., Babich, J., Conrad, P., Conzen, S., Jones, B., Kaye, J., Katz, M.,McVay, L., Murphy, D. B., and Tite, J. (1984) Quantitative variation in la antigen expression playsa central role in immune regulation. Immunol. Today 5, 99–105
44. Ayala, A., Ertel, W., and Chaudry, I. H. (1996) Trauma-induced suppression of antigenpresentation and expression of major histocompatibility class II antigen complex in leukocytes.Shock Augusta Ga 5, 79–90
45. Henze, A.-T., and Mazzone, M. (2016) The impact of hypoxia on tumor-associatedmacrophages. J. Clin. Invest. 126, 3672–3679
46. Laoui, D., Van Overmeire, E., Di Conza, G., Aldeni, C., Keirsse, J., Morias, Y., Movahedi, K.,Houbracken, I., Schouppe, E., Elkrim, Y., Karroum, O., Jordan, B., Carmeliet, P., Gysemans, C., DeBaetselier, P., Mazzone, M., and Van Ginderachter, J. A. (2014) Tumor hypoxia does not drivedifferentiation of tumor-associated macrophages but rather fine-tunes the M2-like macrophagepopulation. Cancer Res. 74, 24–30
47. Conde, P., Rodriguez, M., van der Touw, W., Jimenez, A., Burns, M., Miller, J., Brahmachary, M.,Chen, H., Boros, P., Rausell-Palamos, F., Yun, T. J., Riquelme, P., Rastrojo, A., Aguado, B., Stein-Streilein, J., Tanaka, M., Zhou, L., Zhang, J., Lowary, T. L., Ginhoux, F., Park, C. G., Cheong, C.,Brody, J., Turley, S. J., Lira, S. A., Bronte, V., Gordon, S., Heeger, P. S., Merad, M., Hutchinson, J.,Chen, S.-H., and Ochando, J. (2015) DC-SIGN(+) Macrophages Control the Induction ofTransplantation Tolerance. Immunity 42, 1143–1158
48. Geijtenbeek, T. B. H., and Gringhuis, S. I. (2009) Signalling through C-type lectin receptors:shaping immune responses. Nat. Rev. Immunol. 9, 465–479
49. Tailleux, L., Pham-Thi, N., Bergeron-Lafaurie, A., Herrmann, J.-L., Charles, P., Schwartz, O.,Scheinmann, P., Lagrange, P. H., de Blic, J., Tazi, A., Gicquel, B., and Neyrolles, O. (2005) DC-SIGN Induction in Alveolar Macrophages Defines Privileged Target Host Cells for Mycobacteriain Patients with Tuberculosis. PLoS Med. 2,
50. Roszer, T., Menéndez-Gutiérrez, M. P., Lefterova, M. I., Alameda, D., Núñez, V., Lazar, M. A.,Fischer, T., and Ricote, M. (2011) Autoimmune kidney disease and impaired engulfment of
32
apoptotic cells in mice with macrophage peroxisome proliferator-activated receptor gamma or retinoid X receptor alpha deficiency. J. Immunol. Baltim. Md 1950 186, 621–631
51. Hu, Z., Zhou, Q., Zhang, C., Fan, S., Cheng, W., Zhao, Y., Shao, F., Wang, H.-W., Sui, S.-F., andChai, J. (2015) Structural and biochemical basis for induced self-propagation of NLRC4. Science350, 399–404
52. Devitt, A., and Marshall, L. J. (2011) The innate immune system and the clearance of apoptoticcells. J. Leukoc. Biol. 90, 447–457
53. Fullerton, J. N., and Gilroy, D. W. (2016) Resolution of inflammation: a new therapeutic frontier.Nat. Rev. Drug Discov. 15, 551–567
54. Devitt, A., Moffatt, O. D., Raykundalia, C., Capra, J. D., Simmons, D. L., and Gregory, C. D. (1998)Human CD14 mediates recognition and phagocytosis of apoptotic cells. Nature 392, 505–509
55. Tóth, B., Garabuczi, E., Sarang, Z., Vereb, G., Vámosi, G., Aeschlimann, D., Blaskó, B., Bécsi, B.,Erdõdi, F., Lacy-Hulbert, A., Zhang, A., Falasca, L., Birge, R. B., Balajthy, Z., Melino, G., Fésüs, L.,and Szondy, Z. (2009) Transglutaminase 2 is needed for the formation of an efficient phagocyteportal in macrophages engulfing apoptotic cells. J. Immunol. Baltim. Md 1950 182, 2084–2092
56. Godson, C., Mitchell, S., Harvey, K., Petasis, N. A., Hogg, N., and Brady, H. R. (2000) Cuttingedge: lipoxins rapidly stimulate nonphlogistic phagocytosis of apoptotic neutrophils bymonocyte-derived macrophages. J. Immunol. Baltim. Md 1950 164, 1663–1667
57. Yang, M., Liu, J., Piao, C., Shao, J., and Du, J. (2015) ICAM-1 suppresses tumor metastasis byinhibiting macrophage M2 polarization through blockade of efferocytosis. Cell Death Dis. 6,e1780
58. Takizawa, F., Tsuji, S., and Nagasawa, S. (1996) Enhancement of macrophage phagocytosis uponiC3b deposition on apoptotic cells. FEBS Lett. 397, 269–272
59. Ehrchen, J., Steinmüller, L., Barczyk, K., Tenbrock, K., Nacken, W., Eisenacher, M., Nordhues, U.,Sorg, C., Sunderkötter, C., and Roth, J. (2007) Glucocorticoids induce differentiation of aspecifically activated, anti-inflammatory subtype of human monocytes. Blood 109, 1265–1274
60. Eligini, S., Fiorelli, S., Tremoli, E., and Colli, S. (2016) Inhibition of transglutaminase 2 reducesefferocytosis in human macrophages: Role of CD14 and SR-AI receptors. Nutr. Metab.Cardiovasc. Dis. NMCD 26, 922–930
61. Uderhardt, S., Herrmann, M., Oskolkova, O. V., Aschermann, S., Bicker, W., Ipseiz, N., Sarter, K.,Frey, B., Rothe, T., Voll, R., Nimmerjahn, F., Bochkov, V. N., Schett, G., and Krönke, G. (2012)12/15-lipoxygenase orchestrates the clearance of apoptotic cells and maintains immunologictolerance. Immunity 36, 834–846
33
Table Legends
Table 1: List of specific over-expressed and under-expressed proteins for each human macrophage
polarization
Over-expressed and under-expressed proteins for each polarization obtained through the
comparison of each case to all the others are summarized in the table. Over expressed proteins are
shown in red. (GP1B# corresponds to Guanylate binding protein 1; Uniprot accession number
Q1D1D5). Under-expressed proteins for each polarization are indicated in blue.
Table 2: List of specific over-expressed and under-expressed proteins for macrophages exposed to
LPS
Over-expressed and under-expressed proteins related to the exposure to LPS were obtained after a
subtractive analysis to eliminate specific proteins of M(IFNγ+LPS) and M (IC+LPS) macrophages.
Over-expressed proteins are shown in red. Under-expressed proteins are indicated in blue.
Figure Legends
Figure 1: Analysis of the proteome of human macrophages
(A) Overall experimental workflow. (B) Rank ordered LFQ for each of the proteins identified (log10
LFQ) in the five polarizations under 18.6% O2 (C) 3D graphical representation of the results of a PCA
performed on differentially expressed proteins, first three components (ANOVA, p<0.05), for
macrophages differentiated under 18.6% or 3% O2. (D) Volcano-plots for proteins differentially
expressed between M(IL4+IL13) and M(IFNγ+LPS) under 18.6% O2. Selection criteria were FC > 2 and
p-value <0.05 (n=4 healthy donors). (E) Venn diagram for M(IL10+DXM) showing that 26 proteins are
specific for this polarization compared to all other polarizations at 18.6% O2.
34
Figure 2: STAT1 transcription factor expression increases in M(IFN +LPS) macrophages and locates
to the nucleus
(A) Expression of STAT1 determined by LFQ on mass spectrometry data (n=4 for 18.6% O2, n=3 for 3%
O2). (B) Western blot analysis of STAT1 expression in total cell lysates of macrophages cultured under
18.6% and 3% O2. 20 μg of protein was deposited in each well. Loading control was based on β-actin
levels. Results shown are representative of four independent experiments. (C) Validation and
localization of STAT1 expression using a non phosphospecific antibody in M(IFNγ+LPS) and
M(IL4+IL13) macrophages by immunofluorescence. STAT1 over-expression in the M(IFNγ+LPS)
condition is associated with a nuclear localization. Results shown are representative of three
independent experiments performed under 18.6% O2.
Figure 3: The glycolytic signature of LPS-exposed macrophages is lost under low environmental
oxygen tension.
(A) Hexokinase-2 expression levels (LFQ) in all polarizations under 18.6% and 3% O2 exposure.
Hexokinase-2 is induced in LPS-stimulated macrophages, M(IFNγ+LPS) and M(IC+LPS), compared to
non-LPS-stimulated polarizations in high oxygen conditions (§§ p < 0.01 for M(IFNγ+LPS) and ## p
<0.01 for M(IC+LPS) Tuckey’s multiple comparison test, * p<0.05 Tuckey’s multiple comparison test,
** p<0.01, ***p<0.001 Welch paired t-test). (B) Western blot analysis of Hexokinase-2 expression in
total cell lysates of macrophages cultured under 18.6% and 3% O2. 10 μg of protein was deposited in
each well. Loading control was based on β-actin levels.
Figure 4: Flow cytometry analysis of HLA-DR expression under low oxygen tension.
HLA-DR is mainly expressed at the surface of M(IL4+IL13) macrophages (## p <0.01 001Tuckey’s
multiple comparison test at 18.6% O2, §§§ p<0.001 Tuckey’s multiple comparison test at 3% O2).
Expression of this protein is downregulated in low oxygen conditions for M(IL4+IL13) macrophages
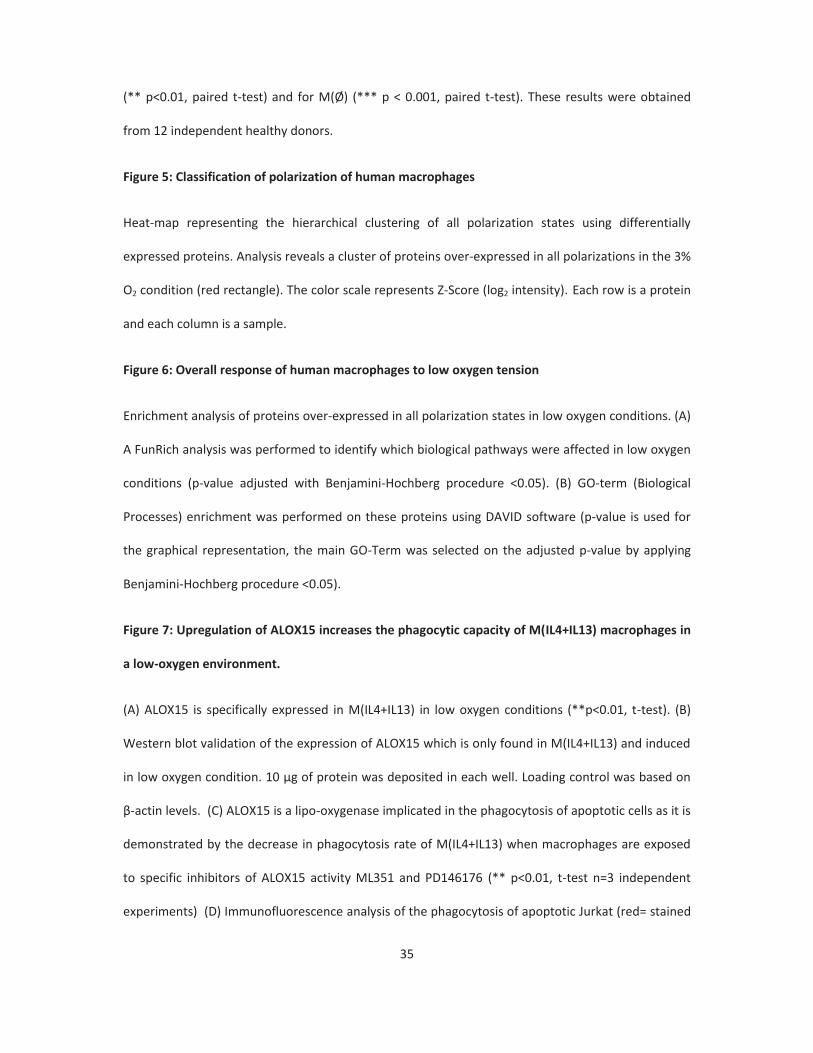
35
(** p<0.01, paired t-test) and for M(Ø) (*** p < 0.001, paired t-test). These results were obtained
from 12 independent healthy donors.
Figure 5: Classification of polarization of human macrophages
Heat-map representing the hierarchical clustering of all polarization states using differentially
expressed proteins. Analysis reveals a cluster of proteins over-expressed in all polarizations in the 3%
O2 condition (red rectangle). The color scale represents Z-Score (log2 intensity). Each row is a protein
and each column is a sample.
Figure 6: Overall response of human macrophages to low oxygen tension
Enrichment analysis of proteins over-expressed in all polarization states in low oxygen conditions. (A)
A FunRich analysis was performed to identify which biological pathways were affected in low oxygen
conditions (p-value adjusted with Benjamini-Hochberg procedure <0.05). (B) GO-term (Biological
Processes) enrichment was performed on these proteins using DAVID software (p-value is used for
the graphical representation, the main GO-Term was selected on the adjusted p-value by applying
Benjamini-Hochberg procedure <0.05).
Figure 7: Upregulation of ALOX15 increases the phagocytic capacity of M(IL4+IL13) macrophages in
a low-oxygen environment.
(A) ALOX15 is specifically expressed in M(IL4+IL13) in low oxygen conditions (**p<0.01, t-test). (B)
Western blot validation of the expression of ALOX15 which is only found in M(IL4+IL13) and induced
in low oxygen condition. 10 μg of protein was deposited in each well. Loading control was based on
β-actin levels. (C) ALOX15 is a lipo-oxygenase implicated in the phagocytosis of apoptotic cells as it is
demonstrated by the decrease in phagocytosis rate of M(IL4+IL13) when macrophages are exposed
to specific inhibitors of ALOX15 activity ML351 and PD146176 (** p<0.01, t-test n=3 independent
experiments) (D) Immunofluorescence analysis of the phagocytosis of apoptotic Jurkat (red= stained
36
by TAMRA) by human macrophages (blue=Hoescht staining of nucleus, green=phalloidin-Alexa488).
Scale bar corresponds to 50 μm. Quantification of phagocytosis (### p < 0.001 for comparison
between M(IL10+DXM) and all other polarizations at 18.6% O2; * p<0.05,**p<0.01, paired t-test n=3
independent experiments).
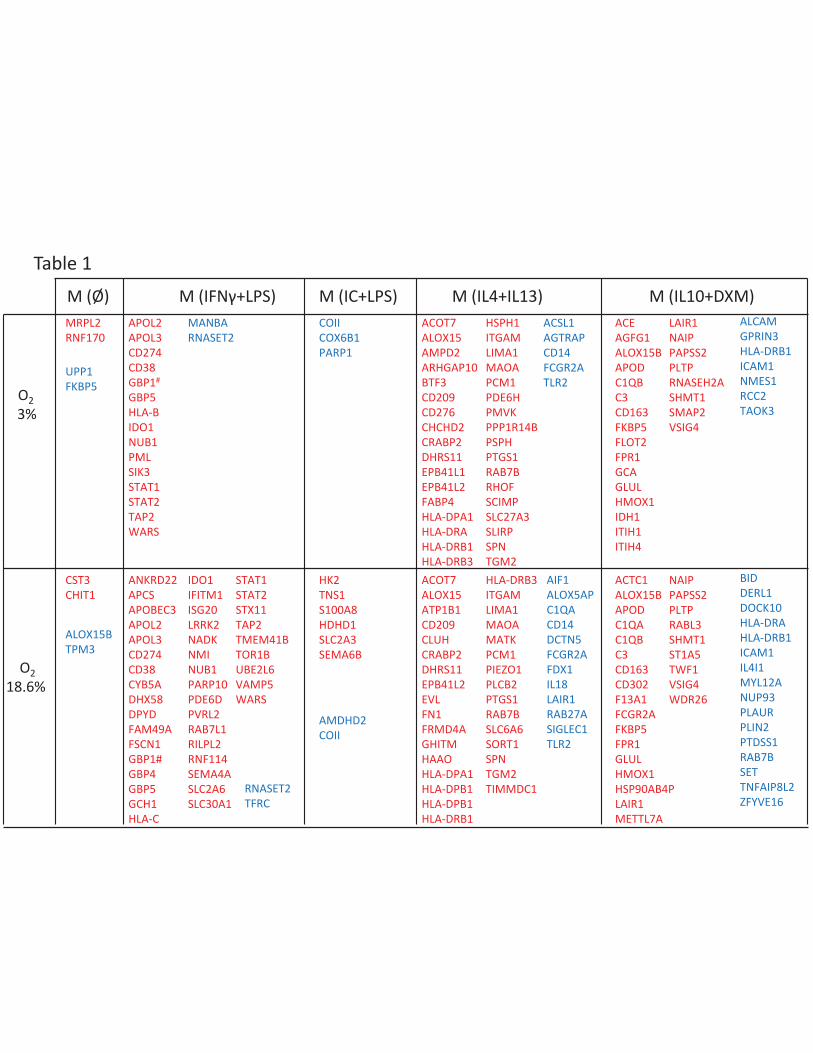
Table 1M (Ø) M (IFNγ+LPS) M (IC+LPS) M (IL4+IL13) M (IL10+DXM)
O218.6%
O2 3%
ANKRD22 APCSAPOBEC3APOL2APOL3 CD274CD38 CYB5A DHX58 DPYD FAM49A FSCN1 GBP1# GBP4 GBP5 GCH1 HLA-C
APOL2APOL3 CD274CD38 GBP1#
GBP5 HLA-BIDO1NUB1PMLSIK3STAT1STAT2TAP2WARS
STAT1STAT2STX11 TAP2TMEM41B TOR1B UBE2L6 VAMP5WARS
MRPL2RNF170
CST3CHIT1
HK2TNS1 S100A8 HDHD1 SLC2A3 SEMA6B
ACOT7 ALOX15 AMPD2 ARHGAP10 BTF3 CD209 CD276CHCHD2CRABP2 DHRS11 EPB41L1 EPB41L2 FABP4HLA-DPA1HLA-DRAHLA-DRB1 HLA-DRB3ACOT7 ALOX15 ATP1B1 CD209 CLUH CRABP2 DHRS11 EPB41L2 EVL FN1 FRMD4A GHITMHAAO HLA-DPA1 HLA-DPB1HLA-DPB1 HLA-DRB1
ACE AGFG1 ALOX15B APOD C1QB C3CD163 FKBP5 FLOT2 FPR1 GCA GLUL HMOX1 IDH1ITIH1 ITIH4
ACTC1ALOX15B APOD C1QA C1QB C3CD163 CD302 F13A1FCGR2A FKBP5 FPR1 GLUL HMOX1 HSP90AB4P LAIR1 METTL7A
HSPH1 ITGAM LIMA1 MAOA PCM1 PDE6H PMVK PPP1R14B PSPHPTGS1 RAB7B RHOF SCIMP SLC27A3SLIRP SPN TGM2 HLA-DRB3ITGAM LIMA1 MAOA MATKPCM1 PIEZO1 PLCB2 PTGS1 RAB7B SLC6A6 SORT1 SPN TGM2 TIMMDC1
IDO1IFITM1ISG20 LRRK2 NADK NMINUB1PARP10 PDE6D PVRL2RAB7L1RILPL2 RNF114SEMA4ASLC2A6 SLC30A1
LAIR1 NAIP PAPSS2PLTPRNASEH2A SHMT1 SMAP2 VSIG4
NAIP PAPSS2PLTPRABL3 SHMT1 ST1A5TWF1 VSIG4WDR26
UPP1FKBP5
ALOX15BTPM3
MANBARNASET2
RNASET2TFRC
COIICOX6B1PARP1
AMDHD2COII
ACSL1AGTRAPCD14 FCGR2ATLR2
AIF1 ALOX5AP C1QA CD14 DCTN5 FCGR2AFDX1 IL18 LAIR1 RAB27A SIGLEC1TLR2
ALCAM GPRIN3 HLA-DRB1ICAM1 NMES1 RCC2 TAOK3
BID DERL1 DOCK10 HLA-DRA HLA-DRB1ICAM1 IL4I1MYL12ANUP93 PLAUR PLIN2 PTDSS1 RAB7B SETTNFAIP8L2 ZFYVE16
Table 2M (IFNγ +LPS) and M(IC+LPS)
O218.6%
O2 3%
ALAS1CD48CD82CKBCLIC4CMPK2DDX58DOCK4EIF2AK2FMNL2GBP2GRAMD1AHLA-A hsOAS3ICAM1IFIT1IFIT2
ADAAKR1B1ALAS1AMPD3CD40CD48CD82CLIC4CMPK2DDX58DTX3LEIF2AK2GBP2GRAMD1AHLA-AHLA-C
hsOAS3ICAM1IFIT1IFIT2IFIT3IL18IL4I1ISG15ISG20ITGALKYNULYNMARCKSMX1MX2MYH11
NCF1NFKB1NFKB2NMES1NR3C1OAS2PARP9PILRAPLAURPLSCR1PSTPIP2PTAFRRDXRIPK2RNF213SAMD9
SERPINB9SOD2STAT3TAP1TAPBPTNFAIP2TNFAIP8TOM1TRG14TRIP10
IFIT3IFIT5IL18IL4I1ISG15ISG20ITGALKYNULYNMARCKSMX1MX2MYH11NCF1NFKB2NMES1NR3C1
NT5C3OAS1OAS2PILRAPLAURPLSCR1PSTPIP2PTAFRRELBRILPL2RNF213SAMD9SAMD9LSERPINB9SOD2SRXN1TAP1
TAPBPTNFAIP2TRG14TRIP10TXNZNRF2
DAB2FEX1 GATMGLG1GUSBHMOX1LIPALRPAP1METTL7AMRC1SDCBP
ACEDAB2LIPAMRC1PPT1
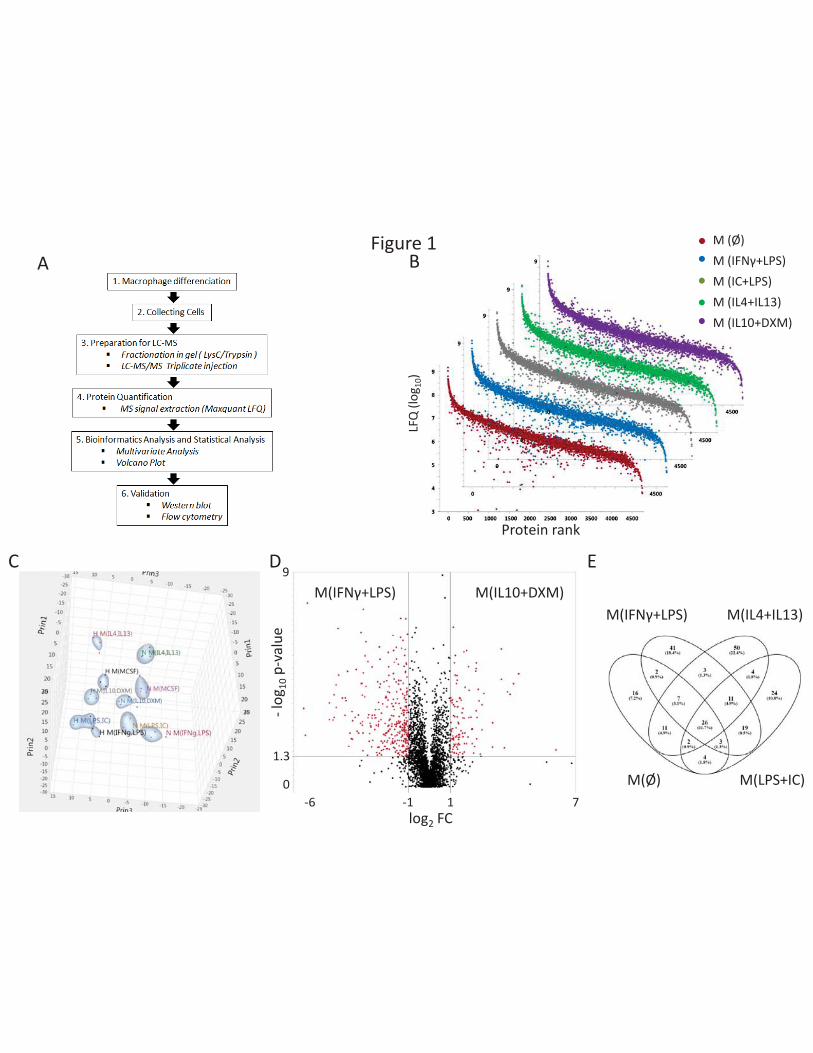
Figure 1A B
M (Ø)
Protein rank
LFQ
(log
10)
M (IFNγ+LPS)M (IC+LPS)M (IL4+IL13)M (IL10+DXM)
C DM(IL10+DXM)M(IFNγ+LPS)
E
M(IFNγ+LPS) M(IL4+IL13)
M(Ø) M(LPS+IC)
log2 FC
-log
10p-
valu
e
1-1 7-60
1.3
9
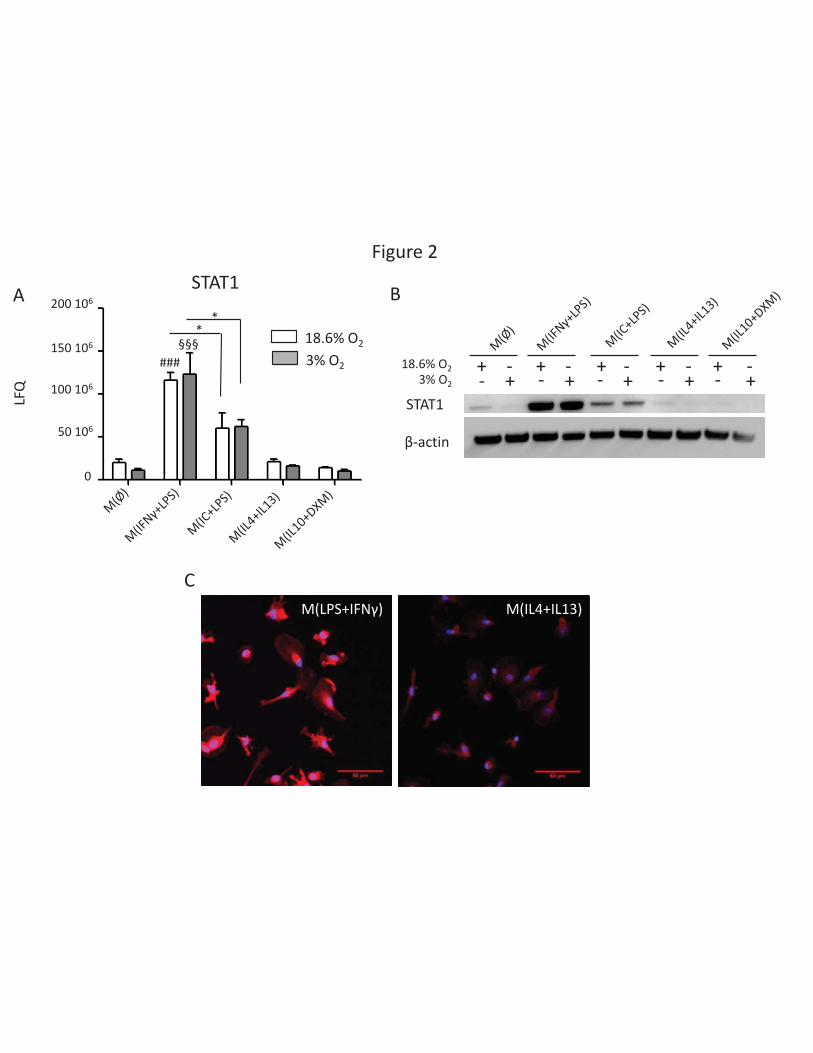
Figure 2
A B
CM(LPS+IFNγ) M(IL4+IL13)
LFQ
STAT1
18.6% O2
3% O2
**
###§§§
200 106
150 106
100 106
50 106
0
STAT13% O2
18.6% O2
-+ + + + +
+++++-
--
--
--
--
β-actin
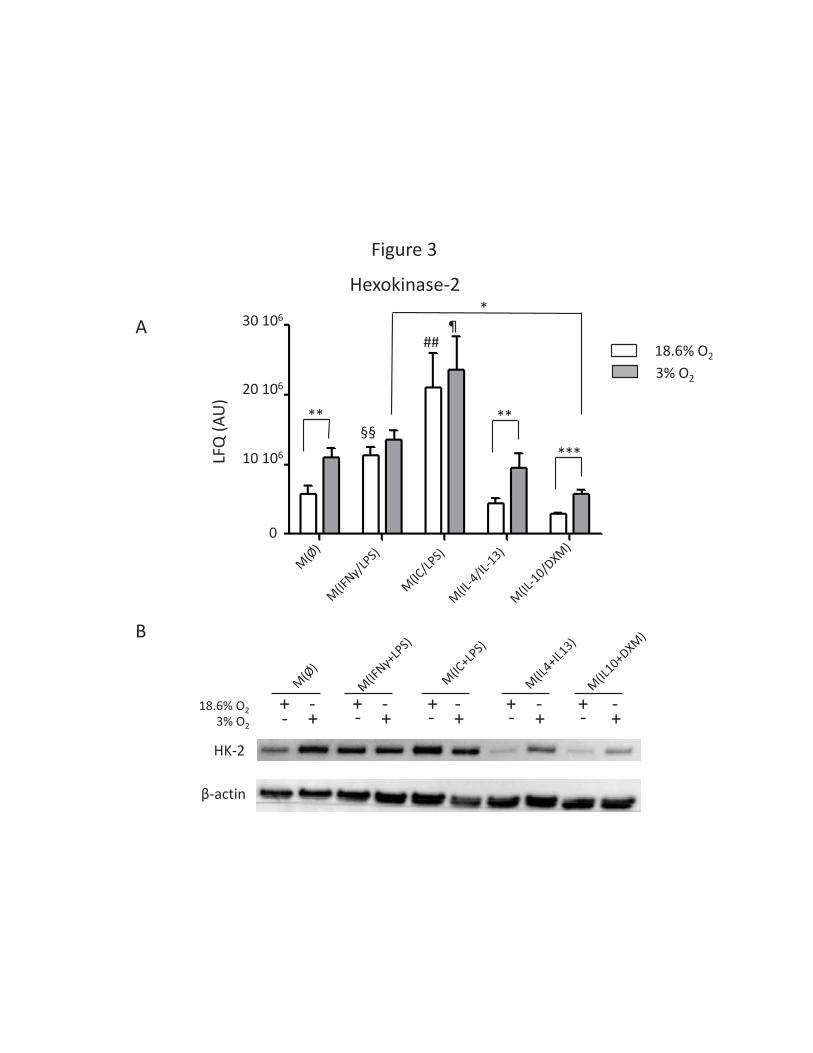
Figure 3
Hexokinase-2
##
** **
***§§
30 106
20 106
10 106
0
LFQ
(AU)
18.6% O2
3% O2
*¶
3% O2
18.6% O2 -+ + + + +
+++++-
--
--
--
--
HK-2
β-actin
A
B
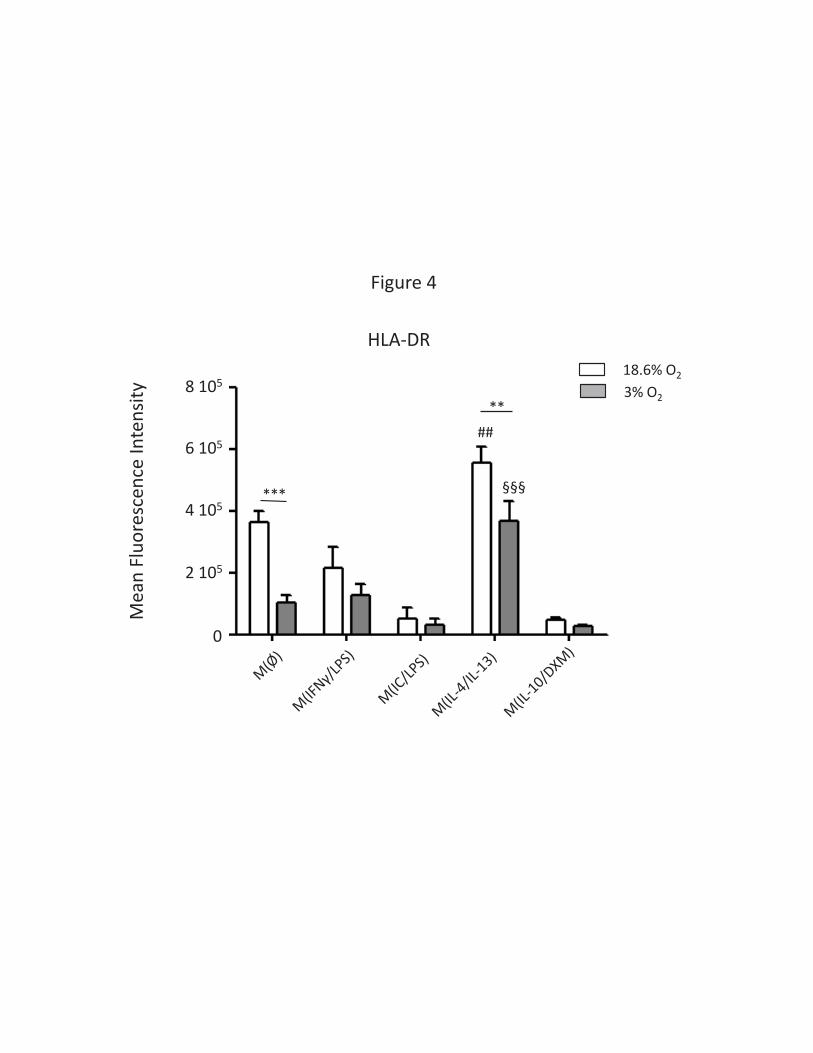
Figure 4
§§§
##
***
**
HLA-DR
Mea
nFl
uore
scen
ce In
tens
ity 8 105
6 105
4 105
2 105
0
18.6% O2
3% O2
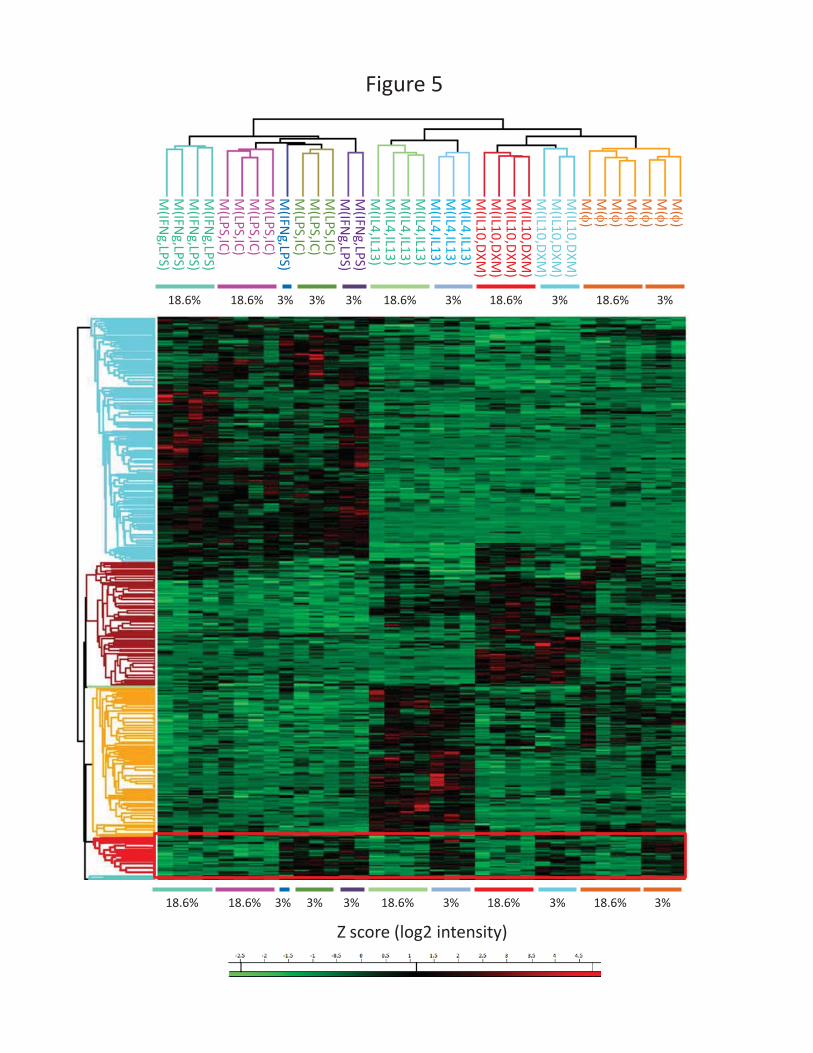
Figure 5
M(IFNg,LPS)
M(IFNg,LPS)
M(IFNg,LPS)
M(IFNg,LPS)
18.6% 18.6% 3% 3% 3% 18.6% 3% 18.6% 18.6%3% 3%
M(LPS,IC)
M(LPS,IC)
M(LPS,IC)
M(LPS,IC)
M(IFNg,LPS)
M(LPS,IC)
M(LPS,IC)
M(LPS,IC)
M(IFNg,LPS)
M(IFNg,LPS)
M(IL4,IL13)
M(IL4,IL13)
M(IL4,IL13)
M(IL4,IL13)
M(IL4,IL13)
M(IL4,IL13)
M(IL4,IL13)
M(IL10,DXM
)
M(IL10,DXM
)M
(IL10,DXM)
M(IL10,DXM
)M
(IL10,DXM)
M(IL10,DXM
)M
(IL10,DXM)
M(
)M
()
M(
)M
()
M(
)M
()
M(
)
Z score (log2 intensity)
18.6% 18.6% 3% 3% 3% 18.6% 3% 18.6% 18.6%3% 3%
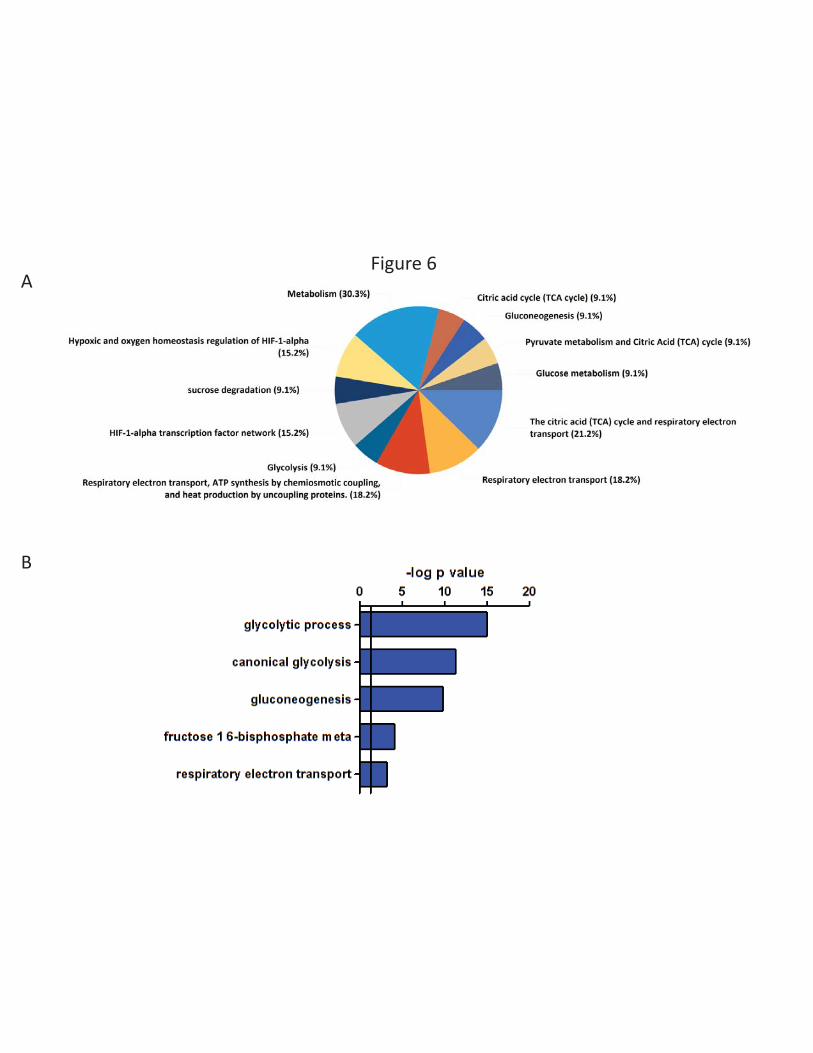
Figure 6A
B
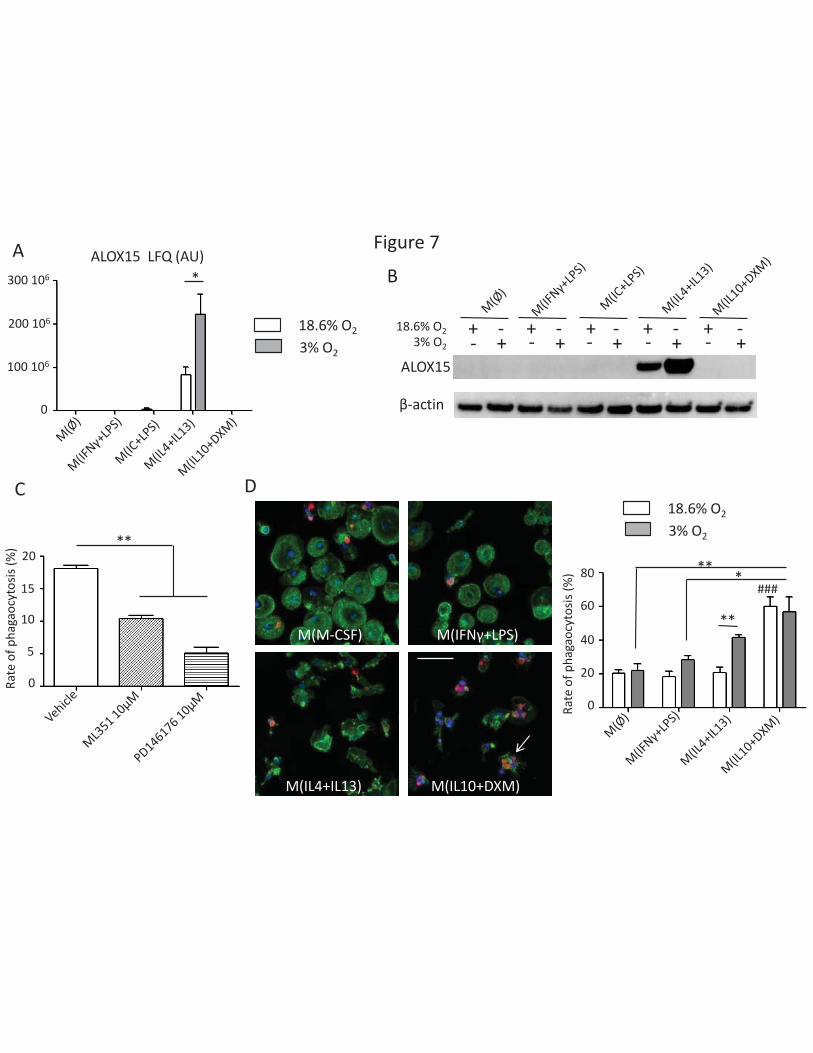
Figure 7
M(IFNγ+LPS)M(M-CSF)
M(IL4+IL13)
D
A
**
ALOX15 LFQ (AU)
18.6% O2
3% O2
300 106 *
200 106
100 106
0
0
20
40
60
80Ra
te o
f pha
gaoc
ytos
is(%
)###
** *
M(IL10+DXM)
ALOX153% O2
18.6% O2
-+ + + + +
+++++- - - - - - - - -
β-actin
C
**
Rate
of p
haga
ocyt
osis
(%)
0
5
10
15
20
B
18.6% O2
3% O2