proteomic indicators of oxidation and hydration state in ...€¦ · cancer-associated proteins are...
TRANSCRIPT
Proteomic indicators of oxidation andhydration state in colorectal cancerJeffrey M. Dick∗1
1Language Institute, Chiang Mai University, Chiang Mai, Thailand
ABSTRACT
New integrative approaches are needed to harness the potential of rapidly growingdata sets of gene and protein expression and microbial taxonomic identification incolorectal cancer (CRC). Using reported data from human proteomic and microbialtaxonomic studies, this study compares the average oxidation state of carbon (ZC)and water demand per residue (nH2O) of proteins from tumors to those in healthytissues or less advanced cancer stages. The major compositional trends are lowerZC and, to a lesser extent, higher nH2O, in tumor vs normal groups, or carcinomavs adenoma groups. Comparison of microbial protein compositions shows a smallshift toward lower ZC in bacteria enriched in fecal samples from cancer patients.Thermodynamic calculations of the relative chemical stabilities of proteins show thatthe cancer-related proteins tend to be stabilized by higher chemical activity of H2O(more hydrating) and/or lower fugacity of O2 (more reducing). The compositionalexploration of molecular data suggests that a systematic chemical transformation isa central aspect of the cancer proteome. The thermodynamic calculations highlightthe potential for interpreting proteomic data within a biochemical context, and maycontribute to a better understanding of the microenvironmental requirements for cancerinitiation and progression.
Keywords: colorectal cancer, proteomics, gut microbiome; redox potential; chemicalthermodynamics
1 INTRODUCTIONColorectal cancer (CRC) is one of the most common and well-studied human cancers,and is a model for the prevailing theory of genetic transformation as the primary driverof cancer progression (Kinzler and Vogelstein, 1996). Differential gene expression andproteomic data sets are now available to characterize numerous specific experimentaland clinical situations. Recently, many studies have generated proteomic data forcandidate biomarkers for early detection of colorectal cancer with a focus on themembrane fractions (Chen et al., 2010; Kume et al., 2014; Sethi et al., 2015), whileothers have focused on subcellular responses (e.g. chromatin; Knol et al., 2014) orstage-specific effects (Uzozie et al., 2014; Sethi et al., 2015). Likewise, microbialassociations with CRC are increasingly well characterized using 16S rRNA andmetagenomic data (Wang et al., 2012; Zeller et al., 2014; Candela et al., 2014).
.CC-BY 4.0 International licensecertified by peer review) is the author/funder. It is made available under aThe copyright holder for this preprint (which was notthis version posted January 4, 2016. . https://doi.org/10.1101/035857doi: bioRxiv preprint
The broad issue that motivates this study is how can molecular data be used tounderstand biological processes underlying oncogenesis? Many approaches have beenutilized in the interpretation of gene- and protein-expression data; e.g. heat maps andcluster algorithms (such as principal-components analysis or PCA), network analysisintegrated with large-scale protein and gene interaction networks, and functionalclassification using the Gene Ontology (GO) or other sources of functional information.These techniques often have as goals the identification of significantly altered genes orproteins for further interrogation as biomarkers, or functional annotations that informconceptual and mathematical models of molecular interactions. Nevertheless, despitethe widespread use of bioinformatic tools, there is growing concern that the fullpotential of the vast molecular data sets has not been realized (e.g. Keating andCambrosio, 2012).
Compared to interpretations focused on molecular interactions and mechanisms ofgene regulation, high-level descriptions and analysis of molecular data have otherbenefits. For example, the information-theoretic concept of maximum entropy has beenused to identify gene expression signatures in carcinogenesis (Zadran et al., 2013).Notably, the information-theoretic based maximum entropy calculations are analogousto thermodynamic equilibrium; these calculations are performed without explicitaccounting for the underlying biomolecular interactions, but still allow forquantification of a potential energy “attractor space”, or stable or steady state of thesystem. However, information-theoretic models are limited in their assessment ofenvironmental influences such as oxidation and hydration potential. Theoreticalcalculations of the relative stabilities of populations of proteins in an environmentalcontext are possible in a chemical thermodynamic framework. This study proposes anapplication of the concept of chemical affinity as a measure of stability (i.e. propensityfor formation) which is grounded in energetic calculations that account for differencesin amino acid composition (Dick et al., 2006; LaRowe and Dick, 2012). The chemicalthermodynamic descriptions have the advantage of being expressed in terms ofvariables that can be compared with independent biochemical measurements.
One of the characteristic features of tumors is varying degrees of hypoxia (Hockeland Vaupel, 2001). The sensitivity of tumors to oxygen is exploited by hyperbaricoxygen treatment to enhance the effects of radiotherapy (Bertout et al., 2008). Hypoxicconditions also promote the subcellular (mitochondrial) generation of reactive oxygenspecies (ROS) (Murphy, 2009). In addition to the molecular responses associated withhypoxia, cancer cells and tissues exhibit changes in oxidation-reduction (redox) state.Redox potential (Eh) monitored in vivo in a fibrosarcoma cell line is altered compared tonormal fibroblasts (Hutter et al., 1997), and it has been suggested that cancer cells havesuppressed ranges of redox oscillations during the cell cycle (Hoffman et al., 2008).
The hydration state of cancer cells and tissues may also vary considerably from theirnormal counterparts. Microwave detection of differences in dielectric constant resultingfrom greater water content in malignant tissue is being explored for medical imaging ofbreast cancer (Lazebnik et al., 2007; Grzegorczyk et al., 2012). IR and Ramanspectroscopic techniques also provide evidence for a greater hydration state ofcancerous breast tissue, resulting from interaction of water molecules with hydrophiliccellular structures of cancer cells but negligible association with the hydrophobicmolecules (triglycerides, fatty acid derivatives) more common in normal cells
2/30
.CC-BY 4.0 International licensecertified by peer review) is the author/funder. It is made available under aThe copyright holder for this preprint (which was notthis version posted January 4, 2016. . https://doi.org/10.1101/035857doi: bioRxiv preprint

(Abramczyk et al., 2014). Increased hydration levels may also be associated withincreased hyaluronan in the extracellular matrix (ECM) of migrating and metastaticcells (Toole, 2002).
Besides these specific responses associated with oxidation and hydration state, otherconsiderations point to a general importance of oxidation and hydration state formetabolic, cellular and physiological processes. For example, the differential reactionsand transport of lactate and pyruvate are tightly interlinked with carbon oxidation statein metabolic pathways (Brooks, 2009), and have implications for cancer metabolism(Semenza, 2008). It has been hypothesized that the increased hydration of cancer cellsunderlies a reversion to a more embryonic state (McIntyre, 2006). Therefore, these twovariables – redox and hydration potential – have been selected as the focus of thedescriptions and explorations in this study.
The compositional and thermodynamic relationships are described in the Methods.Because reaction coefficients on O2 and H2O are to some extent interdependent, anappropriate choice of basis species is needed in order to separate the effects of thevariables. The first part of the Results shows the comparisons for human and microbialproteins (Sections 3.1–3.2) using molecular data taken from the proteomic studies citedin the first paragraph above, as well as from one gene-expression study (Hlubek et al.,2007). There is a major decrease in the average oxidation state of carbon inchromatin-binding proteins in carcinoma and in proteins in some membrane fractions oftumor samples (data from Knol et al., 2014; Chen et al., 2010; Kume et al., 2014), andan increase in the water demand of proteins in precancerous adenomas (Uzozie et al.,2014), and other membrane fractions (Sethi et al., 2015). The protein compositions ofbacteria that are more abundant in cancer-derived samples are also generally shiftedtoward lower oxidation state of carbon. These systematic patterns in the chemicalcompositions of proteins are aligned with the physiological hypoxic and hydratedconditions of many cancer cells.
To better understand the biochemical limits of these changes, the second part of theResults turns to a thermodynamic description in terms of intensive chemical variables.By using a chemical affinity (negative Gibbs energy) calculation, a chemicalthermodynamic prediction of the most stable molecules (akin to a potential “attractorspace”) can be generated (Sections 3.3–3.5). The stability fields of thecancer-associated proteins are found more often at lower oxygen fugacity and/or higherwater activity. The transitions between stability regions of cancer and healthy-relatedproteins in terms of oxidation and hydration potential vary among data sets, suggestingthat specific cell-biological and physiological effects can be identified.
Not only multistep genetic changes, but microenvironmental dynamics areinterrelated determinants of cancer progression (Schedin and Elias, 2004). Here,biochemical patterns in proteomic data sets were explored using descriptions groundedin chemical thermodynamics. Mapping the independently calculated chemicalstabilities allows for a step forward from a purely compositional description, andcontributes toward understanding the subcellular and microenvironmental chemicalconditions that are required for cancer progression.
3/30
.CC-BY 4.0 International licensecertified by peer review) is the author/funder. It is made available under aThe copyright holder for this preprint (which was notthis version posted January 4, 2016. . https://doi.org/10.1101/035857doi: bioRxiv preprint

2 METHODS2.1 Data sourcesThis section briefly describes the data sources: literature reference, cell or tissue type,experimental conditions, analytical methods (e.g. proteomic analysis using label-freeMS or iTRAQ label techniques), statistical analysis of highly differentially abundantproteins in the samples, and additional data selection steps applied in this study. Theheading of each subsection is used in the tables and plot titles to identify the differentdata sets; the words separated by a slash refer to the proteins with higher differentialexpression in “cancer” (or more advanced cancer stage) / “control” (healthy or lessadvanced cancer stage) groups.
Names or IDs of genes or proteins given in the papers were searched in UniProt, andcorresponding UniProt accessions are provided in the Supporting Information. Aminoacid sequences of human proteins were taken from the UniProt reference proteome (fileUP000005640 9606.fasta.gz, dated 2015-04-29, downloaded from ftp.uniprot.org on2015-05-20). Entire sequences were used; i.e., signal and propeptides were not removedwhen calculating the amino acid compositions.
2.1.1 Chromatin-binding in carcinoma/adenomaIn the study of Knol et al. (2014), a combined laboratory/bioinformatic approach wasused to identify chromatin-bound (CB) proteins in colon adenomas and carcinomas.Differential biochemical extraction was used to isolate the chromatin-binding fraction,which was then analyzed using mass spectrometry (LC-MS/MS) for proteinidentification and label-free quantification. Sequences were compared with sevendifferent databases to assign gene annotations. Differentially abundant proteins wereidentified using beta-binomial statistics (significance threshold 0.05); of these,sequences having three or more database hits to a nuclear annotation were kept in thefinal list. Of the 169 proteins listed by Knol et al. (2014), the 27 found only inadenomas, and the 26 found only in carcinomas, are used here for comparison (see fileKWA+14.csv in the Supporting Information).
2.1.2 Membrane fraction tumor/normalIn the study of Chen et al. (2010), solvent extraction and gel-assisted digestion wereused to prepare proteins from the membrane fraction of samples of eight tumor tissuesfrom CRC patients and eight matched normal tissues. Based on proteomic analysisusing iTRAQ LC-MS/MS, 42 proteins exhibited at least two-fold differential expression(34 upregulated in tumor samples, 8 down-regulated) at a 95% confidence level(Student’s t-test p < 0.05). Data including UniProt accessions of these proteins weretaken from Supplementary Table S2 of Chen et al. (2010) and stored in fileCCF+10.csv in the Supporting Information (this study).
2.1.3 Membrane fraction tumor/polypKume et al. (2014) used phase-transfer surfactant (PTS) to extract proteins from themembrane fractions of six matched tissue samples of polyps and cancer with or withoutmetastasis. iTRAQ labeling and LC-MS/MS were used for proteomic analysis andinitial assessment of expression level differences, and SRM/MRM was used to betterquantify the expression levels of biomarker candidates. At an expression ratio <0.5 or
4/30
.CC-BY 4.0 International licensecertified by peer review) is the author/funder. It is made available under aThe copyright holder for this preprint (which was notthis version posted January 4, 2016. . https://doi.org/10.1101/035857doi: bioRxiv preprint

>2.0 and p-value <0.1, 66 proteins were found to increase, and 13 found to decrease,between polyps and cancer without metastasis. Data including UniProt accessions ofthese proteins were taken from Table IIIA and IIIC of Kume et al. (2014) and stored infile KMK+14.csv in the Supporting Information. Only proteins recorded as havingGO cellular components “membrane” and not “extracellular” were used in this study(45 higher in cancer / 6 higher in polyps).
2.1.4 Membrane enriched tumor/normalIn the study of Sethi et al. (2015), samples of tumor and adjacent normal tissues fromeight patients were characterized by label-free nanoLC-MS/MS of themembrane-enriched proteome. 184 proteins were differentially expressed with a foldchange > 1.5 and p-value < 0.05. Protein identifiers and fold changes were taken fromSupporting Table 2 of Sethi et al. (2015) (69 up-regulated and 115 down-regulated intumors). The identifiers were manually searched in UniProt and the correspondingaccessions stored in file STK+15.csv in the Supporting Information.
2.1.5 Epithelial cell signature adenoma/normalUzozie et al. (2014) analyzed 30 samples of colorectal adenomas and paired normalmucosa using iTRAQ labeling, OFFGEL electrophoresis and LC-MS/MS. Proteins withexpression fold changes (log2) at least +/- 0.5 and statistical significance threshold q <0.02 were then compared with protein expression in colorectal cancer cells and HCECcells (normal control). The proteins that were also quantified in cell-line experimentswere classified as “epithelial cell signature proteins” (111), with the remainder (101)interpreted as having a stromal origin. Information on the proteins, including UniProtaccessions, was taken from Table III of Uzozie et al. (2014) and stored in fileUNS+14.csv in the Supporting Information. Because some proteins have multipleUniProt accessions in the source table, the actual number of epithelial proteins here is121, with 64 higher in adenoma and 57 higher in normal tissue.
2.1.6 Stromal cell signature adenoma/normalThis is the set of non-epithelial proteins taken from Table III of Uzozie et al. (2014)(UniProt accessions: 18 higher in adenoma, 108 higher in normal tissue) and stored infile UNS+14.csv in the Supporting Information.
2.1.7 Wnt targets tumor/invasion frontHlubek et al. (2007) identified Wnt target genes that are up- and down-expressed incells in the interior and invasion front of human colon tumors. Here, proteins for the 27genes reported by Hlubek et al. (2007) to be significantly up-regulated in the interior(27) or invasion front (9) of tumors are used in the comparisons.
2.1.8 Serum biomarkers abundance up/downJimenez et al. (2010) compiled a list of candidate serum biomarkers from ameta-analysis of the literature. In the meta-analysis, both up- and down-expressedproteins were associated with some number of studies; the data set used in this study isbased on those proteins identified in at least 3 studies (up-expressed: 26 proteins;down-expressed: 19 proteins).
5/30
.CC-BY 4.0 International licensecertified by peer review) is the author/funder. It is made available under aThe copyright holder for this preprint (which was notthis version posted January 4, 2016. . https://doi.org/10.1101/035857doi: bioRxiv preprint

2.2 Average oxidation state of carbon; Basis set IFor a protein with formula CcHhNnOoSs, the average oxidation state of carbon (ZC) is
ZC =3n+2o+2s−h
c(1)
This calculation permits a simple comparison of the relative degrees of oxidation ofprotein molecules (Dick, 2014).
To proceed to more sophisticated chemical thermodynamic calculations, animportant choice must be made regarding the basis species used to describe the system.The basis species, like thermodynamic components, are a minimum number of chemicalformula units that can be linearly combined to generate the composition of anychemical species in the system of interest. Within these constraints, any specific choiceof a basis set is permitted in theory. In making the choice of components, convenience(Gibbs, 1875), ease of interpretation and relationship with measurable variables, as wellas availability of thermodynamic data (e.g. Helgeson, 1970), and kinetic favorability(May et al., 2001) are other useful considerations. Once the basis species are chosen,the stoichiometric coefficients in the formation reaction for any species are determined.
Following previous studies (e.g. Dick, 2008), the basis species initially chosen hereare CO2, H2O, NH3, H2S and O2 (basis set I). For a protein with formula CcHhNnOoSs,the reaction representing the overall formation of the protein from these basis species is
cCO2 +nNH3 + sH2S+nH2OH2O+nO2O2 CcHhNnOoSs (R1)
where nH2O = (h−3n−2s)/2 and nO2 = (o−2c−nH2O)/2. Dividing nH2O by thelength of the protein gives the water demand per residue (nH2O), which is useful forcomparing proteins of different size.
These or similar sets of inorganic species (such as H2 instead of O2) are often usedin studying reaction energetics in geobiochemistry (e.g. Shock and Canovas, 2010).However, because of the stoichiometric interdependence that links redox and hydrationpotentials, it is possible that a different set of basis species is more appropriate forconvenient description of subcellular processes.
2.3 Basis set II; Thermodynamic calculationsAs seen in Fig. 1a and b, there is a tight correlation between ZC of protein moleculesand nH2O in the reactions to form the proteins from basis set I. This correlation isexpected based on stoichiometric requirements. The equation for nH2O (after ReactionR1) can be combined with Eq. (1) to write
ZC =2c(o−nH2O) (2)
For given c and o, a linear relationship holds between ZC and nH2O, but for a populationof proteins, variations in the chemical composition cause a dispersion around a lineartrend, which is apparent in Fig. 1.
The appearance of this correlation raises a troubling issue. Although the basisspecies, like thermodynamic components, are necessarily independent compositionalvariables, in the systems of proteins considered here basis set I leads to a strong
6/30
.CC-BY 4.0 International licensecertified by peer review) is the author/funder. It is made available under aThe copyright holder for this preprint (which was notthis version posted January 4, 2016. . https://doi.org/10.1101/035857doi: bioRxiv preprint

−0.6 −0.2 0.2 0.4
0.5
1.0
1.5
2.0
2.5
ZC
nH
2O
human proteins
R2 = 0.82
(a)
●●
●
●
●
●
●
●
●●
●
●
●●
−0.22 −0.18 −0.14
1.75
1.80
1.85
1.90
1.95
2.00
2.05
ZC
nH
2O
microbial proteins
R2 = 0.93
(b)
−0.6 −0.2 0.2 0.4
−2.0
−1.5
−1.0
−0.5
ZC
nH
2O
human proteins
R2 = 0.024
(c)
●●
●
●
●
●
●●
●●
●
●
●
●
−0.22 −0.18 −0.14
−0.80
−0.78
−0.76
−0.74
−0.72
−0.70
ZC
nH
2O
microbial proteins
R2 = 0.359
(d)
Figure 1. Scatterplots of average oxidation state of carbon (ZC) and water demand perresidue (nH2O) for (a,c) individual human proteins and (b,d) overall (mean) compositionof proteins from microbial genomes, using (a,b) basis set I (e.g. Reaction R1) or (c,d)basis set II (e.g. Reaction R2). Linear least-squares fits and R2 values are shown. In (a)and (c), the intensity of shading corresponds to density of points, produced using thesmoothScatter() function of R graphics (R Core Team, 2015).
dependence between the two variables we are primarily interested in. Intuition suggeststhat some combinations of basis species will alter, and in some cases, decrease, thecorrelation between individual compositional variables such as ZC and nH2O.
If we “knew” the conditions in the cellular subsystem(s) of interest, any choice ofbasis species would be equally convenient, because we could simultaneously vary all oftheir chemical potentials appropriately. However, since we must begin in a moreexploratory mode, we restrict attention here to one or two variables, with theimplication that the others are held constant. In a subcellular setting, assuming constantvalues of chemical potentials of species such as CO2, NH3 and H2S may be less
7/30
.CC-BY 4.0 International licensecertified by peer review) is the author/funder. It is made available under aThe copyright holder for this preprint (which was notthis version posted January 4, 2016. . https://doi.org/10.1101/035857doi: bioRxiv preprint

appropriate than postulating constant (or “buffered”) potentials of more complexmetabolites. Perhaps, in modeling systems of proteins, constant chemical activities ofamino acids would be a reasonable starting assumption.
Although 1140 3-way combinations can be made of the 20 common proteinogenicamino acids, only 324 of the combinations contain cysteine and/or methionine (one ofthese is required to provide sulfur), and of these only 300, when combined with O2 andH2O, are compositionally independent. The slope, intercept and R2 of the least-squareslinear fits between ZC and nH2O using each of these basis sets are listed in theSupporting Information (AAbasis.csv). Many of these sets have lower R2 and lowerslopes than found for basis set I (Fig. 1a, b), indicating a decreased correlation, which isdesirable for our purposes. From those with a lower correlation (but not the lowest), thebasis set including cysteine, glutamic acid, glutamine and O2 and H2O (basis set II) hasbeen selected for use in this study. The scatter plots and fits between ZC and nH2O usingbasis set II are shown in Fig. 1c and d.
A secondary consideration in choosing this set (rather than others with even lowerR2) is based on the centrality of glutamine and glutamic acid in many metabolicpathways (e.g. DeBerardinis and Cheng, 2010). Accordingly, these amino acids may bekinetically more reactive than others in mechanisms underlying protein synthesis anddegradation. The presence of side chains derived from cysteine and glutamic acid in theabundant glutathione molecule (GSH), associated with redox homeostasis, is alsosuggestive of a central metabolic requirement for these amino acids. Again, it must bestressed that the current choice of basis species is not an absolute, uniquely determinedresult; greater experience with thermodynamic modeling and better biochemicalintuition will likely provide reasons to iterate these calculations using different basissets (perhaps including metabolites other than amino acids).
A general formation reaction using basis set II is
nCysC3H7NO2S+nGluC5H9NO4 +nGlnC5H10N2O3
+nH2OH2O+nO2O2→ CcHhNnOoSs (R2)
where the reaction coefficients (nCys, nGlu, nGln, nH2O and nO2) can be obtained bysolving
3 5 5 0 07 9 10 2 01 1 2 0 02 4 3 1 21 0 0 0 0
×
nCysnGlunGlnnH2OnO2
=
chnos
(3)
Although the definition of basis species requires that they are themselvesstoichiometrically non-degenerate, the matrix equation emphasizes the interdependenceof the reaction coefficients with each other. A consequence of this multiple dependenceis that single variables such as nH2O are not simple variables, but are influenced by boththe inherent chemical makeup of the protein and the choice of basis species used todescribe the system.
Regarding the actual mechanism of synthesis, we are definitely not saying thatproteins are synthesized by combining the specific molecules shown in Reaction R2;
8/30
.CC-BY 4.0 International licensecertified by peer review) is the author/funder. It is made available under aThe copyright holder for this preprint (which was notthis version posted January 4, 2016. . https://doi.org/10.1101/035857doi: bioRxiv preprint

reactions such as this are simply a way to account for mass-conservation requirements.This allows us to generate an internally consistent thermodynamic description of theeffects of changing the local environment (i.e. chemical potentials of O2 and H2O) onthe overall potential for formation of different proteins.
As an example of a specific calculation, consider the following reaction:
7C3H7NO2S+535.6C5H9NO4 +515.2C5H10N2O3→C5275H8231N1573O1762S7 +895.2H2O+522.4O2 (R3)
Here, the the reaction is written for the formation of one mole of the protein MUC1,a chromatin-binding protein that is highly up-expressed in CRC cells (Knol et al., 2014).Using Eq. (1), the average oxidation state of carbon (ZC) in this protein is 0.005.According to this reaction, water is released in the overall formation of the protein, sothe water demand (nH2O) is negative. The length of this protein is 1255 amino acidresidues, giving the water demand per residue, nH2O =−895.2/1255 = 0.71. The valueof ZC indicates that MUC1 is a relatively highly oxidized protein, while its nH2O placesit near the median water demand for cancer-associated proteins in this data set (seeTable 1 and Fig. 2 below).
2.4 Thermodynamic calculationsThermodynamic properties for the amino acids and of unfolded proteins estimated usingamino acid group additivity were calculated as described by Dick et al. (2006), takingaccount of updated values for the methionine sidechain group (LaRowe and Dick, 2012).All calculations were carried out at 37 ◦C and 1 bar. The temperature dependence ofstandard Gibbs energies was calculated using the revised Helgeson-Kirkham-Flowers(HKF) equations of state (Helgeson et al., 1981; Tanger and Helgeson, 1988).Thermodynamic properties for O2 (gas) were calculated using data from Wagman et al.(1982) together with coefficients for the Maier-Kelley heat capacity function (Kelley,1960), and those for H2O (liquid) using data and extrapolations coded in Fortransubroutines from the SUPCRT92 package (Johnson et al., 1992).
Chemical affinities of reactions were calculated using activities of amino acids set to10−4, and activities of proteins equal to 1/(protein length) (i.e., unit activity of residues).Continuing with the example of Reaction R3, an estimate of the standard Gibbs energy(∆G◦f ) of the protein (Dick et al., 2006) at 37 ◦C is -40974 kcal/mol; combined with thestandard Gibbs energies of the basis species, this give a standard Gibbs energy ofreaction (∆G◦r ) equal to 66889 kcal/mol. At logaH2O = 0 and log fO2 =−65, withactivities of the amino acid basis species equal to 10−4, the overall Gibbs energy (∆Gr)is 24701 kcal/mol. The negative of this value is the chemical affinity (A) of the reaction.The per-residue chemical affinity (used in order to compare the relative stabilities ofproteins of different sizes) for formation of protein MUC1 in the stated conditions is-19.7 kcal/mol.
The amino acid compositions of different proteins would yield different values ofthe per-residue chemical affinity. The chemical affinities of formation of all proteins arealso sensitive to the environmental conditions represented by temperature (T ), pressure(P) and the chemical potentials of basis species. Without making any statement aboutmechanism, proteins with higher (more positive) chemical affinity are relatively
9/30
.CC-BY 4.0 International licensecertified by peer review) is the author/funder. It is made available under aThe copyright holder for this preprint (which was notthis version posted January 4, 2016. . https://doi.org/10.1101/035857doi: bioRxiv preprint
energetically stabilized, and theoretically have a higher propensity to be formed.Therefore, the differences in affinities reflect not only the oxidation and hydration stateof the protein molecules but also the potential for local environmental conditions toconstrain the degree of formation and relative abundances of proteins. Here, the relativestabilities as a function of logaH2O and log fO2 are mapped on to diagrams using arank-difference summary of the group-wise (i.e. cancer- vs healthy-associated proteins)chemical affinities.
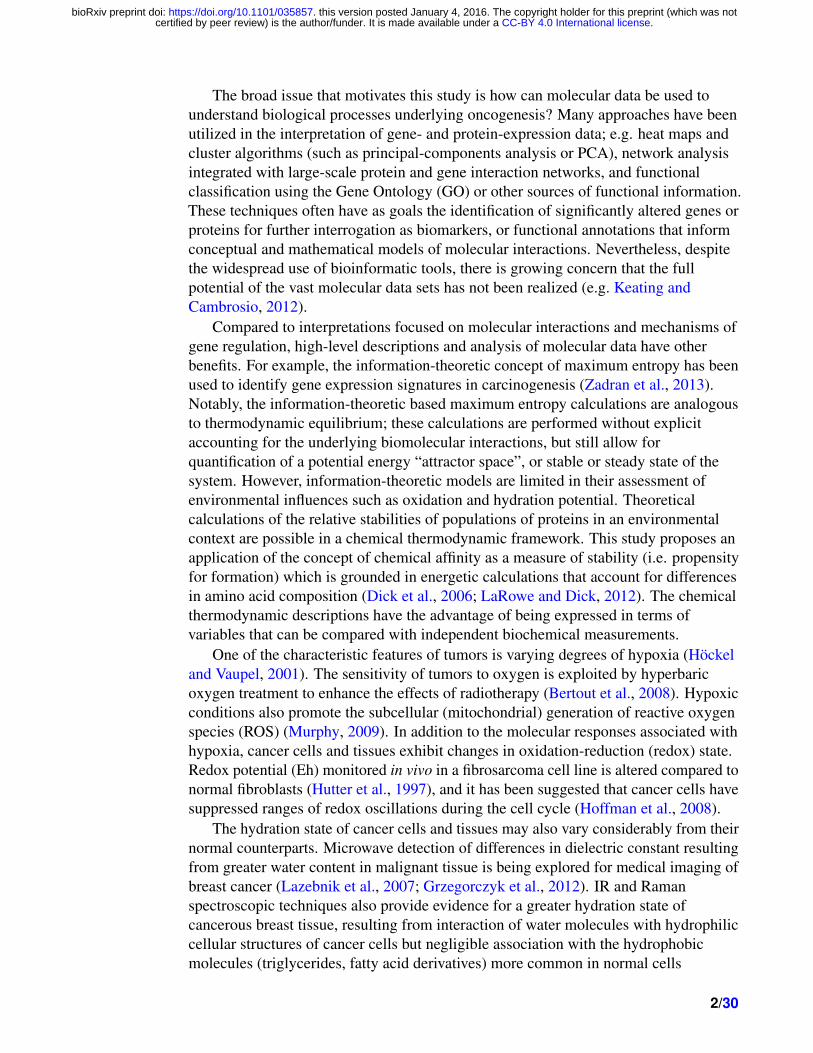
2.5 Rank calculationsConsider a hypothetical system composed of 4 cancer (C) and 5 healthy (H) proteins.Suppose that under one set of conditions (i.e. specified logaH2O and log fO2), theper-residue affinities of the proteins give the following ranking in ascending order (I):
C C C C H H H H H1 2 3 4 5 6 7 8 9
This gives as the sum of ranks for cancer proteins ∑rC = 10, and for healthyproteins ∑rH = 35. The difference in sum of ranks then is ∆rC−H =−25; the negativevalue is associated with a higher rank sum for the healthy proteins, indicating that theseas a group are more stable than the cancer proteins. In a second set of conditions, wemight have (II):
H H H H H C C C C1 2 3 4 5 6 7 8 9
Here, the difference in rank sums is ∆rC−H = 30−15 = 15.For systems where the numbers of cancer and healthy proteins are equal, the
maximum possible differences in rank sums would have equal absolute values, but thatis not the case in this and other systems having unequal numbers of cancer and healthyproteins. To characterize those data sets, the weighted rank-sum difference can becalculated using
∆r = 2(nH
n ∑rC−nC
n ∑rH
)(4)
where nH, nC and n are the numbers of healthy, cancer, and total proteins in thecomparison. In the example here, we have nH/n = 5/9 and nC/n = 4/9. Eq. (4) thengives ∆r =−20 and ∆r = 20, respectively, for conditions (I) and (II) above, showingequal weighted rank-sum differences for the two extreme rankings.
We can also consider a situation where the ranks of the cancer and healthy proteinsare evenly distributed:
H C H C H C H C H1 2 3 4 5 6 7 8 9
Here the absolute difference in rank sums is ∆rC−H = 5, but the weighted rank-sumdifference is ∆r = 0. The zero value for an even distribution, and the opposite values forthe two extremes, demonstrate the acceptability of this weighting scheme.
10/30
.CC-BY 4.0 International licensecertified by peer review) is the author/funder. It is made available under aThe copyright holder for this preprint (which was notthis version posted January 4, 2016. . https://doi.org/10.1101/035857doi: bioRxiv preprint

3 RESULTS3.1 Compositional descriptions of human proteinsFor proteins in the selected data sets (Section 2.1), Fig. 2 shows values of averageoxidation state of carbon calculated from the chemical formulas of the proteins (ZC; Eq.1) and water demand per residue calculated from the overall formation reaction in termsof basis set II (nH2O; Reaction R2).
Fig. 2a reveals that ZC of chromatin-binding proteins in carcinoma reported by Knolet al. (2014) are shifted to lower (more negative) values compared to proteins inadenoma, except for three outliers at high ZC (MUC1, LRP1 and PTGES3). A moderateshift toward higher nH2O is exhibited by chromatin-binding proteins in carcinoma. TheZC of proteins in membrane fractions of tumor samples identified by Chen et al. (2010)are lower than paired normal samples (Fig. 2b), and the ZC of proteins in membranefractions of tumor samples identified by Kume et al. (2014) are lower than paired polypsamples (Fig. 2c). These observations are summarized in Table 1, giving the medianvalues of ZC and nH2O and p-values calculated using the Mann-Whitney test (anon-parametric test that does not assume a particular distribution). Although ZC isconsistently lower for tumor and carcinoma-derived proteins in these data sets, thelower degree of statistical significance (represented by the p-values) precludes making adefinitive statement about relative water demand for these proteins.
In the next row of Fig. 2, compositions of membrane-enriched proteins in the studyof Sethi et al. (2015) are seen to be offset toward higher nH2O for tumor relative tonormal samples (Fig. 2d). The adenoma-derived proteins reported by Uzozie et al.(2014) as identified with “epithelial cell signature” have a strongly elevated relativewater demand per residue compared to proteins from normal tissue, whileadenoma-derived proteins more likely to have a stromal origin show a somewhatsmaller increase in nH2O relative to normal tissue (Fig. 2e,f).
Overall, the compositions of the proteins in carcinoma and tumor-derived proteinsrelative to their adenoma or normal counterparts manifest either a strongly lowermedian ZC with variable sign of the median nH2O difference, or a higher median nH2Owith smaller ZC difference (Fig 2i). These trends are also apparent, although with lowerstatistical significance, for proteins of Wnt target genes in the tumor center compared tothe invasion front (lower ZC, Fig. 2g) and for candidate serum biomarkers withincreased relative abundance compared to those with decreased relative abundance inCRC patients (higher nH2O, Fig. 2h). The possible significance of these findings inrelation to biochemical and physiological observations of tumor oxidation and hydrationstate is discussed further below.
3.2 Compositional descriptions of microbial proteinsHealthy individuals maintain a thriving enteric microbial population. The microbiotasupport important functions including digestion (Turnbaugh et al., 2009) andimmunological regulation and inflammatory responses, which are strongly tied tooxidation-reduction conditions (Koboziev et al., 2014). The healthy gut can becharacterized by a “core microbiome” composed of a common set of genes (orfunctions) that are present regardless of differences in taxonomic composition(Turnbaugh et al., 2009). Because of the diverse responses of microbial populations to
11/30
.CC-BY 4.0 International licensecertified by peer review) is the author/funder. It is made available under aThe copyright holder for this preprint (which was notthis version posted January 4, 2016. . https://doi.org/10.1101/035857doi: bioRxiv preprint

●
●
●
●
●
●
●●
●
●●
●
●
●
●
●
●
●●
●
●●●
●
●●
●
−0.20 −0.10 0.00
−0.9
−0.8
−0.7
−0.6
ZC
nH
2O
chromatin−binding in carcinoma/adenoma
MUC1
LRP1
PTGES3
(a)
●
●
●
●
●
●
●
●
−0.25 −0.15 −0.05 0.05
−0.90
−0.85
−0.80
−0.75
−0.70
−0.65
−0.60
ZC
nH
2O
membrane fraction tumor/normal(b)
●
●
●
●
●
●
−0.30 −0.20 −0.10
−0.9
−0.8
−0.7
−0.6
ZC
nH
2O
membrane fraction tumor/polyp(c)
●
●
●
●
●
●●
●
●
●
●
●●
●
●●
●
●
●
●
●
●●
●
●
●
●
●
● ●
●
●●
●
●
●
●
●
●
●●
●
●
●
●
●
●
●
●●
●
●
●
●
●
●
●
●
●
●●
●●
●
●
●
●
●●
●
●
●
●
●
●
●
●
●
●
●
●
●●
●
●
●
●
●
●
●
●
●
●
●
●
●●
●●
●
●
●
●
●
●
●
●
●
●
●●
●●
●
−0.25 −0.15 −0.05
−1.0
−0.9
−0.8
−0.7
−0.6
−0.5
ZC
nH
2O
membrane enriched tumor/normal(d)
●
●
●
●●
●
●
●●
●
●
●
●
●
●●
●
●
●
●
●●●
●
● ●
●●
●●
●
●●
●●
●
●●●
●
●
●
●
●
●
●
●
●
●
●
●
●
●
●
●
●●
−0.3 −0.2 −0.1 0.0
−0.9
−0.8
−0.7
−0.6
ZC
nH
2O
epithelial cell signature adenoma/normal(e)
●●
●
●
●
●●
●
●
●
●
●
●
●●
●
●●
●
●●
●
●●
●
●●
● ●
●
●●
●
●●
●
●●
●●
●
●
●
●
●
●
●●
●●●
●●
●
●
●
●
●
●
● ●
●● ●
●
●
●●
●●●
●●
●●●●
●●●
●
●●
●
●
●
●●
●● ●
●
●
●
● ●
●
●
●●
●
●
●
●
●
●
●
●
−0.25 −0.15 −0.05
−1.2
−1.1
−1.0
−0.9
−0.8
−0.7
−0.6
−0.5
ZC
nH
2O
stromal cell signature adenoma/normal(f)
●
●
●
●
● ●●
●
●
−0.20 −0.10 0.00
−0.95
−0.90
−0.85
−0.80
−0.75
−0.70
−0.65
ZC
nH
2O
Wnt targets tumor/invasion front(g)
●
●
●●
●
●
●
●
●●
●●
●
●
●
●
●
●
●
−0.20 −0.15 −0.10 −0.05
−0.85
−0.80
−0.75
−0.70
−0.65
−0.60
−0.55
ZC
nH
2O
serum biomarkers abundance up/down(h)
−0.18 −0.14 −0.10 −0.06
−0.80
−0.78
−0.76
−0.74
−0.72
ZC
nH
2O
medians from plots (a)−(h)(i)
●
a
●
b
●
c
●d
●
e
●
f
●g
●
h
Figure 2. Average oxidation state of carbon (ZC) and water demand per residue (nH2O) for proteinsdifferentially expressed in cancerous tissues or samples (see Sections 2.1.1–2.1.8 for data sources andTable 1 for summary statistics of the comparisons). Open red squares represent the tumor-associatedproteins or more advanced cancer stages, and filled blue circles represent proteins associated with normaltissue or less advanced cancer stages. Plot (i) shows the median values in each of the data sets.
12/30
.CC-BY 4.0 International licensecertified by peer review) is the author/funder. It is made available under aThe copyright holder for this preprint (which was notthis version posted January 4, 2016. . https://doi.org/10.1101/035857doi: bioRxiv preprint

Table 1. Summary of compositional comparisons: median values of ZC and nH2O in human proteins andoverall (mean) protein compositions of microbes, and Wilcoxon rank sum test (Mann-Whitney) statisticsand p-values. Depending on the data sets (see footnotes and Section 2.1), “control” refers to normal tissueor less advanced cancer stage (e.g. adenoma), and “cancer” refers to cancer tissue or more advancedcancer stage (e.g. carcinoma).
ZC medians nH2O medianscomparison control cancer p-value control cancer p-valueHuman proteinsChromatin-binding in carcinoma/adenoma a -0.105 -0.164 0.0002 -0.757 -0.727 0.5Membrane fraction tumor/normal b -0.053 -0.173 0.004 -0.740 -0.759 0.5Membrane fraction tumor/polyp c -0.104 -0.153 0.05 -0.745 -0.788 0.5Membrane enriched tumor/normal d -0.146 -0.150 0.7 -0.764 -0.761 0.2Epithelial cell signature adenoma/normal e -0.135 -0.140 0.9 -0.778 -0.736 0.06Stromal cell signature adenoma/normal e -0.129 -0.162 0.4 -0.803 -0.764 0.09Wnt targets tumor/invasion front f -0.078 -0.113 0.5 -0.785 -0.789 0.7Serum biomarkers abundance up/down g -0.126 -0.134 0.8 -0.799 -0.741 0.3
Microbial proteinsfecal 16S rRNA h -0.163 -0.177 0.3 -0.765 -0.741 0.2fecal metagenome i -0.174 -0.190 0.6 -0.738 -0.730 0.5co-abundance groups j -0.138 -0.196 0.2 -0.742 -0.746 0.8
a. Knol et al. (2014); b. Chen et al. (2010); c. Kume et al. (2014); d. Sethi et al. (2015); e. Uzozie et al.(2014); f. Hlubek et al. (2007); g. Jimenez et al. (2010); h. Wang et al. (2012); i. Zeller et al. (2014); j.Candela et al. (2014).
the cancer state (Sears and Garrett, 2014), summary data on microbial populations fromthree studies were selected for inclusion in the descriptions of chemical compositionsgenerated in this study. First, in a study of 16S RNA of fecal microbiota, Wang et al.(2012) reported genera that are significantly increased and decreased in CRC comparedto healthy patients. In order to compare the chemical composition of the microbialpopulation, single species with sequenced genomes were chosen to represent each ofthese genera (see Table 2). Where possible, the species selected are those mentioned byWang et al. (2012) as being significantly altered, or are species reported in other studiesto be present in healthy or cancer states (see Table 2).
In the second study considered (Zeller et al., 2014), changes in the metagenomicabundance of fecal microbiota associated with CRC were analyzed for their potential asa biosignature for cancer detection. The species shown in Fig. 1A of Zeller et al. (2014)with a log odds ratio greater than 0.15 were selected for comparison, and are listed inTable 3. Here, Fusobacterium is identified as a pro-carcinogenic group, as has also beenreported elsewhere (Kostic et al., 2012; Castellarin et al., 2012). Finally, Candela et al.(2014) report the findings of a network analysis that identified 5 microbial“co-abundance groups” at the genus level. As before, single representative species wereselected in this study, and are listed in Table 2. Except for the presence ofFusobacterium, the co-abundance groups show little genus-level overlap with profiles
13/30
.CC-BY 4.0 International licensecertified by peer review) is the author/funder. It is made available under aThe copyright holder for this preprint (which was notthis version posted January 4, 2016. . https://doi.org/10.1101/035857doi: bioRxiv preprint

Table 2. Microbial species selected as models for genera and co-abundance groups thatdiffer between CRC and healthy patients.
Phylum Species Abbrv. Bioproject Refs.Model species for genera significantly higher in healthy patientsa
Bacteroidetes Bacteroides vulgatus ATCC 8482 Bvu PRJNA13378 c
Bacteroidetes Bacteroides uniformis ATCC 8492 Bun PRJNA18195 c
Firmicutes Roseburia intestinalis L1-82 (DSM 14610) Rin PRJNA30005 d
Bacteroidetes Alistipes indistinctus YIT 12060 Ain PRJNA46373 c
Firmicutes Eubacterium rectale ATCC 33656 Ere PRJNA29071 e
Proteobacteria Parasutterella excrementihominis YIT 11859 Pex PRJNA48497 f
Model species for genera significantly higher in CRC patientsa
Bacteroidetes Porphyromonas gingivalis W83 Pgi PRJNA48 g
Proteobacteria Escherichia coli NC101 Eco PRJNA47121 c,h
Firmicutes Enterococcus faecalis V583 Efa PRJNA57669 c
Firmicutes Streptococcus infantarius ATCC BAA-102 Sin PRJNA20527 i
Firmicutes Peptostreptococcus stomatis DSM 17678 Pst PRJNA34073 j
Bacteroidetes Bacteroides fragilis YCH46 Bfr PRJNA58195 g
Model species for protective co-abundance groupsb
Actinobacteria Bifidobacterium longum NCC2705 Blo PRJNA57939 g,k
Firmicutes Faecalibacterium prausnitzii SL3/3 Fpr PRJNA39151 e,l
Model species for pro-carcinogenic co-abundance groupsb
Fusobacteria Fusobacterium nucleatum ATCC 23726 Fnu PRJNA49043 m,n
Bacteroidetes Prevotella copri DSM 18205 Pco PRJNA30025 k,o
Firmicutes Coprobacillus sp. D7 Csp PRJNA32495 h
a. Genus identification from Table 2 of Wang et al. (2012). Based on comments in Wang et al. (2012),Bacteroides is represented here by two species (B. vulgatus and B. uniformis) in healthy patients, and onespecies (B. fragilis) in CRC patients. b. Genus-level definition of co-abundance groups from Candelaet al. (2014). c. Wang et al. (2012); species closely related to 16S rRNA-derived operational taxonomicunits (OTUs; Figure 2 of Wang et al., 2012) or otherwise mentioned by those authors (E. faecalis). d.Duncan et al. (2002). e. Louis and Flint (2007). f. Nagai et al. (2009). g. Chen et al. (2012). h. Candelaet al. (2014). i. Biarc et al. (2004). j. Zeller et al. (2014). k. Weir et al. (2013). l. Sokol et al. (2008). m.Castellarin et al. (2012). n. Kostic et al. (2012). o. cf. Chen et al. (2012); Candela et al. (2014) (moreabundant in CRC patients); Weir et al. (2013) (more abundant in healthy subjects).
derived from the previous two studies.For each of the microbial species listed in Tables 2 and 3, an overall protein
composition was calculated from the NCBI Bioproject genomes as averagecompositions of protein sequences, without any weighting for transcript or actualprotein abundance in organisms, and exclude any post-translational modifications. Thewater demand per residue (nH2O) vs. oxidation state of carbon (ZC) in proteins from allof the microbial species considered here are plotted in Fig. 1b and d.
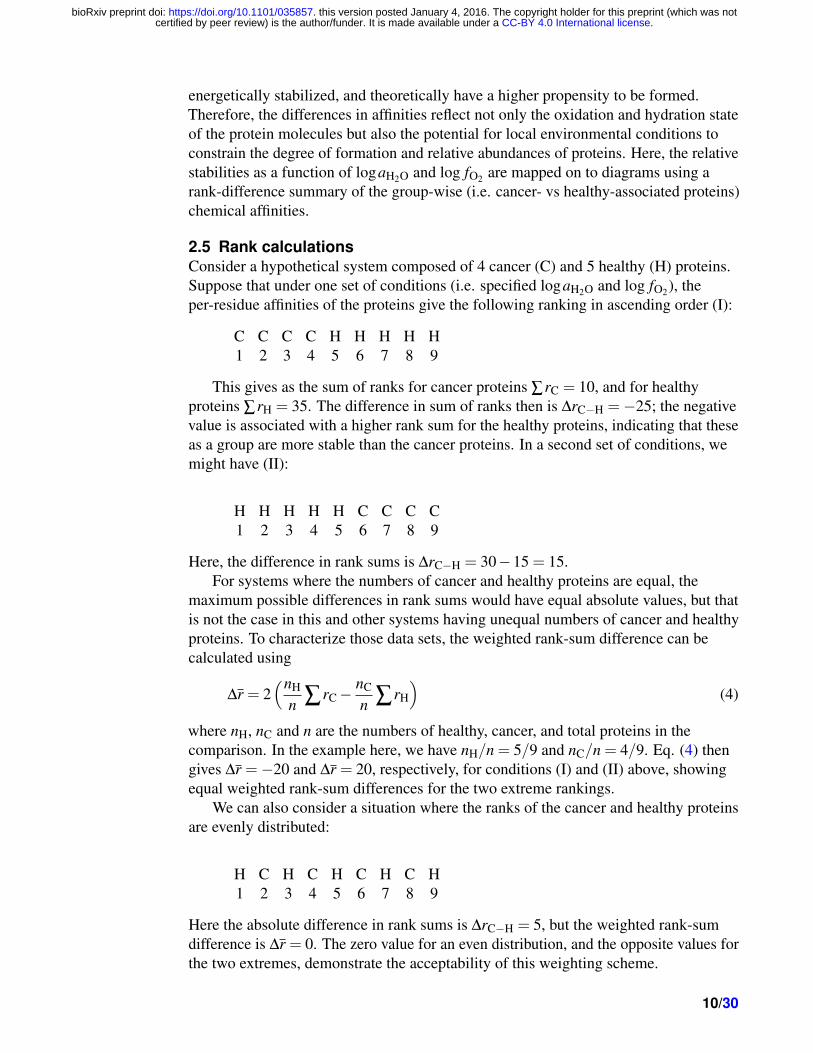
The plots of nH2O vs. ZC for overall microbial proteins in each data set are shown inFig. 3. It is apparent that the proteins in the microbes from cancer patients generallyhave lower ZC than the healthy patients in the same study (see also Table 1). The twoFusobacterium species identified by Zeller et al. (2014) have the lowest ZC of anymicrobial species considered here. The overall human protein composition is alsoplotted in Fig. 3, showing higher ZC than any of the microbial proteomes except for
14/30
.CC-BY 4.0 International licensecertified by peer review) is the author/funder. It is made available under aThe copyright holder for this preprint (which was notthis version posted January 4, 2016. . https://doi.org/10.1101/035857doi: bioRxiv preprint

Table 3. Species from a consensus microbial signature for CRC classification of fecalmetagenomes (Zeller et al., 2014). Only species reported as having a log odds ratiobigger than ±0.15 are listed here, together with strains and Bioproject ID’s used asmodels in the present study.
Species Strain Abbrv. BioprojectHigher in CRC patientsFusobacterium nucleatum subsp. vincentii ATCC 49256 Fnv PRJNA1419Fusobacterium nucleatum subsp. animalis D11 Fna PRJNA32501Peptostreptococcus stomatis DSM 17678 Pst PRJNA34073Porphyromonas asaccharolytica DSM 20707 Pas PRJNA51745Clostridium symbiosum ATCC 14940 Csy PRJNA18183Clostridium hylemonae DSM 15053 Chy PRJNA30369Lactobacillus salivarius ATCC 11741 Lsa PRJNA31503
Higher in healthy patientsClostridium scindens ATCC 35704 Csc PRJNA18175Eubacterium eligens ATCC 27750 Eel PRJNA29073Methanosphaera stadtmanae DSM 3091 Mst PRJNA15579Phascolarctobacterium succinatutens YIT 12067 Psu PRJNA48505unclassified Ruminococcus sp. ATCC 29149(*) Rsp PRJNA18179Streptococcus salivarius SK126 Ssa PRJNA34091
* R. gnavus
Bifidobacterium longum.The proteins from cancer-associated bacteria do not have a consistently different
median nH2O than those from healthy-associated bacteria, but the comparisons showthat the overall changes in microbial populations associated with CRC favor specieswith proteins that are more reduced than the healthy populations.
3.3 Thermodynamic descriptions: backgroundMany workers have investigated the oxidation-reduction (redox) state of cells andbiomolecules and redox-dependent signaling processes in both healthy and cancerouscells. A simplified categorization of redox molecules and processes might include thefollowing. 1) Reactive oxygen species, earlier thought to be generally harmful in cells,are now considered to be important signaling molecules (e.g. Sarsour et al., 2009). 2)Low-molecular weight thiols are also involved in molecular signaling, and have beenproposed as key components of cell-cycle progression (Menon et al., 2003). Theconcentrations of reduced thiols and oxidized disulfides, especially of reduced andoxidized glutathione, are often used to quantify redox potential (Eh). 3) Oxygen itself isa major contributor to redox reactions. Tumor hypoxia is common in cancer (Hockeland Vaupel, 2001), and regulatory response to oxygen is important for oncogenesis(Harris, 2002). 4) The covalent structure of organic molecules determines the oxidationstate of carbon; differences in molecular composition imply that energetics ofbiosynthetic processes generally have a strong dependence on changing redox potential.The different oxidation states of metabolites including lactate and pyruvate are essentialin accounting for their utilization in metabolic processes (e.g. Brooks, 2009). The
15/30
.CC-BY 4.0 International licensecertified by peer review) is the author/funder. It is made available under aThe copyright holder for this preprint (which was notthis version posted January 4, 2016. . https://doi.org/10.1101/035857doi: bioRxiv preprint
−0.22 −0.18 −0.14
−0.80
−0.78
−0.76
−0.74
−0.72
−0.70
ZC
nH
2O
●
Hsa
●
Bvu●Bun
●
Rin
●
Ain
●
Ere
●
Pex
Pgi
Eco
EfaSin
Pst
Bfr
fecal 16S rRNA(a)
−0.22 −0.18 −0.14
−0.80
−0.78
−0.76
−0.74
−0.72
−0.70
ZC
●
Hsa
Fnv
FnaPst
Pas
CsyChyLsa
●
Csc
●Eel
●
Mst
●
Psu
●
Rsp
●Ssa
fecal metagenome(b)
−0.22 −0.18 −0.14
−0.80
−0.78
−0.76
−0.74
−0.72
−0.70
ZC
●
Hsa
●
Blo●
Fpr
Fnu
Pco
Csp
co−abundance groups(c)
Figure 3. Average oxidation state of carbon (ZC) and water demand per residue (nH2O) for overall aminoacid compositions of proteins in genomes of healthy- and cancer-associated microbes. Data are shown forrepresentative species for (a) microbial genera identified in fecal 16s RNA (Wang et al., 2012; Table 2 top),(b) microbial signatures in fecal metagenomes (Zeller et al., 2014; Table 3), and (c) microbialco-abundance groups (Candela et al., 2014; Table 2 bottom).
subcellular distribution of proteins with different oxidation states of carbon can also beused to suggest that the synthesis and degradation of all proteins in cells depend on andinfluence subcellular redox conditions (Dick, 2014).
Higher chemical affinities correspond with greater relative stability, so the relativestabilities of the proteins are a function of both amino acid composition andenvironmental conditions represented by the activities of the basis species, including notonly O2 and H2O but the others. When the highest chemical affinities are mapped onto2-dimensional spaces (here, log fO2 and logaH2O), a diagram with fields results, whichmay be called a predominance diagram, referring to the limiting equilibrium case, ormore generally, a maximal relative stability diagram (or, more simply, stabilitydiagram). However, even in actual situations in which equilibrium is not achieved, thecalculations add a layer of information about relative energetics of reactions. Theenvironmentally dependent reaction energetics support a richer interpretation thancomparison of chemical compositions alone.
16/30
.CC-BY 4.0 International licensecertified by peer review) is the author/funder. It is made available under aThe copyright holder for this preprint (which was notthis version posted January 4, 2016. . https://doi.org/10.1101/035857doi: bioRxiv preprint
−75 −70 −65 −60 −55
−10
−5
0
5
10
logfO2(g)
loga
H2O
(liq)
BvuBun
Rin
Ain
Pex
Eco
Efa
Pst
fecal 16S rRNA(a)
−75 −70 −65 −60 −55
−10
−5
0
5
10
logfO2(g)
loga
H2O
(liq)
Fnv
Fna
Pas
ChyEel
Psu
Rsp
fecal metagenome(b)
−75 −70 −65 −60 −55
−10
−5
0
5
10
logfO2(g)
loga
H2O
(liq)
BloFpr
Fnu
Pco
Csp
co−abundance groups(c)
−75 −70 −65 −60 −55
−10
−5
0
5
10
logfO2(g)
loga
H2O
(liq)
cumulative stability count(d)
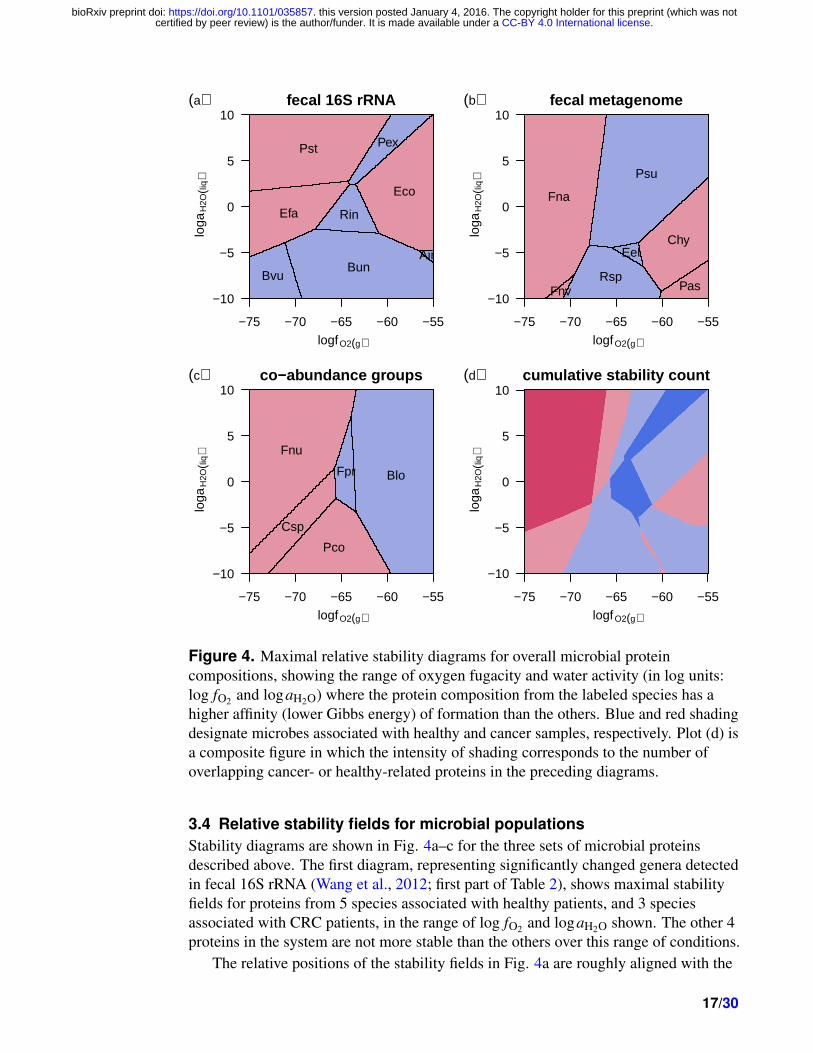
Figure 4. Maximal relative stability diagrams for overall microbial proteincompositions, showing the range of oxygen fugacity and water activity (in log units:log fO2 and logaH2O) where the protein composition from the labeled species has ahigher affinity (lower Gibbs energy) of formation than the others. Blue and red shadingdesignate microbes associated with healthy and cancer samples, respectively. Plot (d) isa composite figure in which the intensity of shading corresponds to the number ofoverlapping cancer- or healthy-related proteins in the preceding diagrams.
3.4 Relative stability fields for microbial populationsStability diagrams are shown in Fig. 4a–c for the three sets of microbial proteinsdescribed above. The first diagram, representing significantly changed genera detectedin fecal 16S rRNA (Wang et al., 2012; first part of Table 2), shows maximal stabilityfields for proteins from 5 species associated with healthy patients, and 3 speciesassociated with CRC patients, in the range of log fO2 and logaH2O shown. The other 4proteins in the system are not more stable than the others over this range of conditions.
The relative positions of the stability fields in Fig. 4a are roughly aligned with the
17/30
.CC-BY 4.0 International licensecertified by peer review) is the author/funder. It is made available under aThe copyright holder for this preprint (which was notthis version posted January 4, 2016. . https://doi.org/10.1101/035857doi: bioRxiv preprint

values of ZC and nH2O of the proteins; note for example the high-log fO2 positions of thefields for the relatively high-ZC Escherichia coli and Alistipes indistinctus, and thehigh-logaH2O position of the field for the high-nH2O Peptostreptococcus stomatis. Asidefrom E. coli, the proteins from the species associated with CRC in this dataset occupythe lower log fO2 (reducing) and higher logaH2O zones of this diagram.
In thermodynamic calculations for proteins from bacteria detected in fecalmetagenomes (Zeller et al., 2014; Table 3), 3 of 6 healthy-associated microbes, and 4 of7 cancer-associated microbes exhibit maximal relative stability fields (Fig. 4b). Here,the cancer-associated proteins occupy the more reducing (Fusobacterium nucleatumsubsp. vincentii and subsp. animalis) or more oxidizing (Clostridium hylemonae,Porphyromonas asaccharolytica) regions, while the proteins from bacteria moreabundant in healthy individuals are relatively stable at moderate oxidation-reductionconditions. For the proteins representing microbial co-abundance groups (Candela et al.,2014; second part of Table 2), all of the 5 bacterial species show up on the diagram.Here, the cancer-associated proteins are more stable at reducing conditions and thehealthy-related proteins are stabilized by oxidizing conditions. These patterns in relativestability are in accord with the distribution of ZC of the proteins (Fig. 2b, c).
In Fig. 4d is a composite representation of the calculations, in which greatercumulative counts of maximal stability of healthy- and cancer-related proteins in thethree studies are represented by deeper blue and red shading, respectively. The regionpredicted to be most energetically favorable for the formation of proteins in bacteriaenriched in CRC is found at low log fO2; proteins from bacteria that are abundant inhealthy patients tend to be stabilized by moderate values of log fO2 . Theseoxidation-potential distinctions between the two groups are most apparent at highlogaH2O. Thus, despite the differences in experimental design and specific taxonomicidentity among the three data sets considered here, the thermodynamic calculationsreveal a shared pattern of relative stabilities in terms of oxidation state.
3.5 Relative stability fields for human proteinsCompared to the overall microbial protein compositions used here (Tables 2, 3), there isa greater number of individual proteins identified in the data sets for healthy and cancerproteins in humans. A plot of the relative affinities of formation of individual proteins inFig. 5a shows a sensitivity to theoretical redox potential, with lower log fO2 tending toprovide more favorable energetic conditions for the formation of up-expressed proteinsin chromatin-binding fractions in carcinoma compared to adenoma. How can this visualimpression be summarized quantitatively, in order to explore the data in multipledimensions (both logaH2O and log fO2)? Unlike the small number of overall microbialproteins, the higher numbers of proteins in these human comparisons diminish theutility of comparisons using maximal stability diagrams.
In Fig. 5b, the difference in mean values of chemical affinity per residue ofcarcinoma and adenoma-associated proteins is plotted, appearing as a straight line as afunction of log fO2 . This linear behavior would translate to evenly-spaced contours on alog fO2-logaH2O diagram. The rank-difference calculation of affinities (see Methods),shown by the jagged curving line Fig. 5b, provides a richer response function tochanging chemical conditions. It emphasizes the transition zone between groups ofproteins, and gives rise to two-dimensional stability diagrams with curved and diversely
18/30
.CC-BY 4.0 International licensecertified by peer review) is the author/funder. It is made available under aThe copyright holder for this preprint (which was notthis version posted January 4, 2016. . https://doi.org/10.1101/035857doi: bioRxiv preprint

−75 −70 −65 −60 −55
−4
−2
0
2
logfO2(g)
A/2
.303
RT
per
res
idue
deviation from overall mean(a)
−75 −70 −65 −60 −55
−0.5
0.0
0.5
logfO2(g)
A/2
.303
RT
per
res
idue
difference in group means / ranks(b)
rank
diff
eren
ce (
%)
−60
−40
−20
0
20
40
60
Figure 5. Calculated chemical affinities per residue of proteins in the “membranefraction tumor/polyp” data set. Values for individual proteins as a function of log fO2 atlogaH2O = 0 are shown in plot (a) as deviations from the mean value for all proteins.Healthy- and cancer-related proteins are indicated by solid blue and dashed red lines,respectively. Plot (b) shows the difference in mean value between healthy and cancerproteins (straight line and left-hand y-axis) and the weighted difference in sums of ranksof affinities as a percentage of maximum possible rank-sum difference (jagged line andright-side y-axis). Positive values of affinity or rank-sum difference in plot (b)correspond to relatively greater stability of the cancer-related proteins.
spaced contours.The differences between sums of ranks of healthy- and cancer-associated proteins
are depicted in Fig. 6 by the intensity of shading, with darker blue areas correspondingto more a negative difference (i.e. healthy-related proteins more stable) and darker redareas to a more positive difference (i.e. cancer-related proteins more stable). Under theinterpretation of the energies as an indicator of propensity of formation of the proteins,the blue zones can be considered to be a prediction of the chemical conditions mostconducive for a healthy state.
The proteins in the first three data sets are distinguished by large changes in theaverage oxidation state of carbon (ZC) (Table 1). Correspondingly, the three affinityrank-difference plots (Fig. 6a-c) show sub-vertical equal-rank lines, with a higherranking of stabilities of cancer-related proteins toward the left-hand side, or lowerlog fO2 . In the “membrane fraction tumor/polyp” data set, both ZC and nH2O varyconsiderably, and the equal-rank line in Fig. 6c accordingly has a more diagonal slope.The second row of Fig. 6 shows plots for data sets in which the compositionaldifferences are more strongly determined by changes in nH2O. In each of thesecomparisons, the groups of cancer proteins are energetically favored by increasinglogaH2O.
The final two stability plots in Fig. 6 show the calculated relations for data sets thatare derived from patterns of gene expression for a specific signaling pathway (“Wnt
19/30
.CC-BY 4.0 International licensecertified by peer review) is the author/funder. It is made available under aThe copyright holder for this preprint (which was notthis version posted January 4, 2016. . https://doi.org/10.1101/035857doi: bioRxiv preprint

−75 −70 −65 −60 −55
−10
−5
0
5
10
logfO2(g)
loga
H2O
(liq)
chromatin−binding in carcinoma/adenoma(a)
−75 −70 −65 −60 −55
−10
−5
0
5
10
logfO2(g)
loga
H2O
(liq)
membrane fraction tumor/normal(b)
−75 −70 −65 −60 −55
−10
−5
0
5
10
logfO2(g)
loga
H2O
(liq)
membrane fraction tumor/polyp(c)
−75 −70 −65 −60 −55
−10
−5
0
5
10
logfO2(g)
loga
H2O
(liq)
membrane enriched tumor/normal(d)
−75 −70 −65 −60 −55
−10
−5
0
5
10
logfO2(g)
loga
H2O
(liq)
epithelial cell signature adenoma/normal(e)
−75 −70 −65 −60 −55
−10
−5
0
5
10
logfO2(g)
loga
H2O
(liq)
stromal cell signature adenoma/normal(f)
−75 −70 −65 −60 −55
−10
−5
0
5
10
logfO2(g)
loga
H2O
(liq)
Wnt targets tumor/invasion front(g)
−75 −70 −65 −60 −55
−10
−5
0
5
10
logfO2(g)
loga
H2O
(liq)
serum biomarkers abundance up/down(h)
−75 −70 −65 −60 −55
−10
−5
0
5
10
logfO2(g)
loga
H2O
(liq)
−0.8
−0.6
−0.4
−0.2
0
0.2
Eh (volt)(i)
Figure 6. Weighted rank-sum comparisons of chemical affinities of formation of human proteins as afunction of log fO2 and logaH2O. The solid lines indicate equal ranking of proteins in the cancer andhealthy groups, and dotted contours are drawn at 10% increments of the maximum possible rank-sumdifference. Blue and red areas correspond to higher ranking of cancer- and healthy-related proteins,respectively, with the intensity of the shading increasing up to 50% the maximum possible rank-sumdifference. (For readers without a color copy: the cancer stability fields lie to the left of (a,b,c,g) or above(d,e,f,h) the stability fields for healthy proteins.) Panel (i) shows calculated values of Eh over the samerange of log fO2 and logaH2O (cf. Reaction R4).
20/30
.CC-BY 4.0 International licensecertified by peer review) is the author/funder. It is made available under aThe copyright holder for this preprint (which was notthis version posted January 4, 2016. . https://doi.org/10.1101/035857doi: bioRxiv preprint

targets in tumor/invasion front”) or from a meta-analysis of extra-cellular proteins(“serum biomarkers abundance up/down”). Some features of the amino acidcompositions of proteins in these data sets lead to stability diagrams that have a morecomplex topography (Fig. 6g-h). Nevertheless, the relative stabilization of tumorinterior proteins and of up-expressed serum biomarker candidates follows the trendsseen above of a stronger association of cancer with more reducing or more hydratingconditions.
The interpretation of log fO2 and logaH2O as simple expressions of physicalquantities (i.e. concentrations) is not straightforward (see Discussion). Nevertheless,effective values of oxidation-reduction potential (Eh) can be calculated by consideringthe water oxidation reaction, i.e.
H2O 12O2 +2H++2e− (R4)
If one assumes that logaH2O = 0 (unit water activity, as in an infinitely dilute solution),this reaction can be used to interconvert log fO2 , pH and pe (or, in conjunction with theNernst equation, Eh) (e.g. Garrels and Christ, 1965, p. 176; Anderson, 2005, p. 363).However, in the approach proposed here for metastable equilibrium among proteins in asubcellular metabolic context, no such assumptions are made on the operational valueof logaH2O, used as an internal indicator, not necessarily externally buffered by anaqueous solution. Consequently, the effective Eh is considered to be a function ofvariable log fO2 and logaH2O, as shown in Fig. 6i for pH = 7.4 and T = 37 ◦C. Thiscomparison gives some perspective on operationally reasonable ranges of log fO2 andlogaH2O.
The physiological reduction potential monitored by the reduced glutathione (GSH) /oxidized glutathione disulfide (GSSG) couple ranges from ca. -260 mV for proliferatingcells to ca. -170 mV for apoptotic cells (Schafer and Buettner, 2001), lying toward themiddle part of the range of conditions shown in Fig. 6 (e.g. Eh = -0.2 V corresponds tolog fO2 = -62.8 at unit activity of H2O). Notably, this implies that the chemical energeticconditions most favorable for formation of cancer-related proteins (lower log fO2 orhigher logaH2O) may be associated with redox potentials that characterize cellproliferation.
4 DISCUSSIONHere, proteomic data were analyzed within a chemical thermodynamic framework thatsupports placing chemical compositions of proteins in a microenvironmental context.To identify some of the implications of these findings, first consider some aspects ofhypoxia and redox potential in cancer cells and tissues.
Hypoxia, or low oxygen concentration (Hockel and Vaupel, 2001), is oftendescribed as a key feature of the tumor microenvironment. A key cellular response tohypoxia is “oxidative stress”, leading to a greater production of reactive oxygen species(ROS) (Murphy, 2009) and disruption of redox-sensitive signaling networks (e.g. Weiet al., 2013). In contrast to oxygenation level, oxidation-reduction potential (redoxpotential or Eh) can be monitored by the concentrations of reduced and oxidizedglutathione (GSH/GSSG) and other redox couples. Cellular growth state can beinfluenced by hypoxia and/or redox potential; hypoxia is known to maintain
21/30
.CC-BY 4.0 International licensecertified by peer review) is the author/funder. It is made available under aThe copyright holder for this preprint (which was notthis version posted January 4, 2016. . https://doi.org/10.1101/035857doi: bioRxiv preprint
undifferentiated states of stem cells (Mohyeldin et al., 2010), and proliferation isgenerally associated with lower intracellular Eh values (Hutter et al., 1997; Schafer andBuettner, 2001), while a rise in intracellular Eh accompanies differentiation (Nkabyoet al., 2002).
The results here show that the chemical makeup of some populations of proteins isrelatively reduced in cancer cells (the chromatin-binding and membrane proteins, andalso the Wnt targets). The reduced chemical composition suggests the possibility ofmolecular adaptation to the biochemical constraints associated with lower oxygenand/or redox potential. These comparisons therefore identify a high-level cellularresponse to microenvironmental conditions that must coexist, but is not necessarilycoincident, with the mechanistic basis for signaling in the HIF-1 pathway.
A thermodynamic perspective may open up other possibilities for control. Forexample, lactate buildup is usually regarded as a primary factor for lowered pH in thetumor microenvironment, promoting tumor growth (Gatenby and Gillies, 2004).However, tumors are not homogeneous. Often, catabolic products of stromal cells feedthe anabolic requirements of epithelial cancer cells (Martinez-Outschoorn et al., 2014).The metabolic consequences of the “lactate shuttle” that operates in this scenario aretied to differences in oxidation state of lactate (ZC=0) and pyruvate (ZC=0.667) (Brooks,2009). Interestingly, the decrease in ZC of proteins in cancer relative to healthy samplesis greater for the significantly changed proteins in stromal cells than in epithelial cells(see Table 1). The accumulation of the relatively reduced lactate molecule and thedecrease in oxidation state of the proteome may both be associated with reducingconditions in specific locations within tumors.
Whether specific prevention and treatment strategies (for example, antioxidants) canprevent or reverse the redox-linked cellular adaptations in cancer is a matter ofcontinuing debate. In general there is little evidence for a tight link between redoxpotential and hypoxia in tumors or healthy tissues, but one study has reported acorrelation between redox potential and oxygenation in tumors on the basis of magneticresonance imaging (MRI) using redox and oxygen-sensitive MRI probes (Hyodo et al.,2012). From a thermodynamic perspective, the cancer-related shifts toward a reducedprotein composition constitute a cellular response that decrease the energy forbiomolecular synthesis in a reducing environment. Therefore, it may be worthwhile toconsider the implication of the current results that a return to normal proteomic stateentails a net oxidation of the proteome.
In addition to oxidation state, the importance of hydration state can not be neglected.Increased hydration state in cells has been identified as a signal for protein synthesisand cell proliferation (Haussinger, 1996). A possible consequence of increasing wateractivity is enhanced rates of enzymatic hydrolysis (Cohen and Wolfenden, 1971), whichcould lead to DNA-damaging mutation through hydrolytic deamination of methylated Cresidues (Kinzler and Vogelstein, 1996). In some of the data sets considered here(membrane enriched, epithelial and stromal cell signature, and serum biomarkers), thecancer proteome is stabilized by a higher hydration potential. Therefore, it seemspossible (but by no means conclusive) that whole-cell and secreted proteins may bedriven to more hydrated states, in contrast with certain subcellular systems(chromatin-binding proteins, membrane fractions) which are more strongly shiftedtoward reducing conditions.
22/30
.CC-BY 4.0 International licensecertified by peer review) is the author/funder. It is made available under aThe copyright holder for this preprint (which was notthis version posted January 4, 2016. . https://doi.org/10.1101/035857doi: bioRxiv preprint

Regarding microbial populations associated with healthy and cancer tissues in thecolon, the growth of bacteria that produce butyrate is associated with a healthy statusand decreased levels of inflammation (Hamer et al., 2008; Candela et al., 2014). One ofthe beneficial outcomes of increased fiber in the diet is greater production of butyrateand other short-chain fatty acids (SCFA). The increased SCFA abundance in turnenhances microbial growth and protein synthesis, also depleting the nitrogen availabilityin the colon, measured as NH3 (Cummings, 1981). The results of the present studyshow that proteins in cancer-associated bacteria are relatively reduced. Beyond therecognition of anaerobic conditions in the gut, little information can be found in theliterature about the effects on the gut microbiome of changes in oxidation conditions.The combination of changes in oxidation state and nitrogen demand suggest the needfor a multidimensional analysis to understand the chemical conditions that may enhanceor inhibit the growth of pro-inflammatory microbes.
Some words should be added on the limitations of thermodynamic variables asindicators of the oxidation and hydration state of the system. Here, we selected logaH2Oand log fO2 as primary variables of interest. However, the conceptual basis of thesevariables as indicators of the hydration and oxidation state of the system (Anderson,2005) does not support a direct interpretation in terms of measurable concentrations.There are astronomical differences between theoretical values of oxygen fugacity andactual concentrations or partial pressures of oxygen (e.g. Anderson, 2005, p. 364–365).Partial pressures of oxygen in human arterial blood are around 90-100 mmHg, and somethresholds for hypoxic conditions include 10 mmHg for energy metabolism, 0.5 mmHgfor mitochondrial oxidative phosphorylation, and 0.02 mmHg for full oxidation ofcytochromes (Hockel and Vaupel, 2001). Taking 1 mmHg = 1/760 atm = 1/750 bar andassuming ideal mixing, the equivalent range of oxygen fugacities indicated by thesemeasurements is log fO2 = -4.57 to -0.88, higher by far than the theoretical values thatdistinguish the relative stabilities of cancer and healthy-associated proteins computedhere.
Likewise, the range of logaH2O shown here deviates tremendously fromlaboratory-based determination of water activity or hydration levels. For example,experimental determination of water activity in saturated protein solutions is as low as0.5 (Knezic et al., 2004), and recent experiments and extrapolations show a likely limitin the range of ca. 0.600 to 0.650 for growth of various xerophilic and halophiliceukaryotes and prokaryotes (Stevenson et al., 2015), but cytoplasmic water activity isprobably not greatly different from aqueous growth media, at 0.95 to 1 (Cayley et al.,2000). The theoretically computed transitions in relative stabilities between proteinsfrom cancer and healthy tissues occur at much lower values of aH2O (ca. 10−6; Fig. 6e)or at values approaching 1, depending on the oxygen fugacity (Figs. 6d,f).
Despite the difficulties in a quantitative interpretation, theoretical predictions ofstabilization of cancer-related proteins by a decrease in log fO2 (Fig. 6a-c,g) or increasein logaH2O (Fig. 6d-f,h) can both be interpreted qualitatively as corresponding with adecrease in redox potential (Fig. 6i).
23/30
.CC-BY 4.0 International licensecertified by peer review) is the author/funder. It is made available under aThe copyright holder for this preprint (which was notthis version posted January 4, 2016. . https://doi.org/10.1101/035857doi: bioRxiv preprint
5 CONCLUSIONConventional methods for interpreting proteomic and microbial data sets emphasizeprotein function and mechanistic descriptions of the normal operation of cells as well asabnormal signaling and growth in cancer. However, an integrated picture of proteomicremodeling in cancer may benefit from accounting for the stoichiometric and energeticrequirements of protein formation. This study has identified a strong shift toward morereduced proteins in colorectal cancer. Importantly, this pattern is identified acrossmultiple data sets, increasing confidence in its systematic nature. In some other datasets, a smaller but still systematic change can be identified indicating greater waterdemand of human proteins in cancer compared to normal tissue.
The findings from this exploration of data unmask biochemical patterns that areconsistent with observations of hypoxia (possibly associated with reduced oxidationstate) and higher hydration state in cancer cells and tumors. As noted by others, suchchemical shifts may favor cellular proliferation and reversion to an embryological modeof growth. The proteomic data can be explicitly linked to microenvironmentalconditions using thermodynamic models, which give estimates of the oxidation- andhydration-potential limits for relative stability of groups of proteins. These calculationsoutline a path connecting the dynamic compositions of proteomes to biochemicalmeasurements such as Eh. In conjunction with growing and more targeted proteomicdata sets, future studies can take advantage of this approach in order to characterize andunderstand in more detail the microenvironmental requirements for the initiation,progression and metastasis of CRC and other cancers.
REFERENCESAbramczyk, H., Brozek-Pluska, B., Krzesniak, M., Kopec, M., and
Morawiec-Sztandera, A. (2014). The cellular environment of cancerous human tissue.Interfacial and dangling water as a ”hydration fingerprint”. Spectrochimica Acta, PartA: Molecular and Biomolecular Spectroscopy, 129(0):609–623. DOI10.1016/j.saa.2014.03.103
Anderson, G. M. (2005). Thermodynamics of Natural Systems. Cambridge UniversityPress, Cambridge, 2nd edition.
Bertout, J. A., Patel, S. A., and Simon, M. C. (2008). The impact of O2 availability onhuman cancer. Nature Reviews. Cancer, 8(12):967–975. DOI 10.1038/nrc2540
Biarc, J., Nguyen, I. S., Pini, A., Gosse, F., Richert, S., et al. (2004). Carcinogenicproperties of proteins with pro-inflammatory activity from Streptococcus infantarius(formerly S.bovis). Carcinogenesis, 25(8):1477–1484. DOI 10.1093/carcin/bgh091
Brooks, G. A. (2009). Cell–cell and intracellular lactate shuttles. Journal of Physiology,587(23):5591–5600. DOI 10.1113/jphysiol.2009.178350
Candela, M., Turroni, S., Biagi, E., Carbonero, F., Rampelli, S., et al. (2014).Inflammation and colorectal cancer, when microbiota-host mutualism breaks. WorldJournal of Gastroenterology, 20(4):908–922. DOI 10.3748/wjg.v20.i4.908
24/30
.CC-BY 4.0 International licensecertified by peer review) is the author/funder. It is made available under aThe copyright holder for this preprint (which was notthis version posted January 4, 2016. . https://doi.org/10.1101/035857doi: bioRxiv preprint

Castellarin, M., Warren, R. L., Freeman, J. D., Dreolini, L., Krzywinski, M., et al.(2012). Fusobacterium nucleatum infection is prevalent in human colorectalcarcinoma. Genome Research, 22(2):299–306. DOI 10.1101/gr.126516.111
Cayley, D. S., Guttman, H. J., and Record, Jr., M. T. (2000). Biophysicalcharacterization of changes in amounts and activity of Escherichia coli cell andcompartment water and turgor pressure in response to osmotic stress. BiophysicalJournal, 78(4):1748–1764. DOI 10.1016/S0006-3495(00)76726-9
Chen, J.-S., Chen, K.-T., Fan, C.-W., Han, C.-L., Chen, Y.-J., et al. (2010). Comparisonof membrane fraction proteomic profiles of normal and cancerous human colorectaltissues with gel-assisted digestion and iTRAQ labeling mass spectrometry. FEBSJournal, 277(14):3028–3038. DOI 10.1111/j.1742-4658.2010.07712.x
Chen, W., Liu, F., Ling, Z., Tong, X., and Xiang, C. (2012). Human intestinal lumenand mucosa-associated microbiota in patients with colorectal cancer. PLoS ONE,7(6):e39743. DOI 10.1371/journal.pone.0039743
Cohen, R. M. and Wolfenden, R. (1971). Cytidine deaminase from Escherichia coli:purification, properties, and inhibition by the potential transition state analog3,4,5,6-tetrahydrouridine. Journal of Biological Chemistry, 246(24):7561–7565
Cummings, J. H. (1981). Short chain fatty acids in the human colon. Gut,22(9):763–779. DOI 10.1136/gut.22.9.763
DeBerardinis, R. J. and Cheng, T. (2010). Q’s next: The diverse functions of glutaminein metabolism, cell biology and cancer. Oncogene, 29(3):313–324. DOI10.1038/onc.2009.358
Dick, J. M. (2008). Calculation of the relative metastabilities of proteins using theCHNOSZ software package. Geochemical Transactions, 9:10. DOI10.1186/1467-4866-9-10
Dick, J. M. (2014). Average oxidation state of carbon in proteins. Journal of the RoyalSociety Interface, 11:20131095. DOI 10.1098/rsif.2013.1095
Dick, J. M., LaRowe, D. E., and Helgeson, H. C. (2006). Temperature, pressure, andelectrochemical constraints on protein speciation: Group additivity calculation of thestandard molal thermodynamic properties of ionized unfolded proteins.Biogeosciences, 3(3):311–336. DOI 10.5194/bg-3-311-2006
Duncan, S. H., Hold, G. L., Barcenilla, A., Stewart, C. S., and Flint, H. J. (2002).Roseburia intestinalis sp. nov., a novel saccharolytic, butyrate-producing bacteriumfrom human faeces. International Journal of Systematic and EvolutionaryMicrobiology, 52(5):1615–1620. DOI 10.1099/ijs.0.02143-0
Garrels, R. M. and Christ, C. L. (1965). Solutions, Minerals, and Equilibria. Harper &Row, New York.
25/30
.CC-BY 4.0 International licensecertified by peer review) is the author/funder. It is made available under aThe copyright holder for this preprint (which was notthis version posted January 4, 2016. . https://doi.org/10.1101/035857doi: bioRxiv preprint

Gatenby, R. A. and Gillies, R. J. (2004). Why do cancers have high aerobic glycolysis?Nature Reviews. Cancer, 4(11):891–899. DOI 10.1038/nrc1478
Gibbs, J. W. (1875). On the equilibrium of heterogeneous substances (first part).Transactions of the Connecticut Academy of Arts and Sciences, 3:108–248
Grzegorczyk, T. M., Meaney, P. M., Kaufman, P. A., di Florio-Alexander, R. M., andPaulsen, K. D. (2012). Fast 3-D tomographic microwave imaging for breast cancerdetection. IEEE Transactions on Medical Imaging, 31(8):1584–1592. DOI10.1109/TMI.2012.2197218
Hamer, H. M., Jonkers, D., Venema, K., Vanhoutvin, S., Troost, F. J., et al. (2008).Review article: The role of butyrate on colonic function. Alimentary Pharmacology& Therapeutics, 27(2):104–119. DOI 10.1111/j.1365-2036.2007.03562.x
Harris, A. L. (2002). Hypoxia – A key regulatory factor in tumour growth. NatureReviews. Cancer, 2(1):38–47. DOI 10.1038/nrc704
Haussinger, D. (1996). The role of cellular hydration in the regulation of cell function.Biochemical Journal, 313:697–710. DOI 10.1042/bj3130697
Helgeson, H. C. (1970). Description and interpretation of phase relations ingeochemical processes involving aqueous solutions. American Journal of Science,268(5):415–438. DOI 10.2475/ajs.268.5.415
Helgeson, H. C., Kirkham, D. H., and Flowers, G. C. (1981). Theoretical prediction ofthe thermodynamic behavior of aqueous electrolytes at high pressures andtemperatures: IV. Calculation of activity coefficients, osmotic coefficients, andapparent molal and standard and relative partial molal properties to 600◦C and 5 Kb.American Journal of Science, 281(10):1249–1516. DOI 10.2475/ajs.281.10.1249
Hlubek, F., Brabletz, T., Budczies, J., Pfeiffer, S., Jung, A., et al. (2007). Heterogeneousexpression of Wnt/β -catenin target genes within colorectal cancer. InternationalJournal of Cancer, 121(9):1941–1948. DOI 10.1002/ijc.22916
Hockel, M. and Vaupel, P. (2001). Tumor hypoxia: Definitions and current clinical,biologic, and molecular aspects. Journal of the National Cancer Institute,93(4):266–276. DOI 10.1093/jnci/93.4.266
Hoffman, A., Spetner, L. M., and Burke, M. (2008). Ramifications of a redox switchwithin a normal cell: Its absence in a cancer cell. Free Radical Biology and Medicine,45(3):265–268. DOI 10.1016/j.freeradbiomed.2008.03.025
Hutter, D. E., Till, B. G., and Greene, J. J. (1997). Redox state changes indensity-dependent regulation of proliferation. Experimental Cell Research,232(2):435–438. DOI 10.1006/excr.1997.3527
Hyodo, F., Davis, R. M., Hyodo, E., Matsumoto, S., Krishna, M. C., et al. (2012). Therelationship between tissue oxygenation and redox status using magnetic resonanceimaging. International Journal of Oncology, 41(6):2103–2108. DOI10.3892/ijo.2012.1638
26/30
.CC-BY 4.0 International licensecertified by peer review) is the author/funder. It is made available under aThe copyright holder for this preprint (which was notthis version posted January 4, 2016. . https://doi.org/10.1101/035857doi: bioRxiv preprint

Jimenez, C. R., Knol, J. C., Meijer, G. A., and Fijneman, R. J. A. (2010). Proteomics ofcolorectal cancer: Overview of discovery studies and identification of commonlyidentified cancer-associated proteins and candidate CRC serum markers. Journal ofProteomics, 73(10):1873–1895. DOI 10.1016/j.jprot.2010.06.004
Johnson, J. W., Oelkers, E. H., and Helgeson, H. C. (1992). SUPCRT92: A softwarepackage for calculating the standard molal thermodynamic properties of minerals,gases, aqueous species, and reactions from 1 to 5000 bar and 0 to 1000◦C.Computers & Geosciences, 18(7):899–947. DOI 10.1016/0098-3004(92)90029-Q
Keating, P. and Cambrosio, A. (2012). Too many numbers: Microarrays in clinicalcancer research. Studies in History and Philosophy of Biological and BiomedicalSciences, 43(1):37–51. DOI 10.1016/j.shpsc.2011.10.004
Kelley, K. K. (1960). Contributions to the Data in Theoretical Metallurgy XIII: HighTemperature Heat Content, Heat Capacities and Entropy Data for the Elements andInorganic Compounds. Bulletin 584. U. S. Bureau of Mines.
Kinzler, K. W. and Vogelstein, B. (1996). Lessons from hereditary colorectal cancer.Cell, 87(2):159–170. DOI 10.1016/S0092-8674(00)81333-1
Knezic, D., Zaccaro, J., and Myerson, A. S. (2004). Thermodynamic properties ofsupersaturated protein solutions. Crystal Growth & Design, 4(1):199–208. DOI10.1021/cg034072o
Knol, J. C., de Wit, M., Albrethsen, J., Piersma, S. R., Pham, T. V., et al. (2014).Proteomics of differential extraction fractions enriched for chromatin-bindingproteins from colon adenoma and carcinoma tissues. Biochimica et Biophysica Acta(BBA) - Proteins and Proteomics, 1844(5):1034–1043. DOI10.1016/j.bbapap.2013.12.006
Koboziev, I., Webb, C. R., Furr, K. L., and Grisham, M. B. (2014). Role of the entericmicrobiota in intestinal homeostasis and inflammation. Free Radical Biology andMedicine, 68(0):122–133. DOI 10.1016/j.freeradbiomed.2013.11.008
Kostic, A. D., Gevers, D., Pedamallu, C. S., Michaud, M., Duke, F., et al. (2012).Genomic analysis identifies association of Fusobacterium with colorectal carcinoma.Genome Research, 22(2):292–298. DOI 10.1101/gr.126573.111
Kume, H., Muraoka, S., Kuga, T., Adachi, J., Narumi, R., et al. (2014). Discovery ofcolorectal cancer biomarker candidates by membrane proteomic analysis andsubsequent verification using selected reaction monitoring (SRM) and tissuemicroarray (TMA) analysis. Molecular & Cellular Proteomics, 13(6):1471–1484.DOI 10.1074/mcp.M113.037093
LaRowe, D. E. and Dick, J. M. (2012). Calculation of the standard molalthermodynamic properties of crystalline peptides. Geochimica et CosmochimicaActa, 80:70–91. DOI 10.1016/j.gca.2011.11.041
27/30
.CC-BY 4.0 International licensecertified by peer review) is the author/funder. It is made available under aThe copyright holder for this preprint (which was notthis version posted January 4, 2016. . https://doi.org/10.1101/035857doi: bioRxiv preprint

Lazebnik, M., Popovic, D., McCartney, L., Watkins, C. B., Lindstrom, M. J., et al.(2007). A large-scale study of the ultrawideband microwave dielectric properties ofnormal, benign and malignant breast tissues obtained from cancer surgeries. Physicsin Medicine and Biology, 52(20):6093–6115. DOI 10.1088/0031-9155/52/20/002
Louis, P. and Flint, H. J. (2007). Development of a semiquantitative degeneratereal-time PCR-based assay for estimation of numbers of butyryl-coenzyme A (CoA)CoA transferase genes in complex bacterial samples. Applied and EnvironmentalMicrobiology, 73(6):2009–2012. DOI 10.1128/AEM.02561-06
Martinez-Outschoorn, U. E., Lisanti, M. P., and Sotgia, F. (2014). Cataboliccancer-associated fibroblasts transfer energy and biomass to anabolic cancer cells,fueling tumor growth. Seminars in Cancer Biology, 25:47–60. DOI10.1016/j.semcancer.2014.01.005
May, P. M., , and Murray, K. (2001). Database of chemical reactions designed toachieve thermodynamic consistency automatically. Journal of Chemical &Engineering Data, 46(5):1035–1040. DOI 10.1021/je000246j
McIntyre, G. I. (2006). Cell hydration as the primary factor in carcinogenesis: Aunifying concept. Medical Hypotheses, 66(3):518–526. DOI10.1016/j.mehy.2005.09.022
Menon, S. G., Sarsour, E. H., Spitz, D. R., Higashikubo, R., Sturm, M., et al. (2003).Redox regulation of the G(1) to S phase transition in the mouse embryo fibroblast cellcycle. Cancer Research, 63(9):2109–2117
Mohyeldin, A., Garzon-Muvdi, T., and Quinones Hinojosa, A. (2010). Oxygen in stemcell biology: A critical component of the stem cell niche. Cell Stem Cell,7(2):150–161. DOI 10.1016/j.stem.2010.07.007
Murphy, M. P. (2009). How mitochondria produce reactive oxygen species.Biochemical Journal, 417:1–13. DOI 10.1042/bj20081386
Nagai, F., Morotomi, M., Sakon, H., and Tanaka, R. (2009). Parasutterellaexcrementihominis gen. nov., sp. nov., a member of the family Alcaligenaceaeisolated from human faeces. International Journal of Systematic and EvolutionaryMicrobiology, 59(7):1793–1797. DOI 10.1099/ijs.0.002519-0
Nkabyo, Y. S., Ziegler, T. R., Gu, L. H., Watson, W. H., and Jones, D. P. (2002).Glutathione and thioredoxin redox during differentiation in human colon epithelial(Caco-2) cells. American Journal of Physiology - Gastrointestinal and LiverPhysiology, 283(6):G1352–G1359. DOI 10.1152/ajpgi.00183.2002
R Core Team (2015). R: A Language and Environment for Statistical Computing. RFoundation for Statistical Computing, Vienna, Austria. ISBN 3-900051-07-0.
Sarsour, E. H., Kumar, M. G., Chaudhuri, L., Kalen, A. L., and Goswami, P. C. (2009).Redox control of the cell cycle in health and disease. Antioxidants & RedoxSignaling, 11(12):2985–3011. DOI 10.1089/ars.2009.2513
28/30
.CC-BY 4.0 International licensecertified by peer review) is the author/funder. It is made available under aThe copyright holder for this preprint (which was notthis version posted January 4, 2016. . https://doi.org/10.1101/035857doi: bioRxiv preprint
Schafer, F. Q. and Buettner, G. R. (2001). Redox environment of the cell as viewedthrough the redox state of the glutathione disulfide/glutathione couple. Free RadicalBiology and Medicine, 30(11):1191–1212. DOI 10.1016/S0891-5849(01)00480-4
Schedin, P. and Elias, A. (2004). Multistep tumorigenesis and the microenvironment.Breast Cancer Research, 6(2):93–101. DOI 10.1186/bcr772
Sears, C. L. and Garrett, W. S. (2014). Microbes, microbiota, and colon cancer. CellHost & Microbe, 15(3):317–328. DOI 10.1016/j.chom.2014.02.007
Semenza, G. L. (2008). Tumor metabolism: Cancer cells give and take lactate. TheJournal of Clinical Investigation, 118(12):3835–3837. DOI 10.1172/JCI37373
Sethi, M. K., Thaysen-Andersen, M., Kim, H., Park, C. K., Baker, M. S., et al. (2015).Quantitative proteomic analysis of paired colorectal cancer and non-tumorigenictissues reveals signature proteins and perturbed pathways involved in CRCprogression and metastasis. Journal of Proteomics, 126:54–67. DOI10.1016/j.jprot.2015.05.037
Shock, E. and Canovas, P. (2010). The potential for abiotic organic synthesis andbiosynthesis at seafloor hydrothermal systems. Geofluids, 10(1-2):161–192. DOI10.1111/j.1468-8123.2010.00277.x
Sokol, H., Pigneur, B., Watterlot, L., Lakhdari, O., Bermudez-Humaran, L. G., et al.(2008). Faecalibacterium prausnitzii is an anti-inflammatory commensal bacteriumidentified by gut microbiota analysis of Crohn disease patients. Proceedings of theNational Academy of Sciences of the United States of America,105(43):16731–16736. DOI 10.1073/pnas.0804812105
Stevenson, A., Cray, J. A., Williams, J. P., Santos, R., Sahay, R., et al. (2015). Is there acommon water-activity limit for the three domains of life? ISME Journal,9(6):1333–1351. DOI 10.1038/ismej.2014.219
Tanger, J. C. IV. and Helgeson, H. C. (1988). Calculation of the thermodynamic andtransport properties of aqueous species at high pressures and temperatures: Revisedequations of state for the standard partial molal properties of ions and electrolytes.American Journal of Science, 288(1):19–98. DOI 10.2475/ajs.288.1.19
Toole, B. P. (2002). Hyaluronan promotes the malignant phenotype. Glycobiology,12(3):37R–42R. DOI 10.1093/glycob/12.3.37R
Turnbaugh, P. J., Hamady, M., Yatsunenko, T., Cantarel, B. L., Duncan, A., et al. (2009).A core gut microbiome in obese and lean twins. Nature, 457(7228):480–484. DOI10.1038/nature07540
Uzozie, A., Nanni, P., Staiano, T., Grossmann, J., Barkow-Oesterreicher, S., et al.(2014). Sorbitol dehydrogenase overexpression and other aspects of dysregulatedprotein expression in human precancerous colorectal neoplasms: A quantitativeproteomics study. Molecular & Cellular Proteomics, 13(5):1198–1218. DOI10.1074/mcp.M113.035105
29/30
.CC-BY 4.0 International licensecertified by peer review) is the author/funder. It is made available under aThe copyright holder for this preprint (which was notthis version posted January 4, 2016. . https://doi.org/10.1101/035857doi: bioRxiv preprint

Wagman, D. D., Evans, W. H., Parker, V. B., Schumm, R. H., Halow, I., et al. (1982).The NBS tables of chemical thermodynamic properties. Selected values for inorganicand C1 and C2 organic substances in SI units. Journal of Physical and ChemicalReference Data, 11:1–392. DOI 10.1063/1.555661
Wang, T., Cai, G., Qiu, Y., Fei, N., Zhang, M., et al. (2012). Structural segregation ofgut microbiota between colorectal cancer patients and healthy volunteers. ISMEJournal, 6(2):320–329. DOI 10.1038/ismej.2011.109
Wei, W., Shi, Q., Remacle, F., Qin, L., Shackelford, D. B., et al. (2013). Hypoxiainduces a phase transition within a kinase signaling network in cancer cells.Proceedings of the National Academy of Sciences of the United States of America,110(15):E1352–E1360. DOI 10.1073/pnas.1303060110
Weir, T. L., Manter, D. K., Sheflin, A. M., Barnett, B. A., Heuberger, A. L., et al. (2013).Stool microbiome and metabolome differences between colorectal cancer patientsand healthy adults. PLoS ONE, 8(8):e70803. DOI 10.1371/journal.pone.0070803
Zadran, S., Remacle, F., and Levine, R. D. (2013). miRNA and mRNA cancersignatures determined by analysis of expression levels in large cohorts of patients.Proceedings of the National Academy of Sciences of the United States of America,110(47):19160–19165. DOI 10.1073/pnas.1316991110
Zeller, G., Tap, J., Voigt, A. Y., Sunagawa, S., Kultima, J. R., et al. (2014). Potential offecal microbiota for early-stage detection of colorectal cancer. Molecular SystemsBiology, 10(11):766. DOI 10.15252/msb.20145645
30/30
.CC-BY 4.0 International licensecertified by peer review) is the author/funder. It is made available under aThe copyright holder for this preprint (which was notthis version posted January 4, 2016. . https://doi.org/10.1101/035857doi: bioRxiv preprint